Abstract
This study aims to accurately estimate the emissions of seven air pollutants (NOX, SOX, CO2, CO, PM2.5, PM10, and NMVOC) from ships for one year (2020) in the busiest port in Korea, Busan Port. To achieve this, a more detailed method for calculating emissions was developed, taking into account factors such as the type of fuel used, mode of operation, and engine output of each ship that entered and left the port. In cases where information on the ship’s main engine was not available, a regression analysis was performed to estimate the engine output based on the ship’s tonnage. In addition, the output of auxiliary engines was estimated based on the ratio of the output of the main engine to that of the auxiliary engine for recently built ships. Finally, emissions from fishing vessels were also included in the calculations. Thus, in Busan port, the total estimated fuel consumption from 44,315 cases in 2020 was 252,519 t; the consumption during hoteling accounted for 87%. In detail, the emissions of seven air pollutants reflecting the emission factors were analyzed as follows: NOX, 18,323 t; SOX, 16,924 t; CO2, 790.383 t; CO, 714 t; PM2.5, 1484 t, PM10, 1614 t; and NMVOC, 772 t. In addition, this study provides an estimation equation to estimate engine output based on a ship’s tonnage, which showed the highest fitness when compared to actual engine output. This methodology can be useful for calculating emissions of air pollutants at the port in detail and promoting marine environment policies.
1. Introduction
Recently, air pollutant emissions from ships’ activities pertaining to maritime logistics movement, passenger transportation, and fishing have raised concerns regarding the damage to the marine environment. Approximately 40% of the pollutants from ships are emitted within 12 nm of the coast, and their proportions double within a range of 100 nm [1]. In particular, a significant amount of air pollution occurs in port cities because of the maneuvering and berthing of ships [2,3]. Cities with heavy marine traffic and closer to port areas exhibit more severe air pollution at small ports [4]. Given that air pollutants from ships in such ports have a negative impact on the health of port-related stakeholders and residents around the corresponding areas, there has been a rising interest in the study of these emissions across the scientific community [5,6]. Port states/ports and the Harbors Bureau have been trying to attract more ships and increase their cargo volume, and therefore, ships stay longer at ports; accordingly, emissions from ships increase during hoteling. To attract more ships and increase their cargo volume, energy-efficient ships are required. This ultimately affects the development of environmentally friendly ships that can comply with environmental regulations, such as carbon-free fuels, such as ammonia and hydrogen, which replace existing fossil fuels [7,8,9].
The International Maritime Organization (IMO), as a measure for reducing air pollutant emissions from ships, stated that from January 2020, international voyage ships with a total load of 5000 t or more should report their fuel oil consumption to the IMO Data Collection System (DCS) verification agency designated by the governments of flag states [10]. The system makes it mandatory to monitor the ship’s fuel consumption and carbon dioxide (CO2) emissions, collect data on them and submit them to reports set out by the IMO. However, domestic ships and fishing vessels weighing less than 5000 t were excluded from the report. Accordingly, the ship fuel consumption information required for quantifying air pollutant emissions from ships in ports has not yet been obtained.
According to previous studies, air pollutant emissions from ships in ports vary depending on the number of ships entering and departing, the type of engine installed on the ship, and the characteristics of ship operation [11]. Furthermore, air pollutants are continuously emitted during loading/unloading cargo, anchoring, cooling/heating, lighting, and ventilation, even during hoteling, and air pollutants are also emitted during the process of maneuvering for berth and departure [12].
In Korea, the Ministry of Oceans and Fisheries, the Ministry of Environment, and the Korea Maritime Institute (KMI) conducted an emission estimation study to determine the amount of air pollutant emissions in ports. However, studies by the Ministry of Oceans and Fisheries and the KMI took top–down approaches that estimated emissions based on the total amount of fuel consumed by ships. Because such approaches enable the indirect estimation of air pollutants from ship activities, these data are known to be highly inaccurate compared to actual emissions. For example, for Incheon Port, the estimated greenhouse gas (GHG) emissions based on a bottom–up approach were approximately five times higher than those with a top–down approach [13]. The Clean Air Policy Support System (CAPSS) calculates emissions via a bottom–up approach based on activities by classifying railways and flights, including ships, as sources of non-road transport pollutants. CAPSS (2019) recently announced that air pollutant emissions from Busan Port in 2019 comprised totally suspended particulate matter (PM10), PM2.5, SOX, NOX, volatile organic compounds (VOCs), NH3, CO, and black carbon [14]. It is continuously making efforts to improve air pollutant emission inventory methodologies as basic data for the effective management of air quality across the country. However, as the emission calculation algorithm in the non-road sector can have limitations in collecting ship specification information and does not have detailed ship activity information, emission estimation studies still have problems in terms of the accuracy of the estimated values. Regarding the calculation of air pollutant emissions from ships, comprehensive analysis, including identification of target ships and setting regional scopes, is a crucial stage in establishing effective strategies for reducing air pollutants. Therefore, in order to formulate a strategy, it is important to analyze the operational profile of ships at the regional level, estimate energy consumption, and accurately estimate emissions [15,16].
To identify air pollutant emissions from ships in ports, specific activity data, such as calculation methodologies, ship specification information in relevant areas, and operating hours, are required. The calculation methods can be categorized into the bottom–up calculation methods, which are based on the activity data of a ship, and top–down methods, which are based on fuel consumption data. The main calculation factors of the bottom–up calculation method include detailed specifications and activity information, such as the engine specifications, output, load factor, fuel characteristics, and operating time of individual ships. Because there is a limit to collecting such detailed specification information owing to domestic conditions, existing studies have focused more on the calculation of emissions based on fuel sales [17]. However, the top–down calculation method does not consider the actual operating conditions of vessels, and the results are inaccurate [18,19]. Currently, studies on activity data-based emission calculations for all ships entering and departing ports while classifying hoteling and maneuvering vessels are lacking in the Republic of Korea owing to limitations in information collection [20].
Therefore, in this study, all ships in the port, including fishing vessels that were excluded from previous studies or emission calculations, were set as research targets. To supplement the limitation of specification data collection that occurs in bottom–up calculation theory, we aimed to develop an estimation formula/equation based on detailed specification data and apply it by combining data from government agencies and built ships in shipyards. The proposed estimation equation and ship classification method will increase the reliability of study results for emission estimation.
2. Methods and Data
The calculations in this study are based on the Busan port activity information retrieved from the PORT-management information system (MIS), which contains the largest amount of data regarding the activities of ships entering and departing the port (44,315 cases) among Korean ports.
Specifically, the process of emission calculation is as follows: the first step involves collecting individual ship specification information, such as the number of ships entering and departing the port, gross tonnage, and hoteling time. Next, for ships without main engine output data, calculation factors based on gross tonnage are derived. Third, calculation factors for auxiliary engine output data are derived based on the output ratio between the main and auxiliary engines. The fuel consumption is then calculated based on the derived data and engine load factor, fuel characteristics, maneuvering distance, and speed for each ship type. Finally, the estimated emissions for each pollutant are calculated by applying the corresponding emission factors. The calculation system is illustrated in Figure 1.
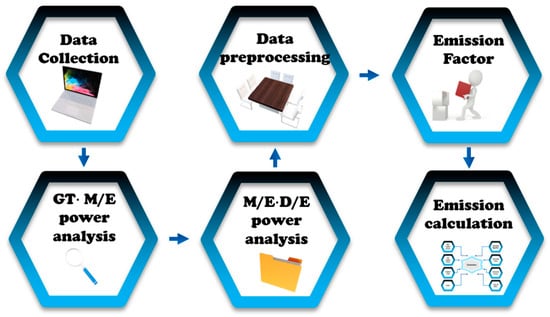
Figure 1.
Process of emission calculation.
2.1. Study Area and Scope
The definitions and target areas for the hoteling and maneuvering phases performed in this study are as follows. In the hoteling phase, a vessel stops without using a propulsion engine at a pier or anchorage for cargo loading and unloading, operation standby of ships, and transportation of passengers. In addition, during maneuvering, a ship moves using auxiliary and main engines within the range of a port with a destination at a pier or anchorage. As for the target areas to be calculated, Busan port (020), Gamcheon port (021), and Busan New port (022) were set as study target areas based on PORT-MIS maneuvering information criteria (Blue code). In 2020, 361,954 vessels entering and departing from all ports in Korea were identified; among them, Busan port recorded 91,193 cases, accounting for 25% of the total. However, ships operating inland, such as in rivers and lakes, were excluded from emission sources. The spatial ranges are shown in Figure 2 [21].

Figure 2.
Study area [21].
2.2. Calculation Method
To calculate air pollutant emissions, calculation theories presented by the European Environment Agency (EEA), the Environment Protection Agency, and IMO can be applied [12,22]. In this study, we selected the EEA’s Tier 3 calculation method, in which an individual ship’s specification information (e.g., engine output) and detailed activity data (e.g., number of arrivals and departures and hoteling time) could be applied [22]. In addition, Tier 1 considers only consumption by type of fuel, and Tier 2 considers only consumption by type of fuel and engine characteristics. However, The Tier 3 methodology can utilize detailed data and estimate detailed emissions according to the classification of various categories, such as international/domestic vessels and emissions by region, by reflecting actual arrival/departure activity information. In Tier 3, for ships whose fuel consumption is unknown, air pollutant emissions can be calculated based on the output of the installed engines, load factor per operation mode, and operation time. This may include ships that were excluded from the conventional sample survey owing to unknown fuel consumption or limitations in specification data collection. The Tier 3 calculation formula is shown in Equation (1).
where ETrip represents emission over a complete trip (ton), EF represents emission factor (kg/t) depending on the type of ship, LF represents engine load factor (%), P represents engine nominal power (KW), T represents time (hours), e represents engine category (main, auxiliary), i represents pollutant [NOx, non-methane volatile organic compound (NMVOC), and PM], j represents engine type (slow-, medium-, and high-speed diesel, gas turbine, and steam turbine), m represents fuel type (bunker fuel oil, marine diesel oil/marine gas oil, and gasoline), and p represents different phases of the trip (cruise, hoteling, and maneuvering).
The EEA presents emission factors by classifying the air pollutants NOX, NMVOC, and PM according to low-, medium-, and high-speed engines. The GHG study by the IMO suggests emission factors for ten types of air pollutants, including NOX, SOX, NMVOC, and ozone-depleting substances, shipping emissions of which are subject to regulation. In this study, emission factors suggested by the fourth GHG study by IMO, EEA, and IPCC were applied in consideration of air pollutants, such as NOX, SOX, NMVOC, PM, CO2, and CO, which are subject to calculation and limitations of engine data collection of individual ships.
2.3. Data Requirements and Data Sources
2.3.1. Collection and Classification of Ships Entering and Departing Busan Port
For the ship activity data, the data availability of the PORT-MIS, Vessel Traffic Service System (VTS), and Automatic Identification System (AIS), operated by the Korean Ministry of Oceans and Fisheries and the Coast Guard, was considered. First, AIS data can be useful when applying a bottom–up emission estimation model based on ship activity data, as the data provide activity information, such as the hourly location and speed of vessels [23]. However, AIS data is incapable of collecting and providing the ship’s specification information necessary for quantifying air pollutant emissions, thus presenting a major limitation.
VTS allows for real-time control of target ships within a control range by collecting, connecting, and comprehensively utilizing activity information, such as radar, VHF, and AIS, static information, such as PORT-MIS, and relevant administrative information. Therefore, data related to ship activities are collected and applied in an integrated manner; upon further utilization, VTS data can become a highly accurate data tool that can precisely identify the activities of individual ships. However, the connection and application of VTS are limited only to maritime traffic control owing to security reasons. PORT-MIS designates subjects to mandatory reporting and non-mandatory reporting in accordance with Article 4, Paragraph 1 of the “Act on the Arrival and Departure of ships” for ships entering water areas within trade port boundaries. Furthermore, it provides data on all port operations and civil affairs related to this study, such as entry and departure of ships in Korea’s national trade ports, use of facilities in ports, control matters, cargo carry-in/out, tax collection, ship types, ship names, gross tonnage, date and time of entry and departure, and ports of call. Such information can be useful for calculating the air pollutant emissions from ships in ports. However, there are limitations regarding the difficulty while identifying the engine specifications of ships, time, and location at the time of reporting. Table 1 lists the ship activity data of the three systems, AIS, VTS, and PORT-MIS.

Table 1.
Comparison of operation information systems of Automatic Identification System (AIS), Vessel Traffic Service System (VTS), and PORT-management information system (MIS).
In this study, PORT-MIS was used to obtain ship specification data and confirm entry and departure information, with the goal of quantifying air pollutant emissions from ships in ports. Further, calculation formulae for each ship type were derived. However, the PORT-MIS information and ship-type classification data of government agencies are incompatible. As such, the issue of compatibility with the ship-type classification system can significantly affect the credibility and calculation results. Therefore, IMO ship type classification criteria were applied, as shown in Figure 3, to ensure the compatibility of PORT-MIS and the ship-type classification system of government agencies.
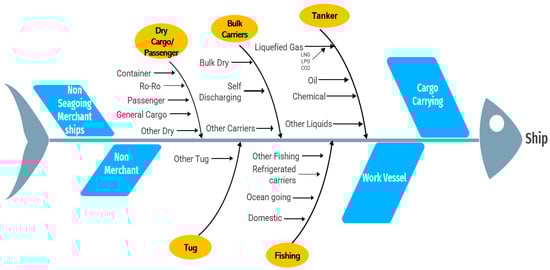
Figure 3.
Classification of ship type.
In the PORT-MIS, information on all vessels reported to be entering and departing from the Port of Busan was aggregated. However, considering the structure of the system, errors may occur in terms of completeness because data are based on the voluntary reporting of the author (reporter). There are several cases where the hoteling period is omitted due to incorrect reporting, and the period is excessively short or unreasonably long. Unlike general cases, there can be cases in which ships stay for a short period or an unreasonably long period; however, to supplement the completeness of the data, this study organized information about excluded data in the emission calculation process, such as errors in the hoteling period and ships without main engines (Table 2).
Table 2.
Raw data preprocessing.
2.3.2. Engine Power and Load Factors
Using PORT-MIS data, it is possible to derive the hoteling time of an individual ship by investigating the ship’s total weight, type, and entry and departure information. However, the calculation of air pollutant emissions requires information on the engine output specifications and the fuel consumed by individual ships.
In this study, we applied the calculation methodology presented in previous studies; however, considering that the main engine output information of each ship is used as key data for calculating emissions, we developed a main engine output estimation formula for each ship type to supplement the missing engine output values. The method suggested in previous studies can be applied to engine output values; however, the classification criteria for ship types have not been clearly identified. Additionally, it was impossible to verify the specifications of the vessels used. Therefore, to enhance the discrimination of ship classification criteria, the actuality of ship activity, and specification information in follow-up studies, we established estimation formulas based on the ship specification information of government agencies and ship classification criteria. For the estimation formula, we used data from 2020 ships, including general cargo ships and bulk ships (865 ships), chemical ships (351 ships), LPG carriers (72 ships), oil tankers (138 ships), and oil product carriers (594 ships), based on registered ships with government agencies, to define correlations between total weights and the engine output of ships.
As for the estimation formula for each ship type, we classified ship types based on ships with information on gross weight (independent variable) and engine output (dependent variable) and applied non-linear regression analysis in the form of y = axb for each ship type. Furthermore, to estimate the output of the auxiliary engine, we utilized the data of 2095 vessels recently built in Korean shipyards to analyze the ratio of the output of the auxiliary and the main engines of each vessel.
The load on a ship’s engine is a calculation factor that fluctuates in real time according to the facility environment used by individual ships; however, it is difficult to obtain an accurate load factor. However, considering the operating characteristics of a ship, there are the following classifications: (1) cruising using the main engine as the main power; (2) maneuvering using the auxiliary and main engines to enter and depart a port; and (3) hoteling, in which the main engine is not used for loading and unloading or standby at a pier [24]. Furthermore, Entec [25] suggested load factor information based on hoteling, cruising, and maneuvering, as shown in Table 3. Based on this, in the case of fuel consumption during hoteling, an engine load factor of 40% of the maximum output was applied. For maneuvering, the engine load factors of the main and auxiliary engines were set to 20% and 50%, respectively. In addition, for fishing grounds where various types of vessels (e.g., seiners, trawlers, etc.) exist, determining engine loads, including working time, is important for calculating fuel consumption and emissions. However, in this study, only information from coastal fishing vessels was available for collecting the port call data. Therefore, the engine load factors, according to Table 4, were uniformly applied to all vessels, including coastal fishing vessels.
Table 3.
Ratio of load factor for main engine and aux engine of ships [25].
Table 4.
Tier-3 specific fuel oil consumption (SFOC).
2.3.3. Duration of Maneuvering Activities in Busan Port
The calculation of fuel consumption during maneuvering, which refers to the process in which a ship enters and departs a port, can be estimated using the output and load of the main and auxiliary engines and the maneuvering period. It is practically difficult to determine the time required for the entry and departure processes of individual ships, fuel consumption, and output load. Accordingly, the maneuvering time was set to 60 min in this study, which considered the safe speed limit within Busan port and the average distance to the pilot stations [26]. Therefore, as illustrated in Figure 4, the average distance was set to 6 km (3.7 nmile), and the maximum navigation speed within Busan port was set to an average of 1–7 knots after considering the maximum navigation speed within Busan port recommended by the Korea Coast Guard.

Figure 4.
Maneuvering distance (Pilot station to Port) [26].
2.3.4. Engine Fuel Type Profiles, Fuel Consumptions, and Emission Factors
Heavy fuel oil (HFO), which is classified as residual oil, is the main fuel used for the propulsion of ships worldwide, and Marine Diesel Oil (MDO) and Marine Gas Oil (MGO), which are commonly called distillates, are generally used for auxiliary engines [27]. However, identifying the fuel consumption of regional ships is challenging. Ship engine specifications and performance and detailed fuel oil information are difficult to disclose as user-specific information or assets, and there remains uncertainty in specifying them [28]. Therefore, the engine types, consumed fuel, and fuel consumption coefficients (specific fuel oil consumption; SFOC, g·fuel/kWh), which are necessary for calculating the fuel consumption of the main and auxiliary engines during the hoteling and maneuvering (arrival/departure) periods, were applied, as shown in Table 4. In addition, Fan A. et al., (2022) reported the method of estimating fuel consumption models [29].
The fuel consumption presented here is the consumption per kWh, as suggested by the EEA, and the oil types of the consumed fuel and the operating mode of the ship were classified. M, H, and C refer to the operation modes, and engine types were classified into low, medium, and high speeds based on the RPM.
After applying Entec’s classification criteria, the outcomes were as follows: slow-speed diesel (SSD, RPM ≤ 300); medium-speed diesel (MSD, 300 < RPM ≤ 1000); and high-speed diesel (HSD, RPM > 1000) [25]. The fuel consumption during hoteling was calculated using the auxiliary engine output, load, and hoteling time of the ship. The hoteling time was calculated based on the PORT-MIS maneuvering (arrival/departure) report information, and the specific fuel consumption of the engine per 1 kWh was applied with the fuel consumption coefficient suggested by the EEA, and the engine load factor was applied as 40% of the maximum output; therefore, the consumption can be calculated via Equation (2).
Here, fuel consumption during hoteling (fuel oil consumption; FOC) = auxiliary engine output per ship (kW) × fuel consumption coefficient (SFOC, g·fuel/kWh) × engine load factor (40%) × hoteling time per ship (hours).
Fuel consumption during the maneuvering (arrival/departure) period is calculated by adding ① the output and load of the auxiliary engine of the ship and ② the output and load of the main engine and the arrival and departure times. For the main engine fuel consumption, the fuel consumption coefficient suggested by the EEA was applied, and the engine load factor was set at 20% for the main engine and 50% for the auxiliary engine, as shown in Equation (3).
Here, fuel consumption during maneuvering (FOC) = [main engine output per ship (kW) × fuel consumption coefficient (SFOC) × engine load factor (20%) × round-trip time during entry and departure (2 h)] + [auxiliary engine output per ship (kW) × fuel consumption coefficient (SFOC) × engine load factor (50%)].
As for the emission factors for quantifying air pollutant emissions, we primarily applied the emission factors presented by the IMO, EEA, and IPCC [12,22,30], as shown in Table 5. However, in the case of EEA, some pollutants have different emission factors depending on the engine speed. In particular, the emission factors of NOX and SOX may vary depending on the engine manufacturing timing of an individual ship or the sulfur content of the fuel. Considering these conditions, this study further used the emission factors presented by the IMO, which applies the emission factors according to the type of fuel oil owing to the lack of raw data on fuel characteristics and engine tier grades of individual ships.
Table 5.
Comparison of emission factors (Unit: kg-pollutant/ton-fuel).
3. Results
3.1. Correlation Analysis Results for Main Engine Output
This analysis was conducted based on the collected law data that could be obtained. In order to estimate the engine output of the main engine by ship type, regression analysis was performed between GT and main engine output for five types of ships: General Cargo; LPG carrier; Oil tanker; Chemical carrier; and Oil products carrier [31]. Figure 5a–e indicates the relationship between the main engine output and the gross tonnage per ship type of ships registered with government agencies. According to the fitness of the non-linear regression analysis between the gross tonnage of ships and the output of the main engine, it can be seen that the gross tonnage or main engine output of some ships without specification information can be predicted, as shown in Table 6.
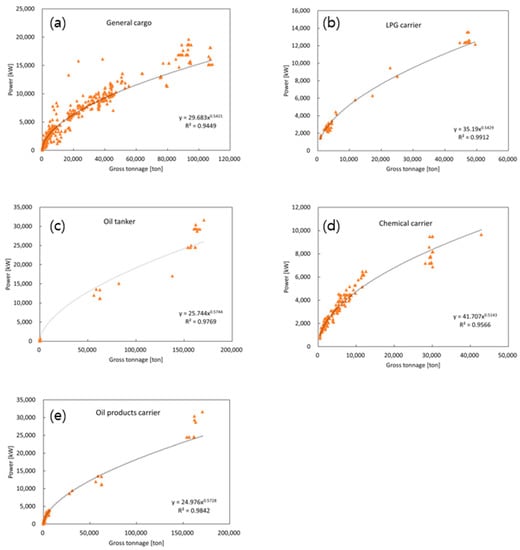
Figure 5.
Non−linear regression of M/E power and GT of general cargo (a); LPG carrier (b); oil tanker (c); chemical tanker (d); and oil product carrier (e).
Table 6.
Correlation results of regressions between M/E Power and GT.
From a regression analysis of the main engine output, we found that the engine output varied depending on the type and total weight of the ship. Specifically, as the total weight of the ship increased, the main engine output increased. Through classification by ship type, it was possible to derive an estimation equation with a significant positive value for each ship type.
3.2. Correlation Analysis Results for Auxiliary Engine Output
To estimate the output of the auxiliary engine, the specification data of 2095 ships built in Korean shipyards were used to analyze the correlation between the main engine output and the auxiliary engine output of each ship. A summary of the output ratios of the auxiliary and main engines for each ship type is presented in Figure 6.

Figure 6.
Estimated average ship ratio of auxiliary engine and main engine.
According to Figure 6, it can be seen that the proportion of auxiliary engines increases in the order of Passenger, Refer’ Carrier, and Asphalt Carrier; as the gross tonnage of ships of the same ship type increases, the proportion of auxiliary engine output to the main engine output decreases.
3.3. Estimated Fuel Consumption Calculations of Ships Entering Busan Port in 2020
The fuel consumption of ships entering Busan port was calculated using the engine output per ship, fuel consumption coefficient (SFOC), load factor, hoteling time, and maneuvering time. The estimated total fuel consumption during the hoteling (223,029 t) and maneuvering periods (M/E: 12,999 t, D/E: 16,488 t) was 252,519 t. Figure 7 shows the results of classification into domestic ships and ocean-going ships/international voyage ships to understand the characteristics of the estimated fuel consumption.

Figure 7.
Proportion of fuel oil consumption and number of reported cases.
As shown in Figure 7, the proportion of ships that entered and departed from ports differed by 6.8% between domestic ships (46.6%) and international voyage ships (53.4%), and the fuel consumption differed by 65.2% between domestic ships (17.4%) and international voyage ships (82.6%). Considering such differences, as for the number of entry and departure reports, no significant difference was observed between domestic and international voyage ships; however, the total weight, engine output, and fuel consumption of domestic ships were lower than those of international voyage ships.
3.4. Calculation Result of Air Pollutant Emissions from Ships Entering Busan Port in 2020
In Busan port, seven types of air pollutants were generated from 44,315 cases over one year in 2020 (see Table 7): NOX: 18,323 t, SOX: 16,924 t, CO2: 790,383 t, CO: 714 t, PM2.5: 1484 t, PM10: 1614 t, and NMVOC: 772 t. Among them, the air pollutant emissions from full container ships accounted for the largest portion had the greatest effect on the amount of air pollutants generated by ships in Busan port.
Table 7.
Results of emission calculation (Unit: tons).
Through Figure 8, it is possible to compare the emissions from ships in ports per ship per operation mode through classification of ship type. Hotelling(H)-auxiliary engine refers to the amount of fuel consumption generated through the auxiliary engine in the port, Maneuvering-M/E, and auxiliary engine refers to the amount of fuel consumption generated in the process of entering and leaving the port. As a result of the comparison, coal carriers were the largest emitters among other ship types in the hoteling mode out of the total emissions in the port. In addition, ship types accounting for more than 90% of emissions during hoteling, compared to all operation modes, were barge, warship, leisure crafts, tug, and waste cleaning vessels. Most of them were government ships and port reception facilities, and these ships operated their engines only in cruising mode. In addition, they did not use engines and moored at collective vessel stations.

Figure 8.
Comparison of fuel consumption by ship type and trips.
4. Discussion
This study classified ship types based on vessel specifications, including fishing vessels that were excluded from previous studies. For ships without some engine information, the engine output was estimated based on the vessel’s gross tonnage, and an estimation equation was proposed. To predict fuel consumption in ports, the output of auxiliary engines was estimated as a ratio of the main engine output to the auxiliary engine output of recently built vessels, allowing for a more accurate and specific calculation of pollutant emissions based on individual ships’ fuel consumption. The results of the study are discussed for each category accordingly.
4.1. Unification of Ship Use Classification
As a result of reviewing previous studies [5,6,17], ship information for estimating air pollutant emissions from ships is diverse, but there is a lack of research that considers both berthing and hoteling characteristics and specifications of ships, in particular, PORT-MIS, AIS, government inspection agencies, and shipyards collect databases in different ways. This confirmed that the classification of ship types was not compatible and that the classification criteria were not unified in terms of DB linkage. This factor can cause an error in the estimation formula per ship type in estimating engine output and, furthermore, can have a significant impact on the calculation result. Therefore, this study is meaningful because it presents ship-type classification criteria based on ship specification information. In this sense, before applying and developing the estimation equation per ship type, if the data range to be utilized is set, and the ship type item is subdivided or simplified according to the setting range to reflect the output estimation formula, more unified data processing, and reliably calculated results can be expected.
4.2. Correlation for Outputs of Main and Auxiliary Engines
Table 8 shows a comparison between the non-linear relationship between gross tonnage and output calculated in this study and the relationship presented in other studies [32]. As such, according to R2 of the goodness of fit for regression analysis, it can be found that regression analysis can be performed to predict the output of an unknown ship. The engine output estimation equation for each ship type was calculated by classifying ship types with information on gross tonnage (independent variable) and engine output (dependent variable) and applying nonlinear regression analysis in the form of y = axb per ship type.
Table 8.
Quantitative relationship between ME and GT.
To compare the fitness of the engine output estimation formula applied in this study and the estimation formula presented in the previous studies, it was verified using the actual output of a random ship per ship type, as summarized in Figure 9.

Figure 9.
Comparison of non-linear regression of engine power.
Taken together with the verification of the estimation equation, as a result of comparing the estimation formula presented in this study and that of previous studies [5,6,23] with the actual engine output of 24 random vessels, the developed estimation formula showed the highest fitness. The actual engine output values were 33,211 kW (100%), 40,516 kW (122%), 35,521 kW (107%), 40,243 (121%), and 38,466 kW (116%) for the random 24 vessels, the estimated formula applied in this study, 2010 world fleet, 1997 world fleet, and 2006 Mediterranean Sea fleet, respectively. Moreover, the actual engine output of the 39 Oil Tankers was 38,920 kW (100%), that of the estimated formula applied in this study was 35,626 kW (92%); that of the 2010 world fleet was 25,273 kW (65%); that of the 1997 world fleet was 36,564 (94%), and that of the 2006 Mediterranean Sea fleet was 28,309 kW (73%). For the seven LPG Carriers, the actual engine output was 18,863 kW (100%); that of the estimated formula applied in this study was 19,702 kW (104%); that of the 2010 world fleet was 13,996 kW (74%); that of the 1997 world fleet was 18,439 (98%), and that of the 2006 Mediterranean Sea fleet was 16,227 kW (86%).
Table 9 shows a comparison between the ratio of the outputs of the main and auxiliary engines shown in previous studies and the resultant coefficients calculated in this study. The resultant coefficients exhibit a large difference between the coefficient values of bulk carriers and passengers.
Table 9.
Estimated average ship ratio of auxiliary engine/main engine by ship type.
The engine output estimation formula can become a more realistic calculation method using the RPM of the main engine and other detailed data; however, there are structural limitations in acquiring a wide range of detailed data. Therefore, numerous previous studies [1,19,23,33] have used missing specification data through estimation.
In this study, there were limitations, such as a lack of information on various types of fishing vessels and uniform application of engine load factors according to ship type. Therefore, in the future, research should be conducted to obtain activity information on various types of fishing vessels and apply more detailed engine load factors.
4.3. Calculation of Air Pollutant Emissions
While calculating air pollutant emissions from ships, the ship traffic volume and operating characteristics of individual ships, that is, environmental factors, can also have a significant impact on the calculation results. Many fishing boats, tankers, tugs, and long-term mooring vessels operating along the coast of Korea do not use engines while hoteling in collective vessel stations. Other barges, towing barges, and delivery ships (sampans) include vessels without main or auxiliary engines. This means that a high number of ships in each port does not imply a large amount of emissions. Emission comparisons between ports require a distinction between the traffic volume of ships and the operation characteristics of individual ships. Therefore, if activity data and environmental factors are continuously supplemented, more reliable calculation results can be expected. In the future, real-time calculation of air pollutant emissions from ships is expected to have practical applications if AIS operation information, which can be used to check real-time navigation routes and ship speed, is linked to data regarding the specification of ships moving in ports.
4.4. Development of Sustainable Strategies for the Port
As mentioned in the Introduction, ports around the world are expecting the emergence of energy-efficient ships to attract more ships and increase cargo volume. From a regulatory perspective, countries, including Korea, Europe, and the United States, have already designated and implemented Emission Control Areas (ECA) to reduce emissions of SOX from ships, while the IMO is now enforcing regulations on GHG emissions. Specifically, from this year, the Energy Efficiency Existing Ship Index and Carbon Intensity Indicator (CII) systems will be implemented to achieve of 40% GHG reduction by 2030. CII is an indicator of the CO2 emissions per ton-mile of a vessel, representing the vessel’s operational efficiency. In other words, the calculated annual operational carbon intensity of an individual ship refers to the ratio of the total CO2 mass emitted to the atmosphere from all transport operations carried out in the designated year, including information on annual fuel consumption and transport distance. Therefore, individual ships can estimate their CII rating by analyzing fuel consumption and transport distance data and comparing it with the developed baseline for carbon intensity. However, at the national level, accurate fuel consumption calculation is essential to predict the CII rating of registered ships for establishing national greenhouse gas reduction policies. Thus, the methodology for estimating GHG emissions from ships entering and leaving ports presented herein can be utilized to estimate annual emissions from ships entering and leaving ports, facilitating the establishment of independent GHG reduction strategies in individual ports. Furthermore, in order to develop sustainable strategies for the port, it is necessary to comprehensively consider not only the qualitative improvement of environmental aspects but also aspects such as digitalization of the port, sustainable mobility, and energy efficiency [9].
5. Conclusions
With the aim of estimating the emissions of air pollutants from vessels in ports, this study focused on Busan Port, which has a large volume of ship traffic and has been designated as an air pollutant emission control area for one year (in 2020). The following results were derived for calculating the seven types of air pollutants from the ships:
(1) The hoteling time was calculated by reflecting the actual traffic volume of all vessels entering Busan port, including vessels previously excluded (e.g., coastal fishing vessels, tugs, and other vessels) through the port entry and departure data. Using the EEA activity-based (Tier 3) calculation method that can reflect the engine specifications of individual vessels, we quantitatively evaluated air pollutant emissions in ports;
(2) Based on the specifications (gross weight) of 2,020 ships registered in Korea, we provided a formula to estimate the output of the main engine and analyzed the output ratio of auxiliary and main engines of recently built ships (2,095 ships) to derive factors for calculating the output of the auxiliary engine compared to that of the main engine prepared earlier;
(3) The total estimated fuel consumption from 44,315 entry and departure cases in Busan Port for one year in 2020 was 252,519 t; consumption during hoteling accounted for 87%, and 13% of the consumption was generated from the entry and departure processes. The emissions of the seven air pollutants reflecting the emission factor were as follows: NOX, 18,323 t; SOX, 16,924 t; CO2, 790,383 t; CO, 714 t; PM2.5, 1484 t; PM10, 1614 t; and NMVOC, 772 t;
(4) To produce consistent results in follow-up studies, it is necessary to establish classification criteria based on the use and function of ships so that standardized information can be utilized.
This study will be useful for calculating emissions of air pollution from ships at ports in detail and promoting marine environment policies.
Author Contributions
J.-W.K., conceptualization, data curation, formal analysis, investigation, methodology, resources, writing—original draft; S.Y., conceptualization, methodology, supervision, writing—review and editing, validation; W.-J.L., funding acquisition, supervision, validation, writing—review and editing. All authors have read and agreed to the published version of the manuscript.
Funding
This work was supported by the Korea Institute of Marine Science and Technology Promotion (KIMST), funded by the Ministry of Oceans and Fisheries (20220603) and by the Ministry of Education of the Republic of Korea, and the National Research Foundation of Korea (NRF-2022R1F1A1073764).
Institutional Review Board Statement
Not applicable.
Informed Consent Statement
Not applicable.
Data Availability Statement
The data presented in this study are available on request from the corresponding author. The data are not publicly available due to privacy.
Conflicts of Interest
The authors declare no conflict of interest.
Abbreviations
| CO2 | Carbon Dioxide |
| CO | Carbon Monoxide |
| CAPSS | Clean Air Policy Support System |
| DCS | Data Collection System |
| D/E | Dynamo engine |
| FOC | Fuel Oil Consumption |
| GHG | Greenhouse gas |
| GT | Gross Tonnage |
| HFO | Heavy Fuel Oil |
| IMO | International Maritime Organization |
| LNG | Liquefied Natural Gas |
| LPG | Liquefied Petroleum Gas |
| MDO | Marine Diesel Oil |
| M/E | Main engine |
| NOX | Nitric Oxide |
| PM | Particulate Matter |
| RORO | Roll-on/Roll-off cargo |
| SFOC | Specific Fuel Oil Consumption |
| SOX | Sulfur Oxides |
| VOC | Volatile Organic Compounds |
References
- Li, C.; Borken-Kleefeld, J.; Zheng, J.; Yuan, Z.; Ou, J.; Li, Y.; Wang, Y.; Xu, Y. Decadal evolution of ship emissions in China from 2004 to 2013 by using an integrated AIS-based approach and projection to 2040. Atmos Chem Phys. 2018, 18, 6075–6093. [Google Scholar] [CrossRef]
- Monteiro, A.; Russo, M.; Gama, C.; Borrego, C. How important are maritime emissions for the air quality: At European and national scale. Environ. Pollut. 2018, 242, 565–575. [Google Scholar] [CrossRef] [PubMed]
- Murena, F.; Mocerino, L.; Quaranta, F.; Toscano, D. Impact on air quality of cruise ship emissions in Naples, Italy. Atmos. Environ. 2018, 187, 70–83. [Google Scholar] [CrossRef]
- Fameli, K.M.; Kotrikla, A.M.; Psanis, C.; Biskos, G.; Polydoropoulou, A. Estimation of the emissions by transport in two port cities of the northeastern Mediterranean, Greece. Environ. Pollut. 2020, 257, 113598. [Google Scholar] [CrossRef] [PubMed]
- Nunes, R.A.O.; Alvim-Ferraz, M.C.M.; Martins, F.G.; Sousa, S.I.V. Assessment of shipping emissions on four ports of Portugal. Environ. Pollut. 2017, 231, 1370–1379. [Google Scholar] [CrossRef]
- Tang, L.; Ramacher, M.O.P.; Moldanová, J.; Matthias, V.; Karl, M.; Johansson, L.; Jalkanen, J.P.; Yaramenka, K.; Aulinger, A.; Gustafsson, M. The impact of ship emissions on air quality and human health in the Gothenburg area—Part 1: 2012 emissions. Atmos. Chem. Phys. 2020, 20, 7509–7530. [Google Scholar] [CrossRef]
- Perčić, M.; Ančić, I.; Vladimir, N. Life-cycle cost assessments of different power system configurations to reduce the carbon footprint in the Croatian short-sea shipping sector. Renew. Sustain. Energy Rev. 2020, 131, 110028. [Google Scholar] [CrossRef]
- Perčić, M.; Vladimir, N.; Jovanović, I.; Koričan, M. Application of fuel cells with zero-carbon fuels in short-sea shipping. Appl. Energy 2022, 309, 118463. [Google Scholar] [CrossRef]
- Campisi, T.; Marinello, S.; Costantini, G.; Laghi, L.; Mascia, S.; Matteucci, F.; Serrau, D. Locally integrated partnership as a tool to implement a Smart Port Management Strategy: The case of the port of Ravenna (Italy). Ocean Coast. Manag. 2022, 224, 106179. [Google Scholar] [CrossRef]
- International Maritime Organization (IMO). Fourth Greenhouse Gas Study; International Maritime Organization (IMO): London, UK, 2020. [Google Scholar]
- Cammin, P.; Yu, J.; Heilig, L.; Voß, S. Monitoring of air emissions in maritime ports. Transp. Res. Part D 2020, 87, 102479. [Google Scholar] [CrossRef]
- Nguyen, P.N.; Woo, S.H.; Kim, H. Ship emissions in hotelling phase and loading/unloading in Southeast Asia ports. Transp. Res. Part D 2022, 105, 103223. [Google Scholar] [CrossRef]
- Chang, Y.T.; Song, Y.; Roh, Y. Assessing greenhouse gas emissions from port vessel operations at the Port of Incheon. Transp. Res. Part D 2013, 25, 1–4. [Google Scholar] [CrossRef]
- Clean Air Policy Support System. National Air Emission Inventory and Research. 2019. Available online: http://www.air.go.kr/capss/emission/sido.do?menuld=31 (accessed on 22 October 2022).
- Yu, H.; Fang, Z.; Fu, X.; Liu, J.; Chen, J. Literature review on emission control-based ship voyage optimization. Transp. Res. Part D 2021, 93, 102768. [Google Scholar] [CrossRef]
- Perčić, M.; Vladimir, N.; Fan, A.; Jovanović, I. Holistic Energy Efficiency and Environmental Friendliness Model for Short-Sea Vessels with Alternative Power Systems Considering Realistic Fuel Pathways and Workloads. J. Mar. Sci. Eng. 2022, 10, 613. [Google Scholar] [CrossRef]
- Korea Maritime Institute (KMI). Improvements in the Estimation of Air Pollutant Emissions from Ships; Korea Maritime Institute (KMI): Busan, Republic of Korea, 2017. [Google Scholar]
- Chen, S.; Meng, Q.; Jia, P.; Kuang, H. An operational-mode-based method for estimating ship emissions in port waters. Transp. Res. Part D 2021, 101, 103080. [Google Scholar] [CrossRef]
- Gan, L.; Che, W.; Zhou, M.; Zhou, C.; Zheng, Y.; Zhang, L.; Rangel-Buitrago, N.; Song, L. Ship exhaust emission estimation and analysis using Automatic Identification System data: The west area of Shenzhen port, China, as a case study. Ocean Coast Manag. 2022, 226, 106245. [Google Scholar] [CrossRef]
- Marinello, S.; Gamberini, R. Multi-Criteria Decision Making Approaches Applied to Waste Electrical and Electronic Equipment (WEEE): A Comprehensive Literature Review. Toxics 2021, 9, 13. [Google Scholar] [CrossRef]
- Busan Harbor Pilot’s Association. Available online: https://www.busanpiolt.co.kr/harbor/busan (accessed on 22 October 2022).
- European Environment Agency (EEA). EMEP/EEA Air Pollutant Emission Inventory Guidebook; European Environment Agency (EEA): Copenhagen, Denmark, 2019; Volume 22. [Google Scholar]
- Weng, J.; Shi, K.; Gan, X.; Li, G.; Huang, Z. Ship emission estimation with high spatial-temporal resolution in the Yangtze River estuary using AIS data. J. Clean. Prod. 2020, 248, 119297. [Google Scholar] [CrossRef]
- Toscano, D.; Murena, F. Atmospheric ship emissions in ports: A review. Correlation with data of ship traffic. Atmos. Environ. X 2019, 4, 100050. [Google Scholar] [CrossRef]
- Entec, U.K. Limited. Quantification of Emissions from Ships Associated with Ship Movements Between Ports in the European Community; Final Report; European Commission: Brussels, Belgium, 2002. [Google Scholar]
- Vessel Finder. Available online: https://www.vesselfinder.com (accessed on 22 September 2022).
- Entec, U.K. Ship Emissions Inventory—Mediterranean Sea; Final Report for Concawe; Entec UK Limited: Brussels, Belgium, 2007. [Google Scholar]
- Ančić, I.; Perčić, M.; Vladimir, N. Alternative power options to reduce carbon footprint of ro-ro passenger fleet: A case study of Croatia. J. Clean. Prod. 2020, 271, 122638. [Google Scholar] [CrossRef]
- Fan, A.; Yang, J.; Yang, L.; Wu, D.; Vladimir, N. A review of ship fuel consumption models. Ocean Eng. 2022, 264, 112405. [Google Scholar] [CrossRef]
- Intergovernmental Panel on Climate Change (IPCC). IPCC Guidelines for National Greenhouse Gas Inventories; Intergovernmental Panel on Climate Change (IPCC): Geneva, Switzerland, 2006; Volume 2. [Google Scholar]
- Koričan, M.; Perčić, M.; Vladimir, N.; Alujević, N.; Fan, A. Alternative Power Options for Improvement of the Environmental Friendliness of Fishing Trawlers. J. Mar. Sci. Eng. 2022, 10, 1882. [Google Scholar] [CrossRef]
- Trozzi, C. Update of Emission Estimate Methodology for Maritime Navigation; Techne Consulting Report; Techne Consulting: Roma, Italy, 2010. [Google Scholar]
- Song, S. Ship emissions inventory, social cost and eco-efficiency in Shanghai Yangshan port. Atmos. Environ. 2014, 82, 288–297. [Google Scholar] [CrossRef]
Disclaimer/Publisher’s Note: The statements, opinions and data contained in all publications are solely those of the individual author(s) and contributor(s) and not of MDPI and/or the editor(s). MDPI and/or the editor(s) disclaim responsibility for any injury to people or property resulting from any ideas, methods, instructions or products referred to in the content. |
© 2023 by the authors. Licensee MDPI, Basel, Switzerland. This article is an open access article distributed under the terms and conditions of the Creative Commons Attribution (CC BY) license (https://creativecommons.org/licenses/by/4.0/).