
Rapid Magnetic Susceptibility Characterization of Coastal Morphosedimentary Units at Two Insular Strandplains in Estonia

 , , ,
, , ,
Abstract
1. Introduction
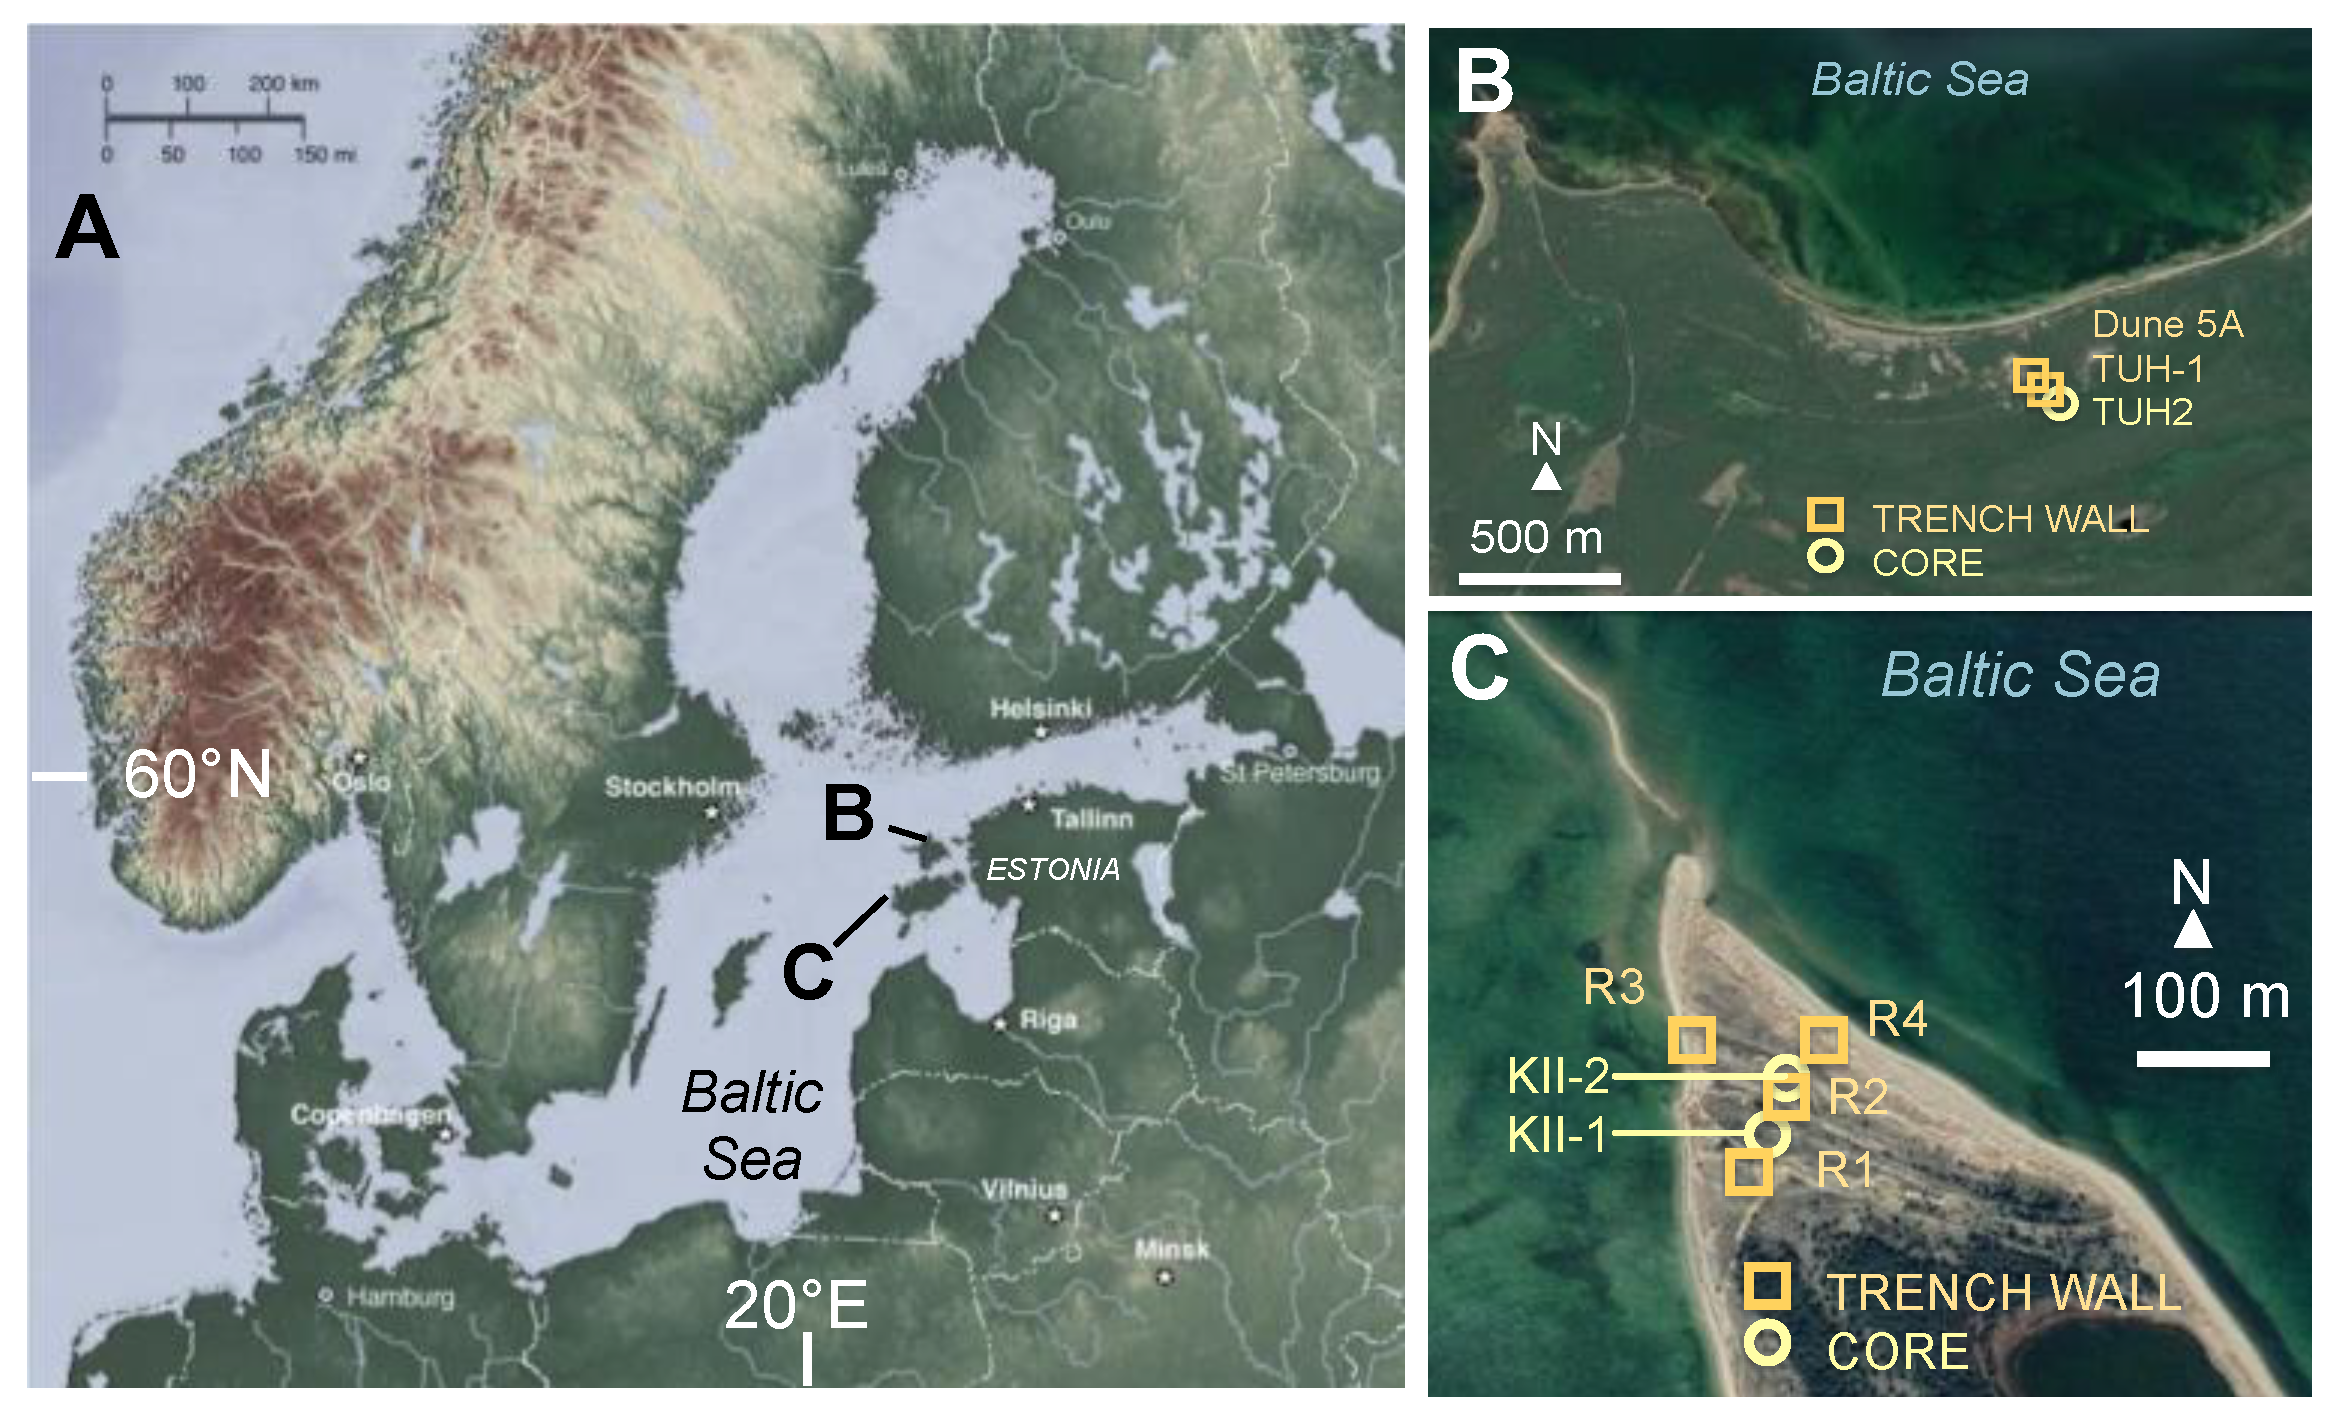
2. Study Areas
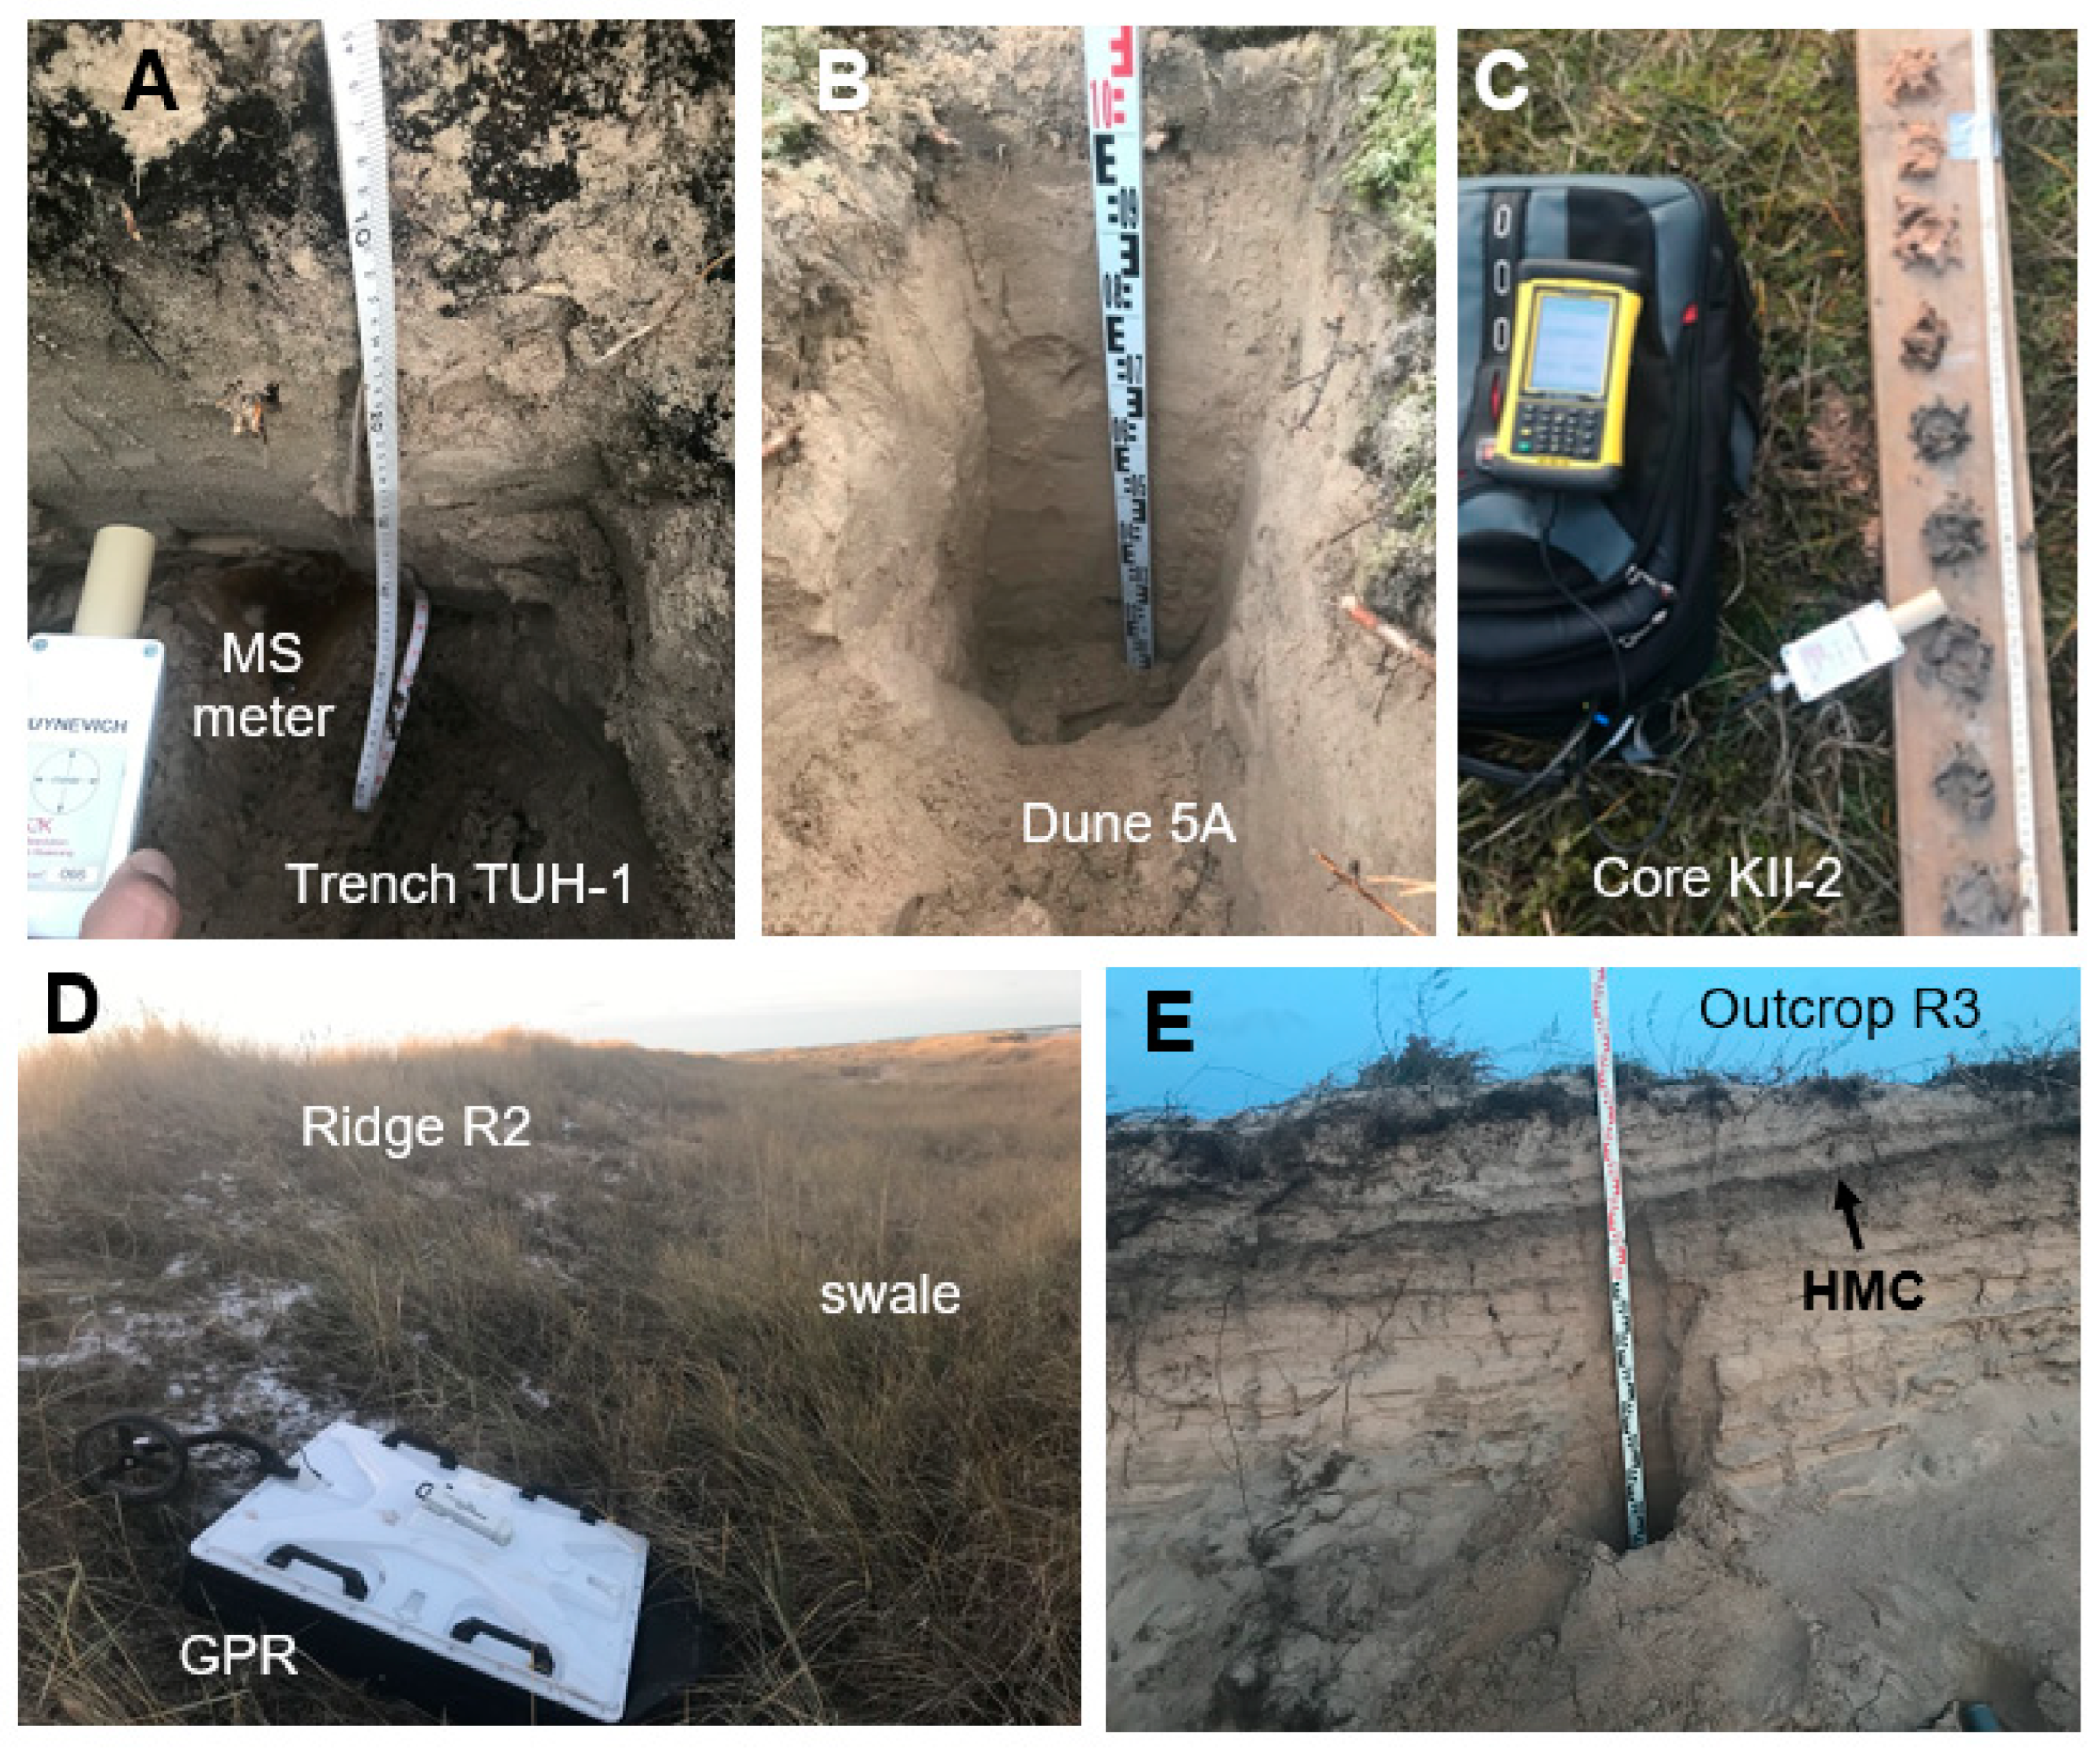
3. Materials and Methods
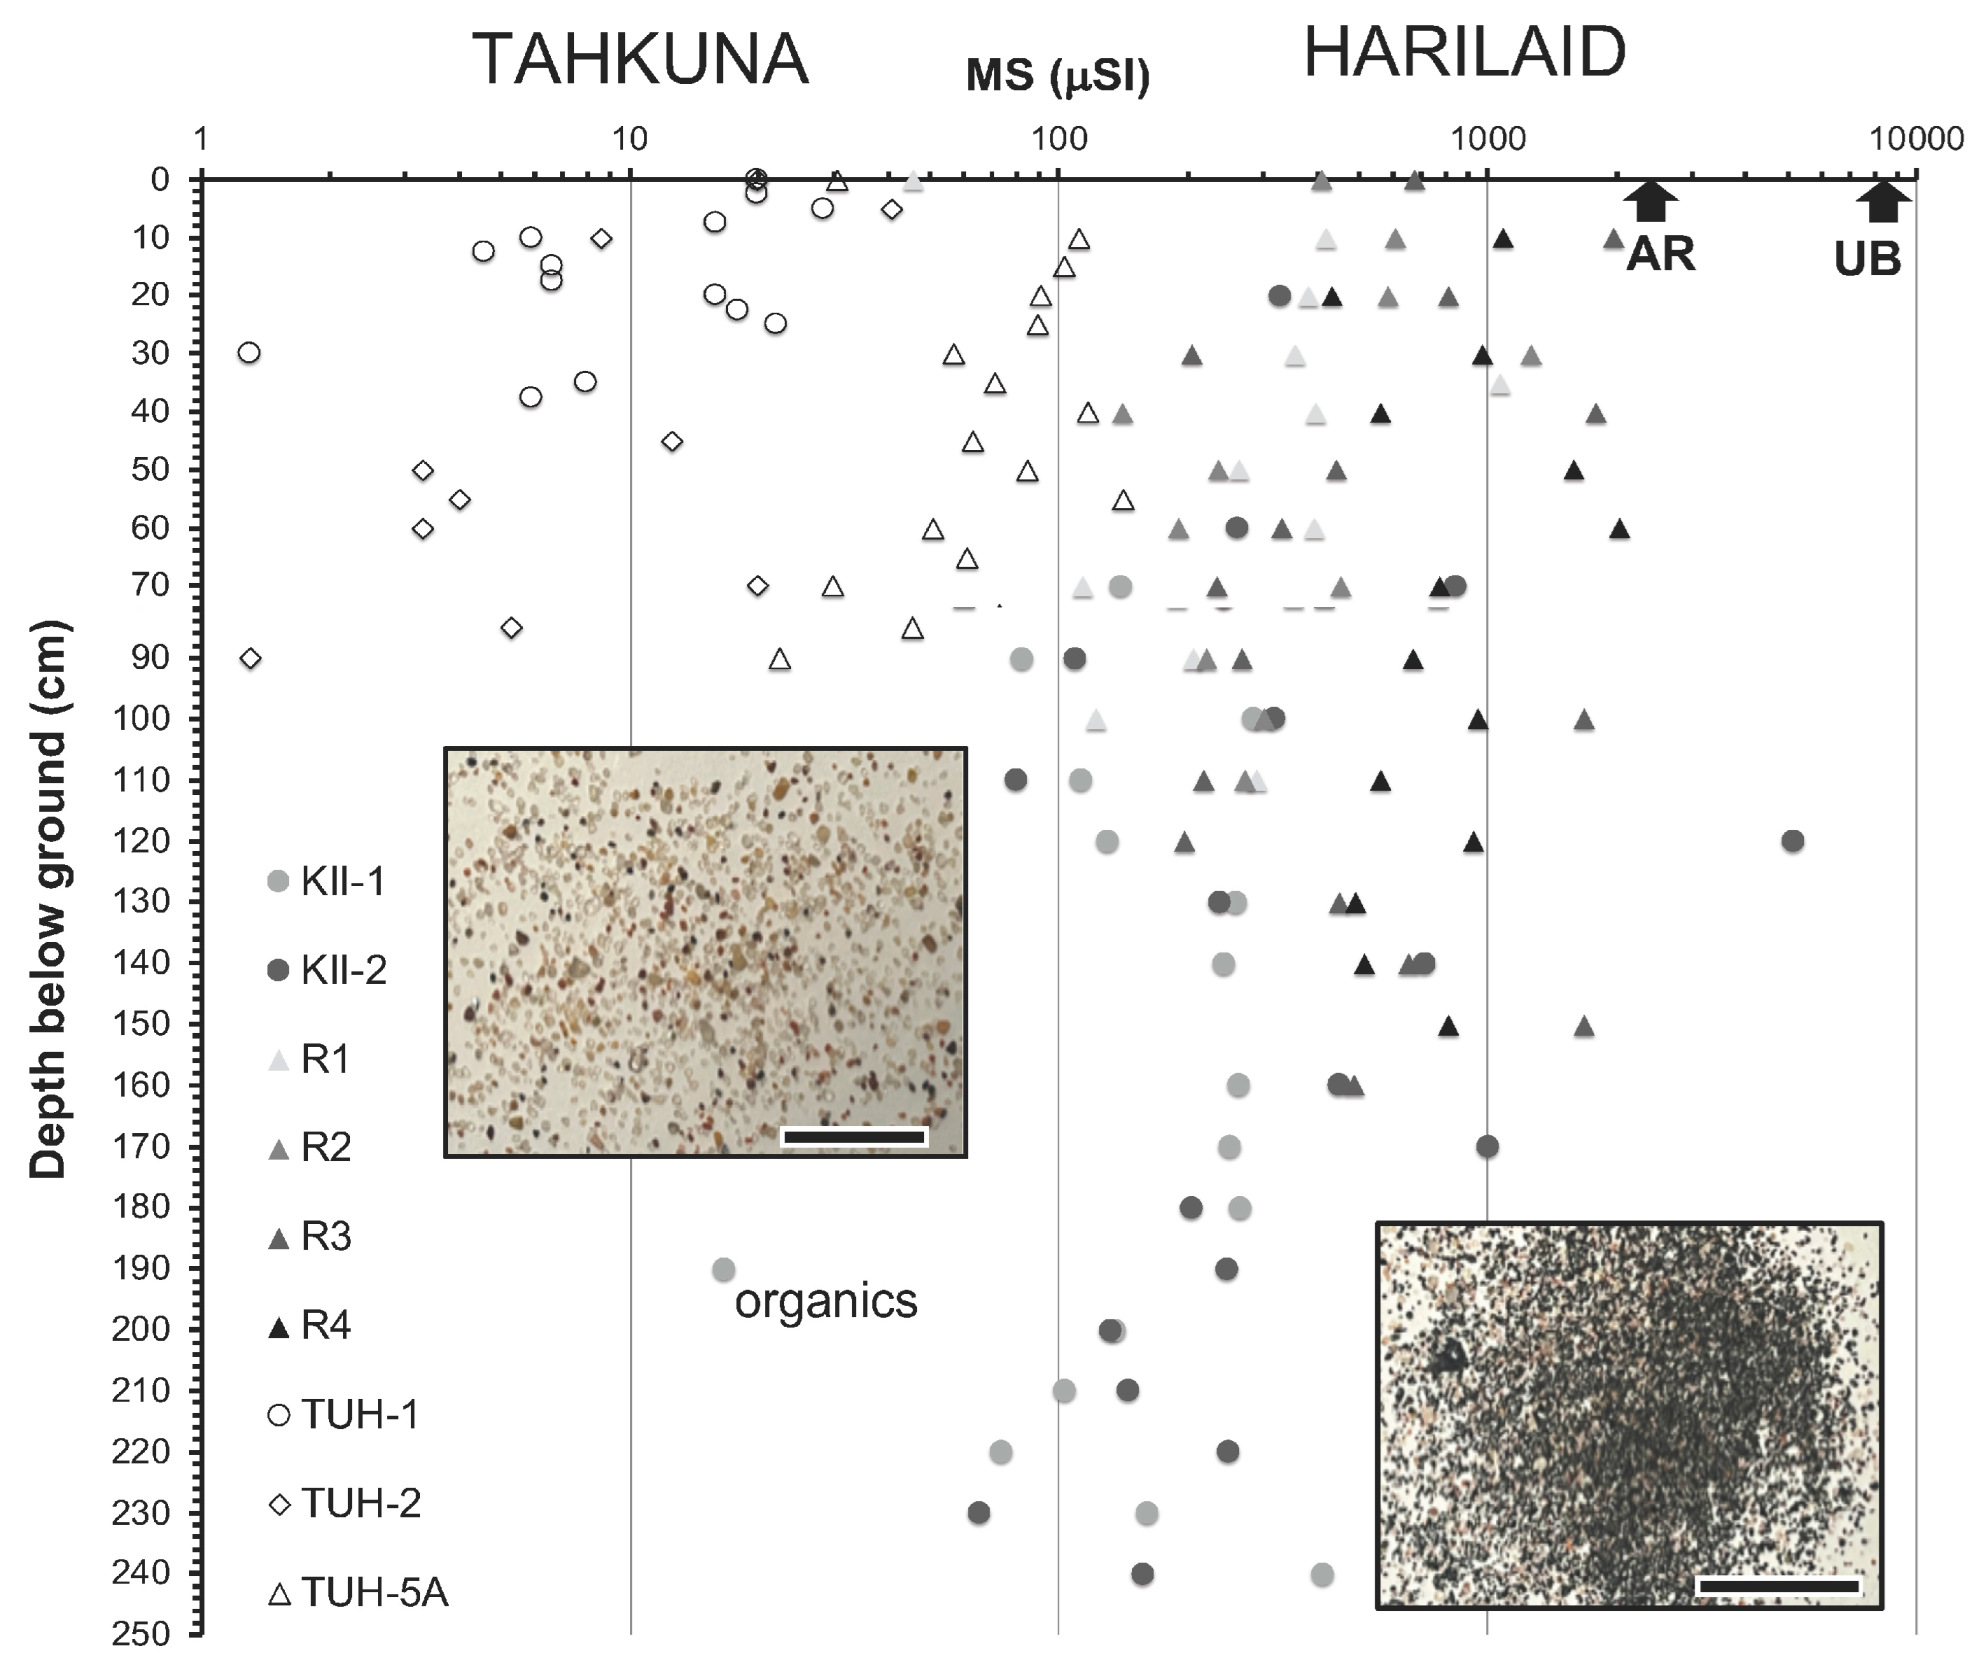
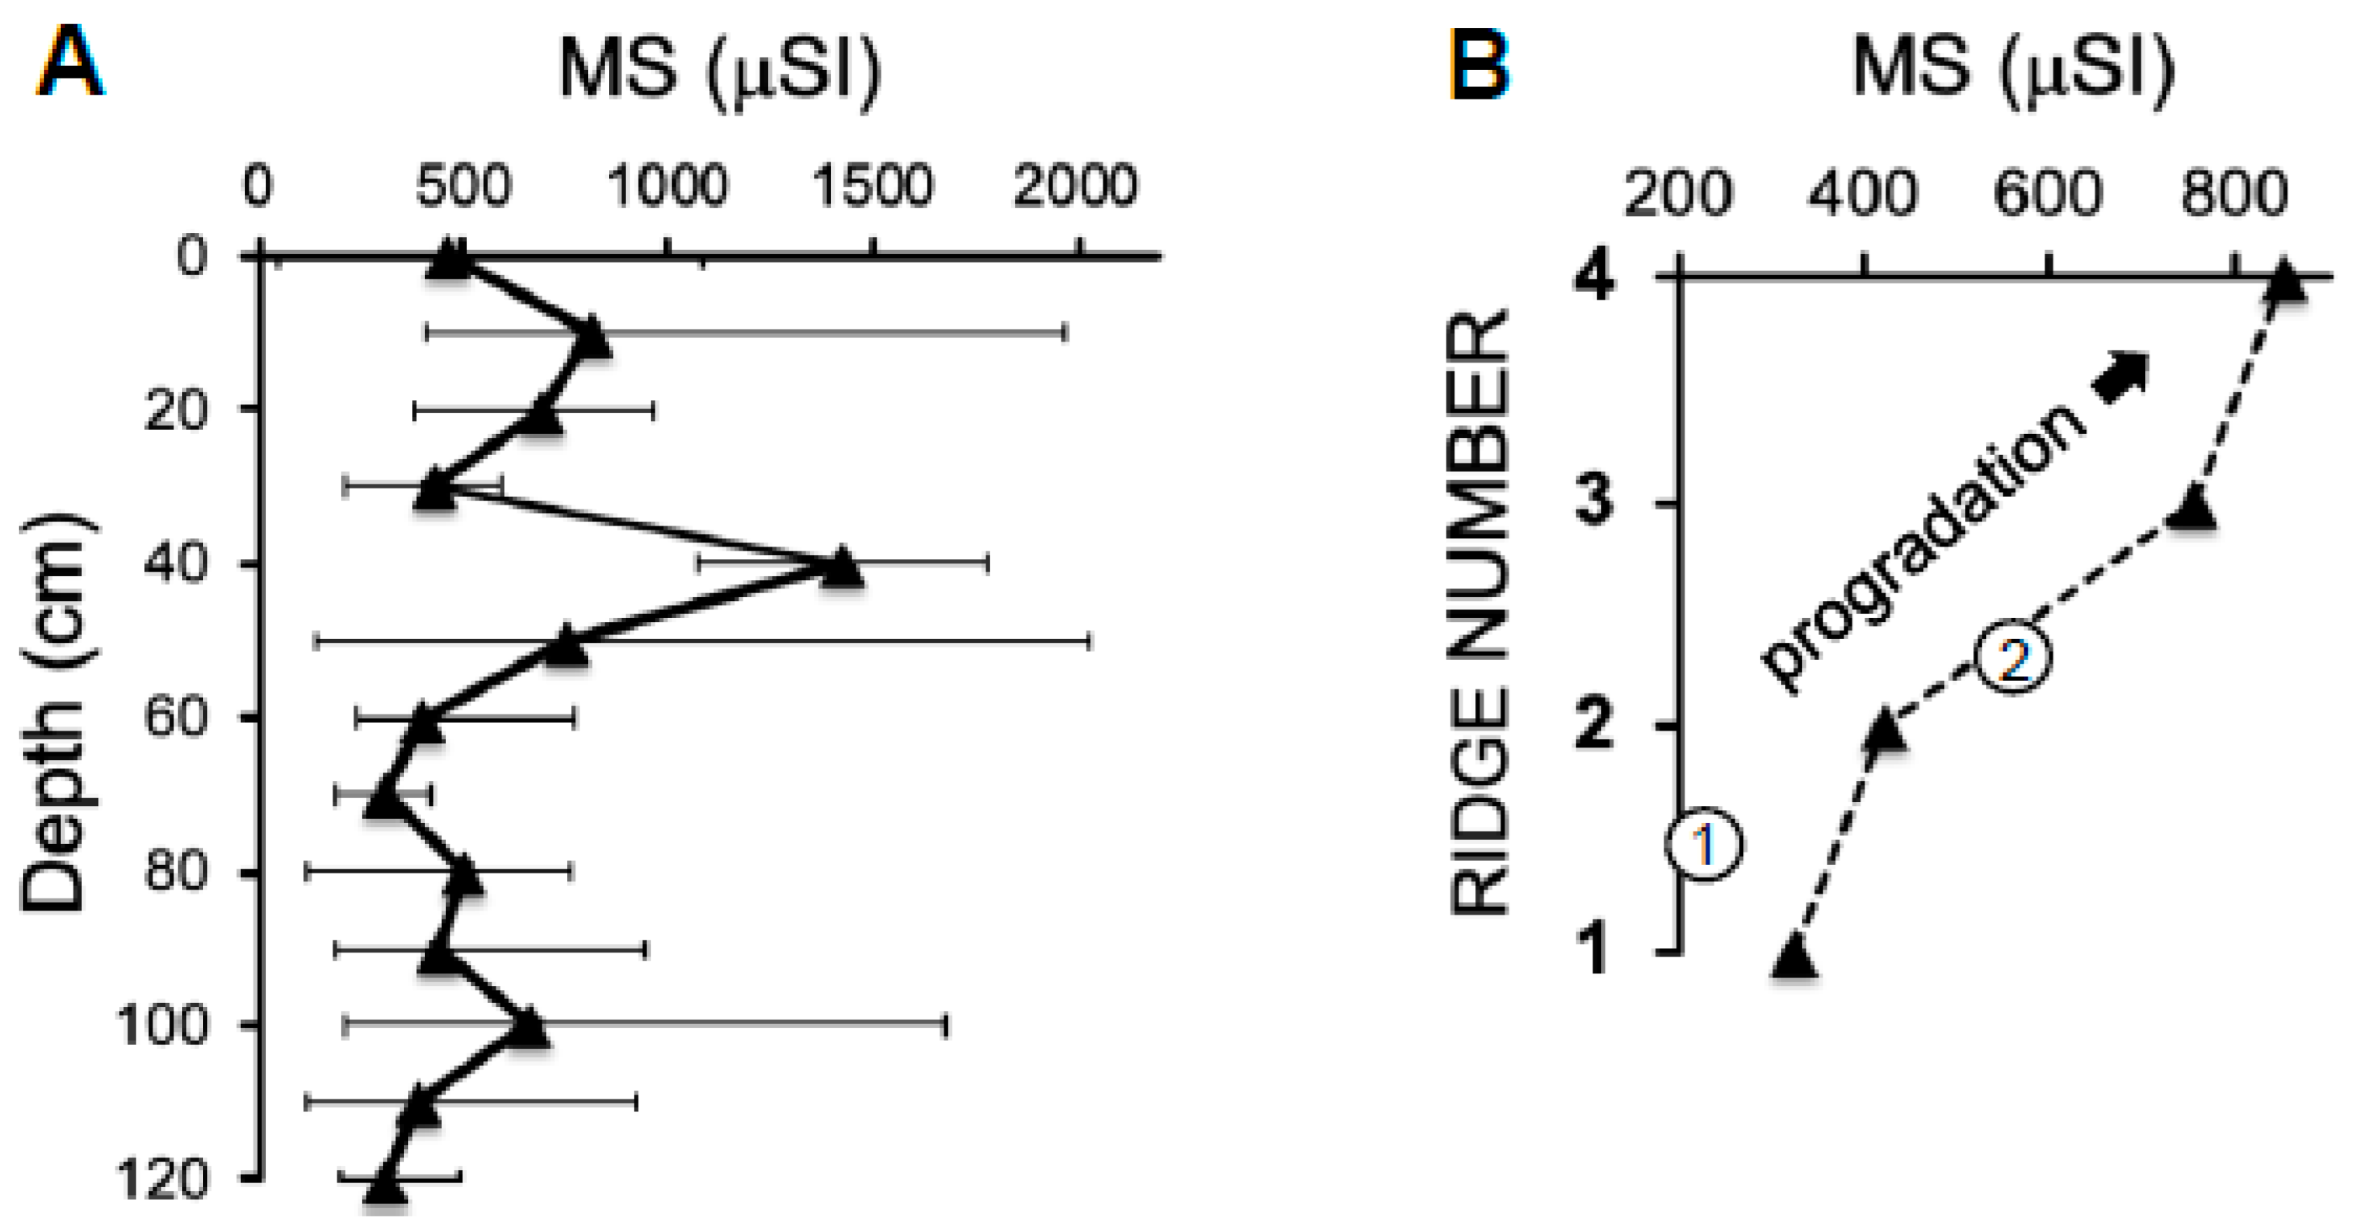
4. Results

| Location | n | kmin | kmax | |
|---|---|---|---|---|
| Tahkuna (n = 68) | ||||
| TUH-1 | 29 | –7.3 | 28.4 | 4.4 |
| TUH-2 core | 20 | –3.3 | 40.9 | 4.7 |
| TUH-5A | 19 | 0 | 140.8 | 68.4 |
| Harilaid (n = 102) | ||||
| R1 | 13 | 45.7 | 1069.9 | 326.6 |
| KII-1 core | 17 | 16.6 a | 283.7 | 208.7 |
| R2 | 12 | 140.2 | 1264.3 | 419.6 |
| KII-2 core | 19 | 65.5 | 5158.2 | 561.6 |
| R3 | 17 | 195.7 | 1966.7 | 754.4 |
| R4 | 15 | 415.9 | 2030.1 | 851.5 |
| Beach | 3 | 16.9 b | 8173.1 c | 2905.4 |
| Dune | 6 | 45.7 d | 1130.1 e | 444.4 |
5. Discussion and Conclusions
Author Contributions
Funding
Institutional Review Board Statement
Informed Consent Statement
Data Availability Statement
Acknowledgments
Conflicts of Interest
References
- Clemmensen, L.B.; Andreasen, F.; Heinemeier, J.; Murray, A. A Holocene coastal aeolian system, Vejers, Denmark: Landscape evolution and sequence stratigraphy. Terra Nova 2001, 13, 129–134. [Google Scholar] [CrossRef]
- Clarke, M.L.; Rendell, H.M.; Tastet, J.-P.; Clavé, B.; Massé, L. Late-Holocene sand invasion and North Atlantic storminess along the Aquitaine Coast, southwest France. Holocene 2002, 12, 231–238. [Google Scholar] [CrossRef]
- Clarke, M.L.; Rendell, H.M. Effects of storminess, sand supply and the North Atlantic Oscillation on sand invasion and coastal dune accretion in western Portugal. Holocene 2006, 16, 341–355. [Google Scholar] [CrossRef]
- Buynevich, I.V.; Bitinas, A.; Pupienis, D. Lithological anomalies in a relict coastal dune: Geophysical and paleoenvironmental markers. Geophys. Res. Lett. 2007, 34, L09707. [Google Scholar] [CrossRef]
- Tamura, T. Beach ridges and prograded beach deposits as palaeoenvironment records. Earth Sci. Rev. 2012, 114, 279–297. [Google Scholar] [CrossRef]
- Suursaar, Ü.; Rosentau, A.; Hang, T.; Tõnisson, H.; Tamura, T.; Vaasma, T.; Vandel, E.; Vilumaa, K.; Sugita, S. Climatically induced cyclicity recorded in the morphology of uplifting Tihu coastal ridgeplain, Hiiumaa Island, eastern Baltic Sea. Geomorphology 2022, 404. [Google Scholar] [CrossRef]
- Komar, P.D.; Wang, C. Processes of selective grain transport and the formation of placers on beaches. J. Geol. 1984, 92, 637–655. [Google Scholar] [CrossRef]
- Smith, A.W.; Jackson, L.A. Assessment of the past extent of cyclone beach erosion. J. Coast. Res. 1990, 6, 73–86. [Google Scholar]
- Dougherty, A.J.; FitzGerald, D.M.; Buynevich, I.V. Evidence for storm-dominated early progradation of Castle Neck Barrier, Massachusetts, USA. Mar. Geol. 2004, 210, 123–134. [Google Scholar] [CrossRef]
- Kattaa, B. Heavy mineral survey of the Syrian beach sands, south of Tartous: Their nature, distribution and potential. Explor. Min. Geol. 2004, 11, 31–41. [Google Scholar] [CrossRef]
- Van Dam, R.L.; Hendrickx, J.M.H.; Cassidy, N.J.; North, R.E.; Dogan, M.; Borchers, B. Effects of magnetite on high-frequency ground-penetrating radar. Geophysics 2013, 78, H1–H11. [Google Scholar] [CrossRef]
- Buynevich, I.V. Morphologically induced density lag formation on bedforms and biogenic structures in aeolian sands. Aeolian Res. 2012, 7, 11–15. [Google Scholar] [CrossRef]
- Pupienis, D.; Buynevich, I.V.; Ryabchuk, D.; Jarmalavičius, D.; Žilinskas, G.; Fedorovič, J.; Kovaleva, O.; Sergeev, A.; Cichoń-Pupienis, A. Spatial patterns in heavy-mineral concentrations along the Curonian Spit coast, southeastern Baltic Sea. Estuar. Coast. Shelf Sci. 2017, 195, 41–50. [Google Scholar] [CrossRef]
- Buynevich, I.V. Detection of mineralogically accentuated biogenic structures with high-resolution geophysics: Implications for ichnology and geoecology. J. Geol. Geogr. Geoecol. 2020, 29, 252–257. [Google Scholar] [CrossRef]
- Vassiljev, J.; Saarse, L.; Grudzinska, I.; Heinsalu, A. Relative sea level changes and development of the Hiiumaa Island, Estonia, during the Holocene. Geol. Quat. 2015, 59, 517–530. [Google Scholar] [CrossRef]
- Rosentau, A. and 28 co-authors. A Holocene relative sea-level database for the Baltic Sea. Quat. Sci. Rev. 2021, 266, 107071. [Google Scholar] [CrossRef]
- Nirgi, T.; Grudzinska, I.; Kalińska, E.; Konsa, M.; Jõeleht, A.; Alexanderson, H.; Hang, T.; Rosentau, A. Late-Holocene relative sea-level changes and palaeoenvironment of the Pre-Viking Age ship burials in Salme, Saaremaa Island, eastern Baltic Sea. Holocene 2022, 32, 237–253. [Google Scholar]
- Kont, A.; Ratas, U.; Puurmann, E. Sea-level rise impact on coastal areas of Estonia. Clim. Chang. 1997, 36, 175–184. [Google Scholar]
- Kriiska, A.; Hang, T.; Rosentau, A. Palaeogeographic model for the SW Estonian coastal zone of the Baltic Sea. In The Baltic Sea Basin (Central and Eastern European Development Studies; Harff, J., Bjorck, S., Hoth, P., Eds.; Springer: Berlin/Heidelbeg, Germany, 2011; pp. 165–188. [Google Scholar]
- Vilumaa, K.; Ratas, U.; Tõnisson, H.; Kont, A.; Pajula, R. Multidisciplinary approach to studying the formation and development of beach-ridge systems on non-tidal uplifting coasts in Estonia. Boreal Env. Res. 2017, 22, 67–81. [Google Scholar]
- Muru, M.; Rosentau, A.; Preusser, F.; Plado, J.; Sibul, I.; Jõeleht, A.; Bjursäter, S.; Aunap, R.; Kriiska, A. Reconstructing Holocene shore displacement and Stone Age palaeogeography from a foredune sequence on Ruhnu Island, Gulf of Riga, Baltic Sea. Geomorphology 2018, 303, 434–445. [Google Scholar] [CrossRef]
- Rivis, R.; Ratas, U.; Kont, A. Some Implications of Coastal Processes Associated with Climate Change on Harilaid, Western Estonia. In Proceedings of the Littoral 2002. 6th International Symposium: The Changing Coast, Porto, Portugal, 22–26 September 2002; pp. 133–139. [Google Scholar]
- Orviku, K.; Suursaar, Ü.; Tõnisson, H.; Kullas, T.; Rivis, R.; Kont, A. Coastal changes in Saaremaa Island, Estonia, caused by winter storms in 1999, 2001, 2005 and 2007. J. Coast. Res. 2009, SI56, 1651–1655. [Google Scholar]
- Orviku, K.; Tõnisson, H.; Jaagus, J. Sea ice shaping the shores. J. Coast. Res. 2011, SI64, 681–685. [Google Scholar]
- Suursaar, Ü.; Jaagus, J.; Kont, A.; Rivis, R.; Tõnisson, H. Field observations on hydrodynamic and coastal geomorphic processes off Harilaid Peninsula (Baltic Sea) in winter and spring 2006−2007. Estuar. Coast. Shelf Sci. 2008, 80, 31–41. [Google Scholar] [CrossRef]
- Soomere, T.; Behrens, A.; Tuomi, L.; Nielsen, J.W. Wave conditions in the Baltic proper and in the Gulf of Finland during windstorm Gudrun. Nat. Hazards Earth Syst. Sci. 2008, 8, 37–46. [Google Scholar] [CrossRef]
- Tõnisson, H.; Orviku, K.; Jaagus, J.; Suursaar, Ü.; Kont, A.; Rivis, R. Coastal damages on Saaremaa Island, Estonia, caused by the extreme storm and flooding on January 9, 2005. J. Coast. Res. 2008, 24, 602–614. [Google Scholar] [CrossRef]
- Tõnisson, H.; Suursaar, Ü.; Rivis, R.; Kont, A.; Orviku, K. Observation and analysis of coastal changes in the West Estonian Archipelago caused by storm Ulli (Emil) in January 2012. J. Coast. Res. 2013, SI65, 832–837. [Google Scholar] [CrossRef]
- Tõnisson, H.; Suursaar, Ü.; Kont, A.; Muru, M.; Rivis, R.; Rosentau, A.; Tamura, T.; Vilumaa, K. Rhythmic patterns of coastal formations as signs of past climate fluctuations on uplifting coasts of Estonia, the Baltic Sea. J. Coast. Res. 2018, SI85, 611–615. [Google Scholar] [CrossRef]
- Seppälä, M. Deflation and redeposition of sand dunes in Finnish Lapland. Quat. Sci. Rev. 1995, 14, 799–809. [Google Scholar] [CrossRef]
- Lancaster, N. Response of eolian geomorphic systems to minor climate change: Examples from the southern Californian deserts. Geomorphology 1997, 19, 333–347. [Google Scholar] [CrossRef]
- Botha, G.A.; Bristow, C.S.; Porat, N.; Duller, G.; Armitage, S.J.; Roberts, H.M.; Clarke, B.M.; Kota, M.W.; Schoeman, P. Evidence for dune reactivation from GPR profiles on the Maputuland coastal plain, South Africa. In Ground Penetrating Radar in Sediments; Bristow, C.S., Jol, H.M., Eds.; Geological Society: London, UK, 2003; Volume 211, pp. 29–46. [Google Scholar]
- Habicht, H.-L.; Rosentau, A.; Jõeleht, A. GIS-based multiproxy coastline reconstruction of the eastern gulf of Riga, Baltic Sea, during the stone age. Boreas 2017, 46, 83–99. [Google Scholar] [CrossRef]
- Tõnisson, H.; Suursaar, Ü.; Rivis, R.; Tamura, T.; Aarna, T.; Vilumaa, K.; Kont, A. Characteristics and formation of a solitary dune belt encountered along the coast of Estonia. J. Coast. Res. 2020, SI95, 689–694. [Google Scholar] [CrossRef]
- Raukas, A.; Bird, E.D.; Orviku, K. The provenance of beaches on the Estonian islands of Hiiumaa and Saaremaa. Proc. Est. Acad. Sci. Geol. 1994, 43, 81–92. [Google Scholar]
- Raukas, A.; Koch, R.; Juriado, K.; Järvelill, J.I. Anomalous radioactivity level and high concentrations of heavy minerals in Lemme area, South-West Estonia. Baltica 2014, 27, 93–104. [Google Scholar] [CrossRef]
- Shankar, R.; Thompson, R.; Prakash, T.N. Estimation of heavy and opaque mineral contents of beach and offshore placers using rock magnetic techniques. Geo. Mar. Lett. 1996, 16, 313–318. [Google Scholar] [CrossRef]
- Järvelill, J.-I.; Kleesment, A.; Raukas, A. Accumulation of heavy minerals in the eastern coast of the Gulf of Riga, south-western Estonia. Bull. Geol. Soc. Finl. 2015, 87, 67–78. [Google Scholar] [CrossRef]
- Buynevich, I.V.; FitzGerald, D.M.; Goble, R.J. A 1500-year record of North Atlantic storm activity based on optically dated relict beach scarps. Geology 2007, 35, 543–546. [Google Scholar] [CrossRef]
- Buynevich, I.V.; Jol, H.M.; FitzGerald, D.M. Coastal Environments. In Ground Penetrating Radar: Theory and Applications; Jol, H.M., Ed.; Elsevier: Amsterdam, The Netherlands, 2009; pp. 299–322. [Google Scholar]
- van Heteren, S.; FitzGerald, D.M.; McKinlay, P.A.; Buynevich, I.V. Radar facies of paraglacial barrier systems: Coastal New England, USA. Sedimentology 1998, 45, 181–200. [Google Scholar] [CrossRef]
- Buynevich, I.V.; FitzGerald, D.M.; van Heteren, S. Sedimentary records of intense storms in Holocene barrier sequences, Maine, USA. Mar. Geol. 2004, 210, 135–148. [Google Scholar] [CrossRef]
- Buynevich, I.V.; Kadurin, S.V. Paleo-storm indicators within Sasyk Liman baymouth barrier, Ukraine. Geol. Bull. Lviv Natl. Univ. Ukr. 2015, i, 53–59. [Google Scholar]
- Rosentau, A.; Jõeleht, A.; Plado, J.; Aunap, R.; Muru, M.; Eskola, K.O. Development of the Holocene foredune plain in the Narva-Jõesuu area, eastern Gulf of Finland. Geol. Q. 2013, 57, 89–100. [Google Scholar]
- Vilumaa, K.; Tõnisson, H.; Sugita, S.; Buynevich, I.V.; Kont, A.; Muru, M.; Preusser, F.; Bjursäter, S.; Vaasma, T.; Vandel, E.; et al. Past extreme events recorded in the internal architecture of coastal formations in the Baltic Sea region. J. Coast. Res. 2016, SI75, 775–779. [Google Scholar] [CrossRef]
- Komar, P.D. Physical processes of waves and currents and the formation of marine placers. Rev. Aquat. Sci. 1989, 1, 393–423. [Google Scholar]
- Hughes, M.G.; Keene, J.B.; Joseph, R.G. Hydraulic sorting of heavy-mineral grains by swash on a medium-sand beach. J. Sediment. Res. 2000, 70, 994–1004. [Google Scholar] [CrossRef]
- Tomkins, M.R.; Nielsen, P.; Michael, G.; Hughes, M.G. Selective entrainment of sediment graded by size and density under waves. J. Sediment. Res. 2003, 73, 906–911. [Google Scholar] [CrossRef]
- Suursaar, Ü.; Tõnisson, H. Storminess-related rhythmic ridge patterns on the coasts of Estonia. Estonian J. Earth Sci. 2017, 66, 220–237. [Google Scholar] [CrossRef]
- Suursaar, Ü.; Kall, T.; Steffen, H.; Tõnisson, H. Cyclicity in ridge patterns on the prograding coasts of Estonia. Boreas 2019, 48, 913–928. [Google Scholar] [CrossRef]
- Suursaar, Ü.; Jaagus, J.; Tõnisson, H. How to quantify long-term changes in coastal sea storminess? Estuar. Coast. Shelf Sci. 2015, 156, 31–41. [Google Scholar] [CrossRef]
- Tõnisson, H.; Suursaar, Ü.; Orviku, K.; Jaagus, J.; Kont, A.; Willis, D.A.; Rivis, R. Changes in coastal processes in relation to changes in large-scale atmospheric circulation, wave parameters and sea levels in Estonia. J. Coast. Res. 2011, SI64, 701–705. [Google Scholar]
- Vandel, E.; Vaasma, T.; Sugita, S.; Tõnisson, H.; Jaagus, J.; Vilumaa, K.; Anderson, A.; Kont, A. Reconstruction of past storminess: Evaluation of an indicator approach using aeolian mineral grains buried in peat deposits, Estonia. Quat. Sci. Rev. 2019, 218, 215–227. [Google Scholar] [CrossRef]
- Rosentau, A.; Nirgi, T.; Muru, M.; Bjursäater, S.; Hang, T.; Preusser, F.; Risberg, J.; Sohar, K.; Tõnisson, H.; Kriiska, A. Holocene relative shore level changes and Stone Age hunter-gatherers in Hiiumaa Island, eastern Baltic Sea. Boreas 2020, 49, 783–798. [Google Scholar] [CrossRef]


Disclaimer/Publisher’s Note: The statements, opinions and data contained in all publications are solely those of the individual author(s) and contributor(s) and not of MDPI and/or the editor(s). MDPI and/or the editor(s) disclaim responsibility for any injury to people or property resulting from any ideas, methods, instructions or products referred to in the content. |
© 2023 by the authors. Licensee MDPI, Basel, Switzerland. This article is an open access article distributed under the terms and conditions of the Creative Commons Attribution (CC BY) license (https://creativecommons.org/licenses/by/4.0/).
Share and Cite
Buynevich, I.V.; Tõnisson, H.; Rosentau, A.; Hang, T.; Kont, A.; Tamura, T.; Suuroja, S.; Palginõmm, V.; Döring, S.F.S. Rapid Magnetic Susceptibility Characterization of Coastal Morphosedimentary Units at Two Insular Strandplains in Estonia. J. Mar. Sci. Eng. 2023, 11, 232. https://doi.org/10.3390/jmse11020232
Buynevich IV, Tõnisson H, Rosentau A, Hang T, Kont A, Tamura T, Suuroja S, Palginõmm V, Döring SFS. Rapid Magnetic Susceptibility Characterization of Coastal Morphosedimentary Units at Two Insular Strandplains in Estonia. Journal of Marine Science and Engineering. 2023; 11(2):232. https://doi.org/10.3390/jmse11020232
Chicago/Turabian StyleBuynevich, Ilya V., Hannes Tõnisson, Alar Rosentau, Tiit Hang, Are Kont, Toru Tamura, Sten Suuroja, Valdeko Palginõmm, and Sophia F. S. Döring. 2023. "Rapid Magnetic Susceptibility Characterization of Coastal Morphosedimentary Units at Two Insular Strandplains in Estonia" Journal of Marine Science and Engineering 11, no. 2: 232. https://doi.org/10.3390/jmse11020232
APA StyleBuynevich, I. V., Tõnisson, H., Rosentau, A., Hang, T., Kont, A., Tamura, T., Suuroja, S., Palginõmm, V., & Döring, S. F. S. (2023). Rapid Magnetic Susceptibility Characterization of Coastal Morphosedimentary Units at Two Insular Strandplains in Estonia. Journal of Marine Science and Engineering, 11(2), 232. https://doi.org/10.3390/jmse11020232