Article

Study on the Formation Characteristics and Disaster Mitigation Mechanisms of Rip Currents on Arc-Shaped Beach

1
School of Marine Science and Engineering, Hainan University, Haikou 570228, China
2
Hainan Academy of Ocean and Fisheries Sciences, Haikou 570206, China
3
School of Civil Engineering and Architecture, Hainan University, Haikou 570228, China
4
School of Marine Science and Technology, Northwestern Polytechnical University, Xi’an 710072, China
5
College of Transportation Engineering, Dalian Maritime University, Dalian 116026, China
6
School of Naval Architecture, Dalian University of Technology, Dalian 116024, China
*
Author to whom correspondence should be addressed.
J. Mar. Sci. Eng. 2023, 11(12), 2381; https://doi.org/10.3390/jmse11122381
Submission received: 14 November 2023 / Revised: 7 December 2023 / Accepted: 12 December 2023 / Published: 18 December 2023
(This article belongs to the Section Coastal Engineering)

Abstract

:
Rip currents are fast offshore currents generated during the breaking process of waves propagating nearshore, posing a potential life safety threat to coastal bathers. This study utilizes a Boussinesq phase-resolving model to investigate the formation mechanism of rip currents at Dadonghai Beach, based on its actual topography, and explores the characteristics of rip current formation under various wave conditions, with an emphasis on analyzing vortices, the mean water level and the spatial distribution of average velocity. The results indicate that rip current formation is significantly influenced by wave height and period. The increase in wave height and period results in more intense rip currents and higher water level fluctuations on arc-shaped beaches and on both sides of the bay, leading to complex vortex distributions. An increase in the angle of wave incidence hinders rip current formation in arc-shaped beach areas but is favorable to the generation of deflection rips on both sides of the bay. Furthermore, an increase in bottom friction inhibits rip current formation. When the water depth decreases in the channels, rip currents transition into longshore currents. The findings of this research offer valuable scientific insights into the formation mechanisms of rip currents and contribute to their prediction and prevention.

1. Introduction

Rip currents are fast and narrow offshore currents that form near the shore through the surf zone and extend out to sea [1], with velocities typically between 0.5 and 1 m/s and up to 3 m/s. As Shepard et al. [2] elucidated, rip currents are an integral component of nearshore circulation, influencing sediment transport, water circulation and pollutant dispersion [3,4,5]. Rip currents are characterized by their random occurrence and rapid velocities, making them a common natural hazard in coastal areas and resulting in fatalities worldwide each year. For example, a significant rip current incident occurred at Haeundae Beach in South Korea in 2012, sweeping more than 100 tourists out to sea [6]. Similarly, in 2015, Dadonghai Beach in Sanya, China, witnessed the worst drowning accident in its history, resulting in four people drowning, three of whom died. (https://www.sohu.com/a/662896410_121493485 accessed on 10 May 2023). In 2021, a major rip current event in Zhangzhou City, Fujian Province, China, resulted in 17 people being swept away, tragically claiming 11 lives (https://aoc.ouc.edu.cn/2021/0822/c15171a344350/pagem.htm accessed on 10 May 2023). Based on data from natural disaster statistics in the United States, 69 deaths were attributed to rip currents in 2022, with an average annual death toll of approximately 71 people over the past decade (https://www.weather.gov/hazstat/ accessed on 8 May 2023). In an extensive study of six beaches in southern China, Zhu et al. [7] used online and on-site questionnaires to assess tourists’ knowledge and perceptions of rip currents. The results indicated that most tourists had insufficient awareness of the potential hazards posed by rip currents, highlighting the need for improved safety education and awareness initiatives.
Early studies of rip currents were primarily physical experiments. For instance, Haller et al. [8] established a physical model of a barred beach with double rip channels in a wave basin, used regular waves as incident waves and measured rip current velocity. The relationship between water level and rip current formation was also established. In addition, the instability of rip currents was observed in this experiment. Due to the pioneering nature of the model, a large number of studies have been carried out by subsequent researchers based on it [9,10,11]. With the advancement of computational capabilities, numerical simulations have emerged as the primary avenue for rip current research, leading to significant progress in the field. Hong et al. [12] conducted numerical investigations focusing on multichannel sandbar topography, revealing how diverse wave parameters and channels affect rip current formation. Their work provided insights into the factors contributing to the disruption of rip current persistence due to changes in wave angles. Zhang et al. [13] conducted research on bay and sandbar channel topography, which is particularly susceptible to rip current hazards, and they explored variations in rip currents under the influence of tides and wave modulation. Hu et al. [14] assessed rip current hazards on Hailing Island, China, considering factors such as water depth, tidal level and sediment dynamics. Shin et al. [15] investigated Haeundae Beach, Busan, using a Boussinesq phase-resolution model, providing insights into the multifaceted mechanism of rip current generation and the role of channels. Wang et al. [16] investigated the influence of different curvatures of an arc-shaped coastline and coastal slopes on rip current formation at Dadonghai Beach. Moulton et al. [17] used the numerical modeling system COAWST to accurately replicate observed longshore currents and rip current patterns. The study examined flow dynamics near nonuniform bathymetry through channel dredging and numerical modeling, revealing correlations between offshore-directed velocity and various parameters, including a breaking-wave-driven setup, wave characteristics and bathymetric features. Tomasicchio et al. [18] proposed a new morphological model that reproduces well the coastal evolution process by predicting littoral transport and the associated coastal morphology on short- and long-term time scales. The stability of the numerical simulation of rip currents was provided. In the pursuit of greater fidelity to real wave environments, Xu et al. [19] delved into the mechanisms of rip current formation under the influence of cross waves. In the nearshore ocean, variations in longshore bathymetry are ubiquitous. These may be natural, as bottom sand is rearranged with complex feedback among waves, currents and sediment [20]. In this situation, wave breaking generates vorticity. Vortices affect the flow, transport and distribution of seawater in the ocean, thereby influencing the formation and development of rip currents. Additionally, the appearance of vortices alters local oceanic dynamical characteristics, including changes in seawater velocity and direction, which directly impact the evolution of rip currents. Brocchini et al. [20] extensively studied the vortices formed near submerged breakwater and sandbar channel topography, delving into the processes of their generation and evolution. Additionally, as two wave trains approach the coastline at varying angles, they produce breakers with a finite cross-flow length and heightened vorticity along their edges. Based on Brocchini’s research, Kennedy [21] developed a simplified model to predict the evolution of vortices, accounting for changes in channel widths. Numerical simulations and experimental analyses underscored the profound influence of local topographical conditions on the generation and movement of vortices, with alterations in topographical parameters effectively controlling vortex direction and intensity. Moreover, the interacting waves resulting from diffraction behind structures or islands may give rise to short waves and rip currents. Postacchini et al. [22] conducted a comprehensive investigation into the generation and evolution of vortices within crossing waves and used theoretical analyses and numerical simulations to derive useful conclusions and relationships, consequently offering fresh insights into wave-induced vortex dynamics. Choi et al. [23] conducted laboratory experiments and numerical simulations to examine the formation of rip currents between breaking wave crests. By measuring wave heights and surface averages, they observed the development and variability of rip currents. The results of numerical simulations aligned with experimental findings but also brought to light the limitations of numerical models in the context of wave breaking and mixing. Furthermore, the study addressed the distinctions between cross waves and original crossing waves while outlining avenues for future research. Despite the significant advancements facilitated by numerical simulations, certain limitations persist, including data constraints, parameter selection and spatial scale. To address these shortcomings, the incorporation of in situ observation techniques becomes crucial.
With the continuous advancement of in situ observation equipment, an increasing array of new equipment has been deployed for field observations of rip currents. Researchers have utilized in situ observation techniques and numerical simulations to investigate the formation mechanism of rip currents under actual sea conditions. Winter et al. [24] investigated the characteristics of rip currents under the influence of obliquely incident waves and tidally driven longshore currents. Their study utilized numerical simulations and field observations to examine how mean water levels, tidal current strength and direction influence rip current formation. Choi et al. [25] conducted their research at Dacheon Beach in South Korea, where they observed variations in rip current morphology with changing tidal levels. In particular, they observed the unique phenomenon of longshore currents transitioning into feeder currents for rip currents. Schönhofer et al. [26] determined the bathymetry conditions favorable to the occurrence of rip currents in the Southern Baltic coastal zone based on numerical simulations and field measurements, and they discussed the relationship between rip current velocities, seabed topography and sea conditions. Haller et al. [27] utilized X-band radar for the observation and recognition of rip currents. Their use of radar images allowed for precise observations of the extension length and direction of the rip currents. The study also revealed an increased occurrence of rip currents during low tides. Notably, the radar detected rip current events that other fixed instruments failed to capture. In summary, the remote sensing of rip currents has significantly facilitated the observation of these phenomena. Additionally, Ludeno et al. [28] introduced a method for the measurement of nearshore seabed topography and the estimation of water depth using X-band radar images. The effectiveness of this method was confirmed through both experimental and numerical simulations, demonstrating its capability for accurately estimating ocean depth. The synergistic fusion of advanced observational tools and numerical simulations significantly enhances our understanding of rip currents in real marine environments. This approach surpasses traditional laboratory-based experiments and provides profound insights into the intricate behavior of rip currents.
Dadonghai, located in Sanya, China, is a renowned coastal bathing area. However, the area faces a significant challenge from rip currents, resulting in numerous drowning rescues each year. The need to scientifically identify and proactively mitigate the risks associated with these rip currents has become increasingly urgent. This paper employs the Boussinesq equation to conduct a comprehensive investigation into how various factors, such as wave height, direction, period and bottom friction, contribute to the formation of rip currents in the Dadonghai region. At the same time, this study explores strategies to manipulate the water depth of channels through structural interventions, with the aim of reducing the impact of rip currents. Through this multifaceted investigation, this paper seeks to provide a solid theoretical foundation for the management and prevention of rip currents in the Dadonghai area, thereby improving overall safety measures.

2. Study Area Overview and Numerical Model

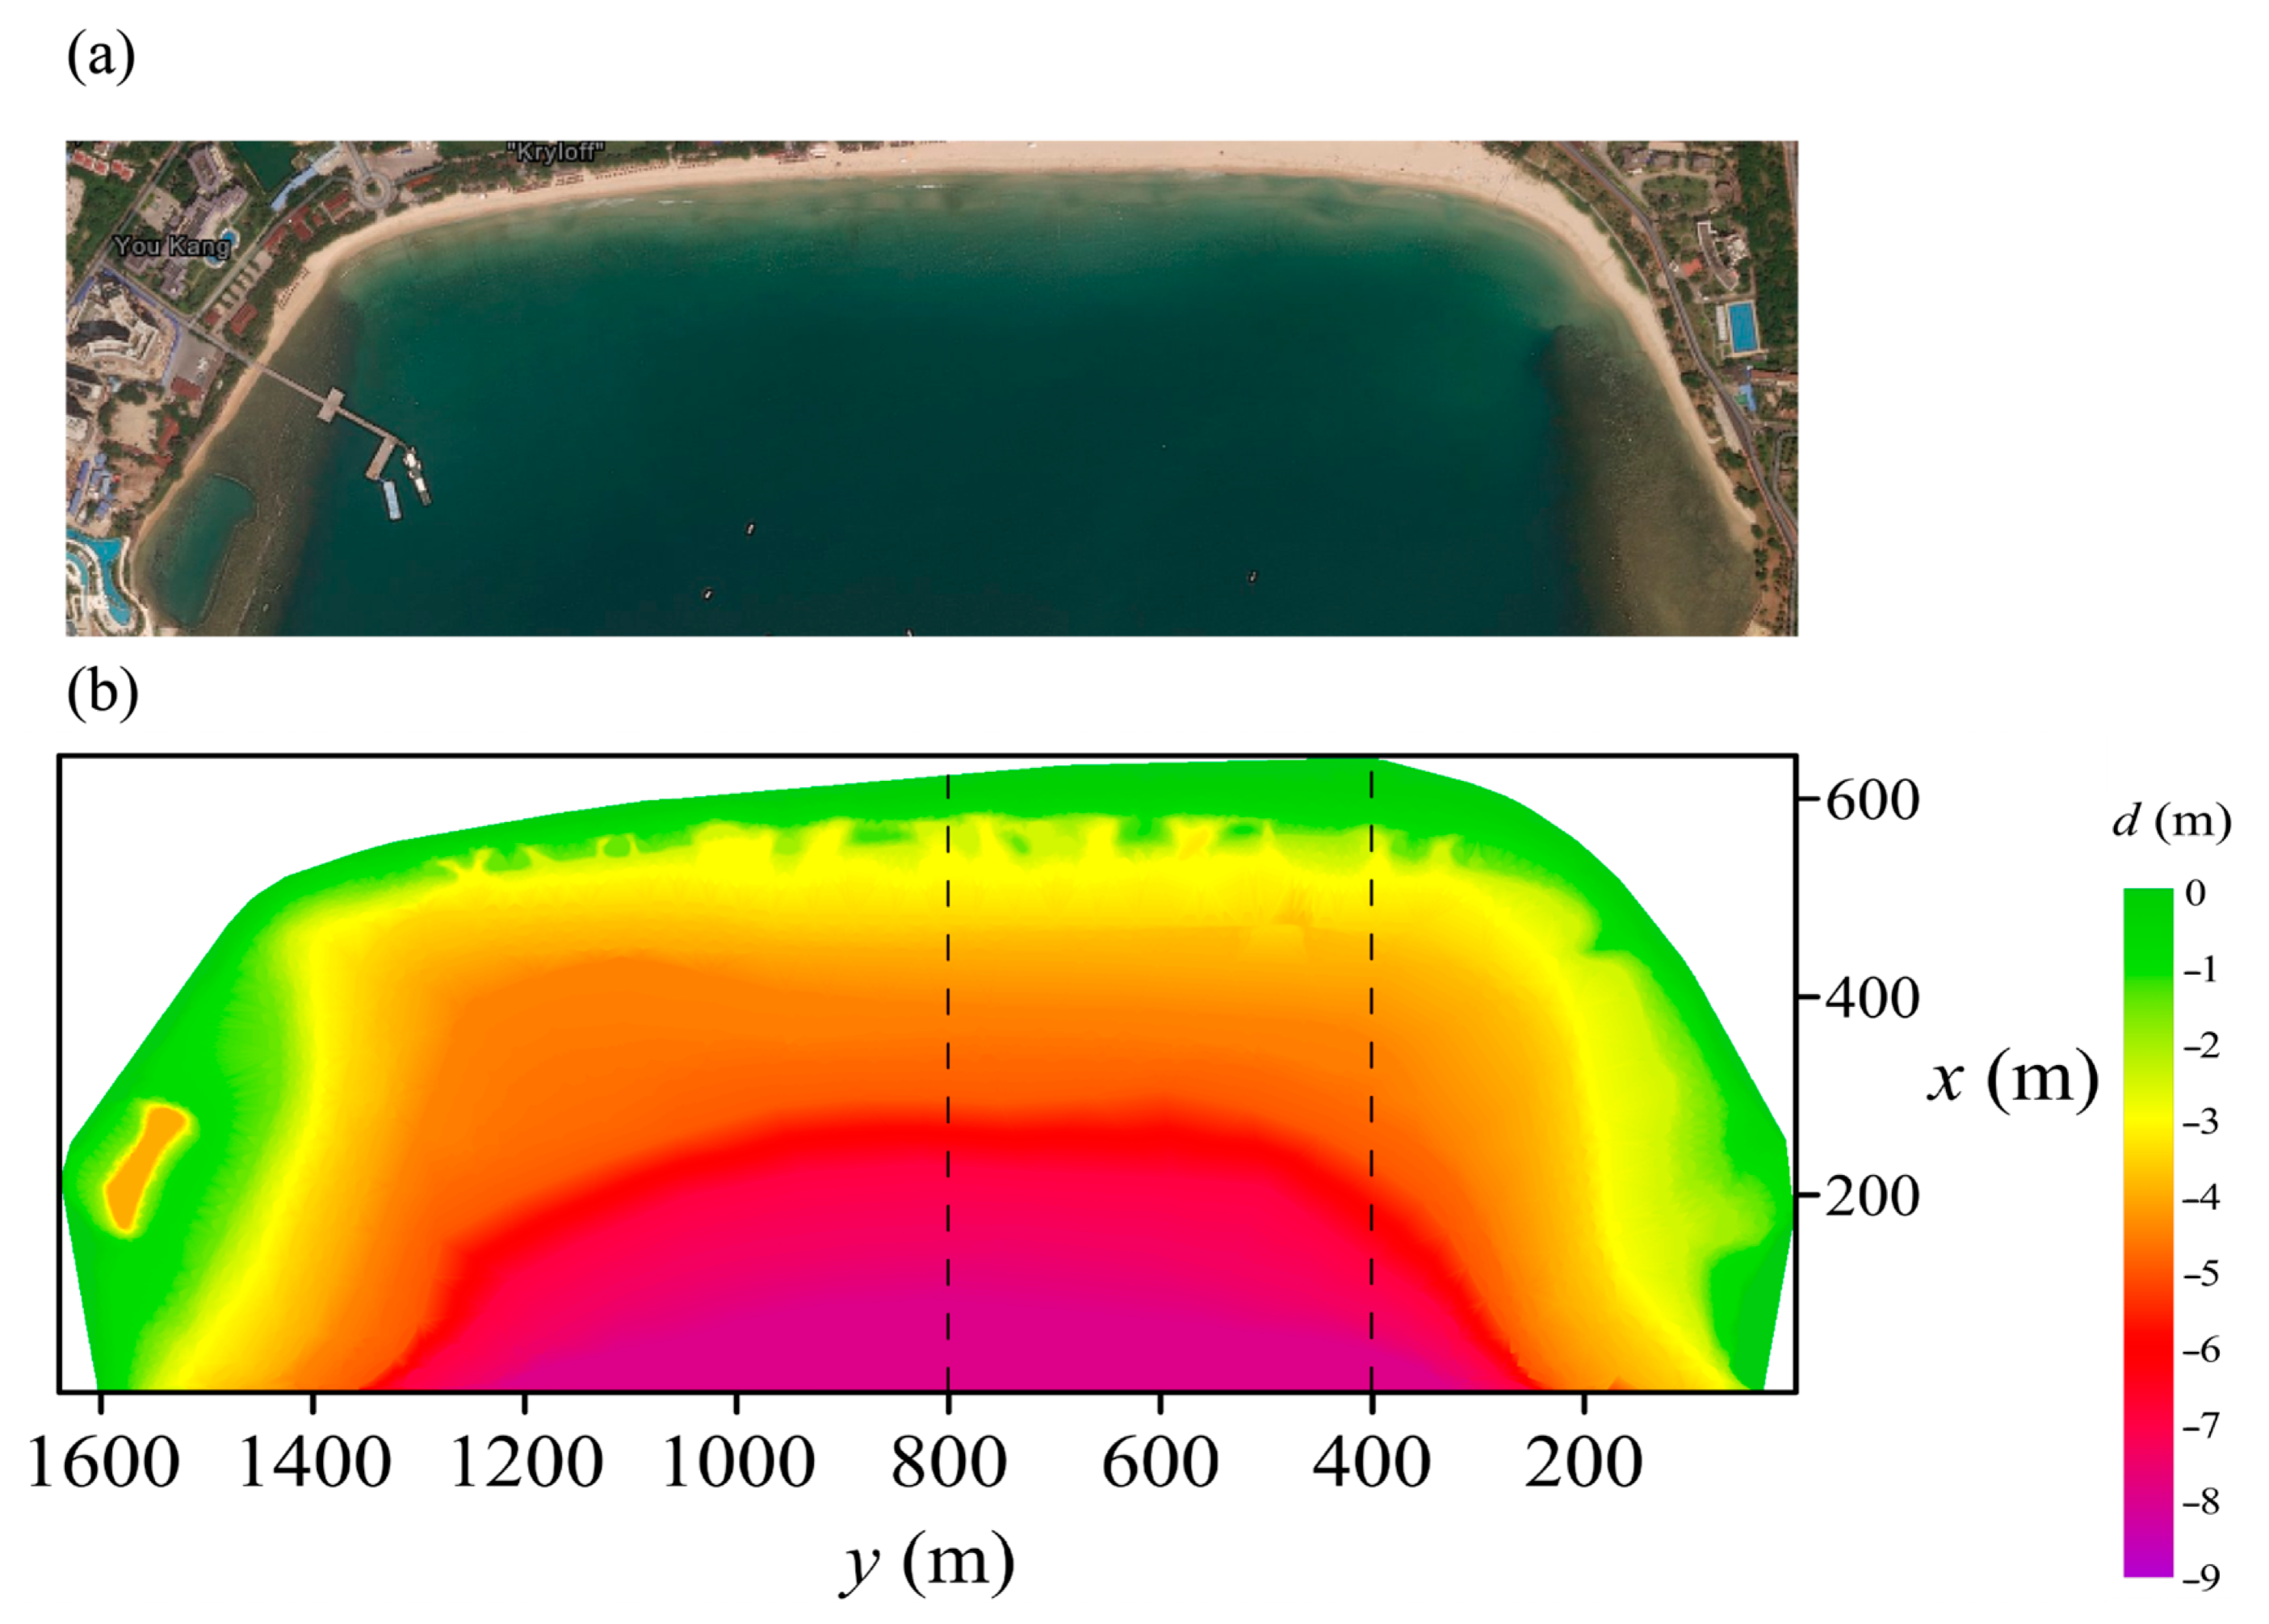
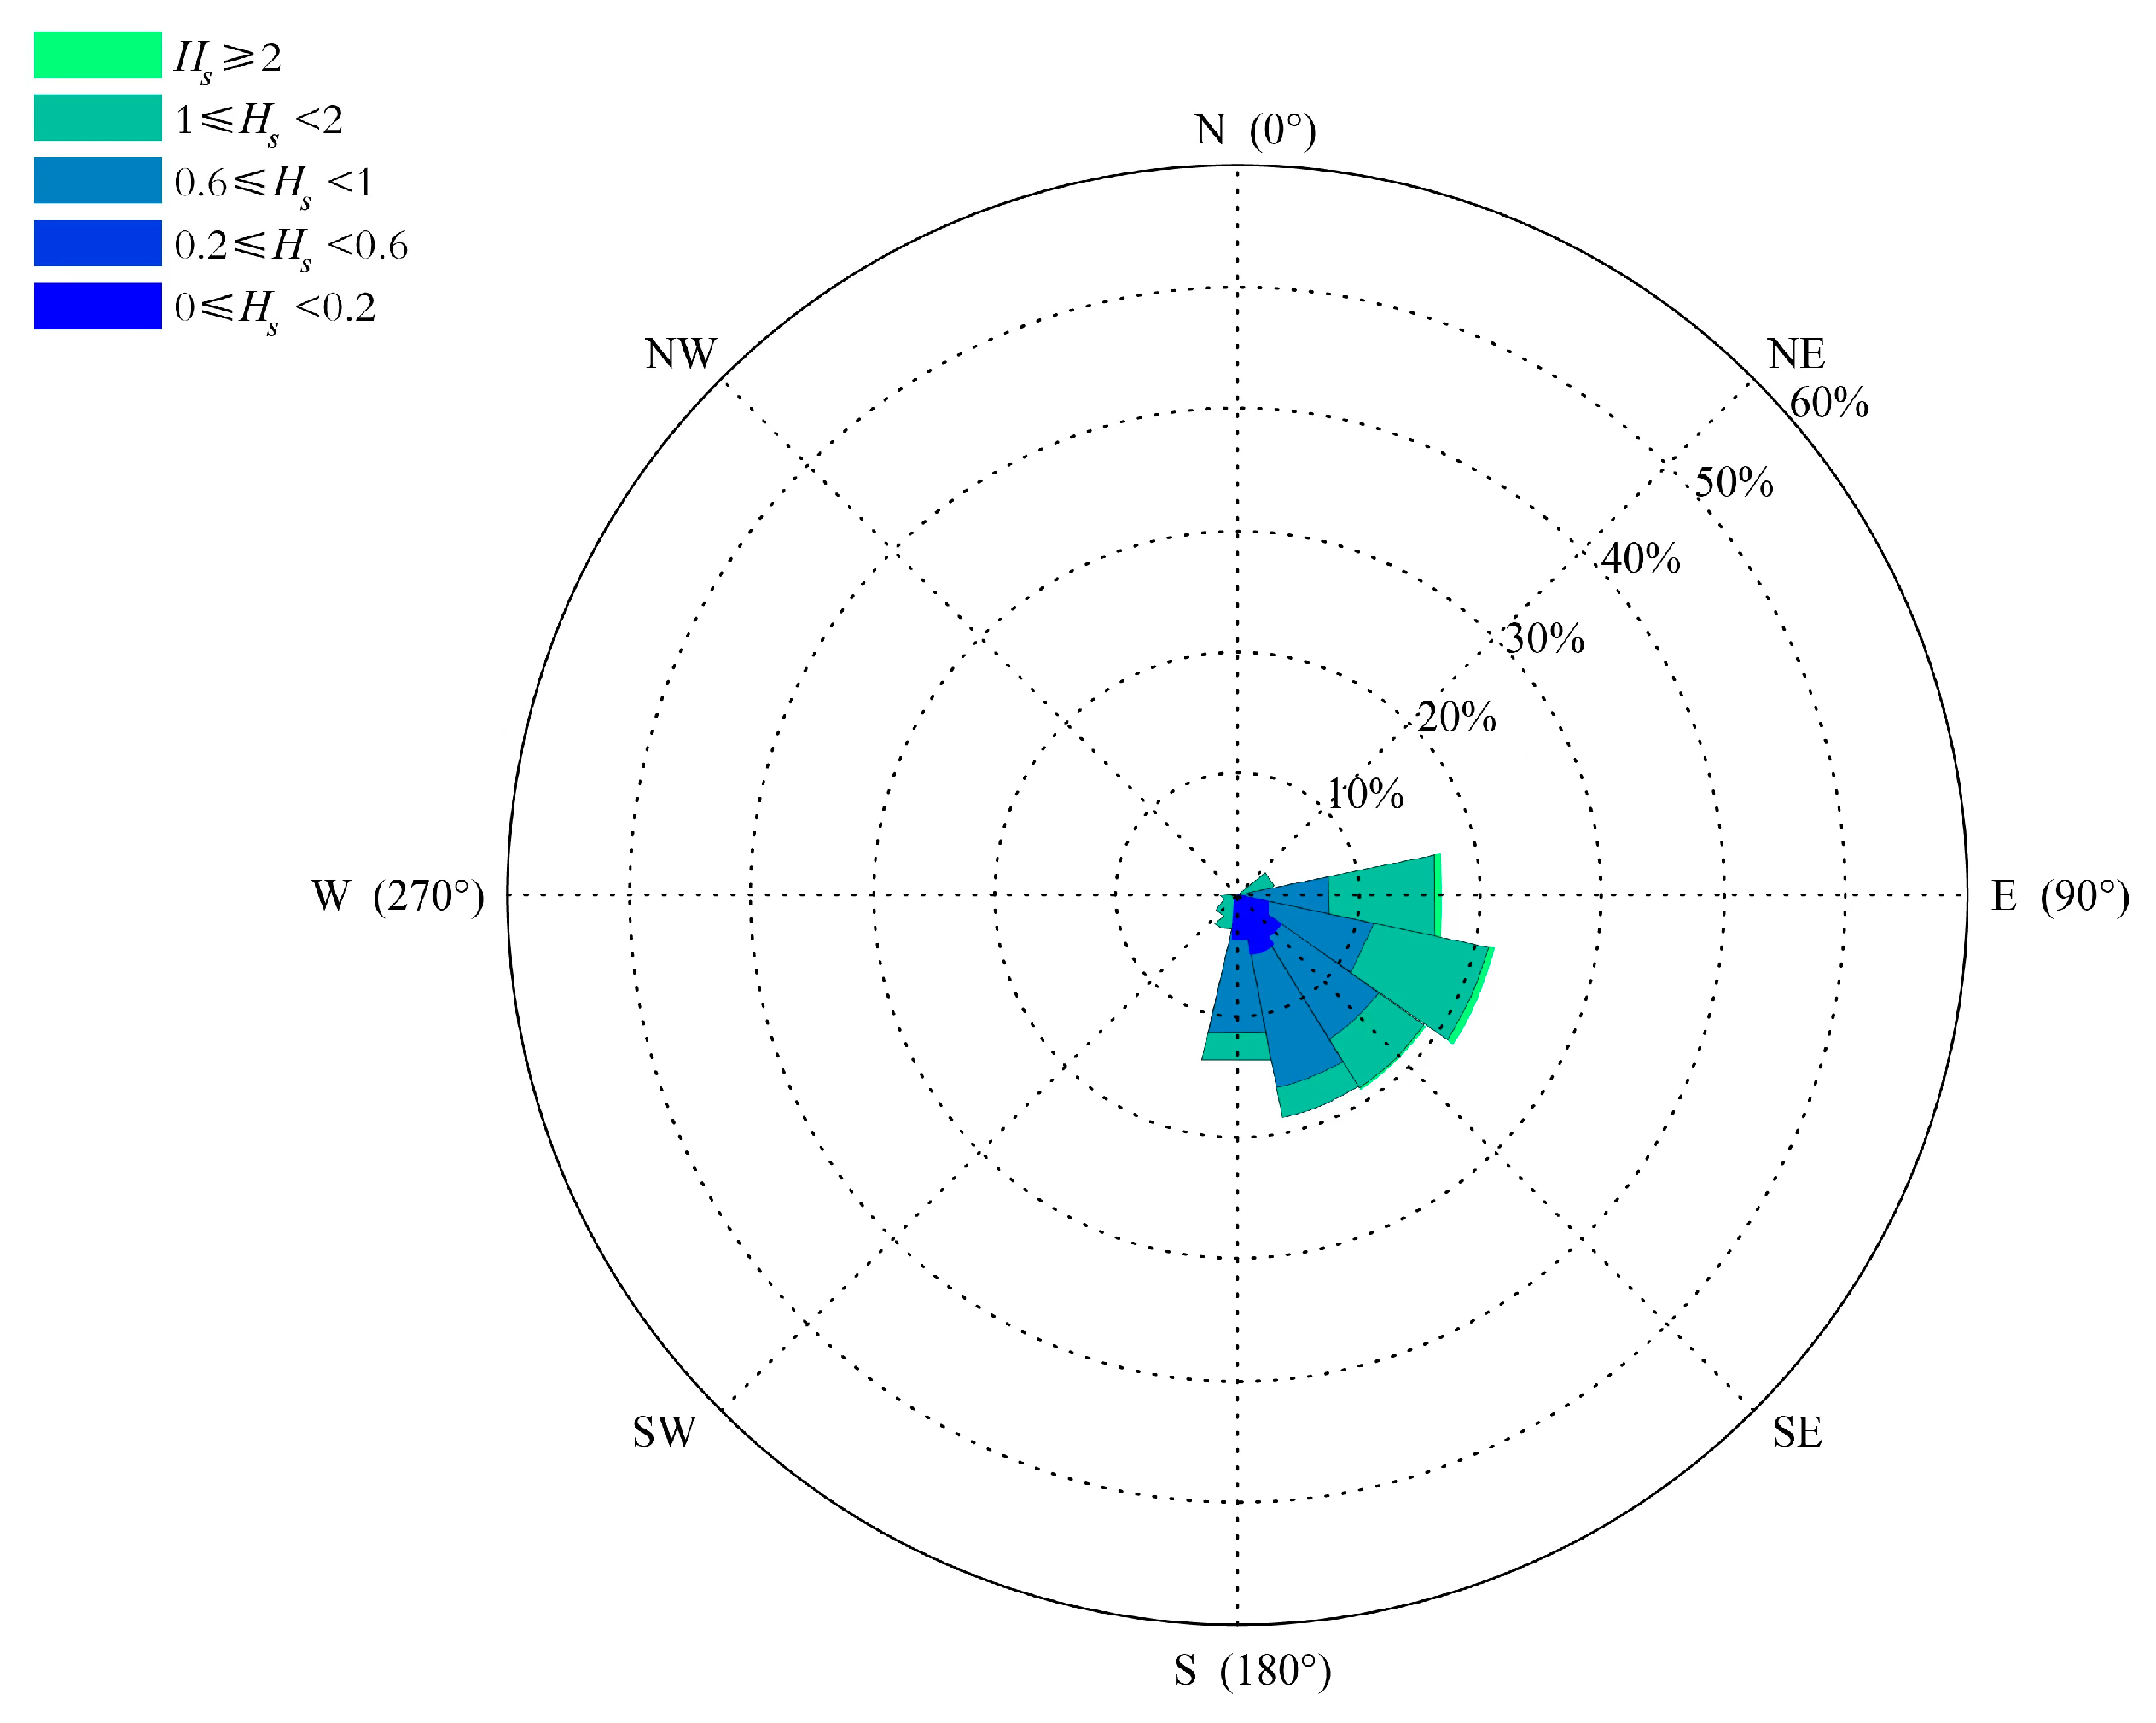
2.1. Overview of the Study Area

Dadonghai, located on the eastern side of Sanya City, stands as the closest coastal beach to the city center, making it a favored recreational destination due to its convenient accessibility. Facing south, Dadonghai exhibits the characteristics of a typical shallow pocket bay open to the south. This configuration renders it susceptible to the impact of southward waves, often resulting in the occurrence of rip currents. In this paper, we intercepted satellite imagery from 7 August 2018 and extracted the water edge line at each image moment based on the difference in reflectivity between land and water in the near-infrared band. High-resolution intertidal topographic data were acquired using an intertidal inversion model. Blue-band images were segmented in grayscale according to specified elevation intervals. Subsequently, corresponding contours were extracted, and bathymetric topographic data were obtained through spatial interpolation. The final correction was made using a nautical chart to obtain the topographic data utilized in the numerical simulation. The result is shown in Figure 1. Wave characteristic data, as summarized in Table 1, revealed notable seasonal variations in the region’s wave features. The mean monthly wave height fluctuates between 0.7 and 1.2 m, peaking in October and December. Likewise, the mean monthly wave period averages 4.25 s, with the highest values recorded in October. The distribution of wave directions is graphically depicted in the rose diagram of Figure 2.

2.2. Numerical Model

The initial version of FUNWAVE was pioneered by Kirby et al. [29], based on the fully nonlinear Boussinesq equation. Over time, the model has been continuously improved [30,31,32,33]. Shi et al. [34] established a version of FUNWAVE-TVD (https://fengyanshi.github.io/build/html/index.html accessed on 1 May 2023) based on FUNWAVE, which has seen significant enhancements in numerical simulation stability, and it has demonstrated improved performance in wave propagation, shallowing, wave climbing and harbor oscillations [35,36,37,38]. Its continuity and momentum control equations are shown below.
η t + M = 0
u α , t + ( u α ) u α + g η + V 1 + V 2 + V 3 + R = 0
where
M = H { u α + u ¯ 2 }
u 2 ( z ) = ( z α z ) A + 1 2 ( Z α 2 Z 2 ) B = 0
u ¯ 2 = 1 H h η u 2 ( z ) d z = [ z α 2 2 1 6 ( h 2 h η + η 2 ) ] B + [ z α + 1 2 ( h η ) ] A = 0
A = ( h u α )
B = u α
z α = ζ h + β η
where = ( x , y ) is the horizontal gradient operator; u α is the velocity at the water quality point at elevation z = z α ; ζ and β are constants; g is the gravitational acceleration; u ¯ 2 is the vertical velocity averaged over the water depth, with dispersion accurate to ο ( μ 2 ) ; h is the static water depth; η is the free wave surface; the subscript t means that the partial derivative with respect to time, H = h + η , is the total water depth; V 1 , V 2 and V 3 denote the dispersion terms; μ denotes the ratio of the water depth to the wavelength; R is the diffusion and dissipation term; A is an auxiliary variable typically used to control the relationship between water depth and velocity, aiding in describing the nonlinear propagation and interaction of waves; B represents the auxiliary variable, denoting the spatial variation in water velocity; and u α , t indicates the rate of change in velocity u α with respect to time t.
FUNWAVE-TVD employs a nonlinear shallow equation group to accurately simulate wave propagation and deformation. These equations ensure an effective simulation of wave propagation and breaking. In the simulation of the current field, the model accounts for water movement, enabling the depiction of changes in the current field caused by waves. Parameters such as seawater viscosity, inertia, bottom friction and pressure gradients are considered when simulating the current field. Furthermore, the FUNWAVE-TVD model encompasses interaction processes between waves and currents, including energy exchange between them, considering the influence of wave breaking on the current field and the impact of the current field on wave morphology. These specifications enable FUNWAVE-TVD to provide an accurate simulation of the intricate interaction between waves and the current field [9,36,37,38,39].
In this case study, the wave-generating boundary is established on the southern side, a wall boundary is established on the northern side, and open boundaries are set along the eastern and western sides.

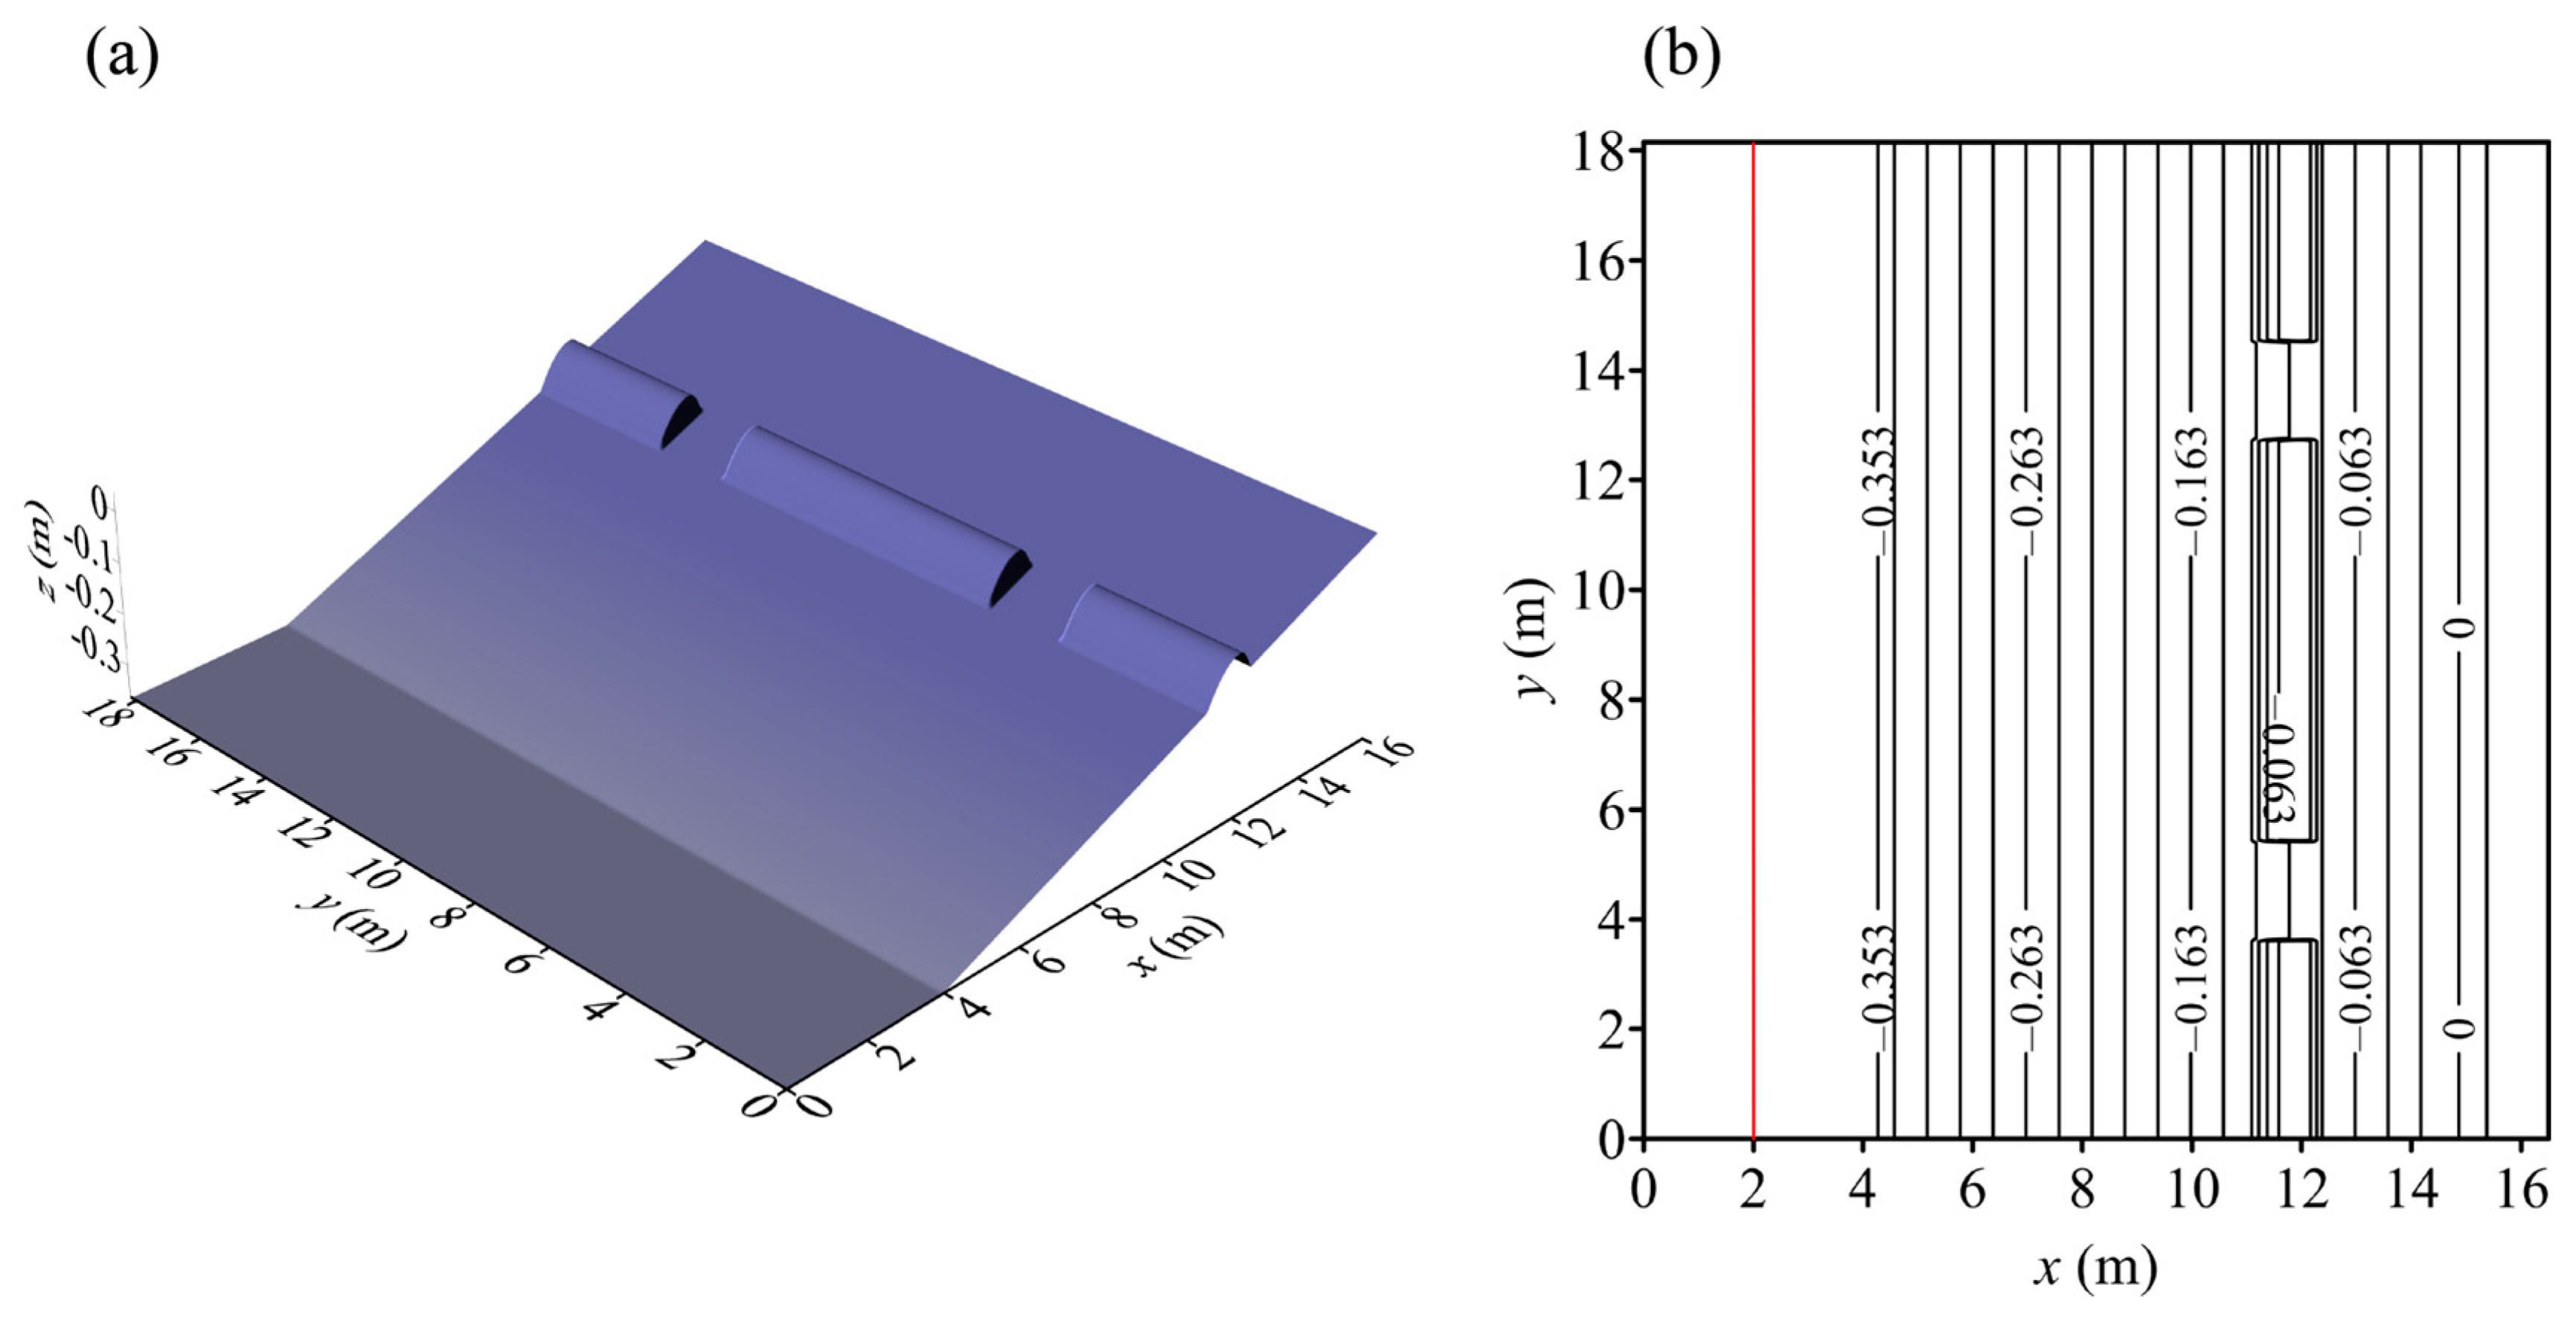
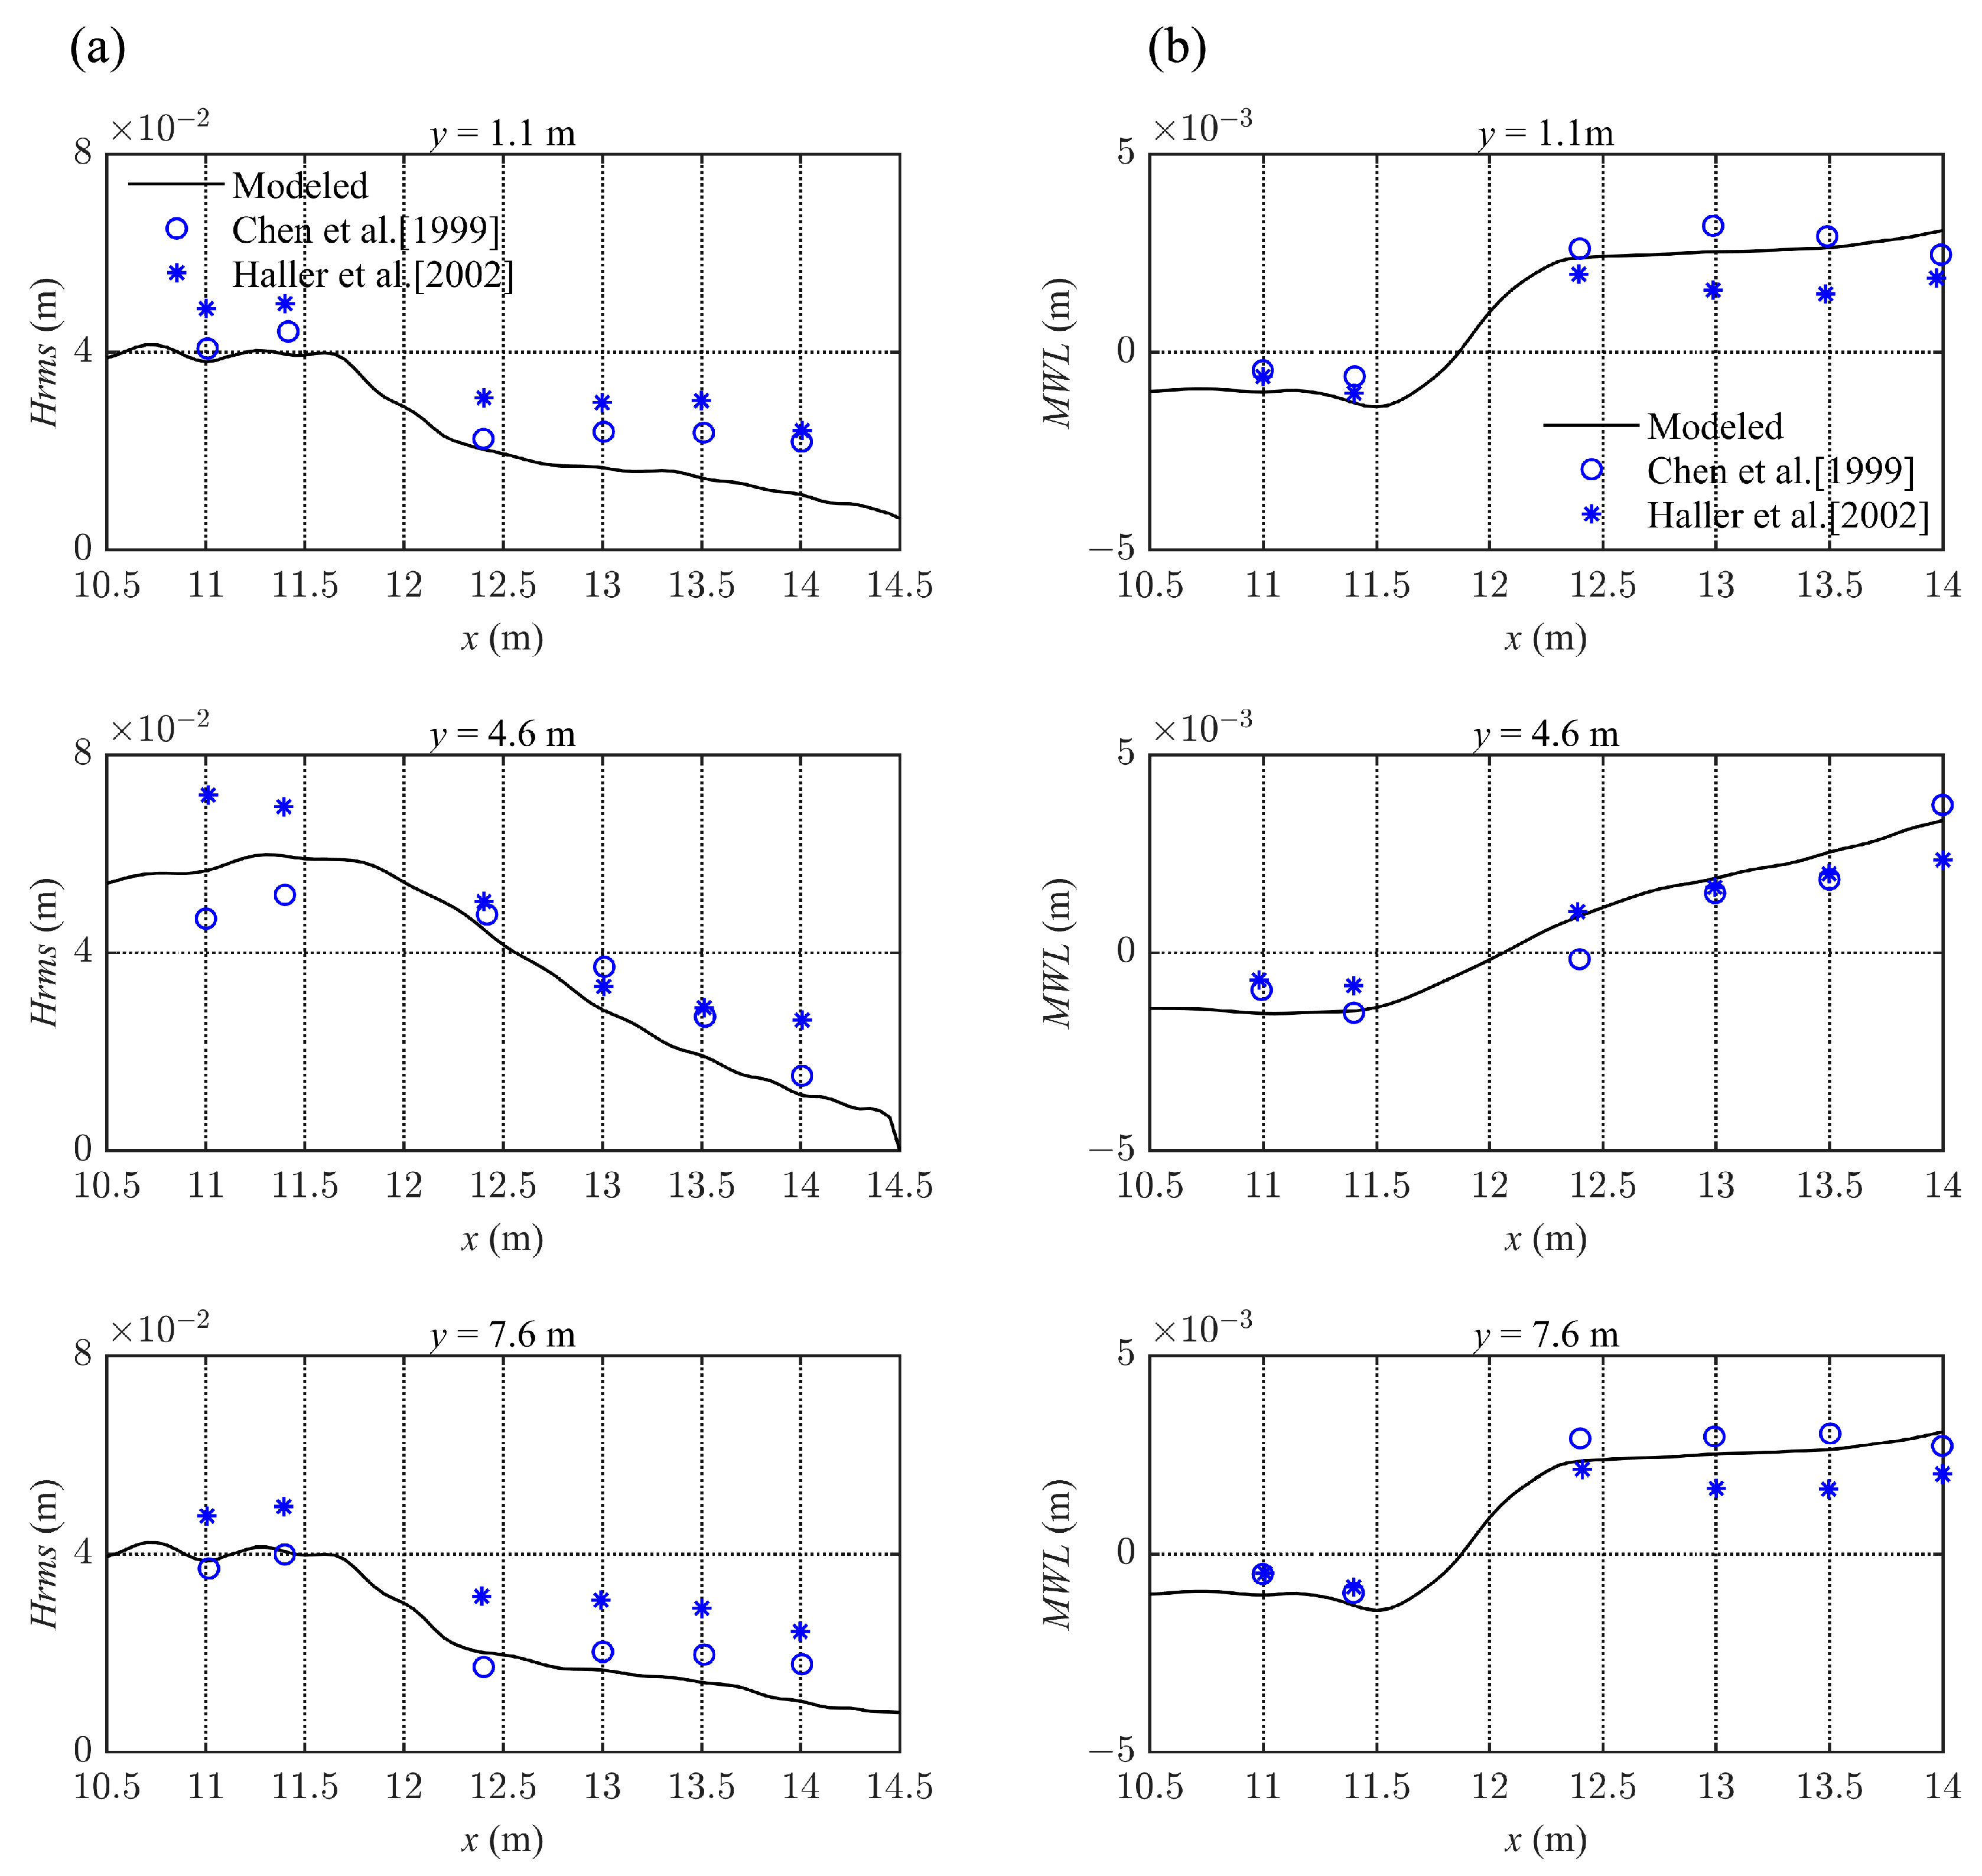
2.3. Test of the FUNWAVE-TVD Model in Simulating Rip Currents

In this study, data from the Haller physics experiment were selected to test the numerical simulation of rip currents. Haller et al. [8] measured wave breaking and rip currents on sandbar channels in a laboratory experiment. Chen et al. [9] simplified the Haller [8] physical experimental model by standardizing the slope scale to 1:30 and ignoring the alongshore water depth. Consistent with Chen et al. [9], the specific topographical parameters in this study are illustrated in Figure 3. In this model, the offshore slope is located at x = 4 m with a water depth of 0.363 m. The sandbar is situated between x = 11.1 and 12.3 m, with a central sandbar length of 7.3 m and side sandbar lengths of 3.65 m. The channel width is 1.8 m, and the crest depth is 0.048 m. The wavemaker is placed at x = 2 m, and a normally incident regular wave with T = 1 s and H = 0.048 m was induced. The wave height and mean water level were observed at y = 1.1 m, 4.6 m and 7.6 m, as shown in Figure 4, and the velocity was observed at x = 10.0 m, 11.25 m, 12.3 m and 13.0 m, as shown in Figure 5.

3. Result of Rip Current Characteristics in Dadonghai Region under Different Wave Conditions

In this study, the computational domain spans 644 m by 1640 m. To counteract wave energy dissipation caused by varying grid sizes, we employed a uniform grid size of dx = dy = 1 m. We selected a bottom friction coefficient of 0.0025. Before initiating numerical simulations, the topography underwent a clockwise rotation of 90°. In order to circumvent the destabilizing effects before the start of the numerical simulation calculations, simulations ran for a duration of 3000 s, with data extracted from the 2400–3000 s interval for subsequent statistical analysis. This study used the JONSWAP wave spectrum, improved by Goda et al. [40], as the incident wave spectrum. To simulate the generation of rip currents in this region under the action of different significant wave heights, peak periods and wave directions, and to analyze the formation conditions and characteristics of rip currents, specific equations of the wave spectrum were used, as shown below:
S ( f ) = β J H 1 / 3 2 T P 4 f 5 exp [ 1.25 ( T p f ) 4 γ exp [ ( T p f 1 ) 2 / 2 σ 2 ]
where
β J = 0.06238 × [ 1.094 0.01915 ln γ ] 0.23 + 0.0336 γ 0.185 ( 1.9 + γ ) 1
σ = { 0.07 ; f f p 0.09 ; f f p
f is the frequency of the wave, T p is the peak period, f p is the peak frequency with the peak height factor, γ = 3.3, H 1 / 3 is the significant wave height, and σ is the spectral shape parameter.
Cd represents the bottom friction coefficient. The larger the value of Cd, the greater the bottom friction, resulting in a more pronounced hindrance to fluid flow. Choi et al. [31,41] calculated and compared the coastal circulation on-site, with values falling between 0.001 and 0.003. In this study, a value of 0.0025 was selected within this range. The specific working condition parameter settings are shown in Table 2.

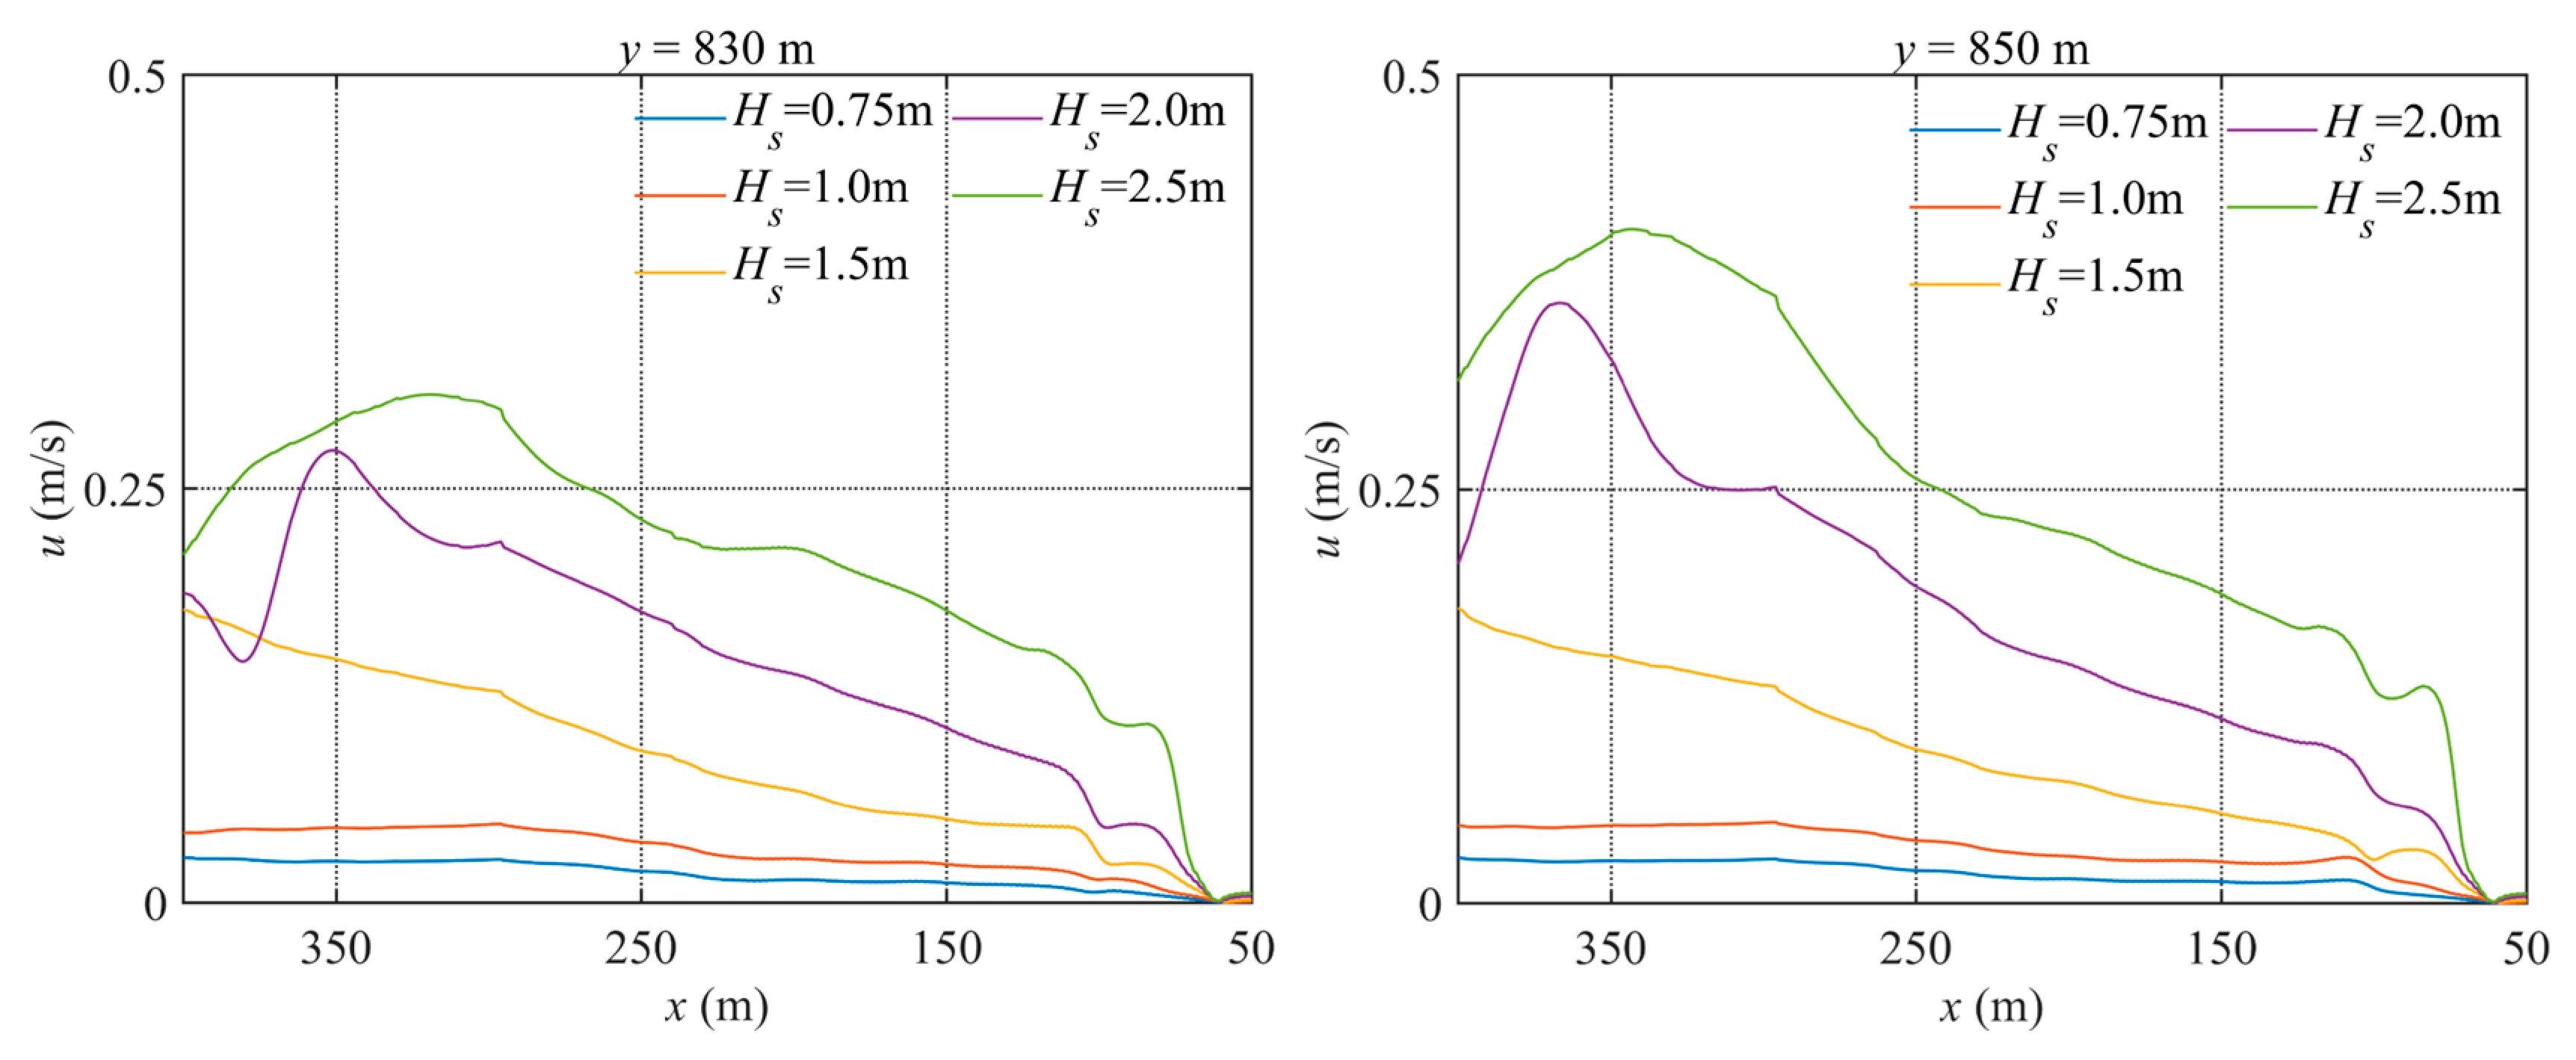
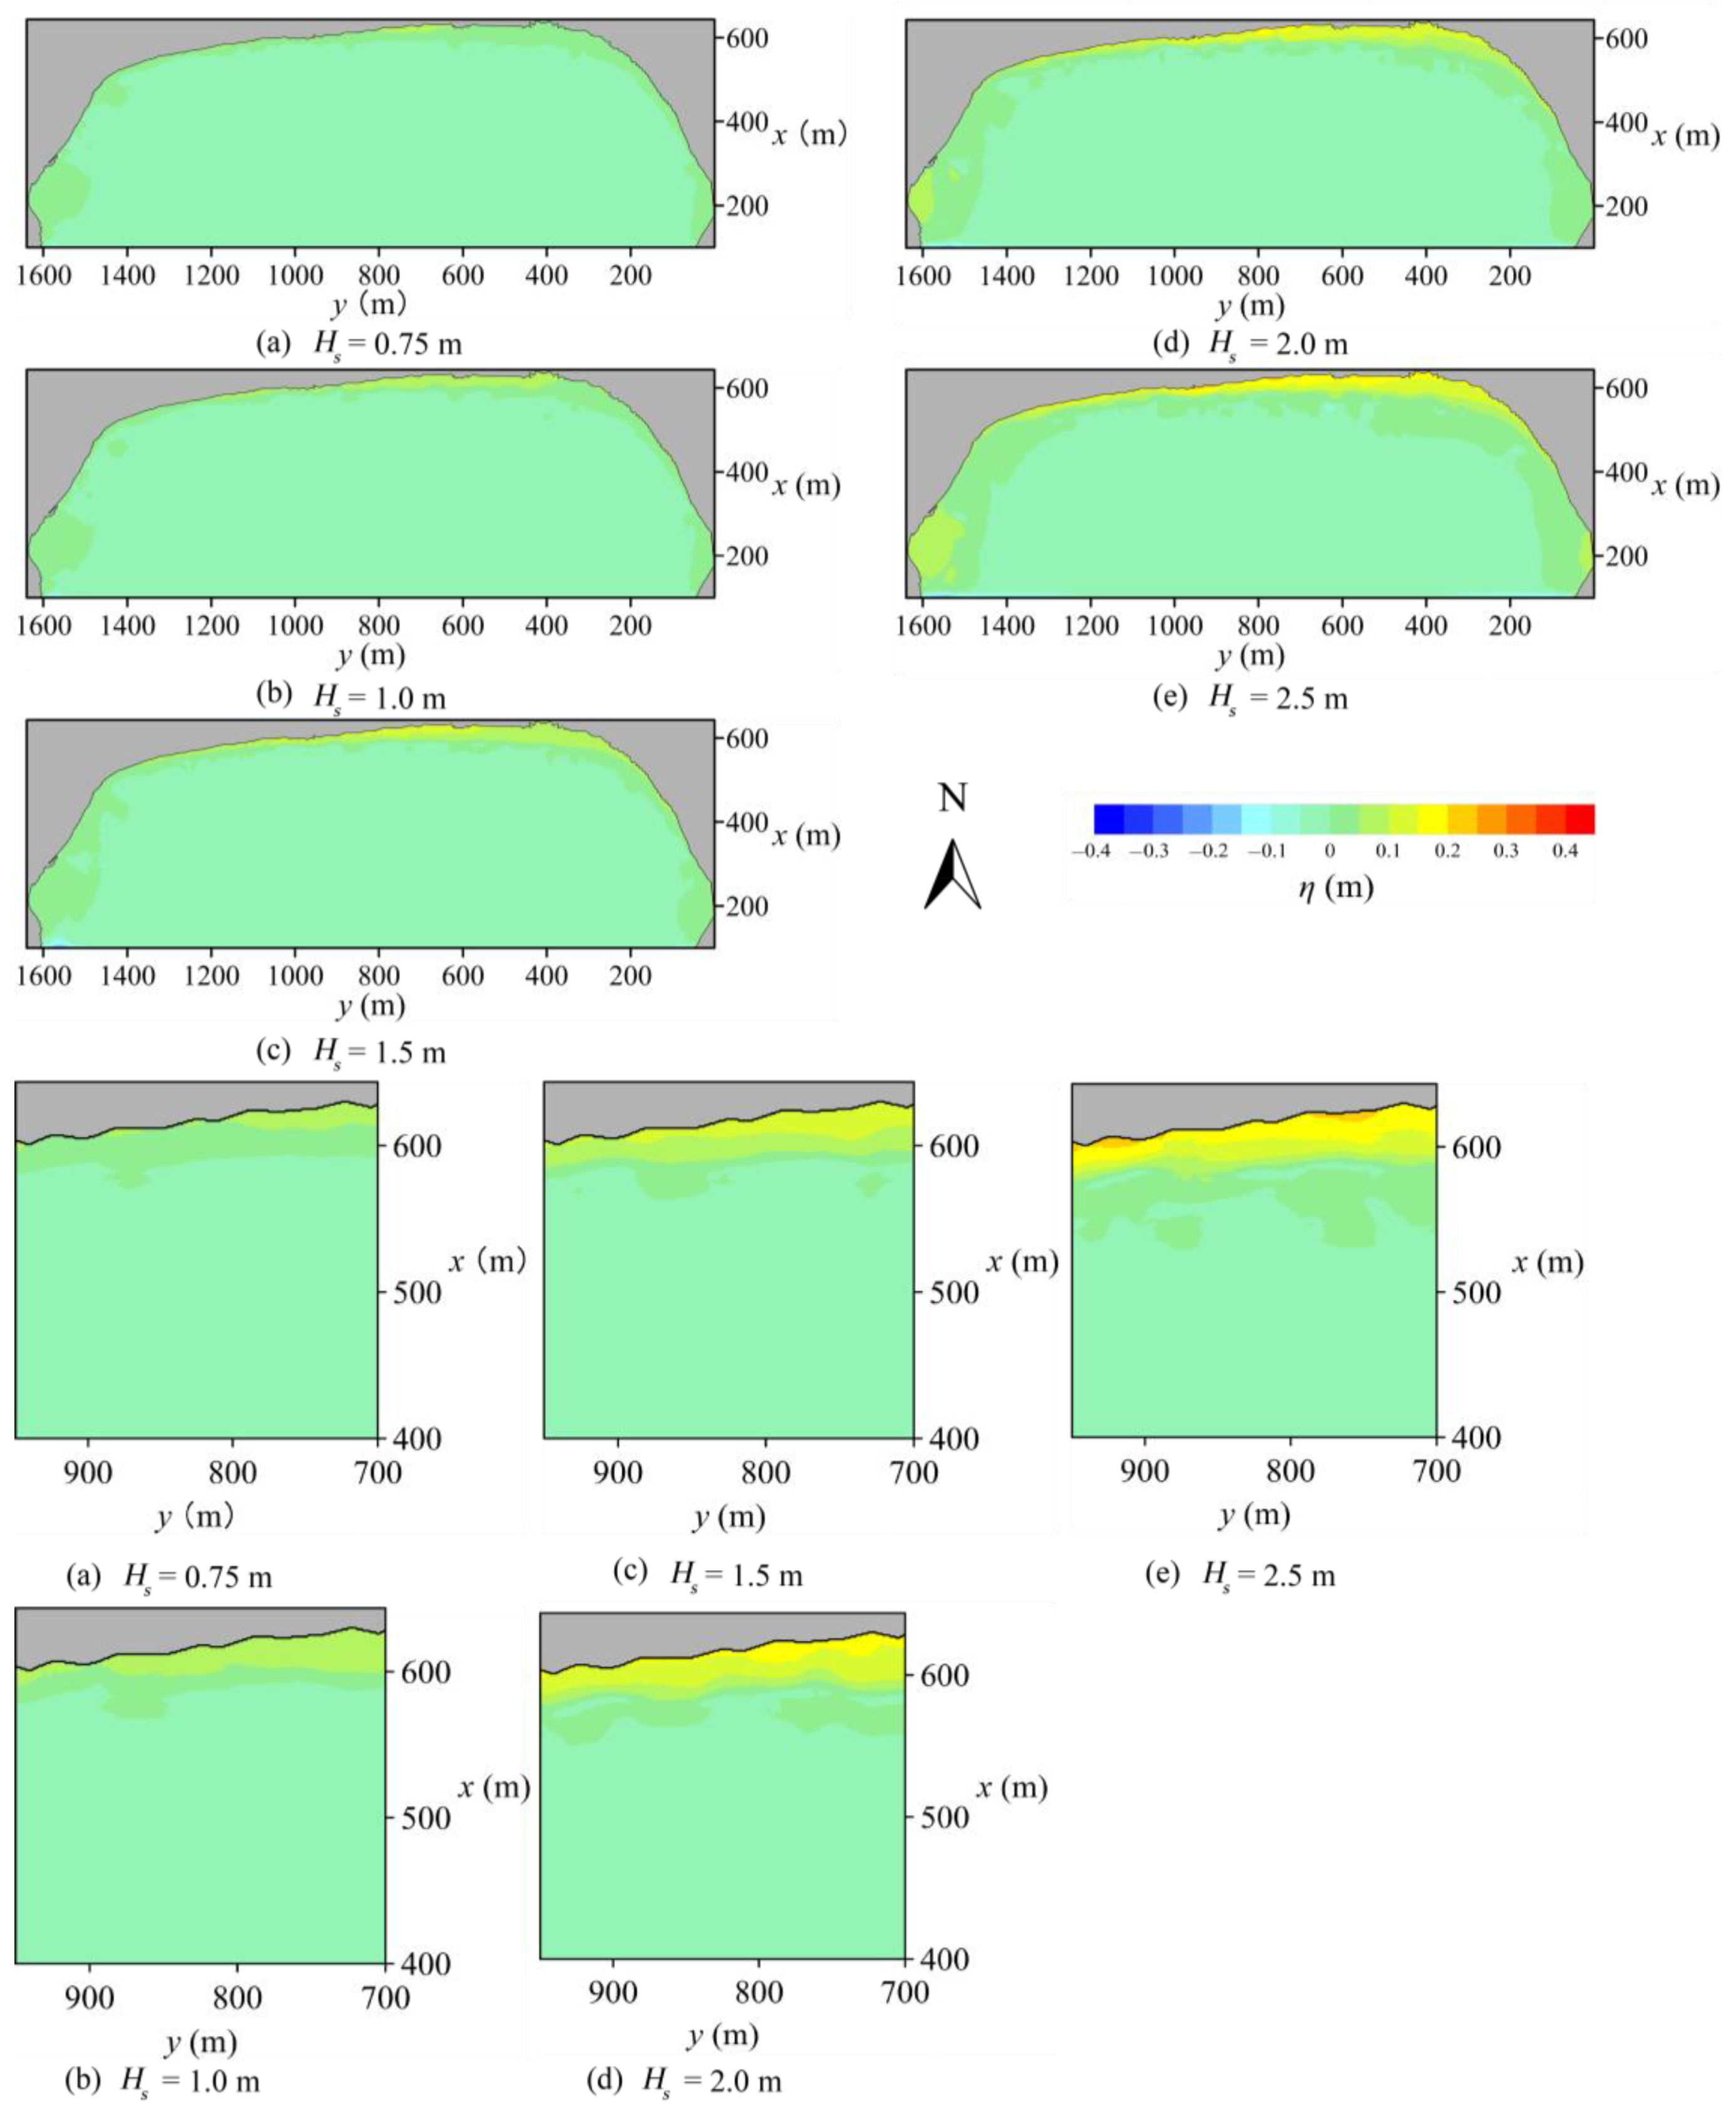
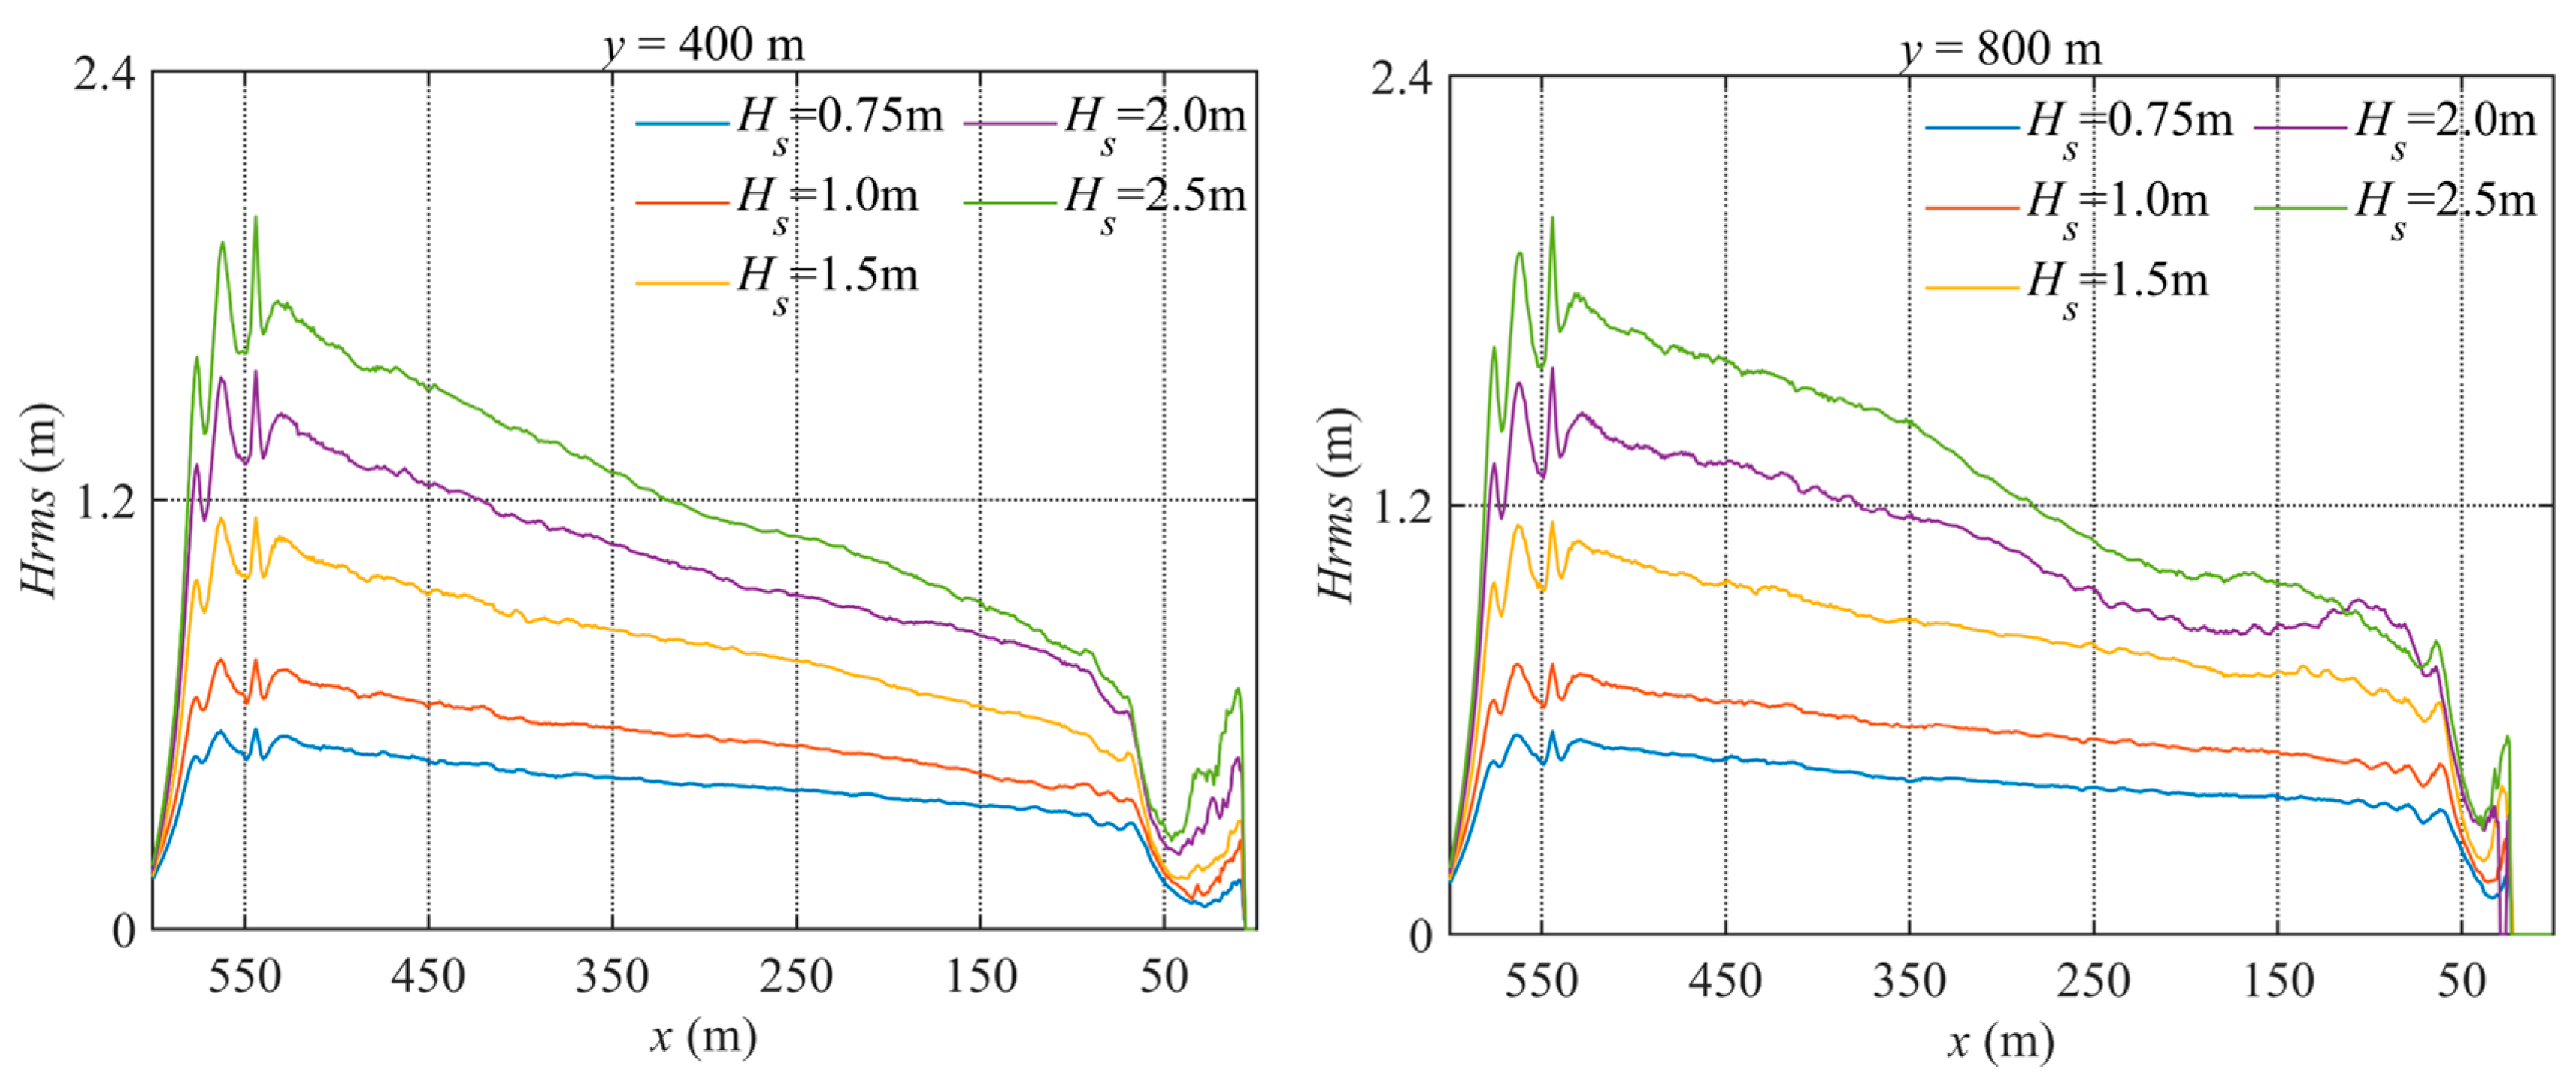
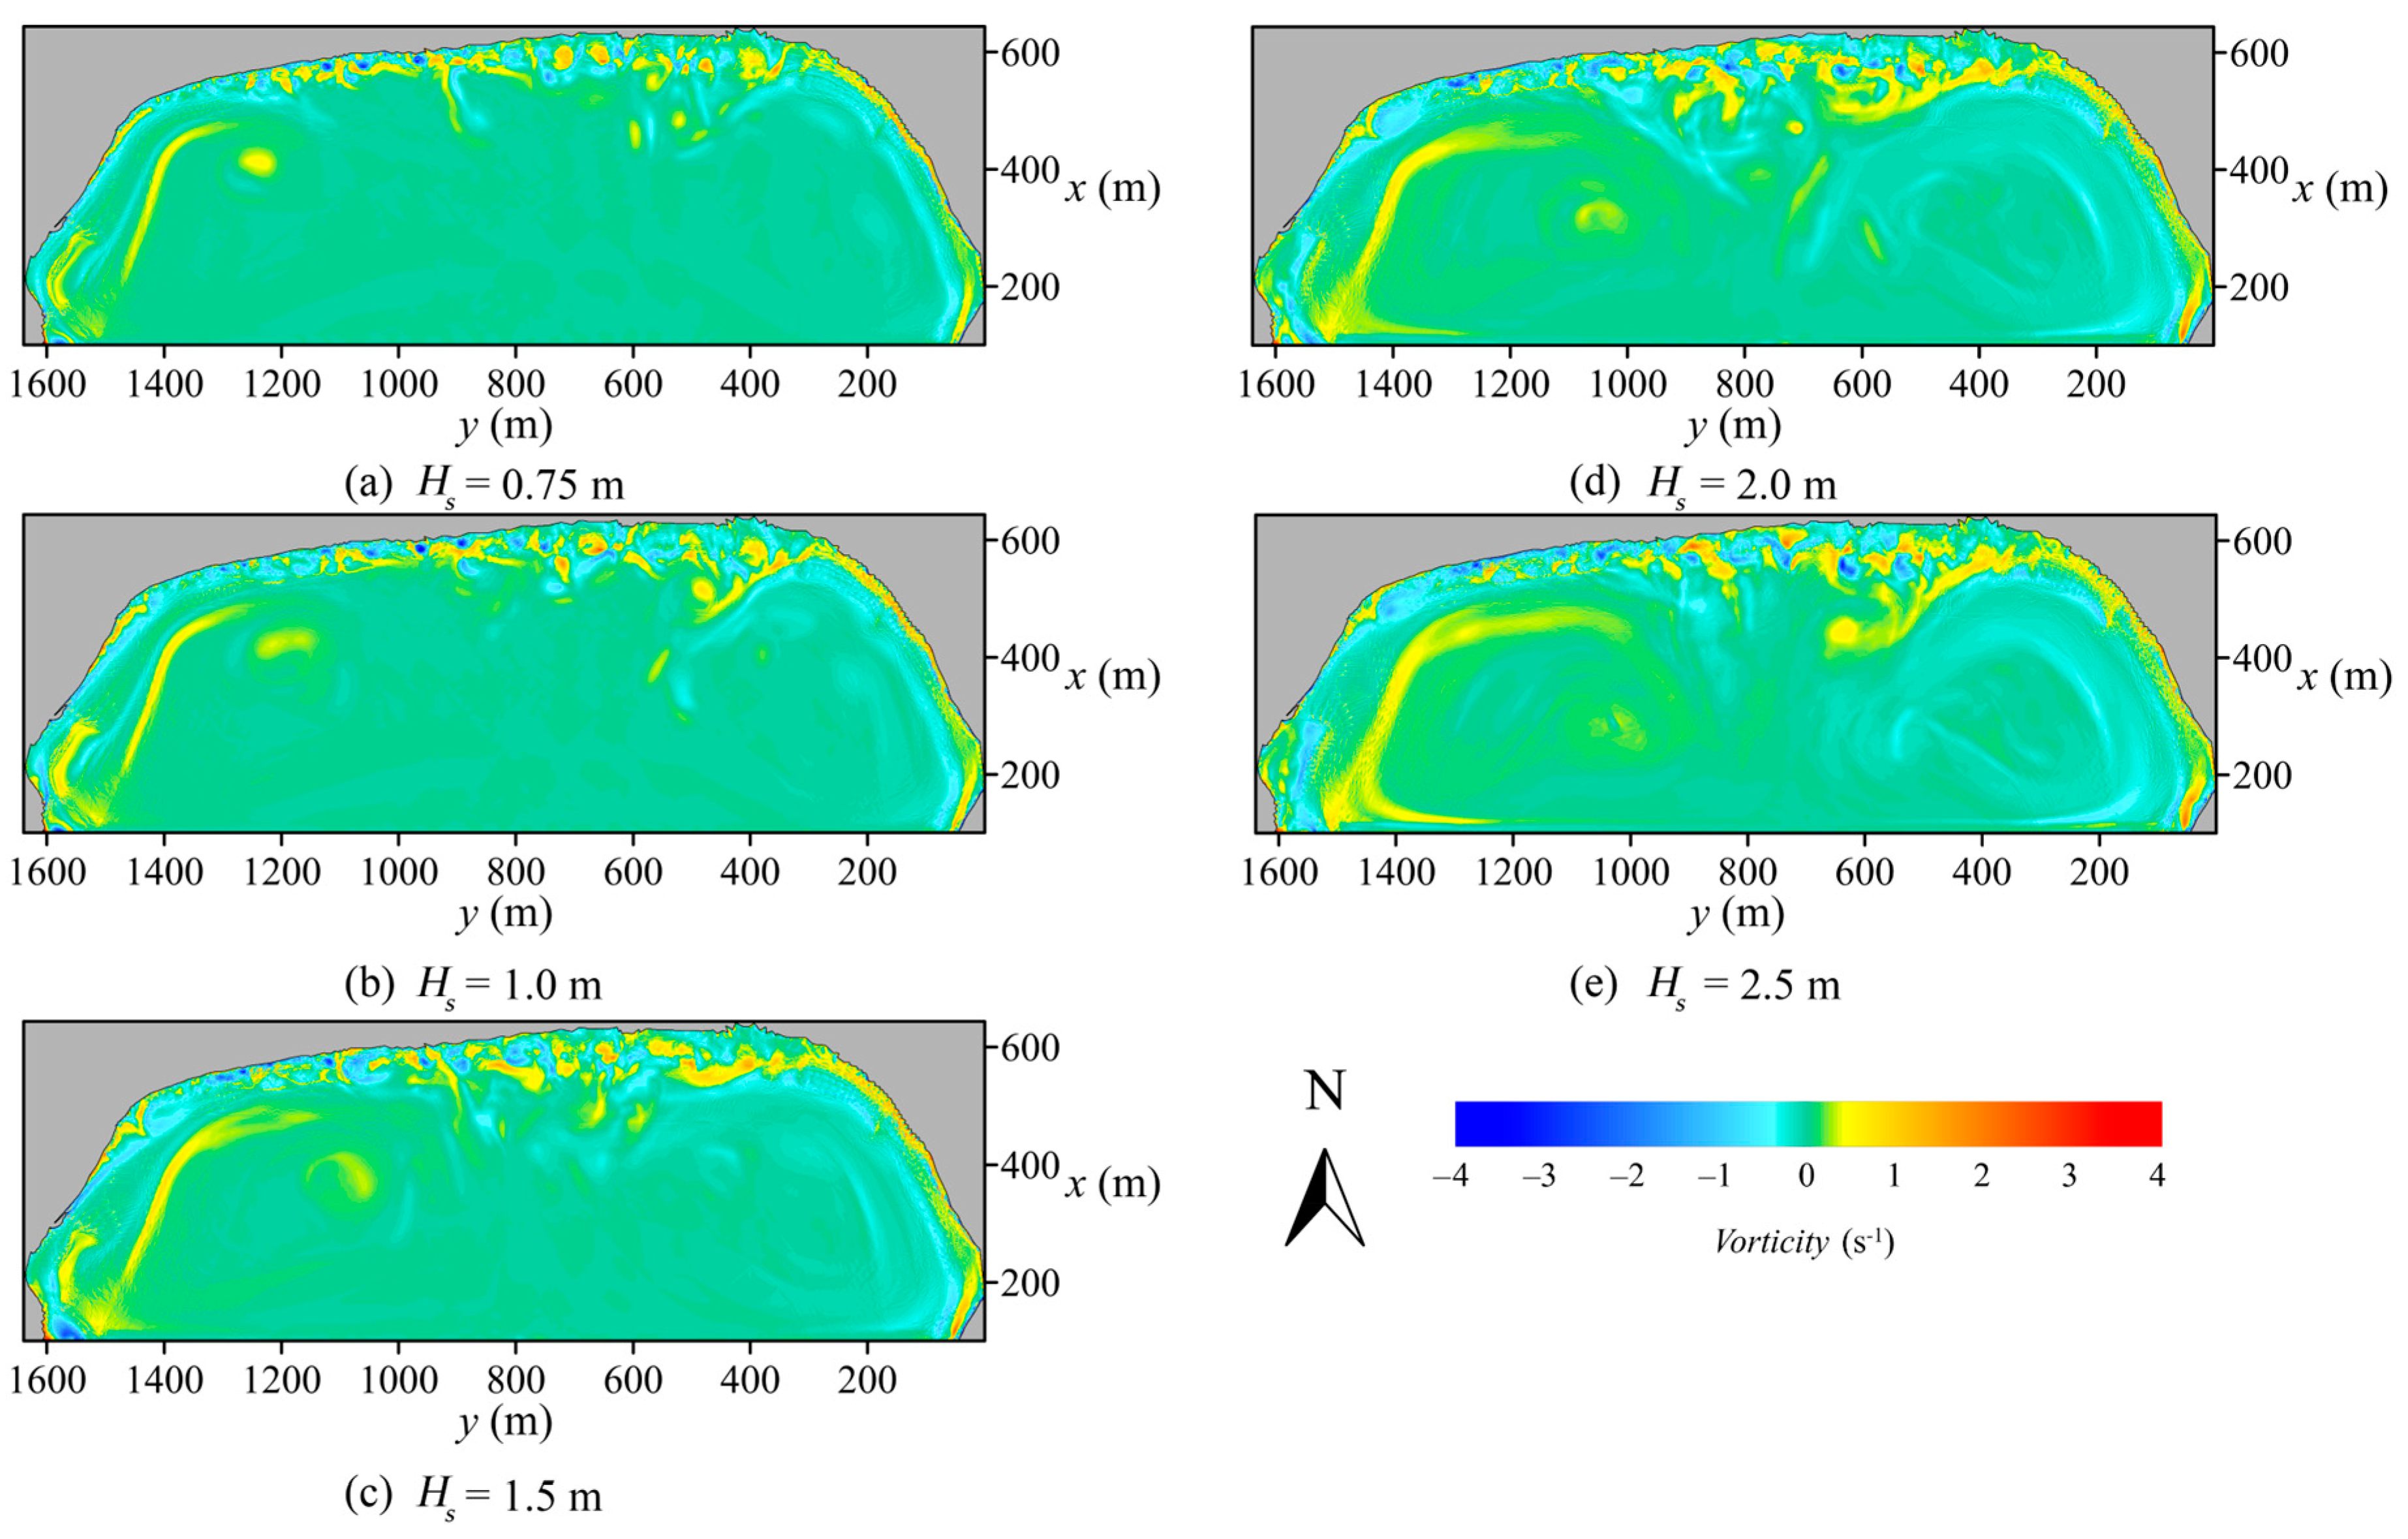
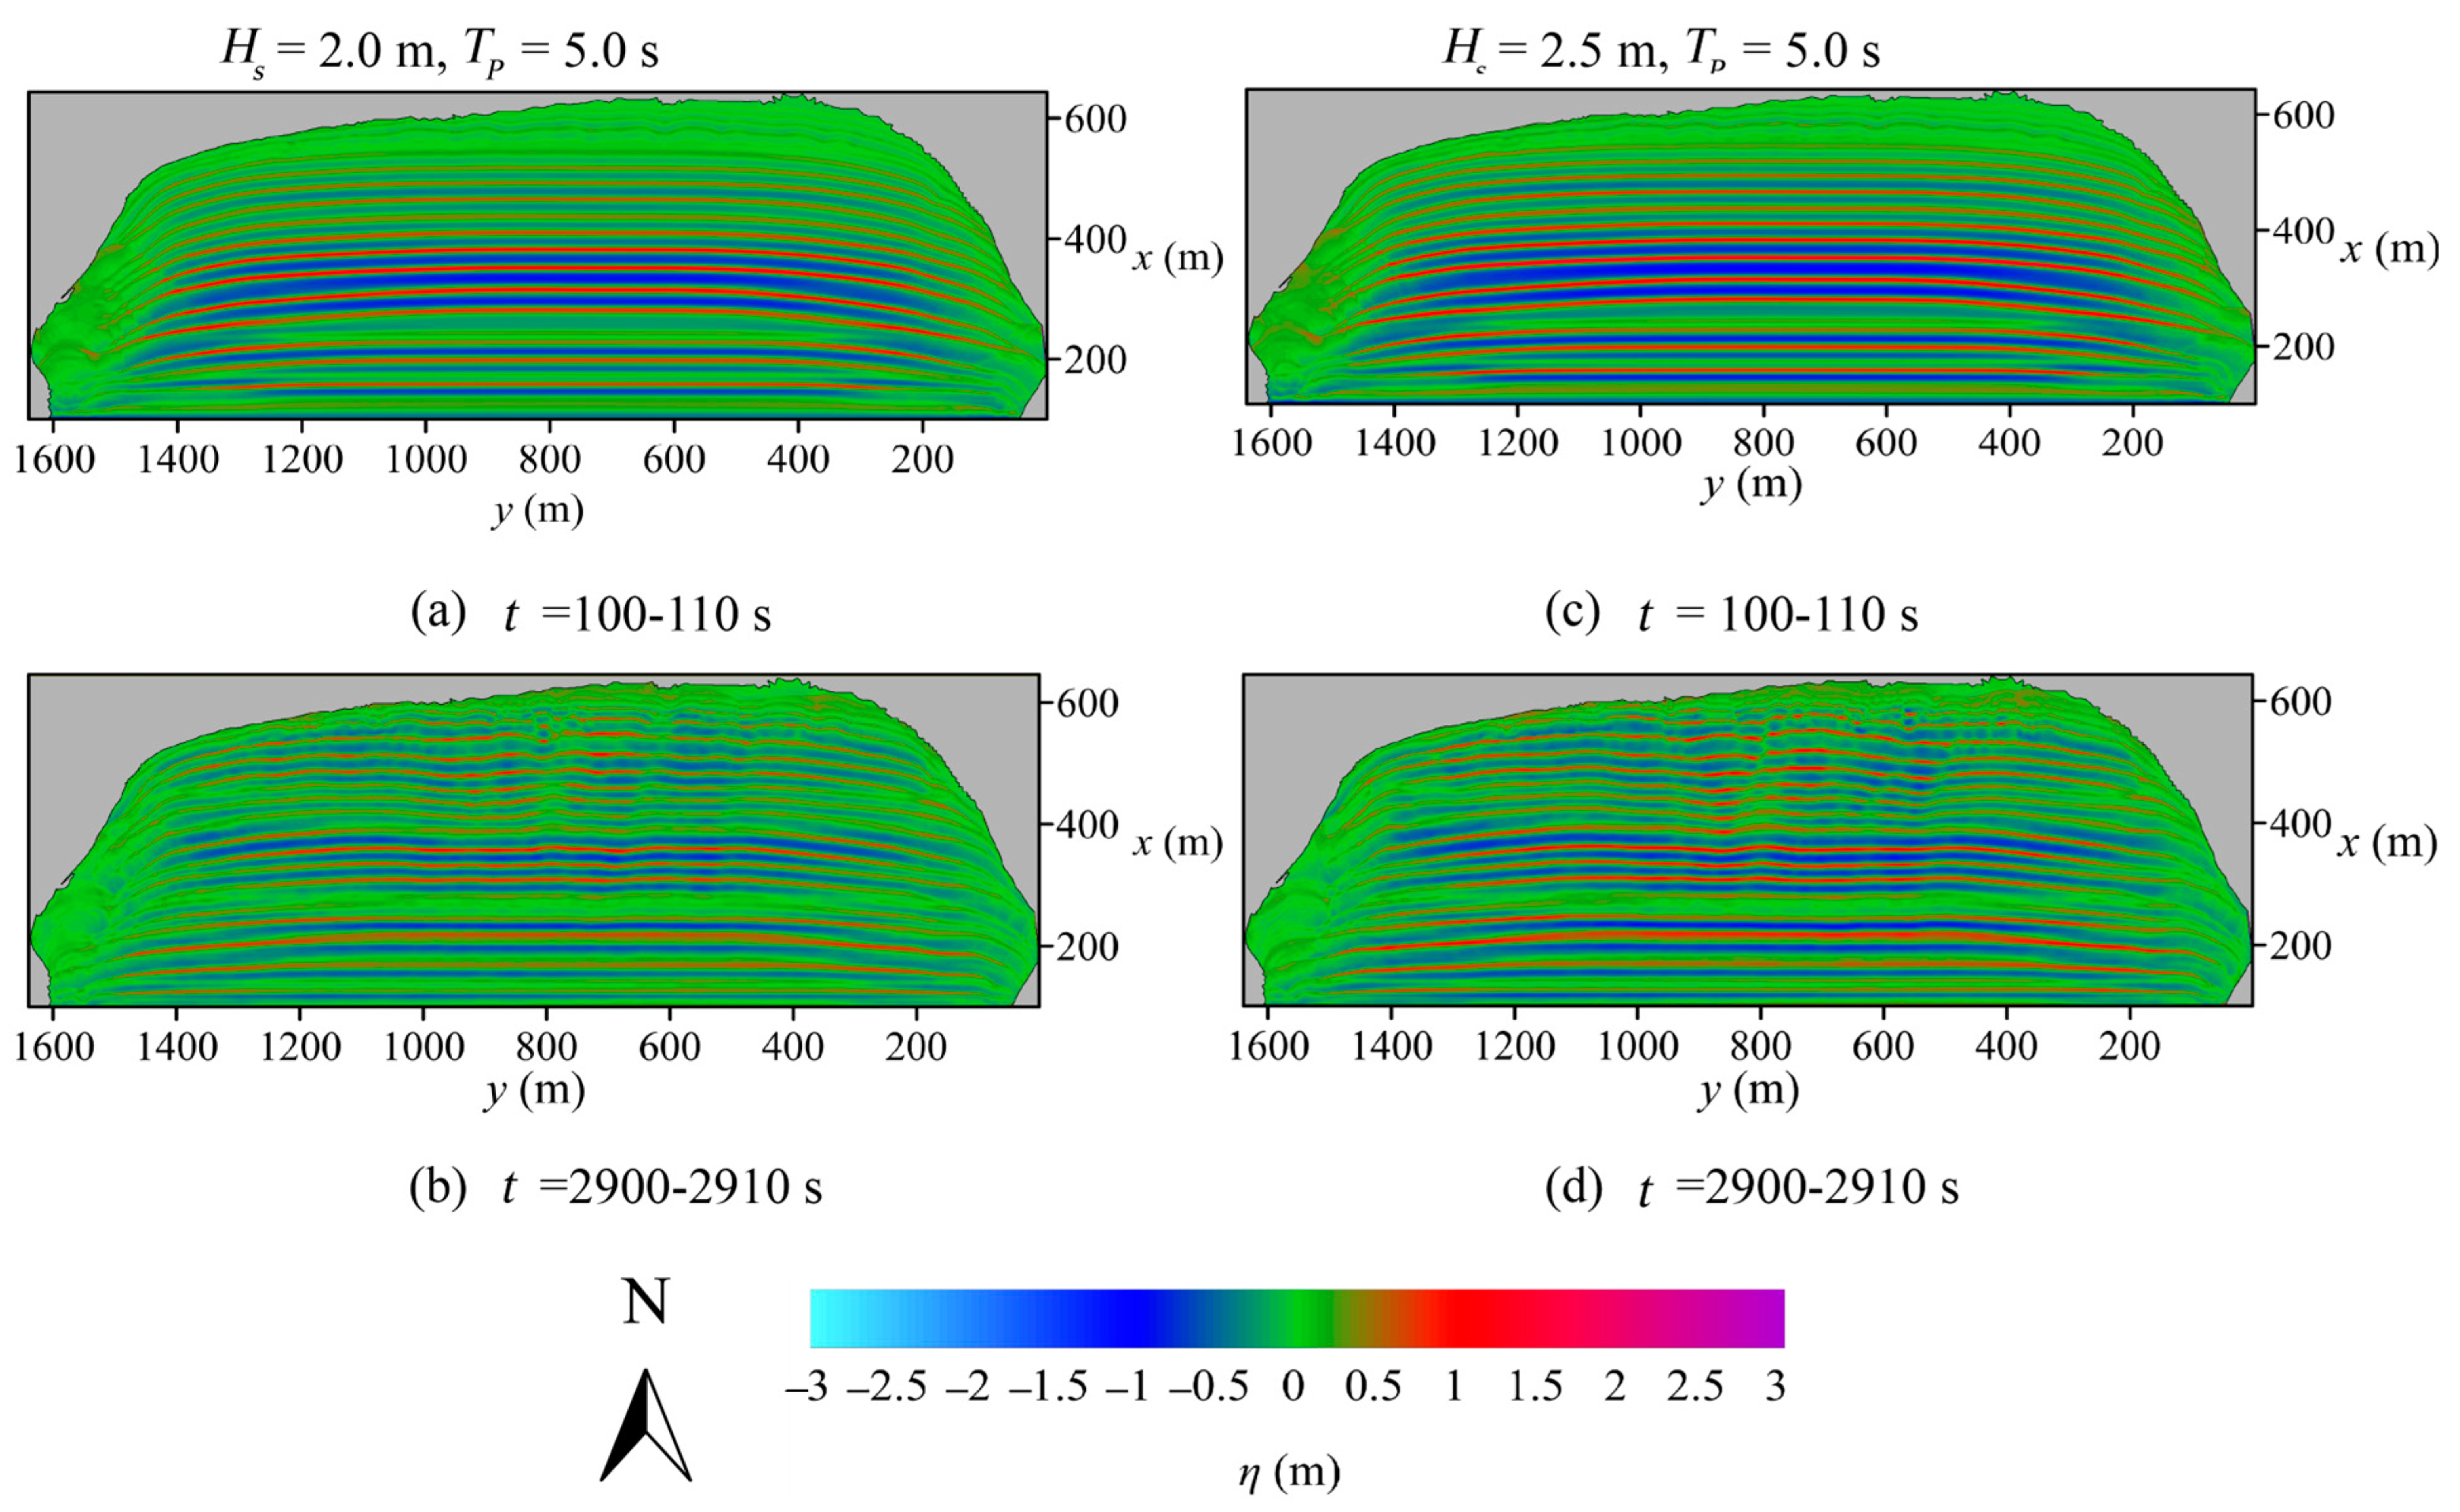
3.1. Effect of Significant Wave Height and Peak Period on Rip Current Characteristics

Dadonghai Beach is highly susceptible to southward waves. In this section, we investigate the influence of wave height and period on the characteristics of rip currents in this region using incident waves with peak periods of 5 s and 10 s, coupled with significant wave heights of 0.75 m, 1 m, 1.5 m, 2 m and 2.5 m. Figure 6 presents the spatial distribution of average velocity for rip currents when the peak period is 5 s. For a wave height of 0.75 m (Figure 6a), noticeable longshore currents emerge on both sides of the bay and extend seaward within the arc-shaped shoreline area. However, these currents maintain relatively low velocities, hovering at approximately 0.3 m/s. This phenomenon is caused by the early breaking of southbound waves due to natural topographic features on both sides of the bay. The continuous impact of southward waves causes the accumulated excess water near the bay to move parallel to the coastline, creating deflection rips that extend seaward within the arc-shaped beach area. Rip currents manifest themselves in the y = 800–1000 m range, exhibiting relatively small velocities and spatial scales. Additionally, there are additional rip currents occurring between y = 400 and 600 m in the cross-shore direction, again with comparatively smaller spatial scales. This behavior possibly originates from the uneven distribution of channels of varying sizes within the arc-shaped beach region. An intriguing phenomenon was observed in the arc-shaped beach area, where the morphology of rip currents deviates from traditional perceptions. Specifically, with a significant wave height of 0.75 m, the rip currents’ trajectory at the y = 900 m position is nearly perpendicular to the coastline. However, as the wave height increases, the trajectory of the rip currents in this area undergo notable changes, no longer aligning perpendicular to the coast. This is due to near-shore wave shoaling and breaking being modified by cross-shore or nearshore morphology controls [41]. These factors induce variations in wave breaking intensity, thereby significantly altering the rip currents’ morphology over time and space. This observation aligns with findings from other rip current studies [12,13,26]. Moreover, the velocity of rip currents in the arc-shaped beach area increases with wave height; at a wave height of 0.75 m, it approximates to 0.5 m/s, rising to 0.8 m/s at a significant wave height of 2.5 m. Generally, rip current velocities in this region exceed 0.5 m/s, corroborating findings from Dudkowska et al.’s research [42].
As the significant wave height increases, wave breaking becomes more pronounced on both sides of the bay. When the significant wave height reaches 1.0 m, increased wave breaking on both sides of the bay leads to the formation of longshore currents with velocities ranging from approximately 0.5 to 0.9 m/s, with slightly higher velocities observed on the western side. The continual impact of southward waves drives these longshore currents, generated by wave breaking, to move along the coastline toward the arc-shaped beach area and then extend seaward, forming deflection rips. The prominence of this phenomenon escalates as wave height increases. At a significant wave height of 2.5 m, the velocities of the longshore currents on both sides of the bay range between 0.8 and 1.4 m/s. Observations indicate that the velocities of longshore currents on both sides of the bay consistently surpass those in the arc-shaped area under various conditions. This is linked to the heightened velocity of longshore currents caused by wave breaking at the abrupt coastal transition. Moreover, as wave height progressively increases, both the intensity of the deflection rips’ extension seaward and their spatial extent expand. The increase in significant wave height leads to a gradual shift in the extension location of the deflection rips closer to the center of the arc-shaped beach, accompanied by an increase in extension distance. This shift is attributed to the transformation of the longshore currents on the arc-shaped beach into feeder currents for the deflection rips. Within the arc-shaped beach area, the increased wave height contributes to an increase in the intensity of the rip currents. As depicted in Figure 6, between y = 800 and 1000 m in the cross-shore direction, a distinct rip current emerges with a peak period of 5 s and a significant wave height of 0.75 m (Figure 6a), albeit at a modest velocity. When the significant wave height is increased to 1 m (Figure 6b), the extension distance of the rip currents in this region decreases compared to the 0.75 m (Figure 6a) wave height. However, the velocity of the rip currents significantly increases. This phenomenon can be attributed to the conversion of longshore currents into the feeder current for deflection rips. At wave heights of 2.0 m (Figure 6d) and 2.5 m (Figure 6e), both the velocity and extension distances of the rip currents increase compared to the 0.75 m (Figure 6a) wave height. In the zone between y = 400 and 600 m in the cross-shore direction along the arc-shaped coastline, rip currents tend to exhibit the characteristics of feeder currents, with only sporadic regions showing signs of extension. Overall, the increase in significant wave height has a positive effect on the formation of rip currents.
When the peak period is 10 s, the results of the spatial distribution of averaged velocities for different conditions are as shown in Figure 7, and the effect of the significant wave height on rip currents is similar to that described above. The only difference lies in the gradual transformation of an increasing segment of longshore currents within the arc-shaped beach region into feeder currents as the significant wave height escalates. Concurrently, the location of deflection rips on either side of the bay becomes more concentrated in the central area of the arc-shaped beach. Within the arc-shaped beach region, longshore currents tend to function as feeder currents for the deflection rips on both sides of the bay. Nevertheless, the presence of rip currents remains evident in this area.
According to the rip current distribution depicted in Figure 6, the area between x = 400–644 m and y = 700–950 m was selected, and the results are shown in Figure 8. As the significant wave height increases, the accumulation of water in the vicinity of the arc-shaped beach increases. Consequently, the potential for rip currents to occur in this particular area increases. At a wave height of 1.5 m (Figure 8c), a robust rip current materializes cross-shore at y = 800 m along the arc-shaped beach. This rip current persists at higher wave heights, with its strength escalating in direct proportion to the increase in the significant wave height.
Figure 8 illustrates the extension trajectory of the rip currents near y = 830 m. To examine the velocity alterations during the extension of rip currents, sectional velocity data from y = 830 m and 850 m, as depicted in Figure 8, were analyzed, with the results shown in Figure 9. On the y = 830 m section, an increase in wave height correlates with an increase in the extension velocity of rip currents. Rip currents fail to form when the wave height is 0.75 and 1.0 m, owing to insufficient wave breaking. In the cross-shore direction, maximum velocities of 0.025 m/s and 0.045 m/s are observed, indicating a stable state. As the wave height increases, wave breaking becomes more intense, leading to notable changes in velocity. The figure demonstrates that velocity increases with cross-shore distance. At a wave height of 2.5 m, the velocity peaks at 0.3 m/s between x = 300 and 400 m and then gradually diminishes due to the influence of deflection rips extending from the west side of the bay. A similar rationale explains the abrupt velocity increase at a wave height of 2.0 m. Although deflection rips form on the west side of the bay at a wave height of 1 m, their extension is limited and does not impact the velocity in that region. Velocity variations in the y = 850 m section display a pattern akin to that of the y = 830 m section.
During the wave propagation process toward the shoreline, wave breaking typically occurs near the sandbar, culminating in a marked reduction in wave height. This phenomenon leads to alterations in the cross-shore directed radiation stress, consequently generating driving forces that influence the surrounding current field. These forces induce fluctuations in the mean water level, instigating a pressure gradient that counters the radiation stress gradient. In this dynamic, the alongshore radiation stress catalyzes the emergence of the longshore current. Furthermore, the established pressure gradient propels the movement of these longshore currents, culminating in the genesis of rip currents. The synergistic effect of radiation stress and pressure gradients is instrumental in the formation and progression of rip currents. The role of setup in this process is significant and warrants a detailed analysis. Zhang et al.’s [43] numerical simulations offer an in-depth analysis of nearshore circulation systems. Their findings suggest that, in scenarios involving cross-waves, wave surface fluctuations along the coastal direction in the nearshore area are generally uniform. At the anti-node point, the pressure gradient in the vertical coastal direction and the radial stress gradient are balanced, and in the node region, they are mainly balanced by the flow advection of rip currents. Contrasting with the findings of this study, Zhang et al. [43] concentrated their research on cross-waves. Their computational analysis revealed that fluctuations in water levels attributable to wave action in nearshore areas are homogeneous. However, our research shows an uneven distribution of the nearshore setup generated by the breaking of long-crested waves over sandbars. This aligns with Haller’s description of rip current formation, where alongshore pressure gradients drive feeder currents in channels, which then divert offshore to form rip currents.
For a significant wave height of 0.75 m and a peak period of 5 s (Figure 10a), wave breaking occurs close to the shoreline, leading to the accumulation of wave setup on both sides of the bay. The western side exhibits a more extensive distribution of wave setup. Wave breaking is less pronounced, and the area of wave setup is smaller on the western side of the arched shoreline. Conversely, it experiences more pronounced wave breaking and a larger area of wave setup on the eastern side. As the significant wave height increases, both the magnitude and extent of the wave setup within the nearshore zone adjacent to the shoreline progressively increase. This increased wave setup value leads to an intensified pressure gradient in the longshore direction. Consequently, the intensity of the rip currents generated by the extension of the water body is enhanced.
To further analyze the characteristics of the wave height in the simulated area, we selected the wave height at locations y = 400 and 800 m in the section, as shown in Figure 11. During the process of waves propagating from the open sea to the nearshore area, the wave height experiences a brief increase to reach a maximum value in all four tests, followed by a gradual decrease. At a distance of 70 m cross-shore, the waves break, leading to a sharp reduction in the wave height, and at 30 m, the wave height briefly increases again before decreasing to zero. Along with the attenuation of wave height caused by wave breaking, the momentum of the wave also diminishes, which translates into the force exerted by the waves on the surrounding flow field. Conversely, the surrounding current also exerts forces on the waves, manifesting in two forms: one causing changes in the horizontal plane, known as the mean water level, and the other generating longshore currents and nearshore circulation. Uneven alongshore mean water levels near the coastline easily trigger rip currents. Additionally, longshore currents and nearshore circulation are also extremely crucial for the formation of rip currents.
The formation of a rip current results from the extension of a substantial volume of water, causing significant shifts in velocity both cross-shore and longshore within the channel area. These dynamics lead to the formation of vortices. The vorticity is calculated with ω = v x u y in s−1, where (u, v) is the depth-averaged instantaneous velocity components with (x, y) coordinates. This phenomenon is vividly depicted in Figure 12, which shows a series of vortex pairs emerging near the arc-shaped beach. Simultaneously, the trajectories of the vortices with the rip currents are observed in the cross-shore direction. As the significant wave height increases, the complexity of these vortices within the arc-shaped beach region increases. Furthermore, the vortices flanking both sides of the bay gradually migrate cross-shore with the increase in the significant wave height, leading to a concomitant decrease in their strength. The movement of vortices initially depends on the morphology of sandbar channels. Extensive research by Brocchini et al. [20] focused on the vortices formed near submerged breakwaters and structures, revealing that vortices move almost perpendicular to the shoreline. A similar phenomenon is observed near y = 900 m under the condition of a significant wave height of 0.75 m (Figure 12a) in this study. Vortices generated by wave breaking extend outward to the sea through self-advection, with the detachment of vortices also observed in their movement trajectories. Vortices generated by the sloping coastline remain consistently active and tend to move toward the channel. A similar trend is observed between y = 200 and 400 m. As the significant wave height increases, a number of shore eddies form near the coastline due to wave breaking, resulting in complex interactions between sandbars and shore eddies. These eddies move away from the shoreline, but their recirculation trajectories become intricate due to their interactions. The distribution of eddies simulated in this paper shows asymmetry, contrary to the findings of Brocchini et al. [20], which may be due to the excessive width of the channel in the computed region. In Figure 12, the intensity near the coast may be related to the weakening of the shore eddies due to wave refraction when the channel width is small, as mentioned in Kennedy’s paper [21]. Additionally, the migration trajectories of vortices can be observed on both sides of the bay entrance, where a substantial number of shore eddies are formed due to the influence of natural topography, with variations in the significant wave height minimally impacting the migration trajectories of vortices.
In shallow water regions characterized by strong currents, these currents exert a substantial influence on the wave field, significantly impacting sediment transport and pollutant dispersion. To investigate the interplay between waves and currents in the nearshore area, this study analyzed wave surfaces at various time points, with key results depicted in Figure 13. Figure 13a demonstrates the wave surface transformations as waves migrate to nearshore areas. During this transition, waves, impacted by submerged sandbars and seabed structures, break upon reaching the nearshore, resulting in a notable wave height reduction. However, this process does not lead to rip current formation. The bay’s distinct topography induces early wave breaking on both sides, with the western side experiencing more substantial wave deformation, likely due to shallower waters. Figure 6 shows that the currents formed post wave breaking flow along the coastline toward the arc-shaped beach’s center, marked by a discernible reduction in wave height. As numerical simulations progress, enhanced wave breaking in the nearshore zone fosters the development of rip currents. Figure 13b presents the wave surface during rip current occurrences, where the current generated by wave breaking extends cross-shore, creating rip currents. This extension manifests as wave height reductions at y = 500 m, 700 m and 900 m. The phenomenon of peak misalignment observed in this figure aligns with the opposing current, corroborating Kumar’s findings [44]. A similar pattern is noticeable near the bay at x = 500 m, likely caused by deflection rips from the bay’s sides. When the significant wave height reaches 2.5 m, akin to the 2.0 m scenario, the opposing current amplifies wave attenuation [45]. In scenarios with larger waves, the current’s influence on wave height intensifies, particularly on the western bay side, where wave deformation is more pronounced, potentially linked to the extent of wave breaking. At a wave height of 2.5 m, the current’s strength also increases, complicating wave interactions and increasing wave energy. Figure 6 indicates that, as wave height increases, the current’s velocity along both sides of the bay’s coastline rises correspondingly. Furthermore, Figure 6, Figure 10 and Figure 13 collectively reveal that current intensification in areas experiencing water level fluctuations near the shore is consistent with Olabarrieta’s conclusions [46].

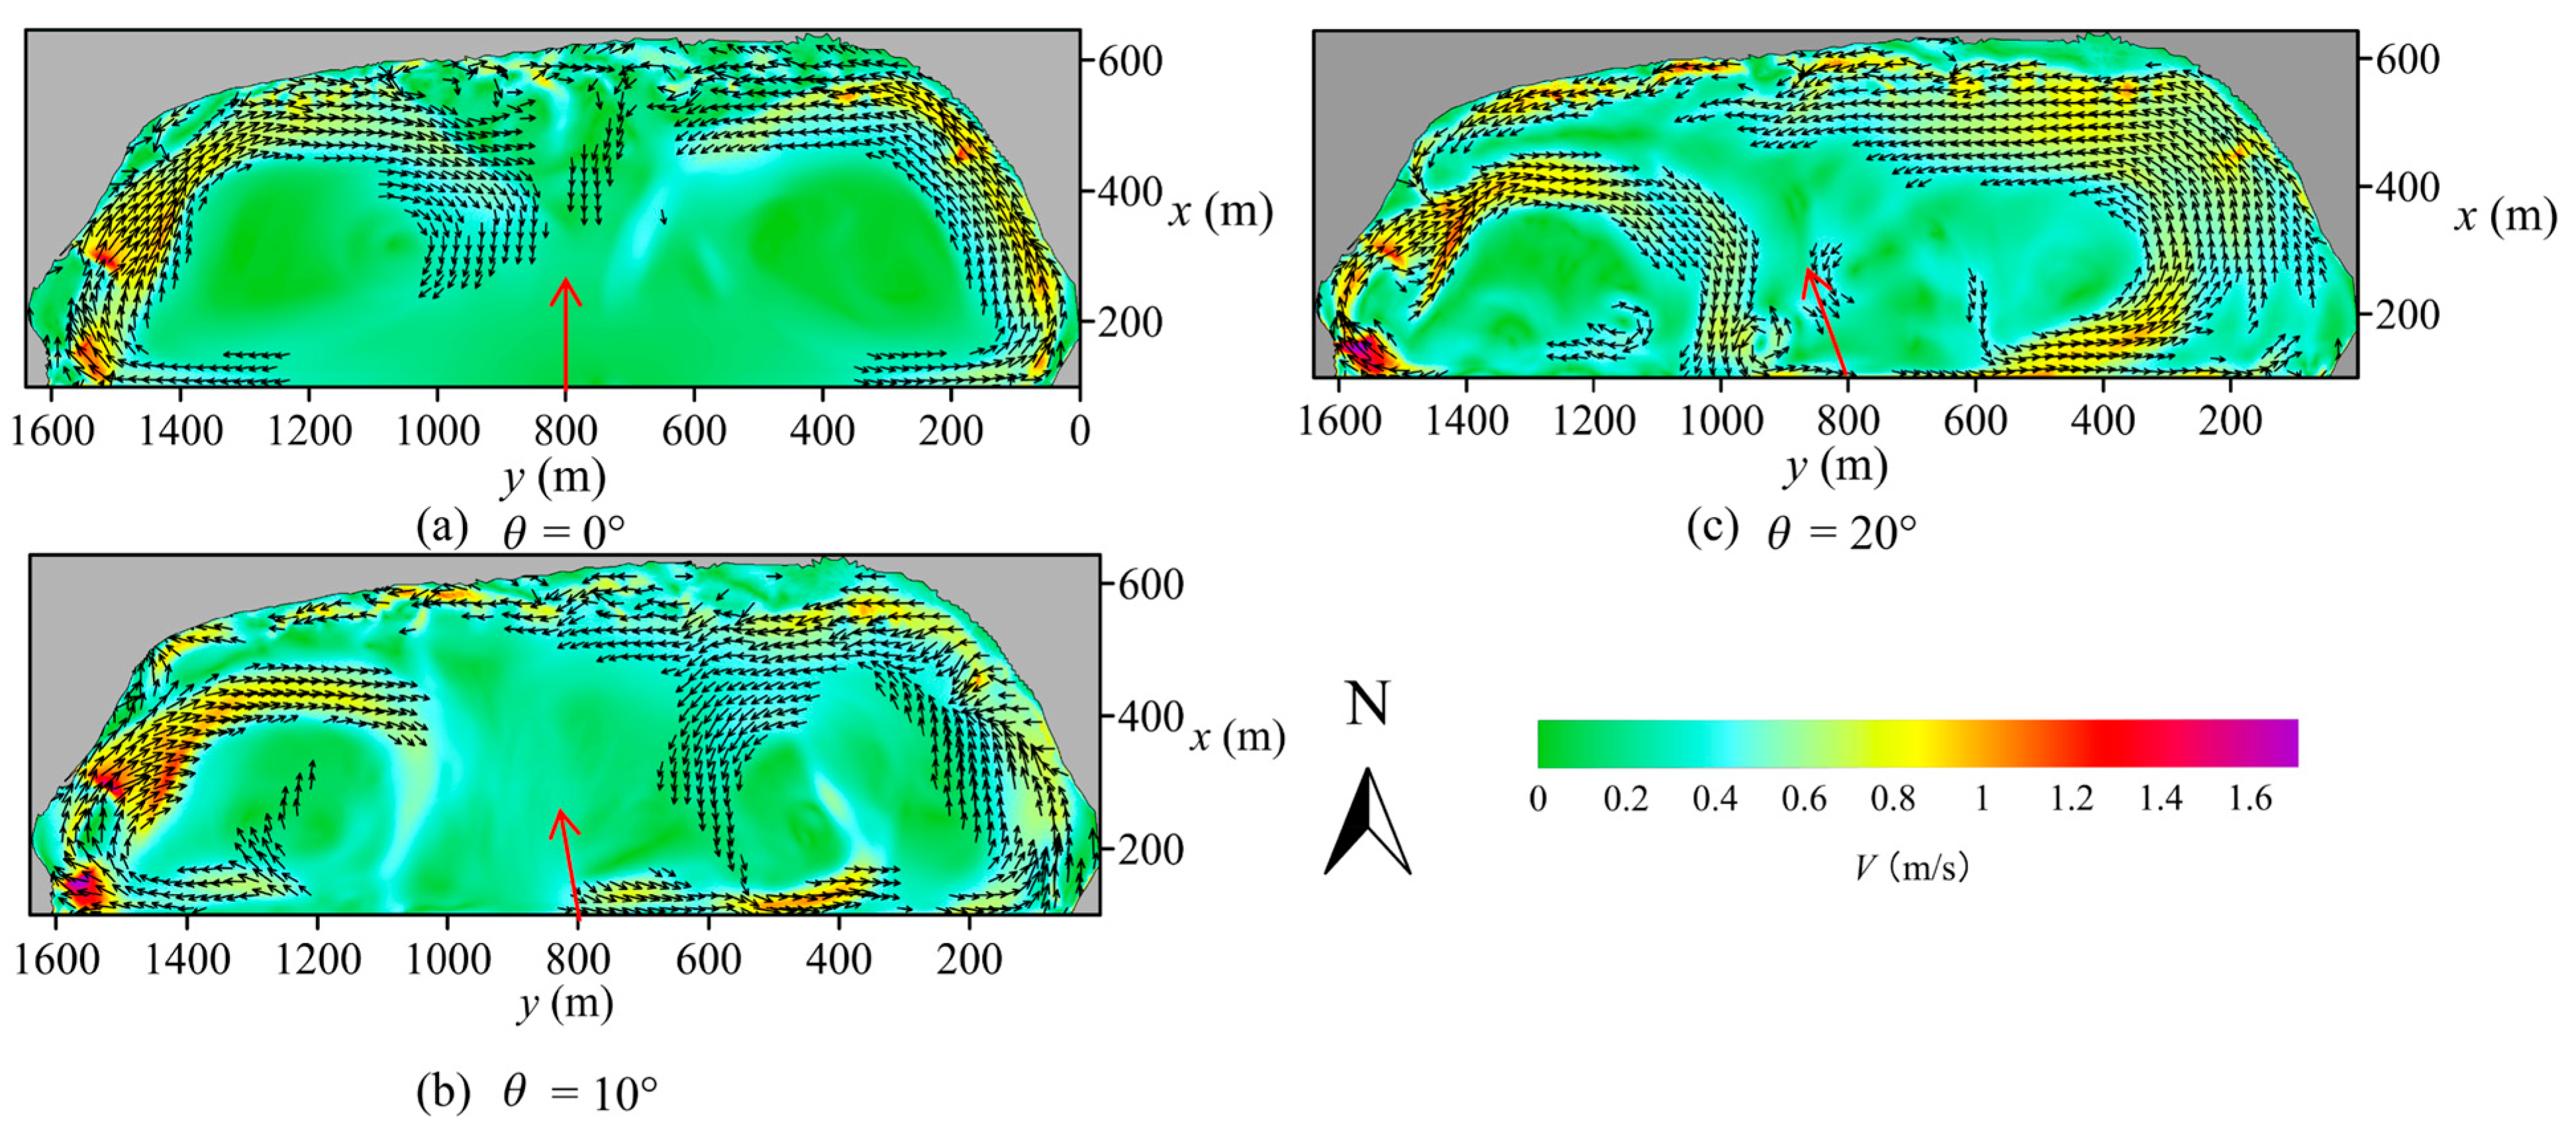
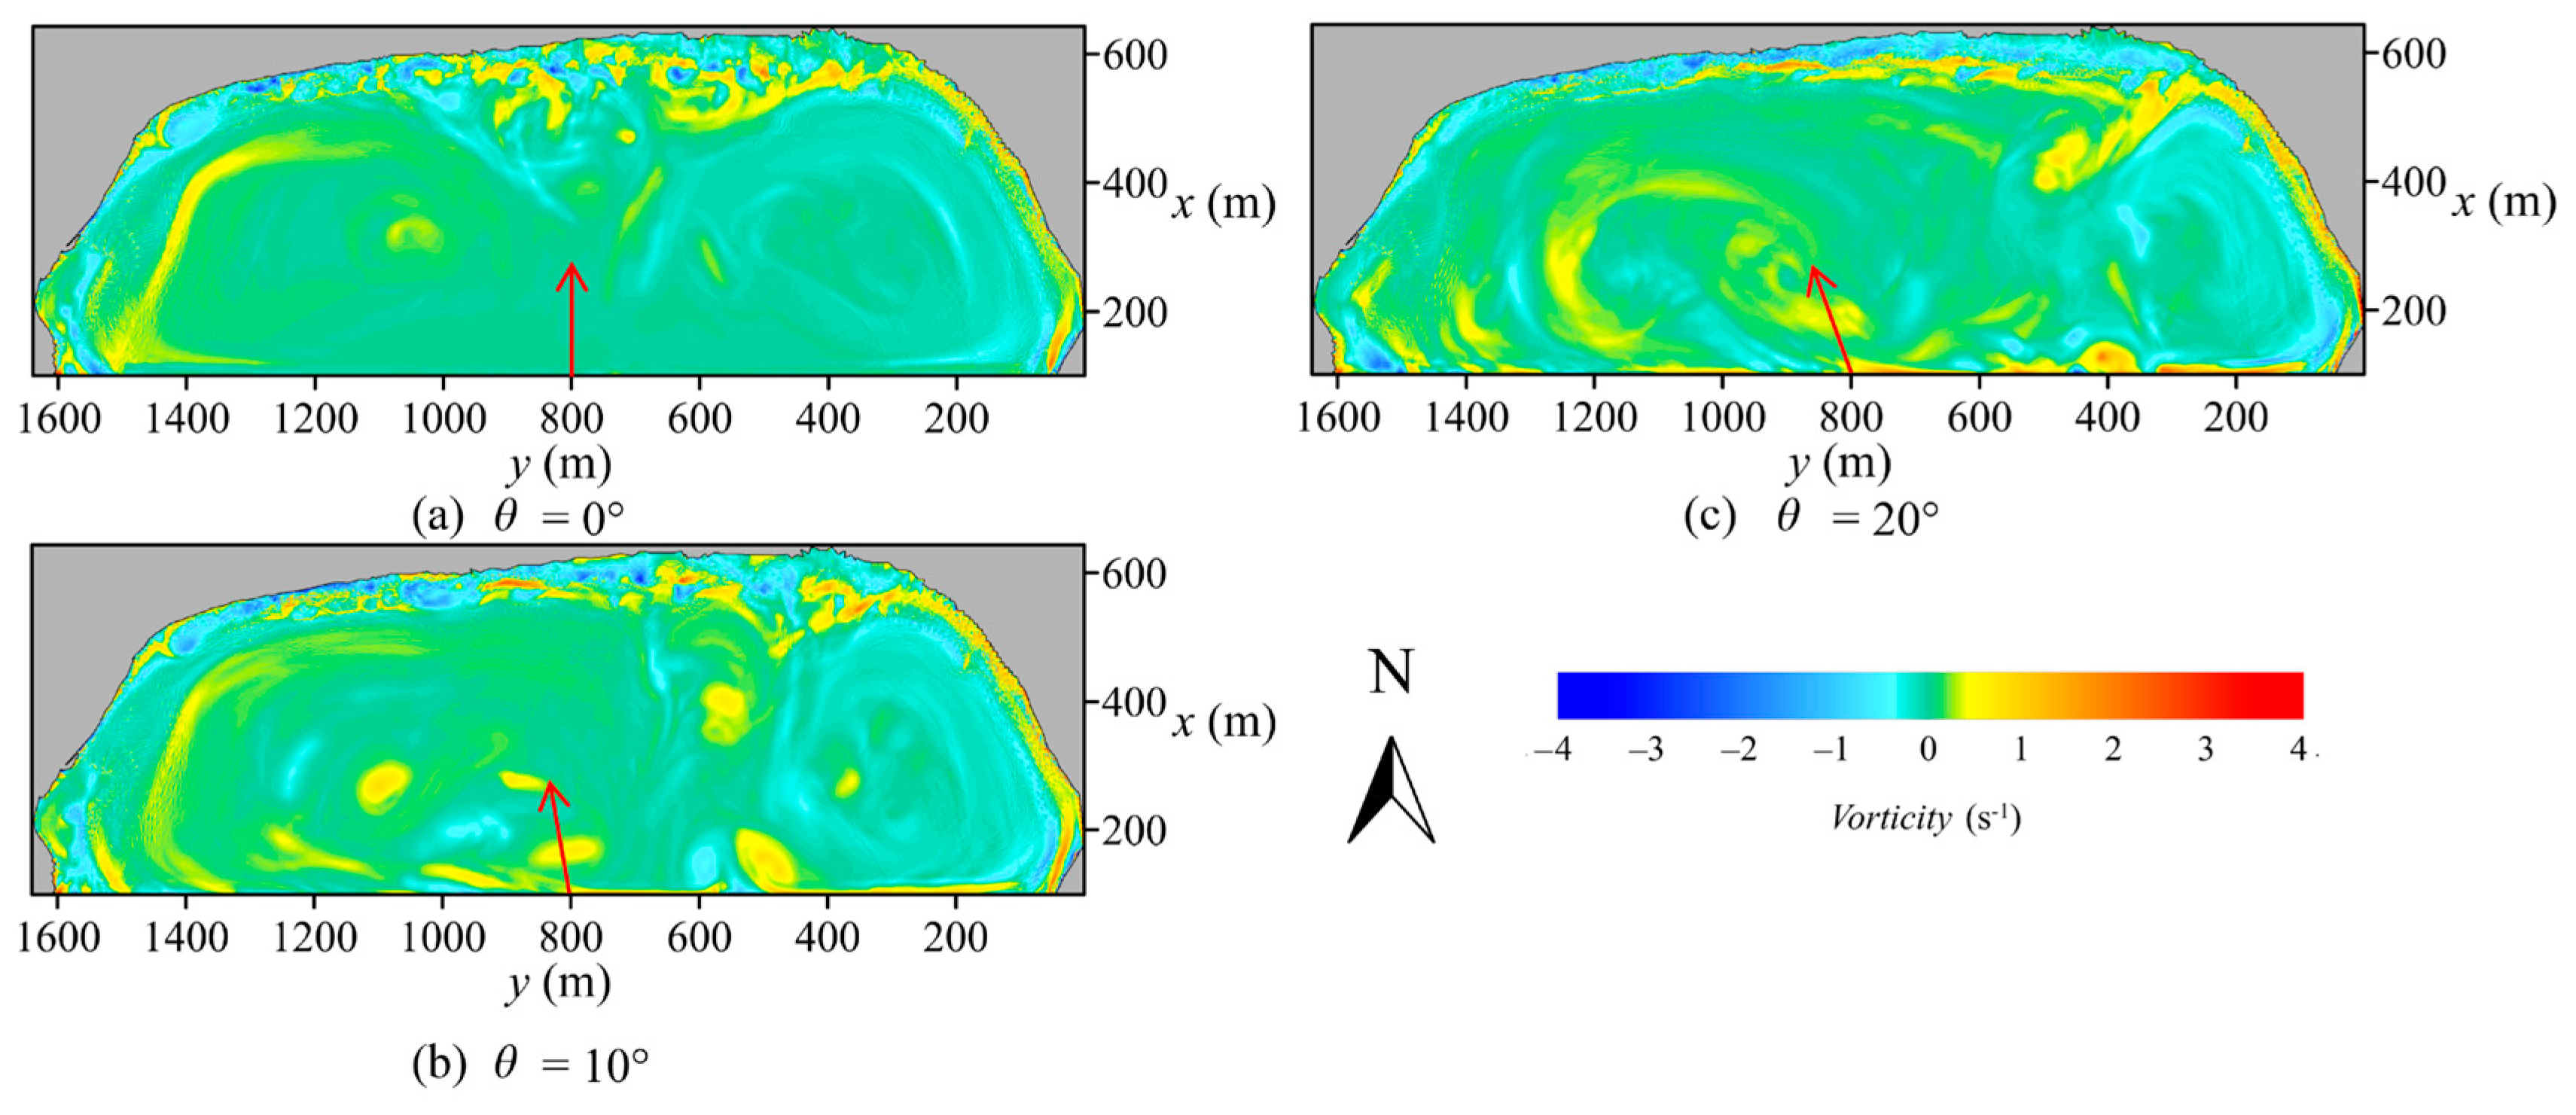
3.2. Effect of Incident WAVE Angle on Rip Current Characteristics

Due to its unique geographical location, Dadonghai Beach is susceptible to waves from different directions. The varying curvature of the coastline at different locations results in different degrees of wave breaking in the nearshore area. Figure 14 shows the spatial distribution of the averaged velocities of rip currents generated by different incident wave directions. The results show that, when waves are incident in the forward direction, the special topographic structure on both sides of the bay leads to early wave breaking and the formation of a large number of longshore currents. Under the continuous impact of southward slanting waves, the longshore currents on both sides extend to the arc-shaped beach area, forming deflection rips. In the arc-shaped beach area, the excess water from wave breaking converges in the middle of the arc-shaped beach. As the angle of the incident wave increases, the flow direction changes significantly. At a 10° wave angle, the longshore currents undergo significant changes due to the influence of the wave direction. The deflection rips on the bay’s eastern side diminish in intensity, and a considerable portion of the longshore currents, created by wave breaking, move toward the western side along the coastline. In contrast, the longshore currents on the western side, influenced by the wave direction, exhibit an increased degree of lateral shift as they extend seaward. A minor portion of these currents still reaches the arc-shaped beach area. The deep mid-beach channel facilitates the cross-shore transport of longshore current momentum, where the combined forces of residual vorticity from rip currents and the wave angle drive a westerly longshore current outside the surf zone. The scenario at a 20° angle, illustrated in Figure 14c, mirrors that at 10°, as shown in Figure 14b. In the case of a 0° angle in the beach area, rip currents predominantly stem from the longshore currents generated by breaking in the arc-shaped beach area. As the angle increases, the longshore currents on the eastern side of the bay progressively shift toward the arc-shaped beach area, expanding their distribution, which is detrimental to rip current formation. Overall, an increase in wave direction angle appears to inversely affect the development of rip currents in the arc-shaped beach zone.
Figure 15 presents the mean water level distribution for varying incident waves, highlighting the effects of changing the wave direction. When waves approach directly, they first break on both sides of the bay entrance and result in a current along the shoreline toward the central area of the arc-shaped beach. Due to the larger area on the eastern side of the bay entrance, it is observed that most currents concentrate on the eastern side of the bay. With an increase in the incident wave angle, the degree of wave breaking on the eastern side of the bay entrance intensifies, leading to the longshore currents moving toward the western side of the arc-shaped beach. At an angle of 20° (Figure 15c), the longshore currents on the eastern side of the bay are nearly parallel to the coastline, and their intensity and distribution range exhibit significant changes compared to those at 10° (Figure 15b), which is beneficial for the uniform evolution of the shoreline and the disappearance of sandbars and troughs [12,47].
Waves approaching the shoreline at specific angles generate nearshore currents, which gradually dissipate over an extended period [21]. When waves are incident perpendicularly, the figure illustrates the migration trajectories of vortices and their intricate interactions near the shoreline. As the incident wave angle increases, the predominant transportation of shore vortices shifts from the west side to the east side of the bay entrance. At a 10° angle (Figure 16b), vortices aggregate near y = 500 m alongside longshore currents. However, with an increased incident wave angle of 20° (Figure 16c), the intensified angle influences the currents’ strength, leading the vortices to converge near y = 400 m. The distribution of vortices in the arc-shaped beach area amplifies, whereas the vortex intensity weakens due to their complex interactions. This phenomenon is distinctly portrayed in Figure 16a–c, highlighting a higher intensity on the eastern side compared to the western side of the arc-shaped beach.
The interplay between waves and currents manifests distinct characteristics at varying angles. With directly approaching waves, their energy is more concentrated, leading to a relatively weaker interaction with currents in regions distant from the nearshore. In contrast, at a 20° angle, wave propagation adopts an oblique pattern, and observations from Figure 17c,d reveal reductions in both wave amplitude and wavelength, accompanied by changes in energy propagation patterns. Moreover, this shift in wave direction results in notable alterations in the distribution and movement of longshore currents. Specifically, in Figure 17d, the increased wave breaking on the eastern side of the arc-shaped beach, due to the angle’s influence, generates excess water, forming longshore currents. In this section, the narrowed angle between waves and currents, coupled with a decrease in current velocity, allows wave influence to predominate. Consequently, the longshore currents tend to migrate toward the western side of the arc-shaped beach, displaying subtle variations from the 0° angle case. Additionally, as shown in Figure 17d, the combined effects of deflection rips and currents result in diminished wave peak values and phase alterations.

4. Methods to Reduce Rip Currents

Rip currents, often termed the “silent killers” of beaches, pose a significant threat to the safety of beachgoers and the management of beach environments. Mitigating the risks associated with rip currents is a pressing issue. However, practical engineering solutions to mitigate rip currents are relatively scarce. Today, most recreational beaches rely on measures such as warning signs to mitigate the risks posed by rip currents. Section 4 of this paper aims to provide suggestions and references for engineering practices.

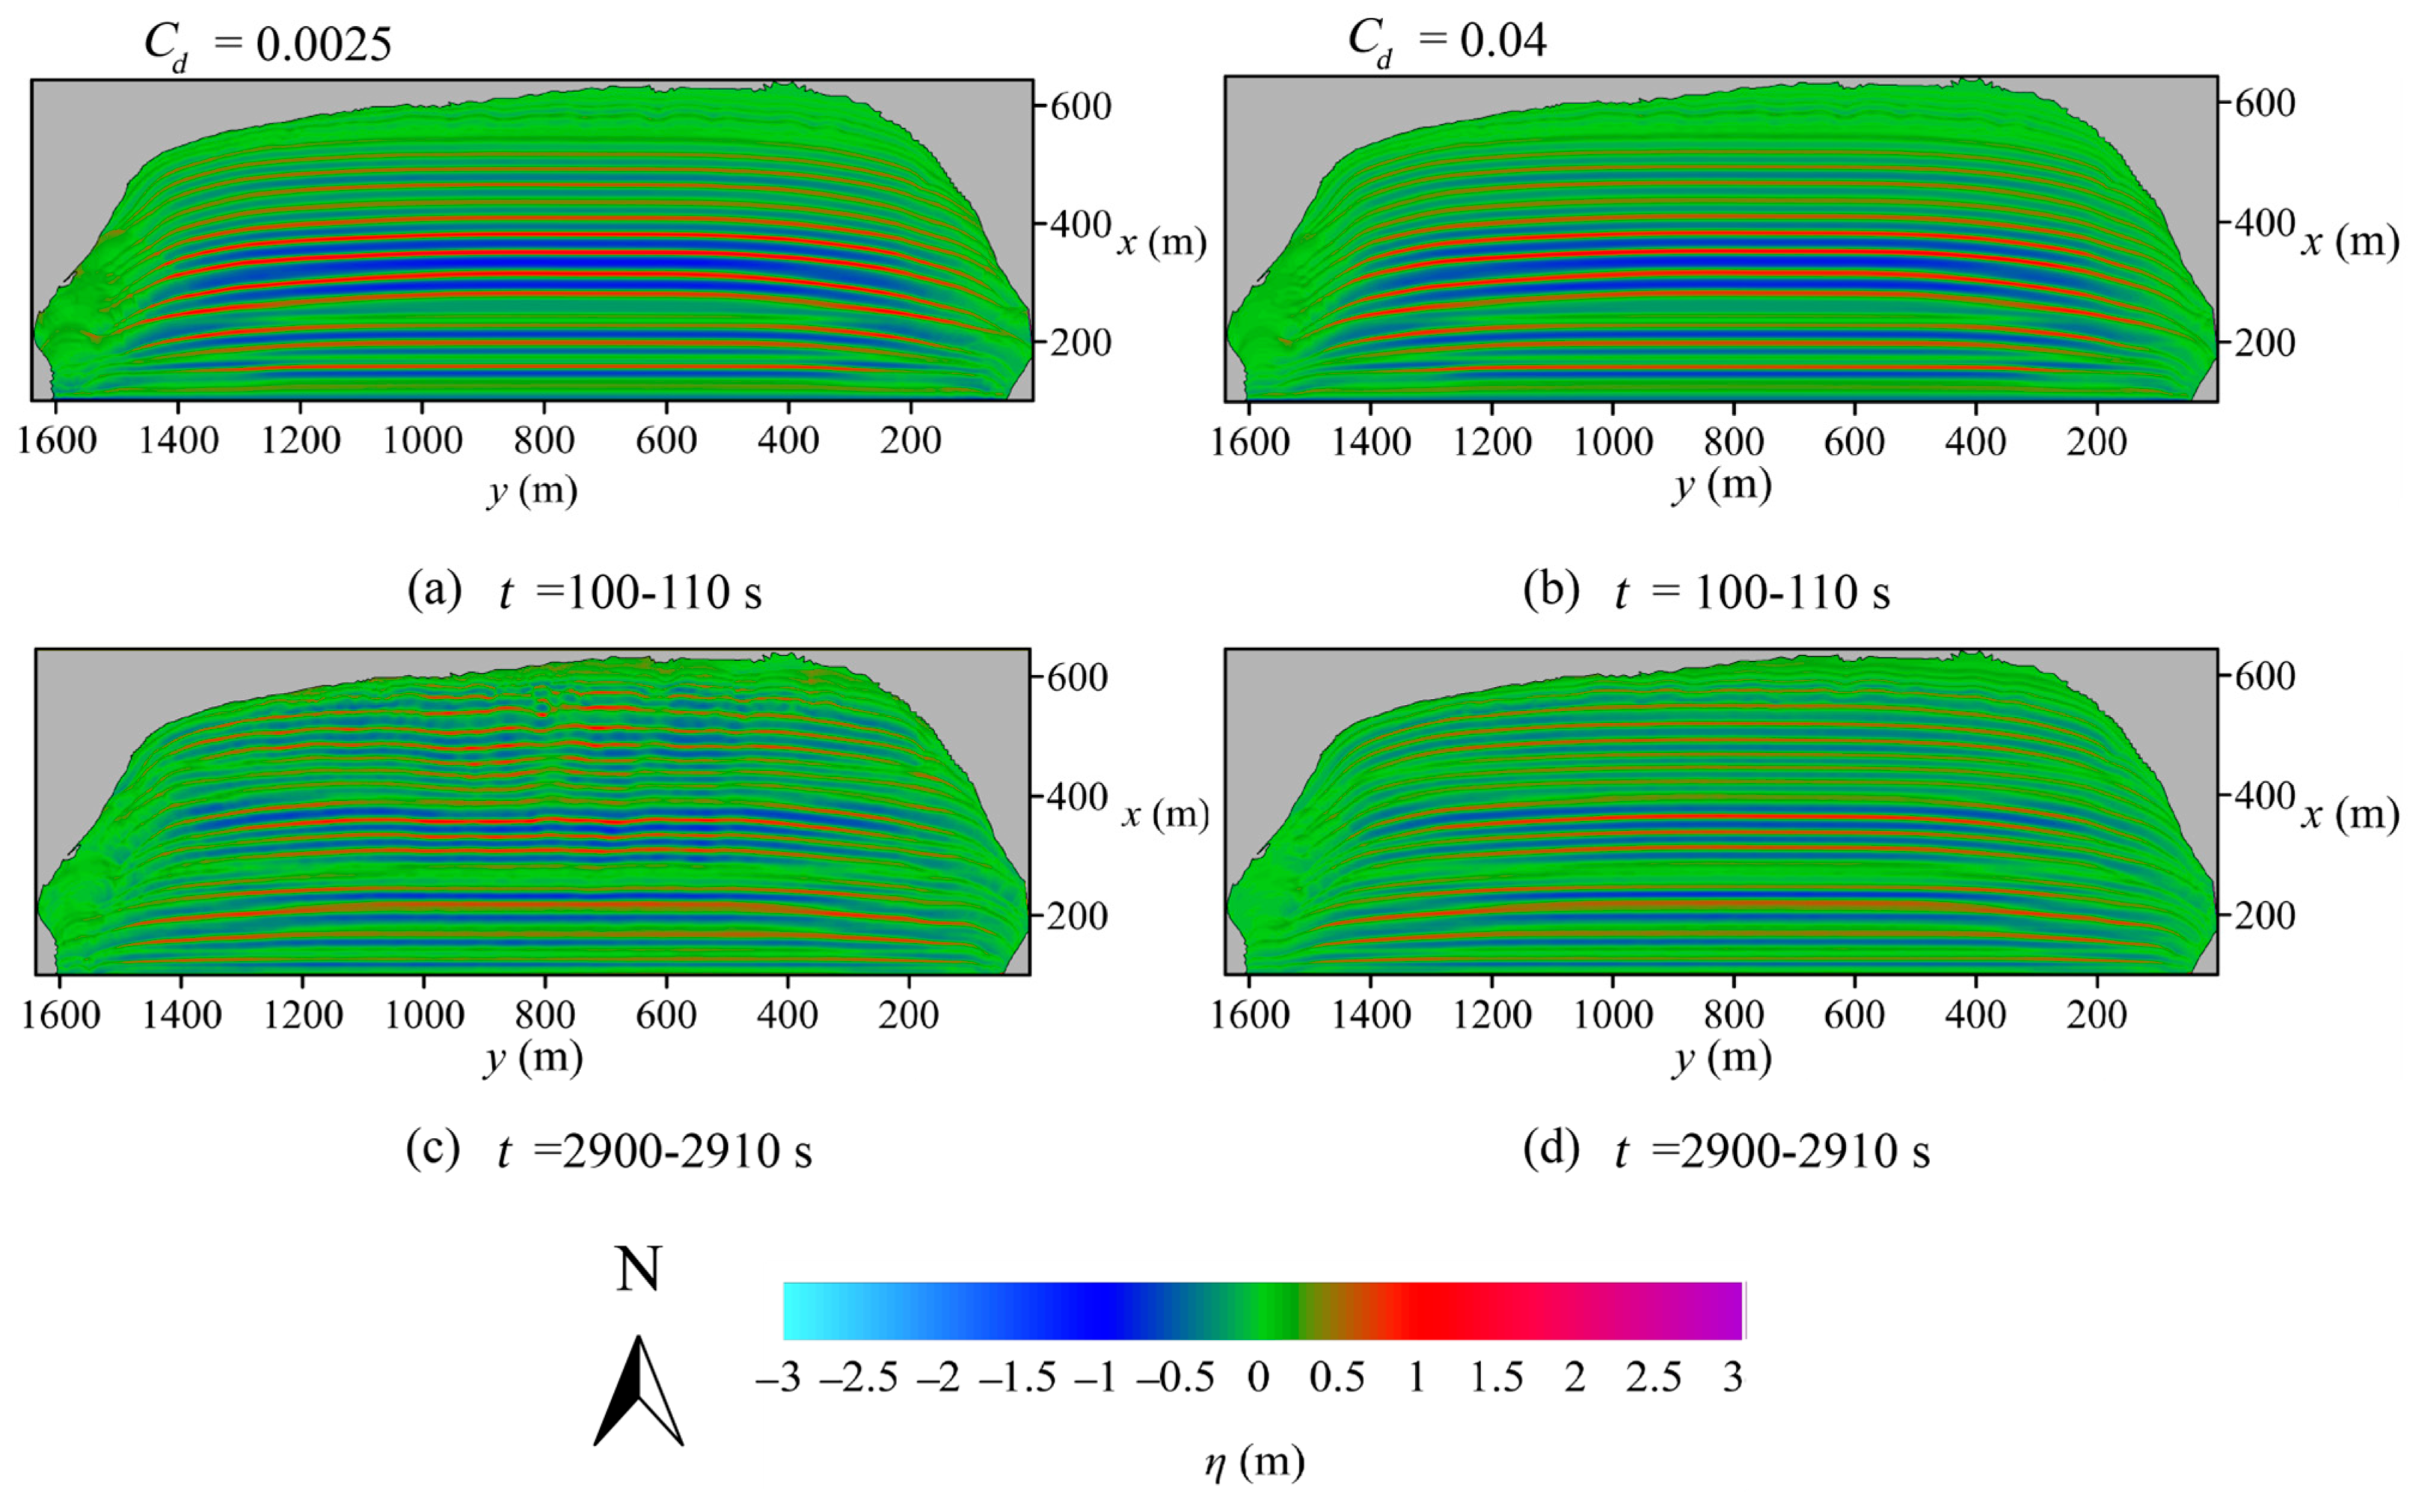
4.1. Effect of Bottom Friction on Rip Current Characteristics

Rip currents, a common coastal hazard, exhibit regional randomness and temporal unpredictability, posing a significant contemporary challenge to the development of effective rip current prevention strategies. In this section, we explore the impact of bottom friction on rip current formation. Specifically, we select three distinct sets of bottom friction coefficients for numerical simulations, and the corresponding results are presented in Figure 18. With a bottom friction coefficient (Cd) of 0.0025 (Figure 18a), the trajectory extension of rip currents near the y = 800 m boundary of the computational domain is clearly observable. Notably, deflection rips with high flow velocity are also present on both sides of the bay. However, as Cd is increased to 0.02 (Figure 18b), the strength of the deflection rips on both sides of the bay and the rip currents at y = 800 m within the arc-shaped beach area decreases. This trend becomes more pronounced as Cd increases to 0.04 (Figure 18c). This observed phenomenon can be attributed to the fact that increased bottom friction leads to reduced wave propagation speed, wave breaking and wave height. In general, increased bottom friction reduces the strength of rip currents, providing valuable insights into rip current management. In practical marine environments, the introduction of rocks and other structures to enhance bottom roughness can effectively mitigate rip currents.
Variations in nearshore topography friction markedly influence wave–current interactions. We analyzed selected wave surfaces at different intervals using two different friction coefficients (Cd = 0.02 and Cd = 0.04). The result is shown in Figure 19. Increasing the topographical roughness amplifies wave dispersion and attenuation, thereby changing wave velocity distributions. At a lower friction coefficient of 0.0025, representing a smoother seabed, wave attenuation is less pronounced, primarily impacting areas where nearshore rip currents are prevalent. However, as the topographical roughness increases, wave attenuation and the complexity of wave–current interactions in the nearshore zone increase substantially. In these scenarios, the current field forms structures such as turbulence and eddies, which, in turn, affect wave dynamics. Additionally, a rougher seabed augments bottom shear stress in the current field, thereby intensifying turbulence within the boundary layer. In the area between x = 400 and 600 m, a shallower water depth leads to more noticeable wave attenuation. Near y = 600 m, wave phase changes are evident, resulting from interactions between longshore currents and waves. Figure 18 further demonstrates a decrease in the longshore current velocity, attributed to the influence of the rough bottom in the nearshore region [48]. Along both sides of the bay, currents predominantly arise from wave breaking, primarily along the coastline. An increase in the topographical roughness correlates with a reduction in near-seabed currents, consequently diminishing the intensity of the resulting deflection rips.
To investigate the influence of bottom friction on rip currents, we conducted a detailed statistical analysis of rip current velocities at two sections (y = 830 m and y = 850 m). The result is shown in Figure 20. At the y = 830 m section, with a bottom friction coefficient of 0.0025, indicative of smoother terrain, we observed a gradual decrease in the current velocity during wave propagation. This trend results from the diminishing water depth and terrain friction constraining wave motion, leading to a deceleration in velocity. In the nearshore area, after wave breaking, the velocity stabilizes and gradually diminishes to zero. As the degree of terrain friction intensifies, negative velocities appear in the cross-shore direction section. This phenomenon is due to increased resistance during wave propagation, particularly at the wave base. During this process, the wave base, influenced by terrain friction, moves in a direction opposite to wave propagation, hence the negative velocities. Similar observations were made at the y = 850 m section, contributing to a more formal understanding of the impact of friction on rip current behavior.

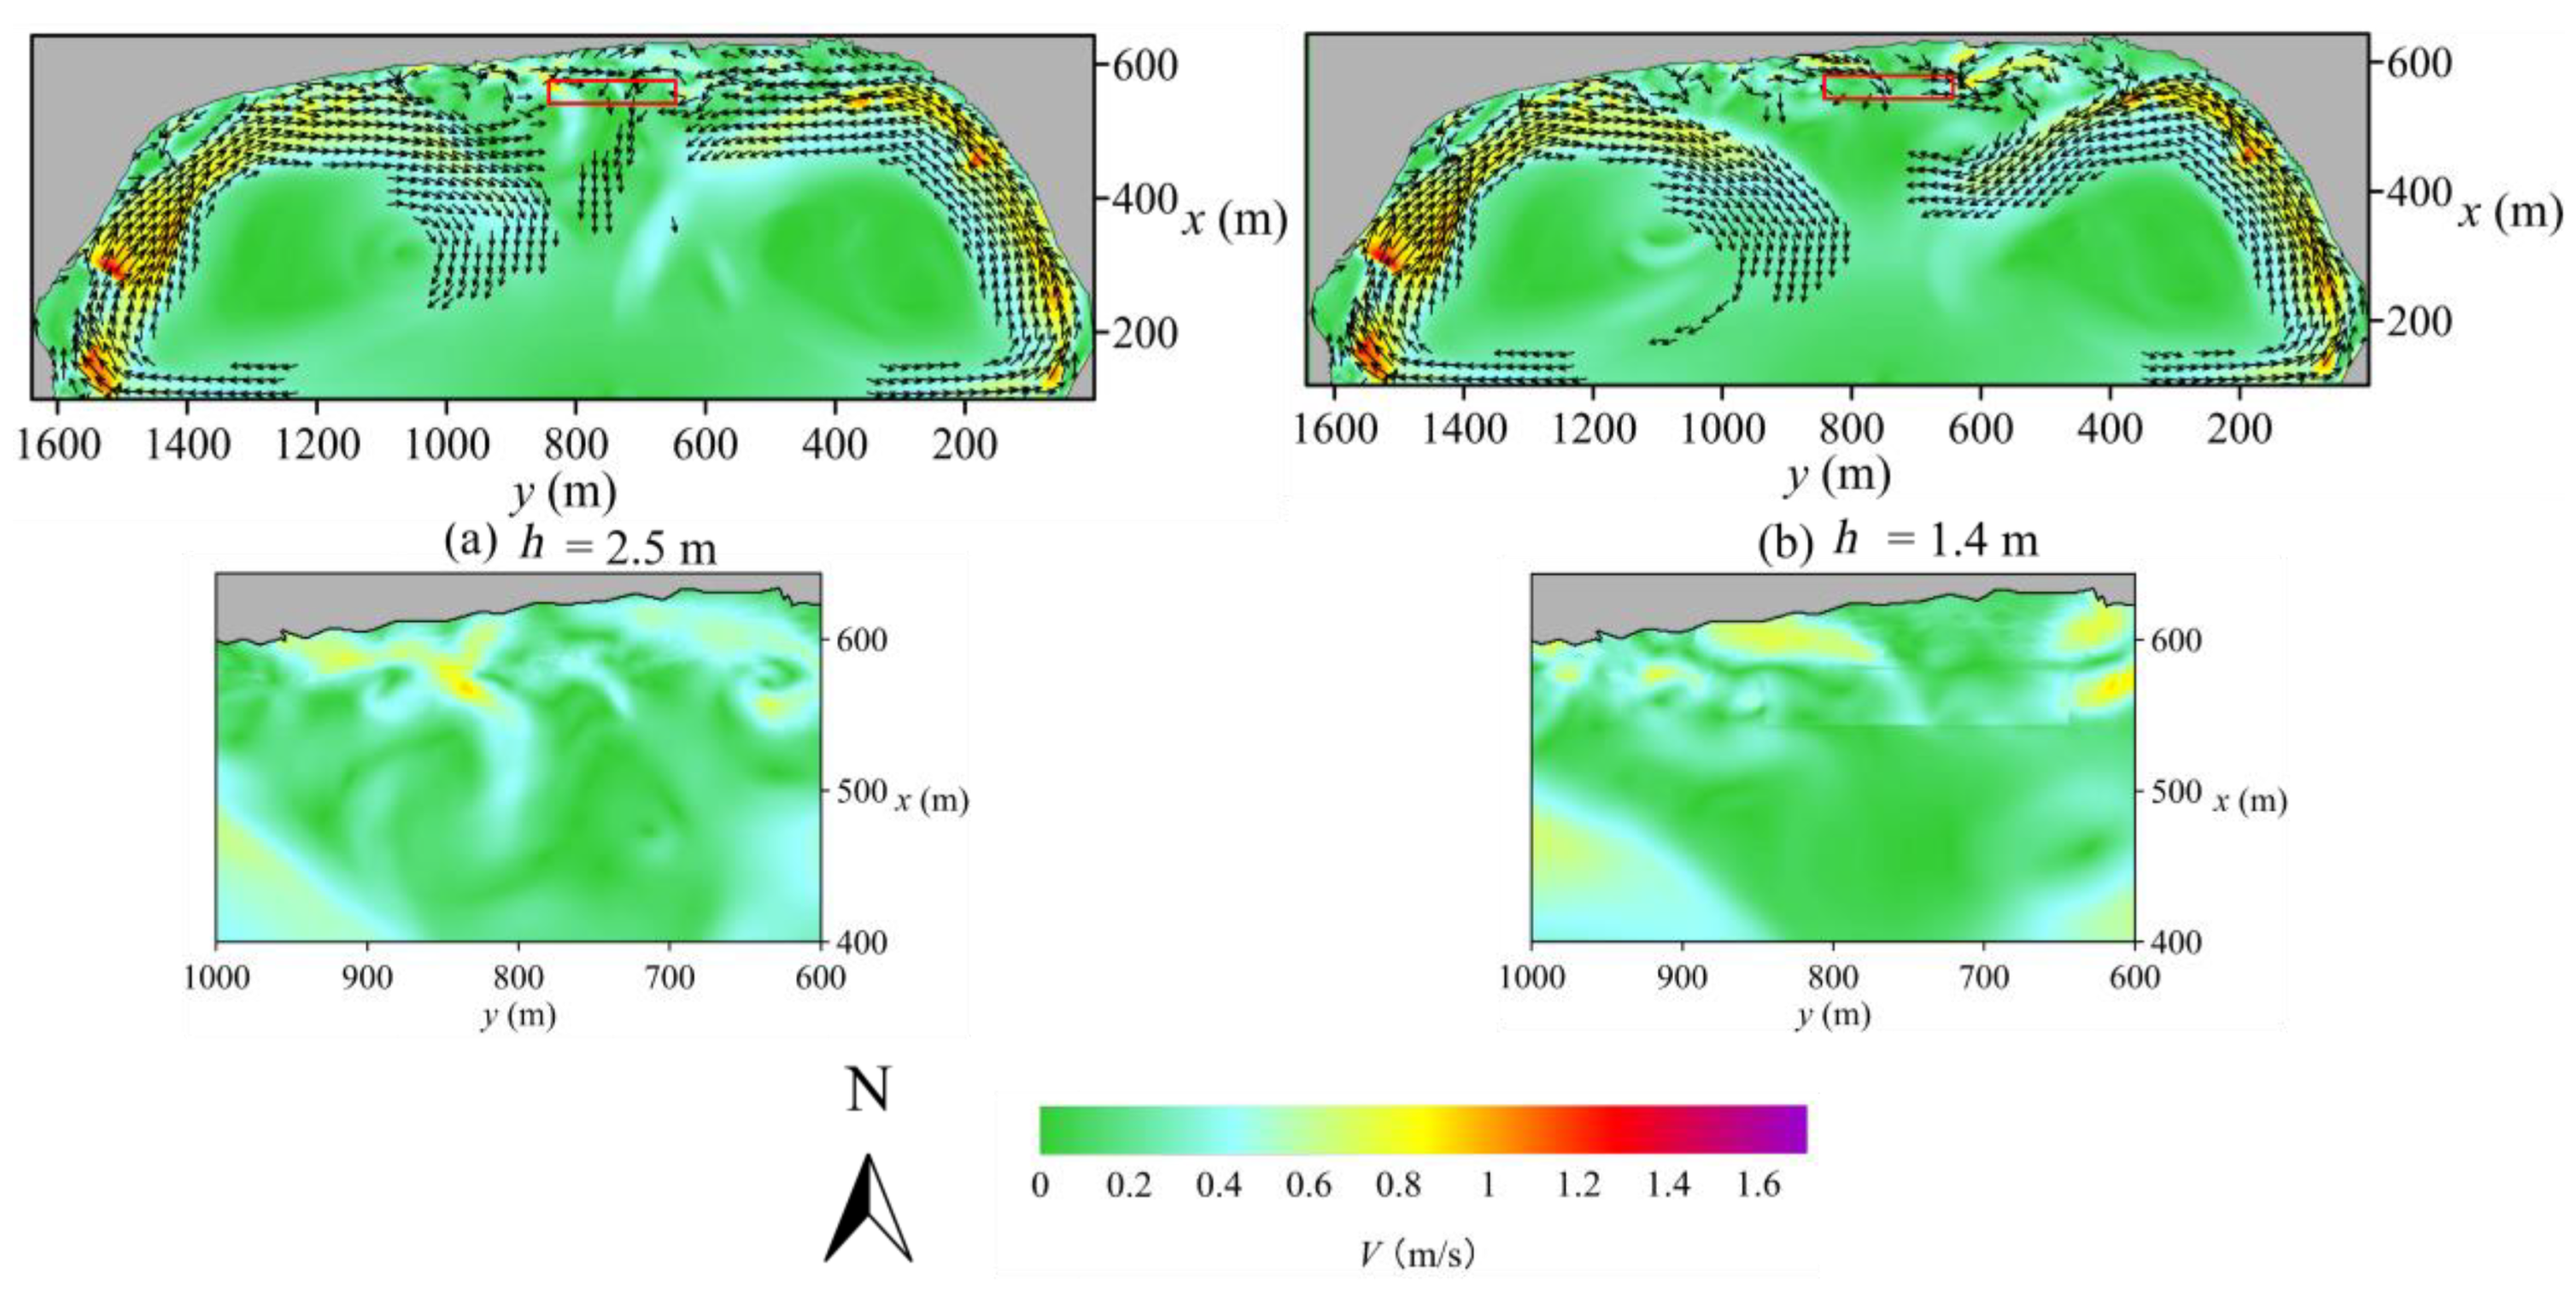
4.2. Influence of Water Depth at Channel Positions on Rip Current Formation

The beach topography at Dadonghai Beach in Sanya is unique, characterized by numerous deep pits and underwater channels, making it susceptible to the accumulation of seawater and the formation of rip currents. In an effort to understand the influence of water depth at channel locations on rip currents, we adjusted the water depth at channels near the shoreline (y = 800 m) within the computational domain, reducing it from 2.5 m to 1.4 m. Figure 21 illustrates the distribution of rip currents across various channel depths. The decrease in channel depth results in a shift in the morphology of the rip currents near the arc-shaped shoreline at y = 800 m, where they transform into longshore currents. This phenomenon occurs because the longshore currents generated by wave breaking are unable to recirculate through the underwater channels in that region. To address rip-current-prone areas, potential remediation measures could involve reducing the depth of these underwater channels or clearing them, thereby effectively preventing the formation of rip currents.
Channels, typically formed by rip currents, often occur in sandy geologies. Due to the loose nature of sandy geological soils, which easily form channels, rip currents formed in sandy areas are characterized by their short duration and unpredictable locations of occurrence. Adjusting the water depth at these channel locations can effectively reduce the intensity of rip currents. Moreover, on coastal platforms and fringing reefs, the erosive action of water may create permanent channels [1]. It is also possible to reduce riptides by changing the depth of the channel. Our study investigates the possibility of mitigating or even eliminating rip currents by altering factors such as water depth, intended to offer insights and references for engineering applications.

5. Conclusions

This study investigates the phenomenon of rip currents occurring at Dadonghai Beach, particularly in the area characterized by year-round incidents of rip current occurrences. This study mainly focuses on analyzing the influence of wave parameters such as wave height, period, incident direction and topographic features, including the bottom friction coefficient and channel depth, on the formation of rip currents. This analysis provides valuable information for risk assessment and the implementation of rip current prevention measures in this marine region. The following conclusions can be drawn from the above study:
As the significant wave height and peak period increase, there is a corresponding increase in the intensity of the deflection rips formed on both sides of the bay, as well as the rip currents within the arc-shaped shoreline area. At the same time, the vortex distribution becomes more complex.
As the incident wave angle increases, more water accumulated near the shore is concentrated mainly on the eastern side of the bay. This change in angle also leads to a more complex distribution of vortices in the same region. Although a higher incident wave angle is detrimental to the development of rip currents, it paradoxically facilitates the formation of deflection rips.
Increased bottom friction reduces wave breaking, resulting in the dissipation of deflection rips on both sides of the bay. Concurrently, the intensity of rip currents and longshore currents generated in the arc-shaped shoreline area is reduced.
Reducing the depth of the water at channel locations prevents the water mass created by wave breaking from flowing back through the channels into the sea, thereby inhibiting the formation of rip currents. As a result, rip currents in this region are more likely to transition into longshore currents.

Author Contributions

Conceptualization, C.X. and X.J.; methodology, Z.Y. and S.Y.; software, C.X., D.W. and Z.R.; validation, C.X., X.J. and Z.Y.; data curation, C.X. and X.J.; writing—original draft preparation, C.X., X.J., Z.Y., D.W. and Z.R.; writing—review and editing, C.X., X.J., Z.Y. and Z.R.; visualization, D.W.; supervision, Z.Y.; project administration, C.X. and X.J., All authors have read and agreed to the published version of the manuscript.

Funding

This work was funded by the National Natural Science Foundation of China (52261043, 51709069, 12002099), the Ministry of Industry and Information Technology with the research project under grant number [2019]357, the Fundamental Research Funds for the Central Universities of China (G2023KY05102, 3132023360), the Innovative Research Projects for Postgraduate Students in Hainan Province (Qhys2022-172), State Key Laboratory of Ocean Engineering (GKZD010084), SKL of HESS and Hainan Province Science and Technology Plan Sanya Yazhou Bay Science and Technology City Joint Project (420LH022).

Institutional Review Board Statement

Not applicable.

Informed Consent Statement

Not applicable.

Data Availability Statement

The data presented in this study are available on request from the corresponding author.

Conflicts of Interest

The authors declare no conflict of interest. The funders had no role in the design of the study; in the collection, analyses or interpretation of data; in the writing of the manuscript; or in the decision to publish the results.

References

  1. Castelle, B.; Scott, T.; Brander, R.W.; McCarroll, R.J. Rip current types, circulation and hazard. Earth-Sci. Rev. 2016, 163, 1–21. [Google Scholar] [CrossRef]
  2. Shepard, F.P.; Emery, K.; La Fond, E.C. Rip currents: A process of geological importance. J. Geol. 1941, 49, 337–369. [Google Scholar] [CrossRef]
  3. Turner, I.L.; Whyte, D.; Ruessink, B.G.; Ranasinghe, R. Observations of rip spacing, persistence and mobility at a long, straight coastline. Mar. Geol. 2007, 236, 209–221. [Google Scholar] [CrossRef]
  4. MacMahan, J.; Brown, J.; Brown, J.; Thornton, E.; Reniers, A. Mean Lagrangian flow behavior on an open coast rip-channeled beach: A new perspective. Mar. Geol. 2010, 268, 1–15. [Google Scholar] [CrossRef]
  5. Scott, T.; Masselink, G.; Austin, M.J.; Russell, P. Controls on macrotidal rip current circulation and hazard. Geomorphology 2014, 214, 198–215. [Google Scholar] [CrossRef]
  6. Kim, I.C.; Lee, J.L.; Lee, J.Y. Verification of rip current simulation using a two-dimensional predictive model, HAECUM. J. Coast. Res. 2013, 65, 726–730. [Google Scholar] [CrossRef]
  7. Zhu, D.; Li, Z.; Hu, P.; Wang, B.; Su, Q.; Li, G. Preliminary Investigation and Analysis of Beachgoers’ Awareness of Rip Currents in South China. Int. J. Environ. Res. Public Health 2023, 20, 4471. [Google Scholar] [CrossRef]
  8. Haller, M.C.; Dalrymple, R.A.; Svendsen, I.A. Experimental Study of Nearshore Dynamics on a Barred Beach with Rip Channels. J. Geophys. Res. 2002, 107, 14-1–14-21. [Google Scholar] [CrossRef]
  9. Chen, Q.; Dalrymple, R.A.; Kirby, J.T.; Kennedy, A.B.; Haller, M.C. Boussinesq modeling of a rip current system. J. Geophys. Res. 1999, 104, 20617–20637. [Google Scholar] [CrossRef]
  10. Haas, K.A.; Svendsen, I.A. Laboratory measurements of the vertical structure of rip currents. J. Geophys. Res. 2002, 107, 15-1–15-19. [Google Scholar] [CrossRef]
  11. Zhang, Y.; Kennedy, A.B.; Tomiczek, T.; Donahue, A.; Westerink, J. Validation of Boussinesq–Green–Naghdi modeling for surf zone hydrodynamics. Ocean Eng. 2016, 111, 299–309. [Google Scholar] [CrossRef]
  12. Hong, X.; Zhang, Y.; Wang, B.; Zhou, S.; Yu, S.; Zhang, J. Numerical study of rip currents interlaced with multichannel sandbars. Nat. Hazards. 2021, 108, 593–605. [Google Scholar] [CrossRef]
  13. Zhang, Y.; Hong, X.; Qiu, T.; Liu, X.; Sun, Y.; Xu, G. Tidal and wave modulation of rip current dynamics. Cont. Shelf Res. 2022, 243, 104764. [Google Scholar] [CrossRef]
  14. Hu, P.; Li, Z.; Zhu, D.; Zeng, C.; Liu, R.; Chen, Z.; Su, Q. Field observation and numerical analysis of rip currents at Ten-Mile Beach, Hailing Island, China. Estuar. Coast. Shelf Sci. 2022, 276, 108014. [Google Scholar] [CrossRef]
  15. Shin, S.; Nam, J.; Son, S.; Kim, I.H.; Jung, T.H. Field Observation and Numerical Modelling of Rip Currents within a Pocket Beach. J. Coast. Res. 2017, 79, 229–233. [Google Scholar] [CrossRef]
  16. Wang, H.; Zhu, S.; Li, X.; Zhang, W.; Nie, Y. Numerical simulations of rip currents off arc-shaped coastlines. Acta Oceanol. Sin. 2018, 37, 21–30. [Google Scholar] [CrossRef]
  17. Moulton, M.; Elgar, S.; Raubenheimer, B.; Warner, J.C.; Kumar, N. Rip currents and alongshore flows in single channels dredged in the surf zone. J. Geophys. Res. Oceans 2017, 122, 3799–3816. [Google Scholar] [CrossRef]
  18. Tomasicchio, G.; Francone, A.; Simmonds, D.; D’Alessandro, F.; Frega, F. Prediction of shoreline evolution. Reliability of a general model for the mixed beach case. J. Mar. Sci. Eng. 2020, 8, 361. [Google Scholar] [CrossRef]
  19. Xu, J.; Yan, S.; Zou, Z.; Chang, C.; Fang, K.; Wang, Y. Flow Characteristics of the Rip Current System near a Shore-Normal Structure with Regular Waves. J. Mar. Sci. Eng. 2023, 11, 1297. [Google Scholar] [CrossRef]
  20. Brocchini, M.; Kennedy, A.; Soldini, L.; Mancinelli, A. Topographically controlled, breaking-wave-induced macrovortices. Part 1. Widely separated breakwaters. J. Fluid. Mech. 2004, 507, 289–307. [Google Scholar] [CrossRef]
  21. Kennedy, A.; Brocchini, M.; Soldini, L.; Gutierrez, E. Topographically controlled, breaking-wave-induced macrovortices. Part 2. Changing geometries. J. Fluid. Mech. 2006, 559, 57–80. [Google Scholar] [CrossRef]
  22. Postacchini, M.; Brocchini, M.; Soldini, L. Vorticity generation due to cross-sea. J. Fluid. Mech. 2014, 744, 286–309. [Google Scholar] [CrossRef]
  23. Choi, J.; Roh, M. A laboratory experiment of rip currents between the ends of breaking wave crests. Coast. Eng. 2021, 164, 103812. [Google Scholar] [CrossRef]
  24. Winter, G.; Van Dongeren, A.R.; De Schipper, M.A.; De Vries, J.V.T. Rip currents under obliquely incident wind waves and tidal longshore currents. Coast. Eng. 2014, 89, 106–119. [Google Scholar] [CrossRef]
  25. Choi, J.; Kim, H.S. A Boussinesq Modeling of a Rip Current at the Daechon beach in Korea. J. Coast. Res. 2016, 75, 1332–1336. [Google Scholar] [CrossRef]
  26. Schönhofer, J.; Dudkowska, A. Rip currents in the southern Baltic Sea multi-bar nearshore zone. Cont. Shelf Res. 2021, 212, 104324. [Google Scholar] [CrossRef]
  27. Haller, M.; Honegger, D.; Catalan, P. Rip current observations via marine radar. J. Waterw. Port. Coast. 2014, 140, 115–124. [Google Scholar] [CrossRef]
  28. Ludeno, G.; Postacchini, M.; Natale, A.; Brocchini, M.; Lugni, C.; Soldovieri, F.; Serafino, F. Normalized scalar product approach for nearshore bathymetric estimation from X-band radar images: An assessment based on simulated and measured data. IEEE J. Oceanic. Eng. 2017, 43, 221–237. [Google Scholar] [CrossRef]
  29. Kirby, J.T.; Wei, G.; Chen, Q.; Kennedy, A.B.; Dalrymple, R.A. FUNWAVE 1.0: Fully Nonlinear Boussinesq Wave Model-Documentation and User’s Manual; Research Repo NO. CACR-98-06; University of Delaware Center for Applied Coastal Research: Newark, DE, USA, 1998. [Google Scholar]
  30. Chen, Q. Fully nonlinear Boussinesq-type equations for waves and currents over porous beds. J. Eng. Mech. 2006, 132, 220–230. [Google Scholar] [CrossRef]
  31. Chen, Q.; Kirby, J.T.; Dalrymple, R.A.; Shi, F.; Thornton, E. Boussinesq modeling of longshore currents. J. Geophys. Res. Oceans. 2003, 108, 3362. [Google Scholar] [CrossRef]
  32. Kennedy, A.B.; Chen, Q.; Kirby, J.T.; Dalrymple, R.A. Boussinesq modeling of wave transformation, breaking, and runup. I: 1D. J. Waterw. Port. Coast. 2000, 126, 39–47. [Google Scholar] [CrossRef]
  33. Kennedy, A.B.; Kirby, J.T.; Chen, Q.; Dalrymple, R.A. Boussinesq-type equations with improved nonlinear performance. Wave Motion. 2001, 33, 225–243. [Google Scholar] [CrossRef]
  34. Shi, F.; Kirby, J.T.; Harris, J.C.; Geiman, J.D.; Grilli, S.T. A high-order adaptive time-stepping TVD solver for Boussinesq modeling of breaking waves and coastal inundation. Ocean Model. 2012, 43, 36–51. [Google Scholar] [CrossRef]
  35. Ren, Z.Y.; Zhao, X.; Liu, H. Dispersion effects on tsunami propagation in South China Sea. J. Earthq. Tsunami. 2015, 9, 1540001. [Google Scholar] [CrossRef]
  36. Kirby, J.T. Boussinesq models and their application to coastal processes across a wide range of scales. J. Waterw. Port Coast. 2016, 142, 03116005. [Google Scholar] [CrossRef]
  37. Li, Z.; Zhang, J.; Liu, H. Boussinesq modeling for the runup of solitary-like waves on a slope and circular island. Ocean Eng. 2021, 226, 108742. [Google Scholar] [CrossRef]
  38. Zheng, Z.; Ma, X.; Ma, Y.; Dong, G. Wave estimation within a port using a fully nonlinear Boussinesq wave model and artificial neural networks. Ocean Eng. 2020, 216, 108073. [Google Scholar] [CrossRef]
  39. Johnson, D.; Pattiaratchi, C. Boussinesq modelling of transient rip currents. Coast. Eng. 2006, 53, 419–439. [Google Scholar] [CrossRef]
  40. Goda, Y. A comparative review on the functional forms of directional wave spectrum. Coast. Eng. J. 1999, 41, 1–20. [Google Scholar] [CrossRef]
  41. Choi, J.; Kirby, J.; Yoon, S. Boussinesq modeling of longshore currents in the SandyDuck experiment under directional random wave conditions. Coast. Eng. 2015, 101, 17–34. [Google Scholar] [CrossRef]
  42. Dudkowska, A.; Boruń, A.; Malicki, J.; Schönhofer, J.; Gic-Grusza, G. Rip currents in the non-tidal surf zone with sandbars: Numerical analysis versus field measurements. Oceanologia 2020, 62, 291–308. [Google Scholar] [CrossRef]
  43. Zhang, Y.; Shi, F.; Kirby, J.; Feng, X. Phase-Resolved Modeling of Wave Interference and Its Effects on Nearshore Circulation in a Large Ebb Shoal-Beach System. J. Geophys. Res.-Oceans 2022, 127, e2022JC018623. [Google Scholar] [CrossRef]
  44. Kumar, A.; Hayatdavoodi, M. Effect of currents on nonlinear waves in shallow water. Coast. Eng. 2023, 181, 104278. [Google Scholar] [CrossRef]
  45. Zhang, X.; Simons, R.; Zheng, J.; Zhang, C. A review of the state of research on wave-current interaction in nearshore areas. Ocean Eng. 2022, 243, 110202. [Google Scholar] [CrossRef]
  46. Olabarrieta, M.; Medina, M.; Castanedo, S. Effects of wave–current interaction on the current profile. Coast. Eng. 2010, 57, 643–655. [Google Scholar] [CrossRef]
  47. Garnier, R.; Falqués, A.; Calvete, D.; Thiebot, J.; Ribas, F. A mechanism for sandbar straightening by oblique wave incidence. Geophys. Res. Lett. 2013, 40, 2726–2730. [Google Scholar] [CrossRef]
  48. Faraci, C.; Musumeci, R.; Marino, M.; Ruggeri, A.; Carlo, L.; Jensen, B.; Foti, E.; Barbaro, G.; Elsaßer, B. Wave- and current-dominated combined orthogonal flows over fixed rough beds. Cont. Shelf Res. 2021, 220, 104403. [Google Scholar] [CrossRef]
Figure 1. Topography and water depth setting map of Dadonghai. (a) Topographic map; (b) Depth setting chart.
Jmse 11 02381 g001
Figure 2. Wave direction rose diagram (all year).
Jmse 11 02381 g002
Figure 3. Numerically simulated topography and water depth setting chart. (a) Numerically simulated topography; (b) Water depth setting of the numerical topography.
Jmse 11 02381 g003
Figure 4. Comparison between simulated and measured wave height (a) and mean water level (b) at different cross-shore locations [8,9].
Jmse 11 02381 g004
Figure 5. Comparison between simulated and measured cross-shore (a) and longshore (b) time-averaged velocity [8,9].
Jmse 11 02381 g005
Figure 6. Computed spatial distributions of averaged velocities for different significant wave heights (Tp = 5.0 s).
Jmse 11 02381 g006
Figure 7. Computed spatial distributions of averaged velocities for different significant wave heights (Tp = 10.0 s).
Jmse 11 02381 g007
Figure 8. Computed spatial distributions of local averaged velocities (Tp = 5.0 s).
Jmse 11 02381 g008
Figure 9. Comparison of rip current velocity in cross-shore direction.
Jmse 11 02381 g009
Figure 10. Computed mean water levels for different significant wave heights (Tp = 5.0 s).
Jmse 11 02381 g010
Figure 11. Comparison of root mean squares of wave height in cross-shore direction (Tp = 5.0 s).
Jmse 11 02381 g011
Figure 12. Average vorticity of cases with varying incident wave heights (Tp = 5.0 s).
Jmse 11 02381 g012
Figure 13. Comparison of wave surfaces under different wave height conditions.
Jmse 11 02381 g013
Figure 14. Computed spatial distributions of averaged velocities for incident wave direction (Hs = 2.0 m, TP = 5.0 s the arrows in the figure indicate the direction of the wave).
Jmse 11 02381 g014
Figure 15. Computed mean water levels for different incident wave directions (Hs = 2.0 m, TP = 5.0 s the arrows in the figure indicate the direction of the wave).
Jmse 11 02381 g015
Figure 16. Average vorticity of cases with varying incident wave directions (Hs = 2.0 m, TP = 5.0 s the arrows in the figure indicate the direction of the wave).
Jmse 11 02381 g016
Figure 17. Comparison of wave surfaces under different angle conditions.
Jmse 11 02381 g017
Figure 18. Computed spatial distributions of averaged velocities for different bottom frictions (Hs = 2.0 m, Tp = 5.0 s, θ = 0°).
Jmse 11 02381 g018
Figure 19. Comparison of wave surfaces under different bottom friction conditions.
Jmse 11 02381 g019
Figure 20. Comparison of rip current velocities in cross-shore direction.
Jmse 11 02381 g020
Figure 21. Computed spatial distributions of averaged velocities for different water depths in different channels (Hs = 2.0 m, Tp = 5.0 s, θ = 0°).
Jmse 11 02381 g021
Table 1. Statistics of characteristic values of wave elements.
Month123456789101112
Mean monthly wave height (m)1.11.00.80.90.80.91.00.80.71.20.91.2
Mean monthly wave period (s)4.64.44.14.23.84.14.34.24.34.74.04.3
Table 2. Different simulated incident wave conditions.
TestsSignificant Wave Height/mPeak Period/sIncident Angle/(°)Cd
10.75500.0025
21500.0025
31.5500.0025
42500.0025
52.5500.0025
60.751000.0025
711000.0025
81.51000.0025
921000.0025
102.51000.0025
1125100.0025
1225200.0025
132500.02
142500.04
Disclaimer/Publisher’s Note: The statements, opinions and data contained in all publications are solely those of the individual author(s) and contributor(s) and not of MDPI and/or the editor(s). MDPI and/or the editor(s) disclaim responsibility for any injury to people or property resulting from any ideas, methods, instructions or products referred to in the content.

