Article

A Four-Year Video Monitoring Analysis of the Posidonia oceanica Banquette Dynamic: A Case Study from an Urban Microtidal Mediterranean Beach (Poetto Beach, Southern Sardinia, Italy)

1
Coastal and Marine Geomorphology Group (CMGG), Dipartimento di Scienze Chimiche e Geologiche, Università degli Studi di Cagliari, Cittadella Universitaria, 09042 Monserrato, Italy
2
Istituto per lo Studio Degli Impatti Antropici e Sostenibilità in Ambiente Marino (IAS)—CNR—Località Sa Mardini—Torregrande, 09170 Oristano, Italy
3
Dipartimento di Ingegneria Civile, Ambientale e Architettura, Università di Cagliari, Via Marengo 2, 09123 Cagliari, Italy
*
Author to whom correspondence should be addressed.
J. Mar. Sci. Eng. 2023, 11(12), 2376; https://doi.org/10.3390/jmse11122376 (registering DOI)
Submission received: 23 November 2023 / Revised: 13 December 2023 / Accepted: 14 December 2023 / Published: 16 December 2023

Abstract

:
This paper investigates the dynamics of the cross-shore extensions of banquettes, a sedimentary structure mostly made by rests of Posidonia oceanica (L.) Delile, in a sandy urban beach located in the Gulf of Cagliari, Italy, western Mediterranean. A video monitoring station was installed above the promontory south of the beach. We analysed a four-year image database and related these dynamics to wave and wind parameters (obtained from the Copernicus and ERA5 databases) from September 2016 to September 2020. Our results showed that banquette deposition occurred in concomitance with the presence of leaf litter in the surf zone associated with mild storm events. Erosion of the banquettes occurred during more intense storms. When leaf litter was not present in the surf zone, banquettes were not deposited even with mild storms. Wind can influence the banquette dynamics: under certain conditions of speed intensity, the banquettes may be removed offshore, supplying litter in the surf zone, or they may be covered by sediment. The permanence of the banquettes on the beaches also depended on their composition: when the banquettes were intertwined with reeds, their removal by the waves did not occur even during intense storms, and this sedimentary structure can protect the beach from flooding.

1. Introduction

Mediterranean beaches are characterized, in their nearshore areas, by the presence of meadows composed by Posidonia oceanica (L.) Delile, an endemic Mediterranean seagrass species (monocotyledonous angiosperms [1,2]) that is able to fix CO2 as organic matter by subtracting it from the sea water and producing oxygen. This plant releases its leaves in the autumn [3,4,5,6].
Posidonia oceanica meadows cover between 25,000 and 50,000 km2 of the Mediterranean coastal areas, living at depths between 0 and 45 m [7,8], and they are classified as a priority habitat, known as “Posidonia beds (Posidonion oceanicae)”, which are protected, both alive and dead, by [9]. These meadows host the most productive marine ecosystem in the Mediterranean [10,11], acting as a nursery and habitat for a lot of fish species, invertebrates, foraminifers, etc., some of which are calcified and when they die, upon which their remains form an autochthonous sediment [12]. Depending on their leaf density, the P. oceanica meadows can dissipate wave energy during storm events and may reduce the speed of coastal currents, promoting the sedimentation of particles in transport [12,13,14,15,16,17], etc. Anthropogenic disturbance is one of the main causes of the degradation of the seagrass meadows all around the Mediterranean Sea, such as increased turbidity, pollution, harbour construction, and anchors [18,19].
Posidonia oceanica rests, composed of leaves, roots, and rhizomes, can be transported by waves and currents to the foreshore and backshore, building wedge sedimentary structures that range from a few centimetres to several meters thick, known as banquettes [20,21,22] or seagrass berms [23,24] (Figure 1). Banquettes can be regarded as sedimentary structures resulting from the accumulation of sand and the other of seagrasses, mostly P. oceanica, at the extreme landward area of wave influence [24]. The composition and granulometry of the sand can vary from beach to beach, just as the percentage of sand can be up to 70% of the total weight of a banquette [25], or ranging from 0.5 to 85% depending on the exposure of the location, hydrodynamics, granulometry, and morphology of the beach [26]. The edification of banquettes may also be related to the availability of leaf litter derived from nearby P. oceanica meadows (Figure 1) [7,22,24,27,28].
To promote touristic activities and for aesthetic reasons, along several Mediterranean beaches, banquettes are removed from dry beaches from late spring to early autumn [21,29,30,31,32,33,34]. Removal operations can also be conducted with heavy machinery such as bulldozers [29].
The deposition and erosion dynamics of banquettes and their composition has been widely investigated by several studies along Mediterranean sandy beaches [24,25,27,35,36,37,38,39], etc. In the last twenty years, the development of coastal video monitoring technologies has improved the knowledge of beach morphodynamics, including banquette dynamics [28,40]. In particular, video monitoring systems were used for: (i) the development of an automated methodology to identify and map banquettes [38]; (ii) assessing the role of banquettes in wave energy dissipation during the swash processes by measuring the wave runup [41]; (iii) the importance of banquettes in countering erosion on particularly fragile Mediterranean beaches such as pocket beaches [40]; and (iv) assessing the shoreline accretion induced by the deposition of beach-cast litter by short-term analysis [28]. (v) These systems are also used for validating the outputs of coastal hydrodynamic models [42,43].
The debate on the role of banquettes in dissipating wave energy is still open. Gómez-Pujol [27] argues that banquettes have little or no effect on wave dissipation as they are dismantled before storms arrive. Other authors [41] highlight how the presence of banquettes affects the swash processes, making the beach profile more reflective.
The present study investigates, by analysing a four-year database of daily images, the deposition and erosion of banquettes along three transects of an urban, microtidal, and wave-dominated Mediterranean beach located in the southeast of Sardinia, Italy, western Mediterranean (Poetto beach, Figure 1). Using geo-rectified images, we measured the cross-shore extensions of the banquettes along three transects for each day and then related their movements with wave and wind parameters. This allowed us to highlight which processes are most involved during deposition events and which in those of removal.

2. Materials and Methods

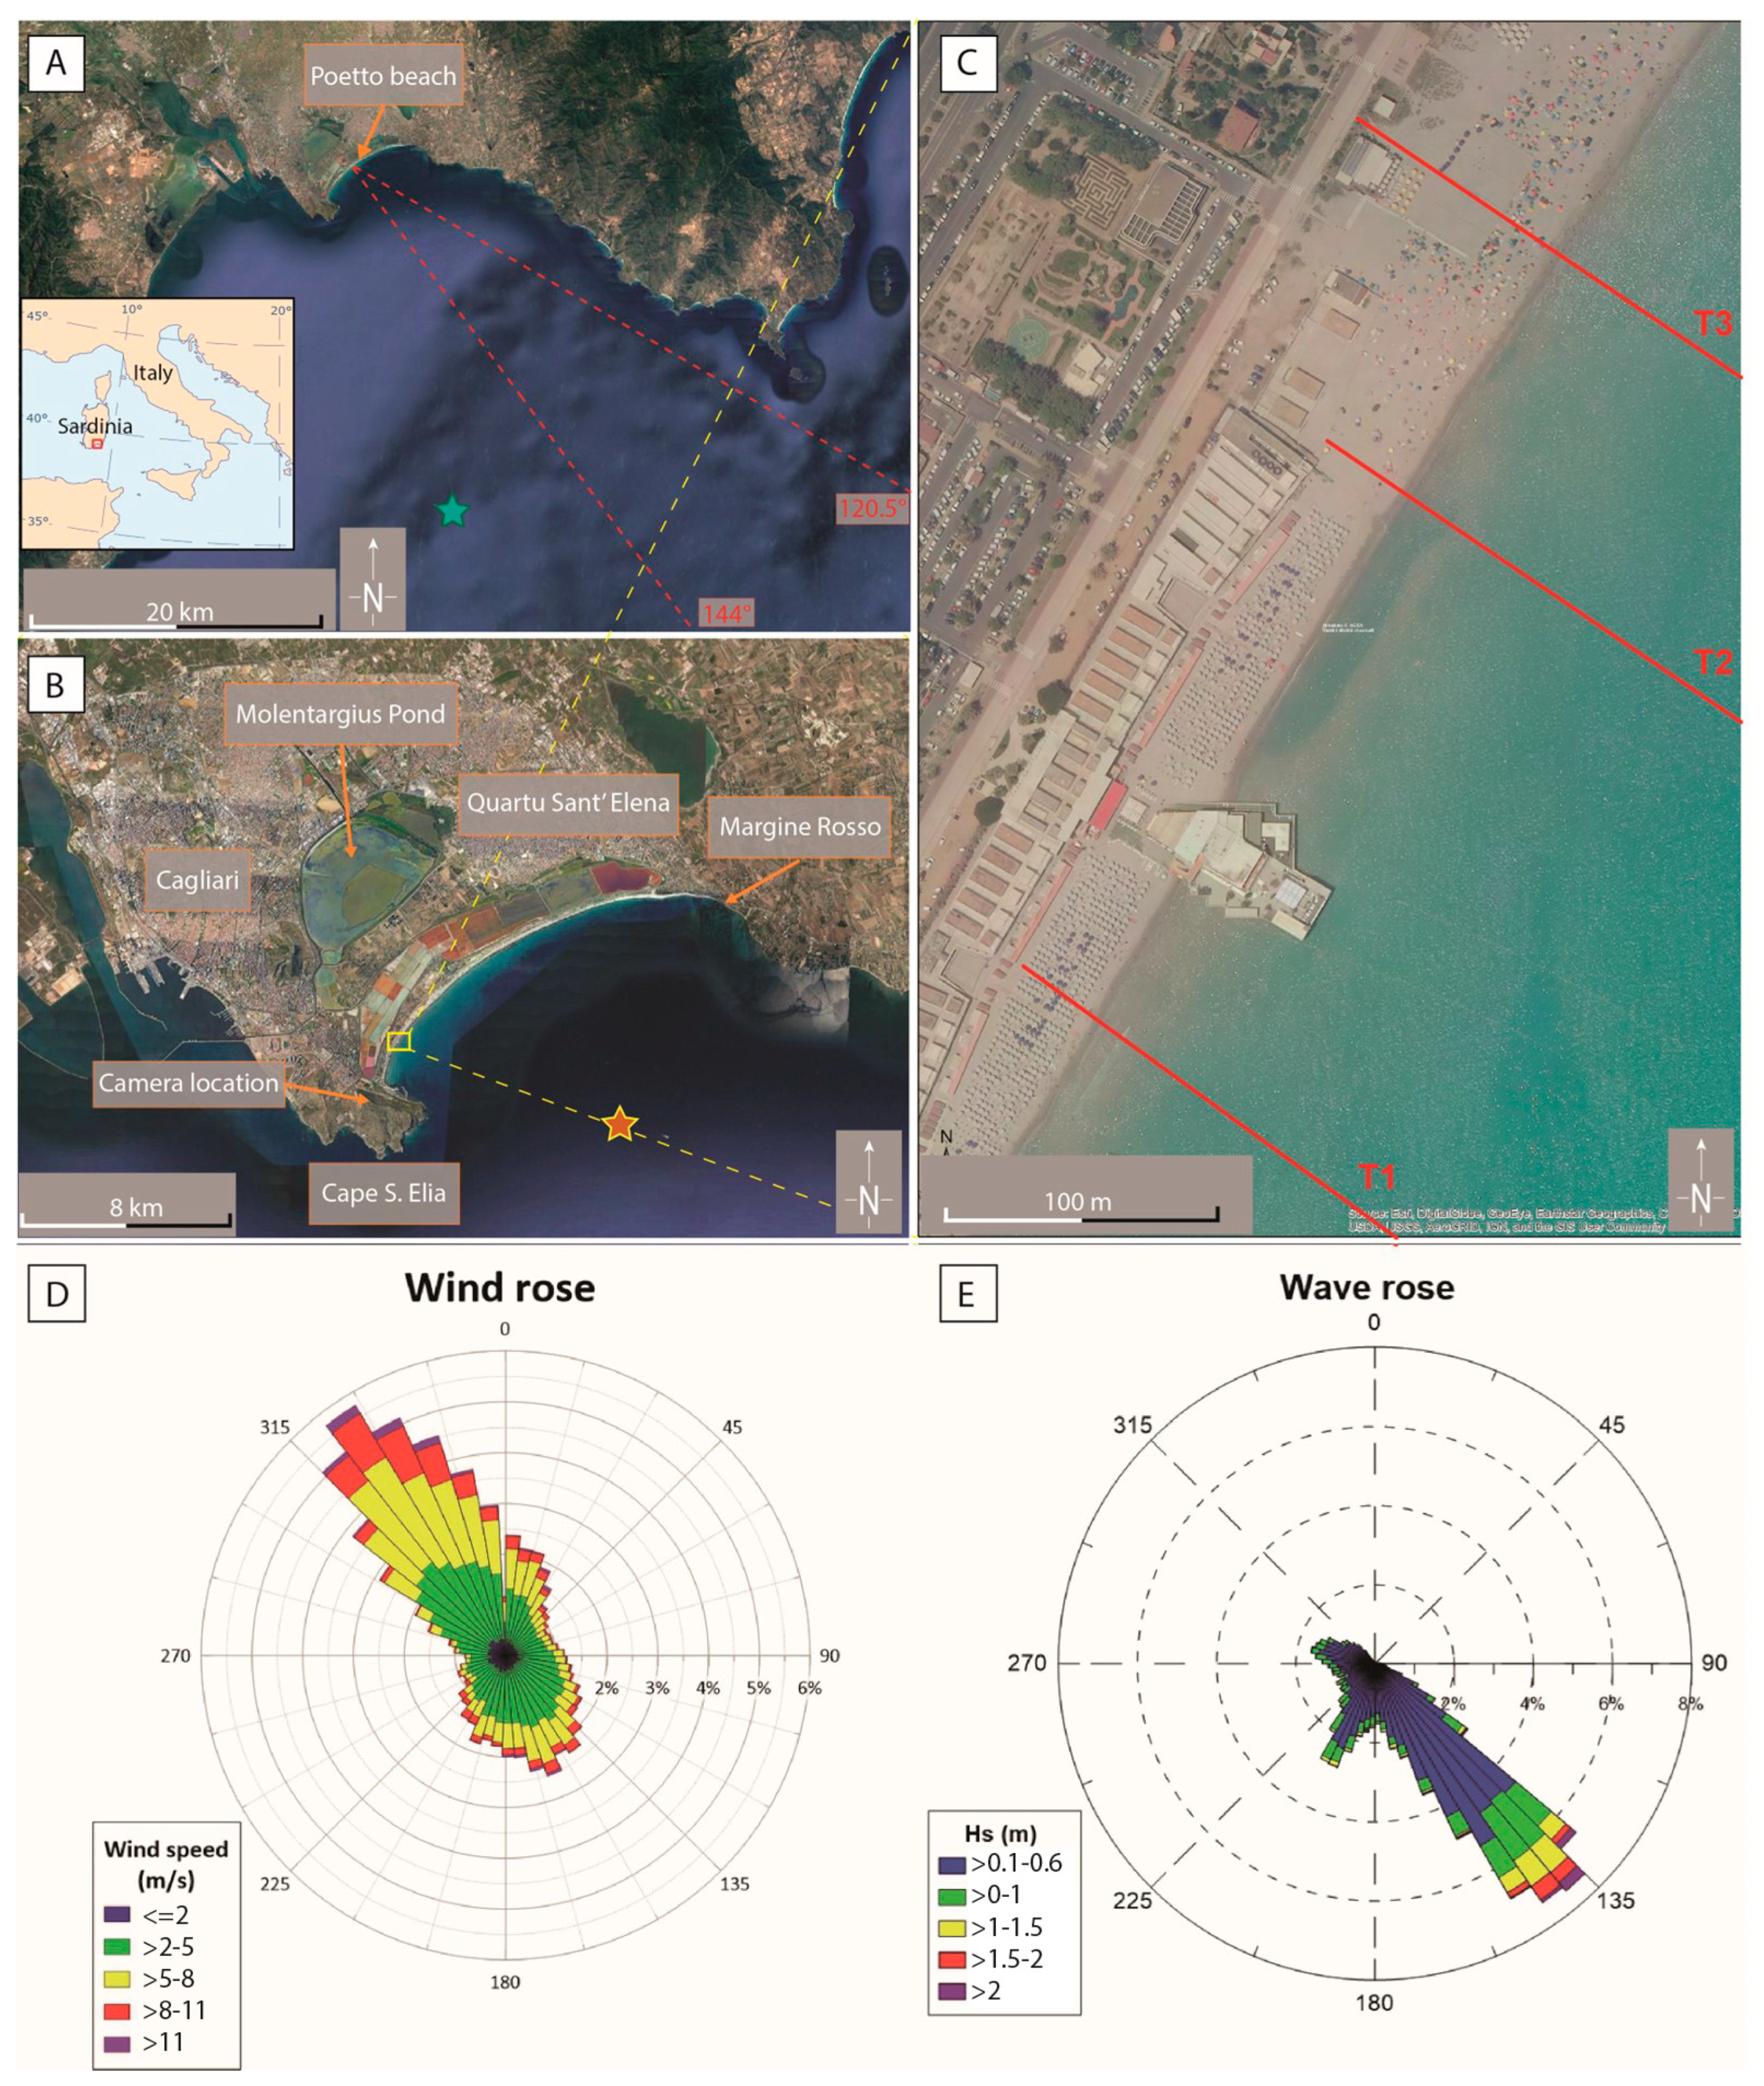
2.1. Geographical Settings, Wave Climate, and Hydrodynamics of the Study Area

Poetto is a sandy beach that has a length of 8 km and a maximum width of about 100 m; it is confined on the southwest side by the Cape S. Elia promontory and on the east by the Margine Rosso area (Figure 2). A residential neighbourhood and a 4-lane motorway interrupt the natural beach profile, mainly in the area that would naturally be the dune system. No river flows across the beach, and there is not a direct terrigenous-sedimentary supply, except for a poor contribution made by the erosion of the carbonate and siliciclastic rocks of the Cape S. Elia promontory [17], Figure 2B. The Poetto submerged beach is characterized by fine sands, and an extended P. oceanica meadow has colonized the sea bottom from a depth ranging between 6 and 15 m (Figure 1) [17].
The carbonate fraction of the sediment has increased since 2002 due to nourishment carried out in the southwestern sector of the beach by a dredger, which dumped bioclastic sediment on the beach with a different grain size from the original sediments. The nourished material was redistributed and levelled with bulldozers [44,45].
An ancient Poetto beach started to form approximately from seven to five thousand years ago, when a heat peak called the ‘Holocene climatic optimum’ brought the sea level to a few tens of centimetres above its current level [46], allowing for the formation of the barrier system that evolved into the current sandy coastline with a brackish water body of a Molentargius pond system behind [7,45,47]. Poetto beach can be classified as a microtidal beach because the average tidal range is less than 20 cm, but this can reach a maximum of about 40 cm during spring tides [48].
The dominant geographical fetch ranged from 120° to 145°, with a maximum extension of 1360 km (Figure 2A,B). However, the limited extent of cyclonic perturbations in the Mediterranean suggests considering, in any case, maximum effective fetches of 500 km [49]. A 2016–2020 set of wave data delivered by the Copernicus Marine Environment Monitoring Service [50] was used to characterize the wave climate of the area (access data: 20 May 2021, Figure 2E). Korres et al., 2021 reported the excellent ability of the CMEMS database in terms of wave height and period predictions across the Mediterranean Sea. Comparing wave computations with the measurements collected by the Cagliari buoy, located in the eastern sector of the Gulf of Cagliari, they found an RMSE of 0.19 m and a correlation of 0.92. We extracted the wave parameters (significant wave height Hs, peak period Tp, mean period Tm, and mean direction) at the grid node of coordinates at 39°18′47″ N, 9°20′51″ E (orange star in Figure 2B) at a depth (h) of 18 m and considered them as representative conditions of the incoming sea states [33].
The wind speed and direction data came from the ERA5 reanalysis dataset [51], (access date: 20 September 2023). ERA5 is the latest climate reanalysis produced by the European Centre for Medium-Range Weather Forecasts, and we extracted the wind parameters, provided every hour at the grid node of coordinates at 39°00′00″ N, 9°25′00″ E, Figure 2A. The wind rose in Figure 2D shows that in the study area, the predominant wind comes from the fourth quadrant (corresponding to an offshore wind). This wind blows with greater intensity and frequency than those from other directions.

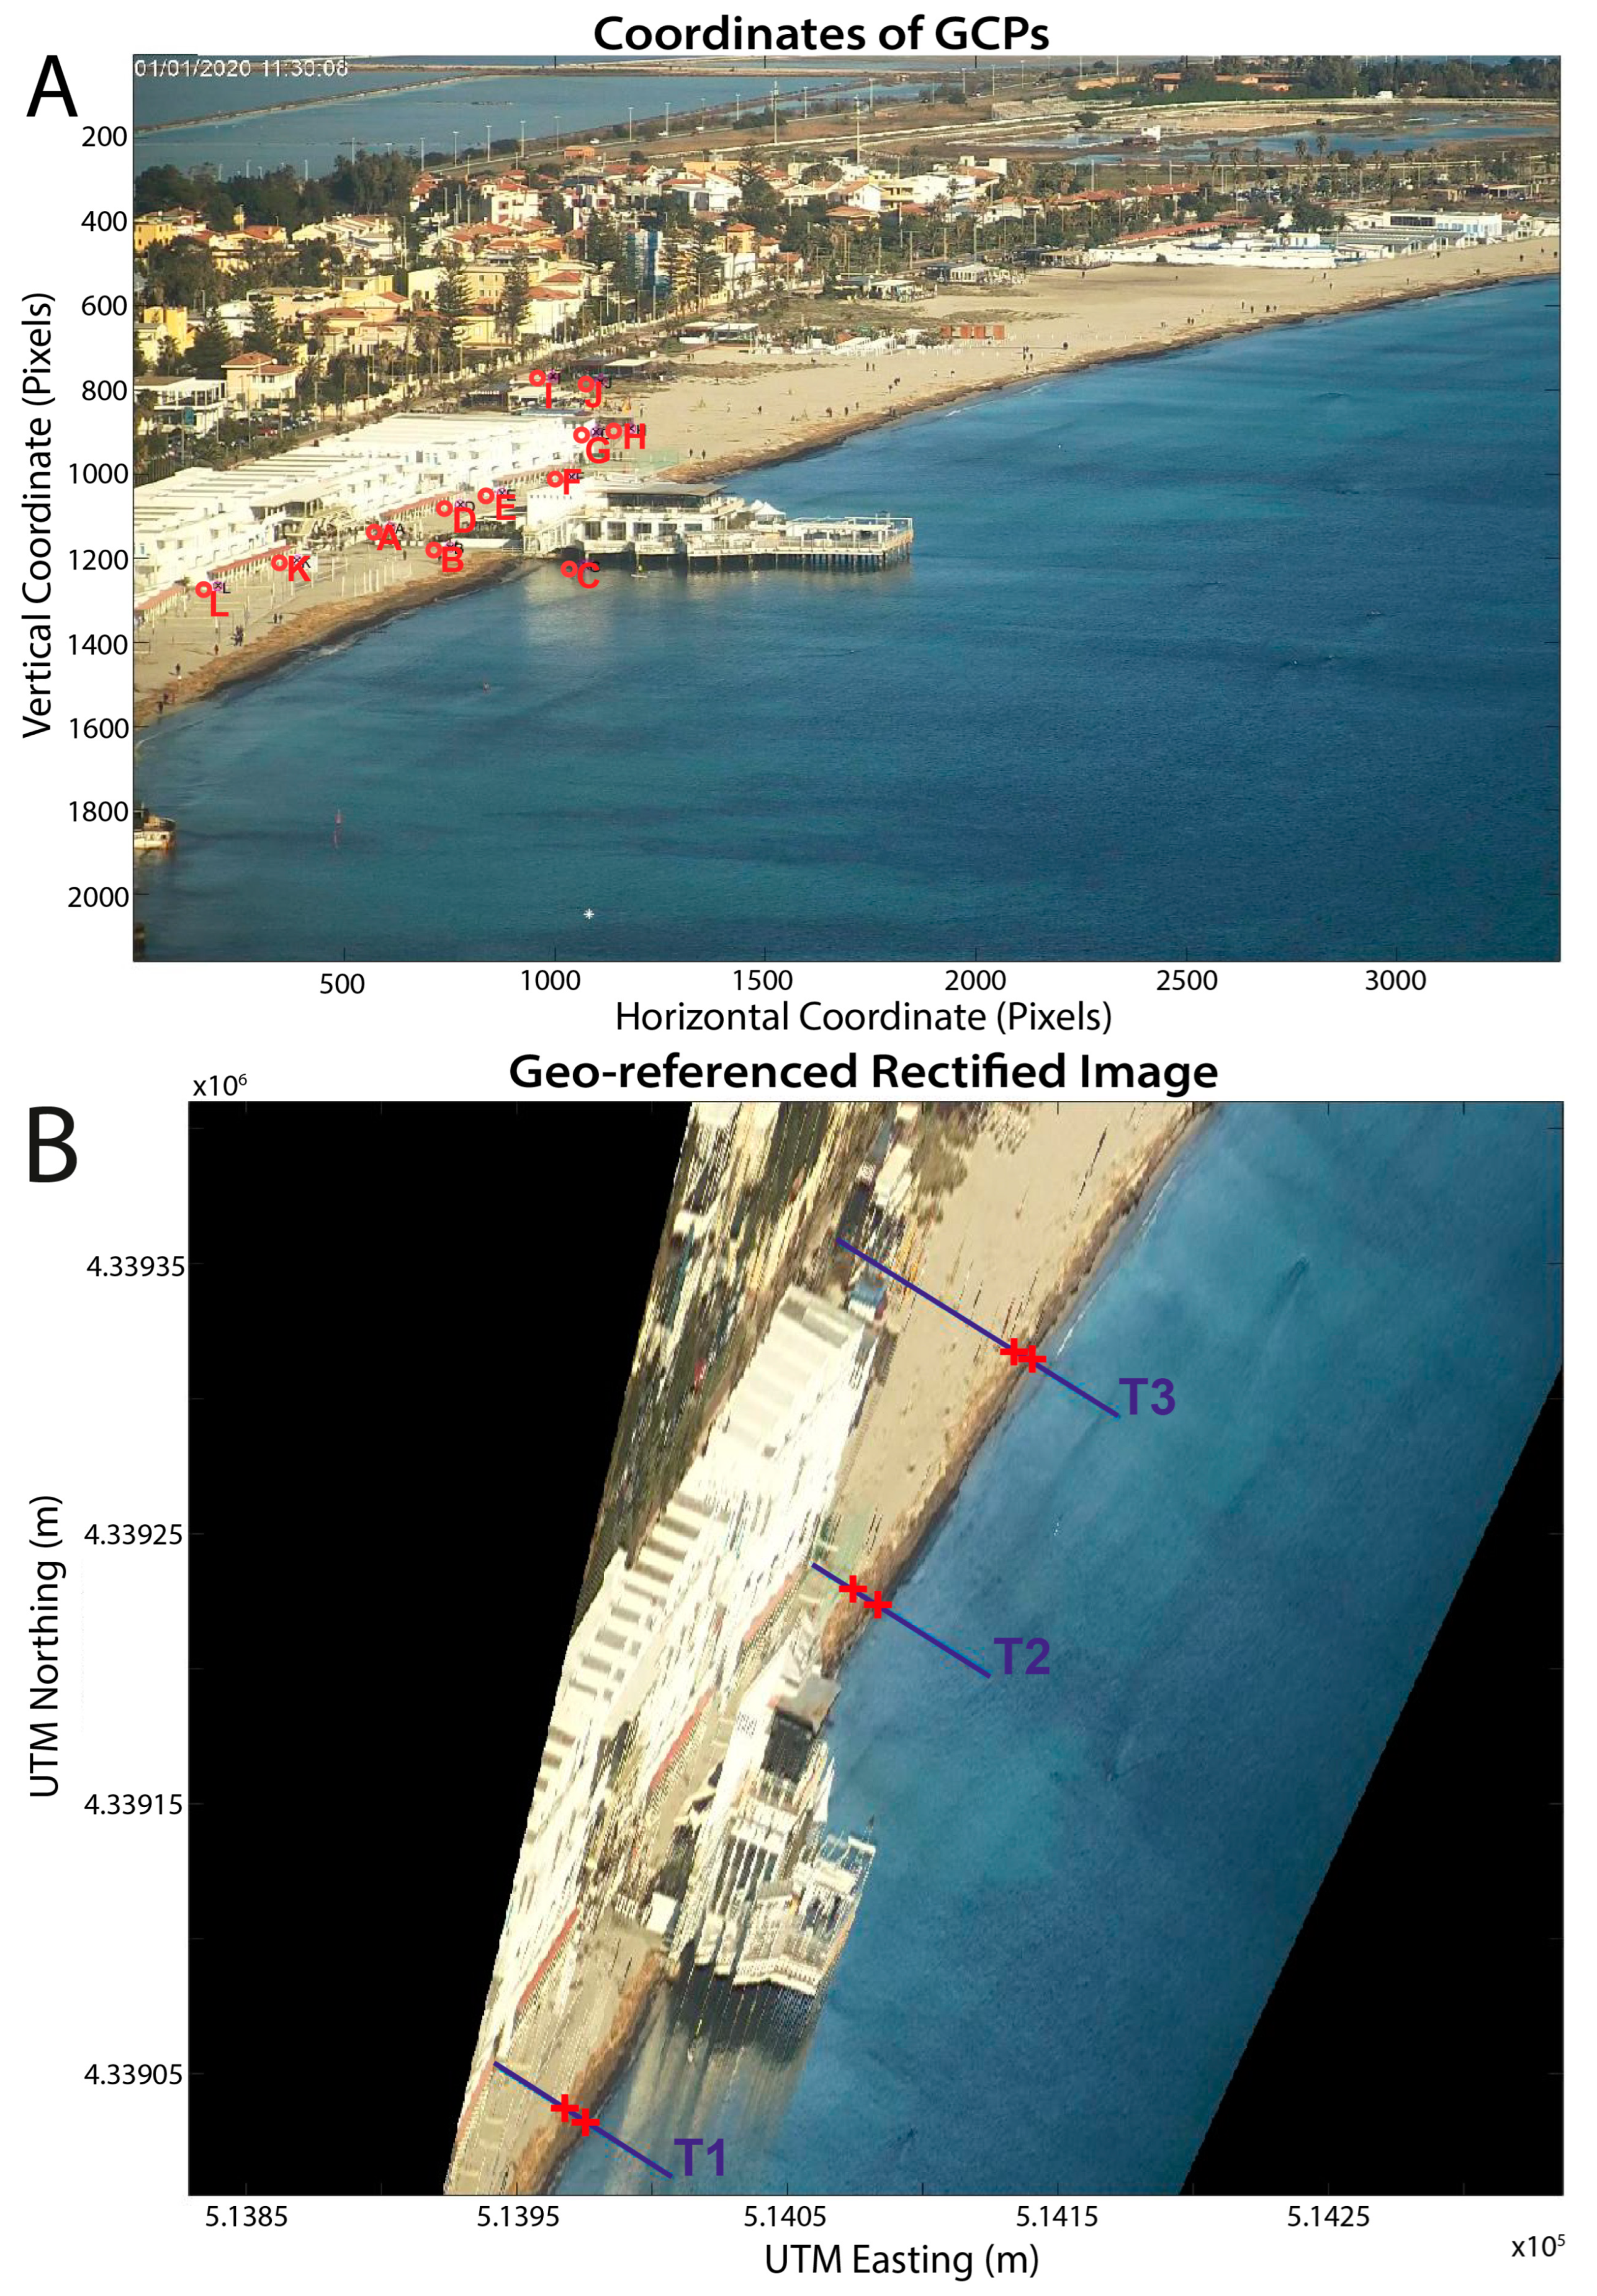
2.2. Video Monitoring System Settings and Wave Energy Flux Computation
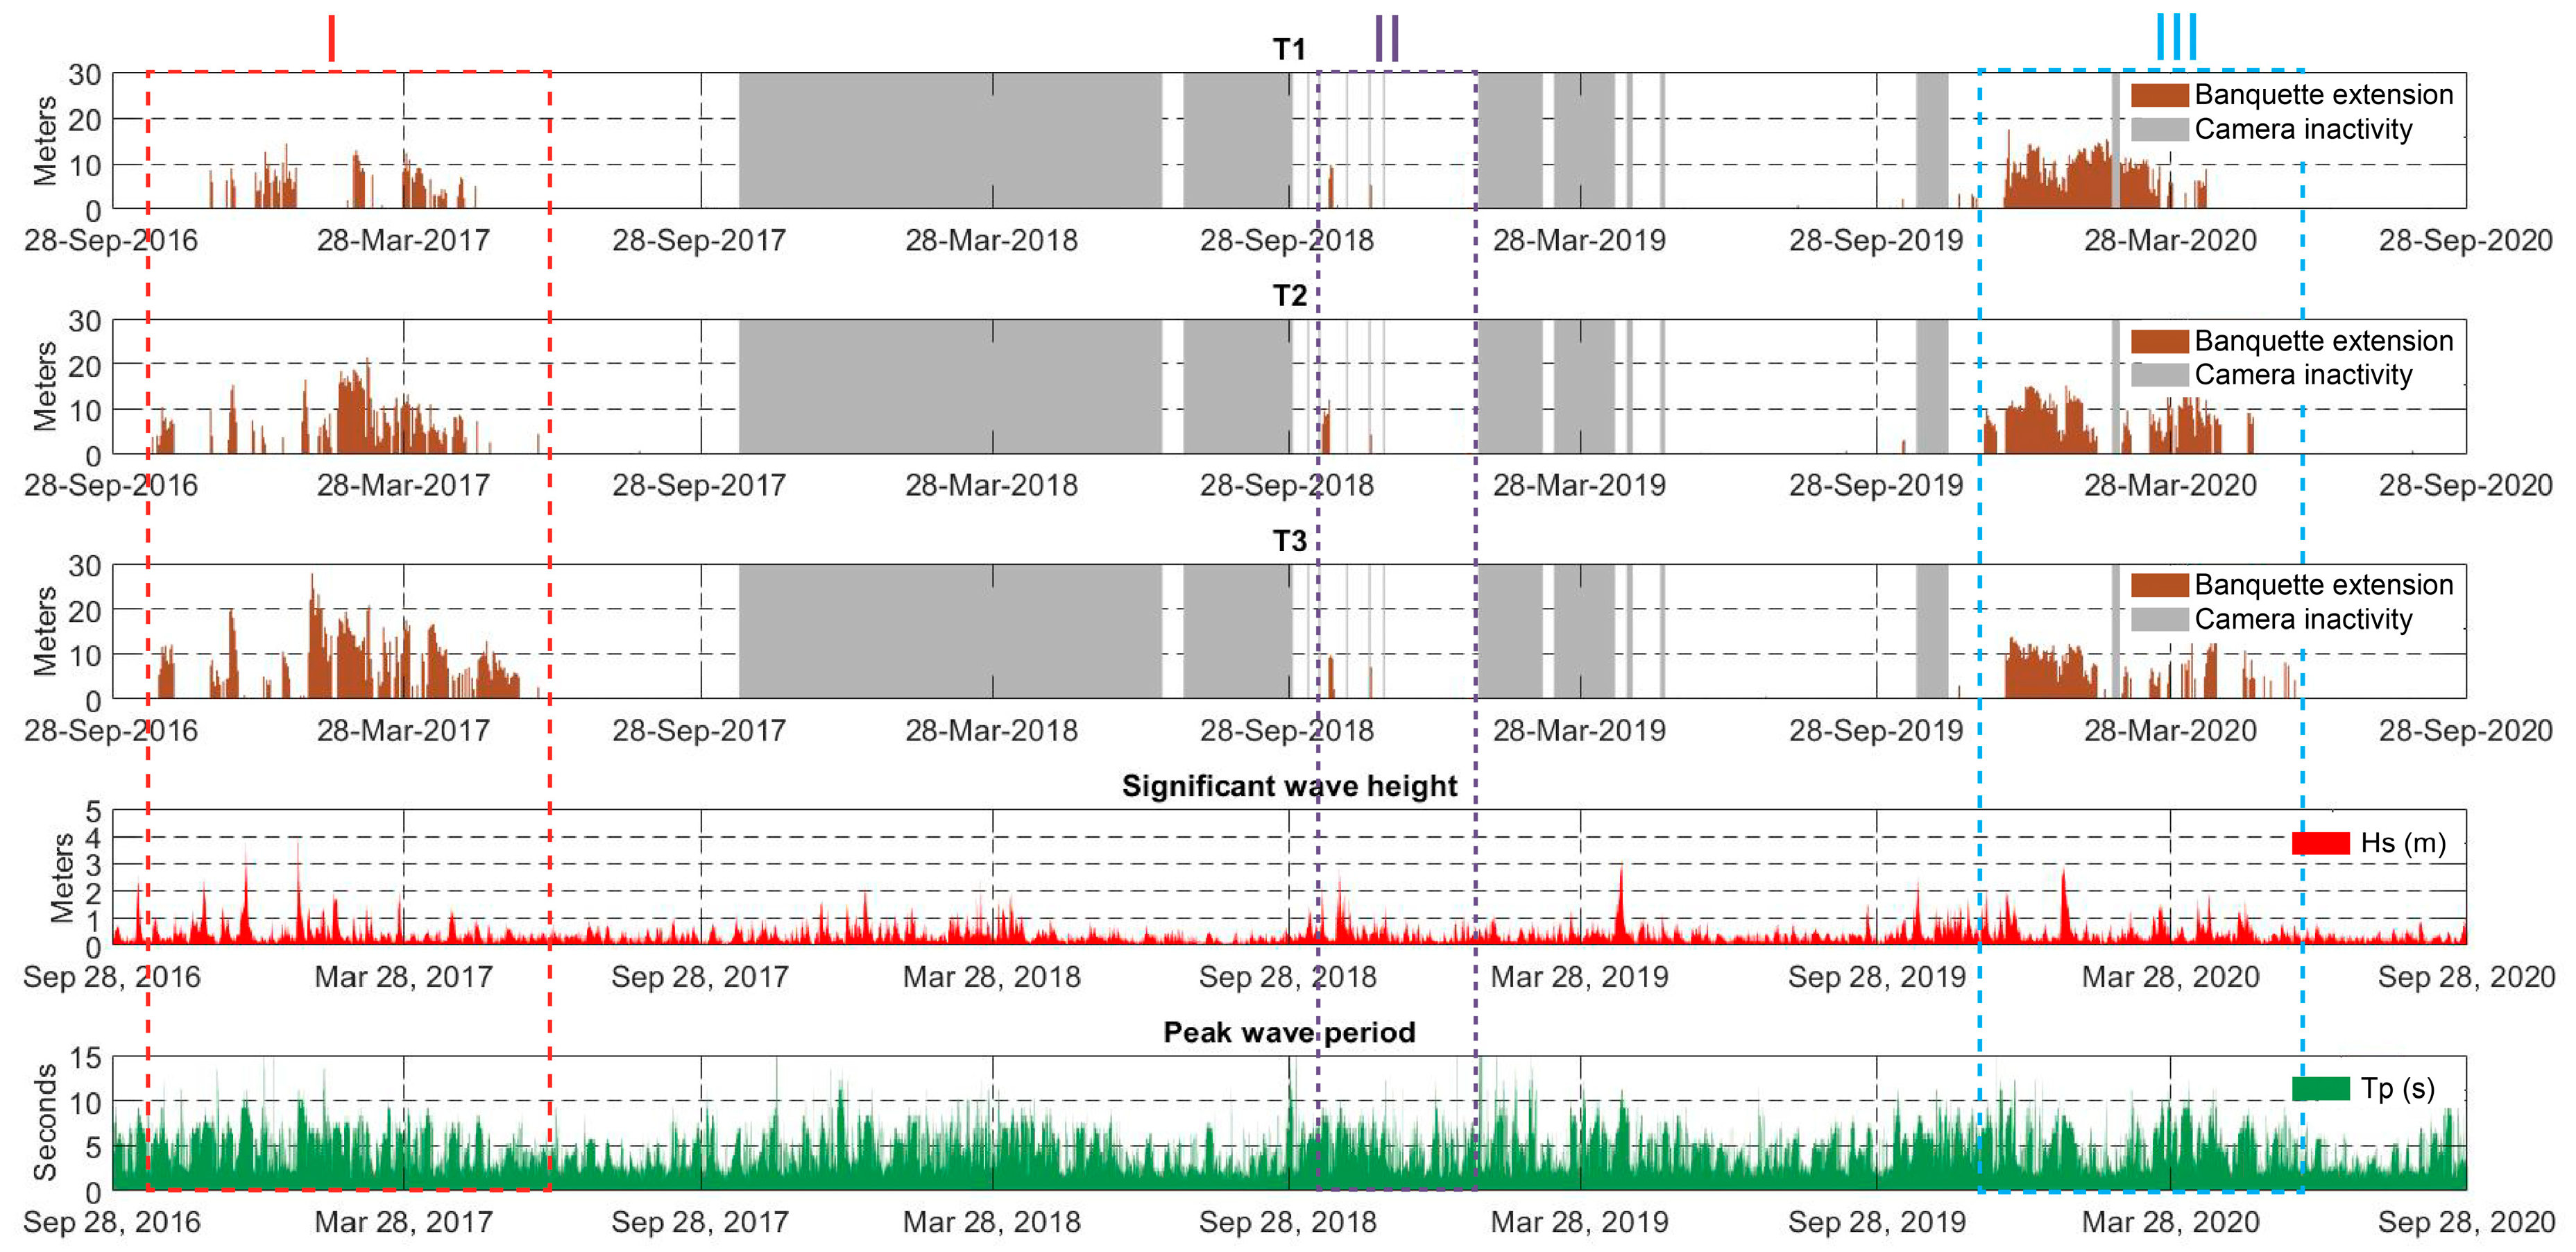
A video monitoring system was used to detect the presence of banquettes on the emerged beach to measure their cross-shore extensions. The video monitoring system was composed of a digital 12-megapixels ultra-HD network camera (Dahua Technology, model DH-IPC-HF81200E), which ensured a high-resolution dataset. The camera was installed on the Sella del Diavolo Promontory (39°11′24″ north, 9°09′30″ east) at a height of 125 m above SWL (Figure 1A and Figure 2B) using an existing steel support from a previous video monitoring system and powered by photovoltaic panels [48,52,53]. The images were corrected from the distortions induced by the camera lens by using the procedure followed in [53]. For this study, we took a single snapshot for each day, from 28 September 2016 to 28 September 2020, and the acquired images, once corrected for lens distortion, were rectified and georeferenced by the means of 12 ground control points (GCPs) obtained through the analysis of orthophotos of “Sardegna Geoportale”, an open-source geodatabase made by “Regione Autonoma della Sardegna” [54], access date 1 March 2021. In this way, we obtained the coordinates (Datum WGS84, Projection UTM 32N) of points that are fixed in time, such as edges of buildings, visible from the oblique images of the camera. For each GCP, the image coordinates in pixels were associated with real-world ground coordinates. The correspondence between the GCP images and ground coordinates was found manually by the operator (Figure 3A). The resulting plan view images were created on a grid of 0.15 × 0.15 m. The root mean squared error for the GCPs for the longitude and latitude were RMSEE = 0.13 m and RMSEN = 0.38 m, respectively.
Once the images were elaborated, the cross-shore extensions of the banquette along three transects (T1, T2, and T3 in Figure 2C) were manually measured (Figure 3B). Due to the lens correction and the pixel resolution, we were able to measure the cross-shore extension of the banquettes, converting the distance from pixels to meters. A time series with these extensions was conducted for each transect, showing when each banquette was built and how wide it was. The deposition and erosion of the banquettes along Poetto beach was then analysed along the three virtual transects (T1, T2, and T3 in Figure 2C) developed from the landward limit of the beach up to the shoreline.
Figure 2C and Figure 3B show the location of each transect along Poetto beach. T1 was about 35 m long and was located beyond a bathing establishment building. Transect T2 was about 38 m long and was located beside the above-mentioned building close to the northeast side. Two smaller buildings were present in the back-beach area of T2. Transect T3 was about 92 m long, and no buildings were present in the back-beach area of T3 (Figure 2C). The distance between T1 and T2 was 220 m, and the distance between T1 and T3 was 350 m.
During the four years of data acquisition (1462 days), the video monitoring system was able to record 1016 daily images, from which both the banquette deposition and the presence or absence of floating leaf litter (recognised in the images as a dark area in the surf zone) were detected, whereas for 446 days, the system was affected by malfunctioning. This occurred mainly between October 2017 and July 2018. Furthermore, video monitoring acquisitions were often combined with field surveys.
The energy flux was also calculated based on the wave parameters obtained by the CMEMS database. From the peak waves period (Tp), obtained from the virtual buoy of the CMEMS system, the deep-water wavelength (L) was calculated using the linear wave equation:
L = g T p 2 2 π
where g is the gravity acceleration. Then, the celerity group (Cg) was computed by the following formula, as derived from the linear wave equation:
C g = L T p 0.5 1 + 2 k h sin h 2 k h
where k is the angular wave vector k = 2 π L and h is the water depth at the virtual buoy. Finally, the wave energy flux was computed by the formula [55]:
E n e r g y   f l u x = ρ g 2 H s 2 16 C g
where ρ is the water density and Hs is the significant wave height obtained by the CMEMS system.
To calculate the number of storms that occurred at the virtual buoy of the CMEMS system, we used the peak-over-threshold method following the specifications used by Ruju [33] and setting the threshold value of Hs equal to 0.8 m, which was double the average Hs calculated for the four years of observation (0.4 m).

3. Results

By the peak-over-threshold method, we identified 87 storm events, of which 58 were recorded by the video monitoring system. The most energetic storm came from the southeast and occurred between the 21st and the 22nd of January 2017, with a maximum Hs of 4 m and a corresponding peak period of 11 s (Figure 4I).
In only in 9 out of the 58 cases of storms (mean Hs at the peak of the storm = 1.3 m), the banquettes were widely developed in terms of amplitude and thickness (this latter was inferred both from the operator’s experience with video monitoring images and from field surveys) before the arrival of the storm; in another 12 storms, the banquettes occupied just a small portion of the beach. In eight out of the nine cases of storms previously mentioned with well-structured banquettes, a re-deposition occurred at the end of the storm.
In the analysis of the 1016 images, equivalent to 1016 days of acquisitions from the video monitoring system, banquettes were detected for 206 days in transect 1, for 253 days in transect 2, and for 266 days in transect 3 (brackets in Table 1). The average cross-shore extension of banquettes along the three transects was less than 8 m. The average cross-shore extension of banquettes was lower along T1 (6.3 m) with respect to the value calculated for T2 and T3 (7.5 and 7.7 m, respectively, Table 1). The maximum cross-shore extension followed the same pattern (Table 1), whereas the variability, measured as the standard deviation of the cross-shore extension of banquettes, was higher in T3 (Table 1).
Figure 4 shows the cross-shore extension of banquettes along the three transects, the wave height (Hs), and the peak period (Tp) for the whole period of monitoring. Figure 4 highlights that along the three transects, banquette deposits were detected from autumn 2016 to spring 2017 and from autumn 2019 to spring 2020. Due to the inactivity of the video monitoring system, no data were recorded for the same period in 2017–2018 and for spring 2019. From May to September, the beach was usually cleaned, and this may explain the absence of banquettes detected for that period along the three transects (Figure 4).
Three periods when banquettes were present on the beach and detected along the three transects were selected and are described in detail in Section 3.1, Section 3.2 and Section 3.3, leaving out the periods without banquette deposits and the periods of camera inactivity.

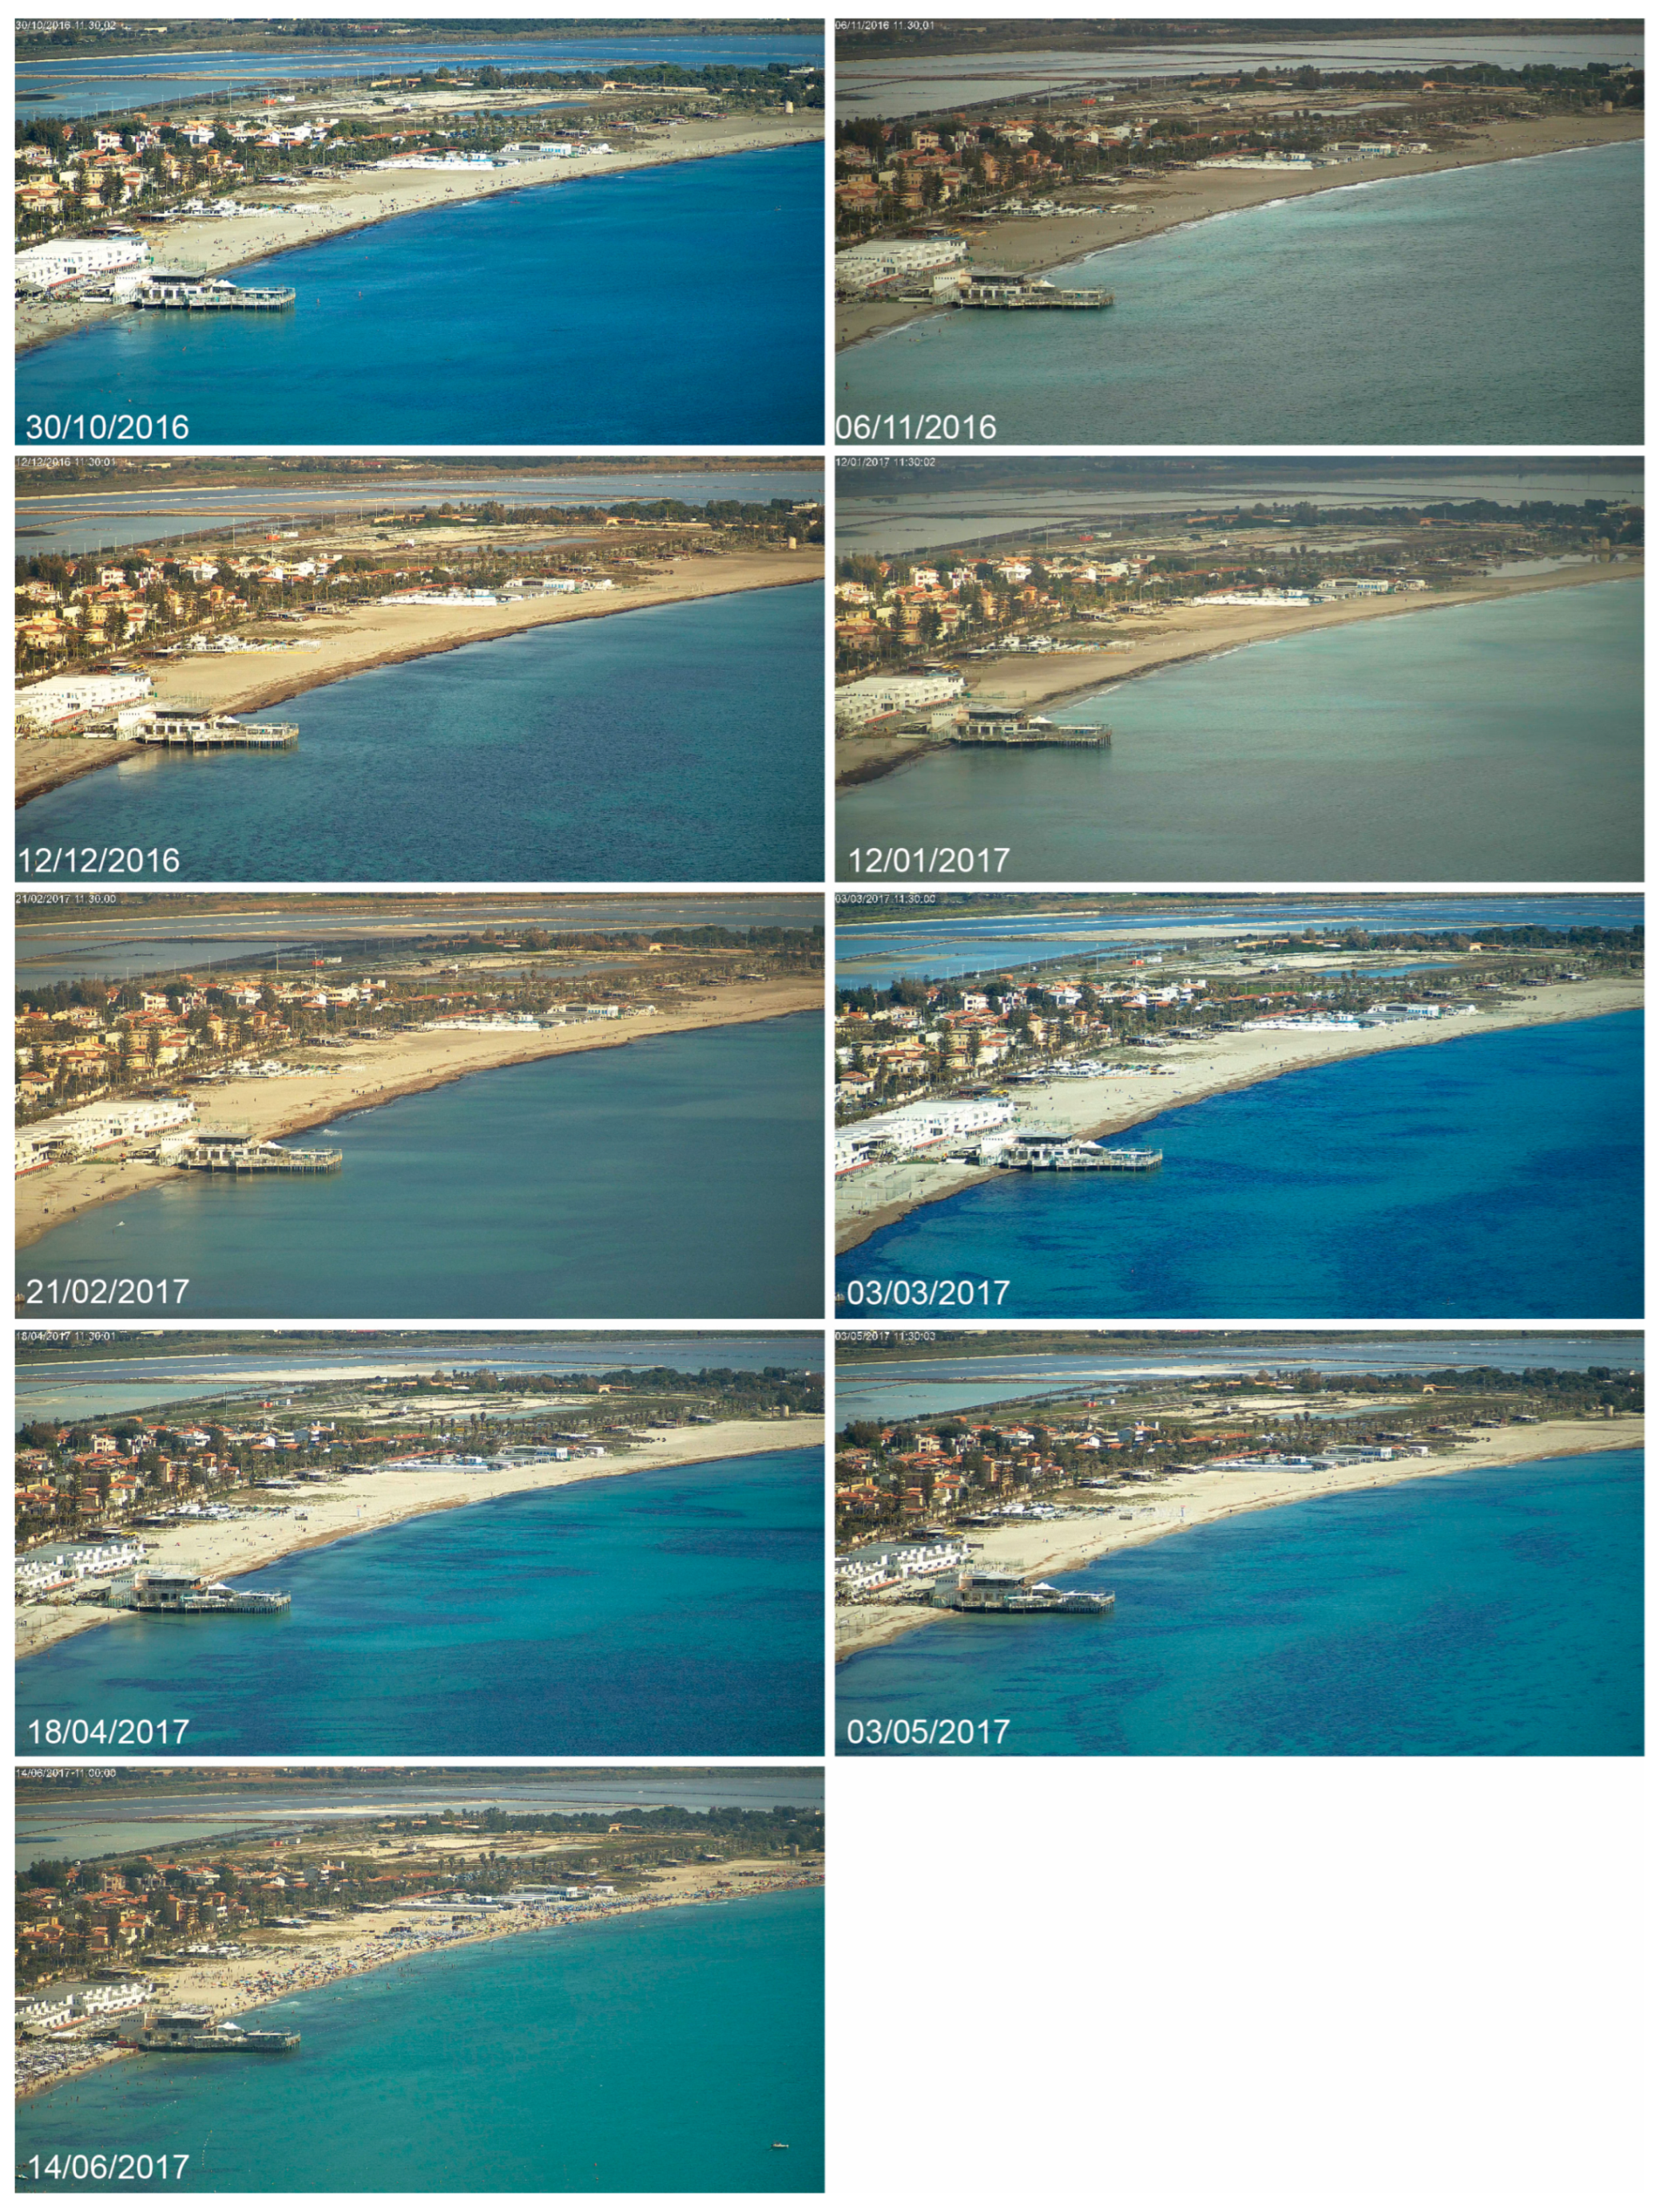
3.1. First Period, from the 20th of October 2016 to the 20th of June 2017

During this period, the deposition of banquettes occurred and was detected along the three transects. The depositional pattern was similar for T2 and T3, while generally smaller deposits were detected at T1 (Figure 5).
In T3, the banquette remained until early June 2017, after which it disappeared, probably due to beach cleaning. By analysing the graph of Hs, it is evident that as a result of a storm, identified by a peak in the Hs graph, banquettes were not detected along the three transects. It is also evident that the deposition of banquettes along the three transects was generally detected during time intervals enclosed between the two peaks of Hs. During this period of observations (from October 2016 to June 2017), the video monitoring system was able to detect large accumulations of Posidonia oceanica floating leaf litter present in the surf zone of the beach, as shown in Figure 6.

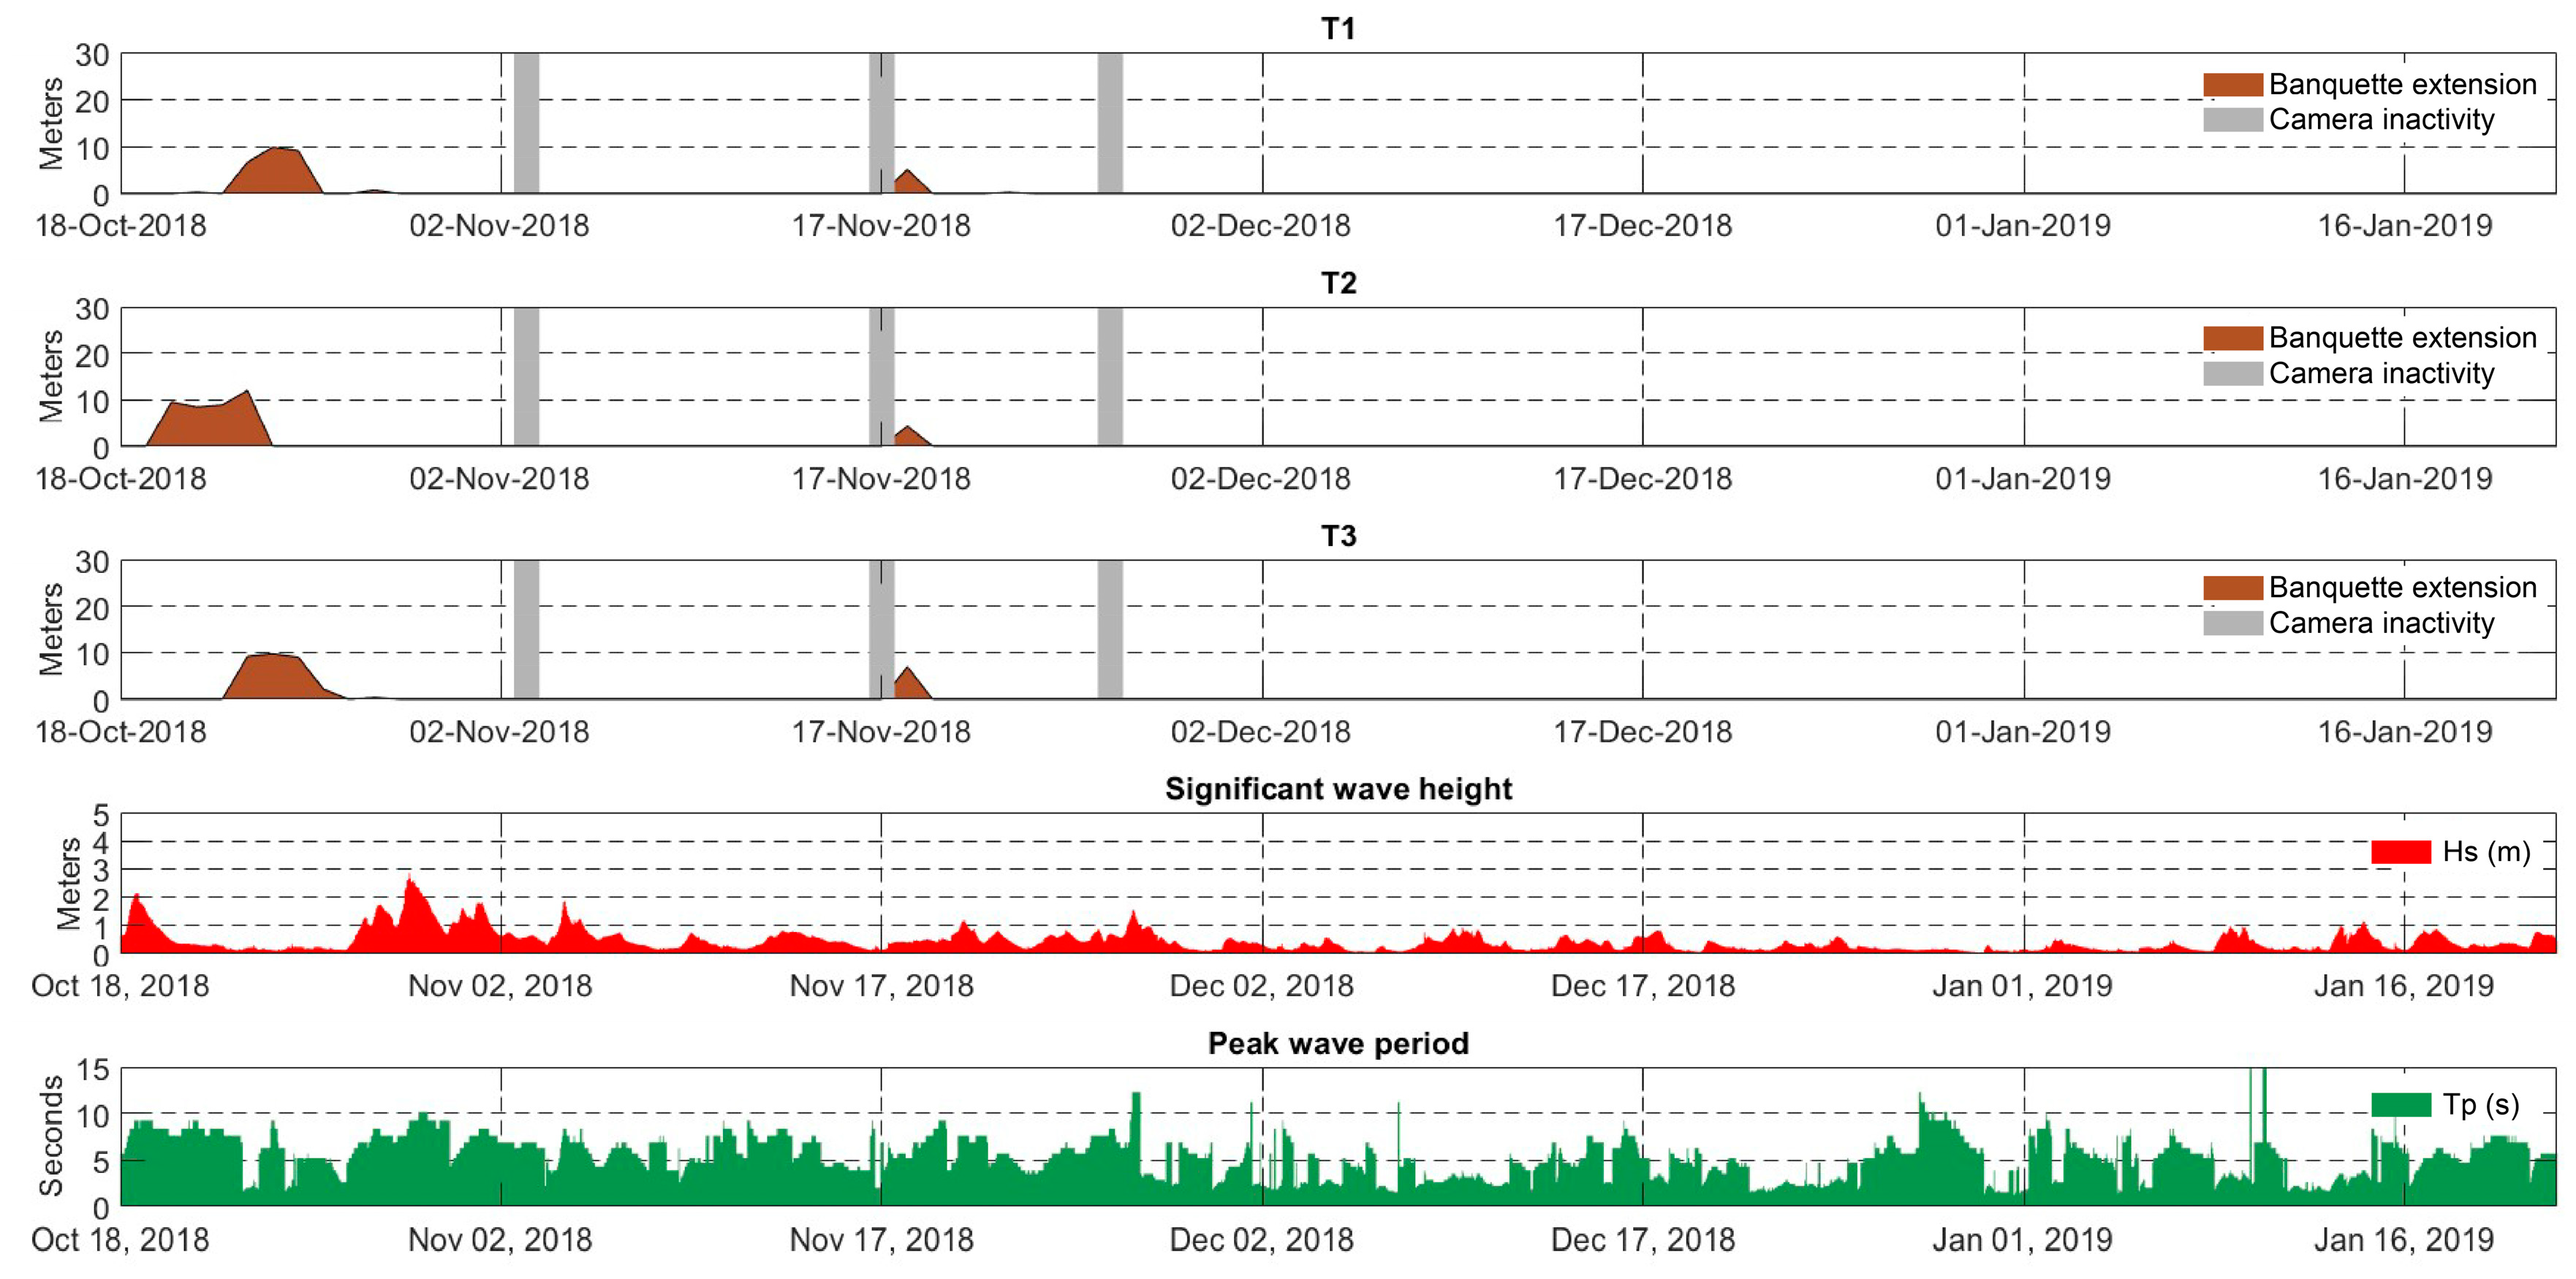
3.2. Second Period, from the 18th of October 2018 to the 22nd of January 2019

The second period (Figure 4-II and Figure 7) was the shortest of the examined periods and was from the 18th of October 2018 to 22nd of January 2019. This period was characterized by a low Hs, and only two main storms occurred. The first occurred on 18th of October 2018, and the second occurred between the 28th and the 29th of October 2018 (Figure 7). After the first one, a deposition of banquettes for a cross-shore extension of about 10 m was detected along the three transects. Before the second storm, the banquettes were totally removed and were no longer detected along the three transects. At the end of the second storm, which overwashed the beach berm and flooded the backshore, no banquette deposition occurred in any transect. In this period of observations (from October 2018 up to January 2019), despite the relatively low energy in terms of Hs, only a small number of of banquettes were deposed, and banquettes were detected just for one day on the 19th of November 2018. During this period, the presence of floating leaf litter was detected only in October 2018, when the presence of banquettes was also detected in the emerged beach (Figure 7 and Figure 8).

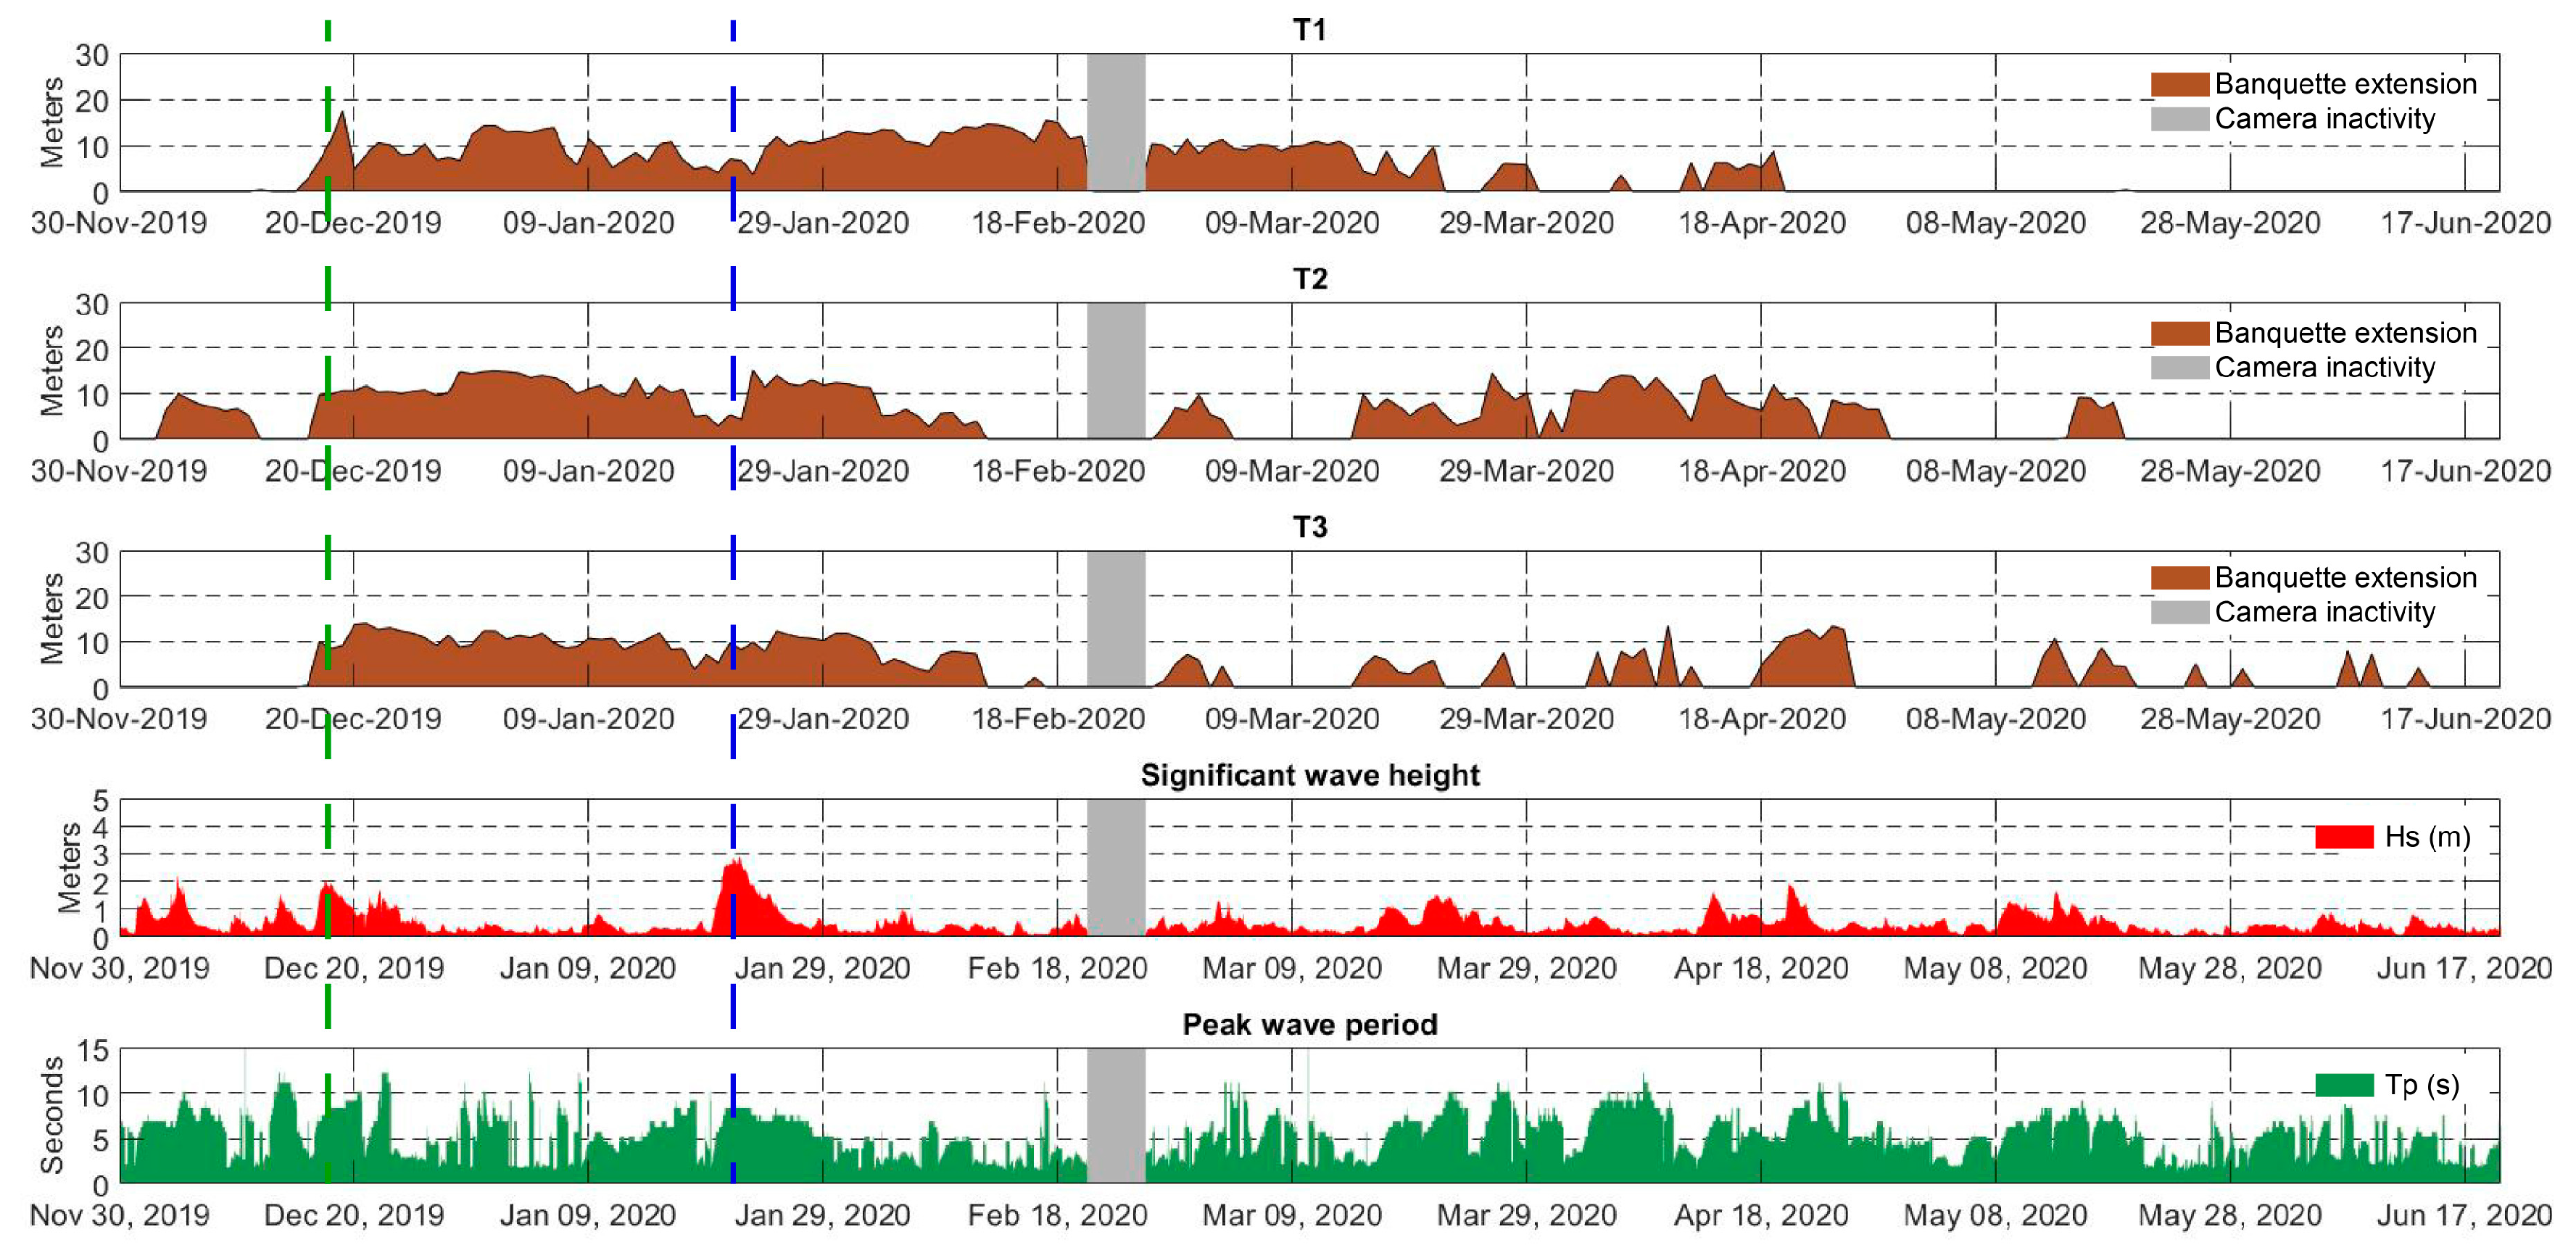
3.3. Third Period, from the 30th of November 2019 to the 20th of June 2020

During the last period (Figure 4-III and Figure 9), in addition to the P. oceanica banquettes, a huge deposition of Arundo donax reeds occurred between the 18th and the 19th of December 2019. A heavy rainfall event caused a rapid increase in the flow of local streams, which set in motion and transported a large amount of reeds into the sea. This material was transported by currents and then deposited during a storm that occurred between the 19th and 20th of December 2019 on Poetto beach (green lines in Figure 9). These plant rests, which intertwined with the banquettes, formed a sedimentary structure that was developed along the berm area (Figure 10) and that was detected along the three transects by the video monitoring system and also subsequently monitored by regular field surveys. This sedimentary structure withstood several storms that occurred during this period. In particular, the structure composed of reeds and banquettes was able to resist to the most intense storm that occurred between the 20th and the 21st of January 2020, which was characterized by an Hs of about 3 m and a peak period of 8 s (vertical blue line in Figure 9). The effect of this storm resulted in a shift in the sedimentary structure built by the reeds and banquettes from the beach berm toward the emerged beach area. Fences and other man-made buildings never interacted with the dynamics of banquette deposition. Only this exceptional event that led to the deposition of the reeds and the storm just described destroyed the fences visible in Figure 10. This structure remained on the beach up to early April 2020, and its removal was conducted manually by operators of the municipalities of Cagliari and Quartu Sant’Elena. The removal operation ended in May 2020.

3.4. Statistical Analysis

In order to analyse the main physical processes, and in particular the wave parameters that occurred during the banquette deposition and retreat/erosion events, we calculated the mean values of each wave parameter that occurred during each event and compared them to each other (Table 2). To perform this analysis, we only considered the days in which the cross-shore extension of the banquettes detected along the transects varied by more than 4 m (deposition/erosion); this computation was conducted for each transect. For each transect, it appears evident that during the banquette deposition events, the average Hs values did not exceed 0.7 m, while retreat or erosion events occurred with an average Hs ranging from 0.9 to 1.1 m. This was also reflected in the energy flux values, which, during the banquette retreat/erosion events, had values that were about double for T2 and T3, while in T1 it was more than four times as high (Table 2). The number of deposition events was higher in T3 and lower in T1, and the same pattern was observed for the number of erosion/retreat events (Table 2).
Conversely, Table 3 highlights the number of erosion/retreat events (equal to or greater than 4 m) that occurred in concomitance with wave events in comparison with the total number of erosion/retreat events. In this context, we considered and counted a wave event whenever the wave breaking was detectable from the video monitoring system acquisitions; this was because the CMEMS wave data were collected outside the wave breaking zone. Furthermore, the main wave parameters during these events are shown in Table 3. The banquette retreat/erosion events occurred mostly in concomitance with storms or wave events. Along T1, in about 88% of the cases in which a banquette retreat (≥4m) was detected, the average Hs was about 1.1 m and the average Tp was about 8.3 s. Along T2, in about 85% of the cases in which a banquette retreat (≥4 m) was detected, the average Hs was about 1.1 m and the average Tp was about 7.7 s, whereas along T3, in about 71% of the cases in which a banquette retreat (≥4 m) was detected, the average Hs was about 1 m and the average Tp was about 7.6 s.
As highlighted in Table 3, in some cases of banquette retreat/erosion events (equal to or greater than 4 m), no wave breaking was detected by the video monitoring system. For this, an estimation of the banquette erosion/reduction due to the effects of wind blowing from the mainland and directed offshore was also performed. The mean wind speed blowing during these events was therefore calculated. For each transect, Table 4 shows the total number of retreat/erosion events; the average wind speed calculated considering all the events of retreat/erosion and considering all the directions (also including the onshore directions); the number of retreat events with offshore winds; and the mean wind speed calculated during the retreat/erosion events with offshore winds. Table 4 highlights that during all the retreat events (equal to or more than 4 m), the average wind speed was always higher than 30 km h−1 along each transect, about twice (16.3 km h−1) that of the average wind speed values considering the 4 years of monitoring. This computation was conducted by also considering the onshore-directed wind. Table 4 highlights that on days when there was a reduction/erosion of the banquette, without wave breaking and with only offshore wind, the mean wind speed was higher than 42 km h−1. Moreover, Table 4 highlights that the banquette reduction/erosion occurred during days in which only the offshore winds blowed for about 17% of the total retreat events for T1 and T2, whereas for T3, this percentage was about 41%. Banquette retreat/erosion events occurring on days when both offshore winds and wave action were present are counted in Table 3 and were assumed to be related to wave action.
Moreover, a cross-correlation analysis between the wave parameters and the cross-shore amplitude of the banquettes was also performed to determine if any relationship between wave action and banquette cross-shore extension were present. The cross-correlation was performed between (i) the banquette cross-shore extensions measured along each transect and (ii) the maximum wave parameter values (Hs, Tp, Tm, and energy flux, respectively) computed for the 24 h interval between the two daily images used to measure the cross-shore extension of banquettes along the transects. When no banquette was present, the value of the cross-shore extension was 0.
Furthermore, a cross-correlation analysis was also performed between the daily variations in the banquettes computed as the difference in the cross-shore extension of banquettes along the transects between the considered daily images and the maximum wave parameter values (Hs, Tp, Tm, and energy flux) computed for the 24 h interval between the daily images used to measure the difference in the cross-shore extension of banquettes along the transects.
Poor correlations were found in both analyses and for every parameter tested. For T1 and T3, the r-value was always less than 0.2, while for T2, the maximum r-value was 0.25, still remaining well below the threshold value of 0.7.
Although incident swell was often present during the banquette retreat events, the individual wave parameters did not appear to be directly correlated with the extent and dynamics of the banquettes. The low correlations were probably due to the different time scales of the banquette evolution with respect to the wave force (e.g., the typical duration of a storm was a few days, while the banquette duration could be as long as weeks or months if not disturbed, which can lead to low correlation values).

4. Discussion

We examined the deposition and retreat/erosion of banquettes along three transects located along a sandy urban beach by using a video monitoring system for a 4-year time interval. The banquettes were manually measured and detected in three periods. Measuring the banquettes was not always easy, as sometimes only repeated analysis and operator experience, as well as field surveys, were able to distinguish the banquettes from saturated sand or other stranded debris. For this reason, in our case, the automated procedure was not considered reliable. Nevertheless, future technological developments may create a reliable automated procedure for banquette measurement [38].
Along Poetto beach, from the analysed data, the deposition of banquettes was detected from autumn to winter, and this was in agreement with other Mediterranean beaches [7,22,27,28,40]. During this period, the banquette deposits were usually detected at the end of storms (Figure 4, Figure 5, Figure 7 and Figure 9). Banquette deposition occurred when floating leaf litter was available along the surf zone, whereas the erosion could be related to the wave action, such as a new storm event. Wind could also play a role in the retreat of the banquettes, particularly on days when waves were absent or low in energy.
Figure 4, Figure 5, Figure 7 and Figure 9 show that the depositions of the banquettes along the three transects did not occur at the end of each mild storm, and this may be related to the leaf litter floating along the surf zone that can have a primary role in providing vegetal material that waves can accumulate onshore. During the 4 years of beach video monitoring, banquettes were detected in three periods. In the first period, running from October 2016 to May 2017, about 20 significant storm events, with Hs values equal to or greater than 0.8 m, occurred, and the banquette deposits were detected frequently along the three transects (Figure 5). In the same period, floating leaf litter was widely present along the surf zone of Poetto beach, as highlighted in Figure 6, and this could be a main factor in the edification of banquettes [24,28]. As observed in Poetto beach during a mild storm when floating leaf litter (derived from nearby P. oceanica meadows or from a pre-existing banquette) was present in the surf zone, the waves were able to deposit this material along the beach, favouring the edification of a seagrass berm along the beach face (Figure 11A–C). At the end of a storm, these deposits tended to occupy the beach face of Poetto beach (Figure 11D). On the other hand, the erosion of banquettes was related to the arrival of new storms that could erode or reduce the banquette deposits. In the most energetic storms, whole deposits of banquettes were eroded from the beach face (Figure 5). But, as in case of total banquette erosion, the banquettes could be deposited again when floating leaf litter was present in the surf zone (Figure 5 and Figure 11).
In the second period, banquettes were detected along the three transects for only a few days in October (Figure 7). No other significant banquette deposits were detected during this period, despite the waves and storms that occurred in this period being characterized by low energy and by an Hs value that did not exceed 0.8 m for the most of them (Figure 8). This could be related to the absence of floating leaf litter in the surf zone, which was not detected in the images provided by the video monitoring system until the end of the second period (Figure 8).
The third period of observation ran from November 2019 to June 2020, because from spring 2019 to late summer 2019, no banquettes were detected on the beach. In terms of seagrass availability, the third period was characterized by similar conditions to those of the first period; in fact, the video monitoring system was able to detect seagrass deposits in the emerged beach and floating leaf litter along the surf zone (Figure 5 and Figure 9). However, the vegetal material deposited on the beach was characterized by a huge amount of Arundo donax reeds (Figure 10). The presence of the reeds influenced the response of the vegetal deposits to the storms. Figure 9 shows the evolution of the cross-shore extension of the banquettes (intertwined with reeds) over time along each transect. It is evident that even in occurrences of an intense storm (such as the one that occurred between the 20th and the 21st of January 2020, as shown by the vertical blue line in Figure 9), the banquettes and the reeds were not completely eroded from the beach face. This mixed sedimentary structure, composed of P. oceanica, A. donax, and sediments, seemed to have longer erosion cycles than accumulations consisting solely of P. oceanica. In addition, this intertwined deposit was able to better withstand storms and for a longer time and may decrease the flooding area during wave overwashing episodes [33]. But, due to safety reasons for beachgoers, the reeds mixed with the banquettes were manually removed from the beach from April to June 2020.
As observed in Poetto beach, waves seemed to be one of the main parameters leading to the deposition and erosion of the banquettes, and several authors have suggested that banquettes are deposed at the final stage of a storm [24,27,28]. Along Poetto beach, the deposition and erosion of banquettes seemed to follow the same pattern.
The correlation between the wave parameters with (i) the cross-shore amplitude of the banquettes and with (ii) the daily differences in the cross-shore amplitude with time showed that no strong correlation could be found among the wave parameters and the amplitude of the banquettes. Furthermore, poor correlations were also found among the wave parameters and the daily differences in the cross-shore amplitude of the banquettes. This may be explained by the fact that the cross-shore amplitude of the banquettes and their deposition and/or erosion cycles had different time scales to the storm events and were not solely related to single wave parameters. The P. oceanica floating leaf litter in the surf zone may have played an important role in providing material that could be deposited onshore and that could build up the banquettes themselves.
Focusing our analysis only on days when the cross-shore amplitude of the banquettes detected along the transects varied by more than 4 m (deposition or retreat), differences were found in the average Hs values when comparing the deposition and the retreat/erosion events of the banquettes (Table 2). In particular, it was observed that the average Hs was lower during deposition events (days in which the cross-shore extension of the banquettes varied positively by more than 4 m) than during those where the retreat/erosion of the banquettes occurred (days in which the cross-shore extension of the banquettes varied negatively by more than 4 m, Table 2). This occurred along each transects for the average Hs but not for the wave periods (Table 2). Our data highlighted that the wave conditions that led to banquette deposition were characterized by an average Hs of about 0.7 m (Table 2). Conversely, the wave conditions during banquette erosion events were characterized by an average of Hs of about 1.1 m (Table 2).
It was also observed that the frequency of banquette retreat or erosion caused by wave events differed in relation to the transect location. In particular, along T1 and T2, the retreat/erosion events occurred with more frequency during wave or storm events (88% and 86%, respectively, in Table 3) rather than during offshore wind events (11.8% and 14.2%, respectively, in Table 4). Transect T3 showed a different behaviour. Along this transect, the retreat/erosion events that occurred during offshore wind events showed a frequency of about 28% of the total retreat/erosion events (Table 3 and Table 4).
These differences can be explained by the location of the transects. T1 and T2 were in an area of the beach characterized by the presence of a huge building. T1 extended from the limit of the building to the shoreline, while T2 was located close to the building. The presence of this building (see Figure 2C) could reduce and modify the wind speed and direction and, along these transects, waves could be considered the predominant force contributing to the erosion of the banquettes. On the other hand, T3 was located in an area without obstacles for wind transport (see Figure 2C for the location). Observing the daily images during the retreat of the banquettes along T3, related to offshore wind events (28% of the total retreat events), it was evident that the reduction in the cross-shore amplitude of the banquettes was related to (i) the sand transported by offshore wind from the back-beach toward the shoreline that covered the banquette accumulation (Figure 12) and/or (ii) to seagrass biomass that was transported offshore by the wind (Figure 12). In both cases, the shoreline did not show any retreat following the banquette disappearance. In the first case, the banquettes were no longer recognizable by the video monitoring system because they were covered by sediment (Figure 12). However, in the second case, the offshore wind removed the leaf material from the subaerial beach, and at the end of the offshore wind event, the beach was free of banquettes. The first case could promote the accretion of the beach and increase its permeability, reducing the runup and flooding extension.
Recent studies have shown that the different responses of a beach to the same storm event depend on the permeability coefficients of the beach, both in the presence of sedimented vegetal biomass and in its absence. When this biomass is sedimented, the permeability of the beach increases by an order of magnitude [33], and this allows for the easy drainage of water that overwashes the berm during storm events, promoting and increasing the resilience of the beach system. The same study highlights that, without sedimented vegetal biomass and with a lower permeability coefficient, the water that overwashes the berm tends to stagnate on the emerged beach, promoting and increasing the flooding area. Our data also highlighted that wind can have a relevant role in the interactions between banquettes and beaches; in fact, when wind causes a burial of banquettes, this can increase the resilience of the beach itself against storms and prevent the massive flooding of the back-beach.

5. Conclusions

Using a four-year video monitoring image database, this work showed that banquette deposition occurred during mild storms when floating leaf litter was present in the surf zone. Conversely, banquettes were not detected even during mild storms when leaf litter was not detected in the surf zone. The erosion or retreat of banquettes occurred during more intense storms but, if there was litter in the surf zone, usually at the end of the storm and/or in mild wave conditions, a new banquette could be deposited. The presence or absence of floating leaf litter, derived from adjacent P. oceanica meadows and transported by currents in the surf zone, may be relevant to the banquette edification and amplitude.
Furthermore, occasionally, when the banquettes were intertwined with other vegetal material, such as reeds, they generated a sedimentary structure that showed a greater resistance to wave erosion.
The banquette dynamics could also be influenced by offshore winds. Under certain conditions of offshore wind intensity, when no obstacles were present, the P. oceanica leaves that composed the banquettes could be removed offshore, supplying the floating leaf litter in the surf zone, or they could be covered by sediment. This latter process led to building a sedimentary berm composed of vegetal rests and sand that could also increase the beach’s resilience against storms.
The development and implementation of this knowledge, as well as the automation in recognising the deposition of banquettes, may help beach operators and stakeholders in their management strategies regarding the maintenance or removal of banquettes on Mediterranean beaches.
However, further study should be conducted to understand the relationship between the availability of floating leaf litter in the surf zone and the deposition of banquettes along dry beaches in order to determine if floating leaf litter is the main factor that controls banquette edification.

Author Contributions

Conceptualization, D.T. and S.S.; methodology, D.T., S.S. and A.R.; software, D.T. and A.R.; validation, D.T., S.S., A.R., M.P., A.I. and S.D.; formal analysis, D.T.; investigation, D.T.; resources, S.D. and D.T.; data curation, D.T., S.S., A.R., M.P., A.I. and S.D.; writing—original draft preparation, D.T.; writing—review and editing, S.S., A.R., M.P., A.I. and S.D.; visualization, D.T. and S.S.; supervision, S.S.; project administration, S.D.; funding acquisition, S.D. and D.T. All authors have read and agreed to the published version of the manuscript.

Funding

This study was carried out within the RETURN Extended Partnership and received funding from the European Union Next-GenerationEU (National Recovery and Resilience Plan—NRRP, Mission 4, Component 2, Investment 1.3—D.D. 1243 2/8/2022, PE0000005). This research was also funded by Regione Autonoma Sardegna under L.R. 7/2007, “Promozione della ricerca scientifica e dell’innovazione tecnologica in Sardegna” for the BEACH and TENDER NEPTUNE projects, directed by Sandro De Muro, University of Cagliari. Andrea Ruju has been financially supported by MUR (Ministero dell’Università e della Ricerca of Italy) under PON “Ricerca e Innovazione” 2014-2020 (D.M. 1062/2021).

Data Availability Statement

Data will be made available on request.

Acknowledgments

The authors warmly thank the RETURN Extended Partnership and the European Union Next-GenerationEU (National Recovery and Resilience Plan—NRRP, Mission 4, Component 2, Investment 1.3—D.D. 1243 2/8/2022, PE0000005). The authors warmly thank MUR (Ministero dell’Università e della Ricerca of Italy) under PON “Ricerca e Innovazione” 2014-2020 (D.M. 1062/2021). Sincere thanks go Battellieri Cagliari and Sardegna Progetta for their assistance during the field work. The authors would like to thank the Sardinia Sea Port Authority, the “Deposito PolNato Marina Militare (Navy PolNato Depot Marina Militare)” of Cape S. Elia–Cagliari and Comando supporto logistico di Cagliari (MARICAGLIARI). Sincere thanks go to the Comune di Cagliari (Alessandro Guarracino) for having allowed the seasonal monitoring during the pandemic lockdown. This study was carried out using E.U. Copernicus Marine Service and ERA5 information. Sincere thanks go to Giovanni Coco for his support in planning the work

Conflicts of Interest

The authors declare that they have no known competing financial interest or personal relationships that could have appeared to influence the work reported in this paper.

References

  1. Duarte, C.M. Seagrass depth limits. Aquat. Bot. 1991, 40, 363–377. [Google Scholar] [CrossRef]
  2. Duarte, C.M. How can beaches be managed with respect to seagrass litter? In European Seagrasses: An Introduction to Monitoring and Management; Borum, J., Duarte, C.M., Krause-Jansen, D., Greeve, T.M., Eds.; The M&MS Project Publisher: Copenhagen, Denmark, 2004; pp. 83–84. ISBN 87-89143-21-3. [Google Scholar]
  3. Romero, J.; Pergent, G.; Pergent-Martini, C.; Mateo, M.-A.; Regnier, C. The Detritic Compartment in a Posidonia oceanica Meadow: Litter Features, Decomposition Rates, and Mineral Stocks. Mar. Ecol. 1992, 13, 69–83. [Google Scholar] [CrossRef]
  4. Pergent, G.; Pergent-Martini, C.; Boudouresque, C. Utilisation de l’herbier à Posidonia oceanica comme indicateur biologique de la qualité du milieu littoral en Méditerranée: État des connaissances. Mésogée 1995, 54, 3–27. [Google Scholar]
  5. Gobert, S.; Cambridge, M.; Velimirov, B.; Pergent, G.; Lepoint, G.; Bouquegneau, J.-M.; Dauby, P.; Pergent-Martini, C.; Walker, D.; Larkum, A.; et al. Biology of Posidonia. In Seagrasses: Biology, Ecology and Conservation; Springer: Dordrecht, The Netherlands, 2006; pp. 387–408. [Google Scholar] [CrossRef]
  6. Vacchi, M.; Montefalcone, M.; Bianchi, C.N.; Morri, C.; Ferrari, M. Hydrodynamic constraints to the seaward development of Posidonia oceanica meadows. Estuar. Coast. Shelf Sci. 2012, 97, 58–65. [Google Scholar] [CrossRef]
  7. Vacchi, M.; De Falco, G.; Simeone, S.; Montefalcone, M.; Morri, C.; Ferrari, M.; Bianchi, C.N. Biogeomorphology of the Mediterranean Posidonia oceanica seagrass meadows. Earth Surf. Process. Landf. 2017, 42, 42–54. [Google Scholar] [CrossRef]
  8. Borum, J.; Duarte, C.M.; Krause-Jensen, D.; Greve, T.M. (Eds.) European Seagrasses: An Introduction to Monitoring and Management; The M&MS Project, S. l.: Copenhagen, Denmark, 2004; Available online: http://www.seagrasses.org (accessed on 12 September 2023).
  9. Council Directive 92/43/EEC of 21 May 1992 on the Conservation of Natural Habitats and of Wild Fauna and Flora—Consolidated Version 01/01/2007 (EU Habitats Directive). Available online: https://eunis.eea.europa.eu/habitats/10004 (accessed on 24 September 2023).
  10. Calizza, E.; Costantini, M.L.; Carlino, P.; Bentivoglio, F.; Orlandi, L.; Rossi, L. Posidonia oceanica habitat loss and changes in litter-associated biodiversity organization: A stable isotope-based preliminary study. Estuar. Coast. Shelf Sci. 2013, 135, 137–145. [Google Scholar] [CrossRef]
  11. Duarte, C.M.; Chiscano, C.L. Seagrass biomass and production: A reassessment. Aquat. Bot. 1999, 65, 159–174. [Google Scholar] [CrossRef]
  12. Boudouresque, C.-F.; Bernard, G.; Bonhomme, P.; Charbonnel, E.; Diviacco, G.; Meinesz, A.; Pergent, G.; Pergent-Martini, C.; Ruitton, S.; Tunesi, L. Protection and Conservation of Posidonia oceanica Meadows; RAMOGE and RAC/SPA: 2012. ISBN N° 2-905540-31-1. Available online: https://www.rac-spa.org/sites/default/files/doc_vegetation/ramoge_en.pdf (accessed on 24 August 2023).
  13. Sánchez-González, J.F.; Sánchez-Rojas, V.; Memos, C.D. Wave attenuation due to Posidonia oceanica meadows. J. Hydraul. Res. 2011, 49, 503–514. [Google Scholar] [CrossRef]
  14. Elginoz, N.; Kabdasli, M.S.; Tanik, A. Effects of Posidonia oceanica Seagrass Meadows on Storm Waves. J. Coast. Res. 2011, 64, 373–377. [Google Scholar]
  15. Infantes, E.; Orfila, A.; Simarro, G.; Terrados, J.; Luhar, M.; Nepf, H. Effect of a seagrass (Posidonia oceanica) meadow on wave propagation. Mar. Ecol. Prog. Ser. 2012, 456, 63–72. [Google Scholar] [CrossRef]
  16. Koftis, T.; Prinos, P.; Stratigaki, V. Wave damping over artificial Posidonia oceanica meadow: A large-scale experimental study. Coast. Eng. 2013, 73, 71–83. [Google Scholar] [CrossRef]
  17. DeMuro, S.; Ibba, A.; Simeone, S.; Buosi, C.; Brambilla, W. An integrated sea-land approach for mapping geomorphological and sedimentological features in an urban microtidal wave-dominated beach: A case study from S Sardinia, western Mediterranean. J. Maps 2017, 13, 822–835. [Google Scholar] [CrossRef]
  18. Montefalcone, M.; Vacchi, M.; Archetti, R.; Ardizzone, G.; Astruch, P.; Bianchi, C.N.; Calvo, S.; Criscoli, A.; Fernández-Torquemada, Y.; Luzzu, F.; et al. Geospatial modelling and map analysis allowed measuring regression of the upper limit of Posidonia oceanica seagrass meadows under human pressure. Estuar. Coast. Shelf Sci. 2019, 217, 148–157. [Google Scholar] [CrossRef]
  19. De Muro, S.; Buosi, C.; Biondo, M.; Ibba, A.; Ruju, A.; Trogu, D.; Porta, M. Ecogeomorphology and vulnerability in a Mediterranean ria-type coast (La Maddalena Archipelago, NE Sardinia, western Mediterranean). J. Maps 2021, 17, 690–704. [Google Scholar] [CrossRef]
  20. Boudouresque, C.; Meinesz, A. Découverte de l’herbier de Posidonies. Cah. Parc Natl. Port-Cros 1982, 4, 1–79. [Google Scholar]
  21. De Falco, G.; Simeone, S.; Baroli, M. Management of Beach-Cast Posidonia oceanica Seagrass on the Island of Sardinia (Italy, Western Mediterranean). J. Coast. Res. 2008, 24, 69–75. [Google Scholar] [CrossRef]
  22. Simeone, S.; De Falco, G. Morphology and composition of beach-cast Posidonia oceanica litter on beaches with different exposures. Geomorphology 2012, 151–152, 224–233. [Google Scholar] [CrossRef]
  23. Short, A.D. Handbook of Beach and Shoreface Morphodynamics; John Wiley: Chichester, UK, 1999; ISBN 0-471-96570-7. [Google Scholar]
  24. Simeone, S.; De Muro, S.; De Falco, G. Seagrass berm deposition on a Mediterranean embayed beach. Estuar. Coast. Shelf Sci. 2013, 135, 171–181. [Google Scholar] [CrossRef]
  25. Astudillo, C.; Gracia, V.; Sierra, J.P.; Cáceres, I.; Sánchez-Arcilla, A. Posidonia beach-cast and banquette: Evaluation of sediment trapping and characterisation for coastal protection. In Coastal Sediments 2023; World Scientific: New Orleans, LA, USA, 2023; pp. 2265–2277. [Google Scholar] [CrossRef]
  26. ISPRA. Formazione e Gestione delle Banquettes di Posidonia oceanica Sugli Arenili; Manuali e Linee Guida 55/2010; ISPRA: Ispra, Italy, 2010; pp. 2265–2277. ISBN 978-88-448-0426-8. [Google Scholar]
  27. Gómez-Pujol, L.; Orfila, A.; Álvarez-Ellacuría, A.; Terrados, J.; Tintoré, J. Posidonia oceanica beach-cast litter in Mediterranean beaches: A coastal videomonitoring study. J. Coast. Res. 2013, 165, 1768–1773. [Google Scholar] [CrossRef]
  28. Trogu, D.; Buosi, C.; Ruju, A.; Porta, M.; Ibba, A.; De Muro, S. What Happens to a Mediterranean Microtidal Wave-dominated Beach during Significant Storm Events? The Morphological Response of a Natural Sardinian Beach (Western Mediterranean). J. Coast. Res. 2020, 95, 695. [Google Scholar] [CrossRef]
  29. Otero, M.M.; Simeone, S.; Aljinovic, B.; Salomidi, M.; Mossone, P.; Giunta Fornasin, M.E.; Gerakaris, V.; Guala, I.; Milano, P.; Heurtefeux, H.; et al. Governance and Management of Posidonia Beach-Dune System; POSBEMED Interreg Med Project; 2018; 66p + Annexes. Available online: https://www.iucn.org/our-work/projects/governance-and-management-posidonia-beach-dune-systems-across-mediterranean (accessed on 17 July 2023).
  30. Simeone, S.; Palombo, A.G.L.; Antognarelli, F.; Brambilla, W.; Conforti, A.; De Falco, G. Sediment Budget Implications from Posidonia oceanica Banquette Removal in a Starved Beach System. Water 2022, 14, 2411. [Google Scholar] [CrossRef]
  31. Simeone, S.; De Falco, G. Posidonia oceanica banquette removal: Sedimentological, geomorphological and ecological implications. J. Coast. Res. 2013, 65, 1045–1050. [Google Scholar]
  32. Astier, J.-M.; Boudouresque, C.; Pergent, G.; Pergent-Martini, C. Non-removal of the Posidonia oceanica “banquette” on a beach very popular with tourists: Lessons from Tunisia. Sci. Rep. Port-Cros Natl. 2020, 34, 15–21. [Google Scholar]
  33. Ruju, A.; Buosi, C.; Coco, G.; Porta, M.; Trogu, D.; Ibba, A.; De Muro, S. Ecosystem services of reed and seagrass debris on a urban Mediterranean beach (Poetto, Italy). Estuar. Coast. Shelf Sci. 2022, 271, 107862. [Google Scholar] [CrossRef]
  34. Lolli, I. The protection of Posidonia oceanica (L.) Delile and the management of its beach-cast leaves. Italian juridical framework. In Proceedings of the Ninth International Symposium “Monitoring of Mediterranean Coastal Areas: Problems and Measurement Techniques”, Livorno, Italy, 14–16 June 2022; Bonora, L., Carboni, D., De Vincenzi, M., Matteucci, G., Eds.; Firenze University Press: Florence, Italy, 2022; pp. 700–718. [Google Scholar] [CrossRef]
  35. Vandarakis, D.; Kourliaftis, I.; Salomidi, M.; Gerakaris, V.; Issaris, Y.; Agaoglou, C.; Kapsimalis, V.; Panagiotopoulos, I. Geomorphological approaches to study Posidonia banquettes and their effects on the coastal front of Schin–as—Marathon National Park. In Proceedings of the Ninth International Symposium “Monitoring of Mediterranean Coastal Areas: Problems and Measurement Techniques”, Livorno, Italy, 14–16 June 2022; Bonora, L., Carboni, D., De Vincenzi, M., Matteucci, G., Eds.; Firenze University Press: Florence, Italy, 2022; pp. 93–103. [Google Scholar] [CrossRef]
  36. Tomasello, A.; Bosman, A.; Signa, G.; Rende, S.F.; Andolina, C.; Cilluffo, G.; Cassetti, F.P.; Mazzola, A.; Calvo, S.; Randazzo, G.; et al. 3D-Reconstruction of a Giant Posidonia oceanica Beach Wrack (Banquette): Sizing Biomass, Carbon and Nutrient Stocks by Combining Field Data with High-Resolution UAV Photogrammetry. Front. Mar. Sci. 2022, 9, 903138. [Google Scholar] [CrossRef]
  37. Astudillo, C.; Gracia, V.; Cáceres, I.; Sierra, J.P.; Sánchez-Arcilla, A. Beach profile changes induced by surrogate Posidonia Oceanica: Laboratory experiments. Coast. Eng. 2022, 175, 104144. [Google Scholar] [CrossRef]
  38. Sabato, G.; Scardino, G.; Kushabaha, A.; Chirivì, M.; Luparelli, A.; Scicchitano, G. Deep learning-based segmentation techniques for coastal monitoring and seagrass banquette detection. In Proceedings of the 2023 IEEE International Workshop on Metrology for the Sea, Learning to Measure Sea Health Parameters (MetroSea). La Valletta, Malta, 4–6 October 2023; pp. 524–527. [Google Scholar] [CrossRef]
  39. Provost, L.A.; Eisemann, E.R.; Anderson, C.P.; Waldron, M.C.B. Wrack placement to augment constructed dunes: A field investigation. Front. Built Environ. 2022, 8, 907608. [Google Scholar] [CrossRef]
  40. Paquier, A.-E.; Laigre, T.; Belon, R.; Balouin, Y.; Valentini, N.; Mugica, J. Video monitoring of Posidonia oceanica banquettes on pocket beaches, Northern Corsica. In Proceedings of the XVIèmes Journées, Le Havre, Presented at the Journées Nationales Génie Côtier—Génie Civil, Le Havre, France, 8–10 December 2020; Editions Paralia. pp. 675–682. Available online: http://www.paralia.fr (accessed on 30 June 2023). [CrossRef]
  41. Passarella, M.; Ruju, A.; Muro, S.D.; Coco, G. Horizontal Runup and Seagrass Beach Cast-litters: Modelling and Observations. J. Coast. Res. 2020, 95, 143–147. [Google Scholar] [CrossRef]
  42. Ruju, A.; Passarella, M.; Trogu, D.; Buosi, C.; Ibba, A.; De Muro, S. An Operational Wave System within the Monitoring Program of a Mediterranean Beach. J. Mar. Sci. Eng. 2019, 7, 32. [Google Scholar] [CrossRef]
  43. Scardino, G.; Scicchitano, G.; Chirivì, M.; Costa, P.J.M.; Luparelli, A.; Mastronuzzi, G. Convolutional Neural Network and Optical Flow for the Assessment of Wave and Tide Parameters from Video Analysis (LEUCOTEA): An Innovative Tool for Coastal Monitoring. Remote Sens. 2022, 14, 2994. [Google Scholar] [CrossRef]
  44. Pranzini, E. Il colore della sabbia: Percezione, caratterizzazione e compatibilità nel ripascimento artificiale delle spiagge. Studi Costieri 2008, 15, 89–108. [Google Scholar]
  45. Biondo, M.; Buosi, C.; Trogu, D.; Mansfield, H.; Vacchi, M.; Ibba, A.; Porta, M.; Ruju, A.; De Muro, S. Natural vs. Anthropic Influence on the Multidecadal Shoreline Changes of Mediterranean Urban Beaches: Lessons from the Gulf of Cagliari (Sardinia). Water 2020, 12, 3578. [Google Scholar] [CrossRef]
  46. Orrù, P.E.; Antonioli, F.; Lambeck, K.; Verrubbi, V. Holocene sea level change of the Cagliari. Quat. Nova 2004, 8, 193–212. [Google Scholar]
  47. Porta, M.; Buosi, C.; Trogu, D.; Ibba, A.; De Muro, S. An integrated sea-land approach for analyzing forms, processes, depos-its and the evolution of the urban coastal belt of Cagliari. J. Maps 2021, 17, 65–74. [Google Scholar] [CrossRef]
  48. Brambilla, W.; Van Rooijen, A.; Simeone, S.; Ibba, A.; DeMuro, S. Field Observations, Video Monitoring and Numerical Model-ing at Poetto Beach, Italy. J. Coast. Res. 2016, 75, 825–829. [Google Scholar] [CrossRef]
  49. Piscopia, R.; Franco, L.; Corsini, S.; Inghilesi, R. Atlante Delle Onde nei Mari Italiani—Italian Wave Atlas; Full Final Report a cura dell’APAT; Università di Roma Tre: Roma, Italy, 2004. [Google Scholar]
  50. Korres, G.; Ravdas, M.; Zacharioudaki, A.; Denaxa, D.; Sotiropoulou, M. Mediterranean Sea Waves Reanalysis (CMEMS Med-Waves, MedWAM3 System) (Version 1) Data Set; Copernicus Monitoring Environment Marine Service (CMEMS): 2021. Available online: https://data.marine.copernicus.eu/product/MEDSEA_MULTIYEAR_WAV_006_012/description (accessed on 20 May 2021).
  51. Hersbach, H.; Bell, B.; Berrisford, P.; Biavati, G.; Horányi, A.; Muñoz Sabater, J.; Nicolas, J.; Peubey, C.; Radu, R.; Rozum, I.; et al. ERA5 Hourly Data on Single Levels from 1940 to Present. Copernicus Climate Change Service (C3S) Climate Data Store (CDS). 2023. Available online: https://cds.climate.copernicus.eu/cdsapp#!/dataset/reanalysis-era5-single-levels?tab=overview (accessed on 20 September 2023).
  52. Brambilla, W. Caratterizzazione Morfodinamica Della Spiaggia del Poetto. Ph.D. Thesis, University of Cagliari, Cagliari, Italy, 2015. [Google Scholar]
  53. Passarella, M. On the Prediction of Swash Excursion and the Role of Seagrass Beach-Cast Litter: Modelling and Observations. Ph.D. Thesis, University of Cagliari, Cagliari, Italy, 2019. [Google Scholar]
  54. Sardegna Geoportale. Available online: https://www.sardegnageoportale.it/ (accessed on 1 March 2021).
  55. Liang, B.; Shao, Z.; Wu, G.; Shao, M.; Sun, J. New equations of wave energy assessment accounting for the water depth. Appl. Energy 2017, 188, 130–139. [Google Scholar] [CrossRef]
Figure 1. In panel (A), the red rectangle highlights the framing area of the camera, while the red circle indicates where the camera was installed. The dashed green line represents the upper limit of P. oceanica meadows. Panels (B,C), on the other hand, show examples of banquettes settling within the study area highlighted by the yellow dashed square in panel (A).
Jmse 11 02376 g001
Figure 2. Geographical setting of the study area (western Mediterranean Sea) with: (A) red dashed lined: wave exposure angles (referred to the N = 0°) and fetch for the study area within Poetto beach; (B) location of video monitoring system and limits of Poetto beach; (C) detail of study area and the three transects (red lines T1, T2, and T3); (D) wind speed and direction for the four years of monitoring from the ERA5 reanalysis dataset (green star in panel (A) represents the grid node where the data were downloaded); (E) significant wave height and direction for the four years of monitoring at the Copernicus Marine Environment Monitoring Service virtual buoy (orange star in panel (B) represents the grid node where the data were downloaded). The yellow dotted line indicates that figure (C) is a zoom of the area within the yellow rectangle of panel (B).
Jmse 11 02376 g002
Figure 3. Panel (A): oblique image from video monitoring system: the dots named with letters highlight the fixed ground control points in study area. Panel (B): orthorectified image with an example of measurement of the banquette cross-shore extension: the crosses represent the start and end points for each measurement.
Jmse 11 02376 g003
Figure 4. Time series of the banquette extensions along the three transects (panels T1, T2, and T3) for the four years of acquisitions, with the related significant wave height (Hs) and peak wave period (Tp). I (red rectangle), II (violet rectangle), and III (blue rectangle) represent the periods that were split, respectively, in Section 3.1, Section 3.2 and Section 3.3.
Jmse 11 02376 g004
Figure 5. Time series of the banquette extensions along the three transects (panels T1, T2, and T3) for the period from the 20th of October 2016 to 20th of June 2017.
Jmse 11 02376 g005
Figure 6. Exemplified images of the first interval period: large accumulation of P. oceanica floating leaf litter was detected (brown patches in the shallow water fronting the beach).
Jmse 11 02376 g006
Figure 7. Time series of the banquette extensions along the three transects (panels T1, T2, and T3) for the period from the 18th of October 2018 to the 22nd of January 2019.
Jmse 11 02376 g007
Figure 8. Exemplified images of the second interval period: floating leaf litter was only detected in October 2018 at the same time as the presence of banquettes. In the following months, neither banquettes nor floating leaf litter were detected. Panel (A): during october 2018 banquette and floating leaf litter were present in the study area. Panel (BD): during other months of the second period neither floating leaf litter nor any banquette was detected.
Jmse 11 02376 g008
Figure 9. Time series of the banquette extensions along the three transects (panels T1, T2, and T3) for the period from the 30th of November 2019 to the 20th of June 2020. The seagrass berm in this period was largely mixed with Arundo donax reeds (deposited during the event highlighted by green line) that seemed to make the structure more resistant to erosion during storm events, such as the example shown by vertical blue line.
Jmse 11 02376 g009
Figure 10. Images acquired on the 19th of January 2020, two days before the storm peak, next to area T2. A. donax and P. oceanica rests were well intertwined. The fences, not being particularly hard structures, were broken down by the swell without significantly restricting the movement of the reeds towards the emerged beach.
Jmse 11 02376 g010
Figure 11. Deposition of banquettes at the end of a storm. In panel (A), an extended floating leaf litter in the surf zone is highlighted (dark area between the dashed red lines). During the storm (panel (B)), this vegetal biomass was transported and sedimented on the shore, building the banquette, as visible from panel (C,D) (dark area within the red lines in panel (D)). Moreover, in panel (D), another huge floating leaf litter deposition is visible in the surf zone.
Jmse 11 02376 g011
Figure 12. Some examples of banquettes (within the red circles) partly removed and partly covered with sand during offshore wind events. Panel (A,B): mean wind speed between the two days was 62.9 Km h−1. Panel (C,D): mean wind speed between the two days was 49.8 Km h−1. Panel (E,F): mean wind speed between the two days was 61.2 Km h−1.
Jmse 11 02376 g012
Table 1. Statistical values of the cross-shore extensions of banquettes in the three transects. The days on which banquettes were detected for each transect are shown between brackets.
T1 (206 days)T2 (253 days)T3 (266 days)
Mean extension6.3 m7.5 m7.7 m
Max. extension17.5 m21.5 m27.9 m
Min. extension0.4 m0.3 m0.3 m
St. deviation4.3 m4.8 m5.3 m
Table 2. Mean wave parameters for the banquette deposition and retreat events greater than 4 m along the studied transects.
T1T2T3
Hs mean deposition0.6 m0.7 m0.7 m
Hs mean erosion1.1 m1.0 m0.9 m
Tp mean deposition7.5 s8.1 s8.1 s
Tp mean erosion8.0 s7.2 s6.8 s
Tm mean deposition4.3 s4.9 s4.5 s
Tm mean erosion4.6 s4.2 s3.4 s
n° events deposition273746
n° events erosion172839
Energy flux mean deposition19,336 W (m2)−124,008 W (m2)−124,228 W (m2)−1
Energy flux mean erosion90,302 W (m2)−153,542 W (m2)−142,098 W (m2)−1
Table 3. Mean wave parameters during banquette retreat/erosion events equal to or greater than 4 m that occurred when the wave breaking was detectable from the video monitoring system acquisitions. The percentages refer to the total number of events.
Events with Retreat/Erosion ≥ 4 mT1T2T3
Hs mean erosion1.1 m1.1 m1.0 m
Tp mean erosion8.3 s7.7 s7.6 s
Tm mean erosion4.8 s4.4 s4.6 s
n° events erosion172839
n° events erosion with waves15 (88.2%)24 (85.7%)28 (71.8%)
Energy flux mean erosion103,011 W (m2)−160,280 W (m2)−154,123 W (m2)−1
Table 4. Mean wind speed during the retreat events equal to or greater than 4 m without wave breaking.
Events with Retreat/Erosion ≥ 4 mT1T2T3
Total number of retreat events172839
Total mean wind speed (Km h−1) during all the retreat events33.8 (n = 17)31.2 (n = 28)32.8 (n = 39)
n° retreat events with offshore winds and their proportion to total retreat events2 (11.8%)4 (14.2%)11 (28.2%)
Mean wind speed (Km h−1) during retreat events with offshore winds45.2 (n = 2)48.2 (n = 4)42.15 (n = 11)
Disclaimer/Publisher’s Note: The statements, opinions and data contained in all publications are solely those of the individual author(s) and contributor(s) and not of MDPI and/or the editor(s). MDPI and/or the editor(s) disclaim responsibility for any injury to people or property resulting from any ideas, methods, instructions or products referred to in the content.

