Article

Numerical Study on Wave–Ice Floe Interaction in Regular Waves

1
College of Shipbuilding Engineering, Harbin Engineering University, Harbin 150001, China
2
Qingdao Innovation and Development Center, Harbin Engineering University, Qingdao 266000, China
3
Department of Civil and Environmental Engineering, Norwegian University of Science and Technology, 7034 Trondheim, Norway
*
Author to whom correspondence should be addressed.
J. Mar. Sci. Eng. 2023, 11(12), 2235; https://doi.org/10.3390/jmse11122235
Submission received: 11 October 2023 / Revised: 22 November 2023 / Accepted: 23 November 2023 / Published: 26 November 2023
(This article belongs to the Section Ocean Engineering)

Abstract

:
The marginal ice zone (MIZ) is located at the junction of ice-covered areas and open water, where waves cause ice floes to break up and change their state of motion, thus threatening the safety of ships navigating the ice. This study employs the Structured Arbitrary Lagrangian–Eulerian (S-ALE) method and the numerical wave-making method based on dynamic boundary conditions to numerically examine the motion response of ice floes in waves. The longitudinal motion of ice floes in waves can be classified into two distinct states, namely irregular and regular, depending on the wavelength. In the short-wave range, the ice floes exhibit primarily irregular motion, whereas in the long-wave range, their motion becomes regular, resembling that of isolated ice floes. The longitudinal motion response of the ice floes remains unaffected by their size. However, the longitudinal velocity, surge velocity, and displacement of the ice floes are influenced by the wavelength. Furthermore, the numerical calculations are compared to the model test conducted in a towing tank using paraffin artificial ices, revealing a qualitative agreement between the experimental and numerical results.

1. Introduction

The polar and subpolar seas have experienced significant impacts from global warming, resulting in heightened storm frequency and intensity, leading to increased wind speeds and more aggressive wave behaviors [1,2,3]. In the past two decades, the Arctic sea-ice cover has undergone a substantial reduction, accompanied by the emergence of a more prevalent marginal ice zone (MIZ) due to wave action.
The region known as the marginal ice zone (MIZ) is characterized by a significant presence of ice floes transitioning from open water to a level ice sheet. Within this zone, the collision and fragmentation of sea ice occur under the direct influence of waves, creating a dynamic environment for the exchange of sea ice, water, and atmosphere. When navigating through the MIZ, ships, even with the assistance of icebreakers, experience the combined effects of wave–wind–current–ice interactions, resulting in different resistance performance compared to sailing solely in the ice floe zone. The interaction between waves and sea ice serves as the foundation for further study in this area [4].
The existing body of literature indicates that studies have identified three primary themes: wave propagation across the marginal ice zone (MIZ), floe size distributions, and sea ice dynamics and breakup [5,6,7,8]. Research on wave propagation across the MIZ can be categorized into two main aspects: investigating the motion response of ice floes under wave action and examining wave propagation characteristics and energy dissipation across various regions of sea ice. Several scholars have made significant contributions to the field of wave–ice floe interaction through their research in theoretical studies, numerical simulations, model tests, and full-scale tests. In the realm of theoretical research, a majority of current investigations on wave–ice floe interaction rely on the assumption that ice floes are either bendable or unbreakable. Additionally, sea ice is often approximated as an elastomeric or viscoelastic continuum in studies focusing on the interaction between sea ice and waves. The primary mathematical models employed in these studies include the mass loading model, thin elastic plate model, viscous layer model, and visco-elastic model [9].
In this regard, the works of many scholars deal with the analytical study of this problem. Meylan and Squire [10] developed a numerical model for the motion and bending deformation of a single flexible floating ice with waves, predicted the heave and rocking amplitude response operators (RAOs) for a single floating ice with wave action at finite and infinite water depths, and extended this numerical model to include the interaction of two different floating ice types with waves. Subsequently, Meylan [11] further investigated the coupling of flexible sea ice with arbitrary geometry under wave action by substituting the free vibration modes of the ice floes into the integral equation describing the fluid motion and gave numerical simulation results for four sea ice geometries (parallelogram, triangle, trapezoid, and square) and two wave numbers. Wang et al. [12] developed a higher-order numerical algorithm based on a coupled boundary element and finite element methods to study the interaction of waves with arbitrarily shaped elastic ice floes, which is in good agreement with the results of Meylan [11]. Bennetts and Williams [13] proposed a simplified numerical method to solve the water wave scattering problem for arbitrarily shaped three-dimensional hydro-elastic geometries (ice floes) and studied the interaction of arbitrarily shaped ice floes floating on an infinite water surface with waves. The study of the interaction of ice floe swarm with waves is based on the study of the interaction of a single ice floe with waves. Peter et al. [14] considered the ice floe swarm as a three-dimensional infinite array space composed of a large number of elastic disc ice floes, the array collection was formed by the regular arrangement of multiple ice floes, and they explored the water wave scattering problem of waves passing through this large ice floe swarm and analyzed the properties of the wave propagation in MIZ after wave propagation and the energy change in the ice floe swarm. Bennetts et al. [15] developed a three-dimensional wave scattering model for the interaction between ice floes and waves consisting of different shapes of elastic sheet ice floe arrays to study the wave attenuation caused by sea ice scattering in the ice edge zone and to predict the wave attenuation rate in MIZ. The results show that wave attenuation is mainly influenced by the wave period and the average thickness of the ice cap, and is almost independent of the size, shape, and distribution of the ice floes. Recently, Meylan and Bennetts [16] studied the Boltzmann equation model of wave scattering in MIZ, investigated the three-dimensional scattered waves from a population of ice floes in the time domain with the spectral analysis of the linear operator of the Boltzmann equation, and gave a method to calculate the scattering terms generated by individual ice floes in this model. Guyenne et al. [17] presented a numerical model for the direct phase-resolved simulation of nonlinear ocean waves propagating through fragmented sea ice. A method for modeling fragmented sea ice was proposed, and the wave propagation and attenuation across the marginal ice zone were studied. Xu et al. [18] conducted a direct phase-resolved simulation to examine the transmission and scattering of nonlinear ocean waves in fragmented sea ice. The utilized numerical model solves the complete time-dependent equations for nonlinear potential flow, incorporating a nonlinear thin-plate approximation of the ice cover, while disregarding dissipative mechanisms. Behera et al. [19] investigated the phenomenon of oblique wave scattering using a floating elastic plate within a one- or two-layer body of water situated above a porous seabed with infinite depth. The employed solution methodology, based on the assumption of small-amplitude surface waves and structural response, involved the utilization of the eigenfunction expansion method. The primary focus of the study was to examine the interaction between oblique waves and a floating elastic plate, which functions as an efficient breakwater. Hossain et al. [20] employed linear stability analysis within the framework of a two-dimensional Cartesian coordinate system to examine the flow dynamics beneath a substantial floating elastic plate situated on a slippery surface, while considering the influence of external shear. Their findings indicate that, in viscous fluids, the presence of high mass and rigidity results in flow attenuation, whereas the rigidity does not affect inviscid flows.
With the development of model experiments and numerical calculation methods, a large number of papers have reported studies on experimental and numerical investigations on ice–wave interaction. Xu et al. [21] presented a discrete element method (DEM) model to simulate the mechanical behavior and fracture behavior of sea ice under wave action, in which sea ice is simulated with densely arranged spherical particles of finite sizes. Bai et al. [22] used HydroSTAR®, a hydrodynamic package based on the potential flow approach, and OpenFOAM®, a CFD package based on the viscous flow approach, to numerically simulate different shapes of ice floes under wave action and observed the phenomena of heave, surge, and longitudinal drift motion. Huang et al. [23] applied the hydro-elastic wave–ice interaction method based on the OpenFOAM® package to predict wave propagation and ice motion during ice wave interaction process. Wu et al. [24] used a computational fluid dynamics (CFD) method to study the response of a single ice floe under wave action. Marquart et al. [25] developed a new numerical approach based on OpenFOAM® software that considers the material composition of non-homogeneous sea ice to simulate the small-scale interactions of waves, pancake ice floes, and interstitial grease ice. Behnen et al. [26] developed a two-dimensional wave–ice interaction simulation environment based on the finite platform LS-DYNA package and constructed a numerical model with a coupled incompressible CFD solver and implicit structural solver. The motion behavior and the mechanical behavior of ice floes under different wave actions were investigated. Zhang et al. [27] presented a two-way coupled numerical method based on Smoothed Particle Hydrodynamics (SPH) to simulate the breakup of ice floes under the action of water waves. A new flow–ice interaction model and a simulation technique for the separation of broken ice pieces were developed, and the effects of solitary waves and focused waves on ice floe breakup were investigated. Jiang et al. [28] presented a boundary element method (BEM)-based method for calculating the coupled added mass and hydrodynamic damping between a ship and ice floes. The influence of added mass and hydrodynamic damping on different wave frequencies and heading are explored. Junior et al. [29] developed and evaluated a new three-dimensional fully Lagrangian (particle-based) numerical model based on the hybrid discrete element method (DEM) and the moving particle semi-implicit (MPS) meshless technique for simulating highly dynamic ice–wave interactions.
In model experiments, Huang et al. [30] studied the drift motion of a small single ice floe induced by regular waves, and analyzed the effects of floating body shape, draft depth, and wave parameters on its motion response and monitored the drift velocity of the ice floe. McGovern et al. [31] studied the kinematic properties of a single ice floe in regular waves with different wave parameters and the energy change in sea ice in waves and found that sea ice size, initial position, and surface roughness had no effect on the motion. Bennetts et al. [32] used thin plastic plate models of different materials and thicknesses to study the kinematic response and wave propagation characteristics of ice floes under regular waves with different parameters, analyzed the drift and surge phenomena of ice floes, and described the relationship between wave propagation and wave steepness. Meylan et al. [33] verified the bending kinematic response of model ice floes under wave action by simulating an experimental model of ice floes with rigid as well as flexible plastic plate models, and observed the ice floe surge phenomenon in the experiment that was much neglected by the theoretical model. Huang et al. [34] proposed a new floating ice model consisting of three elastic plates and studied the front (reflected) and rear (transmitted) wave fields of the ice model with regular incident waves and the overwash waves around the floating ice. Toffoli et al. [35] reviewed the experimental activities of [32] and analyzed previously unreported tests involving irregularly incident waves. The paper compares transmission for the regular and irregular tests with special attention to the effect of nonlinear wave–ice interaction processes. Yiew et al. [36] studied the dynamical response of two isolated thin discs in regular waves, considering the effect of wave surges by adding an edge barrier. Wang et al. [37] conducted experiments using a motion tracking system in a towing tank, focusing on the effects of synthetic ice models with various shapes, lengths, and thicknesses on the motion of ice floes. Bennetts and Williams [38] presented the interaction of regular disc arrays with waves at different ice floe concentrations and explored the relationship between wave period and wave-energy attenuation with wave period. Park et al. [39] used square synthetic ice floes made of low-density polyethylene to experimentally study the wave–ice interaction and to understand the mean drift velocity of free-floating ice models in a three-dimensional wave basin under regular incident waves of different periods and steepness.
This study aims to examine the fluid–structure interaction (FSI) behavior of wave–ice floe interactions by developing high-fidelity physics-based finite-element (FE) models. The rationality of the developed FE models using the Structured Arbitrary Lagrangian–Eulerian S-ALE FSI technique is verified. Additionally, a wave generation method incorporating dynamic boundary conditions is introduced based on linear wave theory. Furthermore, a parametric study is conducted using the validated FSI models to analyze the longitudinal effects of various key parameters, such as wave parameters, ice concentrations, and ice sizes.

2. Numerical Simulation

In this section, we introduce the numerical method based on LS-DYNA briefly and concisely. More information on the method selection process can be found in the LS-DYNA theory manual [40].

2.1. General Governing Equations

In materials, the continuity equation can be written as Equation (1):
V ρ 0 ( x , y , z , t 0 ) d V 0 = V ρ 0 ( x , y , z , t ) d V
Using Jacobian J, we obtain Equation (2):
V 0 ( ρ 0 ρ | J | ) d V 0 = 0 , ρ 0 = ρ | J |
As the time rate of change in the total momentum of a system is the same as the vector sum of all the external forces, Equation (3) can be made:
S t d S + V ρ b d V = d d t V ρ v d V
where ρ is the density, t is the surface traction, and b is the body force per unit mass.
Using the Cauchy stress tensor ( σ ), t = σ i j n , and the divergence theorem, Equation (4) can be made.
V σ i j d V + V ρ b d V = d d t V ρ v d V         ρ d v d t = ρ x ¨ = σ i j + ρ b = σ i j , j + ρ b
Using total energy ( E ), which is the sum of kinetic energy and internal energy, we have:
ρ d E d t = σ i j ε ˙ i j + ρ b v
In LS-DYNA, the modified energy equation for the explicit solver (Equation (6)) is integrated in time and is used for the equation of state evaluation and a global energy balance:
ρ d E d t = V σ i j ε ˙ i j ( p + q ) V ˙
where V is the relative volume, which is the determinant of the Jacobian, p is the hydrostatic pressure, and q is the bulk viscosity.
Since the weak form of the momentum equation is solved using the finite element method (using the principle of virtual work), it can be written as Equation (7).
δ π = V ρ x ¨ i δ x i d V + V σ i j δ x i , j d V V ρ b δ x i d V V t δ x i d V = 0
For time integration, LS-DYNA is processed using the central-difference method to obtain Equation (8):
U ¨ t = 1 Δ t 2 ( U t Δ t 2 U t + U t + Δ t ) U ˙ t = 1 2 Δ t ( U t Δ t + U t + Δ t )
where Δ t is the time step size.

2.2. Structured Arbitrary Lagrangian–Eulerian (S-ALE) Method

The Structured Arbitrary Lagrangian–Eulerian (S-ALE) method is developed from the Arbitrary Lagrangian–Eulerian (ALE) method [41,42]. The arbitrary Lagrangian–Eulerian (ALE) method in LS-DYNA [43] possesses several limitations. Primarily, its applicability is restricted to laminar flows. Furthermore, the ALE solver does not provide a solution for the Navier–Stokes equations, which are commonly employed by most commercial computational fluid dynamics (CFDs) codes. Consequently, it fails to consider the fluid boundary layer effects.
The utilization of a 2D model to illustrate the fundamental attributes of the Lagrangian, Eulerian, and Structured Arbitrary Lagrangian–Eulerian methods is depicted in Figure 1, wherein a solid material is subjected to movement and deformation.
In the calculation of the S-ALE method, the material domain and the reference domain are defined, the velocity of the material is u , the moving velocity of the reference system is v , and the velocity difference u v is denoted as w . From this, the control equations of the S-ALE fluid–solid coupling calculation method can be derived as Equation (9):
J t = J v i x i
where J is the Jacobian, which is the relative differential volume between two domains.
The material time derivatives in S-ALE are written as Equation (10):
b r t = b w f x
where b r means that b is expressed as a function of the reference domain.
Thus, the S-ALE equations for conservation of mass, momentum, and energy are as Equation (11):
ρ r t = ρ u i x i w i ρ x i ρ u i r t = ( σ i j , j + ρ b i ) u i x i ρ w j u j x j ρ e r t = ( σ i j u i , j + ρ b i u i ) ρ w j e x j
The S-ALE solver in LS-DYNA has been enhanced with the inclusion of two additional keywords, namely *ALE_STRUCTURED_MESH and *ALE_STRUCTURED_MESH_CONTROL_POINTS. The former is utilized for mesh generation and activation of the S-ALE solver, while the latter offers information regarding mesh spacing in each local direction. This method of overlapping large and small meshes to solve the significant differences between Lagrange and ALE models has been widely used in FSI simulations [44]. The keyword “ALE_STRUCTURED_FSI” was defined to simulate the interaction between ice floes and the surrounding water.

2.3. Penalty Function Method

The penalty function method is employed in the simulation to handle contact between Lagrangians and coupling between Lagrangian and Eulerian. The penalty function contact algorithm designates the master and slave surfaces as the two surfaces where contact is likely to occur, and can be employed to determine the contact force in explicit or implicit program calculations. Additionally, it effectively mitigates the hourglass effect and eliminates the need for setting collision and release conditions. The calculation of the contact force in the penalty function is conducted as Equation (12):
F = k δ
where k is the stiffness factor and δ is the penetration distance.
The stiffness k is determined as Equation (13):
k = p f K A 2 V
where p f is the scale factor for the interface stiffness, K is the bulk modulus, A is the face area, and V is the volume of the master segment.

2.4. Numerical Wave Tank

The LS-DYNA package employs the S-ALE method and the motion boundary condition wave generation method to achieve numerical wave generation. This is accomplished by referencing the physical pool push-plate-type wave generation method and simulating the simple harmonic vibration of the motion boundary on one side of the fluid region model. Additionally, the wave surface equations of various wave input conditions are combined to derive the theoretical equations of the push-plate motion boundary condition wave generation method. Furthermore, the motion parameters of the wave numerical model are calculated under different wavelengths and wave heights.
The theory of linear surface waves proposed by Airy and Laplace [45] is based on the assumption that the wave amplitudes are small relative to the wavelength and water depth. Assuming homogeneous, incompressible, inviscid, and irrotational flow, the water wave problem can be described by the Laplace equation, and the motion control equation of the two-dimensional plane wave is written as Equation (14).
2 ϕ x 2 + 2 ϕ z 2 = 0
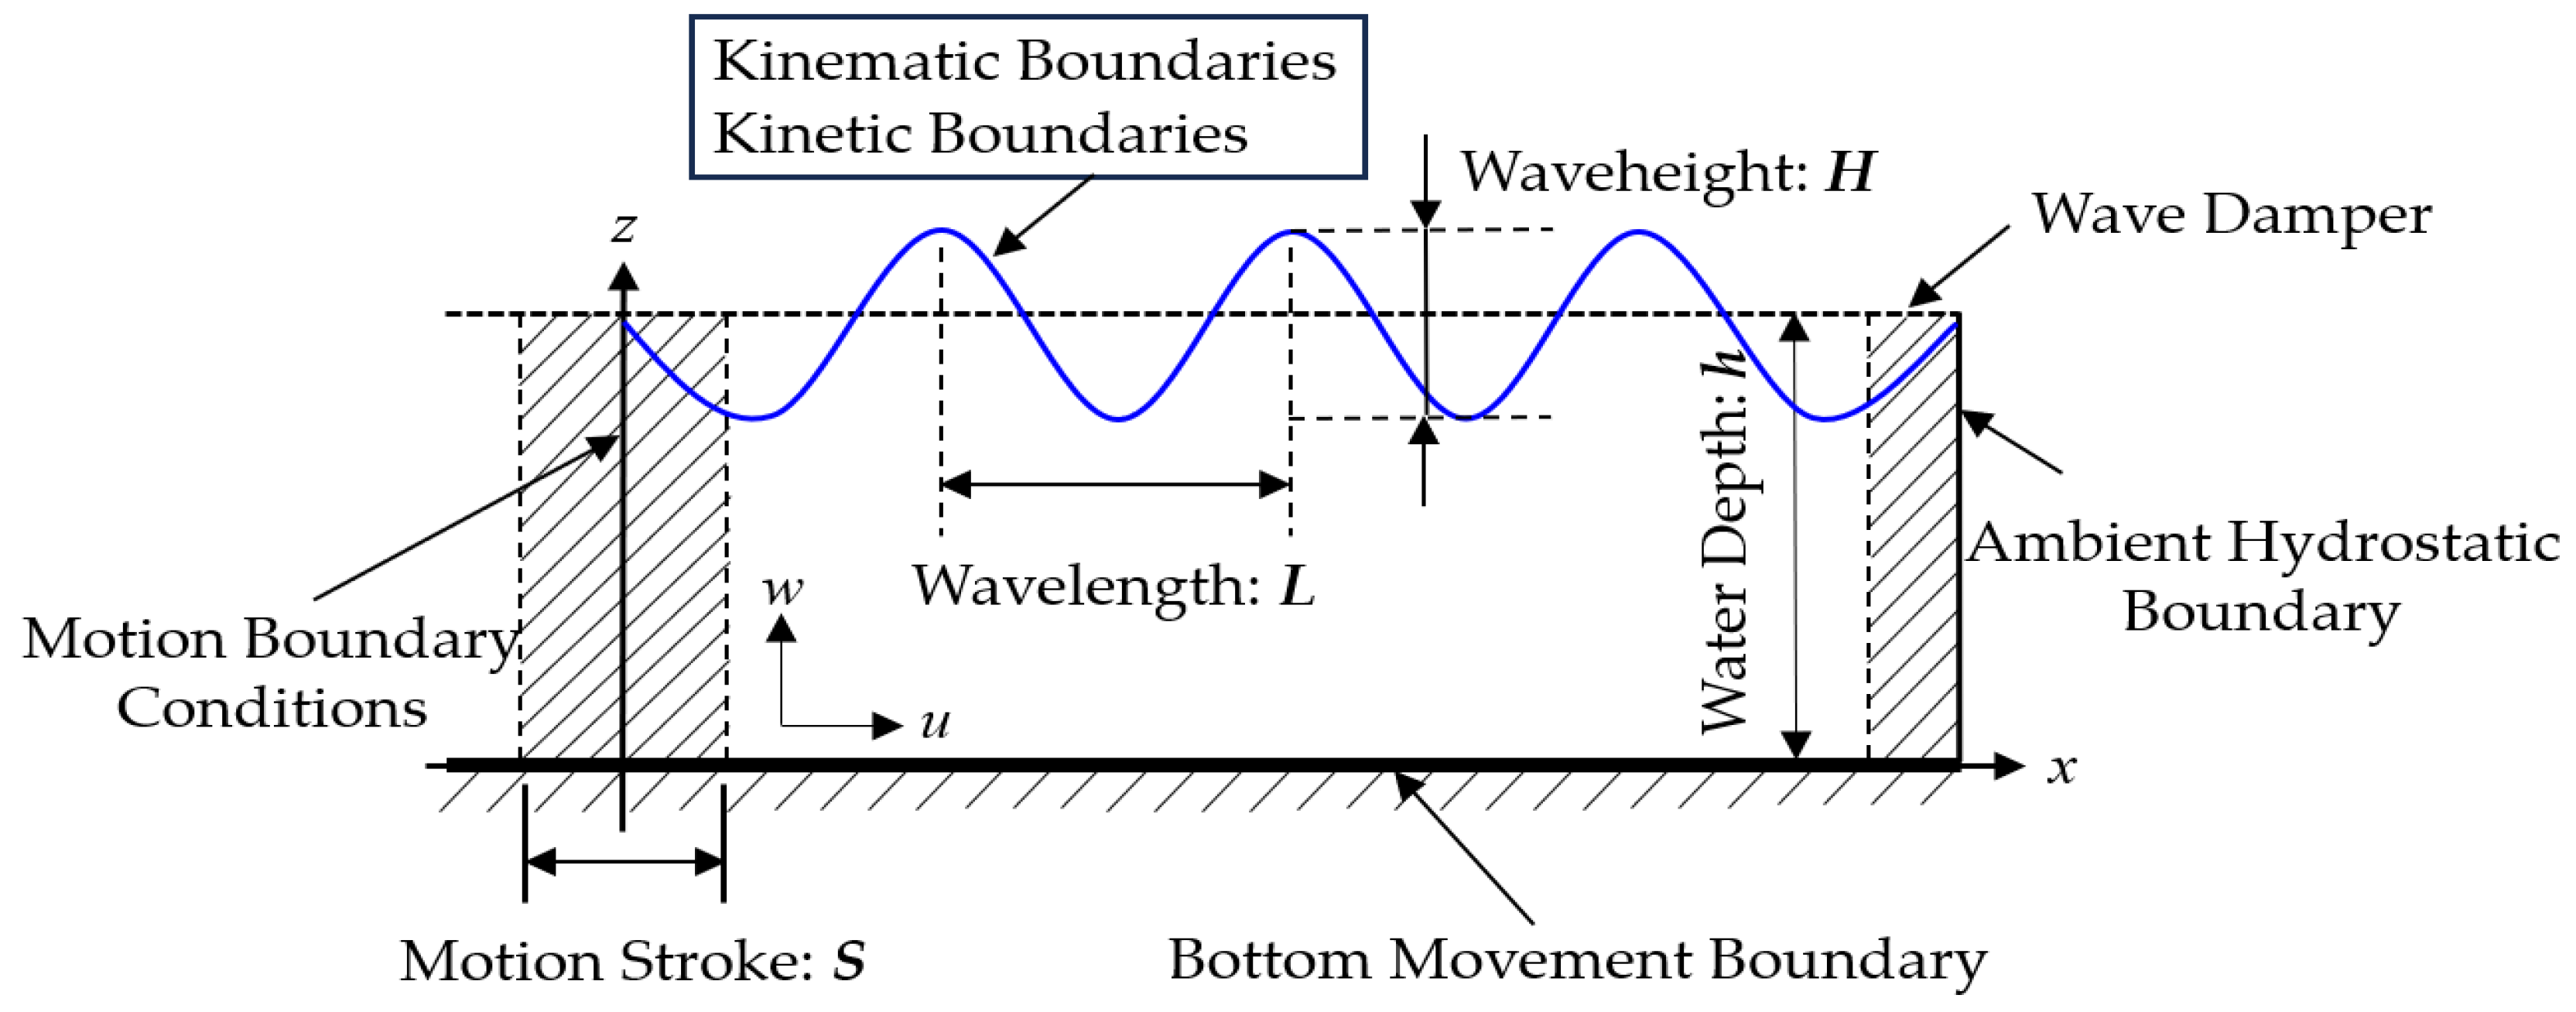
A schematic diagram of the pusher-plate wave-making method based on dynamic boundary conditions is shown in Figure 2. These boundary conditions, employed in the numerical wave model, encompass the left-side dynamic boundary conditions, the right-side ambient hydro-static boundary conditions, the bottom kinematic boundary conditions, and the kinematic and kinetic boundary conditions of the free surface. The derivation of the aforementioned equations is rooted in the theory of small amplitude waves.
Free surface dynamics boundary conditions are written as Equation (15).
η = 1 g ϕ t ( z = h )
Free surface kinematic boundary conditions are written as Equation (16).
ϕ z = η t ( z = h )
Bottom boundary conditions are written as Equation (17).
ϕ z = 0 ( z = 0 )
Dynamic boundary conditions on the left side are written as Equation (18):
u ( 0 , z , t ) = S ( z ) 2 σ cos σ t
where η is the height of the distance between the free surface and the still water surface, and σ is the motion frequency of the moving boundary.
Based on the above equation, the relationship between the wave height and the stroke of the moving boundary can be obtained as Equation (19).
H = 2 S ( cosh 2 k p h 1 ) sin 2 k p h + 2 k p h σ 2 = g k p tanh k p h
The dispersion equation is written as Equation (20).
L = g T 2 2 π tanh k p h
Based on the correlation between wave height and impulse of the moving boundary, as well as the dispersion equation, it is possible to ascertain the simple harmonic equation of motion for the moving boundary. The motion parameters of the moving boundary can be employed as an excitation for the numerical tank’s moving boundary. To mitigate the impact of reflected waves on the accuracy of numerical wave simulations, it becomes imperative to employ the ambient hydrostatic boundary to emulate an infinite water expanse at the dissipation end, owing to the constrained scope of the numerical water model. A layer of ambient elements are added to the initial ALE domain at the outlet. Hydrostatic pressure is applied by using *ALE_AMBIENT_HYDROSTATIC commands and by applying a constant base gravity to the ALE domain. A constant atmospheric pressure is applied on the top surface.

3. Description of Wave–Ice Floe Interaction Model Test

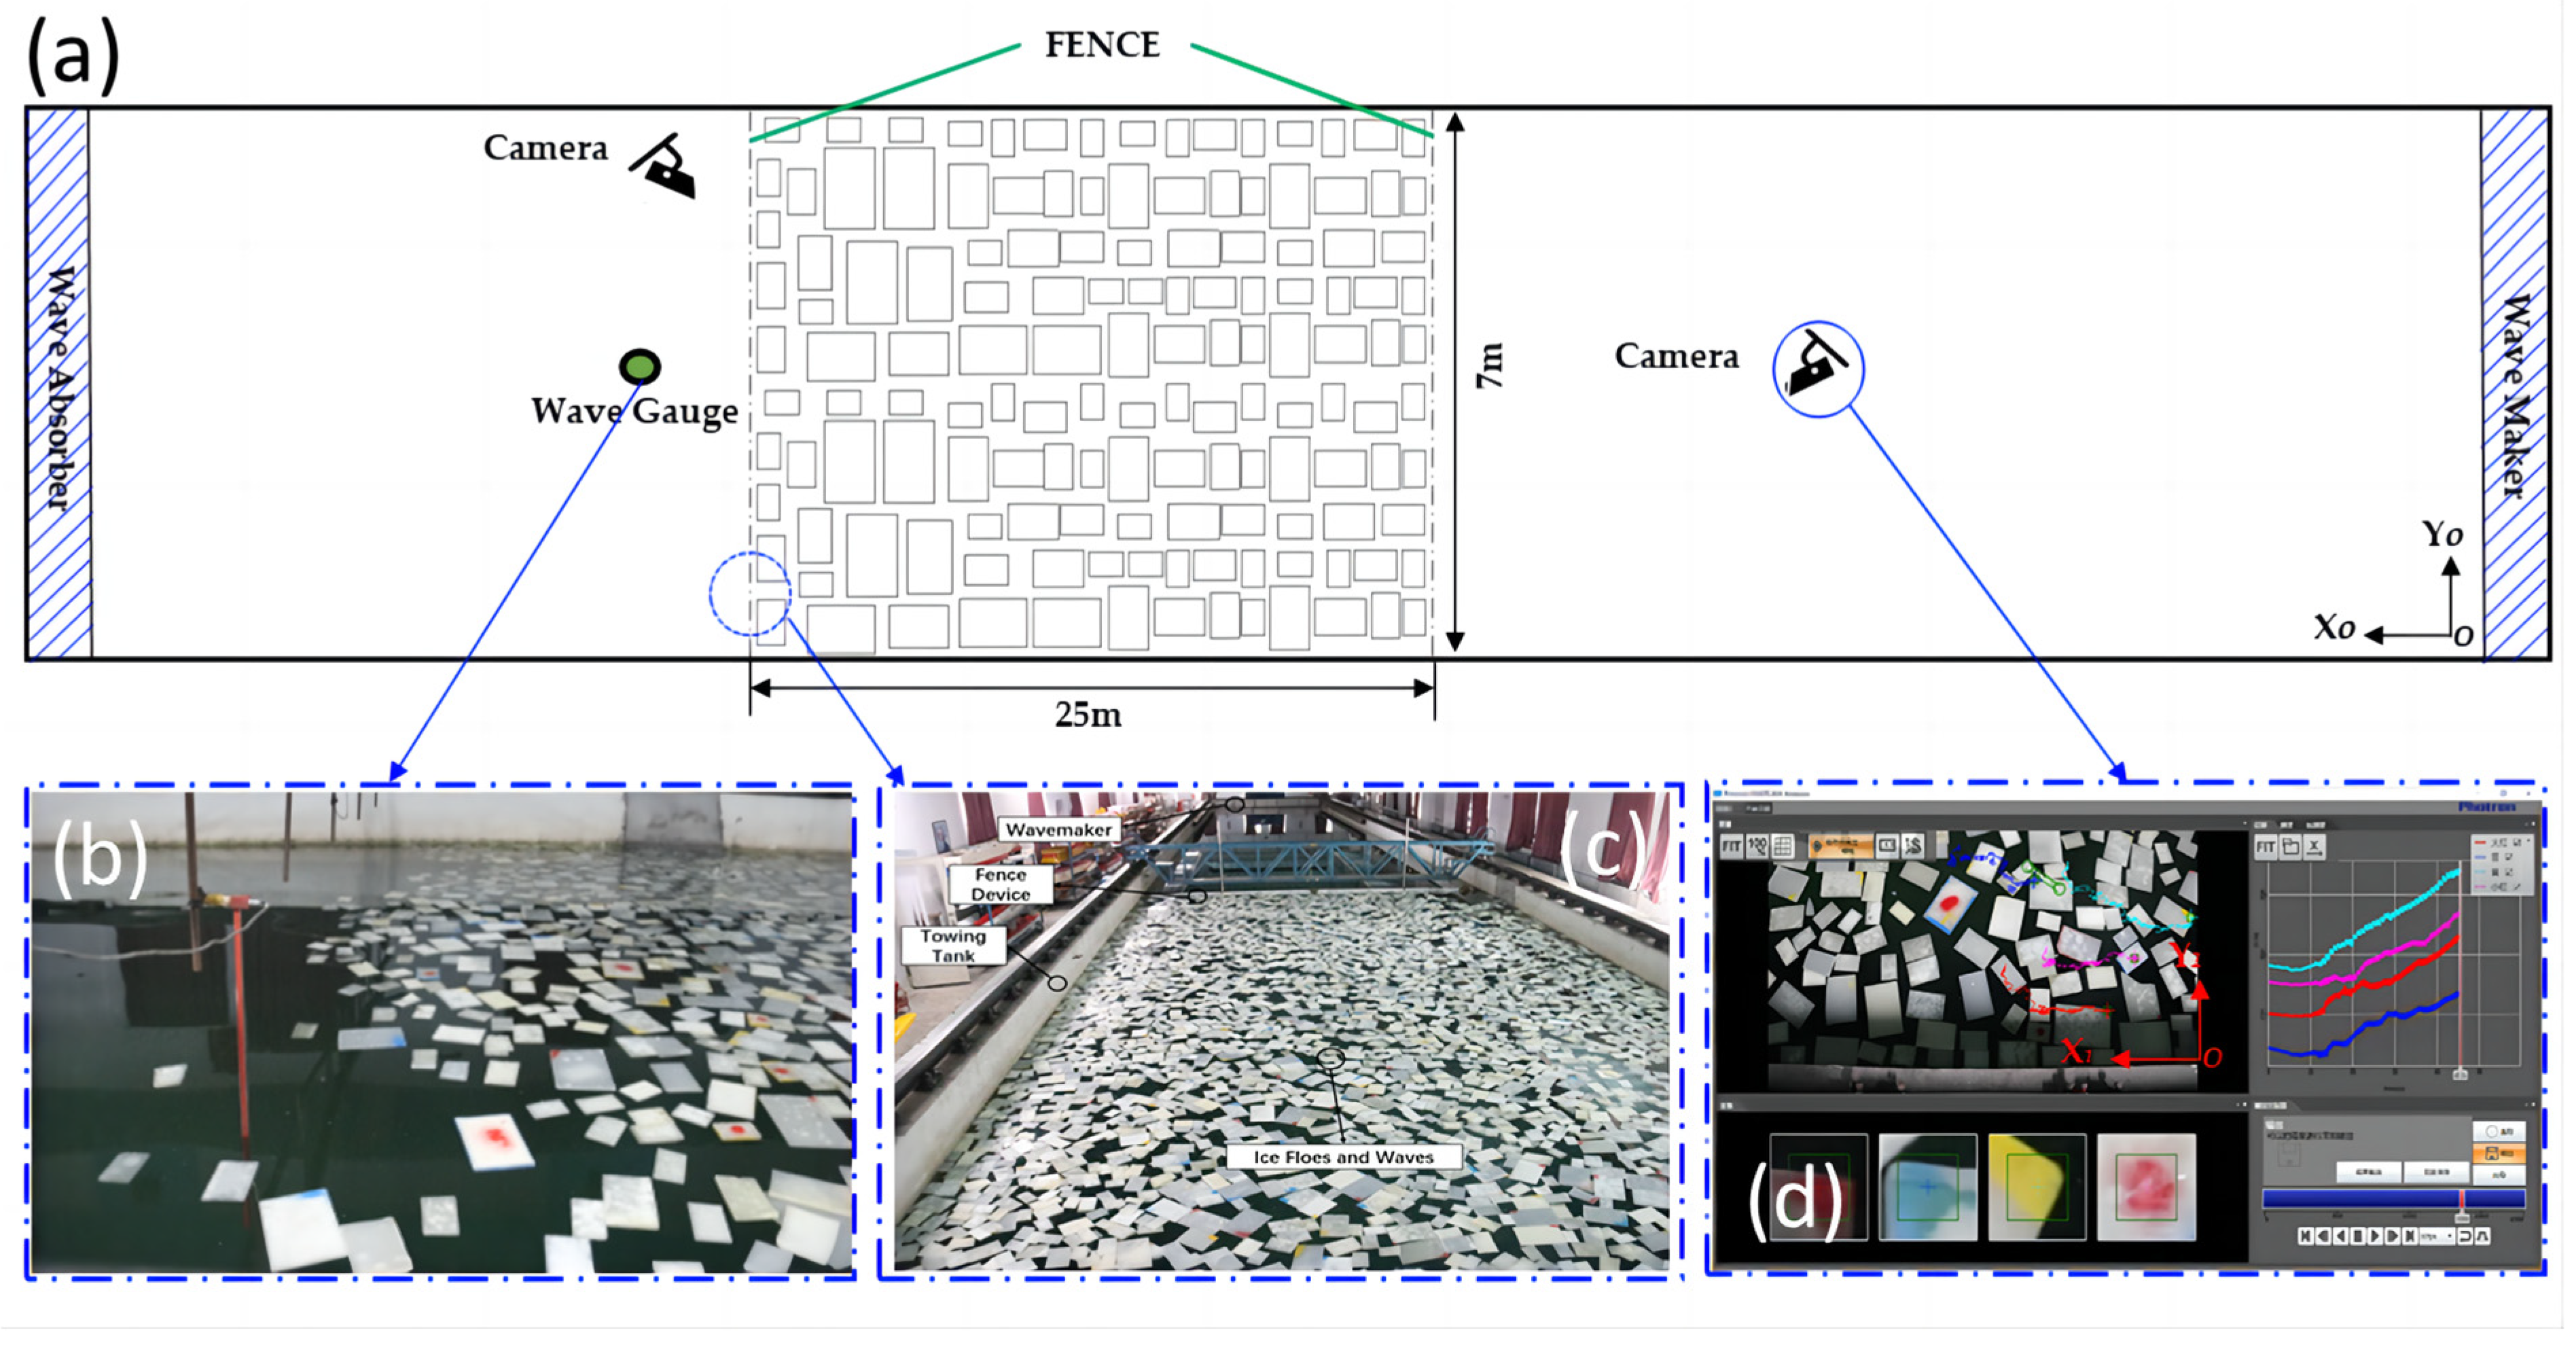
The wave–ice floe model test was conducted at Harbin Engineering University’s towing tank [46]. The towing pool has dimensions of 108 m in length, 7 m in width, and 3.5 m in depth. The experiment utilized a vertical paddle-type wavemaker capable of generating regular waves as well as irregular waves. The model ice employed in this study was prepared from #58 semi-refined granular paraffin, possessing a density and ship-ice friction coefficient similar to that of actual sea ice. The dimensions and number of the model ice were determined based on the ice conditions observed in the MIZ of the Weddell Sea [47]. A rectangular model ice with an aspect ratio ranging from 1.3 to 1.6 was chosen, ensuring its size and quantity corresponded to those of the actual sea ice in the studied region, employing a scaling ratio of 1:45 [23]. Table 1 presents the number and dimensions of the model ice. The average size of the model ice (Lave) is determined to be 15.46 cm. Distinct colors of spray paint were utilized to designate the larger sizes of 14 cm × 21 cm, 16 cm × 24 cm, and 18 cm × 27 cm, while the smallest size of 8 cm × 12 cm served as the control. A total of 9219 ice floes were utilized in the experiment. The test was conducted in two separate scenarios, namely 60% and 90% ice concentration.
The ice floes were spatially organized within a designated area spanning 25 m in length and 7 m in width, thereby yielding a cumulative surface area of approximately 157.5 m2. A schematic representation of the experimental setup can be seen in Figure 3. A fencing device, consisting of PVC floats and barbed wire, was employed to prevent the displacement of ice floes beyond the intended area. Furthermore, the fencing positioned at the wave entrance is fixed in a movable trailer, which is utilized for the purpose of change the ice concentration to 60%. Two high-speed cameras were positioned on the side and middle of the towing pool to record the trajectory of the ice floes. Subsequently, the video footage underwent post-processing using Photron FASTCAM Analysis software (https://techimaging.com/products/high-speed-cameras/software/photron-software/product/photron-fastcam-analysis, accessed on 22 November 2023) to extract crucial information such as the longitudinal motion amplitude and drift velocity of the ice floes. To ensure accuracy, multiple tests were conducted, and the average values were derived.

4. Results and Discussion

4.1. Wave Accuracy Verification

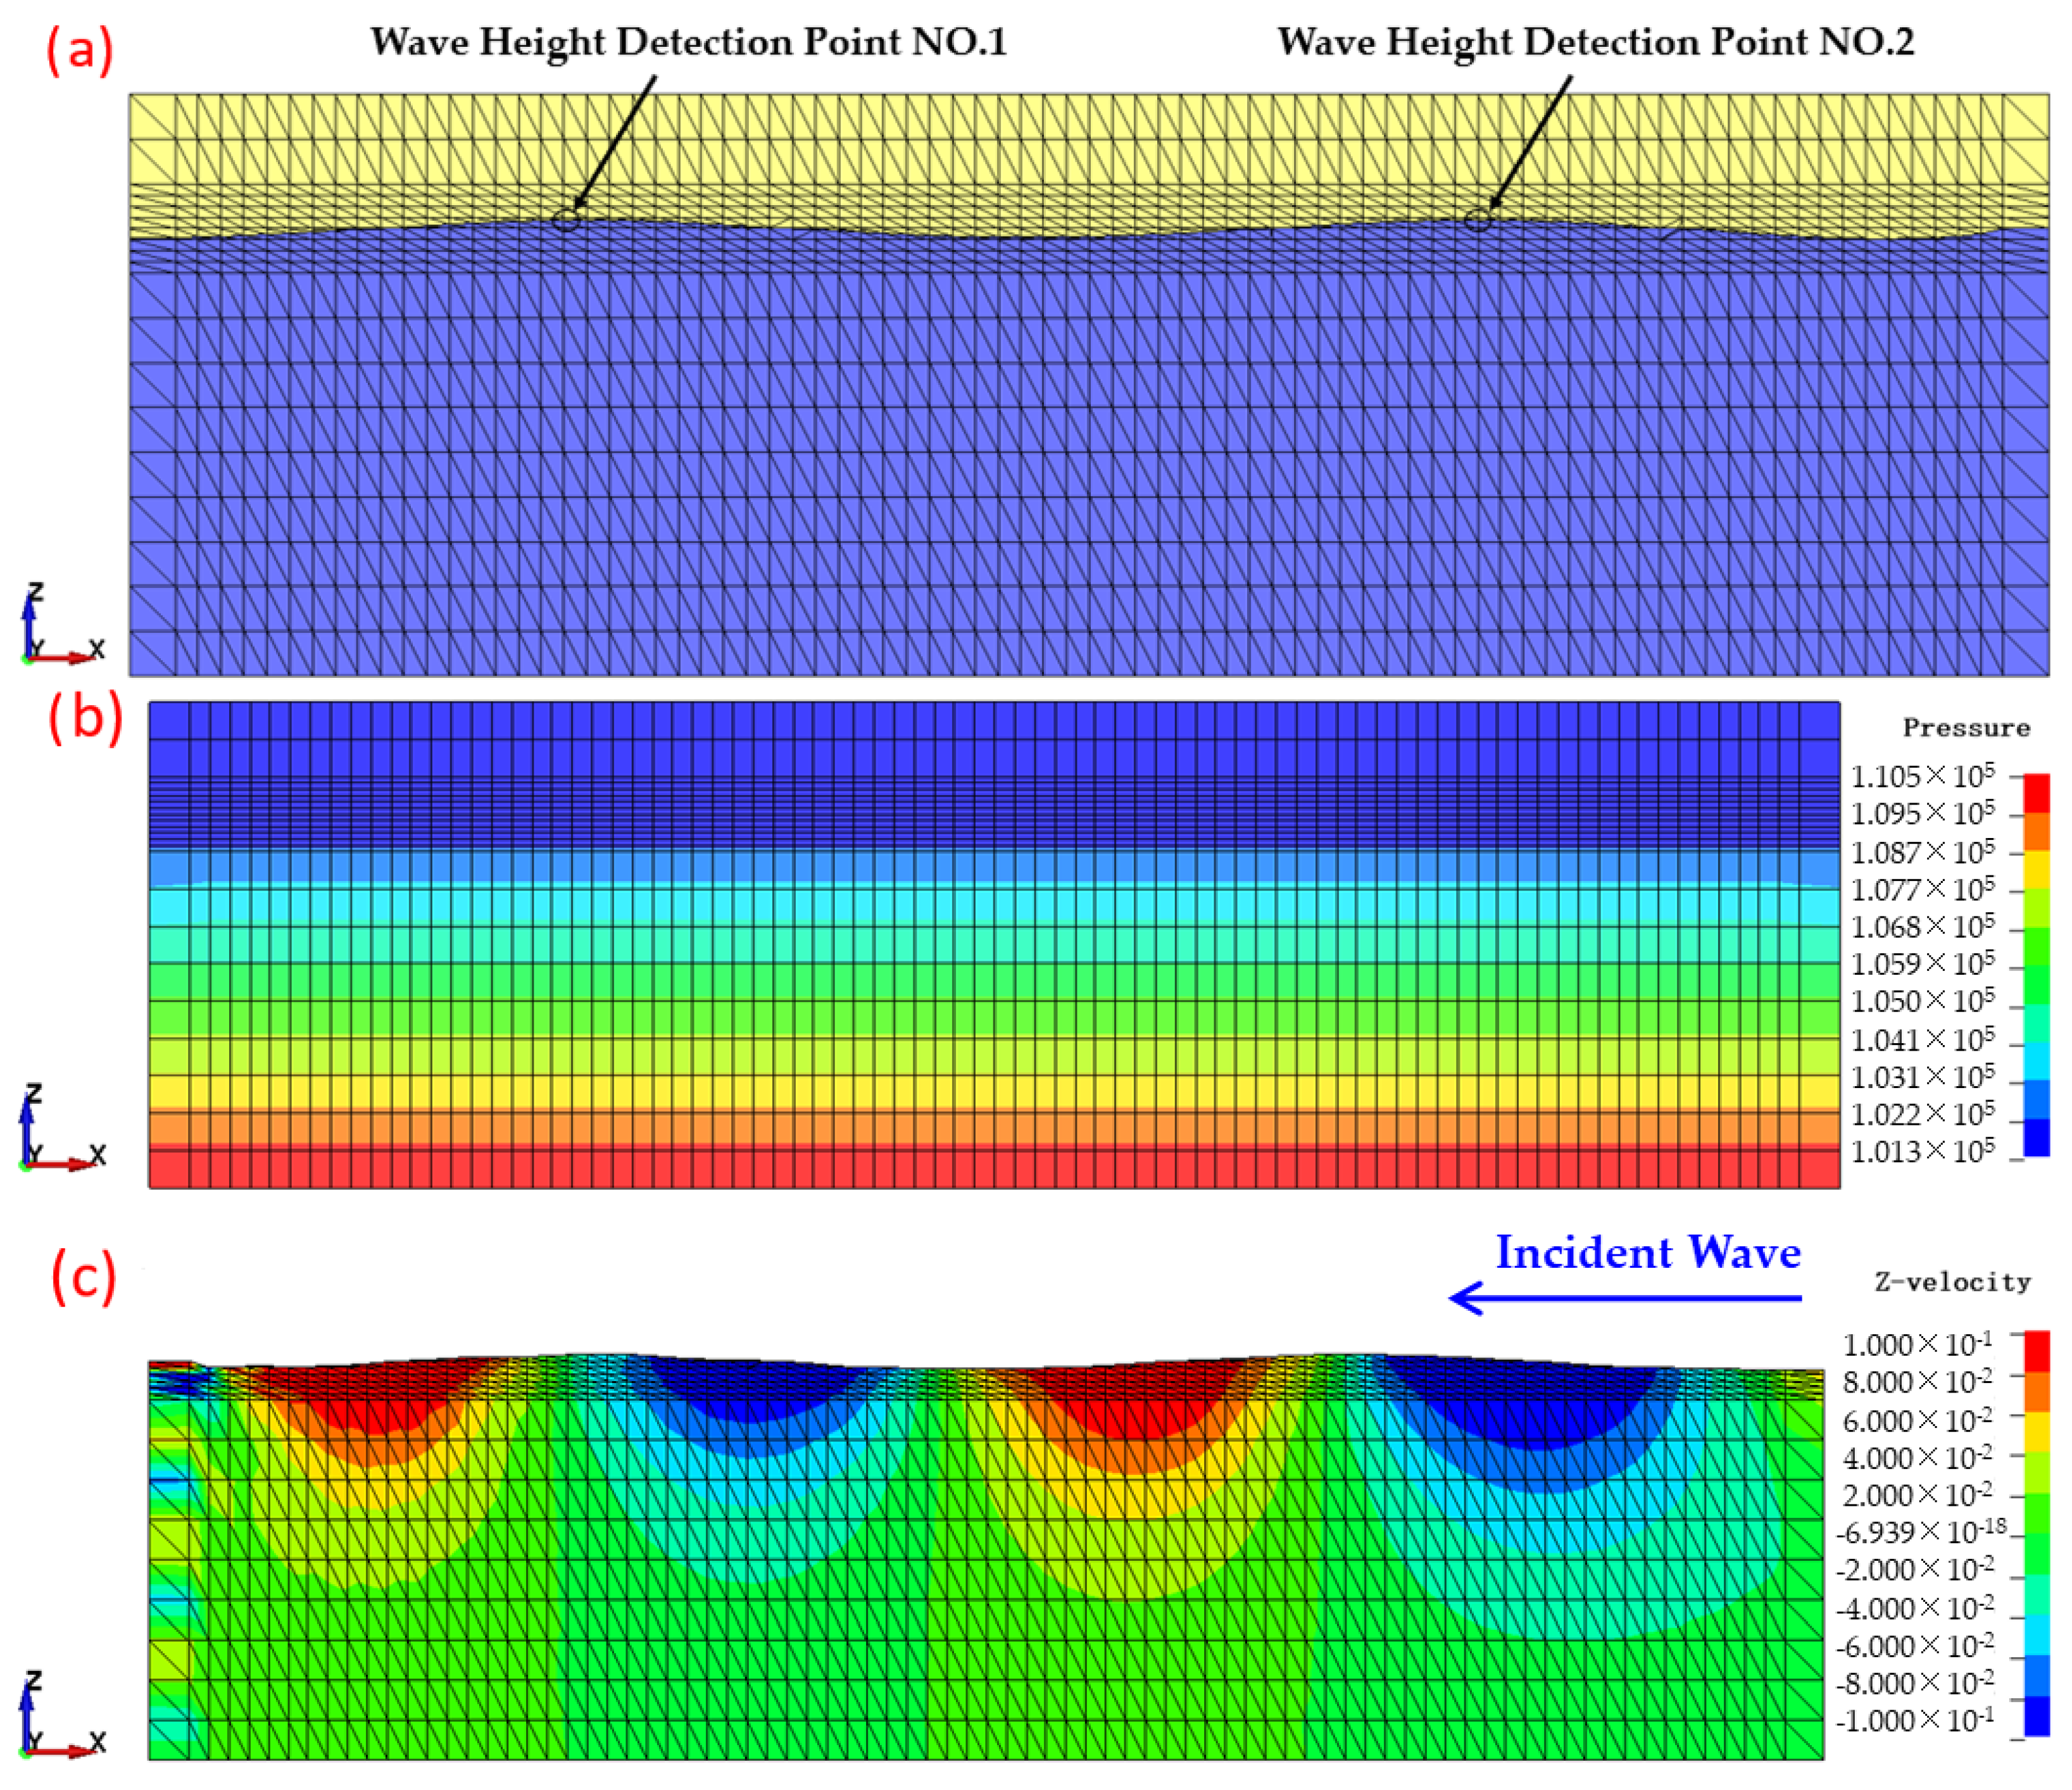
Initially, the two-dimensional wave propagation problem is used to verify that the numerical wave tank is reliable and accurate. This simulation is conducted using regular waves characterized by wavelengths of 2 m and wave heights of 0.04 m. The numerical wave tank employs structured meshes to discretize both the air domain, with dimensions of 4.2 m × 0.3 m, and the water domain, with dimensions of 4.2 m × 1.0 m. The non-encrypted region is assigned a mesh size of 0.1 m, while the encrypted region is assigned a mesh size of 0.025 m. According to the recommendation given by LSTC [40], *MAT_NULL and *EOS_LINEAR_POLYNOMIAL are employed to simulate the air and water. Table 2 lists the air and water parameters. An absorptive boundary condition is established on the X+ side to enable the plane wave to enter and leave the domain without any notable reflections. The remaining boundaries are enforced with displacement-constraint wall boundaries.
Given that the numerical wave tank’s length is twice the wavelength of the incident wave, it is possible to observe two complete wave profiles within the flow field. In Figure 4a, two wave gauges are positioned along the direction of wave propagation, with a spacing of 1.95 m. The free-surface elevation amplitude at monitoring point #1 is measured to be 0.0198 m, while at monitoring point #2 it is measured to be 0.0196 m. The relative errors, expressed as a percentage of the theoretical amplitude (0.02 m), are 1% and 2% for monitoring point #1 and #2, respectively. The level of accuracy is deemed satisfactory. Figure 4b displays the simulated outcomes of hydrostatic pressure, while Figure 4c exhibits the cloud diagram of vertical velocity across the entire fluid domain.

4.2. Numerical Modeling of Ice Floe–Wave Interaction

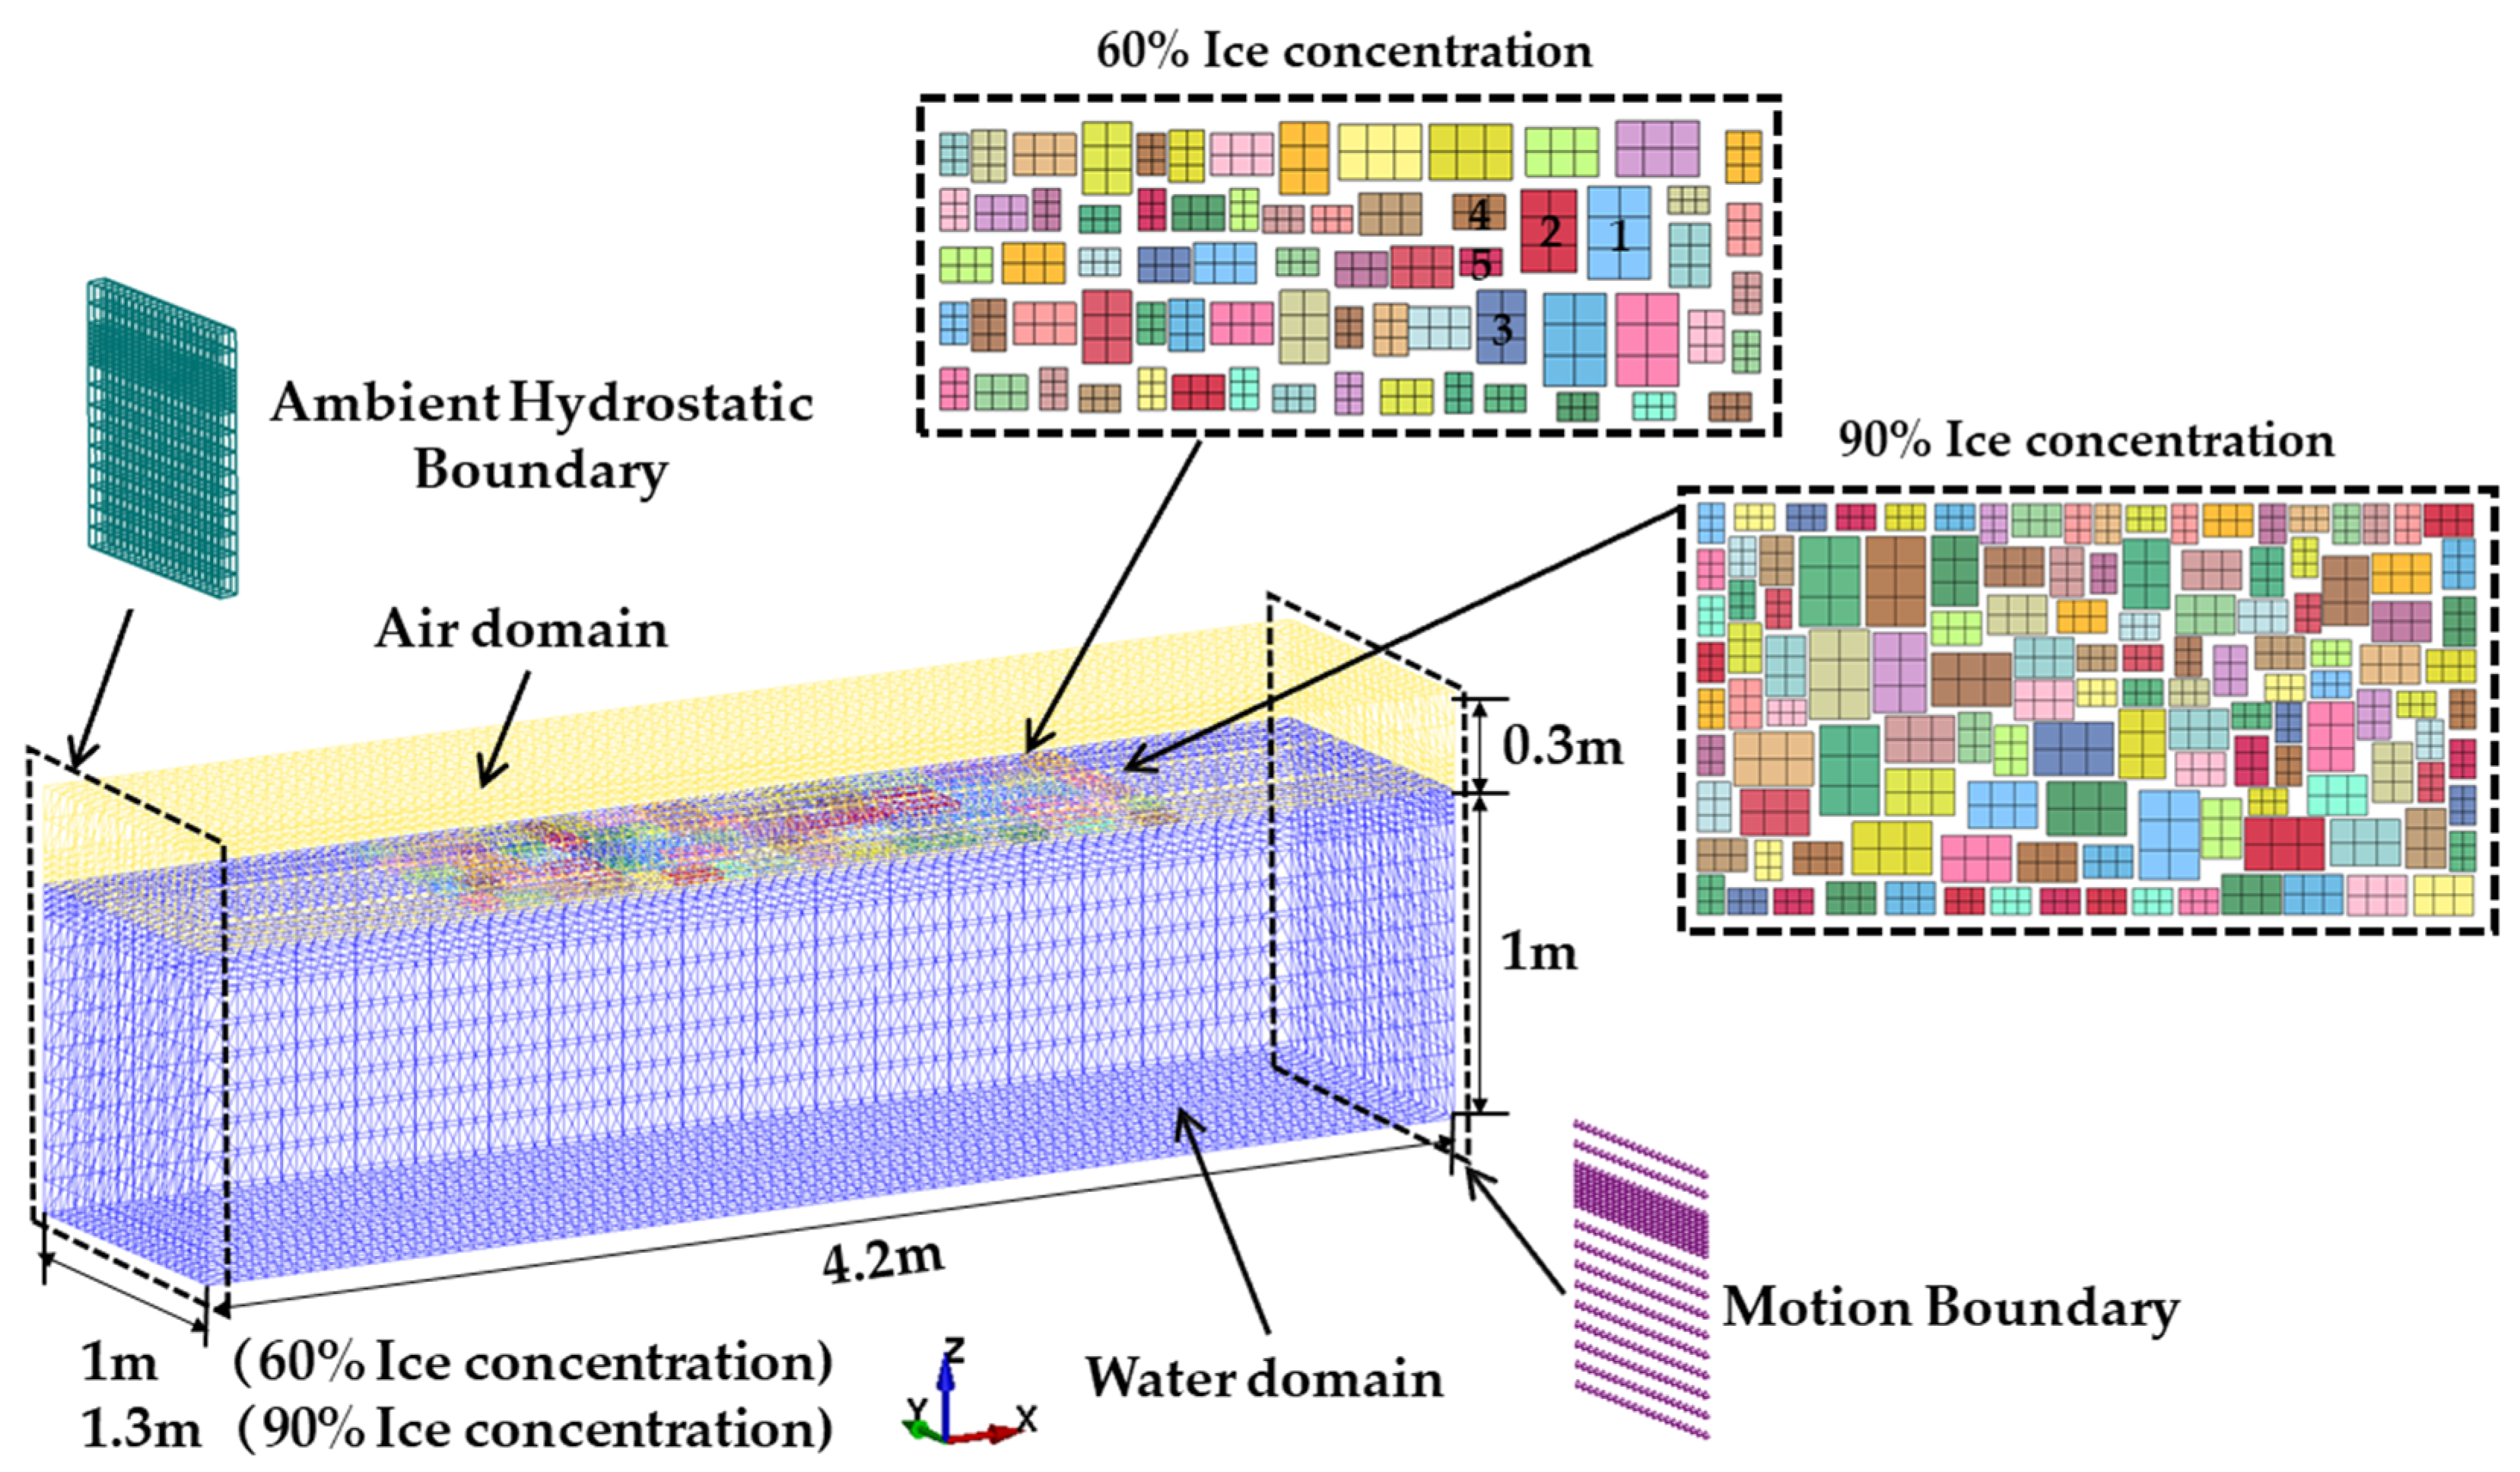
To investigate the relationship between wave action and the motion response of ice floes, a scaled-down numerical model was employed to monitor the motion state of the ice floes, while ensuring the preservation of ice size and distribution. Figure 5 illustrates the numerical model depicting the interaction between ice floes and waves, which is an extension of the 2D numerical model presented in Section 4.1. In order to account for the sensitivity of FSI analysis to mesh proportions, mesh convergence tests are conducted. The three-dimensional fluid mesh size is derived from the expansion of the two-dimensional example grid in Section 4.1, ensuring enhanced numerical accuracy and computational efficiency. The ice floes in question have been attributed with linear elastic material properties, including a density of 870 kg/m3, a Poisson’s ratio of 0.3, and a Young’s modulus of 5.8 × 10⁹ Pa. Given the heightened frequency of collisions within the ice floes, their motion response and state become more apparent. Consequently, various internal ice floes of varying sizes, located in proximity to the direction of the incident wave, have been designated as ICE 1–ICE 5 for monitoring purposes within a 60% ice concentration.
The working conditions for numerical calculations were established based on the wave parameters of the actual marginal ice zone (MIZ), as indicated in Table 3. Specifically, the wave model’s height was set at 0.04 m, the model’s wavelength was refined to encompass the long-wave range (2.5 m) in addition to the short-wave range (0.5 m), and the numerical model’s scaling ratio was maintained at 1:45, aligning with the scaling ratio of the ice floes.

4.3. The Longitudinal Motion Response of Ice Floes under the Influence of Wave Action

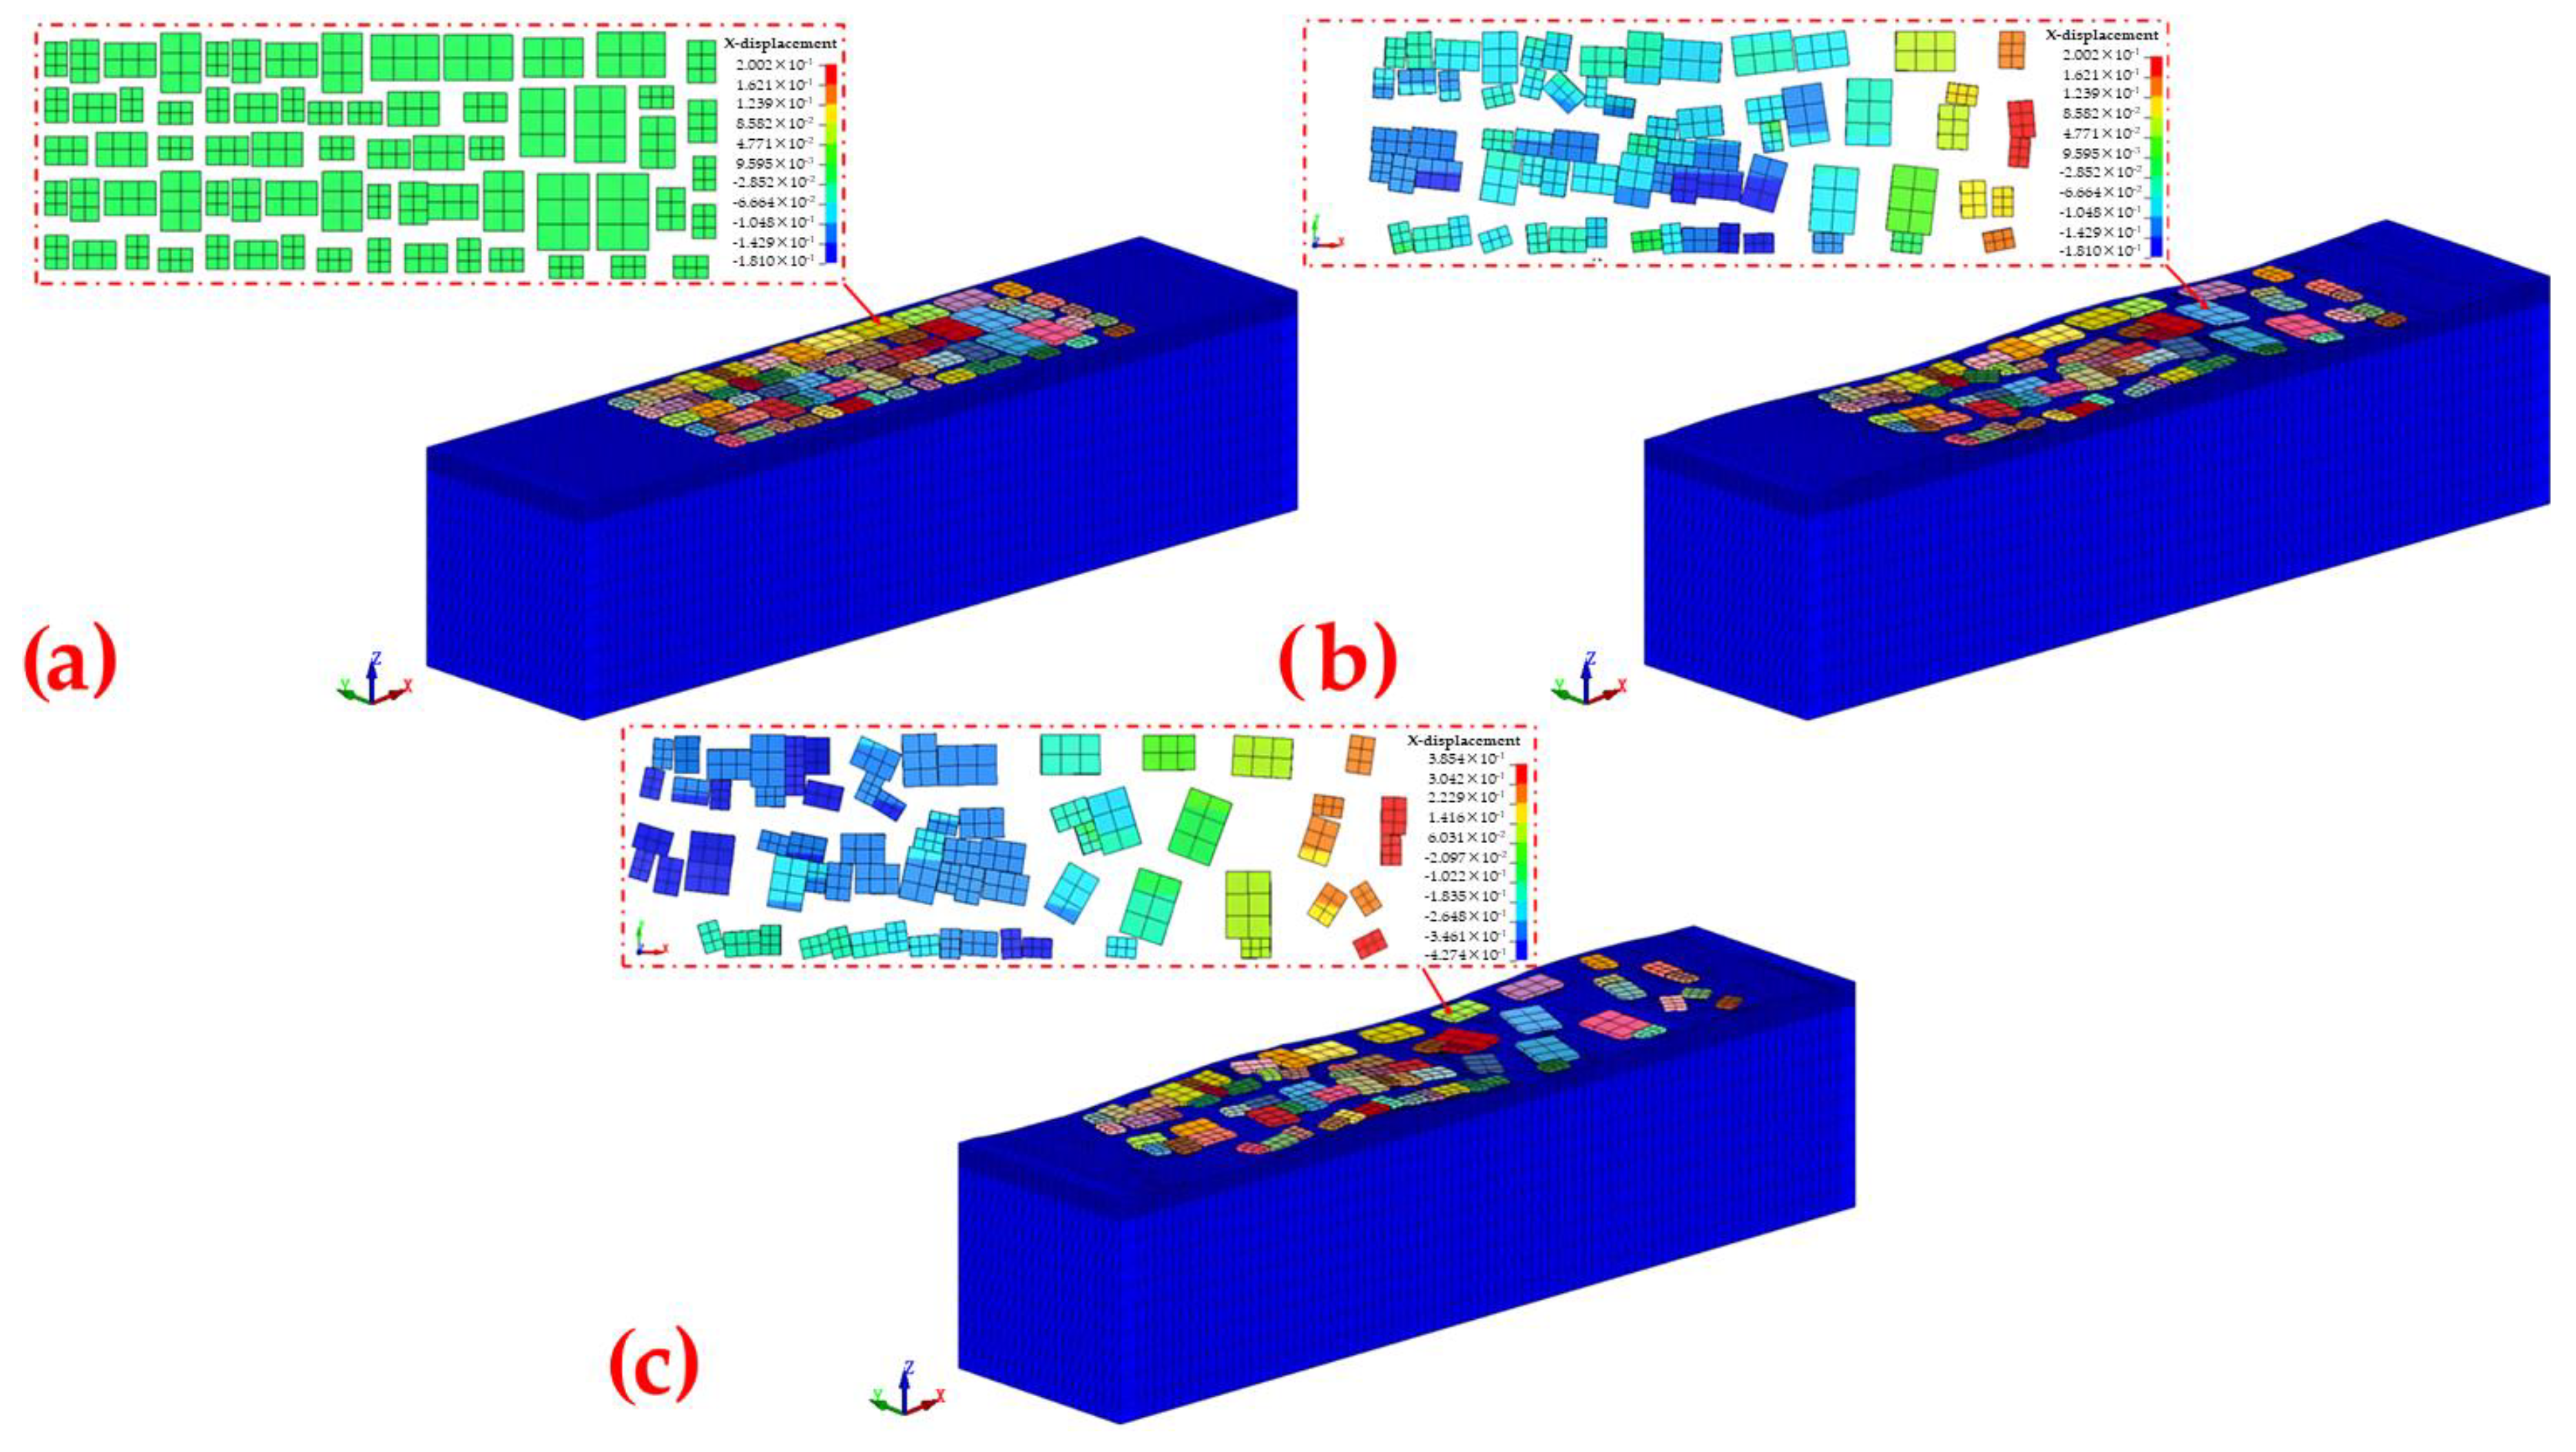
The numerical simulation of the motion of the ice floes at different moments under the working conditions of 60% ice concentration, 2 m wavelength, and 0.04 m wave height is shown in Figure 6. In contrast to the ice floes located further from the wave-making boundary, as depicted in Figure 6a–c, the ice floes in closer proximity to the numerical wave-making boundary, specifically those positioned on the side facing the waves, exhibit more pronounced longitudinal movement. Moreover, these ice floes are more prone to collisions with adjacent ice floes. Conversely, the ice floes situated farther from the wave-making boundary gradually converge towards each other. In comparison to their counterparts on the wave-facing side, these ice floes demonstrate less dynamic motion and display a more stable performance.
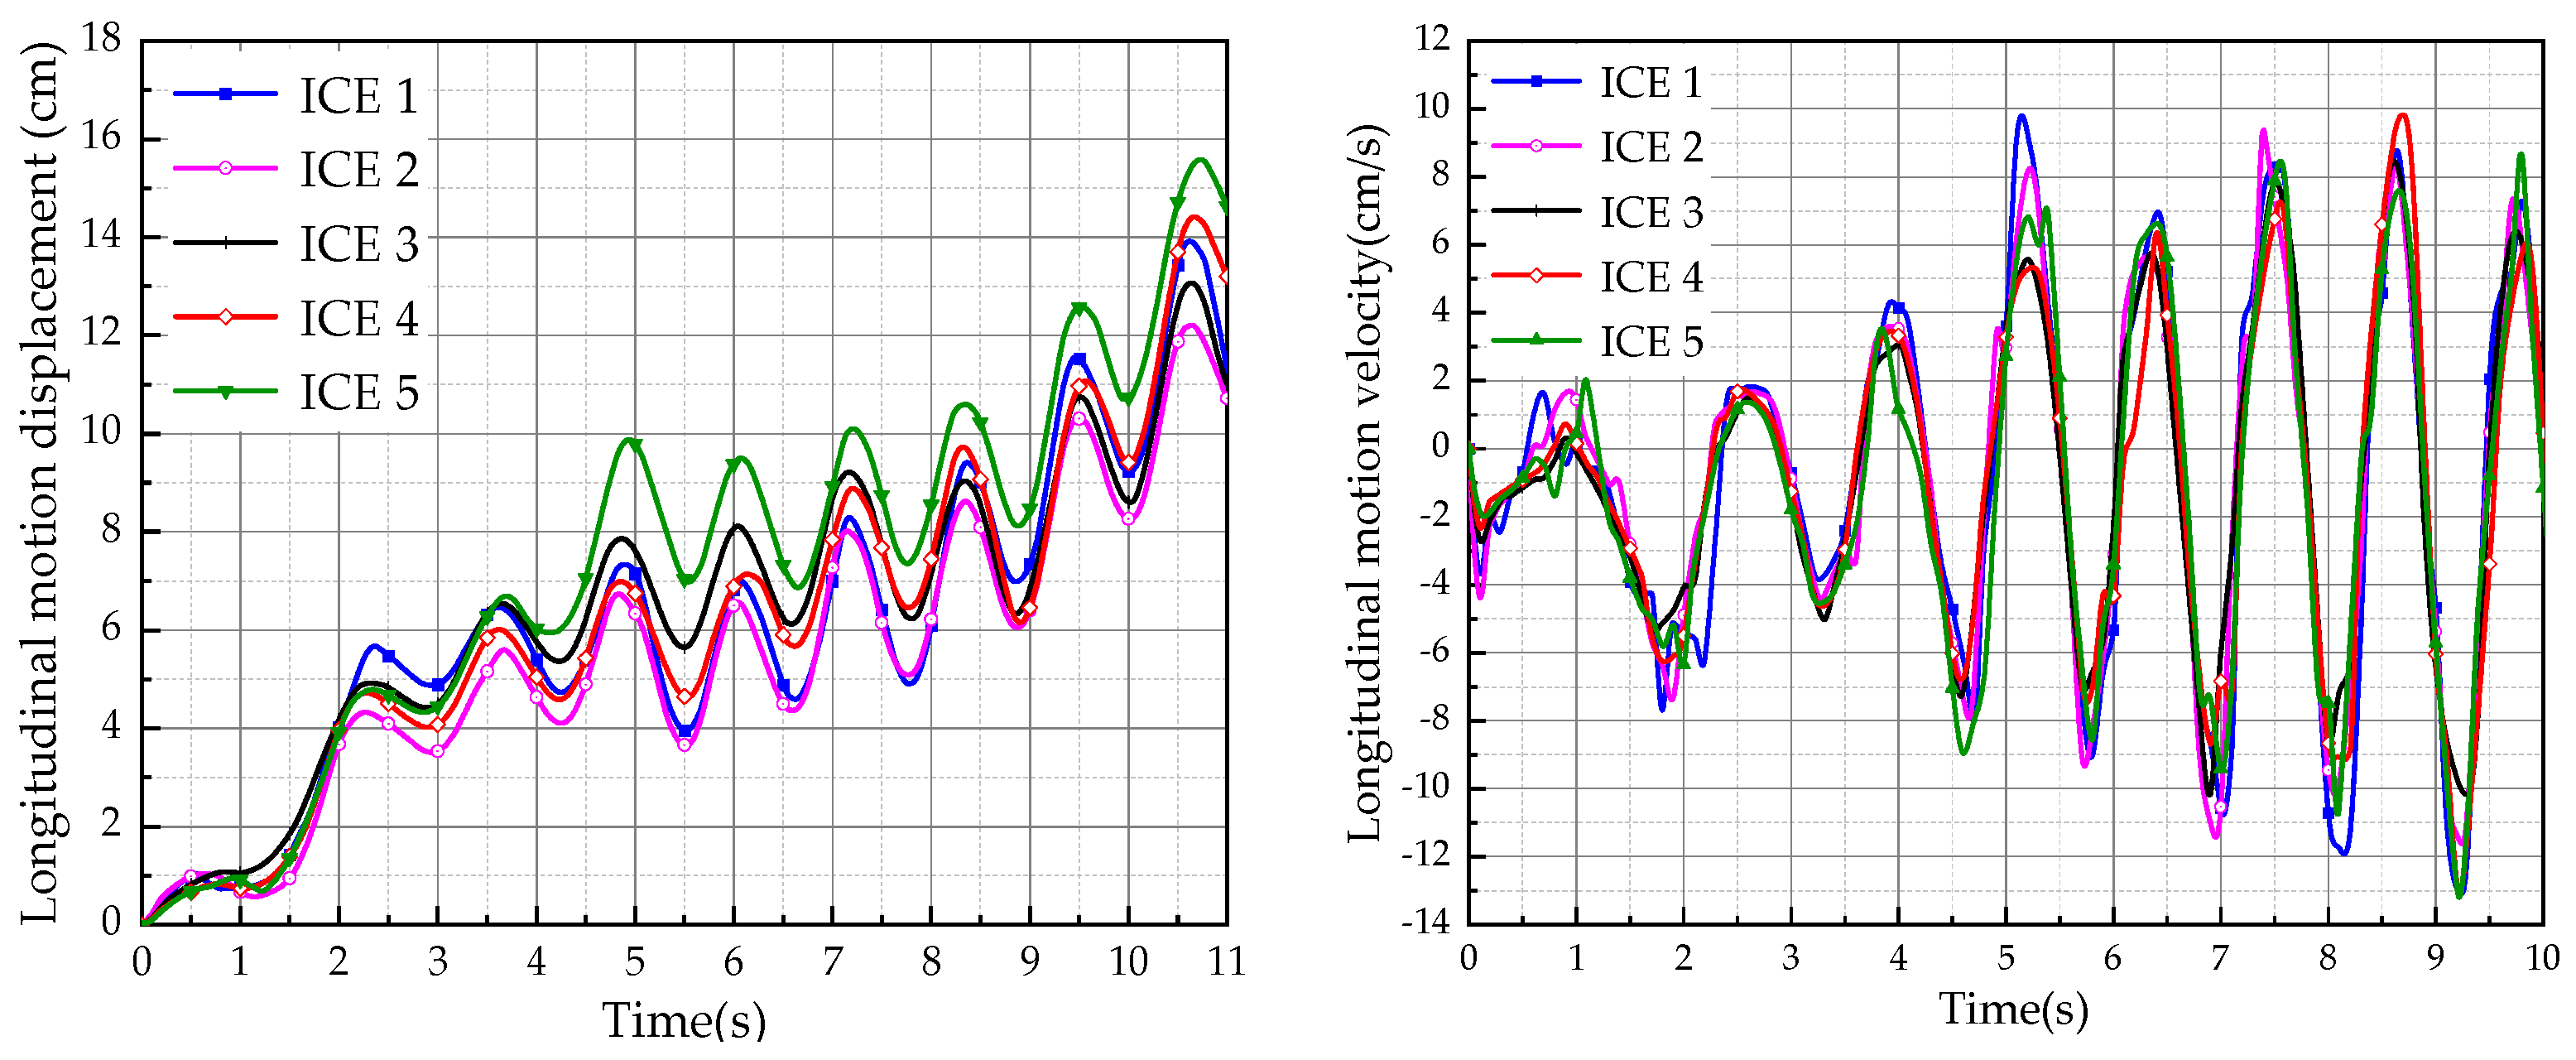
Depict the longitudinal motion displacement and velocity of the ice floes under wave action at a 60% ice concentration, 2 m wavelength, and 4 cm wave height condition, as illustrated in Figure 7. The longitudinal drift velocity, surge amplitude, and surge period of the tagged model ice floes were acquired and compared with the experimental data presented in Table A1 under the same conditions. The determination of the mean drift velocity of ice floes involved the calculation of the average drift velocities of ICE 1-ICE 5. Similarly, the mean amplitude of surge velocity and surge period were computed using the same methodology.
The numerical calculation resulted in a mean drift velocity of 1.21 cm/s for the longitudinal motion of the ice floes, displaying a discrepancy of 15.1% when compared to the experimental value of 1.051 cm/s. Likewise, the mean amplitude of the surge velocity of the ice floes was established as 12.29 cm/s, with a deviation of 2.2% from the experimental value of 12.018 cm/s. Furthermore, the mean value of the period of the longitudinal surge of the ice floe is found to be 1.12 s, displaying an error of 0.6% when compared to the experimental value of 1.127 s.
The analysis demonstrates that there is a significant error in the mean drift velocity of the longitudinal motion of the ice floes. However, the errors in the amplitude and period of the longitudinal oscillatory motion velocity of the ice floes are minimal. The congruity between numerical modeling and ice floe testing is impeded by discrepancies in the initial positions of the modeled ice formations, as well as disparities in the collision dynamics among the ice floes, which impact the collective motion response of the ice formations. Furthermore, the utilization of an elastic substance in the numerical simulation fails to accurately represent the physical characteristics of the paraffin non-freezing model ice material employed in the experimental testing.
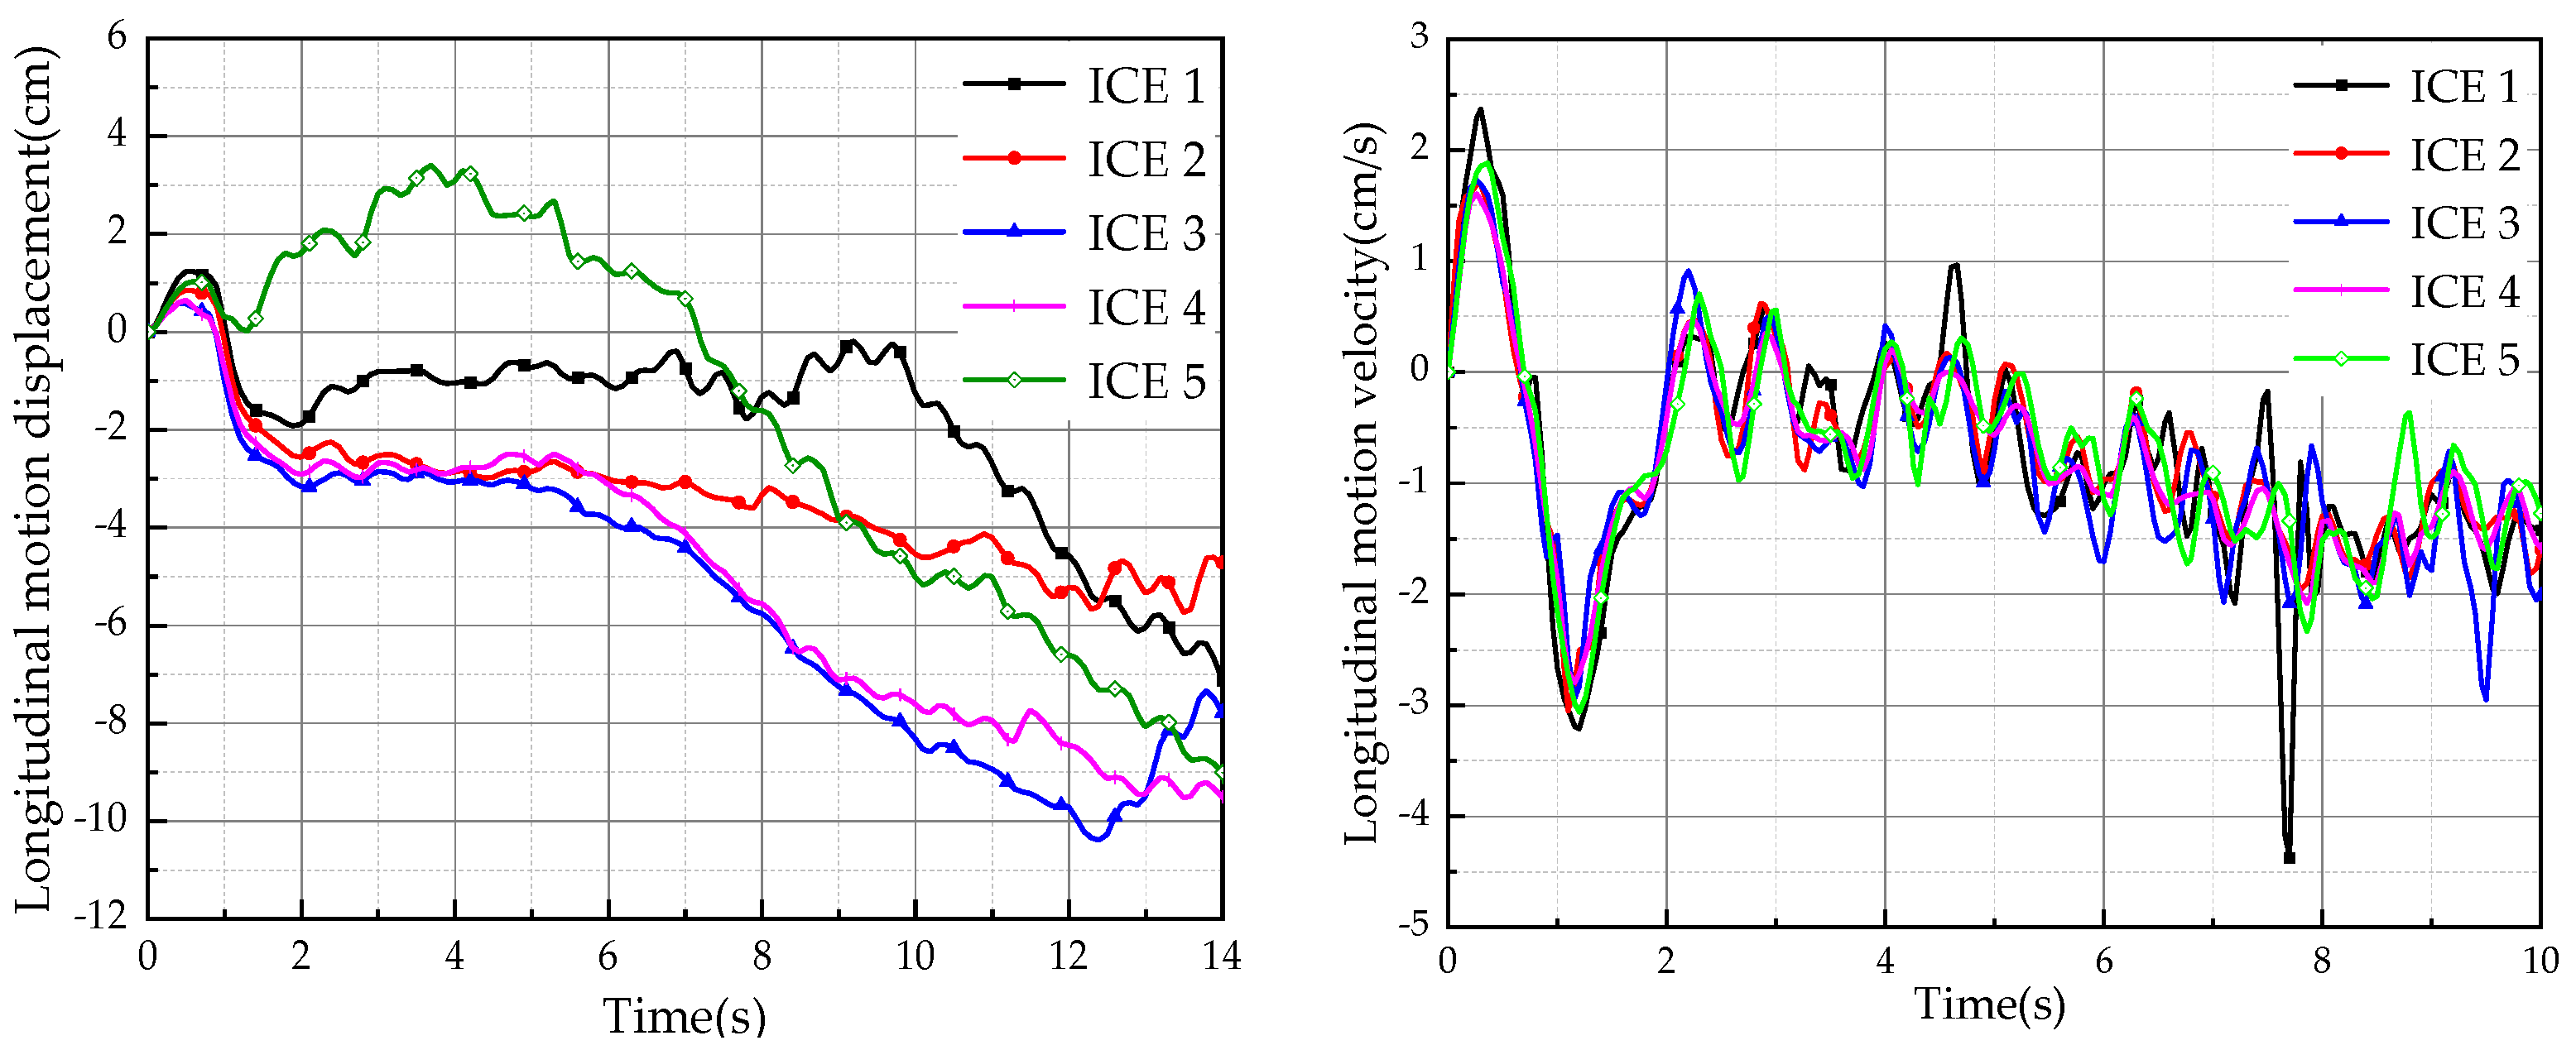
The ice floes exhibited two distinct types of motion states, namely irregular motion and regular motion, when subjected to varying wavelengths. Figure 8 illustrates the longitudinal motion displacement and velocity time history curves of the ice floes under specific conditions, including 60% ice concentration, 4 cm wave height, and 0.5 m wavelength.
By conducting a comparative analysis of Figure 7 and Figure 8, and incorporating findings from the literature [48], it becomes evident that the longitudinal movement of ice floes, influenced by waves of varying wavelengths, exhibits two distinct motion states: irregular and regular. Specifically, ice floes within the short-wave range predominantly exhibit irregular motion, while those within the long-wave range demonstrate regular motion akin to isolated ice floes.
The extracted data include longitudinal drift velocity, longitudinal surge amplitude, and the longitudinal period of the tagged ice floes under wave action. The longitudinal motion response data of the ice floes at 60% and 90% ice concentrations are presented in Table A2 and Table A3. The analysis of Table A1, Table A2 and Table A3 reveals that the longitudinal motion response of the ice floes under wave action is not significantly influenced by the size of each individual ice floe. When the wavelength λ ≤ 0.7 m, the movement of the ice floes exhibits greater irregularity. Conversely, when λ ≥ 0.9 m, the regular oscillatory motion response closely resembles that of isolated ice floes in general, albeit occasional irregular motions may still arise as a result of collisions.
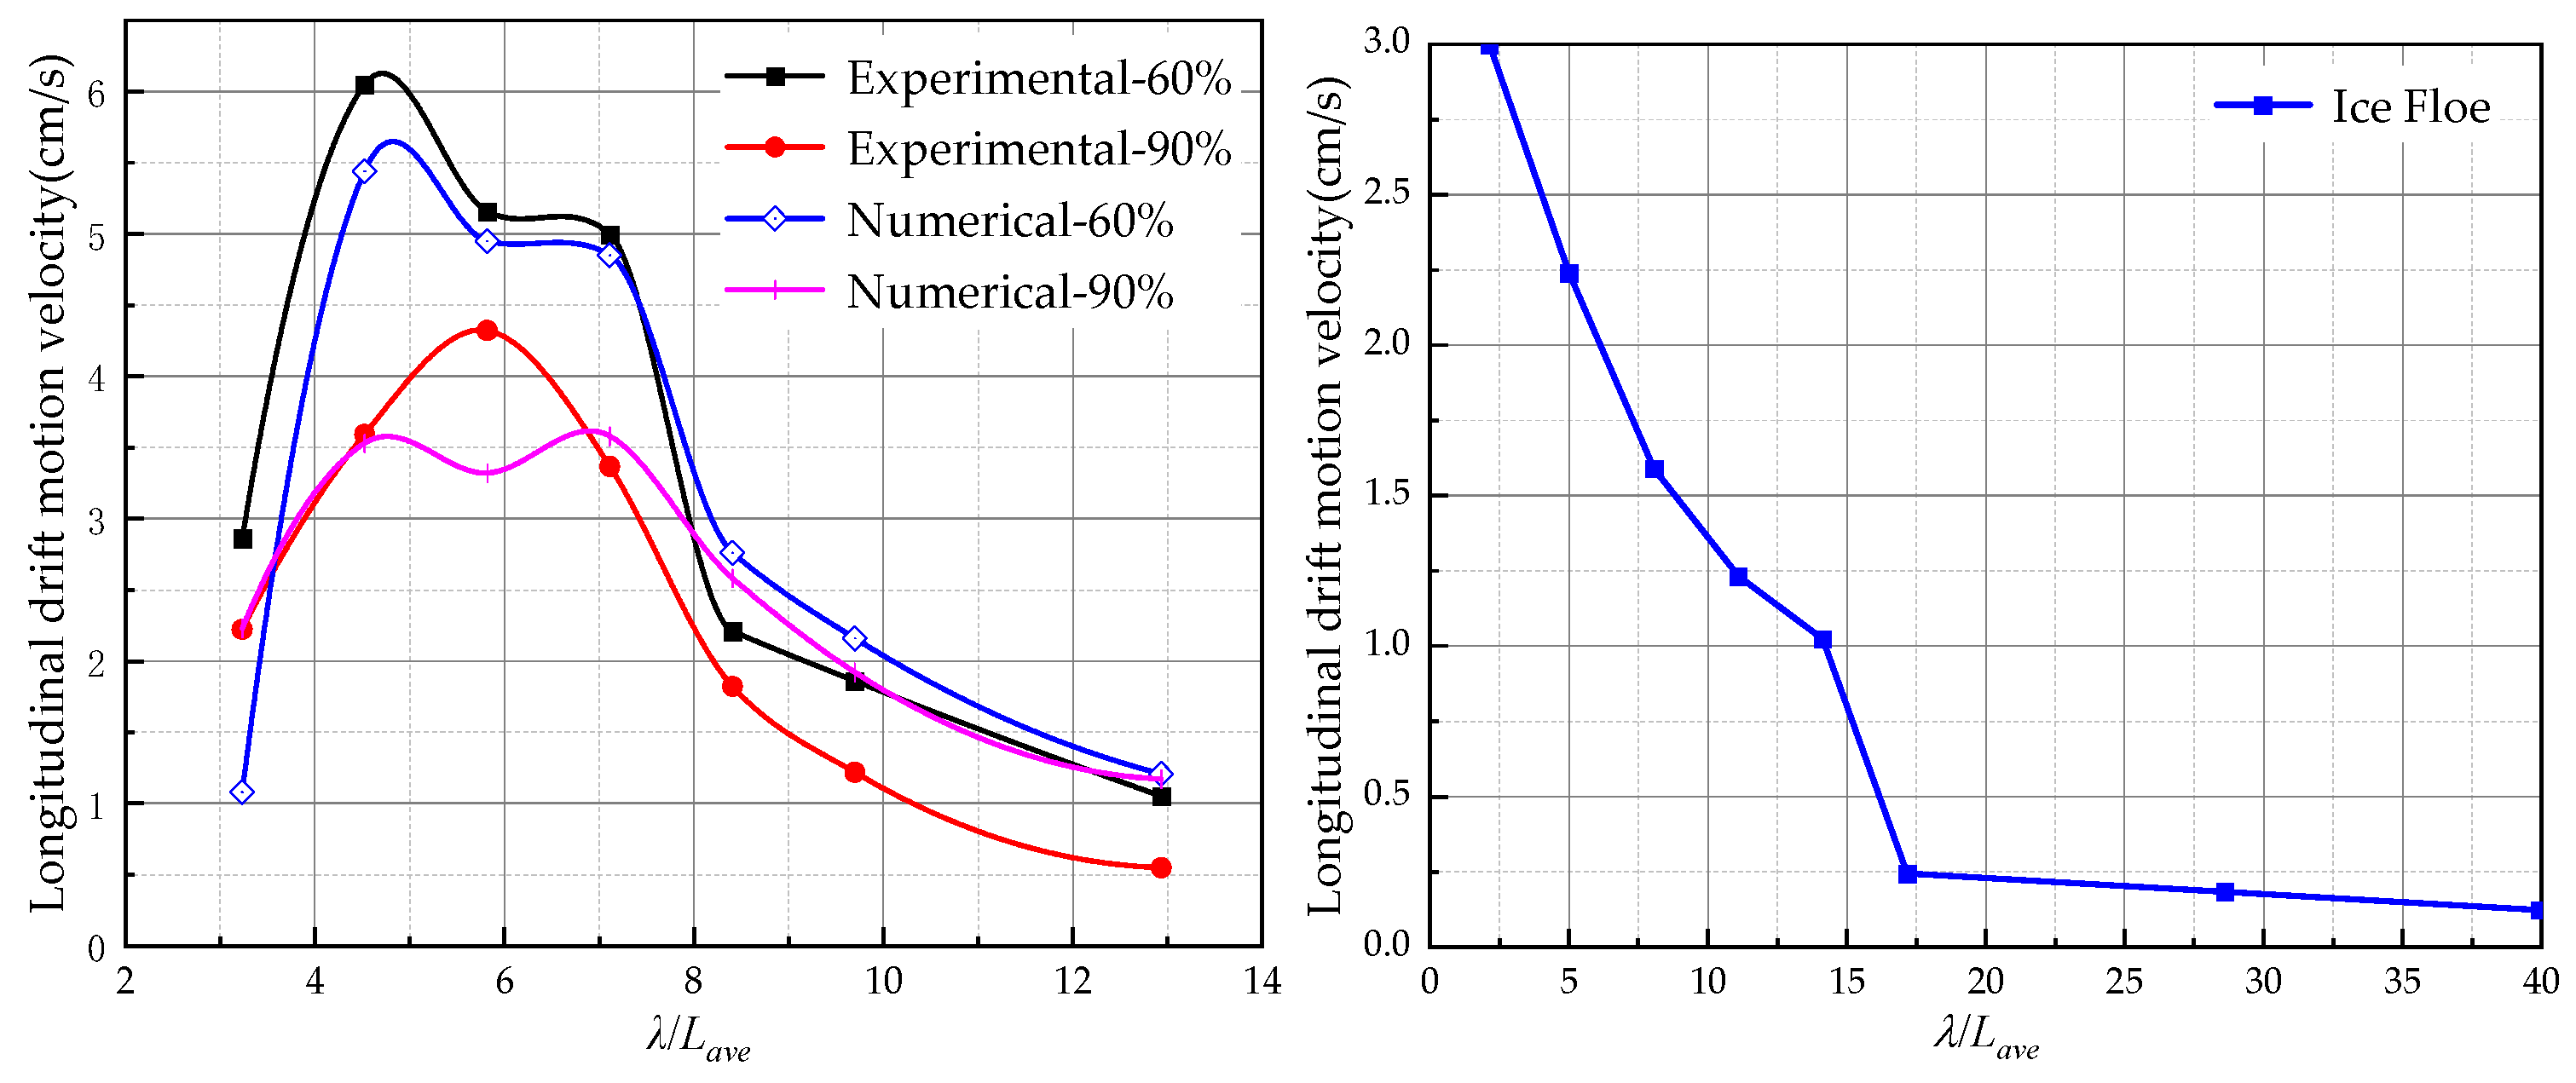
The analysis of the longitudinal motion response of ice floes under wave action is conducted based on numerical and experimental results. In order to derive more generalized conclusions, the dimensionless mean size of ice floes, Lave, is examined in relation to the incident wave wavelength, λ. Figure 9 illustrates the plotted mean velocity of the longitudinal drift motion of ice floes at 60% and 90% ice concentrations against the ratio of wavelength to the mean size of the ice mass (λ/Lave).
The similarity between the longitudinal drift velocity versus wavelength curves of ice floes with varying ice concentrations, as depicted in Figure 9, is evident when comparing the results obtained through numerical and experimental approaches.
The concentration of ice floes significantly influences the mean velocity of longitudinal drift movement. Specifically, ice floes with a 60% ice concentration exhibit a higher mean velocity compared to those with a 90% ice concentration. This trend follows an increasing and then decreasing pattern as the wavelength λ increases. This behavior can be attributed to the reduced spacing between ice floes at higher concentrations, leading to a higher frequency of collisions and, consequently, faster energy dissipation.
At the minimum wavelength (λ/Lave = 3.23), the mean velocity of longitudinal drift motion of ice floes is diminished as a result of the strong interaction between short waves and ice floes, as well as the hindrance caused by collisions between ice floes.
The numerical findings pertaining to the ice floes’ irregular motion range (λ/Lave ≤ 4.53) exhibit consistency with the experimental values’ trend. Moreover, the mean velocity of the longitudinal drift motion experiences an increase as λ/Lave increases, eventually reaching its maximum value around λ/Lave = 5. In the vicinity of λ/Lave = 5.8, a critical wavelength emerges, signifying the transition from the irregular to the regular motion state of the ice floes.
Additionally, the range 4.53 ≤ λ/Lave ≤ 7.11 represents the transition wavelength for the shift from the longitudinal drift motion state of the ice floes. The figures presented in Figure 9 demonstrate the presence of a singularity in the mean velocity curve of the longitudinal drift motion of ice floes within a specific band. This singularity serves as a critical point for the transition of the motion state of the ice floes, commonly referred to as the transition band.
Furthermore, the range of 4.53 ≤ λ/Lave ≤ 7.11 signifies the wavelength range at which the longitudinal drift motion state of the ice floes undergoes a transition. The data depicted in Figure 9 illustrates the existence of a transition band in the average velocity curve of the longitudinal drift motion of ice floes. This transition band plays a pivotal role in the alteration of the motion state of the ice floes.
In the range of the regular motion of ice floes (λ/Lave ≥ 7.11), there exists a disparity between the numerical outcomes and experimental data. Moreover, the rate at which the mean velocity of the longitudinal drift motion of ice floes converges with the increase in λ/Lave, as determined through numerical computations, is evidently slower compared to the experimental findings, particularly at a 90% ice floe concentration. Nevertheless, a discernible trend of decreasing velocity and deceleration of ice floes is observed as λ/Lave increases.
By examining the curves presented in Figure 9, it becomes evident that the mean velocity of the longitudinal drift motion of the isolated ice floe gradually diminishes as λ/Lave increases, ultimately approaching zero [48]. It is apparent that, in comparison to the motion pattern observed in the isolated ice floe, the mean velocity of the longitudinal drift motion of ice floes decays at a faster pace as the wavelength increases. Additionally, there are ranges of irregular motion characterized by short waves, as well as transitional regions from irregular to regular motion.

4.4. The Surge Response of Ice Floes under the Influence of Wave Action

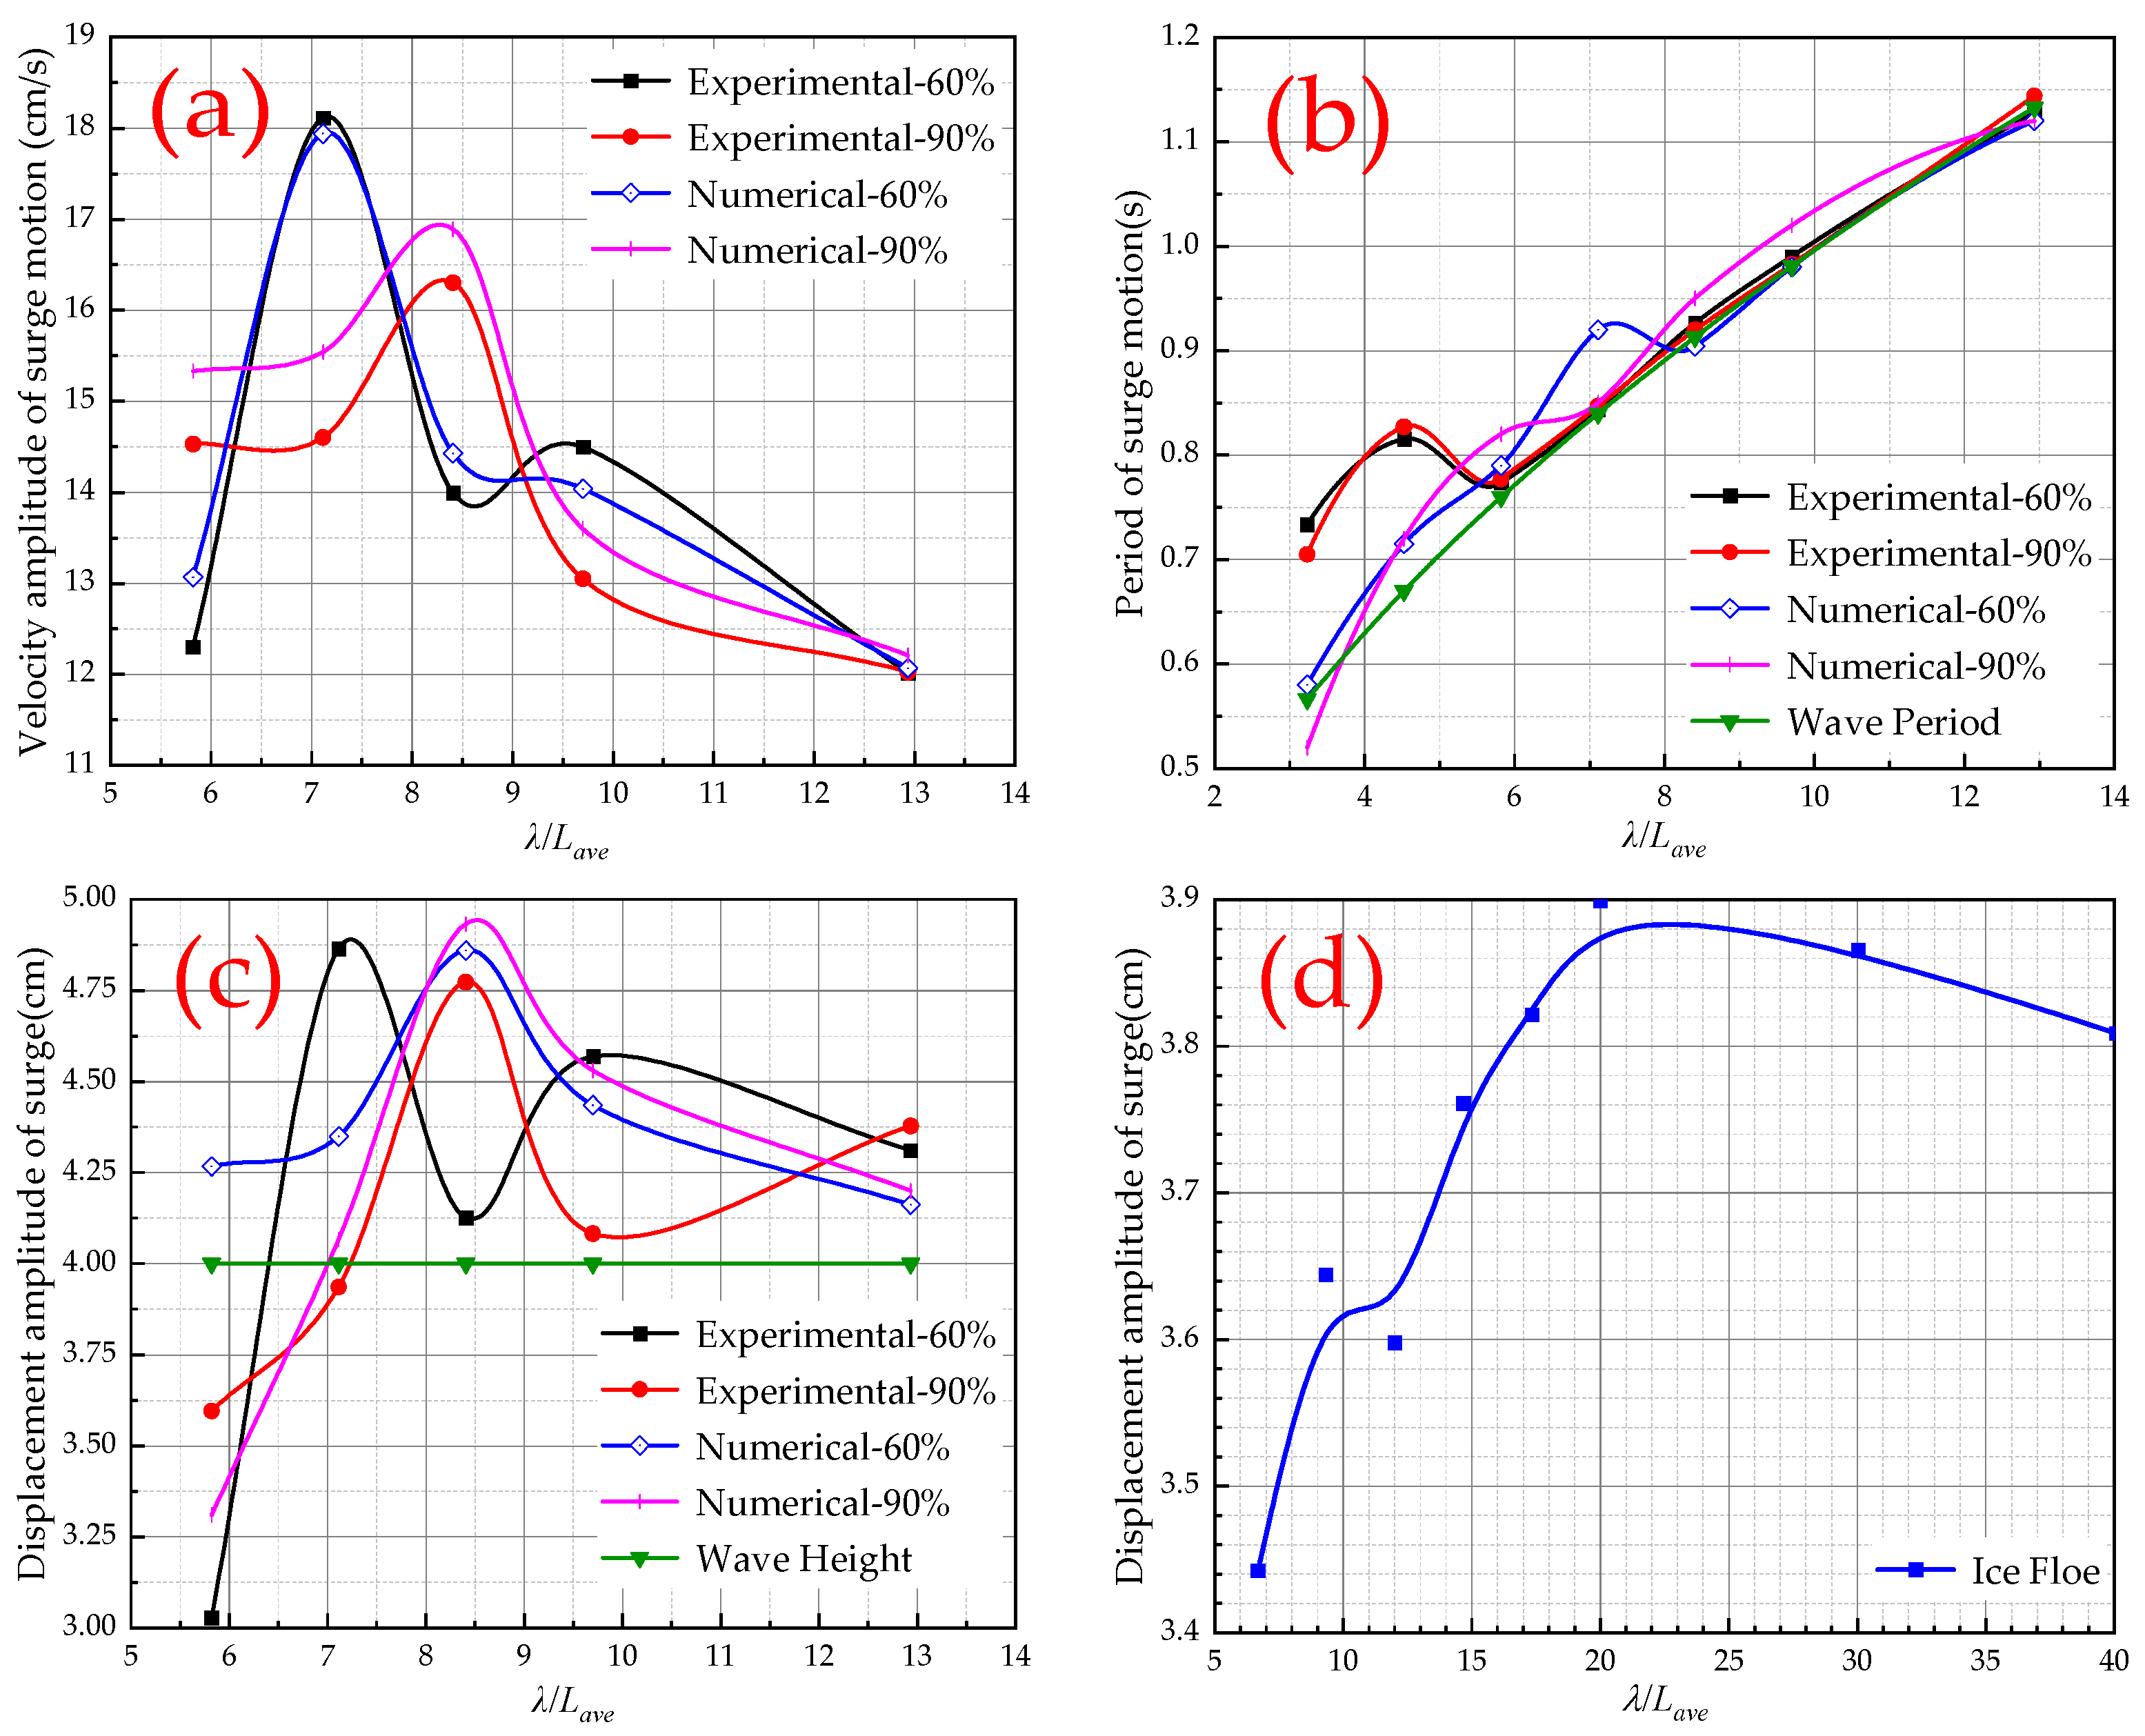
Based on the data presented in Table A1, Table A2 and Table A3, the relationship between the surge response of ice floes with 60% and 90% ice concentration and the ratio of the wavelength to the mean size of the ice floes (λ/Lave) is graphically depicted in Figure 10.
In the experimental findings, it was observed that when the ice floes fall within the short-wave range (λ/Lave ≤ 5.82), the longitudinal surge of the ice floes exhibits irregular behavior. This irregularity is attributed to the intense collision between the ice floes and the waves, leading to a rapid fluctuation in the longitudinal surge velocity and displacement amplitude. Consequently, it becomes challenging to obtain stable values for these parameters. Therefore, this study presents a summary of the surge velocity and displacement amplitude of ice floes within the long-wave range (λ/Lave ≥ 5.82).
Based on the analysis of Figure 10a, it can be observed that the ice floes with 60% ice concentration exhibit a greater amplitude of longitudinal surge velocity compared to those with 90% ice concentration in the presence of waves. A comparison of Figure 10c reveals that the maximum amplitude of longitudinal surge for the ice floes, as obtained through numerical simulation and experimental methods, along with the corresponding wavelength at which this maximum amplitude occurs, differ. However, despite these differences, the overall trend of the curves remains similar.
As depicted in Figure 10d, the longitudinal surge amplitude of the isolated ice floe within the wave ranges from approximately 0.85 H to 0.95 H. Moreover, this surge amplitude progressively converges with the wave height H as the wavelength increases. In contrast to Figure 10c, the longitudinal surge displacement response of the ice floes exhibits a distinct pattern when they are subjected to long-wave conditions (λ/Lave ≥ 5.82). Notably, this pattern differs from that observed in the isolated ice floe, where the longitudinal surge displacement amplitude gradually approaches the wave height H. The longitudinal surge displacement amplitude of the ice floes exhibits a rapid increase, surpassing the wave height H, followed by a subsequent decrease as the wavelength λ increases, eventually approaching the wave height H.
Based on the findings presented in Figure 10b, it can be inferred that the longitudinal surge period of the ice floes surpasses that of the wave period. Furthermore, the longitudinal surge period of the ice floes appears to be minimally influenced by varying ice concentration. Additionally, as the wavelength increases, the longitudinal surge period of the ice floes gradually approaches that of the wave period.
In the short-wave range (λ/Lave ≤ 4.53), the experimental method yields a greater longitudinal period for the ice floes compared to the numerical method, and this period is further removed from the wave period. In the long-wave range (λ/Lave ≥ 5.82), both numerical and experimental methods produce longitudinal surge periods for the ice floes that align with the wave period, indicating a consistent trend with the longitudinal surge period of isolated ice floes.

5. Conclusions

This paper presents the implementation of a numerical wave generation technique using the finite element method. Additionally, a numerical simulation method is proposed for studying the interaction between ice floes and waves. This simulation method incorporates the S-ALE fluid–structure coupling method and penalty function contact algorithm utilizing the aforementioned numerical wave generation technique. The dynamic boundary condition wave generation method, based on the micro-amplitude wave theory, is employed to achieve accurate numerical wave generation. The simulation successfully reproduces dynamic traveling waves and verifies the accuracy of the wave generation process. Furthermore, the longitudinal motion law is examined:
(1)
The longitudinal motion response parameters of ice floes of varying sizes exhibit no consistent and substantial disparities. The longitudinal motion of ice floes in waves manifests in two distinct states, namely irregular and regular, contingent upon the wavelength. Ice floes predominantly engage in irregular motion within the short-wave range, while assuming a regular motion akin to that of isolated ice floes within the long-wave range.
(2)
In the context of the irregular motion of ice floes within the short-wave range, it is observed that the mean speed of the longitudinal drift motion of the ice floes exhibits a rapid increase as the wavelength increases. Additionally, the period of the longitudinal surge of the ice floes is slightly greater than that of the wave.
(3)
In the long-wave range, the ice floes exhibit regular motion. As the wavelength increases, the mean velocity of the longitudinal drift motion of the ice floes decreases and eventually approaches zero. Conversely, the speed and displacement amplitude of the longitudinal surge motion of the ice floes increase rapidly, surpassing the wave height, and subsequently decrease to approach the wave height as the wavelength increases. Additionally, the response period of the longitudinal surge of the ice floes coincides with the wave period.
It is crucial to recognize that the longitudinal and surge motion laws of ice floes, which have been previously discussed, encompass wavelength ranges that are not exactly identical within the short-wave and long-wave ranges. Moreover, qualitative conclusions alone cannot provide quantitative outcomes to address specific application problems. Further studies should be undertaken to investigate the nonlinear dynamics of ice collision and fragmentation, taking into account the influence of fluid–structure interactions.

Author Contributions

Conceptualization, C.W. (Chunhui Wang) and J.W.; methodology, C.W. (Chunhui Wang); software, J.W.; validation, C.W. (Chunhui Wang) and C.W. (Chao Wang); formal analysis, J.W.; investigation, Y.Z.; resources, C.W. (Chunhui Wang); data curation, J.W.; writing—original draft preparation, C.W. (Chunhui Wang), J.W. and Z.W.; writing—review and editing, J.W.; visualization, Z.W.; supervision, C.W. (Chunhui Wang) and C.W. (Chao Wang); project administration, C.W. (Chao Wang); funding acquisition, C.W. (Chunhui Wang), Y.Z. and Z.W. All authors have read and agreed to the published version of the manuscript.

Funding

This research was funded by the Fundamental Research Funds for the Central Universities (Grant No. 3072022CF0103); the National Natural Science Foundation of China (Grant No. 51909043); the Joint Funds of the Natural Science Foundation Project of Heilongjiang Province (Grant No. LH2023E072); China Postdoctoral Science Foundation funded project (Certificate No. 2023M730832); Postdoctoral Funding Program of Heilongjiang Province of China (Grant No. LBH-Z22099); Qingdao Postdoctoral Application Foundation funded project.

Institutional Review Board Statement

Not applicable.

Informed Consent Statement

Not applicable.

Data Availability Statement

Data is contained within the present article.

Acknowledgments

The authors would like to thank the unknown reviewers who provided excellent guidance.

Conflicts of Interest

The authors declare no conflict of interest. The funders had no role in the design of the study; in the collection, analyses, or interpretation of data; in the writing of the manuscript, or in the decision to publish the results.

Appendix A

Table A1. Experimental data on the longitudinal motion response of ice floes in waves (wave condition: λ = 2.0 H = 0.04).
Size of Ice Floe (cm × cm)Amplitude of Surge Speed (cm/s)Longitudinal Drift Motion Velocity (cm/s)Amplitude of Surge Velocity (cm/s)Surge Period (s)
8 × 1212.150.79112.151.14
14 × 2111.871.15311.871.13
16 × 2411.991.00911.991.138
18 × 2712.061.25012.061.1
Table A2. Longitudinal motion response of ice floes with 60% ice concentration.
Wavelength (m)Ice NumberAmplitude of Surge Speed (cm/s)Mean Value of Longitudinal Drift Motion Velocity (cm/s)Mean Value of Amplitude of Surge Velocity (cm/s)Mean Value of Surge Period (s)
0.514.551.084.610.58
27.35
34.71
42.63
53.79
0.7110.485.4410.250.715
28.04
310.92
410.7
511.1
0.9115.174.9513.070.79
29.24
313.13
413.58
514.24
1.1117.054.8517.940.92
216.34
318.56
417.88
519.86
1.3112. 92.7614.430.904
216.41
314.83
414.21
513.82
1.5114.582.1614.040.98
213.05
313.86
414.49
514.22
2.0113.121.20712.071.12
211.96
312.02
412.44
511.91
Table A3. Longitudinal motion response of ice floes with 90% ice concentration.
Wavelength (m)Ice NumberAmplitude of Surge Speed (cm/s)Mean Value of Longitudinal Drift Motion Velocity (cm/s)Mean Value of Amplitude of Surge Velocity (cm/s)Mean Value of Surge Period (s)
0.512.482.233.120.52
23.13
33.99
43.46
52.52
0.716.383.537.690.72
28.9
38.76
49.3
55.09
0.9115.133.3215.330.82
215.28
316.23
415.1
514.9
1.1114.913.5815.540.85
214.43
314.07
418.46
515.84
1.3114.822.5816.890.95
216.76
319.2
416.25
517.46
1.5113.661.9213.61.02
213.4
312.61
415.58
513.19
2.0112.061.1713.211.12
213.19
313.03
413.42
514.36

References

  1. Squire, V.A.; Dugan, J.P.; Wadhams, P.; Rottier, P.J.; Liu, A.K. Of ocean waves and sea ice. Annu. Rev. Fluid Mech. 1995, 27, 115–168. [Google Scholar] [CrossRef]
  2. Squire, V.A. Of ocean waves and sea-ice revisited. Cold Reg. Sci. Technol. 2007, 49, 110–133. [Google Scholar] [CrossRef]
  3. Squire, V.A. Ocean wave interactions with sea ice: A reappraisal. Annu. Rev. Fluid Mech. 2020, 52, 37–60. [Google Scholar] [CrossRef]
  4. Toyota, T.; Kohout, A.; Fraser, A.D. Formation processes of sea ice floe size distribution in the interior pack and its relationship to the marginal ice zone off East Antarctica. Deep Sea Res. Part II Top. Stud. Oceanogr. 2016, 131, 28–40. [Google Scholar] [CrossRef]
  5. Squire, V.A. A prognosticative synopsis of contemporary marginal ice zone research. Philos. Trans. Royal Soc. A 2022, 380, 20220094. [Google Scholar] [CrossRef]
  6. Bennetts, L.G.; Bitz, C.M.; Feltham, D.L.; Kohout, A.L.; Meylan, M.H. Theory, modelling and observations of marginal ice zone dynamics: Multidisciplinary perspectives and outlooks. Philos. Trans. Royal Soc. A 2022, 380, 20210265. [Google Scholar] [CrossRef]
  7. Squire, V.A. Marginal ice zone dynamics. Philos. Trans. Royal Soc. A 2022, 380, 20210266. [Google Scholar] [CrossRef]
  8. Linton, C.M. Towards a three-dimensional model of wave–ice interaction in the marginal ice zone. J. Fluid Mech. 2010, 662, 1–4. [Google Scholar] [CrossRef]
  9. Zeng, L.; Xiong, H.; Wu, Q. Review on the interaction between sea ice and waves/currents. J. Theor. Appl. Mech. 2021, 53, 641–654. (In Chinese) [Google Scholar]
  10. Meylan, M.H.; Squire, V.A. The response of ice floes to ocean waves. J. Geophys. Res. 1994, 99, 891–900. [Google Scholar] [CrossRef]
  11. Meylan, M.H. Wave response of an ice floe of arbitrary geometry. J. Geophys. Res. Oceans 2002, 107, 3005. [Google Scholar] [CrossRef]
  12. Wang, C.D.; Meylan, M.H. A higher-order-coupled boundary element and finite element method for the wave forcing of a floating elastic plate. J. Fluids Struct. 2004, 19, 557–572. [Google Scholar] [CrossRef]
  13. Bennetts, L.G.; Williams, T.D. Wave scattering by ice floes and polynyas of arbitrary shape. J. Fluid Mech. 2010, 662, 5–35. [Google Scholar] [CrossRef]
  14. Peter, M.A.; Meylan, M.H. Water-wave scattering by vast fields of bodies. SIAM J. Appl. Math. 2010, 70, 1567–1586. [Google Scholar] [CrossRef]
  15. Bennetts, L.G.; Peter, M.A.; Squire, V.A.; Meylan, M.H. A three-dimensional model of wave attenuation in the marginal ice zone. J. Geophys. Res. Oceans 2010, 115. [Google Scholar] [CrossRef]
  16. Meylan, M.H.; Bennetts, L.G. Three-dimensional time-domain scattering of waves in the marginal ice zone. Philos. Trans. Royal Soc. A 2018, 376, 20170334. [Google Scholar] [CrossRef]
  17. Guyenne, P.; Părău, E.I. Numerical study of solitary wave attenuation in a fragmented ice sheet. Phys. Rev. Fluid 2017, 2, 034002. [Google Scholar] [CrossRef]
  18. Xu, B.; Guyenne, P. Nonlinear simulation of wave group attenuation due to scattering in broken floe fields. Ocean Model 2023, 181, 102139. [Google Scholar] [CrossRef]
  19. Behera, H.; Ng, C.O.; Sahoo, T. Oblique wave scattering by a floating elastic plate over a porous bed in single and two-layer fluid systems. Ocean Eng. 2018, 159, 280–294. [Google Scholar] [CrossRef]
  20. Hossain, M.; Tsai, C.; Behera, H. Instability mechanism of shear-layered fluid in the presence of a floating elastic plate. Phys. Fluids 2023, 35, 027102. [Google Scholar] [CrossRef]
  21. Xu, Z.; Tartakovsky, A.M.; Pan, W. Discrete-element model for the interaction between ocean waves and sea ice. Phys. Rev. E 2012, 85, 016703. [Google Scholar] [CrossRef] [PubMed]
  22. Bai, W.; Zhang, T.; McGovern, D.J. Response of small sea ice floes in regular waves: A comparison of numerical and experimental results. Ocean Eng. 2017, 129, 495–506. [Google Scholar] [CrossRef]
  23. Huang, L.; Ren, K.; Li, M.; Tuković, Ž.; Cardiff, P.; Thomas, G. Fluid-structure interaction of a large ice sheet in waves. Ocean Eng. 2019, 182, 102–111. [Google Scholar] [CrossRef]
  24. Wu, T.; Luo, W.; Jiang, D.; Deng, R.; Huang, S. Numerical study on wave-ice interaction in the marginal ice zone. J. Mar. Sci. Eng. 2020, 9, 4. [Google Scholar] [CrossRef]
  25. Marquart, R.; Bogaers, A.; Skatulla, S.; Alberello, A.; Toffoli, A.; Schwarz, C.; Vichi, M. A computational fluid dynamics model for the small-scale dynamics of wave, ice floe and interstitial grease ice interaction. Fluids 2021, 6, 176. [Google Scholar] [CrossRef]
  26. Behnen, J.; von Bock und Polach, R.U.F.; Klein, M.; Ehlers, S. Hydrodynamic and mechanic response of a floating flexible ice floe in regular waves with the ICFD method. In Proceedings of the International Conference on Offshore Mechanics and Arctic Engineering, Hamburg, Germany, 5–10 June 2022; Volume 85918, p. V006T07A008. [Google Scholar]
  27. Zhang, N.; Ma, Q.; Zheng, X.; Yan, S. A two-way coupling method for simulating wave-induced breakup of ice floes based on SPH. J. Comput. Phys. 2023, 488, 112185. [Google Scholar] [CrossRef]
  28. Jiang, Z.; Li, F.; Mikkola, T.; Kujala, P.; Hirdaris, S. A Boundary Element Method for the Prediction of Hydrodynamic Ship–Ice–Wave Interactions in Regular Waves. J. Offshore Mech. Arct. Eng. 2023, 145, 061601. [Google Scholar] [CrossRef]
  29. Junior, R.A.A.; Mellado-Cusicahua, A.; Shakibaeinia, A.; Cheng, L.Y. A fully Lagrangian DEM-MPS mesh-free model for ice-wave dynamics. Cold Reg. Sci. Technol. 2021, 186, 103266. [Google Scholar]
  30. Huang, G.; Law, A.W.K.; Huang, Z. Wave-induced drift of small floating objects in regular waves. Ocean Eng. 2011, 38, 712–718. [Google Scholar] [CrossRef]
  31. McGovern, D.J.; Bai, W. Experimental study on kinematics of sea ice floes in regular waves. Cold Reg. Sci. Technol. 2014, 103, 15–30. [Google Scholar] [CrossRef]
  32. Bennetts, L.G.; Alberello, A.; Meylan, M.H.; Cavaliere, C.; Babanin, A.V.; Toffoli, A. An idealised experimental model of ocean surface wave transmission by an ice floe. Ocean Model 2015, 96, 85–92. [Google Scholar] [CrossRef]
  33. Meylan, M.H.; Bennetts, L.G.; Cavaliere, C.; Alberello, A.; Toffoli, A. Experimental and theoretical models of wave-induced flexure of a sea ice floe. Phys. Fluids 2015, 27, 041704. [Google Scholar] [CrossRef]
  34. Huang, L.; Lu, W.; Yang, J.; Dong, Q. Experimental study on surface waves around a novel model of ice floe. Cold Reg. Sci. Technol. 2022, 193, 103380. [Google Scholar] [CrossRef]
  35. Toffoli, A.; Pitt, J.P.A.; Alberello, A.; Bennetts, L.G. Modelling attenuation of irregular wave fields by artificial ice floes in the laboratory. Philos. Trans. Royal Soc. A 2022, 380, 20210255. [Google Scholar] [CrossRef] [PubMed]
  36. Yiew, L.J.; Bennetts, L.G.; Meylan, M.H.; French, B.J.; Thomas, G.A. Hydrodynamic responses of a thin floating disk to regular waves. Ocean Model 2016, 97, 52–64. [Google Scholar] [CrossRef]
  37. Wang, C.; Song, M.; Guo, C.; Wang, S.; Tian, T.; Luo, W. Experimental study of sea ice motion in waves. J. Cold Reg. Eng. 2020, 34, 04020010. [Google Scholar] [CrossRef]
  38. Bennetts, L.G.; Williams, T.D. Water wave transmission by an array of floating discs. Proc. Math. Phys. Eng. Sci. 2015, 471, 20140698. [Google Scholar] [CrossRef]
  39. Park, S.B.; Shin, S.Y.; Shin, D.G.; Park, H.; Jung, K.H.; Suh, S.B.; Lee, J.; Lee, S.J.; Kim, H.S. Experimental study of wave transmission and drift velocity using freely floating synthetic ice floes. Ocean Eng. 2022, 251, 111058. [Google Scholar] [CrossRef]
  40. Hallquist, J.O. LS-DYNA Keyword User’s Manual; Livermore Software Technology Corporation: Livermore, CA, USA, 2007; Volume 970, pp. 299–800. [Google Scholar]
  41. Chen, H. LS-DYNA structured ALE (S-ALE) solver. In Proceedings of the Fourteenth International LS-DYNA User Conference, Detroit, MI, USA, 12–14 June 2016. [Google Scholar]
  42. Wang, C.; Wang, J.; Wang, C.; Guo, C.; Zhu, G. Research on vertical movement of cylindrical structure out of water and breaking through ice layer based on S-ALE method. J. Theor. Appl. Mech. 2021, 53, 3110–3123. (In Chinese) [Google Scholar]
  43. Kim, M.C.; Lee, S.K.; Lee, W.J.; Wang, J.Y. Numerical and experimental investigation of the resistance performance of an icebreaking cargo vessel in pack ice conditions. Int. J. Nav. Archit. Ocean Eng. 2013, 5, 116–131. [Google Scholar] [CrossRef]
  44. Ye, X.; Fan, W.; Sha, Y.; Hua, X.; Wu, Q.; Ren, W. Fluid-structure interaction analysis of oblique ship-bridge collisions. Eng. Struct. 2023, 274, 115129. [Google Scholar] [CrossRef]
  45. Airy, G.B. On tides and Waves. In Encyclopedia Metropolitana: Mixed Sciences; Rose, H.J., Ed.; John Joseph Griffin & Co.: London, UK, 1842; Volume 3, p. 1841. [Google Scholar]
  46. Wang, C.; Wang, J.; Wang, C.; Song, M. Experimental study on longitudinal motion law of ice floes under wave action. J. Huazhong Univ. Sci. Technol. 2022, 50, 143–148. (In Chinese) [Google Scholar]
  47. Toyota, T.; Haas, C.; Tamura, T. Size distribution and shape properties of relatively small sea-ice floes in the Antarctic marginal ice zone in late winter. Deep Sea Res. Part II Top. Stud. Oceanogr. 2011, 58, 1182–1193. [Google Scholar] [CrossRef]
  48. Wang, S. Experimental Research on the Resistance Performance of Ice-Going Ships in Marginal Ice Zones; Harbin Engineering: Harbin, China, 2017. (In Chinese) [Google Scholar]
Figure 1. Typical characteristics of a 2D model of a solid material being moved and deformed using different methods.
Jmse 11 02235 g001
Figure 2. Schematic diagram of the push-plate wave-making method based on dynamic boundary conditions.
Jmse 11 02235 g002
Figure 3. Schematic diagram of the basin test. (a) Experimental setup. (b) Wave gauge. (c) Fence device and ice floes. (d) Post-processing software interface.
Jmse 11 02235 g003
Figure 4. The validation of two-dimensional wave propagation. (a) Wave profile. (b) Hydrostatic pressure. (c) Vertical velocity distribution.
Jmse 11 02235 g004
Figure 5. Numerical modeling of ice floe–wave interaction. ICE1-ICE5 are closely monitored.
Jmse 11 02235 g005
Figure 6. Motion of the ice floes at different moments under 60% ice concentration, 2 m wavelength, and 4 cm wave height. (a) T = 0 s; (b) T = 5.1 s; (c) T = 9.6 s.
Jmse 11 02235 g006
Figure 7. The numerical simulation results of the longitudinal motion displacement and velocity of ice floes under the influence of wave action, specifically at a 60% ice concentration, 2 m wavelength, and 4 cm wave height condition. (Left): Longitudinal motion displacement. (Right): Longitudinal motion velocity.
Jmse 11 02235 g007
Figure 8. The numerical simulation results of longitudinal motion displacement and velocity of ice floes under the influence of wave action, specifically at a 60% ice concentration, 0.5 m wavelength, and 4 cm wave height condition. (Left): Longitudinal motion displacement. (Right): Longitudinal motion velocity.
Jmse 11 02235 g008
Figure 9. Comparison curves depicting the relationship between mean longitudinal drift velocity and wavelength for longitudinal drift motions of ice floes and isolated ice floe. (Left): Ice floes. (Right): Isolated ice floe [48].
Jmse 11 02235 g009
Figure 10. Comparative trends of mean velocity in relation to wavelength for both surge motions of ice floes and individual ice floes. (a): Amplitude of the surge velocity of the ice floes. (b): Value of the surge period of ice floes. (c): Value of the surge displacement of ice floes. (d): Value of the surge displacement of the isolated ice floe [48].
Jmse 11 02235 g010
Table 1. The number and dimensions of model ice.
Size (cm × cm)Average Calliper Diameter (m) Thickness (m)Amount [Pieces]
Model ScaleFull ScaleModel ScaleFull Scale
12 × 80.125.410.020.94245
15 × 100.156.762151
18 × 120.188.111225
21 × 140.219.46757
24 × 160.2410.82498
27 × 180.2712.17343
Total9219
Table 2. The related parameters in numerical simulation.
NameAir Water
Material typeMAT_NULLMAT_NULL
Unit typeSOLID164SOLID164
Equation of stateEOS_LINEARPOLYNOMIALEOS_LINEARPOLYNOMIAL
Density(kg/m3)1.1845998.21
Cutoff pressure(Pa)−10−100
Viscosity coefficient(N·s·m−2)1.8444 × 10−58.684 × 10−4
Table 3. Parameterization of modeled wave conditions.
Ice ConcentrationWave Height (m)Wavelength (m)
60%/90%0.040.5
0.7
0.9
1.1
1.3
1.5
2.0
Disclaimer/Publisher’s Note: The statements, opinions and data contained in all publications are solely those of the individual author(s) and contributor(s) and not of MDPI and/or the editor(s). MDPI and/or the editor(s) disclaim responsibility for any injury to people or property resulting from any ideas, methods, instructions or products referred to in the content.