Article

ShipGen: A Diffusion Model for Parametric Ship Hull Generation with Multiple Objectives and Constraints

Department of Mechanical Engineering, Massachusetts Institute of Technology, 77 Massachusetts Avenue, Cambridge, MA 02139, USA
*
Author to whom correspondence should be addressed.
J. Mar. Sci. Eng. 2023, 11(12), 2215; https://doi.org/10.3390/jmse11122215
Submission received: 2 October 2023 / Revised: 9 November 2023 / Accepted: 16 November 2023 / Published: 22 November 2023
(This article belongs to the Special Issue Machine Learning and Modeling for Ship Design)

Abstract

:
Ship design is a years-long process that requires balancing complex design trade-offs to create a ship that is efficient and effective. Finding new ways to improve the ship design process could lead to significant cost savings in the time and effort required to design a ship, as well as cost savings in the procurement and operation of a ship. One promising technology is generative artificial intelligence, which has been shown to reduce design cycle times and create novel, high-performing designs. In a literature review, generative artificial intelligence was shown to generate ship hulls; however, ship design is particularly difficult, as the hull of a ship requires the consideration of many objectives. This paper presents a study on the generation of parametric ship hull designs using a parametric diffusion model that considers multiple objectives and constraints for hulls. This denoising diffusion probabilistic model (DDPM) generates the tabular parametric design vectors of a ship hull, which are then constructed into a point cloud and mesh for performance evaluation. In addition to a tabular DDPM, this paper details adding guidance to improve the quality of the generated parametric ship hull designs. By leveraging a classifier to guide sample generation, the DDPM produced feasible parametric ship hulls that maintained the coverage of the initial training dataset of ship hulls with a 99.5% rate, a 149× improvement over random sampling of the design vector parameters across the design space. Parametric ship hulls produced using performance guidance saw an average 91.4% reduction in wave drag coefficients and an average 47.9× relative increase in the total displaced volume of the hulls compared to the mean performance of the hulls in the training dataset. The use of a DDPM to generate parametric ship hulls can reduce design times by generating high-performing hull designs for future analysis. These generated hulls have low drag and high volume, which can reduce the cost of operating a ship and increase its potential to generate revenue.

1. Introduction

Generative artificial intelligence (AI) models produce new instances of information that resemble the data used to train the model. While generative AI is famously known for generating text and image information, it can also be used to generate information for engineering products. Recent advances in generative AI provide promising new avenues for quickly generating designs. Including additional information in training, such as a design’s performance, can be leveraged to create designs with high performance. These advances are especially useful in the design of ships. Ship design currently requires a large team of naval architects to balance design trade-offs in the design of a single ship. A generative AI model specifically trained to generate ship hulls can improve this workflow. Training such a model successfully is enabled by the availability of large datasets that include both design and performance information for ship hulls [1]. Hull design was chosen as a starting point for generative model, as the shape of the hull has a direct impact on over 70% of the cost of a ship [2]. It is also one of the first steps in the traditional workflow of ship design [3]. The hull shape affects several key aspects of a ship’s performance, including the buoyancy, upright stability, hydrodynamics, and general arrangements of the ship. With these considerations, the design of ship hulls provides an impactful avenue for the application of machine learning for engineering design.
A well-designed machine learning tool for ship design could learn design trade-offs for ships through the continual designing and evaluation of many ship designs. This work demonstrates the use of a guided denoising diffusion probabilistic model (DDPM), a type of deep generative model, to rapidly generate high-performing and feasible parametric ship hull designs by generating parameters in a tabular format. This model, called ShipGen, generates early-stage hull designs considering seven performance metrics, creating shapes with low drag and high cargo-carrying capacity. Figure 1 shows an overview of the work presented, highlighting that the implementation of classifier and performance guidance during the sampling process generates hulls with high performance. This work features model training with a publicly available dataset of parametric ship hulls, called ShipD [1]. The following sections detail a literature review of previous work, the methodology for creating and evaluating a tabular DDPM, the evaluation of ship hulls generated by the DDPM, and a discussion on the impact of the work. The hulls generated with the guided DDPM are intended to be candidate designs for future analysis. As such, these generated hulls may not necessarily look exactly like realistic hull forms but instead have design features that, in combination, lead to high performance. Through the development of the performance-guided DDPM for ship hull generation, the novel contributions of this paper are as follows:
  • The first known use of denoising diffusion probabilistic models for generating parametric tabular data for an engineering performance-focused design application;
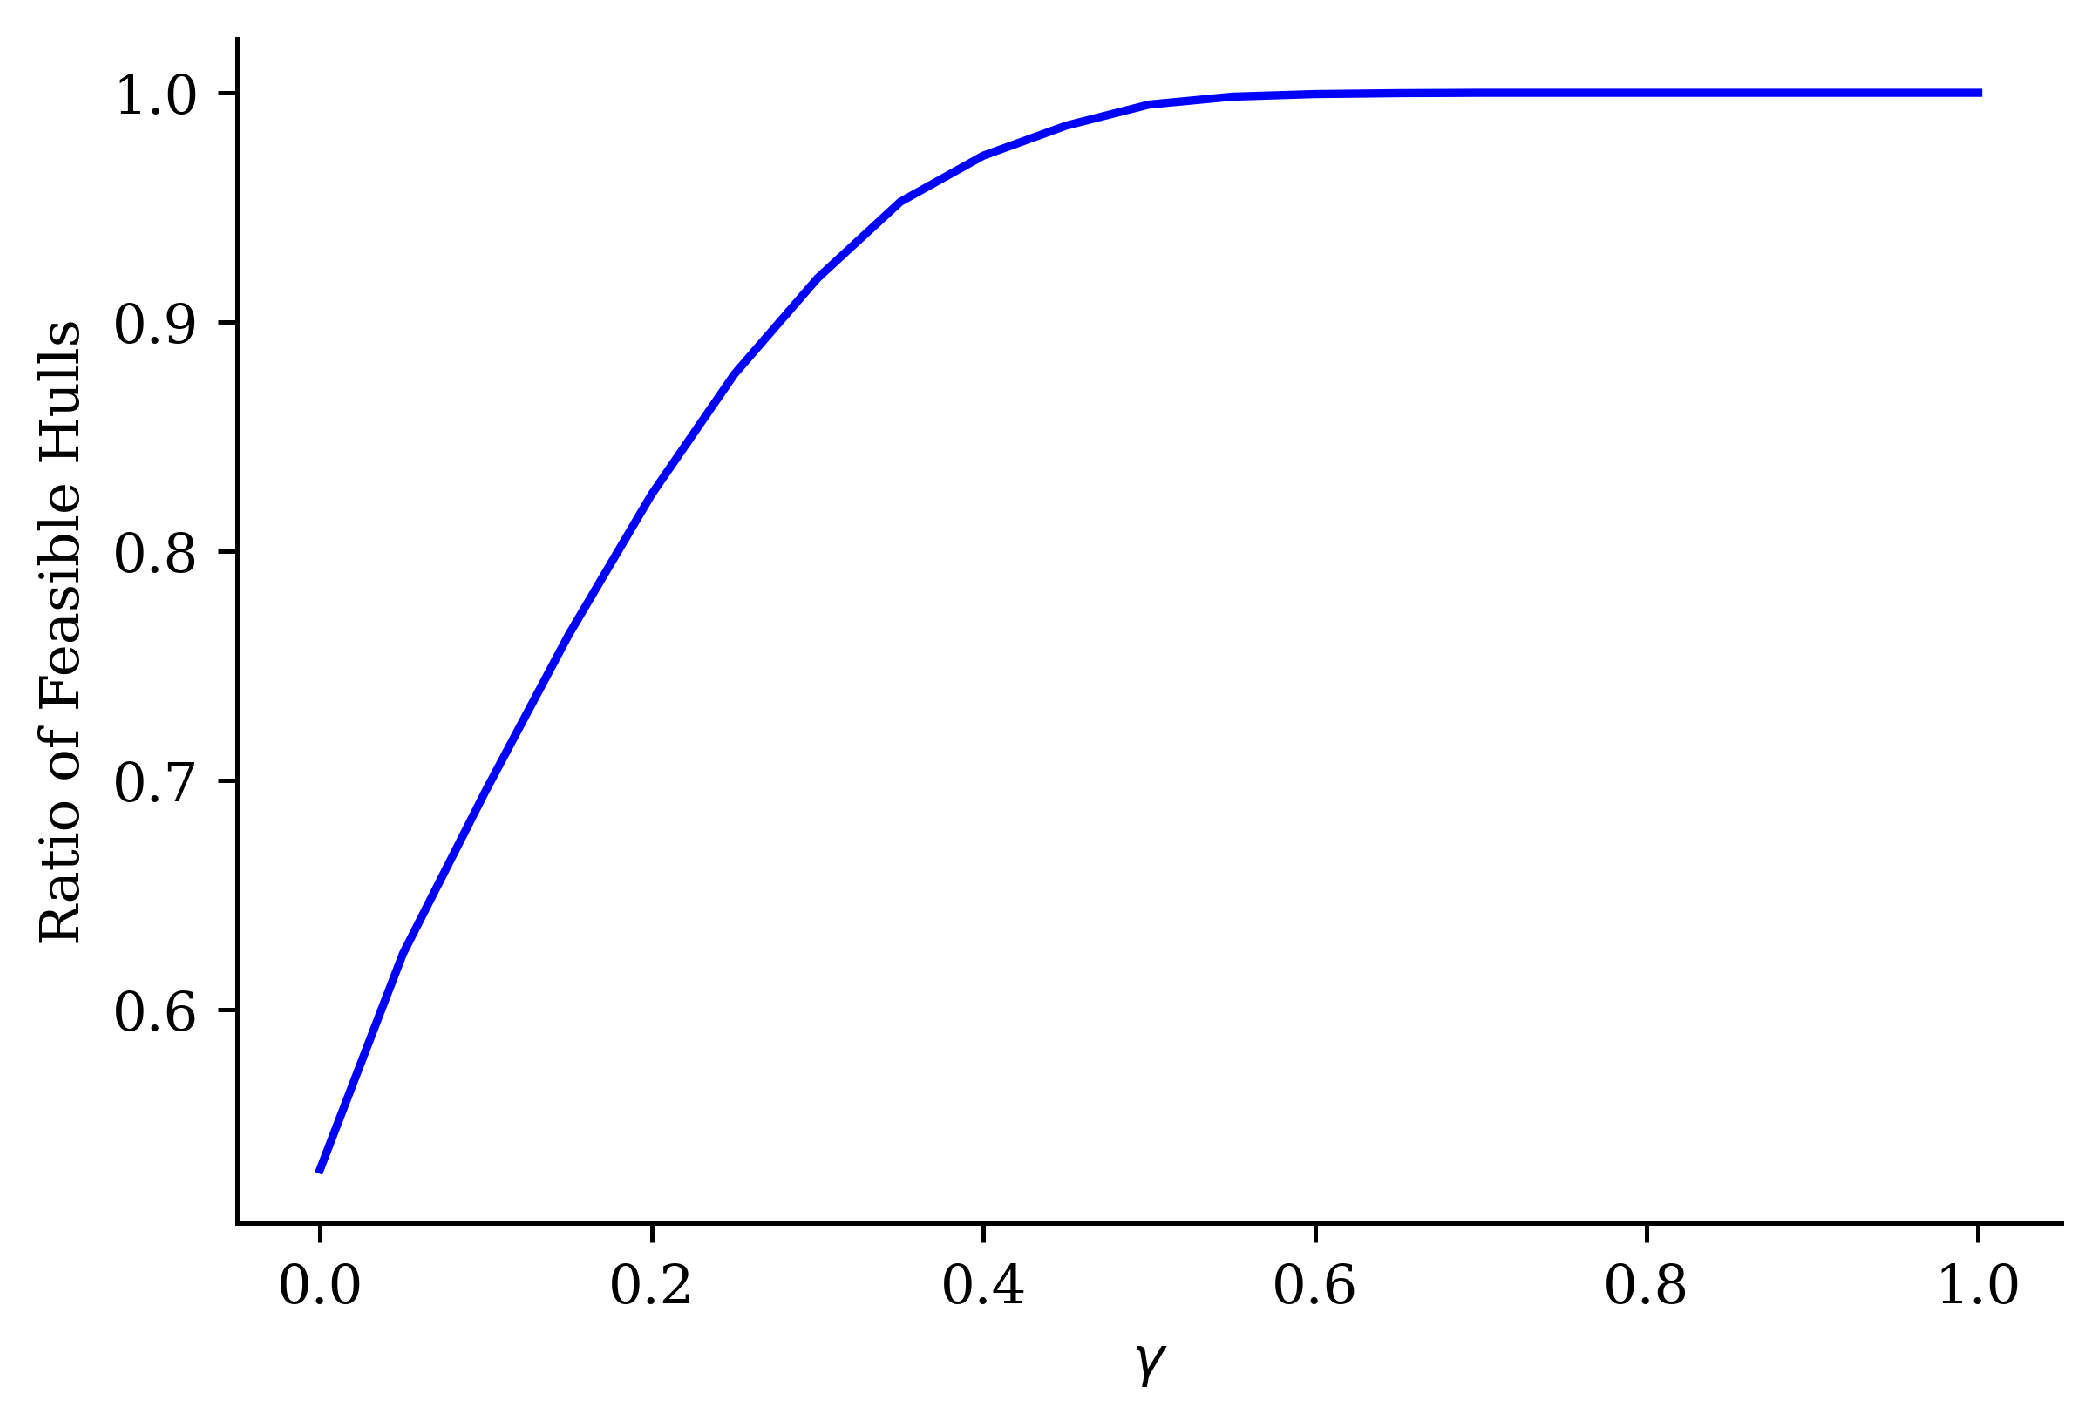
  • Showcasing that classifier guidance in the DDPM navigates complex design feasibility constraints to generate feasible samples with over 99% success, while maintaining dataset design coverage;
  • Use of guidance to improve ship hull performance, with samples having an average 91.4% reduction in wave drag coefficient and 47.9× more displaced volume compared to the mean performance of the hulls in the dataset.

2. Prior Work

Generative AI for ship hull design has been influenced by research in computational ship design and the machine learning literature. Section 2.1 details prior work in computational ship design, including ship hull design representation, hull form design optimization, and the use of machine learning in ship design. Section 2.2 details the development of diffusion models and their applications in engineering design.

2.1. Computational Ship Design

Computational ship design refers to the application of computer-based modeling, simulation, and optimization techniques in the design and analysis of marine vessels, facilitating more efficient, innovative, and integrated design solutions. Historically, computational ship design can be divided into three categories: design representation; forward modeling, which includes surrogate models; and inverse design or synthesis, which includes optimization methods. Recently, generative AI methods have emerged as a powerful technique, which could be used for the representation and synthesis of ship hull designs.
In order to design a product using computational methods, the product needs to be represented in a way that a computer can understand. For ship design, the two most popular modes are parameterized vectors [1,4,5,6,7,8,9,10,11,12], and free-form deformation techniques [13,14,15,16,17,18]. The benefit of using parameterized design representations for a hull is that the design is defined by a set of tunable parameters that both human designers and computers can interpret. The ease of use of parametric design representations has often limited the diversity of possible hull shapes. Conversely, FFD techniques present a different landscape. They allow the creation of a broad array of shapes. Yet, these representations can be challenging for humans to interpret without a visual representation of the hull form. The works of Khan et al. [19,20,21], Shaeffer et al. [22,23], and Bagazinski et al. [1] looked at various methods for creating diverse design spaces and design datasets for ship hull design. These efforts aimed to harness machine learning in ship hull design.
In addition to design representation, computational design often has metrics for evaluating a design’s performance. Finding computationally efficient methods for evaluating each generated design could lead to enhanced design generation. Hydrodynamic drag stands out as the predominant performance metric for ships in the literature. Several rapid drag prediction techniques exist. Some, like Hollenbach’s and Savitsky’s methods, rely on statistical regressions from test data [24,25,26]. Other fast methods used to predict wave drag are linear wave solvers, which provide accurate drag measurements with reduced computational effort relative to traditional computational fluid dynamics techniques. These solvers use potential flow to simulate the waves produced by a ship in a steady forward motion, to estimate drag as a result of surface wave propagation. The different linear wave solvers include Michell’s integral [27,28], Rankine panel methods [29], Neumann–Kelvin theory (also called Dawson’s method) [30], and Neumann–Michell theory [31,32,33]. These potential flow solvers input the 3D geometry of a hull and provide estimates of drag at typical operating speeds of a hull. The third method for creating a fast prediction of drag is to build a small dataset of drag measures, to train a neural network to predict drag from a hull’s design representation [5,6,9,13,14,15,16,19,20,34,35].
Combining hull design representation with efficient drag prediction equips designers with the tools needed for optimization algorithms. This enables hull design creation tailored for specific scenarios. A common objective in the optimization literature is minimizing hull drag while adhering to geometric constraints. More recently, computational hull design has also been attempted using a tabular generative adversarial network (GAN) to quickly generate ship hull instances, which could be used for seeding populations for design optimization [21]. The next improvement of generative AI in ship design would be to implement a denoising diffusion probabilistic model (DDPM) for generating hull designs. Diffusion models provide improvements over GANs for generative design, as DDPMs are more stable to train and provide superior sampling quality. Additionally, diffusion models can implement guidance without retraining the whole generative model. In this way, new constraints or performance objectives can be simply integrated into design generation, whereas a GAN would need to be retrained for every new design consideration [36]. For ship hull design, this means that a single model can be trained to generate high-quality hulls that are tailored to specific user needs by integrating guidance models for different design considerations. This is particularly useful for ship design, so that information from the design of many classes of ship can be considered when designing a ship hull.

2.2. Generative Design with Diffusion Models

This transition from traditional design methods leads to a cutting-edge generative AI model: the denoising diffusion probabilistic model (DDPM). Gaining momentum in the machine learning domain, DDPMs iteratively modify a noisy data vector over many specified steps, transforming random data to mirror the statistics of training data [37]. The development of DDPMs in the last few years has shown that they are capable of generating complex data, and they already have applications for engineering design. For example, DDPMs were shown to create higher quality images compared to generative adversarial networks [37], a particularly difficult task, as images are comprised of large patterns of pixels to visually represent something a human could see with their eyes.
DDPMs work by training a neural network to predict small iterative denoising steps. The algorithm for training a diffusion model as defined by Ho et al. [37]. is shown in Algorithm 1.
Algorithm 1 This is the training algorithm for a standard DDPM. The DDPM is represented by the function ϵ θ ( X 0 , ϵ , t ) in step 5.
1:
repeat
2:
       X 0 q ( X 0 )
3:
       t U n i f o r m ( { 1 , , T } )
4:
       ϵ N ( 0 , I )
5:
      Take gradient descent step on: θ | | ϵ ϵ θ ( a t ¯ X 0 + 1 a t ¯ ϵ , t ) | | 2
6:
until converged
In this algorithm, the generated sample (design parameters) are represented by X and noted with subscripts to indicate the denoising timestep. The DDPM itself is represented by ϵ θ , indicating that the DDPM is trained to predict a small change in random noise across the vector. Once trained, a DDPM generates samples by denoising a Gaussian noise vector over predetermined timesteps. This results in samples that are within the training data’s statistical distribution. In the case of images, this could be a “deep fake” that looks like the training data. In the case of ship hull design, it could be a parameterized ship hull design. The sampling algorithm defined by Ho et al. is defined in Algorithm 2.
Subsequent advancements in DDPMs introduced guidance, where gradients from a classifier neural network guide image synthesis to match a specific image classification label [36]. This evolution birthed text-to-image DDPMs that employ text-based guidance to craft custom, lifelike images [38,39]. Guided DDPMs have found applications in generating 3D shapes from image data [40].
Algorithm 2 This is the sampling algorithm for a standard DDPM. The DDPM is represented by the function ϵ θ ( X t , t ) in step 4.
1:
X T N ( 0 , I )
2:
for  t = T , , 1  do
3:
       Z N ( 0 , I ) if t > 1 , else  z = 0
4:
       X t 1 = 1 α t ( X t 1 α t 1 α t ¯ ϵ θ ( X t , t ) ) + σ t Z
5:
return  X 0
Guided diffusion can be applied to engineering design generation. For example, guided diffusion has been used to create two-dimensional structures [41,42,43] and vehicles [44] using image data. In these instances, the guidance of the design generation using image-based DDPMs is applied for constraint satisfaction and improved performance. DDPMs can generate high-quality designs, navigate complex constraints, and implement precise generation with guidance, which makes them an excellent deep generative model for designing ship hulls. The subsequent sections demonstrate a tabular DDPM for generating parametric ship hull designs that give improved performance through the implementation of guidance.

3. Methods

This section outlines the methodology behind developing a guided DDPM for ship hull design. This section explores the ship hull dataset, delves into tabular DDPMs, and introduces both classifier and performance guidance for sampling ship hulls with a DDPM. A secondary methods section on conditional DDPMs is included in Appendix A.

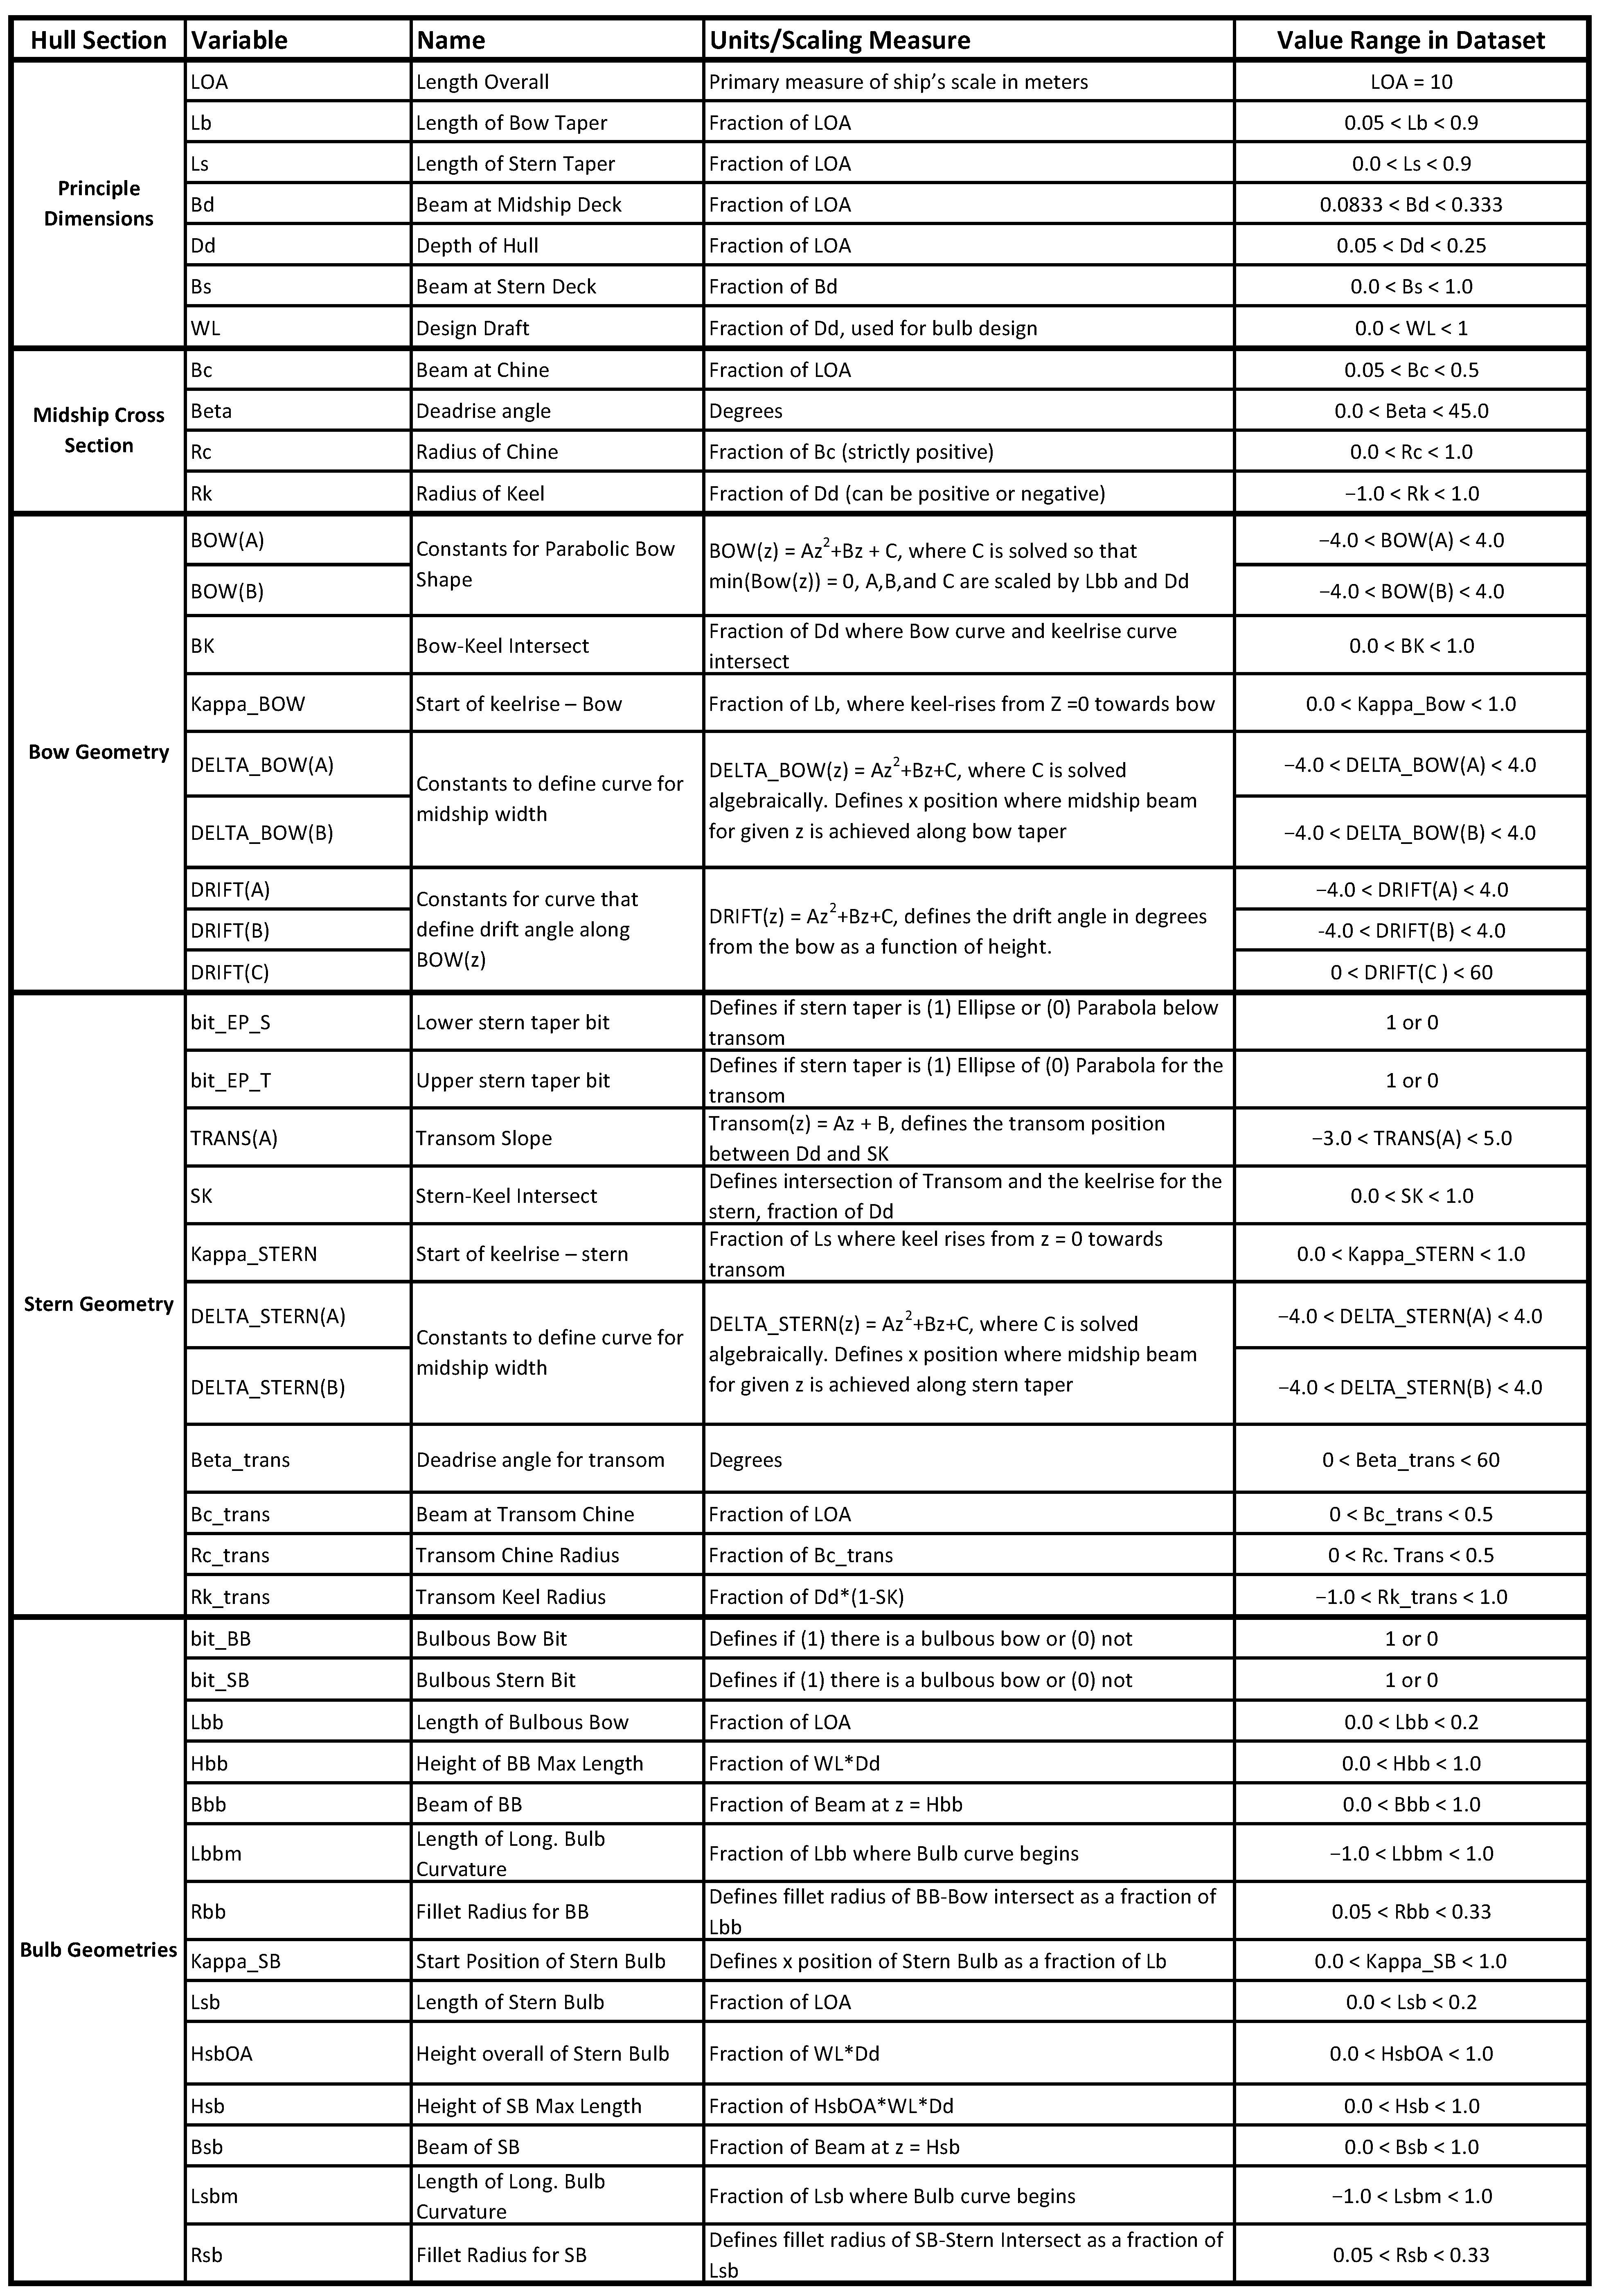
3.1. Ship-D Dataset and Hull Parameterization

The Ship-D dataset consists of 30,000 parameterized ship hulls. The hulls are parameterized with 45 terms. These terms are applied to a set of algebraic equations to define and characterize the surface of the hull. These terms were construed through analyzing and characterizing the shape and curvature of many different publicly available hull geometries. The parameters cover various aspects:
  • Principal dimensions (e.g., overall length, beam at main deck);
  • Cross-section of the parallel midbody (e.g., deadrise angle, chine radius);
  • Geometry of bow and stern taper;
  • Geometry of bulbs at bow and stern
These parameters, designed to capture a range of curvatures and shapes, encompass the features seen in a diverse variety of vessels, from large ships to smaller boats. Their dual design facilitates human understanding and computer-generated input. Full documentation of the hull design parameters is provided at https://decode.mit.edu/projects/ShipGen/ (accessed on 9 October 2023). Additionally, Figure A5 in the Appendix B lists the parameters and provides details, so human designers can create parametric hulls with this representation. A glimpse into the Ship-D dataset is provided in Figure 2, showcasing the diverse shapes achievable with the parametric design scheme. As these designs are randomly sampled across the entire feasible design space, they do not necessarily look like realistic hull designs. The performance of these hulls was not considered in their random sampling. Many of these hulls are relatively low performing; having high drag, low displacement volumes, and high surface area. The feasibility criteria used to generate these hulls are described in the next section.

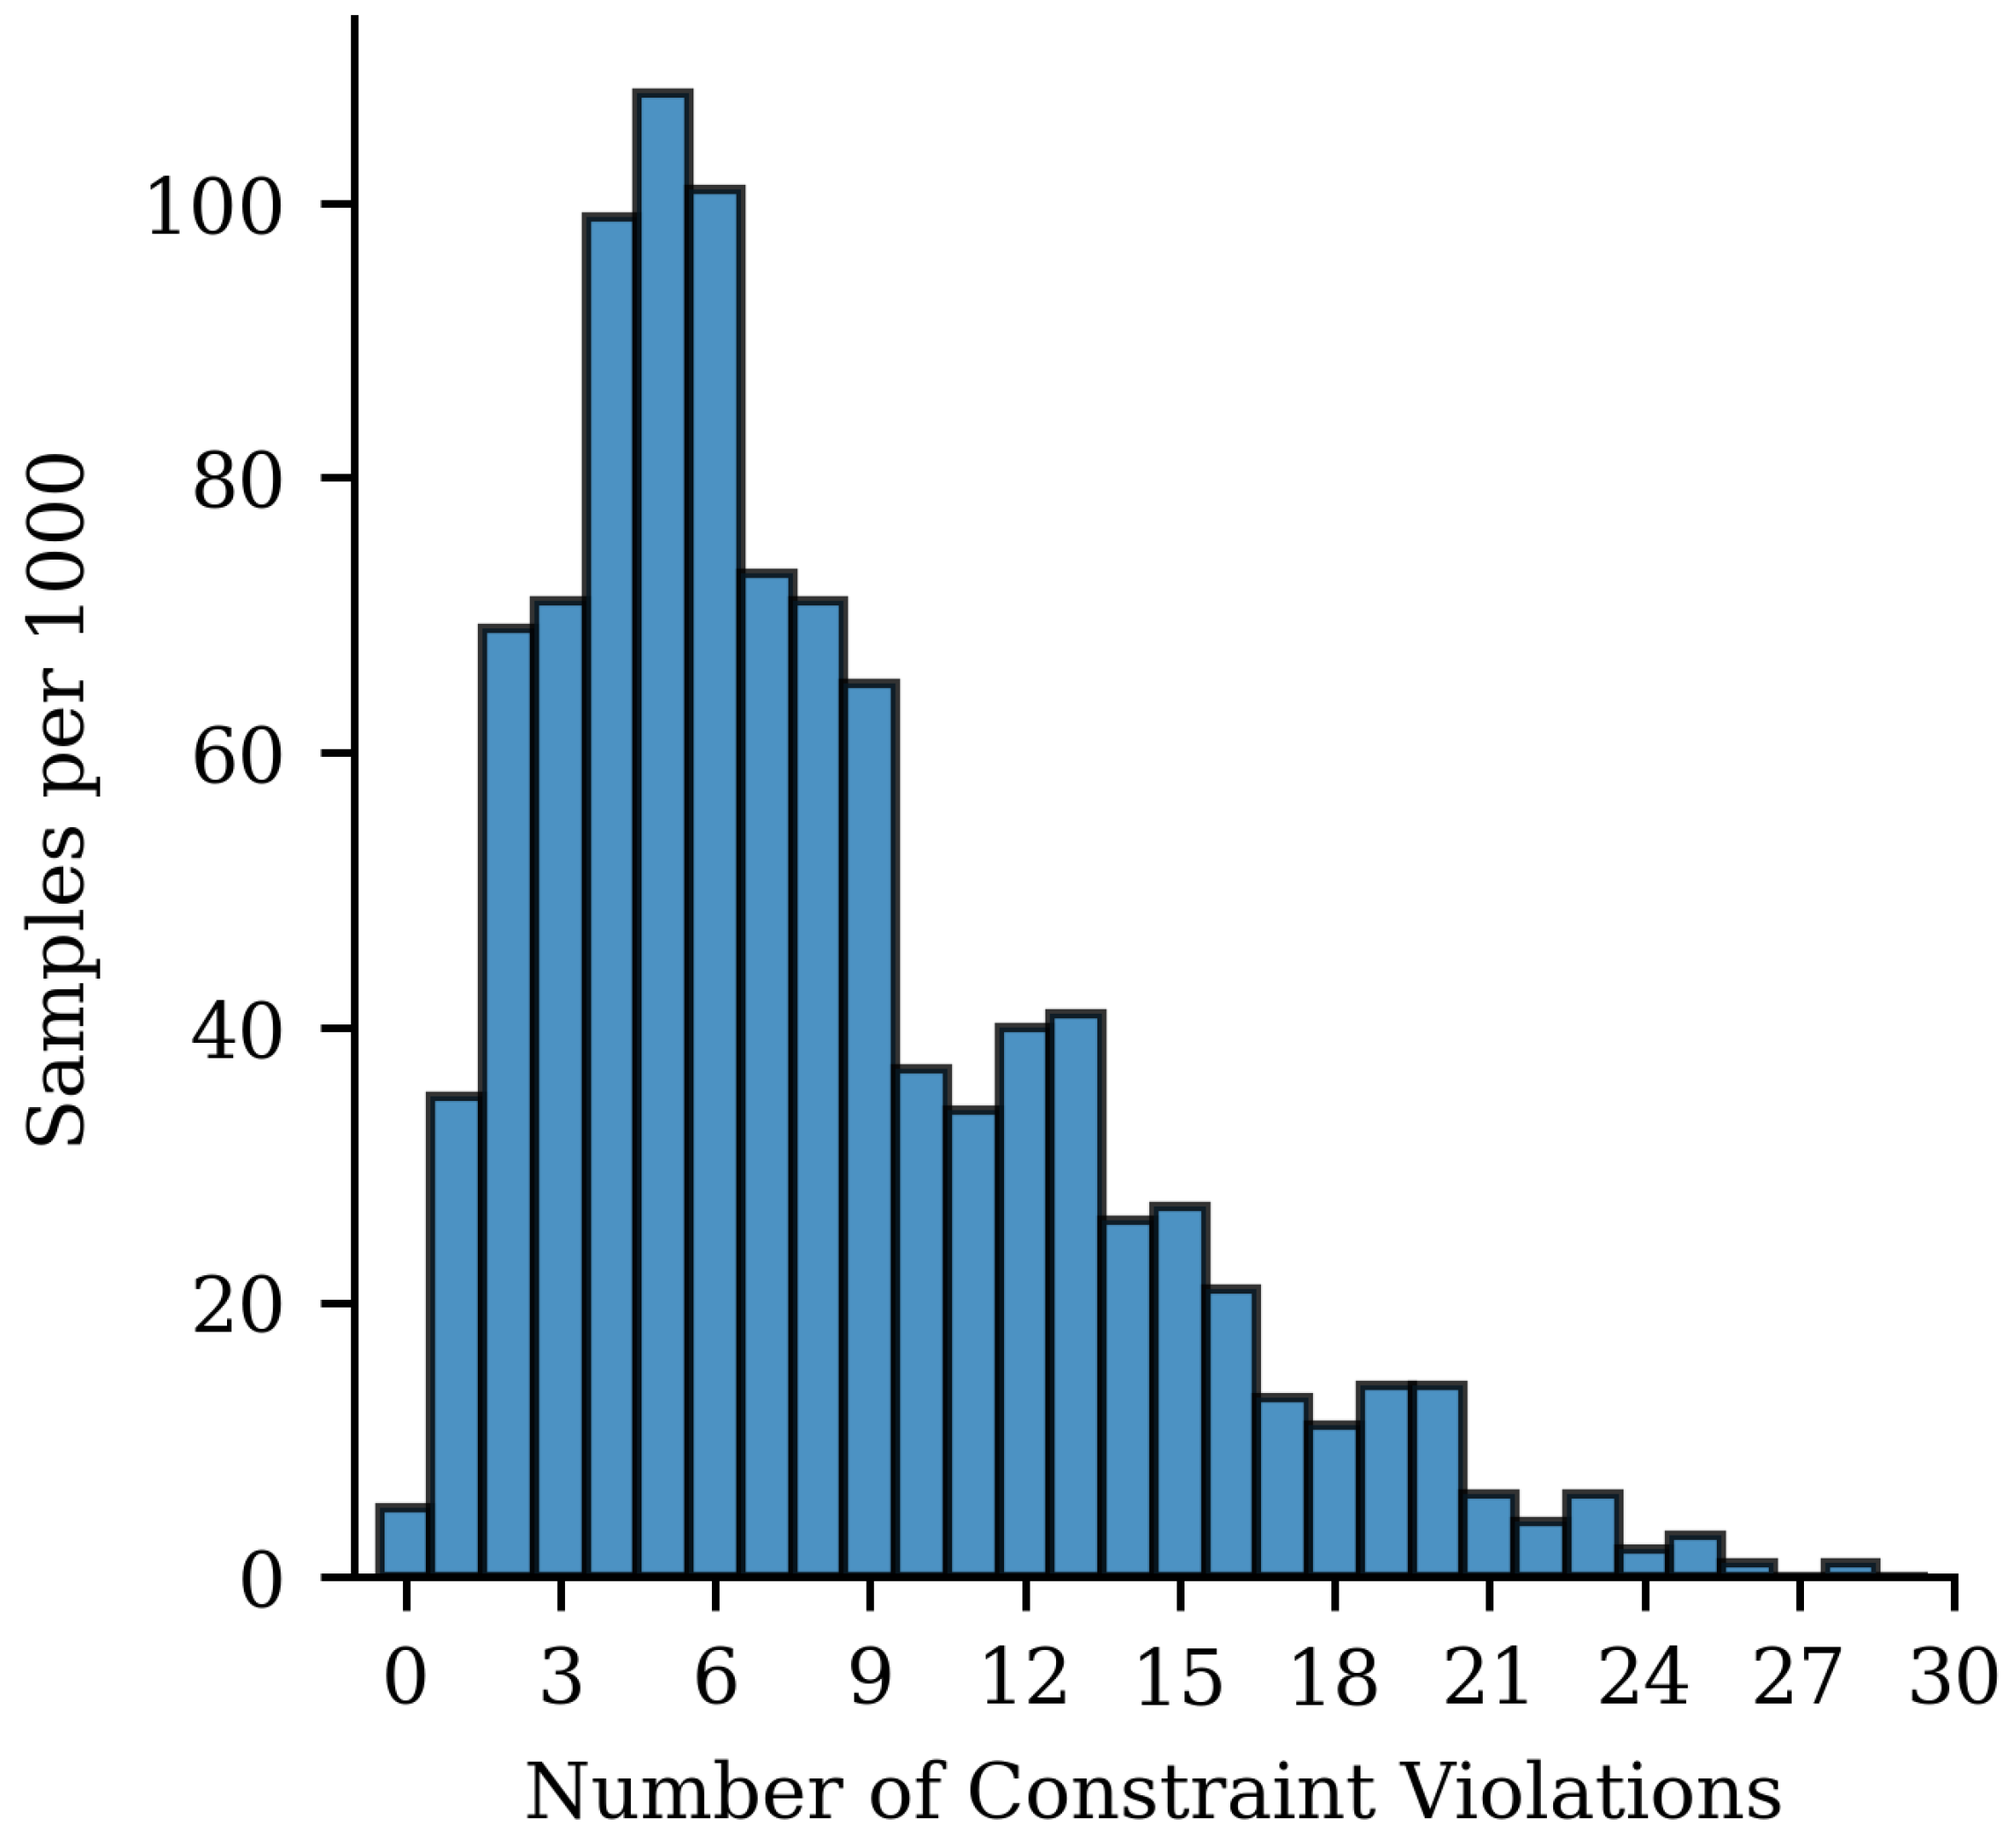
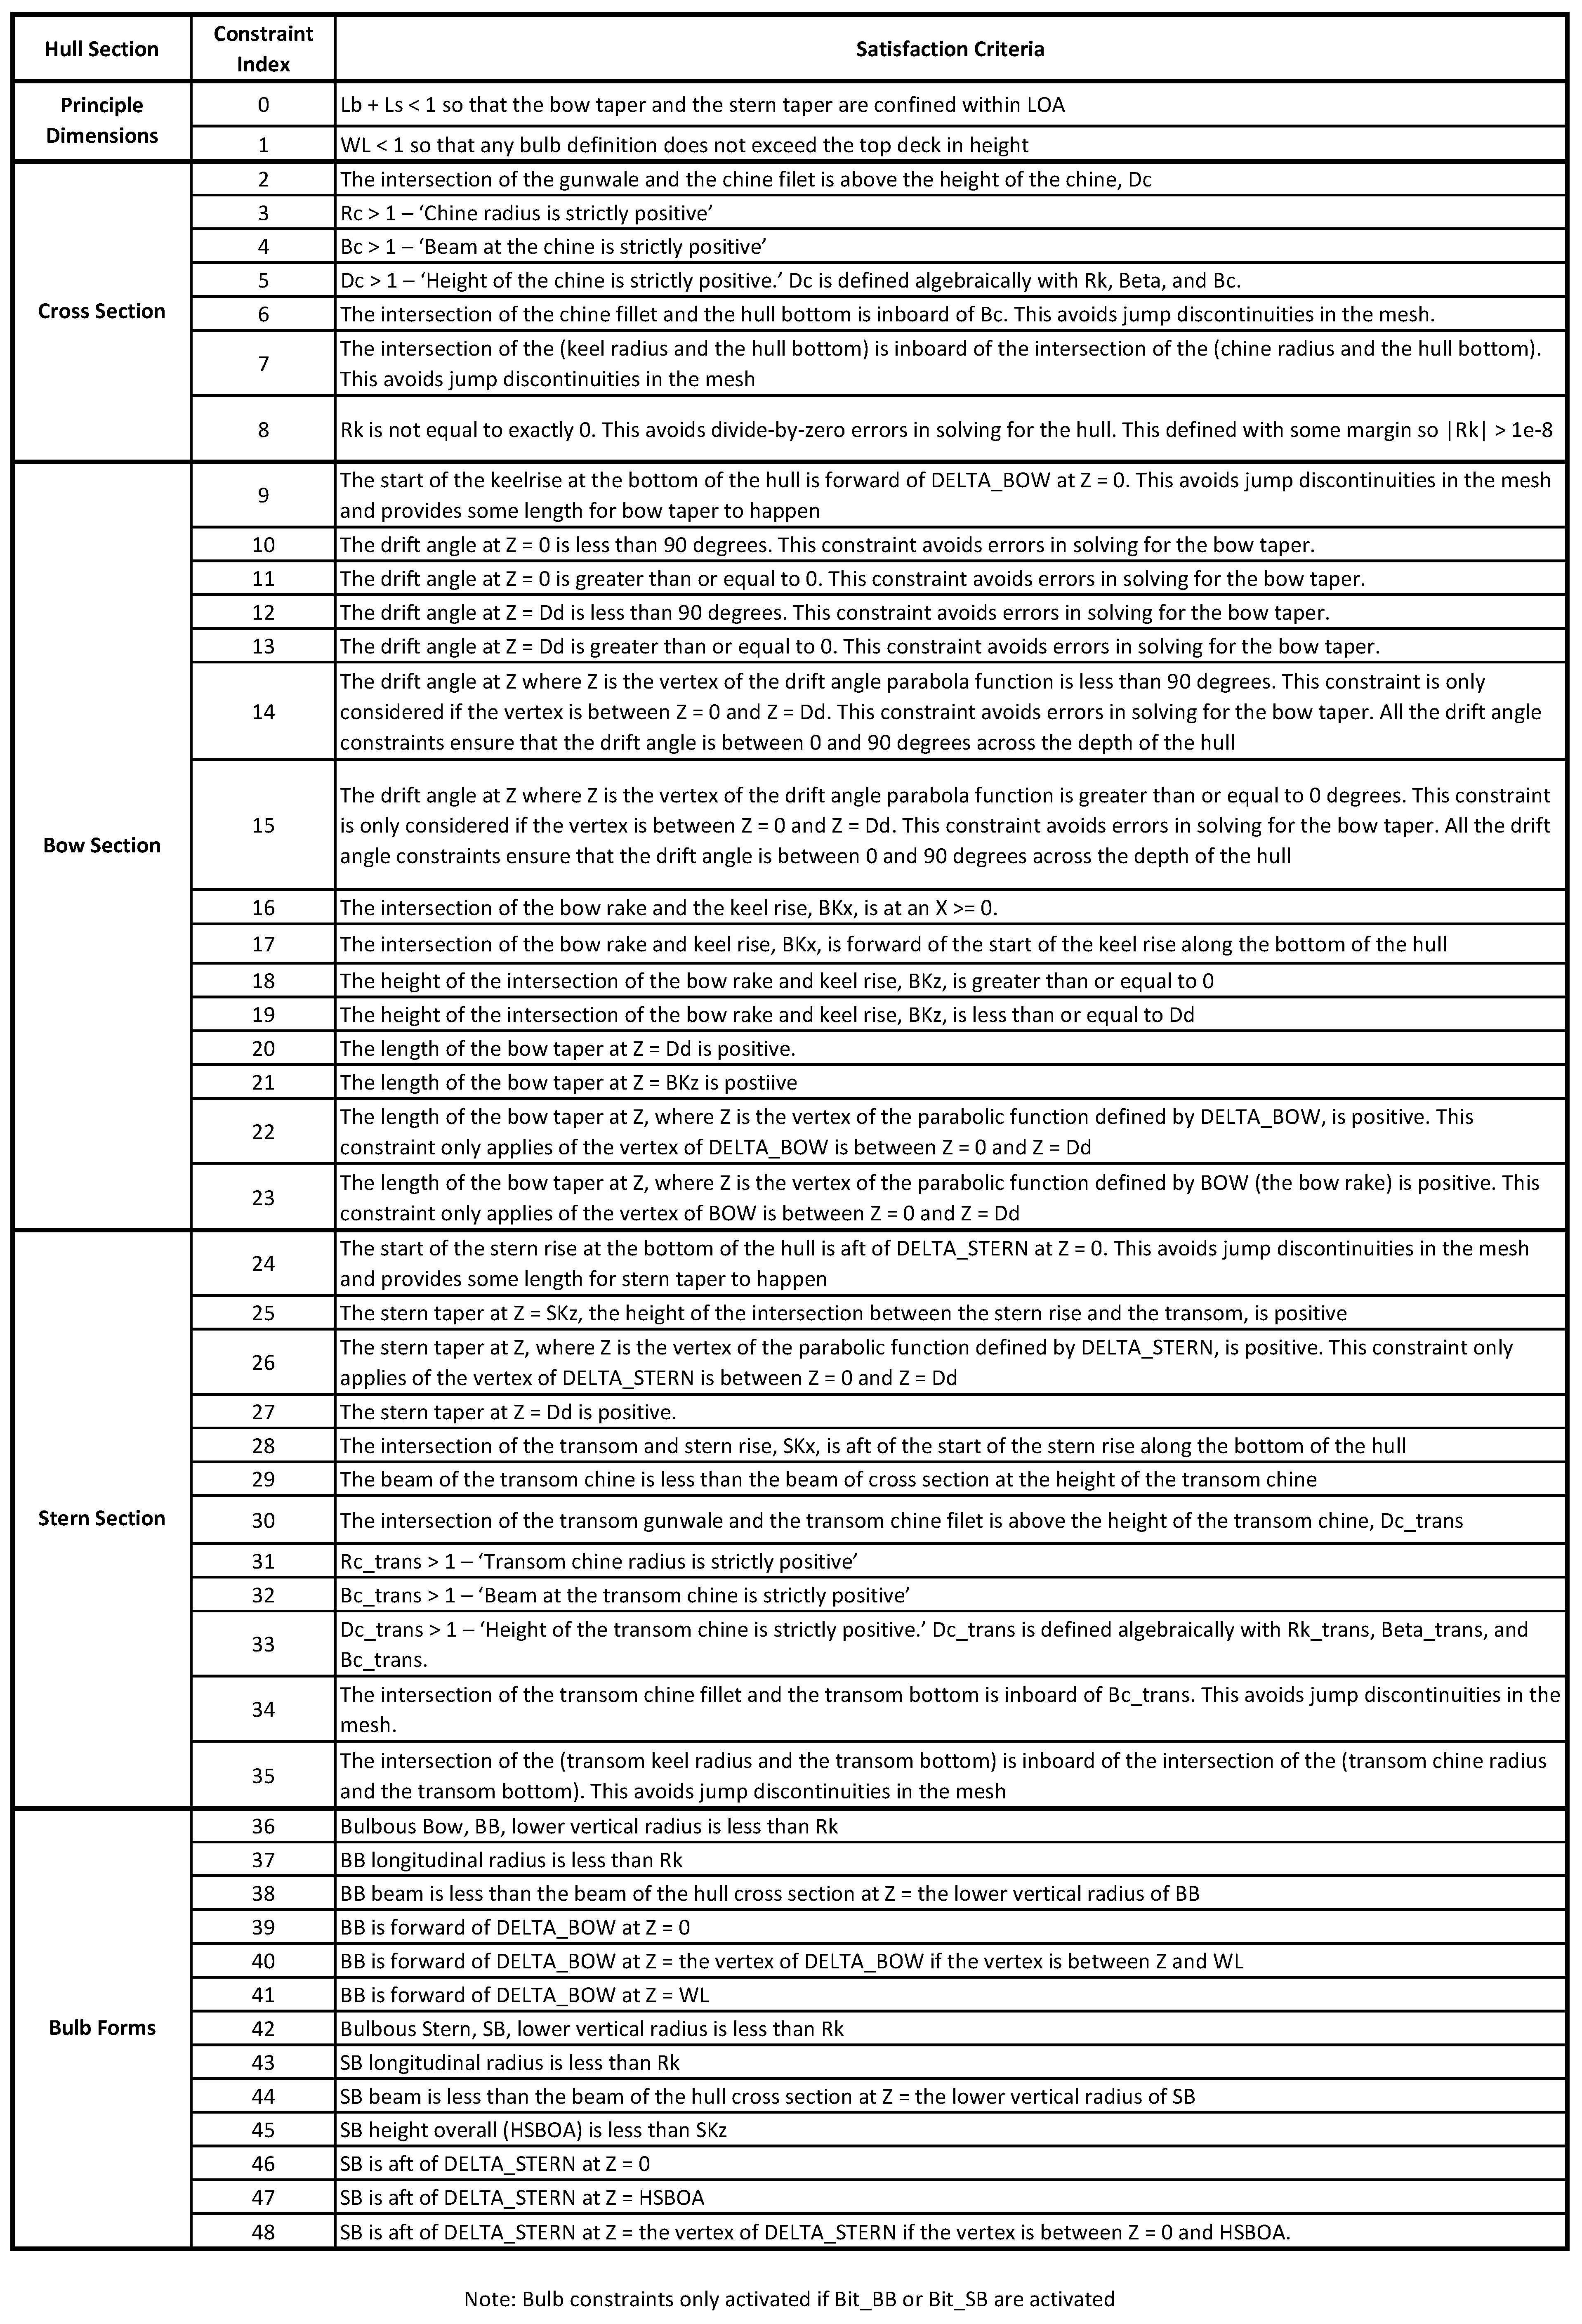
3.1.1. Feasibility Constraints for Hull Geometry

While the parameterization can define a large design space of hull geometries, constraints on the parameterization are needed to ensure that a feasible hull will be produced by a specific set of parameters. To satisfy a “feasible” hull shape, the hull’s surface only needs to satisfy two criteria:
  • The hull is watertight, meaning that there are no holes on its surface;
  • The hull surface is not self-intersecting.
As the hull surface is defined by a set of equations with constants dictated by the parameter values, conditions to determine whether a hull’s surface satisfies the two main feasibility criteria can be solved algebraically. The advantage of algebraically solving these conditions is significantly reduced computational effort when checking hull feasibility with the algebraic constraints compared to feasibility checks with mesh generation. After searching through the design space of the hull parameterization and examining the equations that define the hull surface, a set of forty nine constraints were defined to determine if a hull surface produced from a specific parameterization satisfies the two feasibility criteria. Figure A6 in the Appendix B lists the 49 algebraic constraints and provides information on each of their satisfaction conditions.
Conversely, the two feasibility criteria can be checked by constructing the mesh of a hull and analyzing its surface. Mesh generation and feasibility checks are computed in O ( N l o g ( N ) ) , where N is the number of vertices on the mesh. On an Intel Core i9-10980XE Processor (Intel Corporation, Santa Clara, CA, USA), the construction and checking of a hull mesh with approximately 80,000 vertices was 1.77 s. Comparatively, the algebraic constraints checked the design feasibility of a parametric hull in 0.000199 s. This is a ten-thousand-fold increase in speed when checking design feasibility with the algebraic constraints. A uniform random sampling of the design parameters leads to the generation of a feasible hull in approximately 1 per 150 tries. In addition to the 30,000 feasible hulls in the Ship-D dataset, an additional 20,000 design vectors (called invalid samples) that violate at least one feasibility constraint were generated. These invalid samples were used to train models in classifying and distinguishing between feasible and infeasible design vectors [41].

3.1.2. Hull Performance Measures

The Ship-D dataset already contains ten geometric measures and thirty-two wave drag calculations for each hull. The ten geometric measures allow naval architects to characterize a hull when designing a ship. The ten geometric measures are calculated using trapezoidal integration at ten draft marks spaced along the depth of the hull. These ten geometric measures are as follows:
  • Height of draftmark;
  • Length of the waterline;
  • Area of the waterplane;
  • Surface area of the hull below the specified draftmark (wetted surface);
  • Longitudinal centers of flotation (waterplane centroid);
  • Second moment of area about the longitudinal axis of the waterplane;
  • Second moment of area about the transverse axis of the waterplane;
  • Displaced volume below the draftmark;
  • Longitudinal center of buoyancy;
  • Vertical center of buoyancy.
As these metrics have units of length to some power L n , they are normalized by the first term in the parameterization, L O A , to its respective power. For example, lengths are normalized by L O A , areas by L O A 2 , volumes by L O A 3 , and area moments of inertia by L O A 4 . This allows computational analysis of the geometry of the hull to be performed independently of the hull’s scale.
In addition to the geometric measures, the Ship-D dataset has thirty-two wave drag coefficients for each hull across four different drafts and eight velocity conditions. The four drafts are 25%, 33%, 50%, and 67% of the hull’s total depth. The eight velocity conditions are normalized using Froude scaling. The eight velocities are between F n = 0.10 and F n = 0.45 in increments of 0.05, corresponding to typical operating conditions of traditional displacement hulls [45,46]. The Froude number is the relative scaling between inertial and gravitational forces described in the equation below:
F n = U g L
where U is the hull speed, g is gravity, and L is a length scale. The length used in simulating the 32 speed-draft conditions of the hulls was the length of the waterline at the tested draft mark. In this way, thirty two unique conditions were measured. Wave drag is both a function of the hulls geometry, and the hydrodynamics of waves propagating off of the hull from its forward motion. Including a full spectrum of speed–draft conditions in the dataset allows a machine learning model to learn the effects of drag due to the changing of the submerged geometry with draft and speed. This provides significantly more information related to the geometry and performance of a hull than available from measuring a single operating condition. This allows a generative model using the Ship-D dataset to generalize wave drag in the design process. As the generative model is intended to produce conceptual hull designs, it is imperative that the exact speed–draft condition is unknown, so that the model generates hulls that generally have low drag. Section 6.1 details goals for generating hull designs tailored to specific use cases, which could include specific speed–draft conditions.
The Michell integral was chosen over other linear wave methods to simulate wave drag for its relative computational efficiency and the accuracy it provides. The Michell integral is a linear estimate of the wave drag of a slender ship in forward motion. It is defined using the following equation [27,28]:
R w = A ρ g 2 π U 2 1 ( I 2 + J 2 ) λ 2 λ 2 1 d λ
where ρ is the density of water, g is gravitational acceleration, U is the ship’s speed, and A , I and J are integrated terms relating to the surface normal across the hull and the direction of wave propagation. Further insight into these terms is given in Michell’s paper from 1898 [27].
In addition to scaling the relative speed and draft conditions for the hulls, the wave drag is also scaled to ensure consistency across the dataset:
C w = R w 1 2 ρ U 2 · LOA 2
Typical drag coefficients of hulls are scaled using the wetted surface area of the hull. Within the dataset, however, the wetted surface area of the hulls can vary greatly. Instead, the length overall (LOA) is used, as this is the first term in the parameterization. For the purposes of applying machine learning using the dataset, the wave drag coefficient can be characterized by the remaining 44 terms in the parameterization and the hull’s relative speed and draft.
An additional two measures of the hulls are included in this paper and will be added to the Ship-D dataset. The first measure is the Gaussian curvature of the hull’s surface. The second metric is a measure of the largest rectangular prism that can be vertically lowered into the hull, referred to as MaxBox for the remainder of this paper. Gaussian curvature quantifies the double curvature of a surface. The average Gaussian curvature is calculated for these hulls to assess the manufacturing complexity of the hull’s surface. As most large ships are constructed from welded sheet steel or aluminum, bending a sheet along two principal axes of curvature is a difficult task owing to both the sheet forming process and for welding the edge of a complex surface to another. By measuring the average double curvature of each hull, an understanding of the difficulty of manufacturing the hull surface is gained for the dataset. The Gaussian curvature was calculated for the hulls using a finite difference method to measure the principal curvature of the hull in the YZ plane and in the XY plane for a uniform grid of points on the hull [47]. Equation (4) calculates the average Gaussian curvature over the surface of the hull. The terms R X Y and R Y Z are the radii calculated using the finite difference method along the two principal axes of the hull’s surface. Gaussian curvature has units 1 / L 2 and is hence normalized by L O A 2
G C = S d A R X Y ( x , y , z ) · R Y Z ( x , y , z ) Total Surface Area
MaxBox measures the box with maximum volume that is completely inscribed by the hull and that can be vertically lowered into the hull through the waterplane at the hull’s top deck. This provides a measure for evaluating a candidate region within the ship hull for allocating cargo holds. Additionally, as the MaxBox is open at the deck of the ship, a crane can service this entire volume within each hull. The MaxBox for each hull was optimized using a Nelder–Mead simplex optimization algorithm, to maximize the volume of the box while constrained by the surface of the hull and the waterplane of the top deck [48]. Included in the dataset is the forward (x) position of the box, its length, width, depth, and volume. These results were normalized using their length dimensionality, 1 / L O A and 1 / L O A 3 .
Among the available performance measures in the Ship-D dataset, seven were selected to be implemented in the performance-driven generation of ship hull designs. The goal was selecting the seven performance metrics that generally describe the quality of a hull.These metrics provide an avenue to compare hulls directly to each other using useful characteristics that consider the hulls’ hydrodynamics, hydrostatics, and manufacturability. These seven performance metrics are as follows:
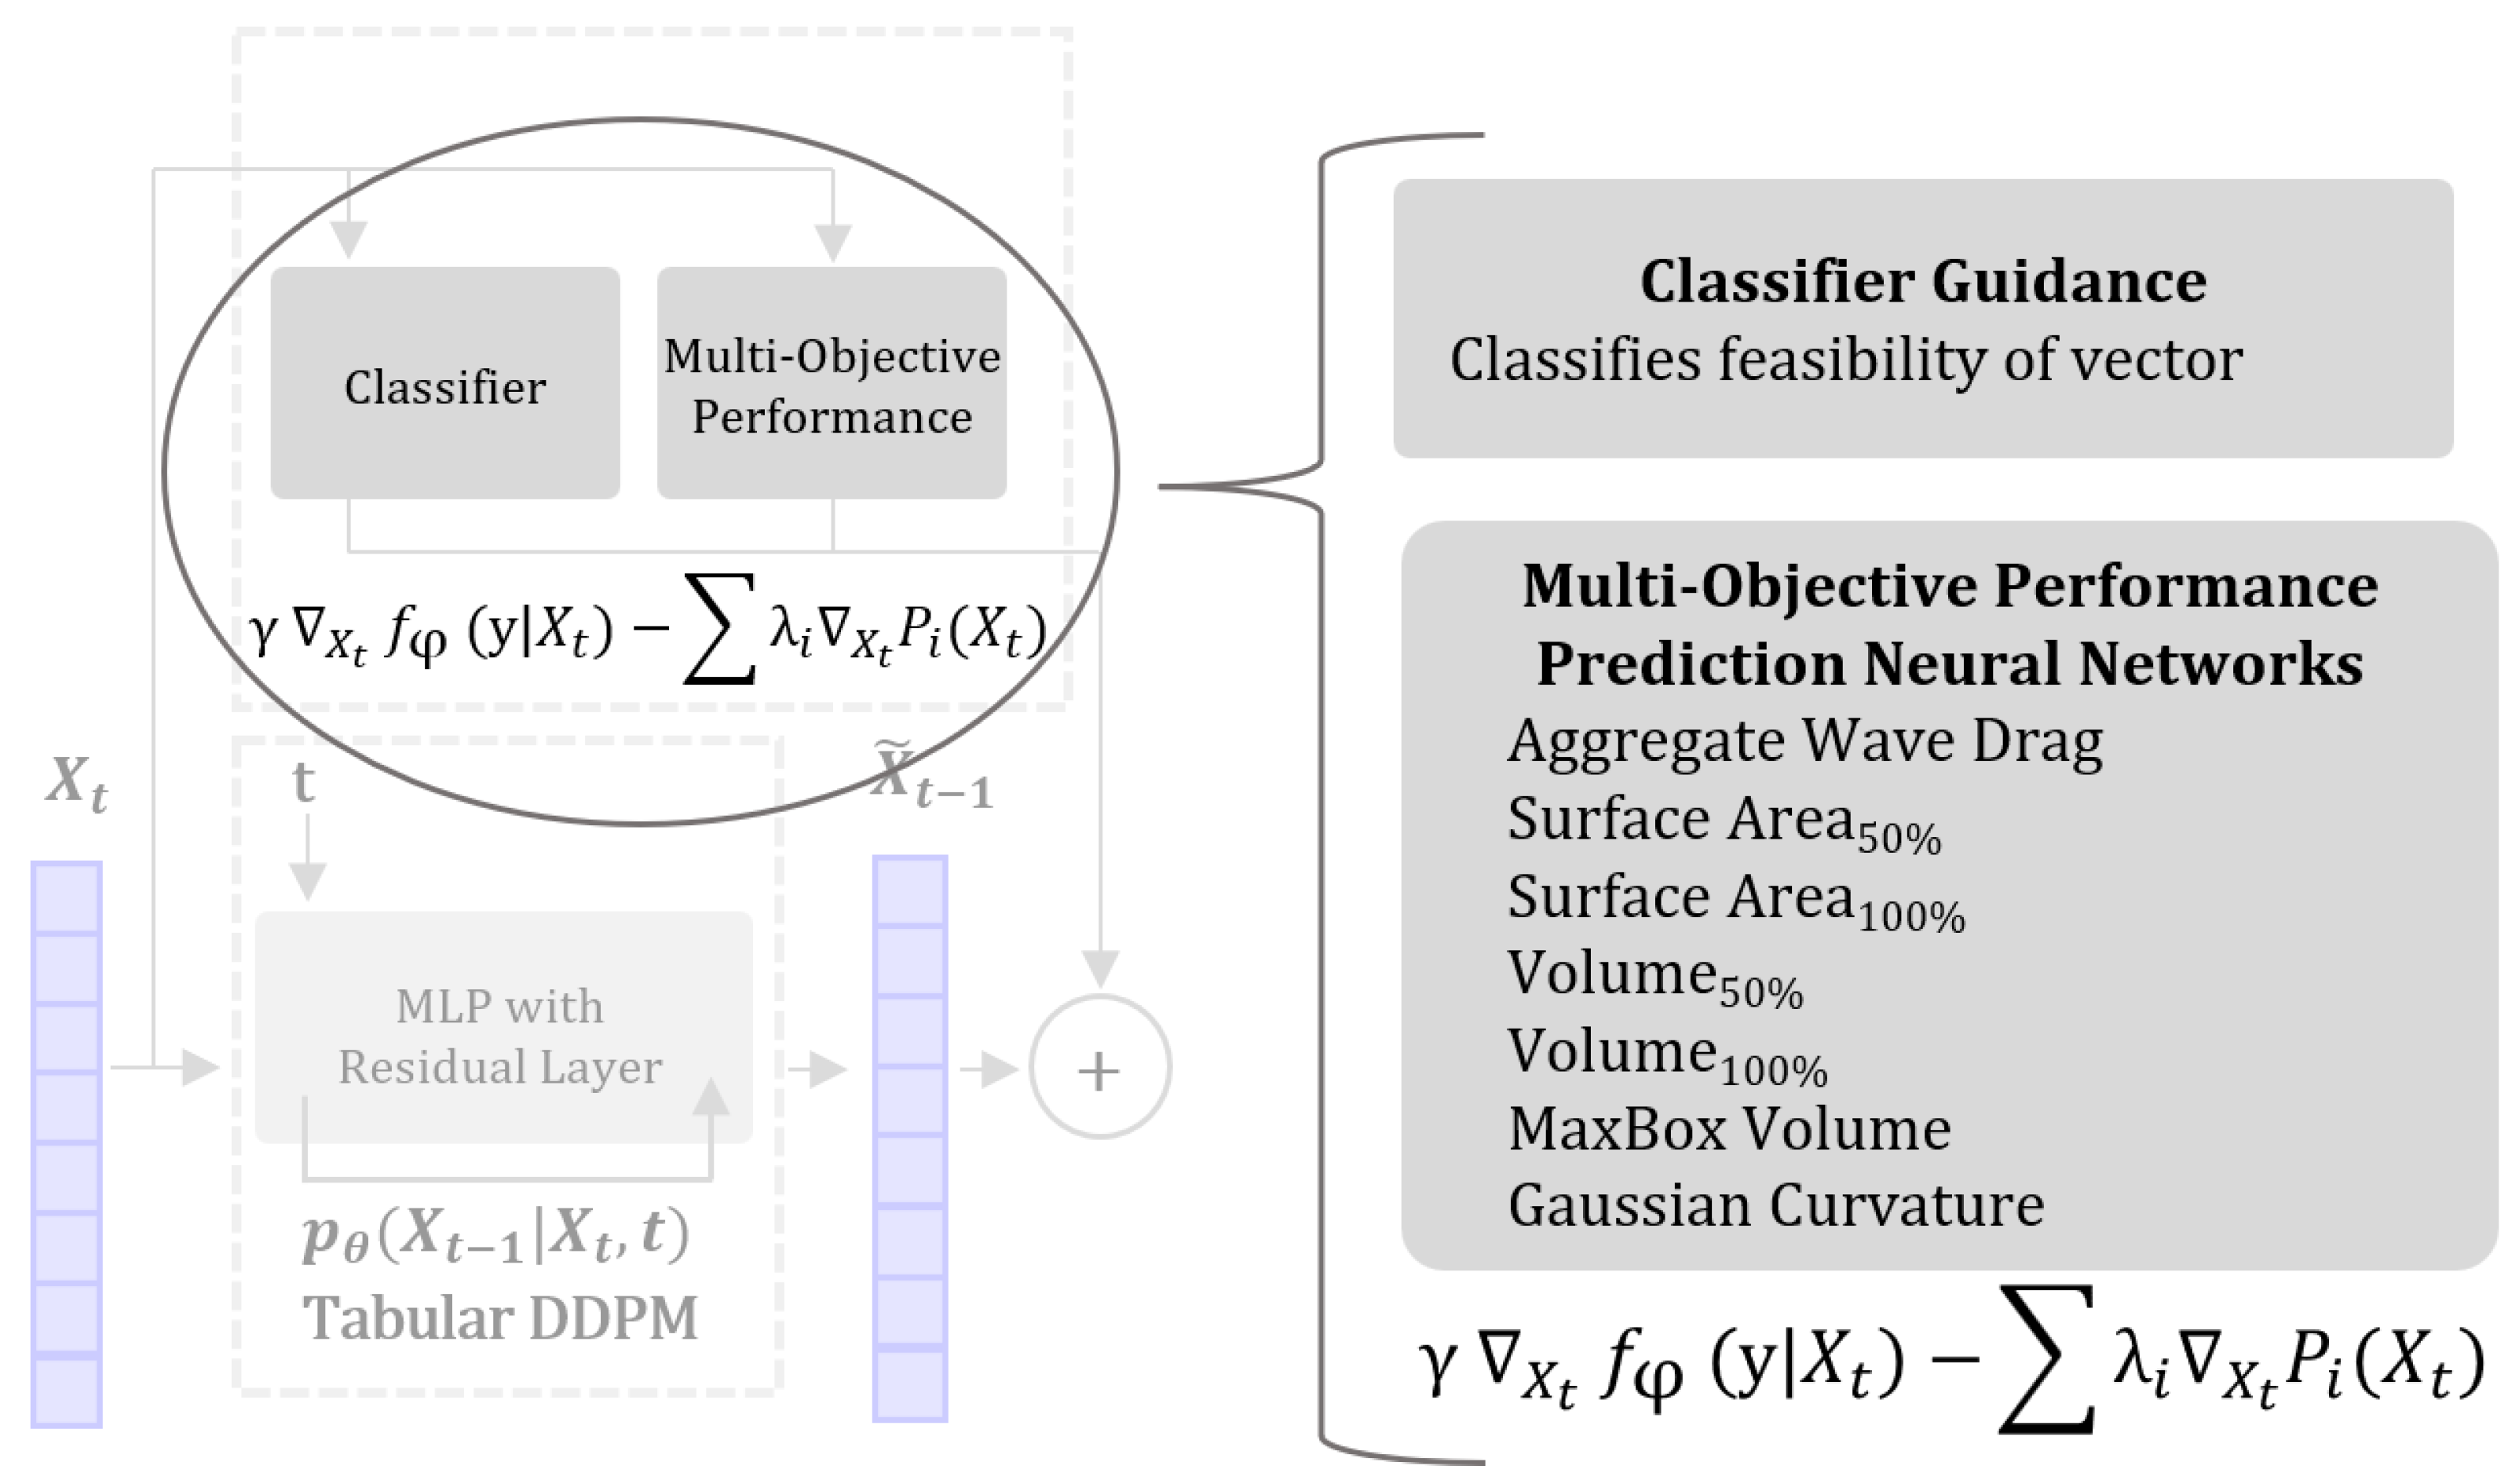
  • Aggregated sum of wave drag coefficients;
  • Surface area of the hull up to 50% of its total depth;
  • Total surface area of the hull;
  • Displaced volume of the hull up to 50% of its total depth;
  • Total displaced volume of the hull;
  • Volume of the MaxBox;
  • Gaussian curvature.
The aggregated sum of wave drag coefficients was selected as a way to quickly characterize the general wave drag of a given hull. In large ships, wave drag is the primary component in the ship’s total drag. By learning how a ship’s hull shape affects drag, a generative AI model could generate hulls with low wave drag, saving ship operation costs through reduced fuel consumption. The aggregated sum of the wave drag coefficients is defined in Equation (5). It is important to note that this performance metric and five of the other metrics are represented on a logarithmic scale. Due to the geometry of the hull designs, these performance metrics span several orders of magnitude across the Ship-D dataset. The distribution of the logarithmic scaled performance metrics is normal, a desired quality for machine learning.
C w * = i = 1 32 log 10 ( C w i )
The surface area of the lower half of the hull was selected as a performance measure, as this is the portion of a hull’s surface that is most likely to be submerged when the hull is in water. The wetted surface of the ship affects the viscous drag acting on the hull. Reducing the wetted surface area of a hull can reduce the total drag of a ship, saving operational costs through reduced fuel consumption. Additionally, the total surface area of the hull was selected, as this can consider the amount of material needed to manufacture the surface of the ship hull. By reducing the total surface area of the ship, manufacturing costs can be reduced through generating hull designs with a smaller total surface area. The two measures of surface area are provided in Equations (6) and (7).
S A 50 % * = log 10 0 T / D d = 0.5 δ S A ( z ) δ z L O A 2
S A 100 % * = log 10 0 T / D d = 1.0 δ S A ( z ) δ z L O A 2
The displaced volume of the bottom half of the hull was selected as it characterizes the portion of the hull that contains much of the displaced volume for buoyant forces. This performance metric therefore characterizes the relative total weight of the ship and its cargo. Learning how the hull design parameters affect the displaced volume of the hull can lead to generating hull designs that can carry more weight. The total displaced volume of the hull was also selected, as this measure characterizes the total volume capacity available for cargo, outfitting and the other systems on the ship. By learning how the ship hull design parameters affect its total displaced volume, ship hulls with greater total volume can be generated. These two measures of volume affect the ability of ships to generate revenue through the shipment of cargo. The two volume measures are calculated with Equations (8) and (9). With the intention of maximizing the volume metrics in hull generation, the volume measures are multiplied by 1 . This conforms the volume maximization problem to a “minimization” problem akin to the other performance objectives.
V 50 % * = log 10 0 T / D d = 0.5 δ V ( z ) δ z LOA 3
V 100 % * = log 10 0 T / D d = 1.0 δ V ( z ) δ z LOA 3
An additional measure of volume is the MaxBox volume. As described earlier in this section, the MaxBox metric measures the ratio of the most useful cargo-carrying volume of the ship compared to the hull’s total displaced volume. Learning how the design parameters affect MaxBox can lead to the generation of hulls with more useful cargo-carrying capacity. This can also lead to greater revenue through a ship’s operation. MaxBox is not on a logarithmic scale like the other measures, and it is calculated with Equation (10).
MaxBox * = Volume MaxBox Volume T / D d = 1.0
The final performance metric selected was the average Gaussian curvature of the hull. Since Gaussian curvature is a measure of a hull’s surface complexity, it affects the manufacturing costs of a ship. Reducing the average Gaussian curvature of a ship hull can lead to reduced manufacturing costs, making it a critical metric for a ship hull. The average Gaussian curvature is normalized for machine learning using Equation (11).
G C * = log 10 ( G C · L O A 2 )
While the aforementioned seven metrics were chosen to demonstrate the efficacy of the proposed methodology, it is crucial to highlight that this is not an exhaustive list of performance measures for ship hull evaluation. Indeed, a significant strength of the proposed diffusion model lies in its adaptability. It allows users to integrate additional performance metrics, without necessitating retraining. This flexibility underscores the model’s robustness and its potential to be tailored to various specific needs, optimizing designs based on a myriad of performance criteria.

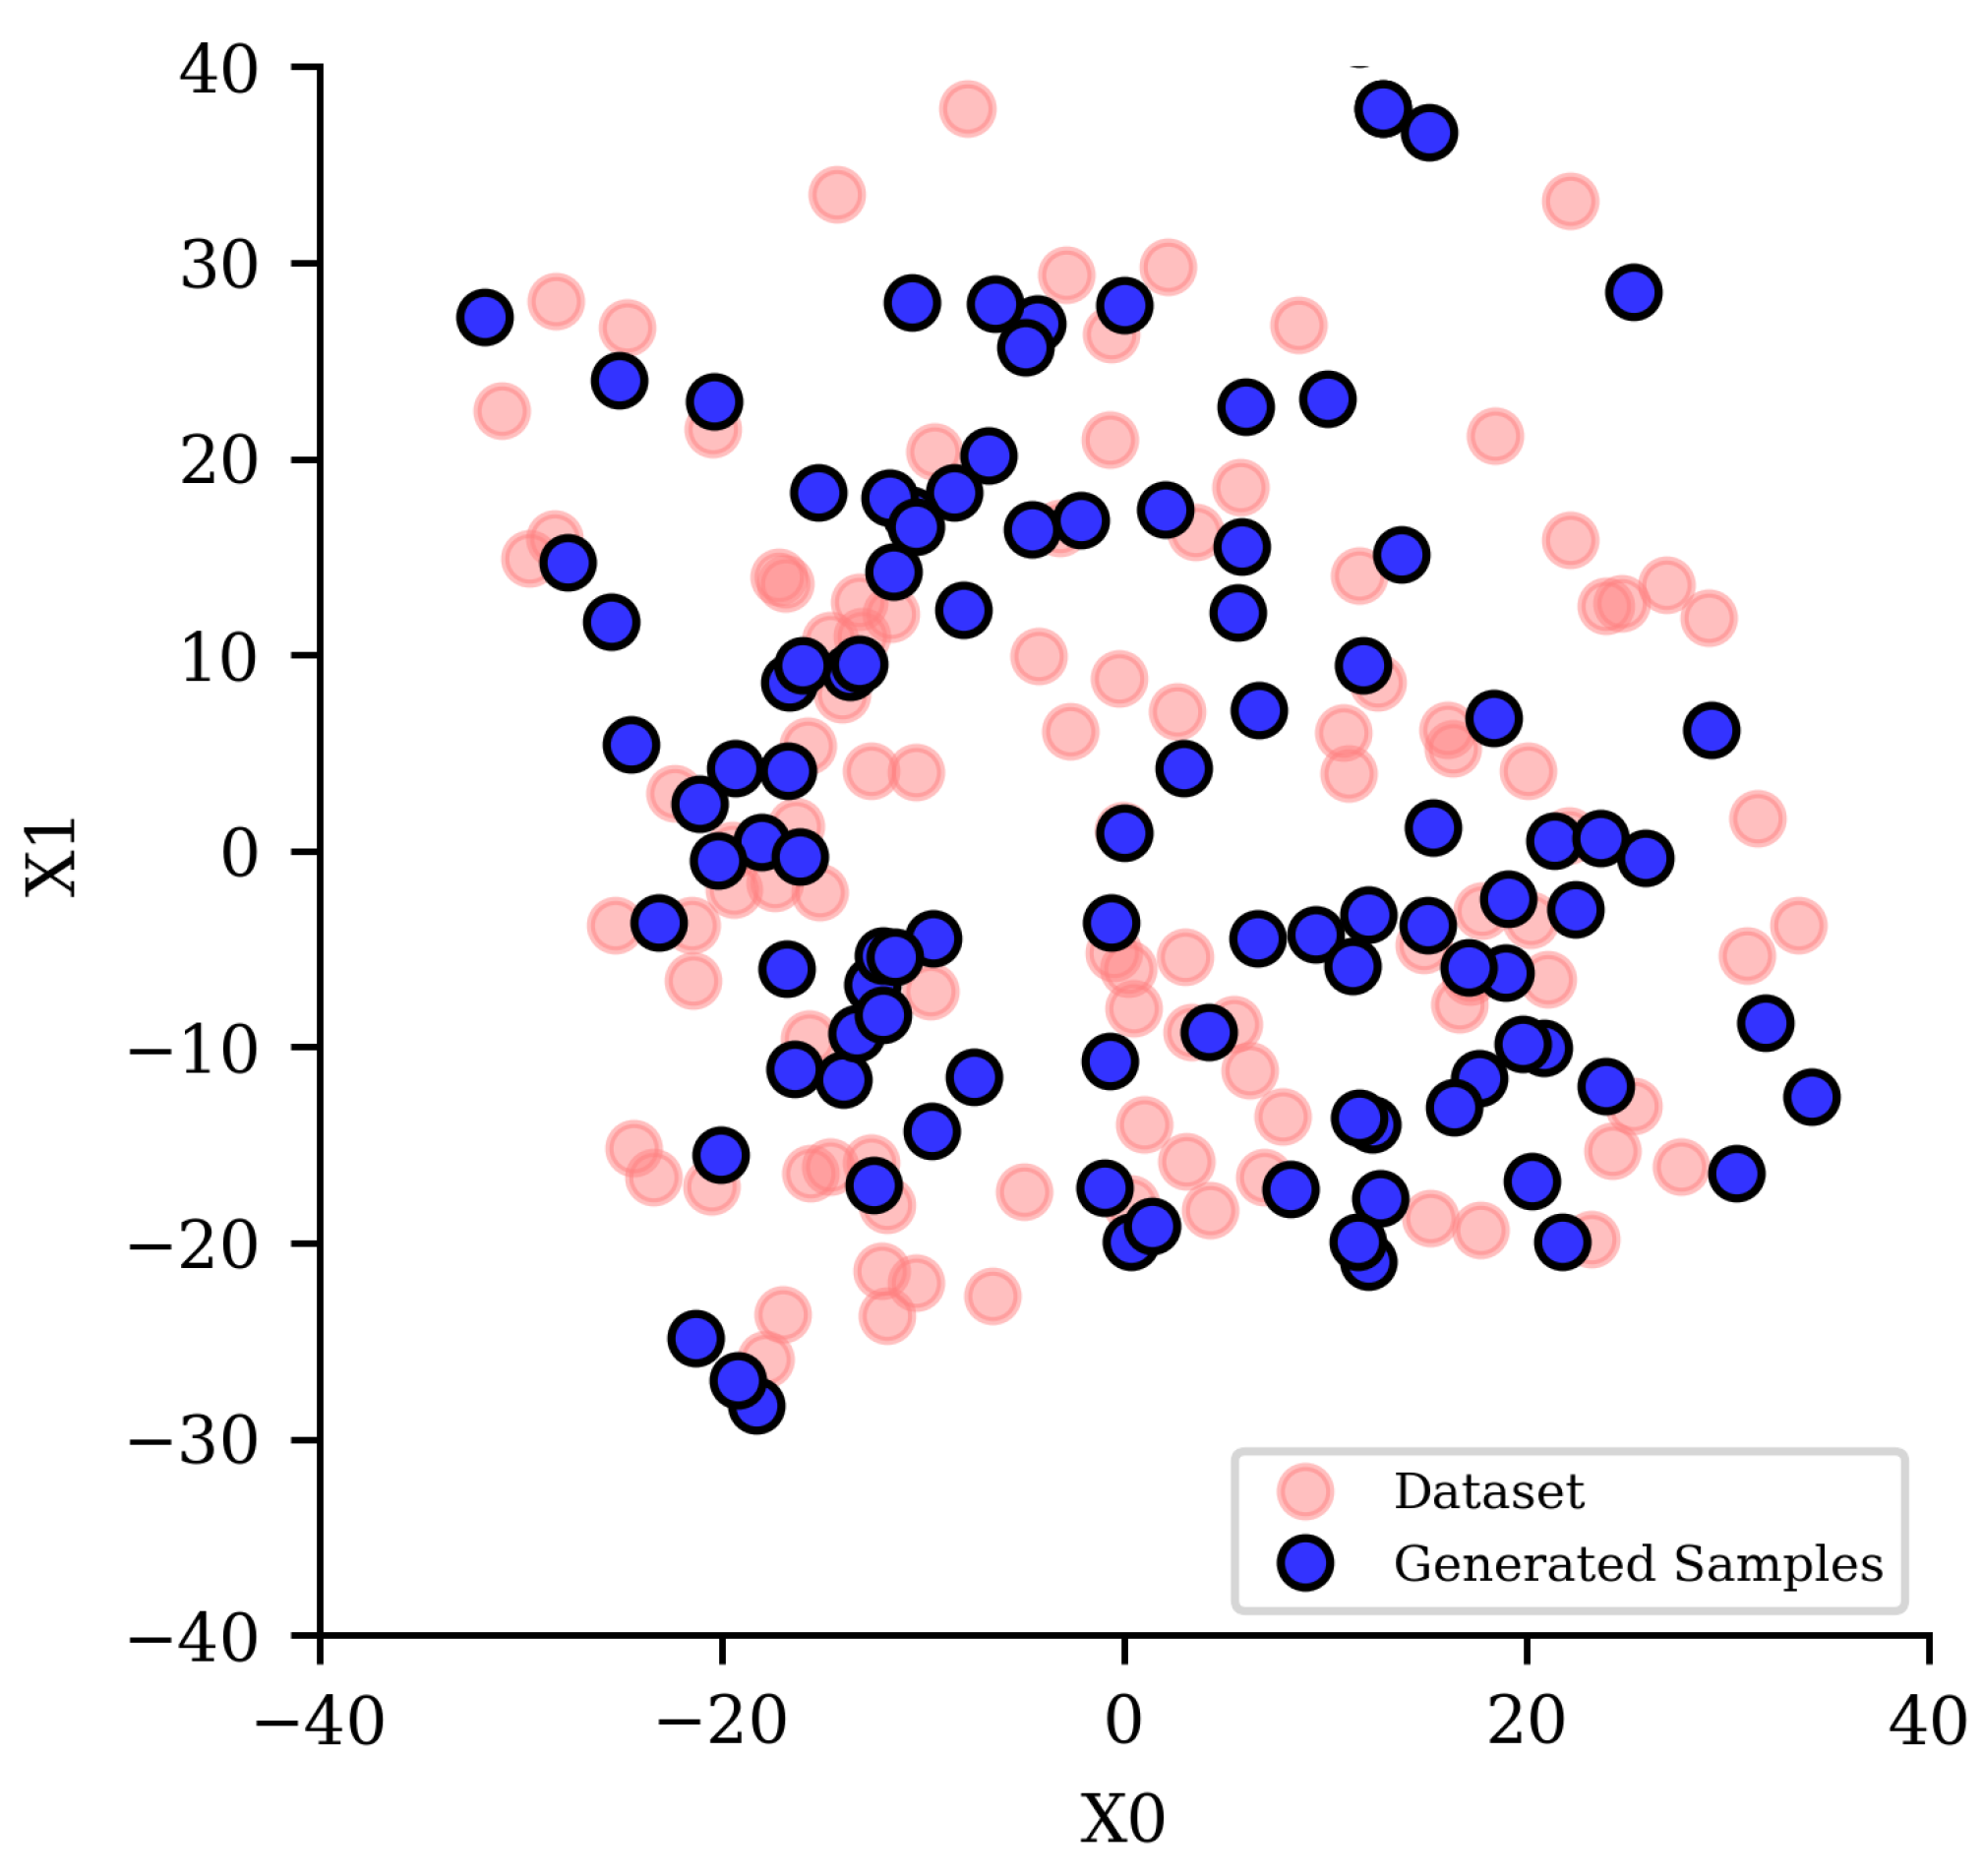
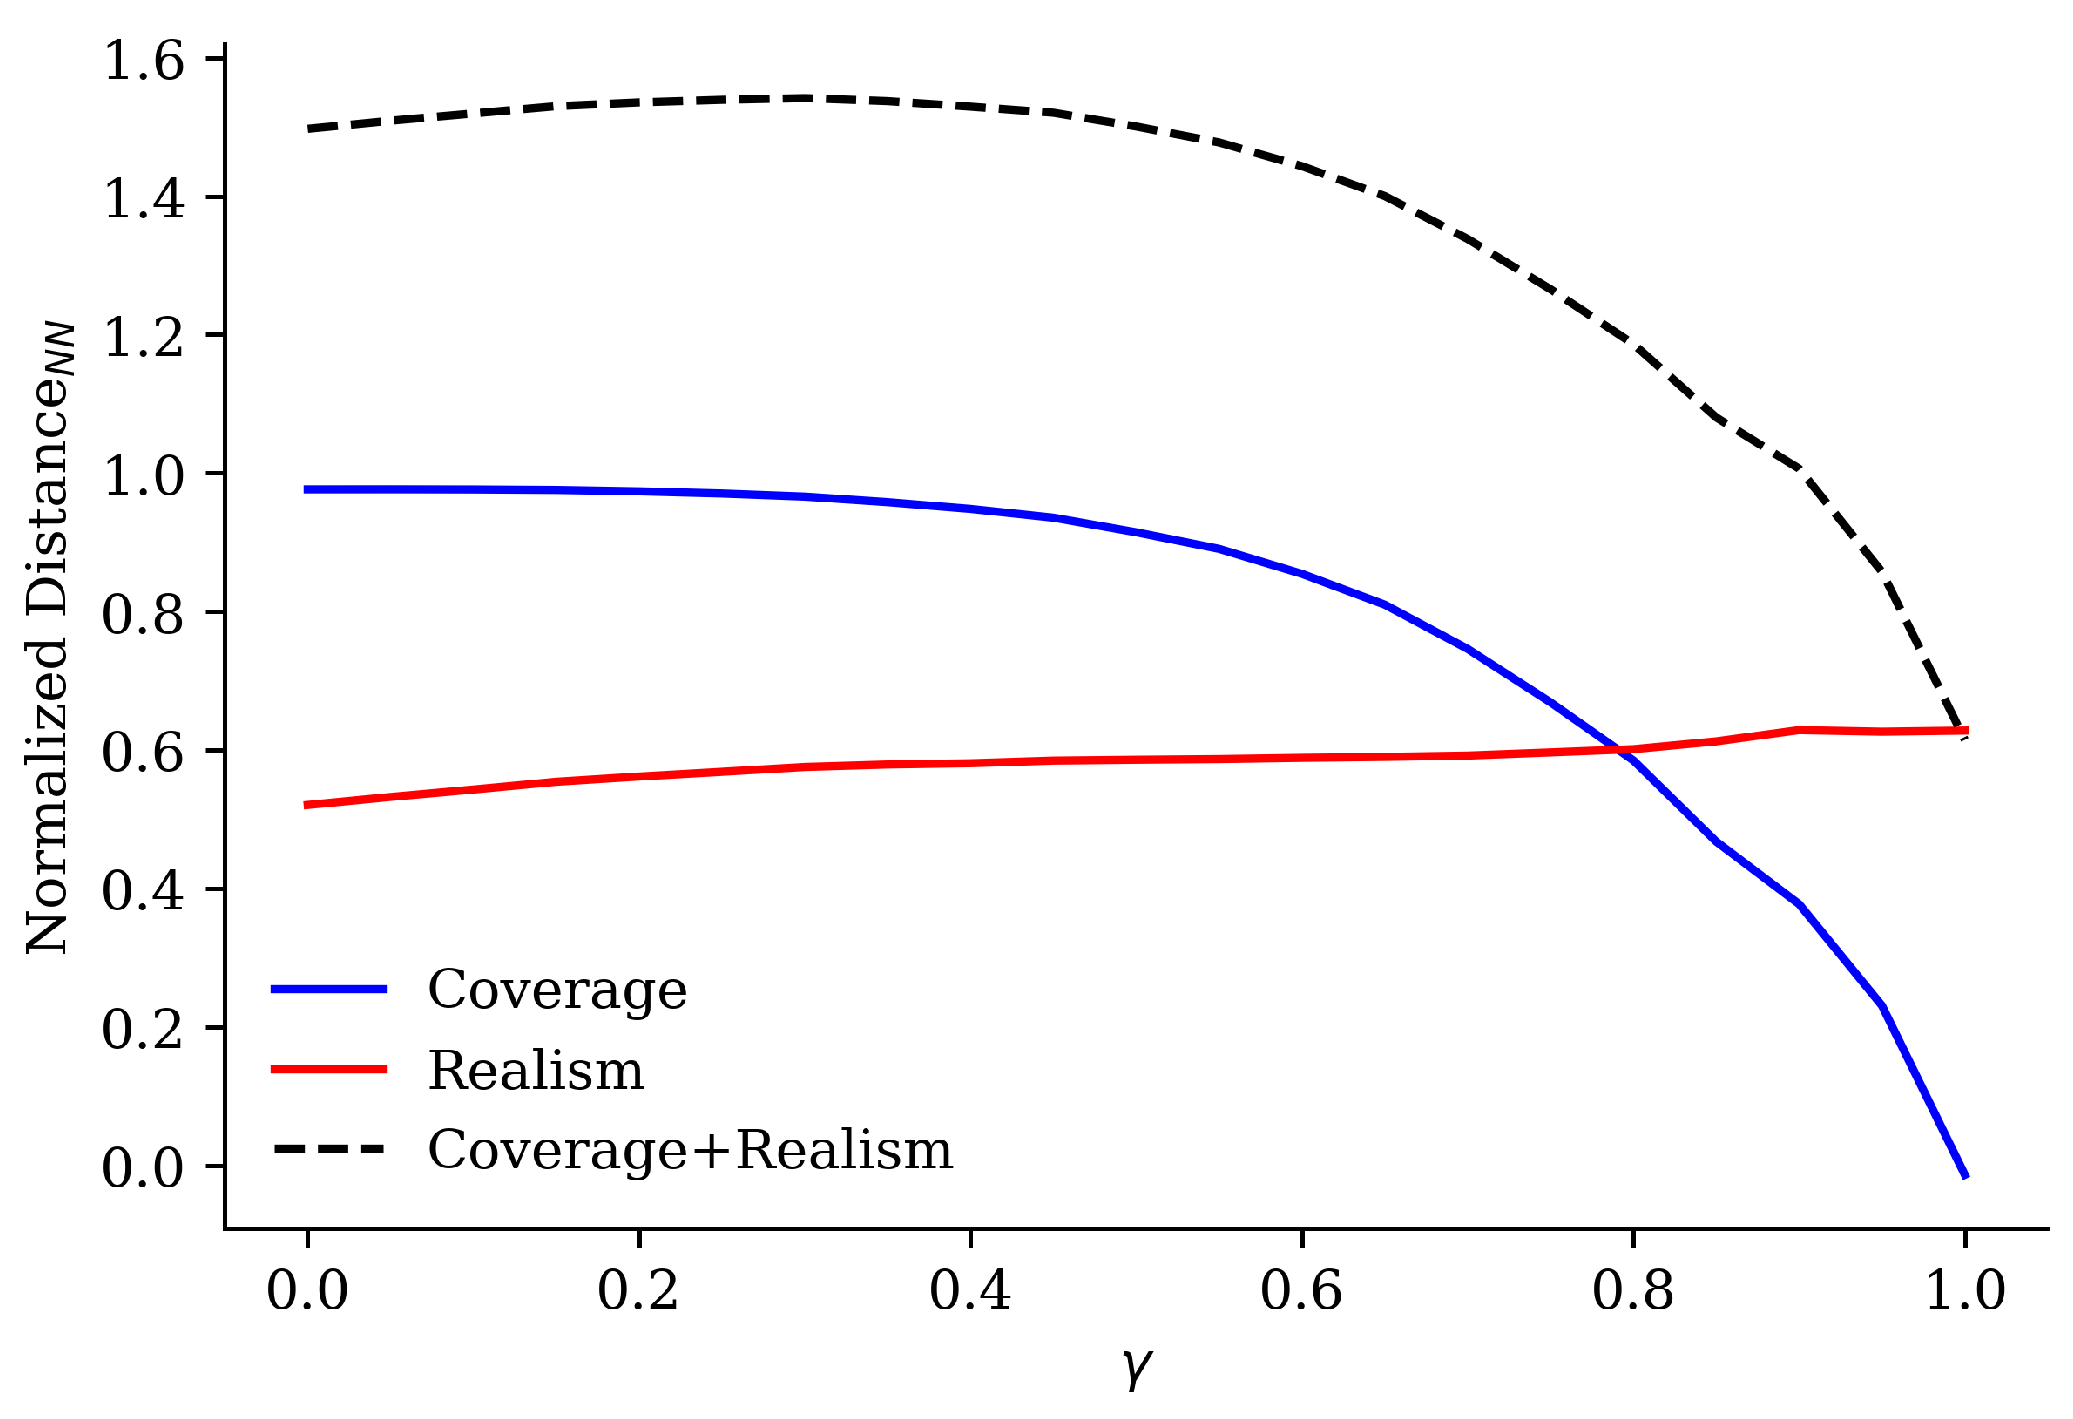
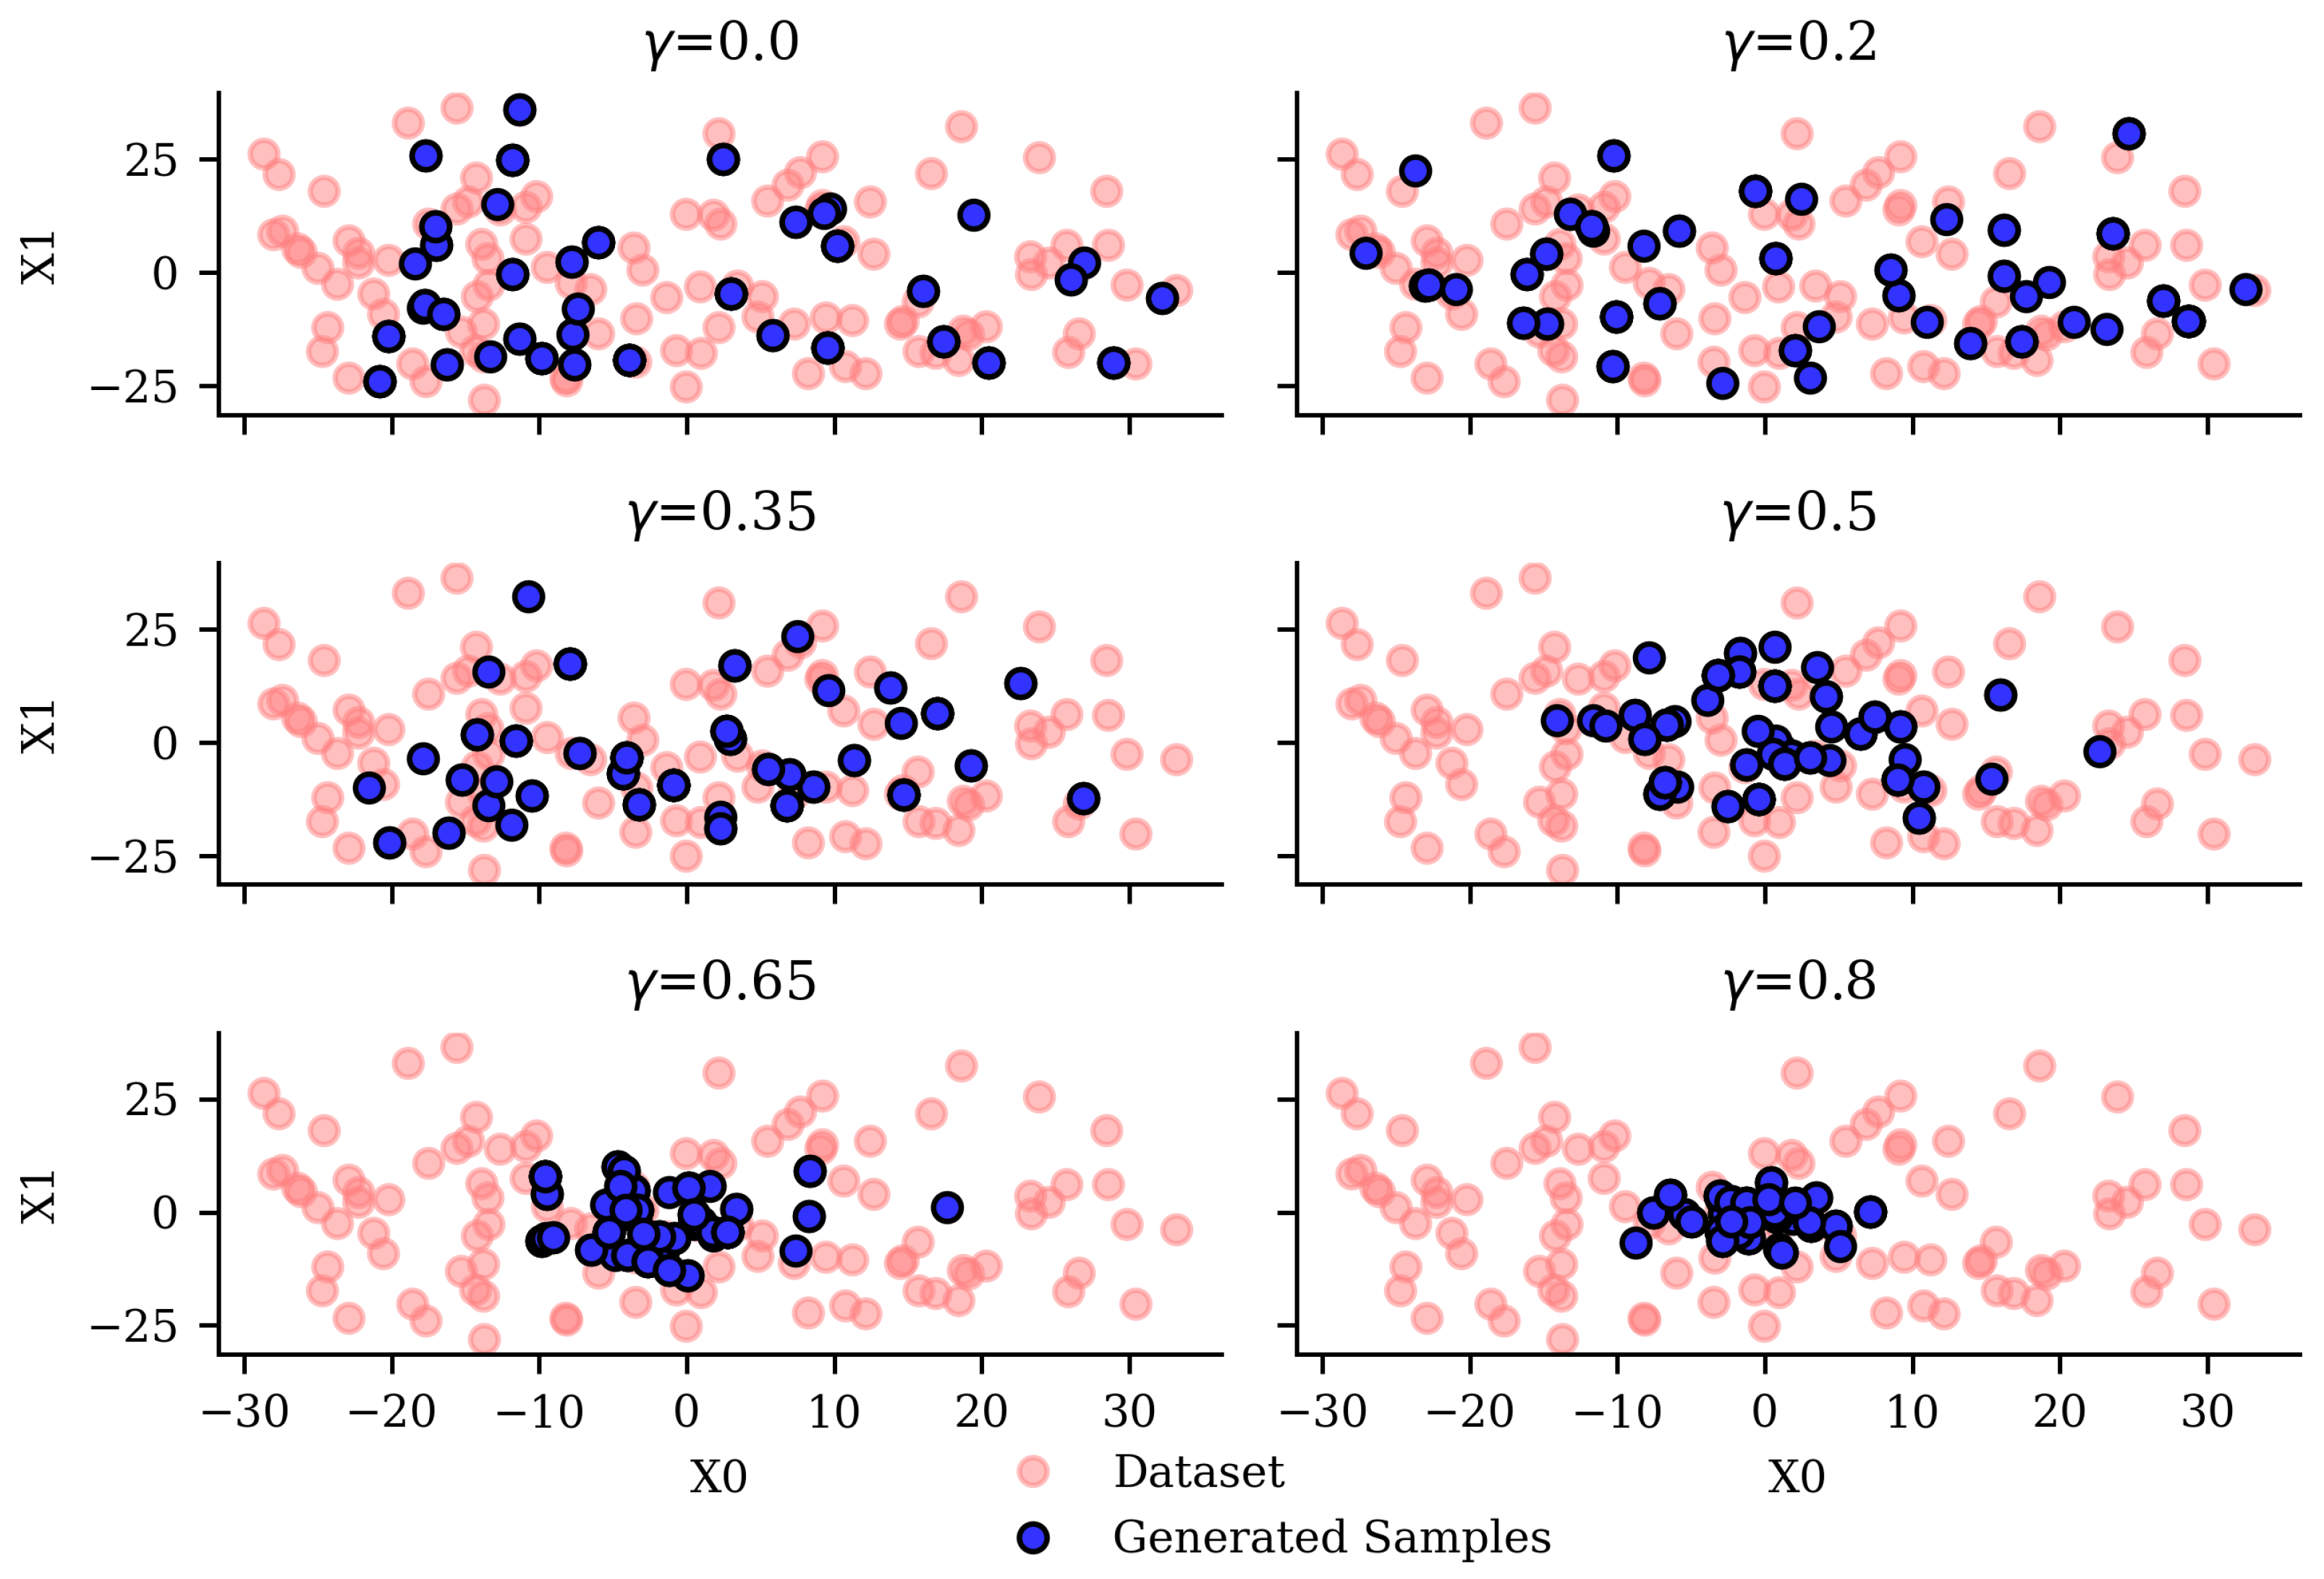
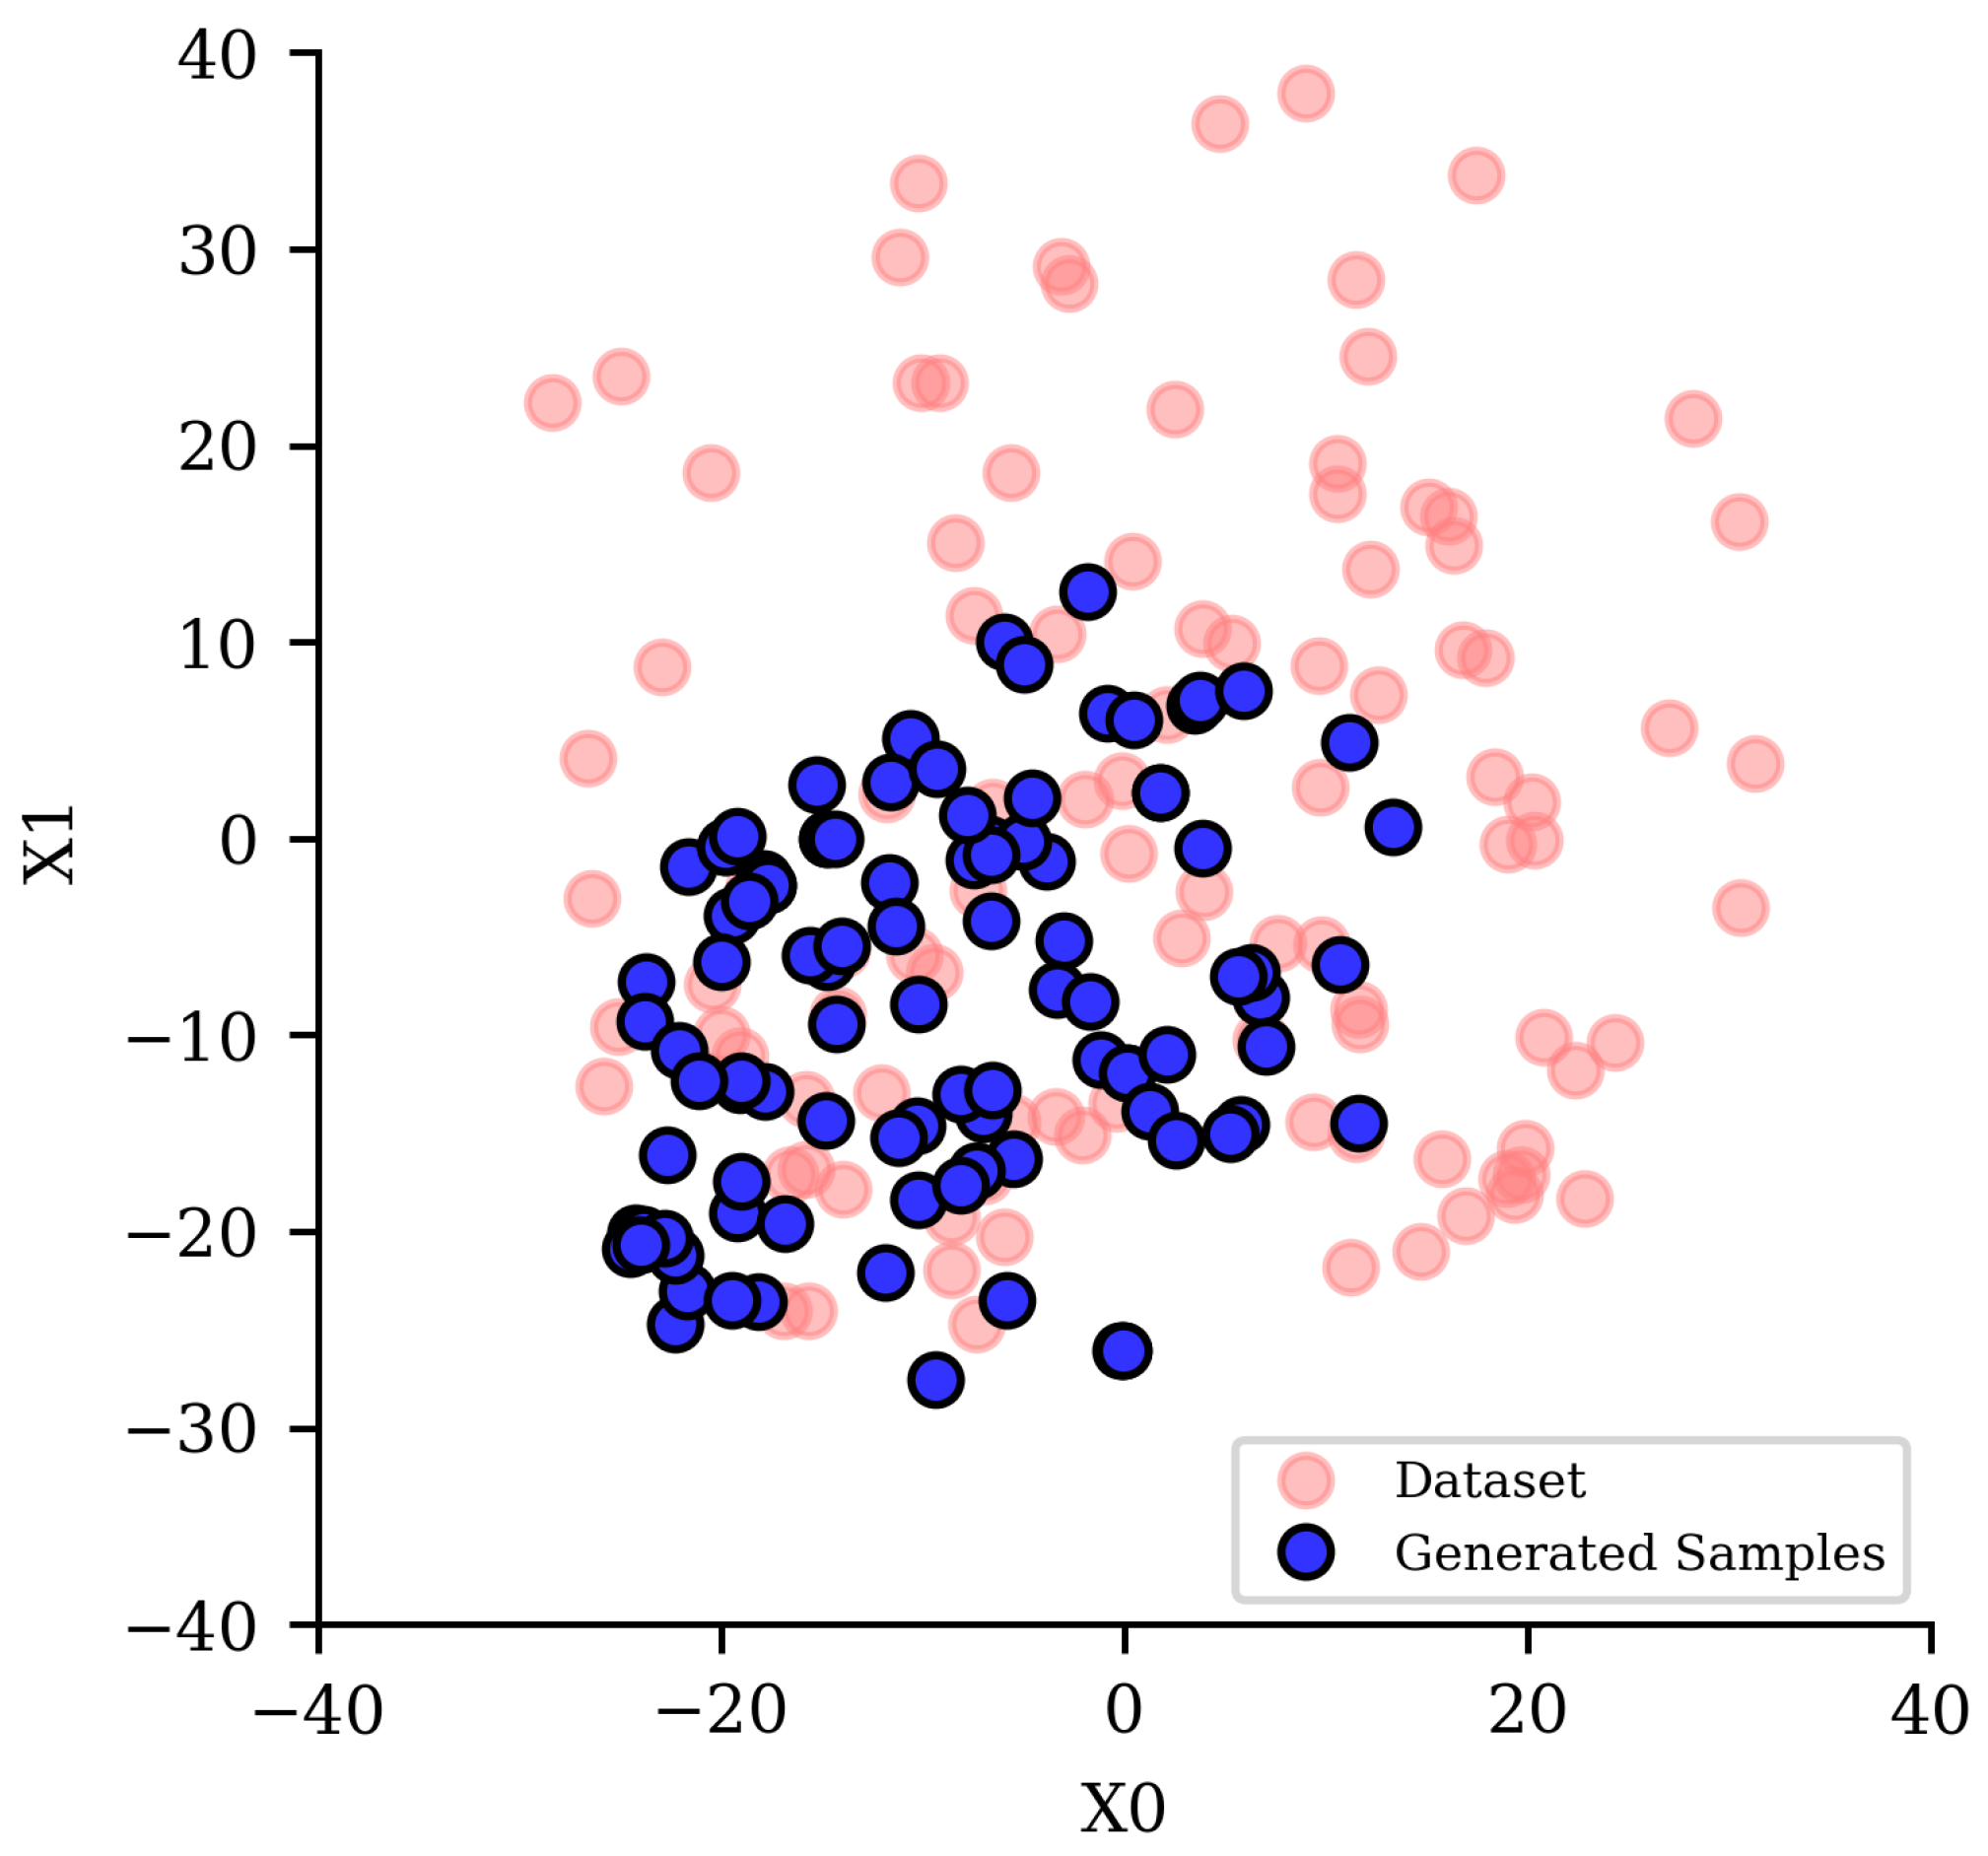
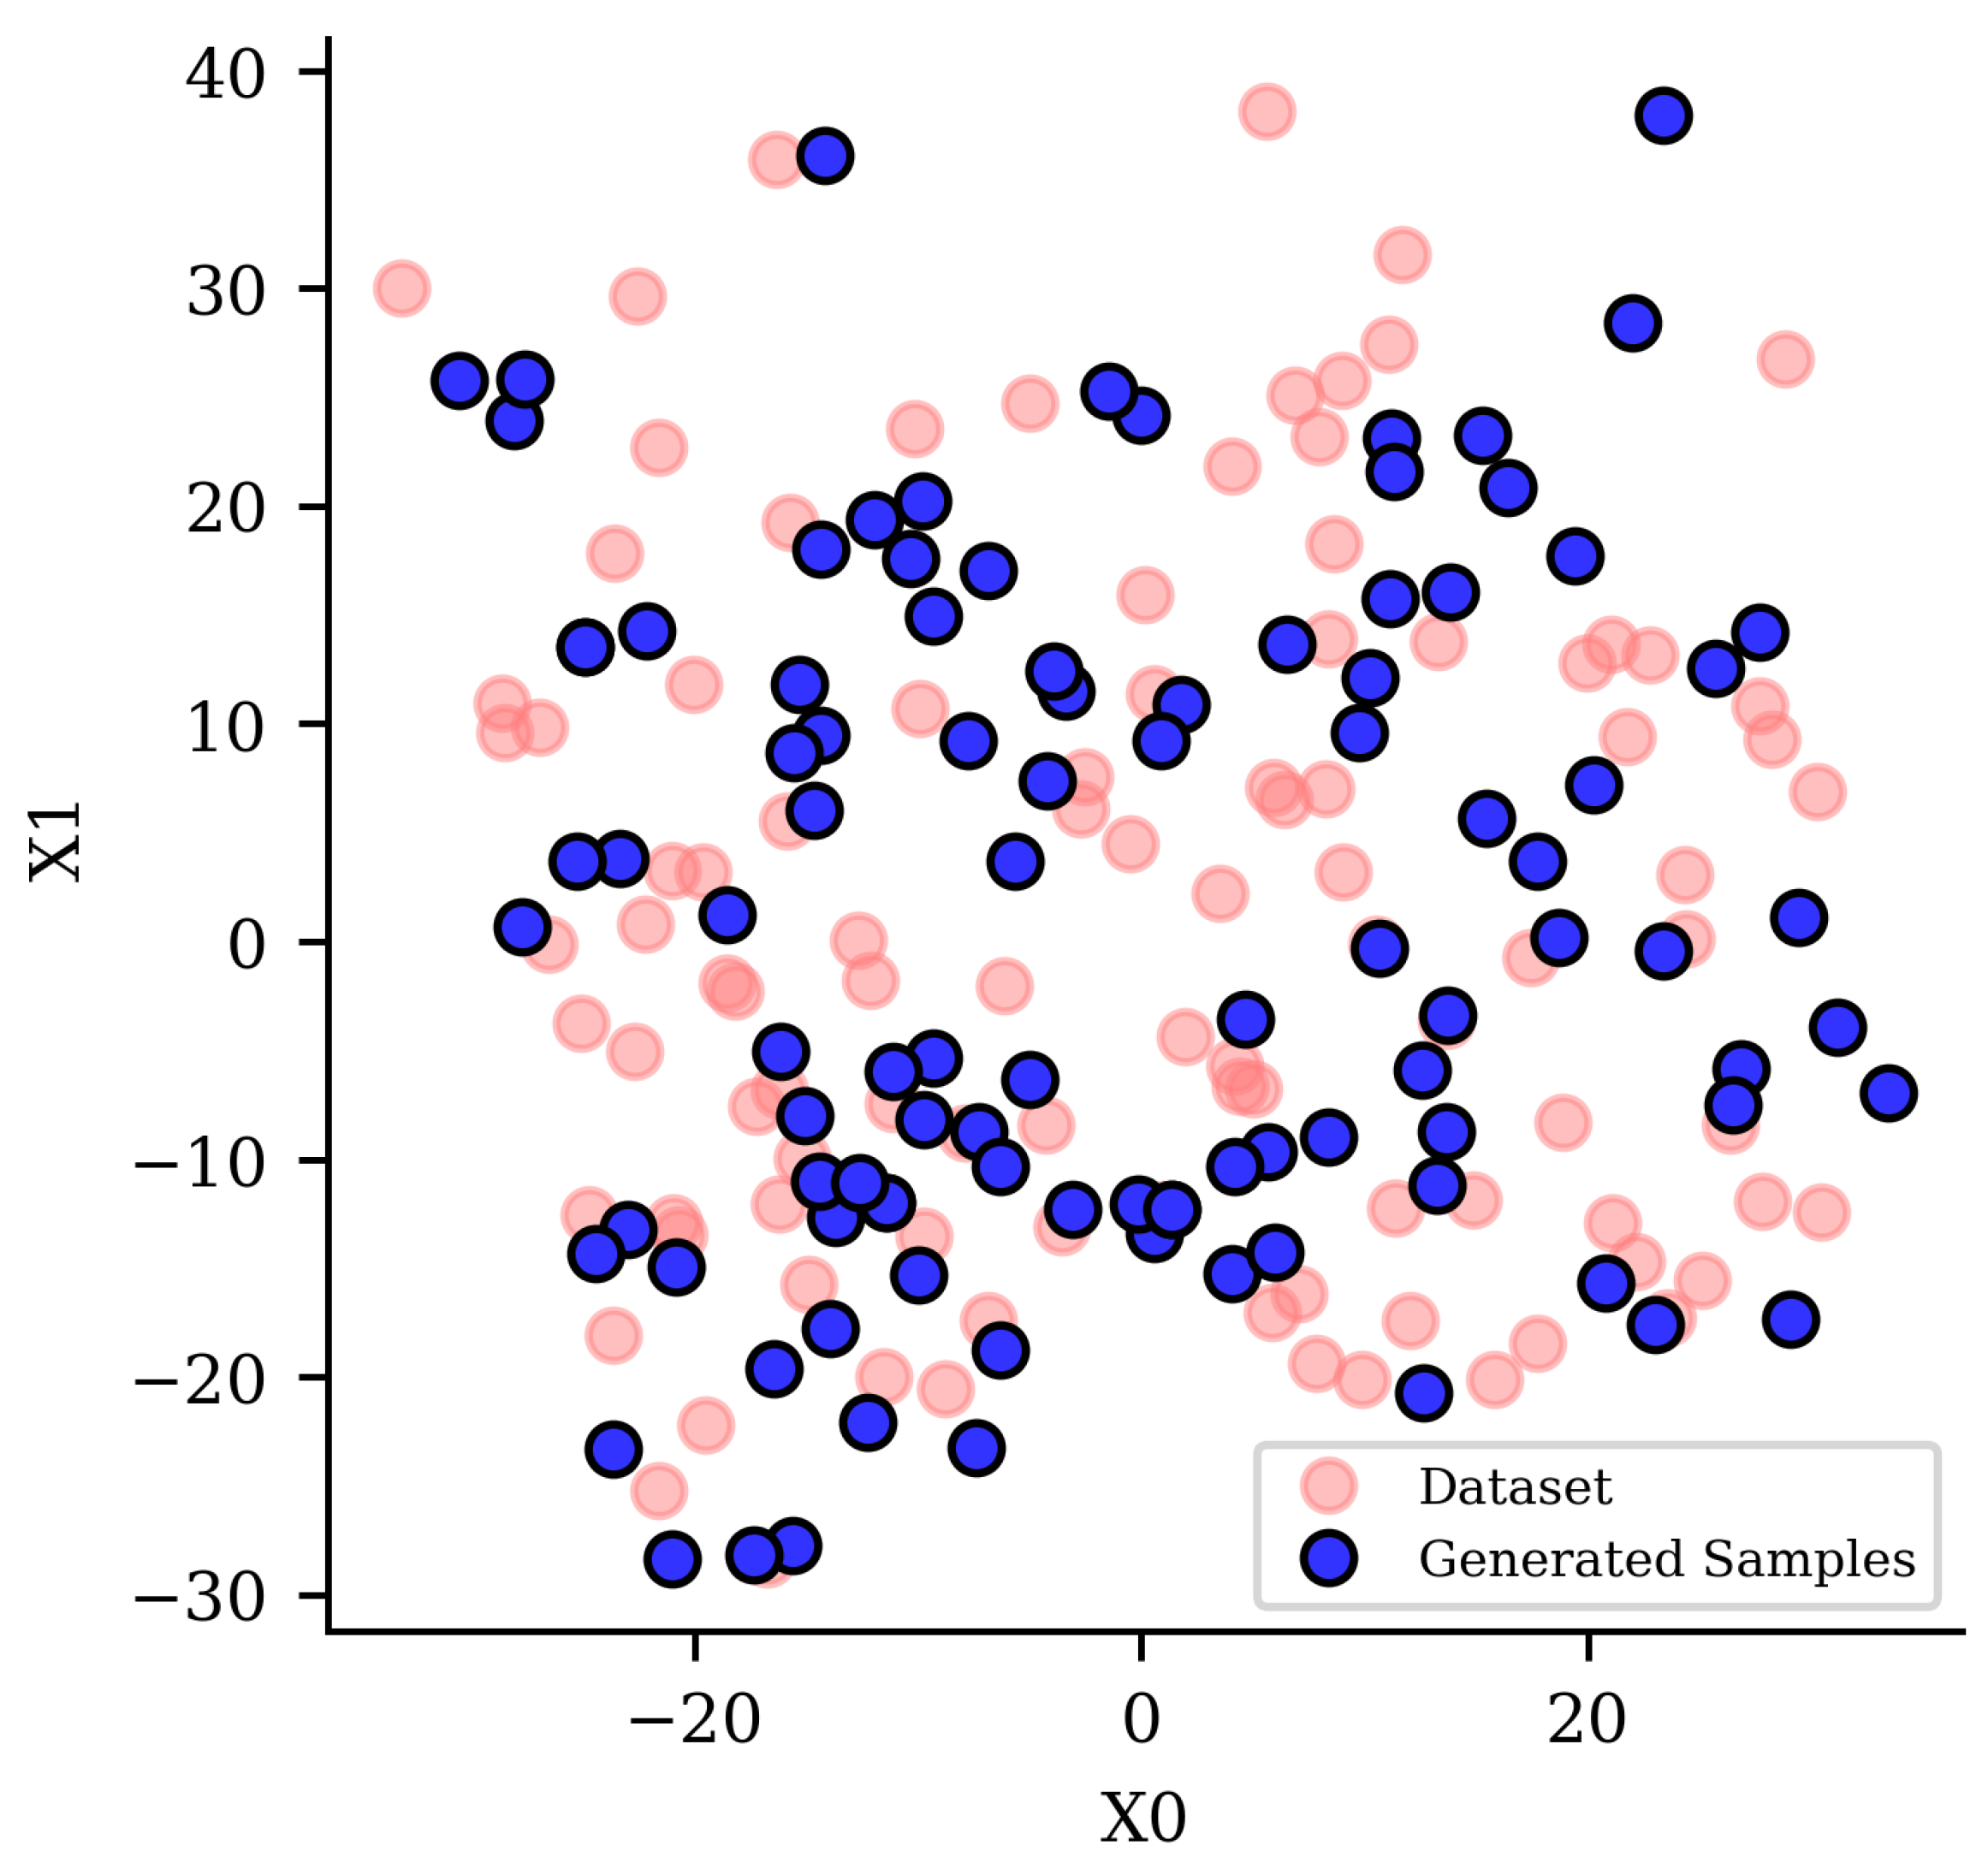
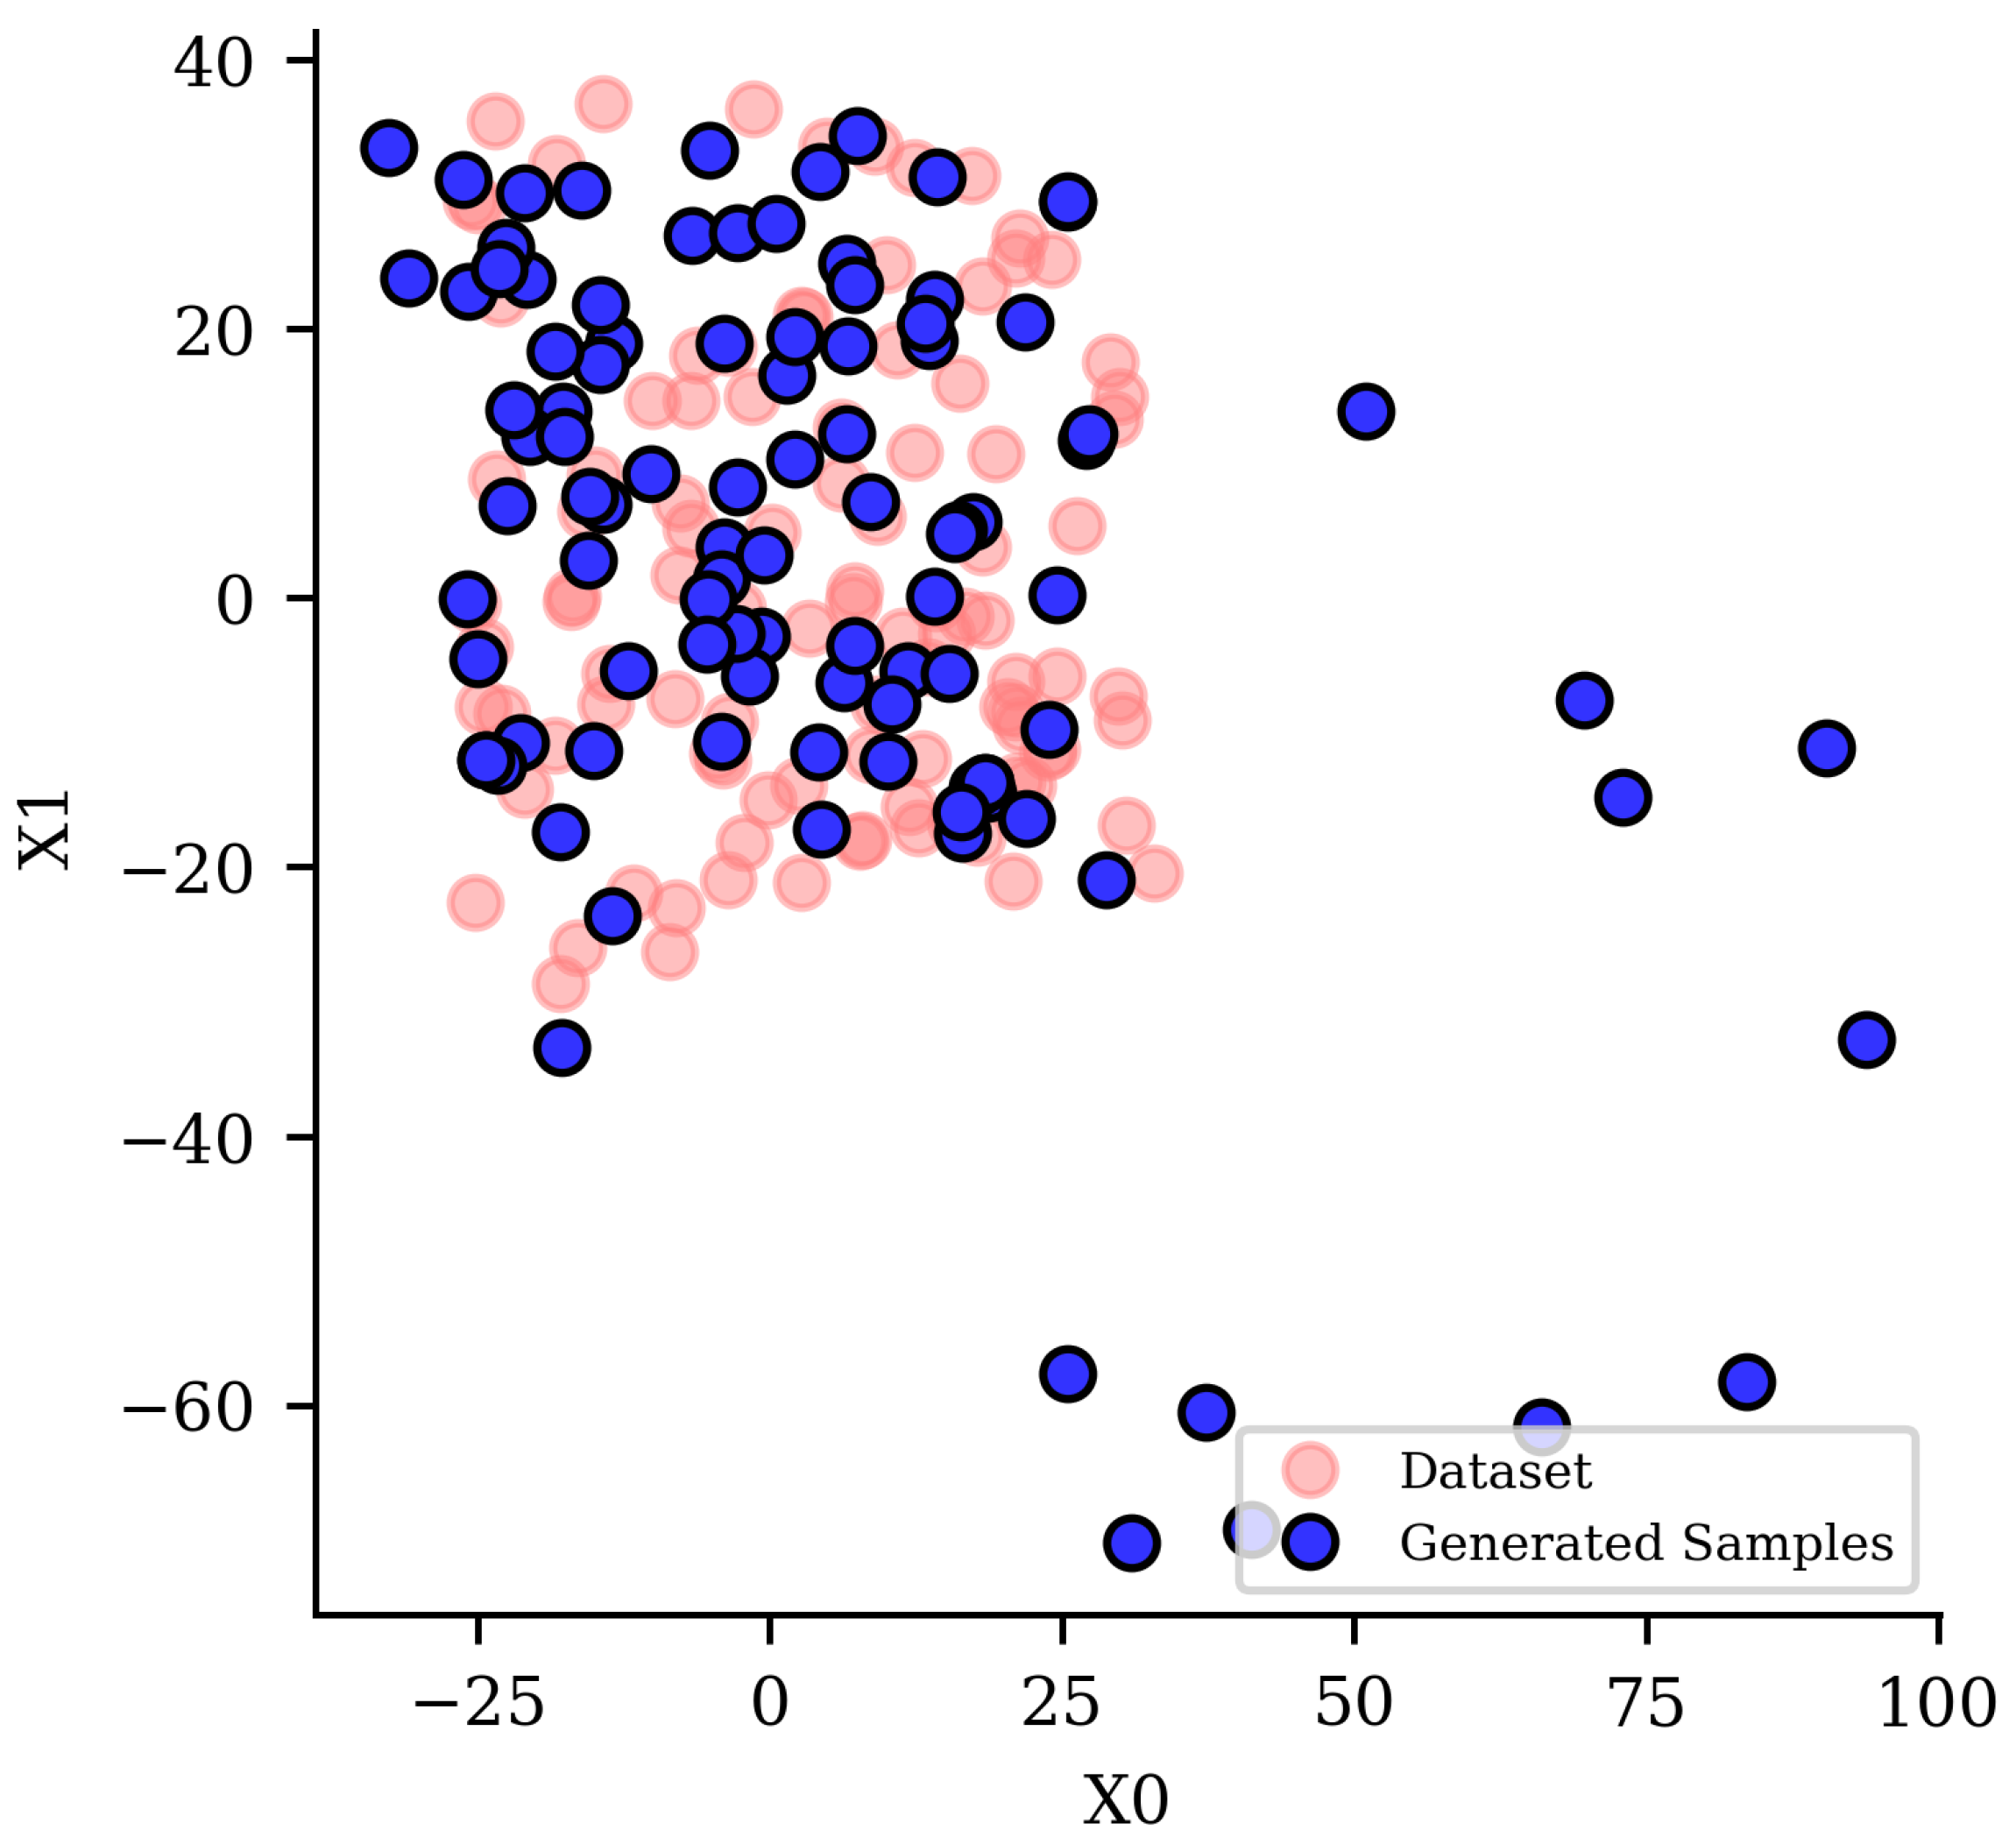
3.2. Dataset Coverage and Generated Sample Evaluation

In order to characterize DDPMs’ ability to cover the total parametric dataset space and generate feasible designs, two measures are utilized throughout the remainder of the paper. To visually characterize how a set of generated hull designs covers the dataset space of the Ship-D hulls, a two-dimensional principal component analysis is trained with the Ship-D parametric design vectors. When evaluating the designs generated with DDPMs, the PCA of the generated samples is plotted against the PCA of a random selection of the Ship-D dataset hulls. This shows the relative spread of the generated designs compared to the dataset hulls. In addition to visualization, coverage and realism quantify a model’s ability to generate samples similar to the training dataset.
  • Coverage is quantified as the mean Chamfer distance of each dataset instance from its nearest neighbor among the generated samples;
  • Realism, on the other hand, measures the mean Chamfer distance of each generated sample instance from its closest match within the dataset [49].
Chamfer distance is the Euclidean distance between two hull design vectors. For two sets of parameterized hull designs, A and B, the Chamfer distance determines the distance from a design vector in A to its nearest neighbor in B. The distance metric used is the squared Euclidean distance between the two vectors. The formula for this evaluation metric is as follows:
C D = A n B n * 2
where B n * is the nearest neighbor of the design vector A n in B. Chamfer distance is normalized for coverage and realism using the following equation:
C D * = 1 N A n = 1 N A C D n C D worst - case C D best - case C D worst - case
where N A is the number of points in set A, and C D * is a normalized Chamfer distance, being coverage or realism. As a baseline, coverage is linearly normalized between the best- and worst-case scenarios derived from an analysis of the dataset. The best-case coverage is the mean nearest neighbor distance of each hull in the dataset (100% coverage), which was equal to 4.315. The worst-case coverage is the mean Chamfer distance between the centroid of the dataset hulls and each hull in the dataset, (0% coverage), which was equal to 26.930. Realism was also linearly normalized to be between the minimum and maximum Chamfer distance between the dataset hulls and their nearest neighbor.
To benchmark the DDPMs’ ability to generate feasible samples, two studies on the feasibility of hulls generated by interpolating between hull design vectors were conducted. The first study generated sample hulls by finding the midpoint between two random hull design vectors from the Ship-D dataset. The second study generated sample hulls by finding the midpoint between a random hull and its nearest neighbor in the Ship-D dataset. The results of these studies are provided in Section 4.
An additional benchmark study was conducted using a tabular generative adversarial network called CTGAN [50]. The CTGAN was trained to generate feasible hull designs, only gathering information from the 30,000 feasible hull designs in the Ship-D dataset. The goal of this benchmark study was to compare the ability of the CTGAN and the DDPM to generate feasible hulls and cover the dataset without explicitly identifying feasible or infeasible hull designs for the model. In training, the CTGAN learned the parametric information encoded in the design vectors and generated samples to match the distribution of the dataset samples. The results of this study are included in Table 1 and Table 2.
When leveraging classifier guidance using a DDPM to generate feasible samples, the dataset coverage is greatly affected by the same hyperparameter that influences the feasibility of the generated samples.

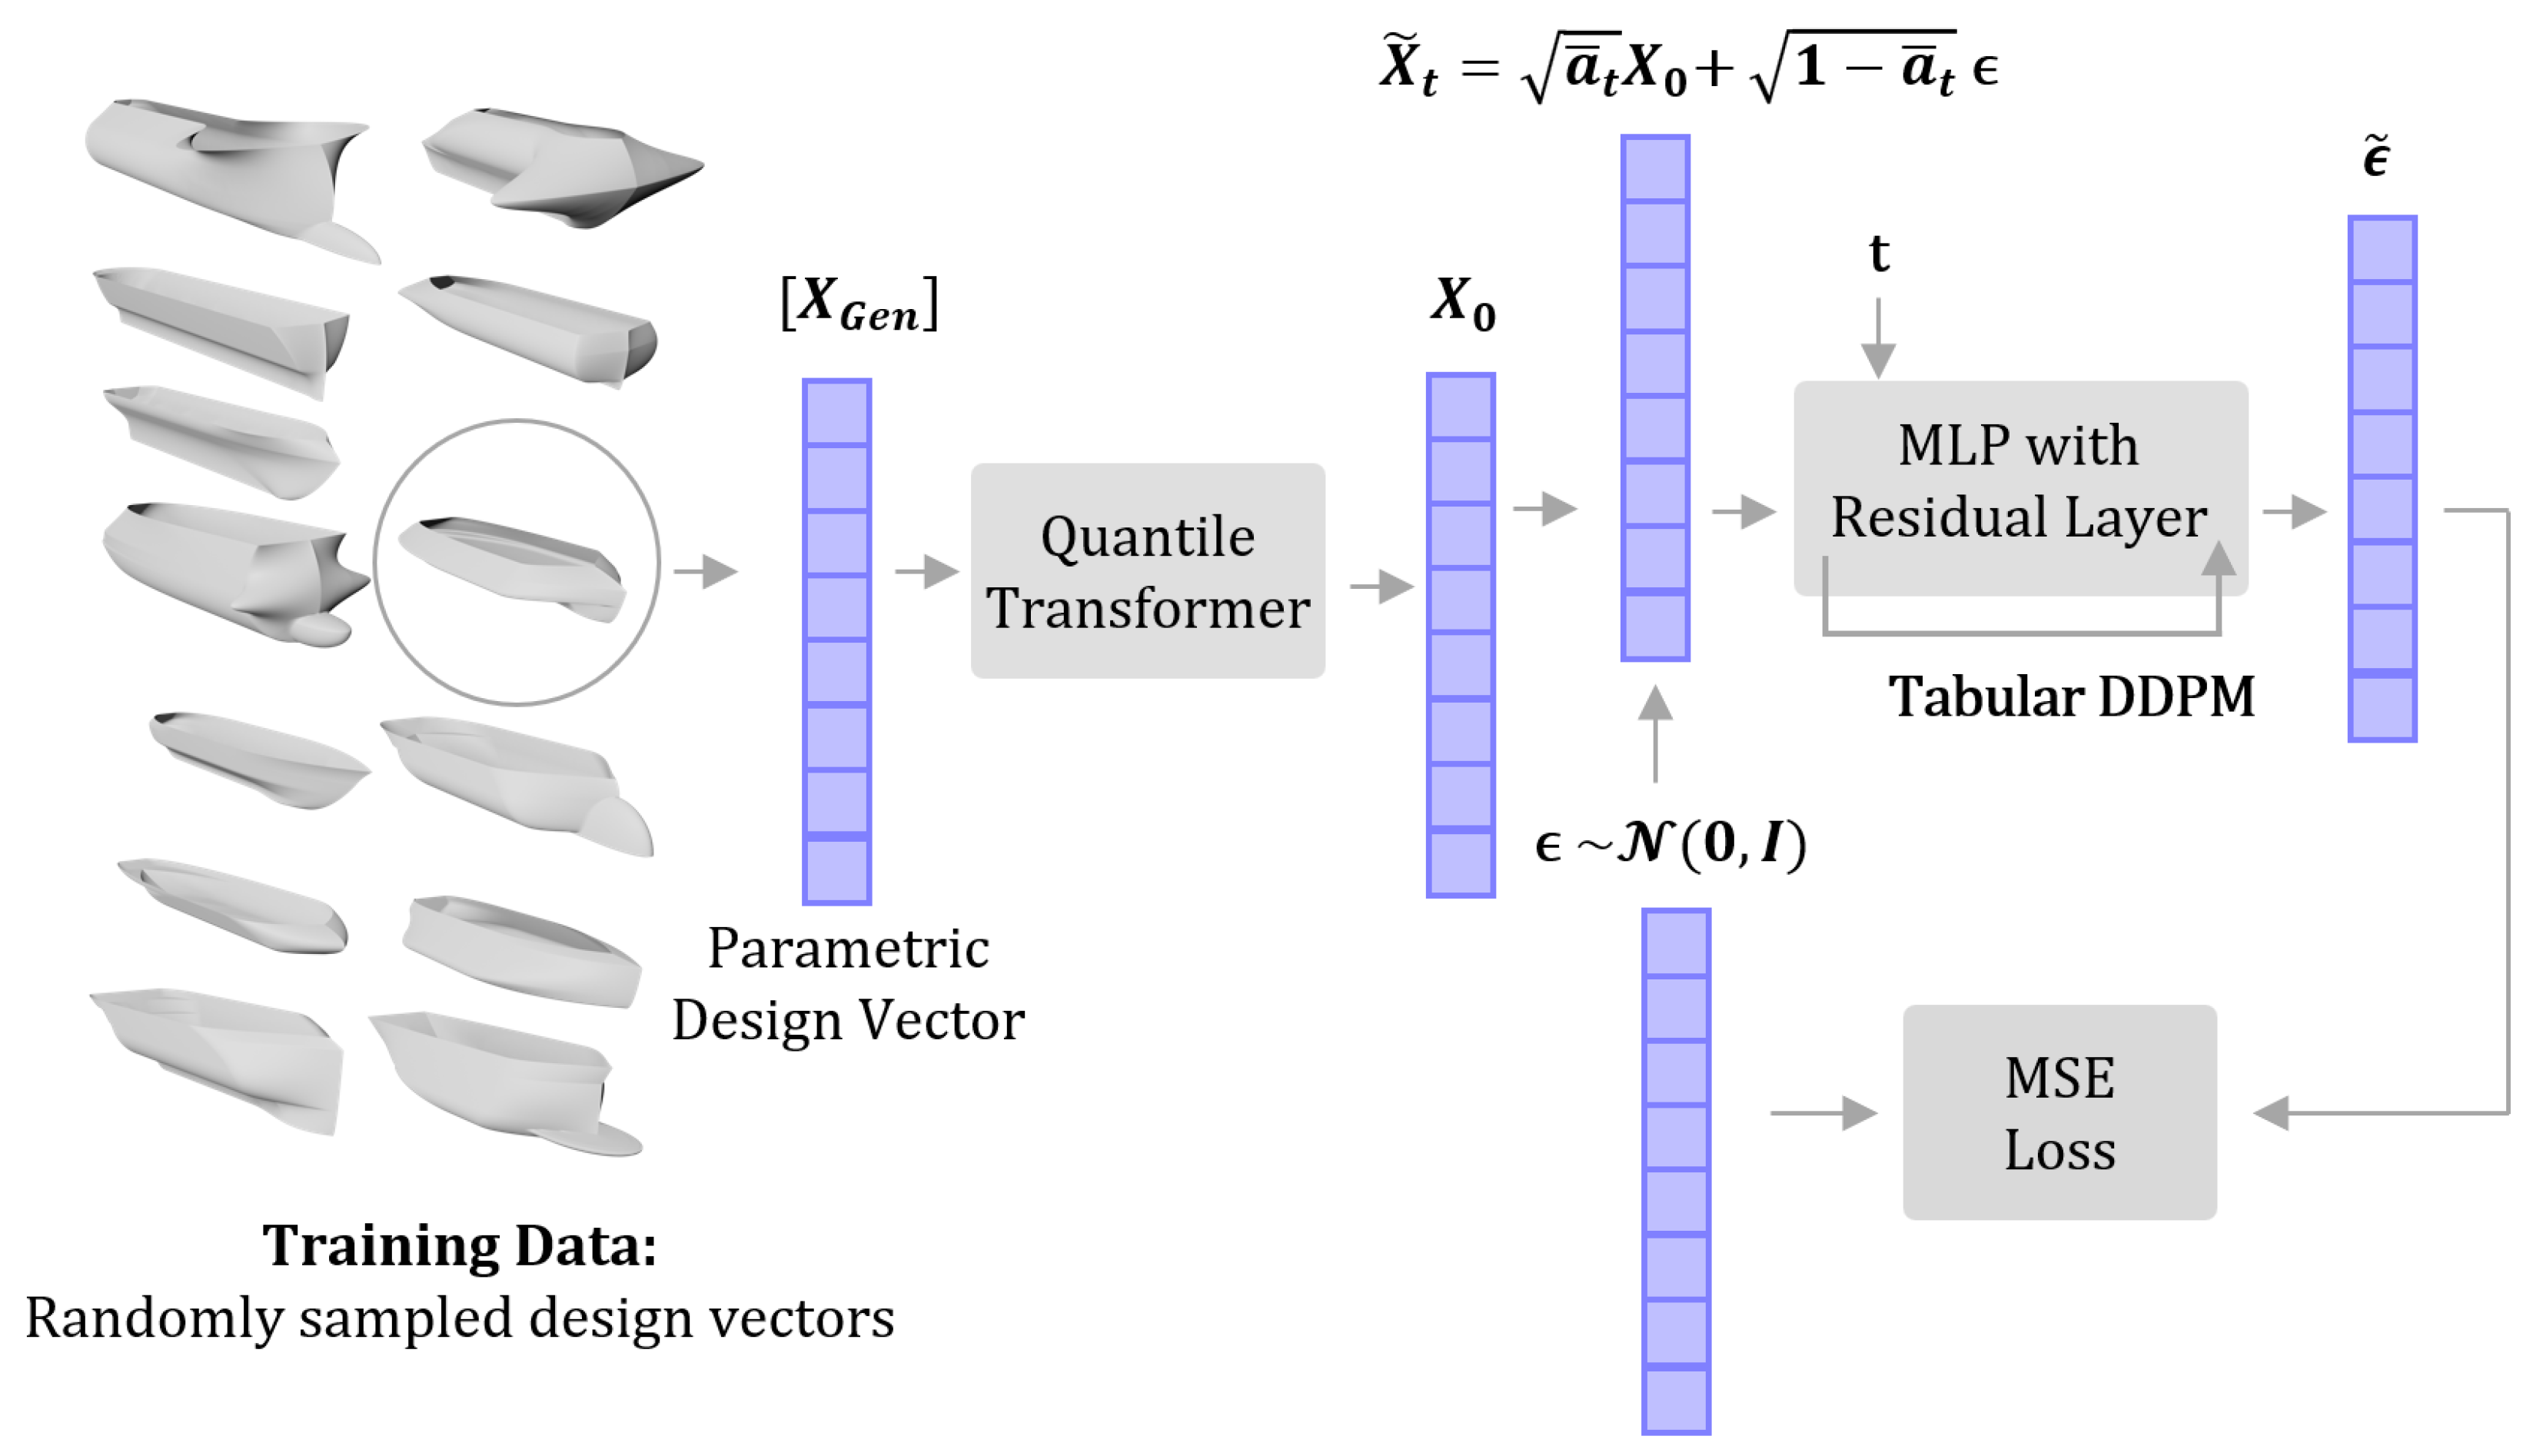
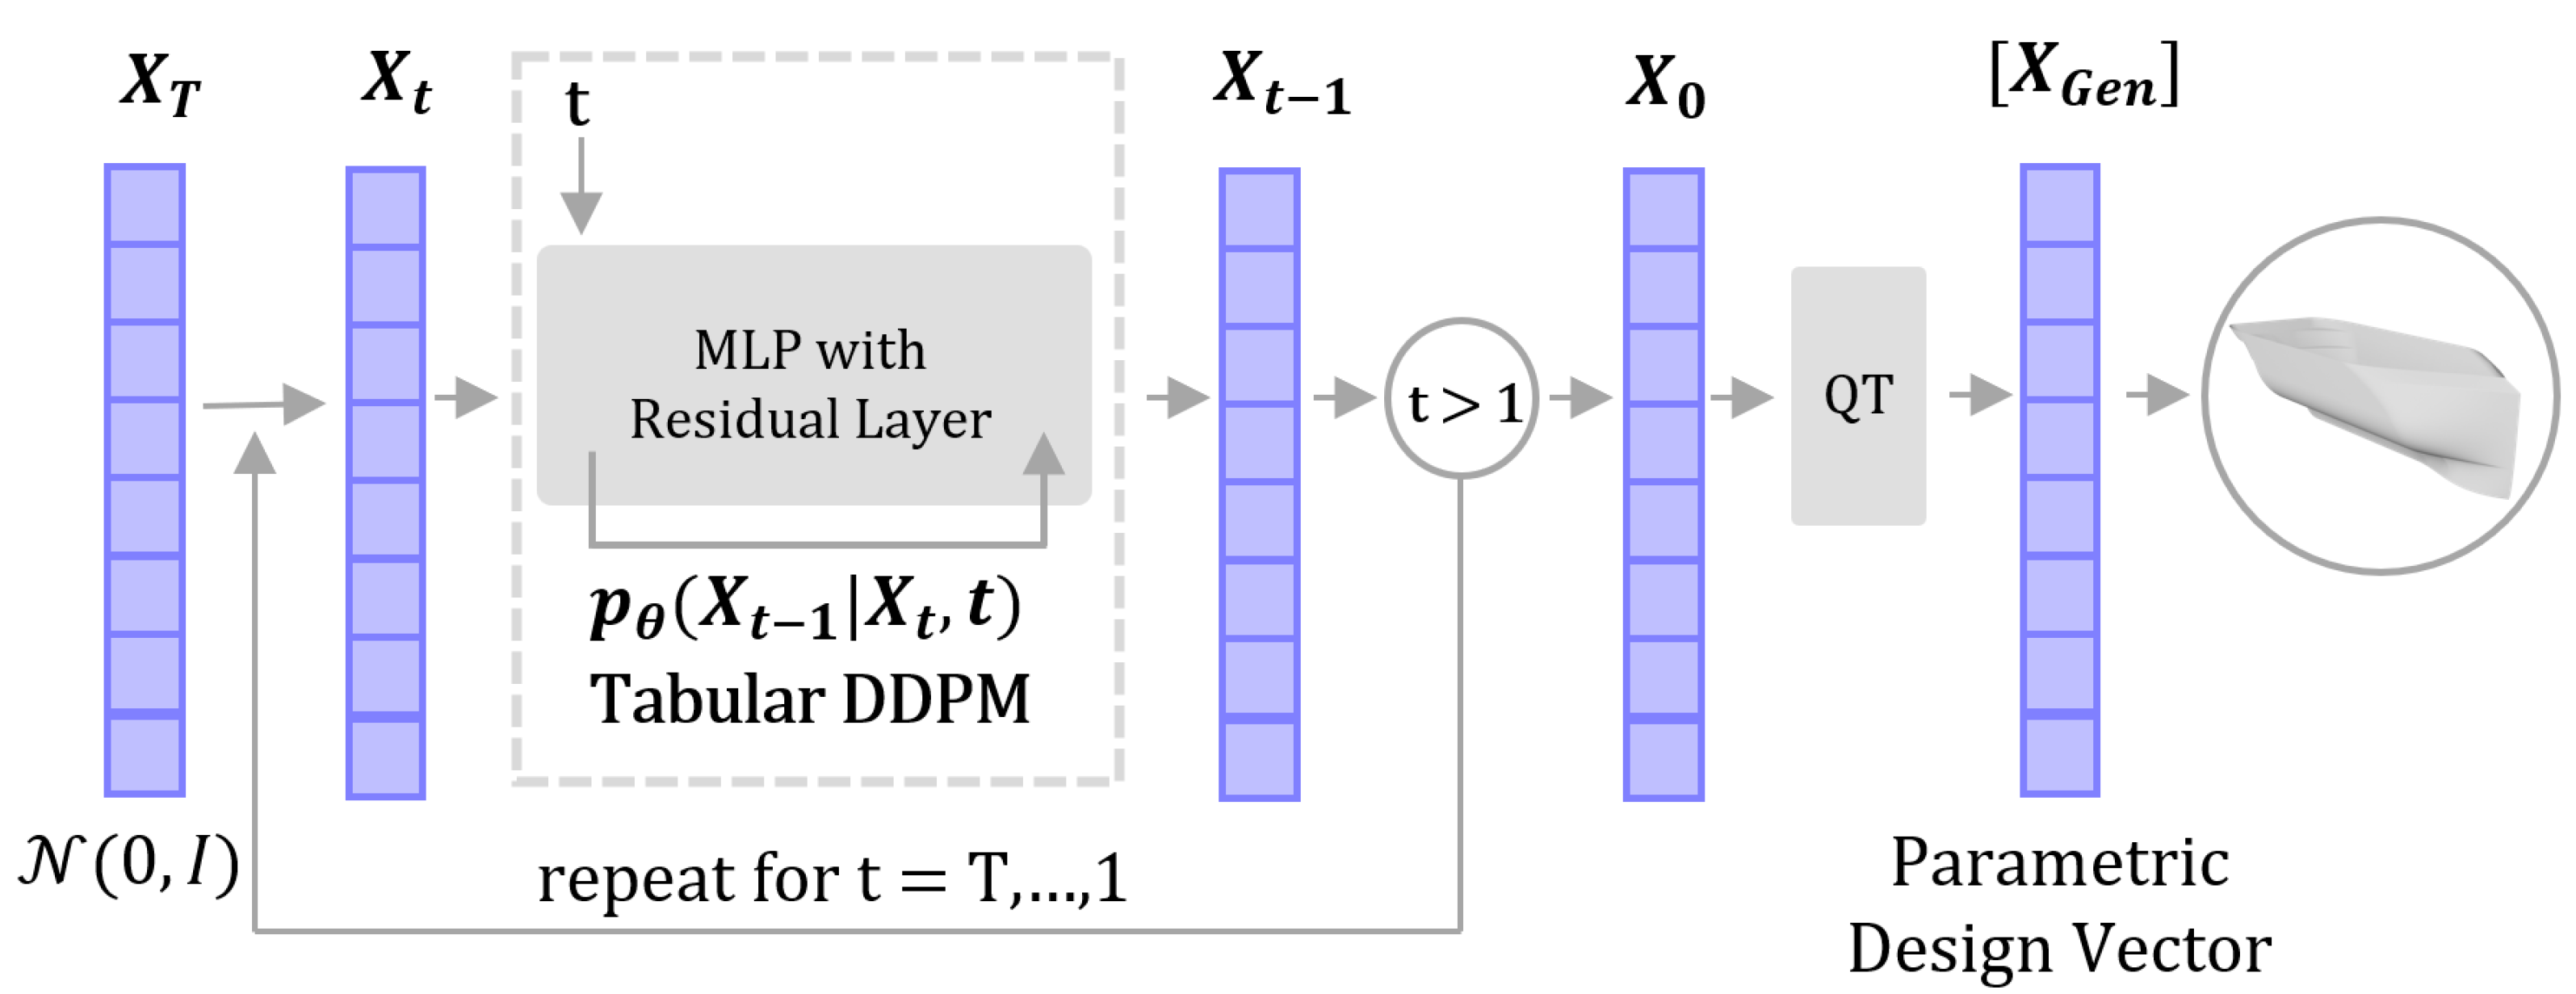
3.3. Denoising Diffusion Probabilistic Models

A denoising diffusion probabilistic model (DDPM) is a generative AI model that generates new instances of data by denoising random information over many steps, so that the generated sample falls within the statistical distribution of the training dataset samples. A tabular DDPM was built and trained on the ship hull parametric design information from the Ship-D dataset. The DDPM used to create ShipGen was inspired by the work of Kotelnikov et.al, called TabDDPM [51]. Unlike popular image-focused diffusion models, this DDPM is trained on tabular information to generate tabular information. Prior to training, the parametric design vectors were transformed using a quantile normalizer to rescale the distribution of the design parameters to have a normal distribution with the same mean and variance as the parameters in the dataset. A second linear transformation rescaled the bounds so that the range of each parameter was between 1 and 1. These transformations ensured that the parametric design data were fit for the tabular DDPM. Training this model provided a baseline to verify that the tabular DDPM produced ship hulls with parametric information within the relative distribution of the Ship-D dataset. Section 4 provides the results of both the parameter distribution and feasibility constraint satisfaction of these generated samples.

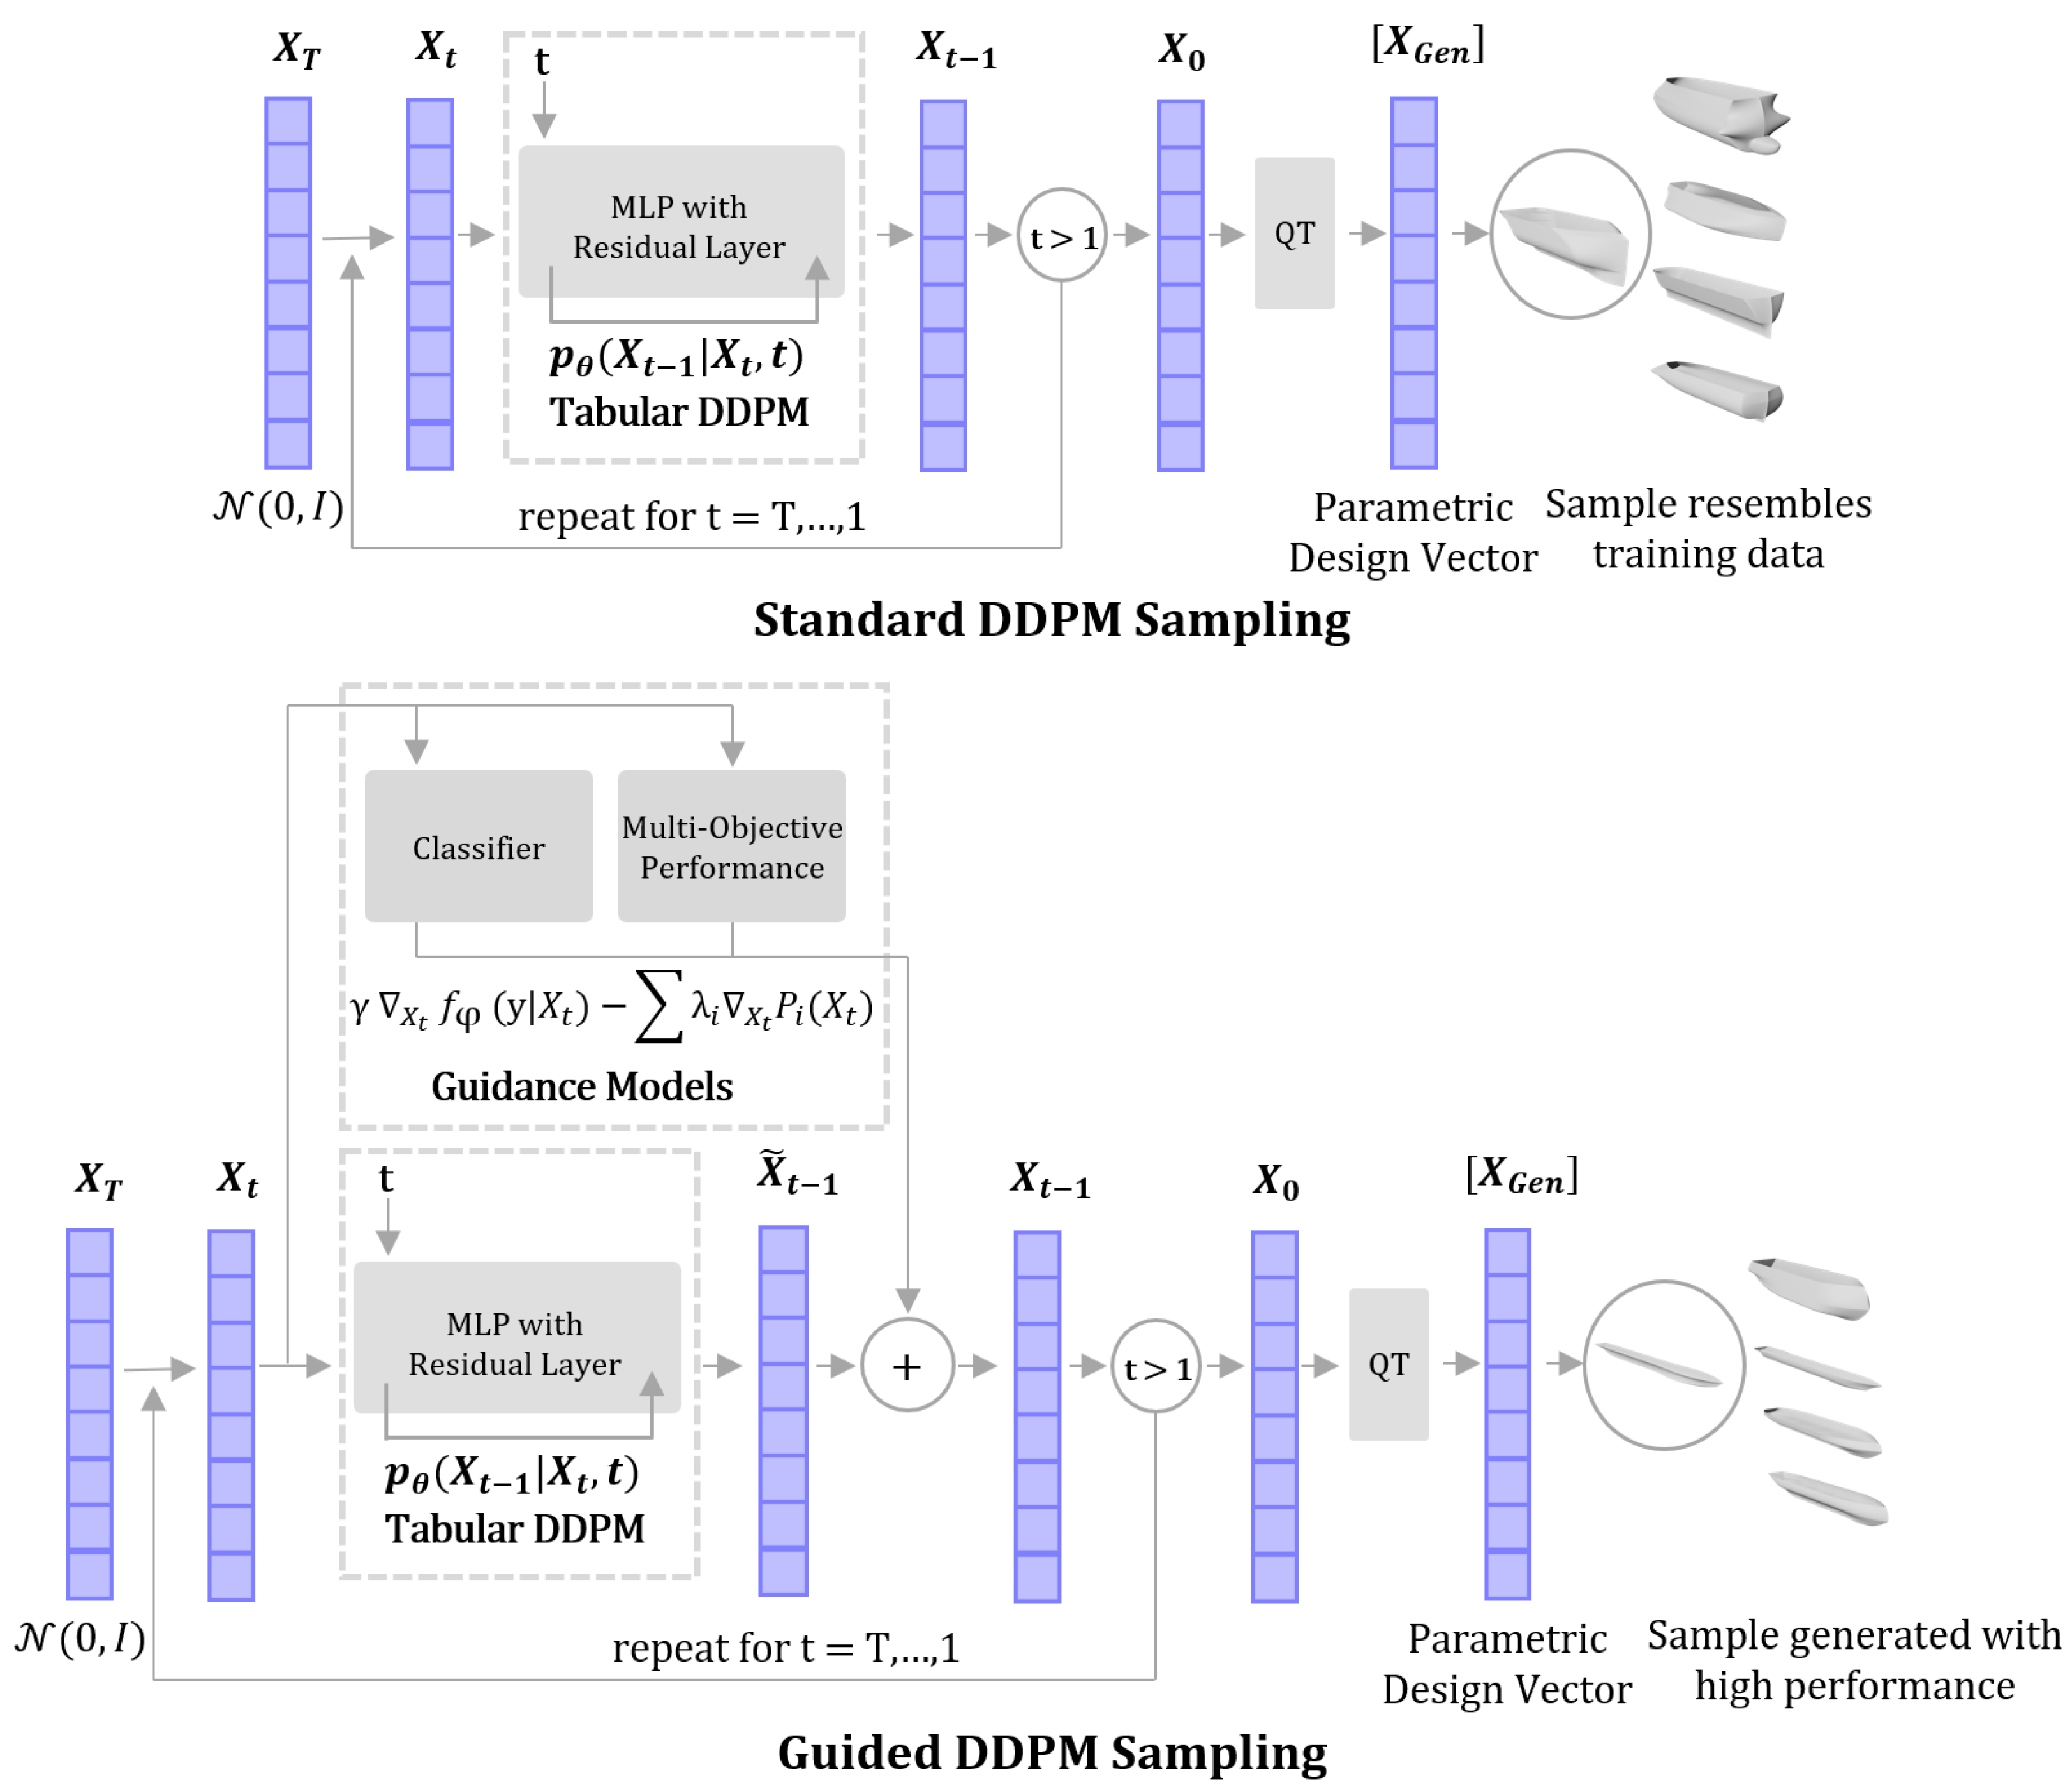
3.3.1. Standard Diffusion Model

The standard DDPM follows the training and sampling algorithms defined in Algorithms 1 and 2. The standard DDPM implicitly learns the statistical relationships between the parameters in each sample. In the sampling process, the trained DDPM generates samples that are statistically similar to the designs in the dataset. There is no extra consideration for design feasibility or design performance. Since the Ship-D dataset comprises randomly sampled hulls that meet the feasibility criteria, any increase in the DDPMs ability to produce feasible hulls compared to pure random sampling is due to the DDPM implicitly learning the relationships between the design parameters that lead to feasible hull designs.
During training, a feasible design vector was quantile normalized and partially noised according to the training algorithm in Algorithm 1. Then the DDPM predicted a noised vector given the timestep embedding and the partially noised vector. The mean squared difference between the predicted noise vector and a pure noise vector was the loss of this prediction. The mean squared loss then back-propagated through the DDPM to update its weights and biases. This process was repeated for the 30,000 feasible design vectors across one thousand denoising timesteps in random batches to train the DDPM. Figure 3 illustrates the training process for one design vector at one timestep.
After training, the standard DDPM could sample new design vectors. The initial seed for sampling was a Gaussian noise vector of size N, where N is the number of design parameters. The DDPM denoised this vector one thousand times, taking into account the timestep embedding at each iteration. After the denoising process, the final denoised vector was reverse-quantile normalized, so that it became a design vector fitting the Ship-D parametric design scheme. This generated design vector could then be checked for feasibility constraint satisfaction. If the design was feasible, a point cloud and mesh of the hull was generated to evaluate the sample’s performance. Figure 4 illustrates the sampling process for a single design vector.

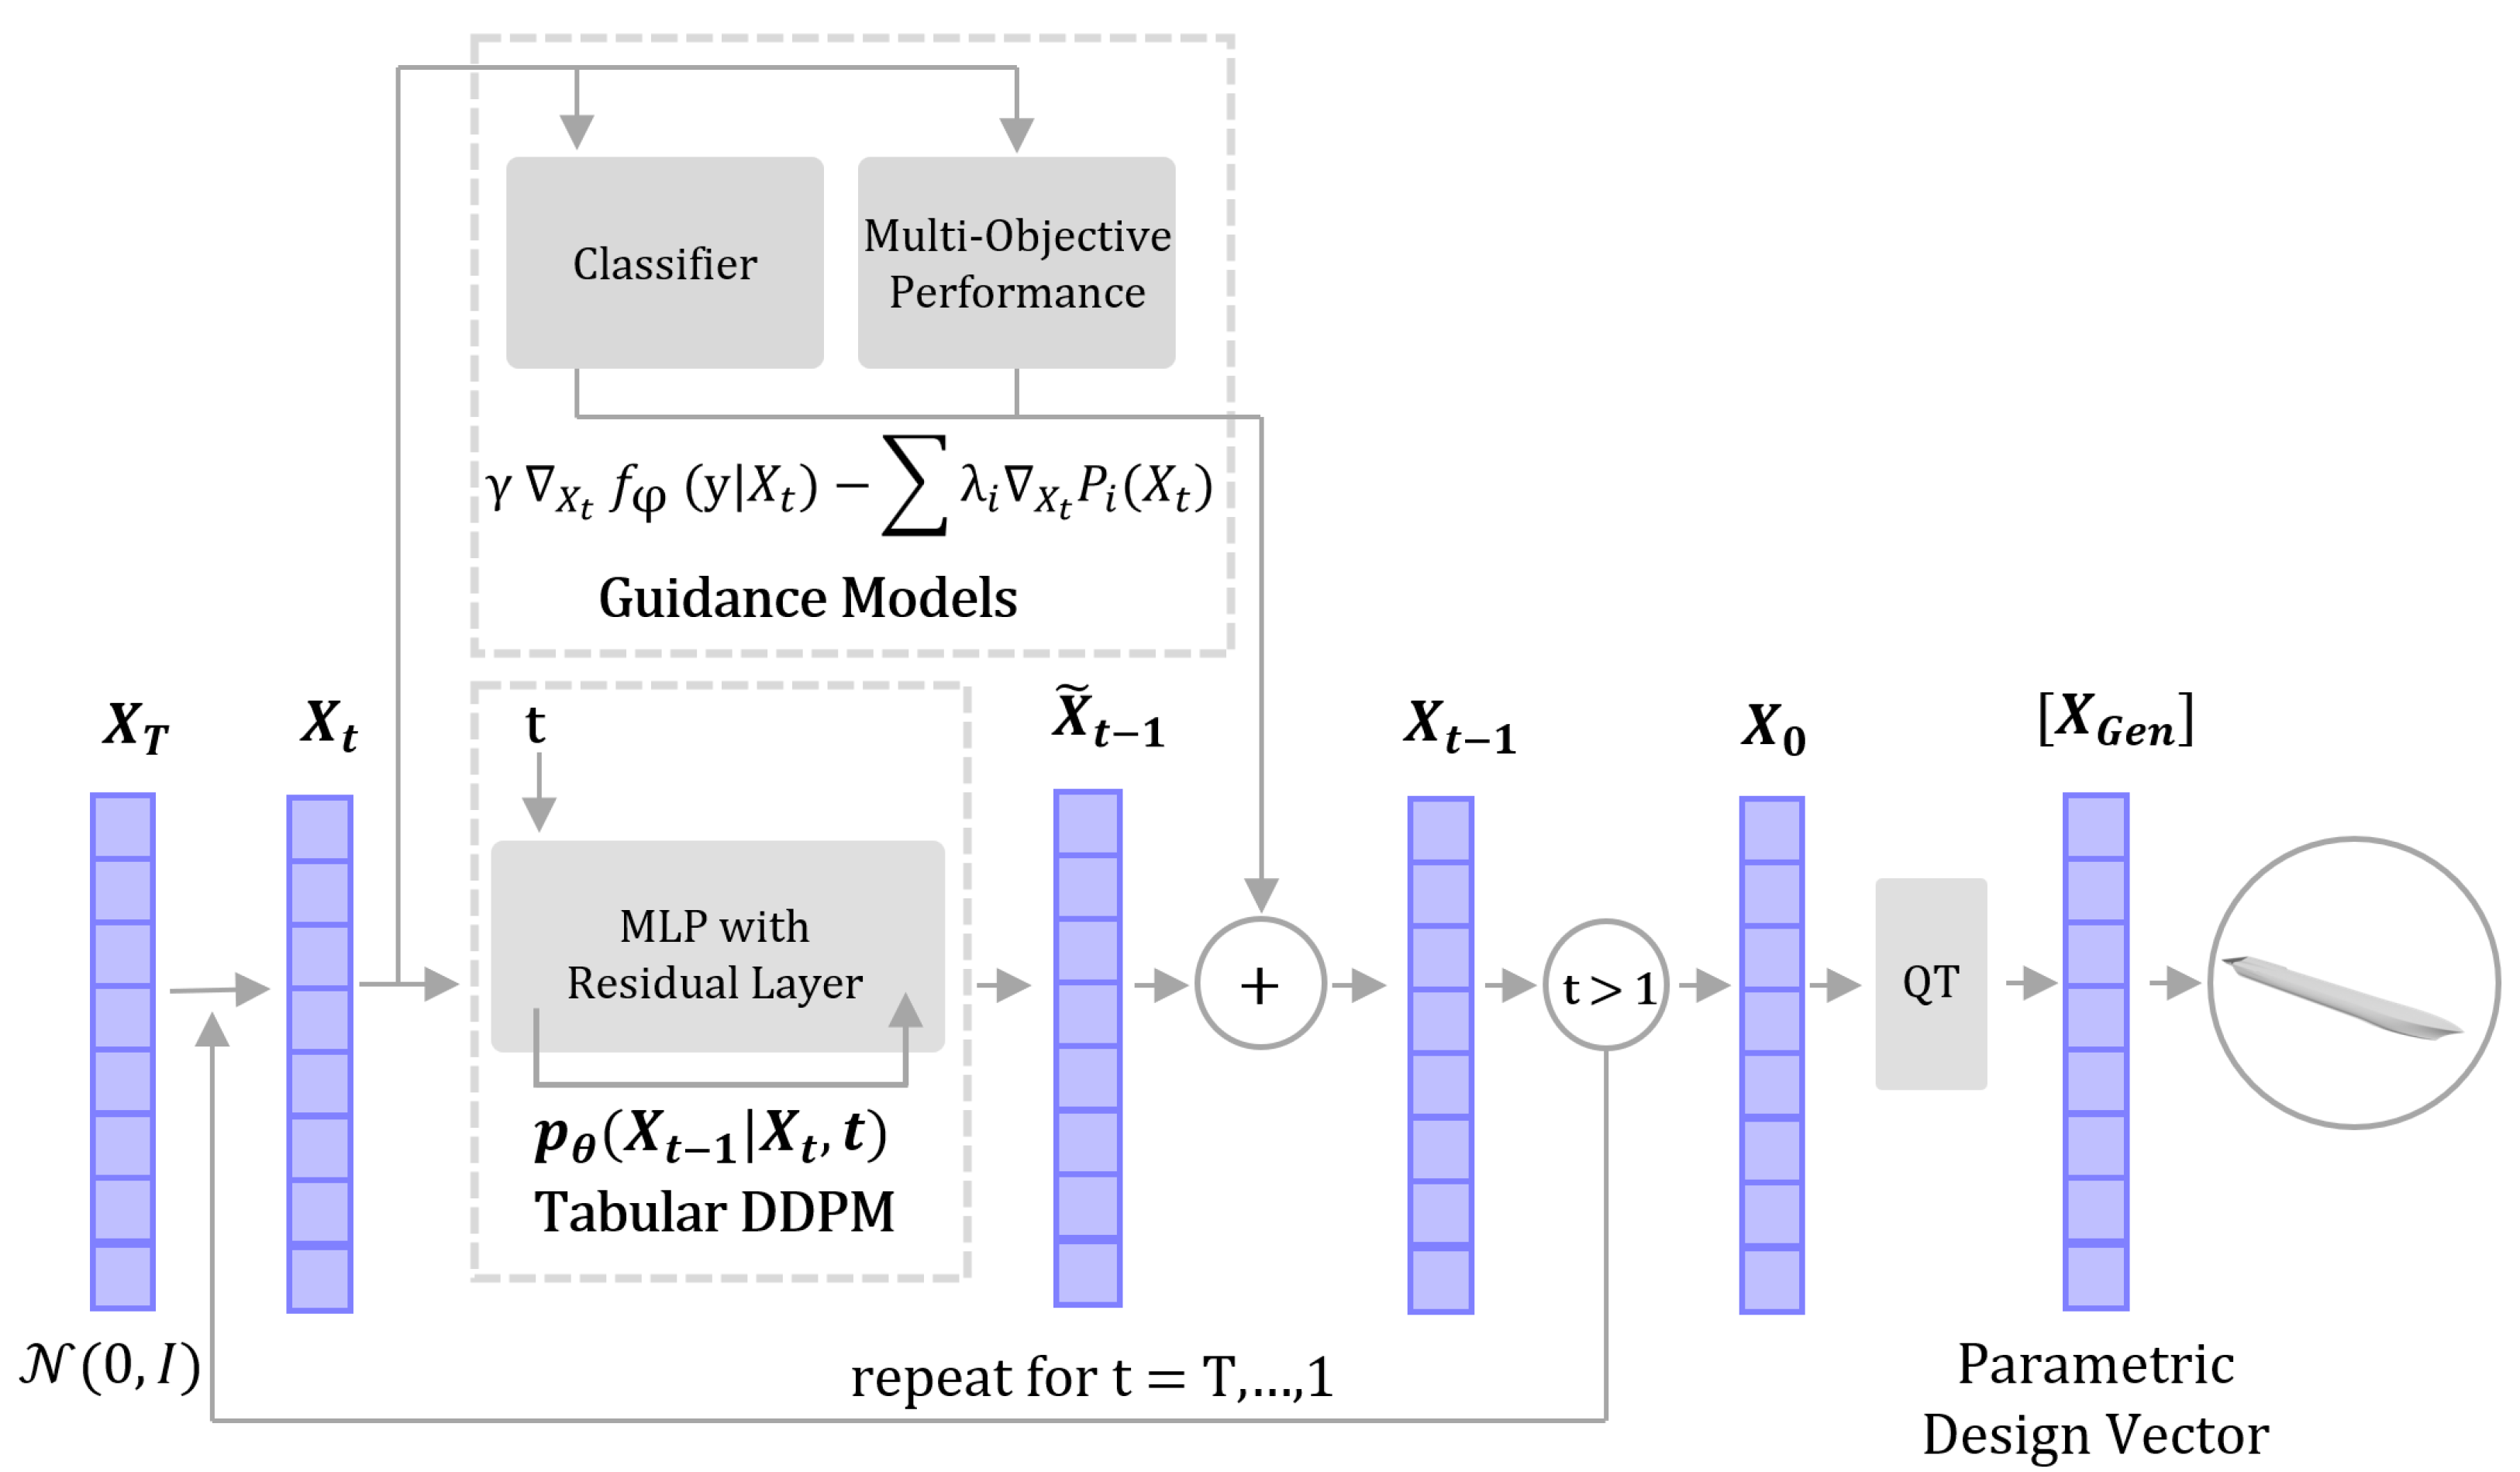
3.3.2. Classifier Guidance for Diffusion Models

An additional method of influencing sample generation towards feasibility constraint satisfaction is using classifier guidance [36]. Classifier guidance leverages the gradients of a trained design classifier during the standard DDPM’s sampling process to influence a design to meet a certain classifier label. In this case, the classifier label characterizes whether a design is feasible or infeasible. Here, the 30,000 Ship-D design vectors and the 20,000 infeasible design vectors trained a classifier to predict design feasibility. At each timestep in the sampling process, the gradient of the trained classifier for a target class, f ϕ ( y | X t ) , with respect to the parameterized design vector, X t , was calculated. This gradient was multiplied by a hyperparameter, γ , and was added to the sample during Step 4 of the DDPM sampling algorithm defined in Algorithm 2. A classifier-guided DDPM was created by replacing Step 4 with Equation (14).
X t 1 = 1 α t X t 1 α t 1 α ¯ t ϵ θ ( X t , t ) + σ t ( Z ( 1 γ ) ) + γ X t f ϕ ( y | X t )
Section 4 provides data from tuning γ , as it will be shown that this hyperparameter has an effect on both the likelihood of producing feasible hull design vectors and on the distribution of these vectors relative to the Ship-D dataset. Without the need to additionally train the standard DDPM itself, adding guidance gradients in the sampling process can be accomplished easily. Figure 5 and Figure 6 illustrate the classifier guidance used in conjunction with performance guidance to generate parameterized hull designs with high performance. Section 3.3.3 details the addition of more guidance models to generate hulls while considering the hull’s performance.

3.3.3. Performance Guidance for Diffusion Models

Similar to classifier guidance, a neural network trained to predict the performance of a hull can also be used to guide sample generation. Seven residual neural networks were trained to predict the normalized performance of a hull given its parametric design vector. The 30,000 feasible hull designs in the ShipD dataset were used for the training data. The performance prediction neural networks all had the same structure: four hidden layers with 256 nodes, where the first hidden layer was added as a residual to the final hidden layer. The normalization of the performance metrics distributed them over a Gaussian, improving the prediction accuracy of the neural network.
During sampling, the gradients of the normalized performance prediction from the neural networks were used to guide the DDPM’s sampling process. The performance gradient of each of the objectives, X t P i ( X t ) , was multiplied by a weight, λ i . While generating samples, the weights of the λ values for each performance objective were normalized so that they were positive and summed to 1.0 for each sample. In this way, a broad spectrum of samples was generated with unique combinations of weighted influences from the seven performance objectives. Performance guidance was achieved by replacing Step 4 in the DDPM sampling algorithm with Equation (15).
X t 1 = 1 α t X t 1 α t 1 α ¯ t ϵ θ ( X t , t ) + σ t ( Z ( 1 γ ) ) + γ X t f ϕ ( y | X t ) i = 1 7 λ i X t P i ( X t )
During sampling, the gradients of both the classifier and performance prediction models were calculated at each timestep. Weighting these gradients with γ and λ influenced the impact each individual model had on the sampling process. The classifier guidance weight, γ , was set to 0.5, so that both a high degree of sample diversity and sample feasibility were maintained. Figure 5 shows how guidance from the classifier and performance prediction models was implemented into the denoising process. The fit of these performance regression networks is measured with R 2 in Table 3.
Figure 6 highlights the contributions of both the feasibility classifier and the performance prediction neural networks to the guidance. For performance guidance, the gradients of the seven performance prediction networks were calculated for each sampling timestep for X t . Then, the gradients were weighted by their respective λ value. The sum of the weighted gradients was subtracted from the output of the standard DDPM to create the next partially denoised vector, X t 1 , in the sampling process. The gradients were subtracted to follow the scheme of “minimizing” the performance objectives in the generated samples.
After sampling, the generated design vectors were checked for feasibility. The performance of the feasible generated hulls was then calculated using the same simulations used to create the original dataset. Table 4 showcases the mean normalized performance between the dataset hulls and the generated hulls, as well as the scale factor between the true performance of the two sets of hulls.

4. Results

This section contains the results of the studies described in the Section 3. Section 4.1 provides the results of the feasibility and design spread of the parameterized hulls generated with interpolation between the existing hulls in the Ship-D dataset. Section 4.2 gives the results of generating feasible hulls using a standard tabular DDPM and with a guided DDPM. Section 4.3 provides the results of generating hulls using performance guidance, including the results of the performance prediction residual neural networks. Appendix A contains the results of training a conditional DDPM with both feasible and invalid hulls.

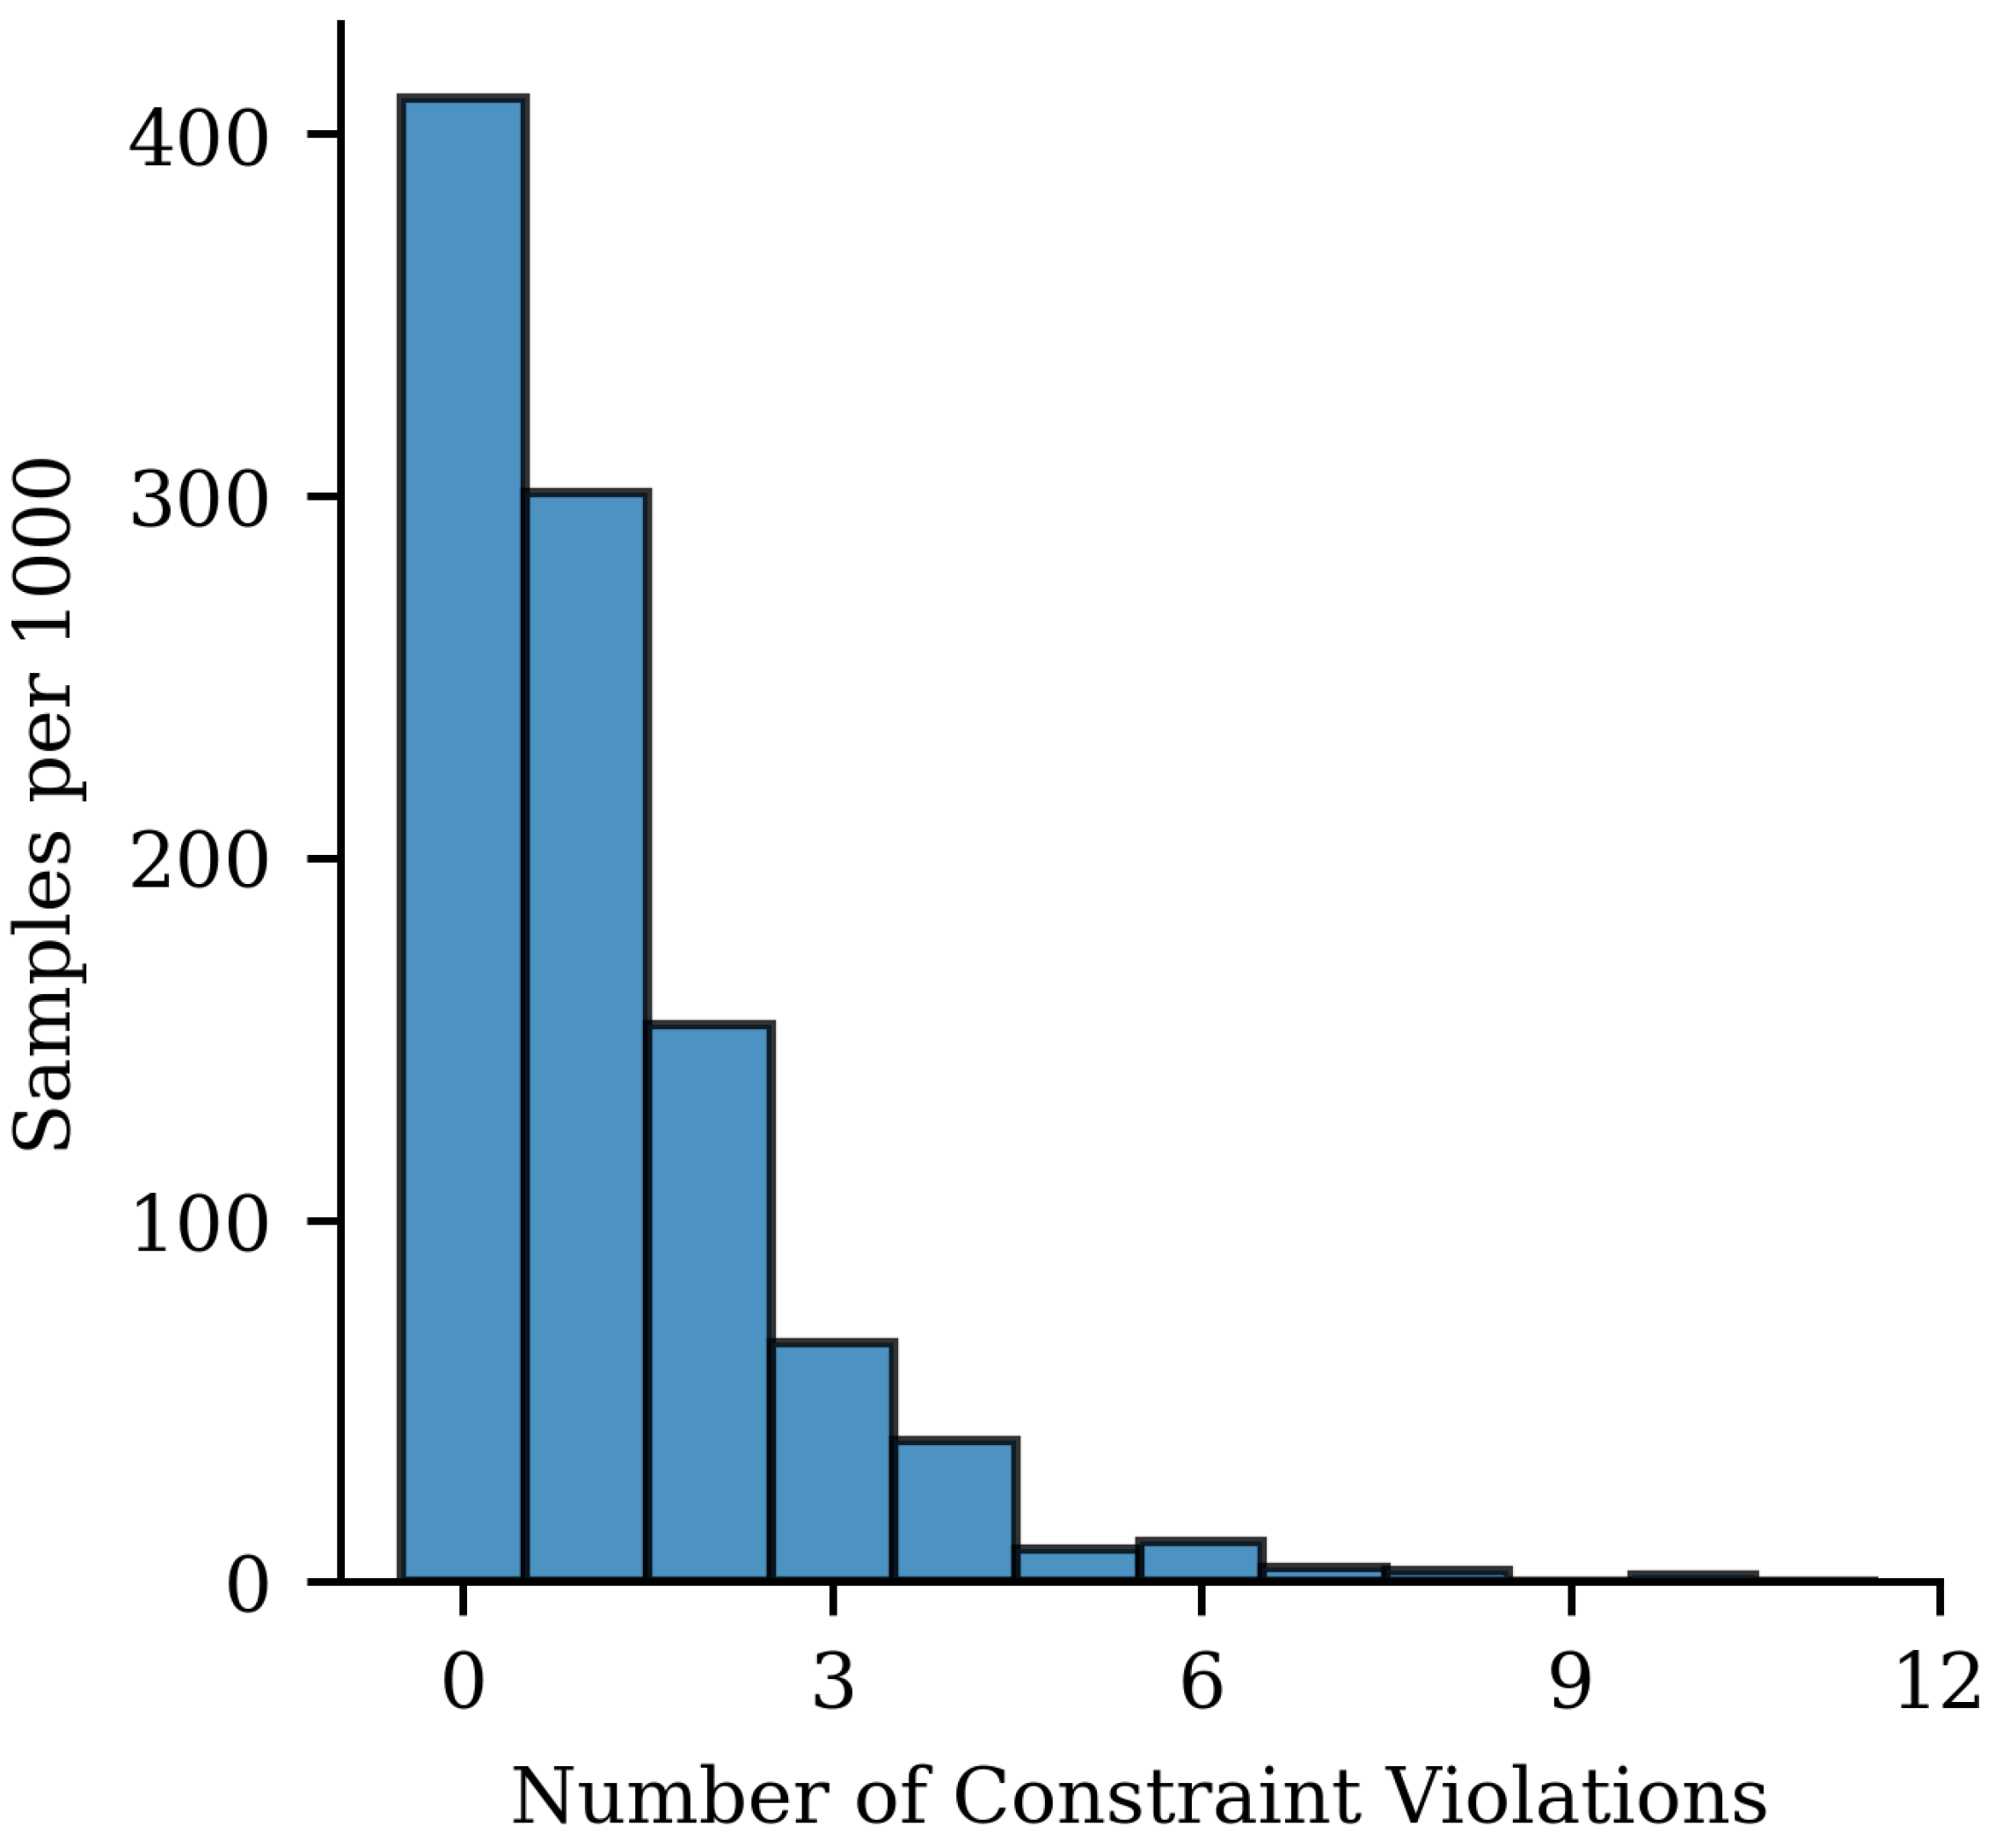
4.1. Benchmark Feasibility Constraint Satisfaction Studies

An initial study generating hulls using interpolation methods was conducted to measure the success rate of generating feasible hulls using the Ship-D dataset. The first study generated thirty thousand parametric hulls by interpolating the parameters halfway between two random hulls belonging to the Ship-D dataset. This interpolation method generated feasible hulls at a rate of 93.1%, as listed in Table 2. The second interpolation method generated hulls by interpolating between a dataset hull and its nearest neighbor hull. The second interpolation method generated feasible hulls with a success rate of 93.8%. Table 1 lists the dataset coverage of these two interpolation methods. The first interpolation method maintained a normalized coverage ratio of 0.965 compared to the baseline coverage, while the second interpolation method exceeded the baseline coverage, having a ratio of 1.059. These two interpolation methods served as benchmarks for the feasibility and dataset coverage analysis on hulls generated with the DDPM.
The CTGAN benchmark study provided a baseline for a trained generative model to generate feasible hulls implicitly. The CTGAN was trained on the 30,000 feasible hull design Ship-D dataset, to implicitly learn the combinations of parameter values that define “feasibility”. This study generated thirty thousand samples of hulls and measured the dataset coverage and feasibility of these samples. The sample coverage was decreased with the CTGAN, having a normalized coverage ratio of 0.94 compared to the baseline. This was slightly reduced from the interpolation benchmark coverage ratios of 0.965 and 1.059. The coverage measures for the CTGAN study are included in Table 1. Of the CTGAN generated samples, only 0.7% satisfied all feasibility constraints. This finding is included in Table 2. The CTGAN was only marginally better than randomly sampling the design space to create a feasible parametric hull design. Further analysis of the CTGAN benchmark study is included in Section 5.

4.2. Feasibility Constraint Satisfaction with Tabular Denoising Diffusion Probabilistic Models

This subsection provides the design feasibility and dataset coverage of the samples generated with different types of DDPM. The types of DDPM considered for sample generation were the standard DDPM and guided DDPM. The following subsections provide the results for each type of DDPM.

4.2.1. Standard DDPM Leads to Good Feasibility and Coverage

A standard DDPM was trained only on the parametric design information from the dataset. The samples generated from a standard DDPM were made up of the implicit statistical relationships learned from the parameters in the feasible hulls. The standard DDPM produced feasible hulls 51.1% of the time, as seen in Table 2. In Section 4, a two-dimensional principal component analysis (PCA) is used to illustrate the spread of the generated sample hulls compared to the Ship-D dataset hulls. The PCA was trained on the parametric hull design data from the Ship-D dataset and used to transform the generated samples into a two-dimensional PCA for visualization. Figure 7 shows that the standard DDPM generated samples that maintained most of the dataset coverage, maintaining a normalized coverage ratio of 0.984. The dataset coverage and feasibility of samples created with the standard diffusion model are included in Table 1 and Table 2.

4.2.2. Guided Denoising Diffusion Probabilistic Model for Enhanced Feasibility

While the standard DDPM generated feasible hulls with a relatively high success rate, the feasibility could be improved by leveraging guidance from a pretrained classifier neural network. The classifier identified hulls as satisfying all the constraints or violating at least one of the forty nine constraints. This classifier network was implemented in the denoising step of generating samples with a standard DDPM, to guide the generation of hulls towards satisfying the feasibility criteria. As mentioned in Section 3, the degree to which the guidance influenced sample denoising was tied to a hyperparameter, γ . Figure 8 shows the percentage of generated feasible samples among the generated samples versus γ . Note that when γ = 0 , the denoising process was the same as the standard DDPM. In addition to design feasibility, γ also affected the dataset coverage of the generated samples, as shown in Figure 9. As defined in the Section 3, the generated samples had increased realism with a generated sample when decreasing the Chamfer distance to its nearest neighbor belonging to the dataset of designs. Similarly, the generated samples had an increasing dataset coverage with the decreasing distance of each dataset point to its nearest neighbor belonging to the generated samples.Realism and coverage were measured as the mean normalized Chamfer distance between the generated hulls and the dataset hulls. Table 1 quantifies the coverage, showing that increasing γ reduced the dataset coverage substantially. To maintain a dataset coverage similar to the interpolation studies, γ should be less than or equal to 0.35. To balance both the design feasibility and dataset coverage among the generated samples, γ was set to 0.5. In this way, feasible samples were generated 99.5% of the time, maintaining a dataset coverage ratio greater than 0.9. The remaining plots in this subsection capture a snapshot of samples generated with guided diffusion with γ set to 0.2, 0.35, 0.5, 0.65, 0.80, and 1.0. Table 2 shows the trend of increasing success in generating feasible hulls. The PCA charts in Figure 10 illustrate the reduction in coverage with increasing γ . Figure 11 shows that classifier guidance had a significant influence on the feasibility of the generated samples throughout the denoising process.

4.3. Hull Generation with Performance Guided Denoising Diffusion Probabilistic Model

In addition to generating feasible samples, guidance can also generate high-performing parametric hull designs. The following subsections provide the results from training performance prediction neural networks on the seven objectives and the results from measuring and simulating the hulls generated using multi-objective performance guidance.

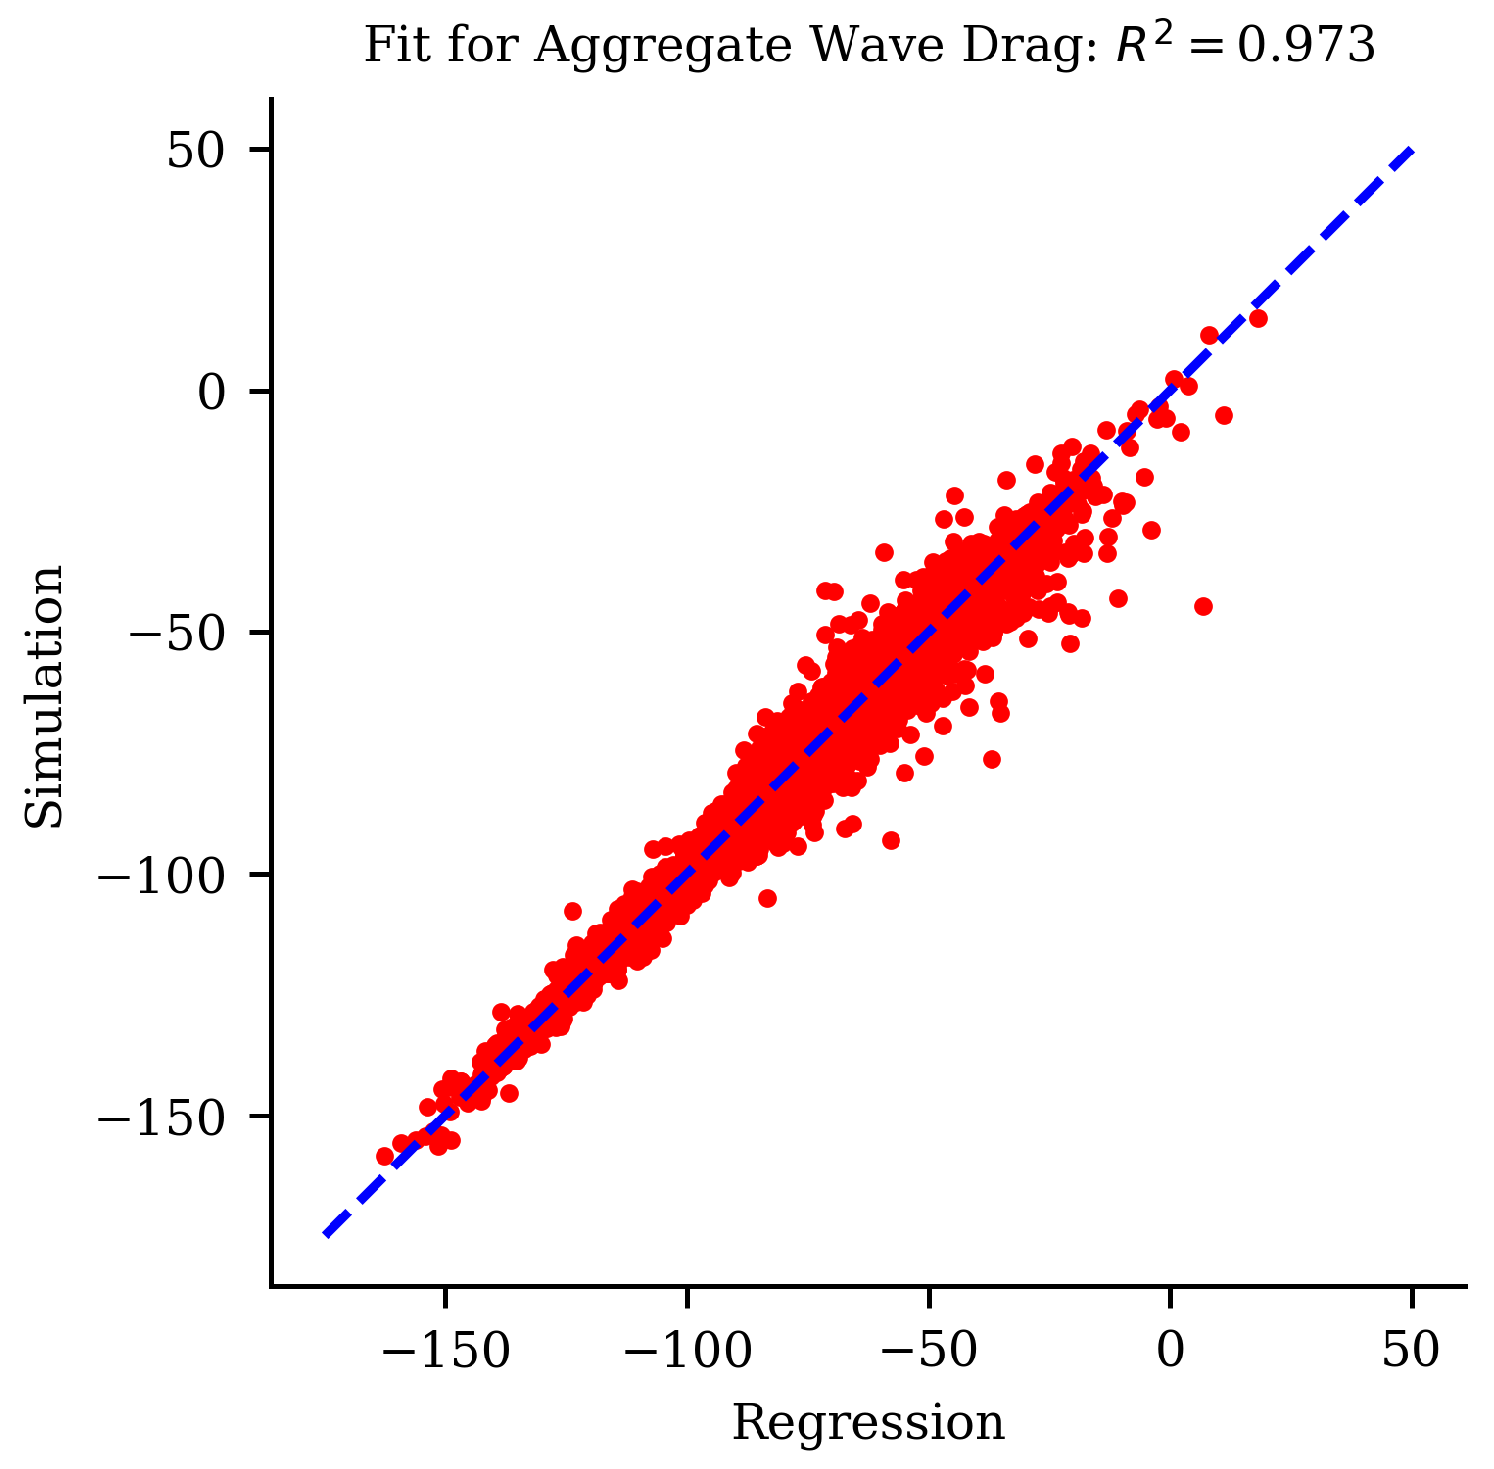
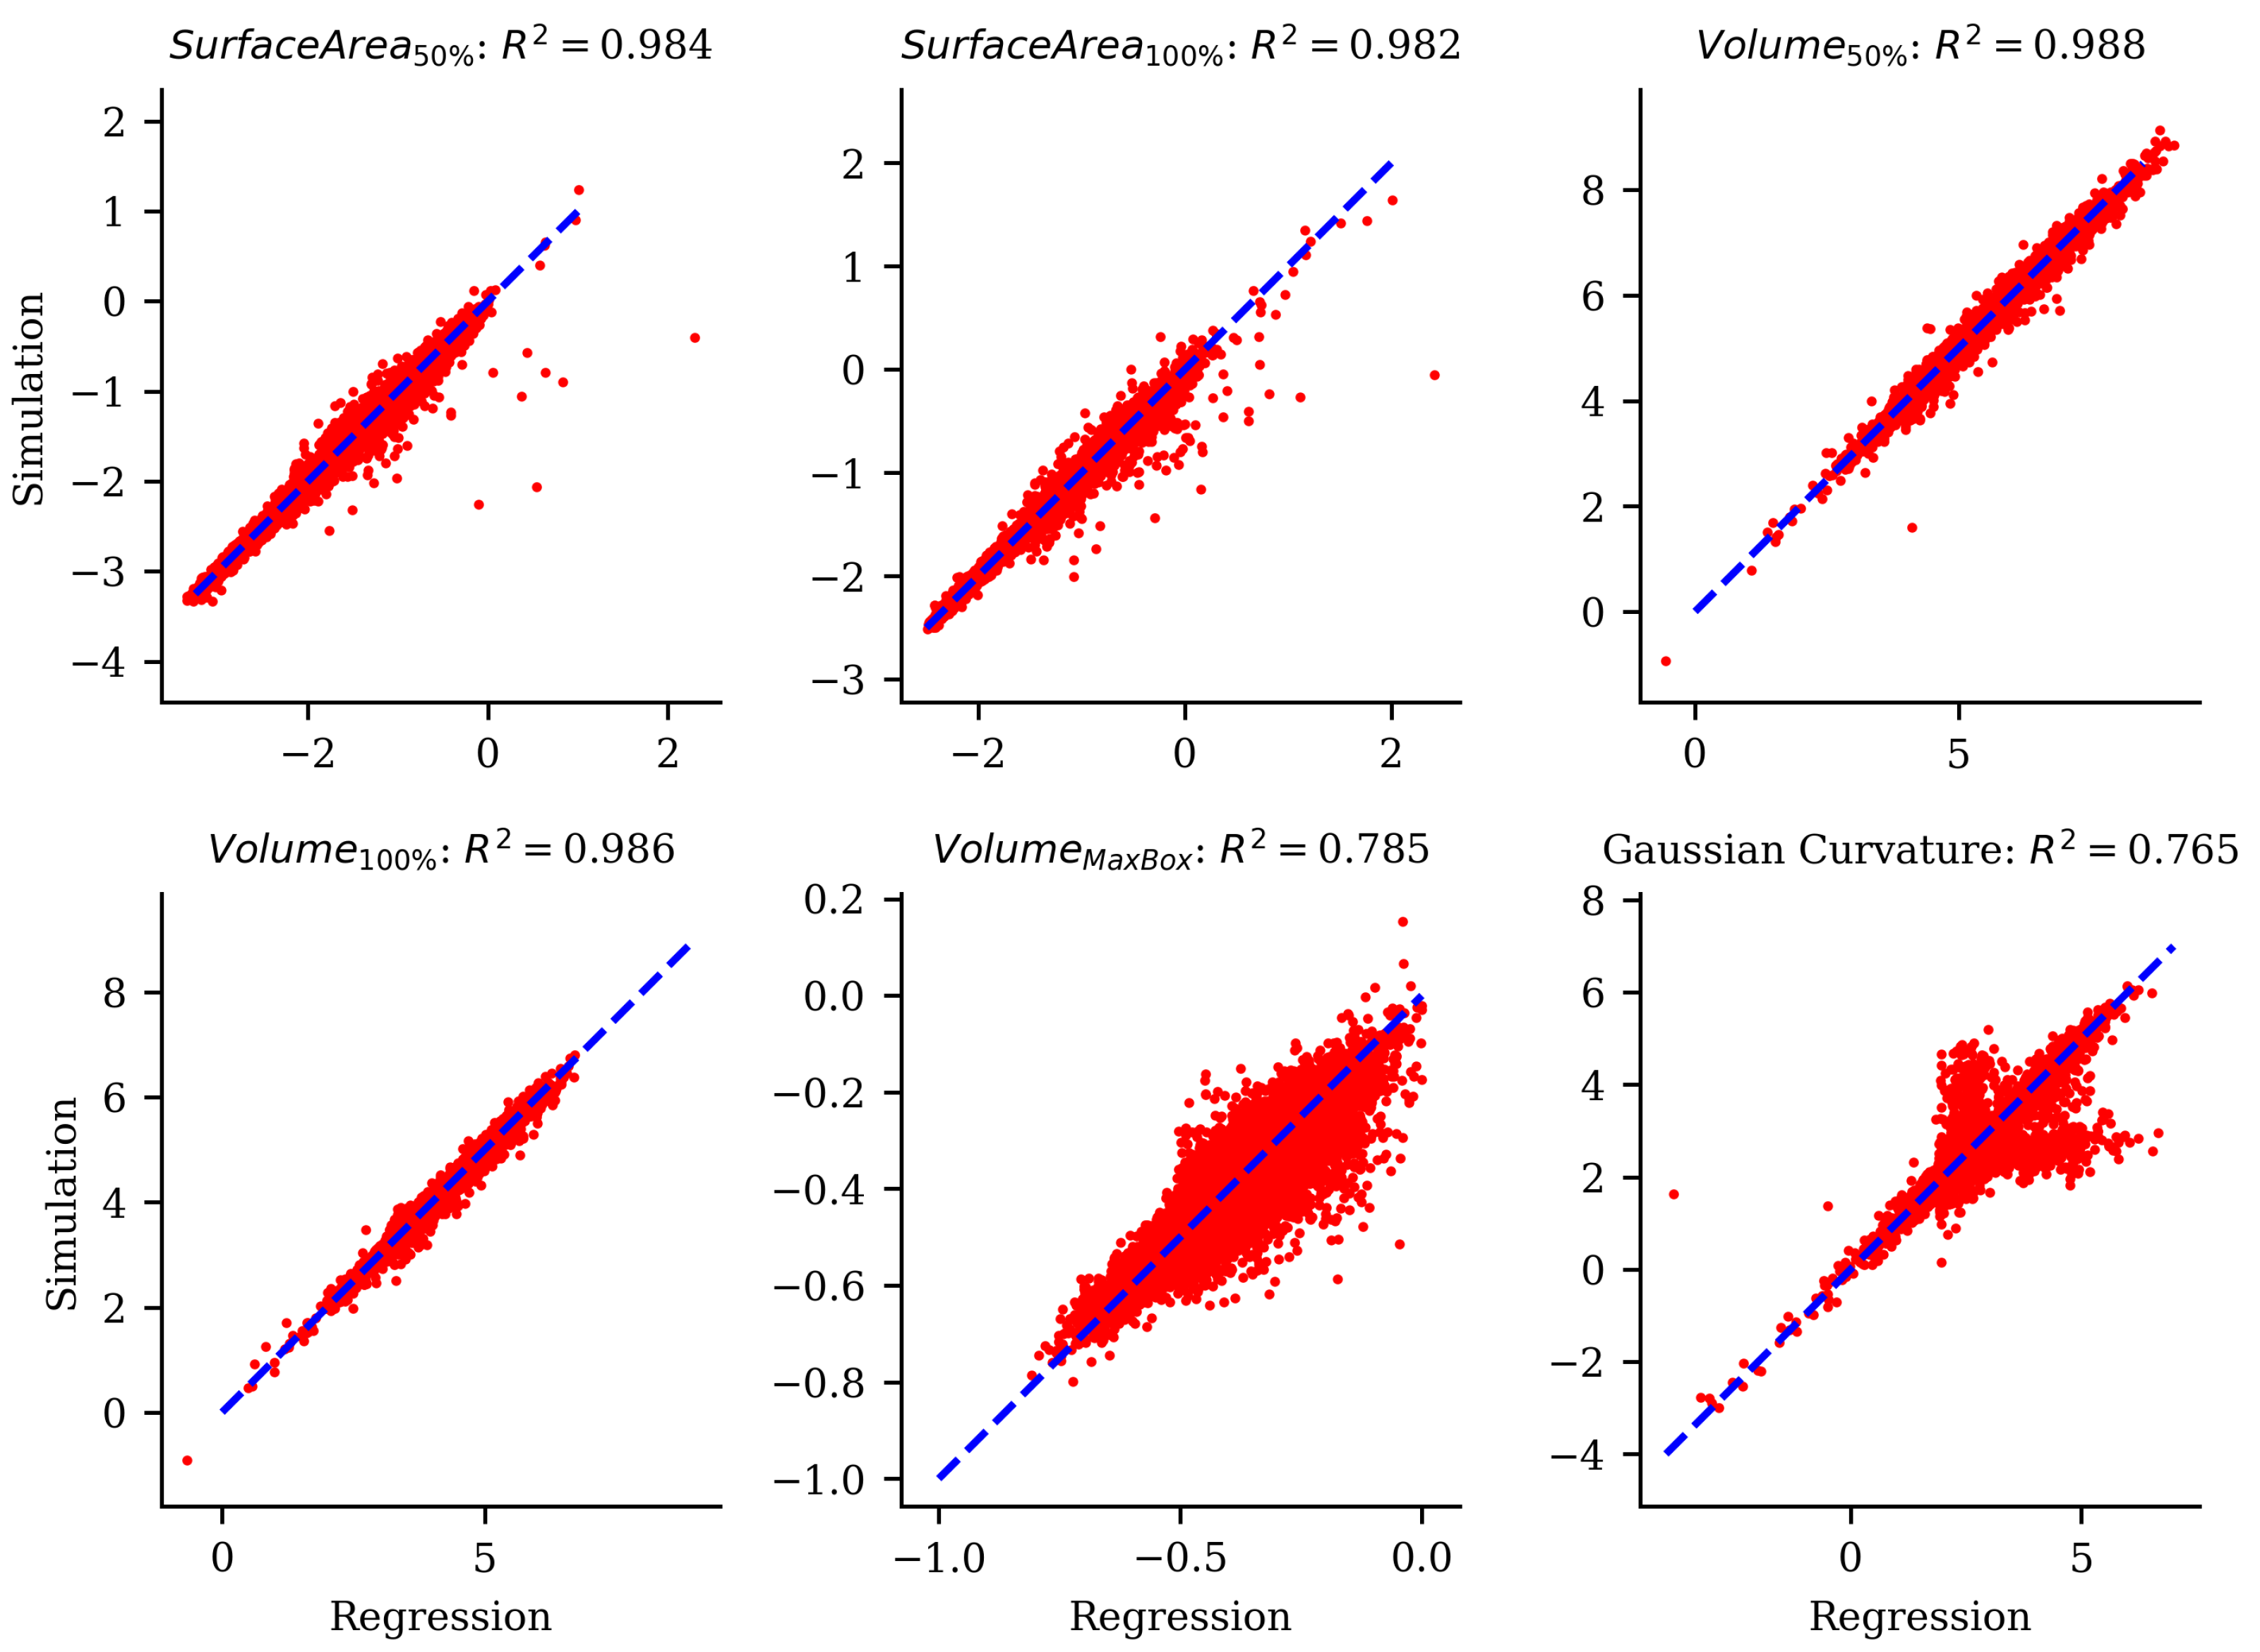
4.3.1. Performance Prediction Training

Using the performance data from the Ship-D dataset, seven residual neural networks were trained to predict the performance of the hulls given the parameterized design vector. Table 3 summarizes the results of the training, using R 2 as a measure of the goodness of fit for these neural networks. Figure 12 shows a plot of the regression prediction versus the simulation calculation for the aggregate wave drag measurement. Figure 13 shows the same plots for the remaining six performance metrics. The blue dashed line in these figures represents the perfect regression prediction, exactly aligning with the simulation calculation. The wave drag coefficient, surface area, and volume prediction neural networks had high R 2 fits and hug the blue dashed line closely. The MaxBox and Gaussian curvature predictions had lower R 2 values, however, they are still sufficient for use with performance-guided DDPM sampling [44].

4.3.2. Multi-Objective Guided Performance Hull Generation

The seven performance prediction neural networks were implemented with the guided DDPM, to generate 1000 hulls. Each objective in these samples was randomly weighted so that the influence of each of the performance metrics varied among the samples. The feasibility classifier guidance was tuned to γ = 0.5 to maintain some variability and dataset coverage among the samples and to not overpower the performance guidance. The samples generated with performance guidance were feasible 83.9% of the time. The PCA plot of these generated samples is shown in Figure 14. These samples did not cover the same sample range of the design space as the Ship-D dataset hulls.
After sampling, the 839 feasible hull designs were simulated and measured using the seven performance objectives. The mean and standard deviation of the performance metrics among the Ship-D dataset and the generated samples are provided in Table 4. These metrics are scaled according to Equations (5)–(11), so it is important to note that these values exist on a logarithmic scale. Among these samples, the wave drag coefficients and displaced volumes showed significant improvements in their performance. These improvements were at the expense of a relative increase in the surface area and Gaussian curvature. The generated samples had wave drag coefficients for any single speed/draft condition that was, on average, 91.4% lower than the average wave drag coefficients of the Ship-D dataset hulls. For the displaced volumes, these generated hulls had an average 114× increase in displaced volume in the bottom 50% of the hull depth and an average 47.9× increase in the total displaced volume of the hull. The generated hulls had, on average, 2.1× more total surface area, 4.4× more surface area in the bottom 50% of the hull, and 1.51× more double curvature compared to the Ship-D hulls. This is not desirable. The MaxBox metric saw a small, but negligible, decrease in the volume ratio of the hull belonging to the MaxBox, where the generated samples had an average 5.2% reduction in the MaxBox volume ratio compared to the hulls in the dataset. This result, however, was far overshadowed by the substantial increase in total available volume in the hull.
In addition to measuring the performance of these hulls, a STL mesh and five images of each hull were created for visual analysis. Figure 15 shows nine of these hulls. A major difference in these generated hulls was their higher length-to-beam ratios compared to the Ship-D hulls seen in Figure 2.

5. Discussion

The following subsections provide insight into the results of the studies presented. Section 5.1 reviews the successful generation of feasible designs with the different DDPMs. Section 5.2 provides an analysis of the dataset coverage of the DDPMs, with special attention given to the γ hyperparameter used in the classifier-guided DDPM. Section 5.3 analyzes the performance of the hulls generated with performance guidance. The Appendix A contains a discussion on the conditional DDPM study.

5.1. Feasibility Constraint Satisfaction

Of the different DDPMs, only the classifier-guided DDPM proved to successfully sample feasible parameterized hull designs with the same success rate as the interpolation study. The standard DDPM, while producing a feasible hull approximately half of the time, was able to do so only by implicitly learning the statistical relationships between the design parameters in feasible hulls. The standard DDPM’s feasibility success rate of 51.1% was significantly higher than the success rate of 0.66% seen by randomly sampling the design space. In the comparison between CTGAN and DDPM, a significant performance gap was identified, particularly in constraint modeling. The CTGAN benchmark study revealed that the standard DDPM was two orders of magnitude more successful at generating feasible hulls than the CTGAN model. While the dataset coverage study demonstrated CTGAN’s ability to produce parameterized vectors representing the dataset statistics, leading to high coverage, it struggled to generate these design vectors with combinations of parameter values that resulted in high feasibility. This suggests that the CTGAN may have faced challenges in implicitly learning the statistical correlations between the parameters to the extent that DDPM did, underlying the need for a comprehensive examination. Such an examination, backed by empirical and theoretical analysis, would be essential to delve deeper into the observed challenges and understand the inherent model characteristics or learning behaviors causing the performance disparity. Without this thorough analysis, making definitive claims regarding the observed differences remains speculative. A deeper comparative study on constraint satisfaction across different deep generative models is needed to make such claims.
Finally, the guided classifier guidance showed that by tuning the γ hyperparameter, the rate of feasible hull generation varied. In order to meet the feasibility benchmark of 93% feasible hulls, the γ should be set between 0.35 and 1. Table 2 also shows that simply by including a small influence of guidance ( γ = 0.2 ), the success of generating feasible hulls improved significantly compared to the standard DDPM. For performance guidance, the success rate of generating feasible hulls was 83.9%, which is lower than the benchmark target, but this came with the benefit of producing high-performing hulls, even with γ = 0.5 . This reduction in the feasibility satisfaction rate was due to the added influence of the performance guidance, which does not consider feasibility when generating samples. Further work in hyperparameter tuning could lead to higher success rates in feasible and high-performing hull generation. Overall, a DDPM with classifier guidance can be used to generate feasible design vectors with a high degree of success in an extremely complicated design space.

5.2. Dataset Coverage

Among the DDPMs, there were varying degrees of dataset coverage. Visually comparing the design space coverage of the Ship-D dataset hulls and the generated samples proved to be reasonably effective for analyzing the dataset coverage. Among the two interpolation methods, interpolation between a random design vector and its nearest neighbor was the best benchmark for dataset coverage, as the diversity in the generated samples relied on the diversity of the randomly selected design vectors. The standard DDPM was also effective at maintaining dataset coverage as it was trained to generate sample hulls that are representative of the hulls in the dataset, as seen in Figure 7. The standard DDPM also maintained dataset coverage better than the CTGAN. Finally, the DDPM with classifier guidance heavily relied on γ for maintaining dataset coverage. As γ is increased to produce feasible hulls with a higher success rate, the dataset coverage of the feasible samples decreases. Figure 9 was made to quantify the coverage and realism of the samples, in addition to visually inspecting the PCA distribution of the generated samples. The best balance of maintaining a high feasibility success rate and dataset coverage was at γ 0.35 0.5 , as shown in Table 1. With increasing γ , the generated samples lost diversity and clustered around the center of the PCA distribution. While the performance-guided DDPM was not intended to generate designs that covered the dataset, Figure 14 suggests that these generated samples maintained some diversity and dataset coverage. Overall, the classifier-guided DDPM was shown to maintain a large breadth of dataset coverage with careful tuning of its hyperparameters.

5.3. Performance Guidance

The DDPM with performance guidance produced hulls with mixed results. Performance guidance created hulls with an average 91.4% lower drag and 47.9× higher displaced volumes than the hulls from the original dataset. This is a highly desirable outcome of performance guided sample generation. This outcome, however, came at the expense of the generated hulls having increased surface area and double curvature, which is not ultimately desirable. Further in-depth analysis, such as life cycle cost assessments, is needed to weigh the impact these results would have on a real, scaled-up ship, instead of a non-dimensionalized parametric hull shape. Future work could also consider different tunings of the γ and λ hyperparameters in the performance guidance of the hulls. The random λ weights used for this study were likely not scaled appropriately for the magnitude of the gradients of the different performance metrics. This could explain why the aggregate wave drag coefficient and displaced volume metrics improved drastically, while MaxBox was relatively unaffected, and the surface area and Gaussian curvature were increased. As these performance gradients were calculated using the weights of the regression neural networks, it is possible that the magnitudes of the gradients between the different regression models disproportionately affected the net influence of guidance on design generation. This is apparent when comparing the significant, yet desired, increase in hull volume and the undesired increase in surface area. These two competing performance objectives should have maintained some balance of improvement across the DDPM generated samples; however, the displaced volume performance objectives saw overwhelming improvement, which included the relative detriment to the surface area objectives. Nonetheless, the significant improvements in wave drag coefficient and displaced volume had strong economic prospects for the cost of operating a ship: the cost of fuel (drag) and the ability to generate revenue (carry cargo). Leveraging a DDPM with performance guidance has been shown to generate hull shapes considering multiple objectives, which can lead to huge cost savings for ship operators. Future work will explore generating hulls with specific performance requirements, to find explicit applicability of guided DDPMs to generate hulls tied to real cost savings in ship design.
In addition to the performance of the generated hulls, these generated samples share more resemblance to real ship hulls than the Ship-D hulls. Figure 15 shows a sample of the generated hulls for visual inspection. These hulls had higher length-to-beam ratios than the Ship-D hulls and had streamlines more akin to real ship hulls.

6. Conclusions

The goal of this work was to generate ship hulls using a denoising diffusion probabilistic model that considered the performance of the hull as part of the design generation. First, by training a DDPM on a dataset of randomly generated feasible hull designs, the DDPM was able to implicitly learn statistical relationships between the design parameters to generate feasible parametric hulls. Then, by incorporating guidance from performance prediction models trained on the same dataset of hulls, the DDPM was able to generate high-performing hulls with only information learned from the low-performing hulls in the dataset.
One critical aspect of leveraging generative AI on parametric design information is the generation of feasible designs. A standard diffusion model can generate feasible hulls approximately 51.1% of the time. While this is much better than the success rate seen by randomly generating hull parameterizations (∼ 0.66 % ), standard diffusion models do not yield feasible hulls at rates similar to interpolation methods (∼ 93 % ). By leveraging the gradients of a classifier during the sampling process, the standard DDPM saw increased feasibility among generated hull designs. The classifier guidance in the denoising process was influenced by a tunable parameter, γ . By varying γ , the guided DDPM was able to generate hulls with different success rates for feasibility, at the expense of design coverage across the dataset. It was found that γ = 0.5 led to high hull feasibility (99.5%) with limited detriment to dataset coverage.
As guidance was shown to be the most successful and versatile method of producing feasible hull designs, guidance was also used to generate high-performing designs. Seven neural networks were trained to predict the different performance metrics given a hull’s design vector. The gradients of these performance prediction neural networks were implemented for performance guidance in the DDPM’s sampling process. The aggregate wave drag coefficients of the generated hulls had a 91.4% mean reduction in drag coefficient compared to the Ship-D hulls. The total displaced volume of the generated samples was on average 47.9× larger than the mean displaced volume of the Ship-D dataset hulls. However, surface area, Gaussian curvature, and MaxBox of the generated samples did not improve compared to the hulls in the dataset. Overall, the significantly reduced drag coefficients and increased displaced volume were extremely beneficial for ship design. These performance metrics dictate how expensive a voyage is (fuel costs due to drag) and how much cargo the ship can carry (how much money can be made on a voyage). With this work, the economic prospects of leveraging generative AI to design ship hulls were shown.

6.1. Future Work

Future work will focus on the continued study of generative AI to generate ship hulls and other systems on a ship. Immediate future work will look at continued tuning of the λ weights during performance guidance, to generate hulls that have improved performance for all of the objectives. To accomplish this, a study on hyperparameter tuning and guidance gradients will be performed. Furthermore, work on leveraging guided diffusion to generate high-performing ship hulls with specific performance targets will be explored. The goal of this future work will be to generate hulls that consider specific user-defined constraints (such as dimensions, volume, speed, etc.) with high performance. In this way, the design of ship hulls using DDPMs could be analogous to similarly structured online text-to-image DDPMs, such as Dall-E [38] and Stable Diffusion [39]. In addition to generating ship hulls, further work on DDPMs to generate other aspects of ship design will be explored, such as structural design generation, packing arrangements, machinery, and outfitting of a ship.

Author Contributions

Conceptualization, N.J.B. and F.A.; methodology, N.J.B. and F.A.; software, N.J.B.; validation, N.J.B.; formal analysis, N.J.B.; investigation, N.J.B. data curation, N.J.B.; writing—original draft preparation, N.J.B. and F.A.; supervision, F.A. All authors have read and agreed to the published version of the manuscript.

Funding

This research was funded by the United States’ Department of Defense, Office of Naval Research, via the National Defense Science and Engineering Graduate (NDSEG) Fellowship program.

Institutional Review Board Statement

Not applicable.

Data Availability Statement

The data and code used for the ShipGen project are available at https://decode.mit.edu/projects/ShipGen/, accessed on 9 October 2023.

Acknowledgments

The authors would like to thank MIT Supercloud for providing some of the computational resources needed to perform this work [52].

Conflicts of Interest

The authors declare no conflict of interest.

Abbreviations

The following abbreviations are used in this manuscript:
AIArtificial Intelligence
DDPMDenoising Diffusion Probabilistic Model, aka Diffusion Model
TabDDPMTabular Denoising Diffusion Probabilistic Model
GANGenerative Adversarial Network
CTGANConditional Tabular GAN
PCAPrincipal Component Analysis
LOALength Overall
FFDFree Form Deformation
CFDComputational Fluid Dynamics

Appendix A. Conditional Diffusion Models

This appendix contains an additional study performed by training a conditional DDPM. Conditional DDPMs are similar to the standard DDPM; however, their structure includes extra layers that embed extra information in the training and sampling process. The extra information in this study is a sample’s classification of being feasible or invalid. The following subsections detail the Methods, Results, and a Discussion on leveraging a conditional DDPM to generate hull designs.

Appendix A.1. Methods

A tabular DDPM was built with additional conditioning embedding layers, to influence the model to produce designs that satisfy the feasibility constraints. In addition to the 30,000 parametric hulls in the Ship-D dataset, 20,000 design vectors were randomly generated that did not meet at least one of the feasibility constraints. The feasible ship hull design vectors and the infeasible vectors were labeled. While training the tabular DDPM, the feasibility label was provided to the conditional embedding layer with its respective design vector in training. The goal of the conditioning was to use the additional label to influence the sampling process, to guide the tabular DDPM to produce designs that satisfied the feasibility constraints. To modify the standard DDPM to become a conditional DDPM, modify the gradient step (Step 5) in the DDPM training algorithm with Equation (A1), where C is the conditional embedding layer that is concatenated to the first layer of the standard DDPM. In sampling, replace Step 4 of the sampling algorithm with Equation (A2), where C is the same conditional embedding layer concatenated to the first layer of the DDPM. The DDPM training and sampling algorithms are provided in Algorithm 1 and Algorithm 2, respectively. Section 4 provides the sample distribution and constraint satisfaction of ship hull design vectors generated with the conditioned tabular DDPM.
θ | | ϵ ϵ θ ( a t ¯ X 0 + 1 a t ¯ ϵ , t , C ) | | 2
X t 1 = 1 α t ( X t 1 α t 1 α t ¯ ϵ θ ( X t , t , C ) ) + σ t Z

Appendix A.2. Results

The conditional DDPM was trained on the thirty thousand Ship-D hulls that satisfied all forty nine constraints and twenty thousand invalid samples that violated varying numbers of the forty nine constraints. Two separate sample generations were performed with the conditional DDPM. The first study tried to intentionally generate feasible hulls. Figure A1 shows that the conditional DDPM produced feasible hulls 39.8% of the time. The PCA plot in Figure A2 shows that the spread of the generated samples was within the bounds of the dataset. This conditional DDPM could also intentionally generate invalid samples. Although this is not useful in design work, the generation of invalid samples with the conditional DDPM shows that the model can distinguish between “positive” and “invalid” samples in sample generation. Figure A3 and Figure A4 showcase the results of hulls that were intentionally created to violate the hull parameterization’s feasibility criteria.
Figure A1. Bar graph showing the number of individuals generated with an increasing number of constraint violations. Leveraging a conditional DDPM to generate hull parameterization led to hull parameterizations that satisfied all constraints 39.8% of the time.
Jmse 11 02215 g0a1
Figure A2. Two-dimensional principal component analysis of the hull parameterization shows that hulls generated with a conditional DDPM maintained most of the dataset coverage; however, there was less design feasibility among the samples than desired.
Jmse 11 02215 g0a2
Figure A3. Bar graph showing the number of individuals generated with an increasing number of constraint violations. Leveraging a conditional DDPM to generate invalid hull parameterization led to the generation of samples that violated a large spread of design feasibility constraints.
Jmse 11 02215 g0a3
Figure A4. Two-dimensional principal component analysis of the hull parameterization shows that invalid hull samples covered the dataset space and more, as some of the parameters were intentionally sampled outside of the feasible range of some parameters.
Jmse 11 02215 g0a4

Appendix A.3. Discussion

The conditional DDPM was not able to produce feasible hulls at a rate that met the interpolation study benchmarks. It was surprising to see how poorly the conditional DDPM performed, given that the model was trained with a distinction between feasible and infeasible design vectors. The conditional model, however, could intentionally create infeasible hulls at will, which further added to the surprise of the poor feasible hull generation. It seems that the conditional DDPM struggled to distinguish the statistical relationships between the parameters in the feasible and infeasible hulls during training. This result did not yield an improvement over the standard DDPM in generating feasible hulls, but it was excellent at generating a large diversity of hulls with at least one constraint violation. This could be useful in future studies concerning design feasibility.

Appendix B. Parametric Hull Design: Parameters and Constraints

This appendix provides documentation for the 45 hull design parameters and the 49 algebraic feasibility constraints. Figure A5 lists the design parameters, describes the features, and provides the ranges for each parameter in the Ship-D dataset. Figure A6 lists each of the 49 algebraic constraints and describes the conditions for satisfying each constraint. By satisfying all 49 algebraic constraints, the hull will satisfy the two feasibility criteria:
  • The hull is watertight, meaning that there are no holes on its surface;
  • The hull surface is not self-intersecting.
Figure A5. List of the hull design parameters, their scaling, and their value ranges within the dataset.
Jmse 11 02215 g0a5
Figure A6. List of the parametric hull design constraints and a description of their satisfaction criteria.
Jmse 11 02215 g0a6

References

  1. Bagazinski, N.J.; Ahmed, F. Ship-D: Ship Hull Dataset for Design Optimization using Machine Learning. In Proceedings of the International Design Engineering Technical Conferences and Computers and Information in Engineering Conference, Boston, MA, USA, 20–23 August 2023; American Society of Mechanical Engineers: New York, NY, USA, 2023. [Google Scholar]
  2. Lin, C.K.; Shaw, H.J. Feature-based estimation of preliminary costs in shipbuilding. Ocean Eng. 2017, 144, 305–319. [Google Scholar] [CrossRef]
  3. Evans, J.H. Basic design concepts. J. Am. Soc. Nav. Eng. 1959, 71, 671–678. [Google Scholar] [CrossRef]
  4. Brown, A.; Salcedo, J. Multiple-objective optimization in naval ship design. Nav. Eng. J. 2003, 115, 49–62. [Google Scholar] [CrossRef]
  5. Feng, Y.; el Moctar, O.; Schellin, T. Parametric Hull Form Optimization of Containerships for Minimum Resistance in Calm Water and in Waves. J. Mar. Sci. Appl. 2022, 20, 670–693. [Google Scholar] [CrossRef]
  6. Read, D. A Drag Estimate for Concept-Stage Ship Design Optimization; The University of Maine: Orono, ME, USA, 2009. [Google Scholar]
  7. Zhang, Y.; Kim, D.J.; Bahatmaka, A. Parametric Method Using Grasshopper for Bulbous Bow Generation. In Proceedings of the 2018 International Conference on Computing, Electronics & Communications Engineering (iCCECE), Southend, UK, 16–17 August 2018; IEEE: Piscataway, NJ, USA, 2018; pp. 307–310. [Google Scholar]
  8. Chrismianto, D.; Kim, D.J. Parametric bulbous bow design using the cubic Bezier curve and curve-plane intersection method for the minimization of ship resistance in CFD. J. Mar. Sci. Technol. 2014, 19, 479–492. [Google Scholar] [CrossRef]
  9. Lu, Y.; Chang, X.; Hu, A.k. A hydrodynamic optimization design methodology for a ship bulbous bow under multiple operating conditions. Eng. Appl. Comput. Fluid Mech. 2016, 10, 330–345. [Google Scholar] [CrossRef]
  10. Knight, J.T.; Zahradka, F.T.; Singer, D.J.; Collette, M.D. Multiobjective Particle Swarm Optimization of a Planing Craft with Uncertainty. J. Ship Prod. Des. 2014, 30, 194–200. [Google Scholar] [CrossRef]
  11. Knight, J.T.; Singer, D.J.; Collette, M.D. Testing of a spreading mechanism to promote diversity in multi-objective particle swarm optimization. Optim. Eng. 2015, 16, 279–302. [Google Scholar] [CrossRef]
  12. Hodges, J.; Wheeler, M.; Belhocine, M.; Henry, J. AI/ML applications for ship design. In Proceedings of the ICCAS 2022, Yokohama, Japan, 13–15 September 2022. [Google Scholar] [CrossRef]
  13. Wang, Y.; Joseph, J.; Aniruddhan Unni, T.; Yamakawa, S.; Barati Farimani, A.; Shimada, K. Three-dimensional ship hull encoding and optimization via deep neural networks. J. Mech. Des. 2022, 144, 101701. [Google Scholar] [CrossRef]
  14. Ao, Y.; Li, Y.; Gong, J.; Li, S. An artificial intelligence-aided design (AIAD) of ship hull structures. J. Ocean. Eng. Sci. 2021, 8, 15–32. [Google Scholar] [CrossRef]
  15. Ao, Y.; Li, Y.; Gong, J.; Li, S. Artificial Intelligence Design for Ship Structures: A Variant Multiple-Input Neural Network-Based Ship Resistance Prediction. J. Mech. Des. 2022, 144, 091707. [Google Scholar] [CrossRef]
  16. Peri, D.; Rossetti, M.; Campana, E.F. Design optimization of ship hulls via CFD techniques. J. Ship Res. 2001, 45, 140–149. [Google Scholar] [CrossRef]
  17. Demo, N.; Tezzele, M.; Mola, A.; Rozza, G. Hull shape design optimization with parameter space and model reductions, and self-learning mesh morphing. J. Mar. Sci. Eng. 2021, 9, 185. [Google Scholar] [CrossRef]
  18. Abbas, A.; Rafiee, A.; Haase, M. DeepMorpher: Deep learning-based design space dimensionality reduction for shape optimisation. J. Eng. Des. 2023, 34, 254–270. [Google Scholar] [CrossRef]
  19. Khan, S.; Kaklis, P.; Serani, A.; Diez, M.; Kostas, K. Shape-supervised dimension reduction: Extracting geometry and physics associated features with geometric moments. Comput.-Aided Des. 2022, 150, 103327. [Google Scholar] [CrossRef]
  20. Khan, S.; Kaklis, P.; Serani, A.; Diez, M. Geometric moment-dependent global sensitivity analysis without simulation data: Application to ship hull form optimisation. Comput.-Aided Des. 2022, 151, 103339. [Google Scholar] [CrossRef]
  21. Khan, S.; Goucher-Lambert, K.; Kostas, K.; Kaklis, P. ShipHullGAN: A generic parametric modeller for ship hull design using deep convolutional generative model. Comput. Methods Appl. Mech. Eng. 2023, 411, 116051. [Google Scholar] [CrossRef]
  22. Shaeffer, A. Application of Artificial Neural Networks to Early-Stage Hull Form Design. Ph.D. Thesis, George Mason University, Fairfax, VA, USA, 2023. [Google Scholar]
  23. Shaeffer, A.K.; Wilson, W.; Yang, C. Application of Machine Learning to Early-Stage Hull Form Design. In Proceedings of the SNAME Maritime Convention, SNAME, Virtual, 29 September–1 October 2020; p. D043S019R002. [Google Scholar]
  24. Hollenbach, K.U. Estimating resistance and propulsion for single-screw and twin-screw ships-ship technology research 45 (1998). Schiffstechnik 1998, 45, 72. [Google Scholar]
  25. Hollenbach, U.; Friesch, J. Efficient hull forms–What can be gained. In Proceedings of the 1st International Conference on Ship Efficiency, Hamburg, Germany, 8–9 October 2007; pp. 8–9. [Google Scholar]
  26. Savitsky, D. Hydrodynamic Design of Planing Hulls. Mar. Technol. SNAME News 1964, 1, 71–95. [Google Scholar] [CrossRef]
  27. Michell, J.H., XI. The wave-resistance of a ship. Lond. Edinb. Dublin Philos. Mag. J. Sci. 1898, 45, 106–123. [Google Scholar] [CrossRef]
  28. Tuck, E.O. The wave resistance formula of JH Michell (1898) and its significance to recent research in ship hydrodynamics. ANZIAM J. 1989, 30, 365–377. [Google Scholar]
  29. Mantzaris, D.A. A Rankine Panel Method as a Tool for the Hydrodynamic Design of Complex Marine Vehicles. Ph.D. Thesis, Massachusetts Institute of Technology, Cambridge, MA, USA, 1998. [Google Scholar]
  30. Dawson, C. A practical computer method for solving ship-wave problems. In Proceedings of the Second International Conference on Numerical Ship Hydrodynamics, Berkeley, CA, USA, 19–21 September 1977; pp. 30–38. [Google Scholar]
  31. Noblesse, F.; Huang, F.; Yang, C. The Neumann–Michell theory of ship waves. J. Eng. Math. 2013, 79, 51–71. [Google Scholar] [CrossRef]
  32. Yang, C.; Huang, F.; Noblesse, F. Practical evaluation of the drag of a ship for design and optimization. J. Hydrodyn. 2013, 25, 645–654. [Google Scholar] [CrossRef]
  33. Huang, F.; Yang, C.; Noblesse, F. Numerical implementation and validation of the Neumann–Michell theory of ship waves. Eur. J. Mech.-B/Fluids 2013, 42, 47–68. [Google Scholar] [CrossRef]
  34. Marlantes, K.; Maki, K. Modeling Vertical Planing Boat Motions using a Neural-Corrector Method. In Proceedings of the SNAME International Conference on Fast Sea Transportation, Providence, RI, USA, 26 October 2021. [Google Scholar] [CrossRef]
  35. Silva, K.M.; Maki, K.J. Implementation of the Critical Wave Groups Method with Computational Fluid Dynamics and Neural Networks. arXiv 2023, arXiv:2301.09834. [Google Scholar]
  36. Dhariwal, P.; Nichol, A. Diffusion models beat gans on image synthesis. Adv. Neural Inf. Process. Syst. 2021, 34, 8780–8794. [Google Scholar]
  37. Ho, J.; Jain, A.; Abbeel, P. Denoising diffusion probabilistic models. Adv. Neural Inf. Process. Syst. 2020, 33, 6840–6851. [Google Scholar]
  38. Ramesh, A.; Dhariwal, P.; Nichol, A.; Chu, C.; Chen, M. Hierarchical text-conditional image generation with clip latents. arXiv 2022, arXiv:2204.06125. [Google Scholar]
  39. Rombach, R.; Blattmann, A.; Lorenz, D.; Esser, P.; Ommer, B. High-Resolution Image Synthesis with Latent Diffusion Models. In Proceedings of the 2022 IEEE/CVF Conference on Computer Vision and Pattern Recognition (CVPR), New Orleans, LA, USA, 18–24 June 2022; IEEE: Piscataway, NJ, USA, 2022; pp. 10674–10685. [Google Scholar]
  40. Liu, R.; Wu, R.; Van Hoorick, B.; Tokmakov, P.; Zakharov, S.; Vondrick, C. Zero-1-to-3: Zero-shot one image to 3d object. In Proceedings of the IEEE/CVF International Conference on Computer Vision, Paris, France, 4–6 October 2023. [Google Scholar]
  41. Mazé, F.; Ahmed, F. Diffusion Models Beat GANs on Topology Optimization. In Proceedings of the AAAI Conference on Artificial Intelligence (AAAI), Washington, DC, USA, 7–14 February 2023; Volume 37, pp. 9108–9116. [Google Scholar] [CrossRef]
  42. Giannone, G.; Srivastava, A.; Winther, O.; Ahmed, F. Aligning Optimization Trajectories with Diffusion Models for Constrained Design Generation. arXiv 2023, arXiv:2305.18470. [Google Scholar]
  43. Giannone, G.; Regenwetter, L.; Srivastava, A.; Gutfreund, D.; Ahmed, F. Learning from Invalid Data: On Constraint Satisfaction in Generative Models. arXiv 2023, arXiv:2306.15166. [Google Scholar]
  44. Arechiga, N.; Permenter, F.; Song, B.; Yuan, C. Drag-guided diffusion models for vehicle image generation. arXiv 2023, arXiv:2306.09935. [Google Scholar]
  45. Zubaly, R. Applied Naval Architecture; Cornell Maritime Press: Centreville, MD, USA, 1996. [Google Scholar]
  46. Newman, J.N. Marine Hydrodynamics; The MIT Press: Cambridge, MA, USA, 2018. [Google Scholar]
  47. Dalle, D. Comparison of numerical techniques for Euclidean curvature. Rose-Hulman Undergrad. Math. J. 2006, 7, 12. [Google Scholar]
  48. Nelder, J.A.; Mead, R. A simplex method for function minimization. Comput. J. 1965, 7, 308–313. [Google Scholar] [CrossRef]
  49. Regenwetter, L.; Srivastava, A.; Gutfreund, D.; Ahmed, F. Beyond Statistical Similarity: Rethinking Metrics for Deep Generative Models in Engineering Design. Comput.-Aided Des. 2023, 165, 103609. [Google Scholar] [CrossRef]
  50. Xu, L.; Skoularidou, M.; Cuesta-Infante, A.; Veeramachaneni, K. Modeling Tabular data using Conditional GAN. In Proceedings of the Advances in Neural Information Processing Systems, Vancouver, BC, Canada, 8–14 December 2019. [Google Scholar]
  51. Kotelnikov, A.; Baranchuk, D.; Rubachev, I.; Babenko, A. Tabddpm: Modelling tabular data with diffusion models. In Proceedings of the International Conference on Machine Learning, PMLR, Honolulu, HI, USA, 23–29 July 2023; pp. 17564–17579. [Google Scholar]
  52. Reuther, A.; Kepner, J.; Byun, C.; Samsi, S.; Arcand, W.; Bestor, D.; Bergeron, B.; Gadepally, V.; Houle, M.; Hubbell, M.; et al. Interactive Supercomputing on 40,000 Cores for Machine Learning and Data Analysis. In Proceedings of the 2018 IEEE High Performance Extreme Computing Conference (HPEC), Waltham, MA USA, 25–27 September 2018; pp. 1–6. [Google Scholar] [CrossRef]
Figure 1. Overview of utilizing a DDPM to generate parametric ship hull designs. When leveraging classifier and performance guidance from pretrained neural networks, the DDPM is able to generate ship hull designs with high performance.
Jmse 11 02215 g001
Figure 2. A selection of hulls from the Ship-D dataset, showing the variability possible with the hull parameterization. A random sampling from the dataset may lead to unrealistic hulls, containing combinations of features that do not resemble real-world ships and features that lead to poor performance.
Jmse 11 02215 g002
Figure 3. During training, the DDPM predicted a denoising step, given a timestep embedding and a partially noised sample design vector.
Jmse 11 02215 g003
Figure 4. During sampling, the standard DDPM denoises a vector over one thousand timesteps, generating a sample design vector that statistically aligns with the training data.
Jmse 11 02215 g004
Figure 5. For guided sampling, the generated vectors were denoised with the standard DDPM at each timestep and then influenced with guidance gradients in each denoising iteration.
Jmse 11 02215 g005
Figure 6. Classifier and performance guidance is the result of leveraging gradients of pretrained models to influence the denoising process of the DDPM. The figure highlights the models implemented for this experiment.
Jmse 11 02215 g006
Figure 7. Two-dimensional principal component analysis of the hull parameterization shows that hulls generated with a standard DDPM maintained most of the dataset coverage.
Jmse 11 02215 g007
Figure 8. Hull design feasibility was highly dependent on γ in guided diffusion. The percentage of feasible generated hulls was above 90% when γ was greater than 0.3.
Jmse 11 02215 g008
Figure 9. Realism and coverage of the generated samples was strongly affected by γ . When γ was approximately 0.5, the sum of realism and coverage was maximized.
Jmse 11 02215 g009
Figure 10. Two-dimensional principal component analysis of the hull parameterization shows that the dataset coverage was reduced when increasing the hyperparameter, γ .
Jmse 11 02215 g010
Figure 11. Leveraging classifier guidance improved the feasibility of the generated samples throughout the denoising process compared to the standard DDPM (no guidance). The classifier guidance was tuned to γ = 0.5 .
Jmse 11 02215 g011
Figure 12. Comparison of the neural network prediction and the simulation value (ground truth) across the dataset for aggregate wave drag. This regression had a R 2 equal to 0.973. A perfect prediction ( R 2 = 1 ) is shown by the blue dashed line.
Jmse 11 02215 g012
Figure 13. Comparison of the neural network prediction and the simulation value (ground truth) across the dataset for the remaining six performance metrics. All of these performance metric regressions were well resolved. A perfect prediction ( R 2 = 1 ) is shown by the blue dashed line.
Jmse 11 02215 g013
Figure 14. Two-dimensional principal component analysis of the hull parameterization shows that the performance-guided DDPM with γ = 0.5 led to sample coverage that was skewed relative to the distribution of the Ship-D dataset as a result of the performance guidance.
Jmse 11 02215 g014
Figure 15. A selection of hulls generated with multi-objective guided performance generation. Notice the relative slenderness of the hulls, leading to drastically reduced drag coefficients relative to the dataset hulls.
Jmse 11 02215 g015
Table 1. This table provides the dataset coverage for the different sampling methods. These values were normalized between the best- and worst-case scenarios found in the dataset. The standard DDPM covered the dataset better than the CTGAN. By adding guidance to the DDPM, dataset coverage was maintained when γ 0.5 .
Generation MethodChamfer Distance
(Lower Is Better)
Normalized Coverage
(Higher Is Better)
Random Dataset Sample4.315(Baseline) 1.000
Interpolation Study 15.0990.965
Interpolation Study 22.9761.059
CTGAN
Standard DDPM
5.660
4.672
0.940
0.984
Guidance: γ = 0.2 4.7310.982
Guidance: γ = 0.35 5.0670.967
Guidance: γ = 0.5 6.0020.925
Guidance: γ = 0.65 8.4530.817
Guidance: γ = 0.8 13.6110.589
Guidance: γ = 1.0 27.054 0.005
Table 2. This table shows the fraction of the generated samples that are feasible. The standard DDPM generated feasible samples 73× more often than CTGAN. Increasing γ increased the proportion of feasible samples. All generated samples were feasible when γ 0.65 .
Generation MethodFeasibility Rate
Interpolation Study 10.931
Interpolation Study 20.938
CTGAN
Standard DDPM
0.007
0.511
Guidance: γ = 0.2 0.839
Guidance: γ = 0.35 0.962
Guidance: γ = 0.5 0.995
Guidance: γ = 0.65 1.000
Guidance: γ = 0.8 1.000
Guidance: γ = 1.0 1.000
Table 3. The performance prediction neural networks had a high goodness-of-fit with the training data, which enabled performance guidance in DDPM sampling with these objectives.
Performance ObjectiveTraining Fit: [ R 2 ]
Wave Drag C w 0.973
Surface Area 50 % 0.983
Surface Area 100 % 0.982
Volume 50 % 0.988
Volume 100 % 0.986
Volume MaxBox 0.784
Gaussian Curvature0.765
Table 4. The table shows the mean and standard deviation of the performance metrics across the Ship-D dataset hulls and the feasible generated hulls. The generated hulls saw a 47.9× increase in total volume and a 91.4% relative decrease in wave drag coefficient across all speeds.
Performance ObjectiveShip-D DatasetGenerated SamplesScaled Factor
( Y * gen )( Y * DS )( Y gen / Y DS )
MeanStd.MeanStd.
Wave Drag C w 73.40 17.38 107.45 23.900.086
Surface Area 50 % 1.71 0.53 1.07 0.194.365
Surface Area 100 % 1.09 0.45 0.76 0.192.138
Volume 50 % 4.780.812.720.59114.815
Volume 100 % 3.800.622.120.4347.863
Volume MaxBox 0.407 0.010 0.384 0.0720.948
Gaussian Curvature2.430.5292.610.241.514
Disclaimer/Publisher’s Note: The statements, opinions and data contained in all publications are solely those of the individual author(s) and contributor(s) and not of MDPI and/or the editor(s). MDPI and/or the editor(s) disclaim responsibility for any injury to people or property resulting from any ideas, methods, instructions or products referred to in the content.

