Article

Failure Behavior and Surrounding Soil Stress Responses of Suction Anchor in Low-Strength Muddy Clay

1
National Engineering Research Center of Port Hydraulic Construction Technology, Tianjin Research Institute for Water Transport Engineering, Ministry of Transport, Tianjin 300456, China
2
Hebei Construction & Investment Offshore Wind Power Co., Ltd., Tangshan 063611, China
*
Author to whom correspondence should be addressed.
J. Mar. Sci. Eng. 2023, 11(11), 2190; https://doi.org/10.3390/jmse11112190
Submission received: 10 October 2023 / Revised: 13 November 2023 / Accepted: 16 November 2023 / Published: 17 November 2023
(This article belongs to the Special Issue Wave Loads on Offshore Structure)

Abstract

:
Anchorage failure of a suction anchor is more likely to occur in low-strength muddy clay. This paper focuses on the failure behaviors of suction anchors and muddy clay stress responses. The centrifugal model test was used to study the loading processes of suction anchors with various pulling angles. Firstly, the multi-stage developing process of anchoring force was analyzed according to the test results. Numerical modeling was used to validate the test results. The displacement of the suction anchor and muddy clay soil were analyzed using the numerical results. Then, the numerical and testing results were compared to analyze the horizontal soil pressure responses around the suction anchors. It was found that the change in loading direction affected the distribution and development of soil stress. The horizontal soil resistance played a crucial role in improving the bearing capacity. The soil stress variation and anchor displacement revealed that the suction anchors exhibited multi-attitude coupling movement during the inclined pulling. The vertical pulling suction anchor showed shear–slip failure behaviors, while the inclined pulling suction anchors showed compression–shear–slip coupling failure behaviors. The results of this study provide insight into the interaction mechanism between suction anchors and muddy clay, serving as a reference for the design and application of suction anchors.

1. Introduction

With the development of anchoring technology in offshore engineering, suction anchors are extensively being used as deep water foundations [1,2]. A suction anchor is a cylindrical structure with a large diameter that is open at the bottom and closed at the top. The anchor is placed on the seabed and sinks into the soil under self-weight, thereby forming a closed environment. Subsequently, the internal water is pumped out, generating a considerable differential pressure. Then, the suction anchor is installed into the seabed gradually under pressure [3]. Installing a suction anchor is both cost-effective and convenient compared to piling in deep water, and a suction anchor can provide high bearing capacity. Suction anchors with taut wire have excellent stability and high deformation control accuracy, which can be used to tension leg oil platforms [4], floating wind turbines [5,6], and submerged floating tunnels [7].
The offshore floating structures experience a complex combination of wind, wave, and current loads [8], and all loads are transferred to the anchor foundation. Therefore, the bearing capacity of a suction anchor is vital for the safety of offshore structures, and this has become a hotspot of current research [9,10,11,12,13]. Researchers have focused on suction anchors’ bearing capacity under static and dynamic loads. In terms of the loading direction effect, various studies have been conducted by researchers. Wang et al. [14] assessed the lateral bearing capacity of suction bucket foundation. Wang and Chen [15] focused on the suction caisson’s vertical loading effect. Monajemi et al. [16] investigated the suction anchor’s reaction under inclined loading.
For the bearing capacity under dynamic load, Li et al. [17] and Shen et al. [18] investigated the excess pore pressure accumulation around the suction anchor. Cheng et al. [19] utilized a stiffness degradation model to analyze the cyclic behavior of suction anchors. Previous studies [20,21,22,23] have shown that the bearing capacity of a suction anchor under dynamic load was 60 to 90 percent of that under static load. For the bearing capacity under static load, the previous research pays more attention to the length/diameter ratio (L/D) [2] and mooring position [24] of suction anchors, which significantly influences the bearing capacity. The mooring position, which ensures that the anchor purely translates, is known as the optimal loading point of suction anchors (i.e., when a horizontal or inclined load is experienced) [4]. However, loading on the optimal point is ideal. Slight rotation during the loading and deformation process of a suction anchor is inevitable and makes the mechanical behaviors of the suction anchor more complex.
A series of analytical methods, including upper bound plastic limit analyses [25], limiting equilibrium analyses [26], and vertical–horizontal (V-H) failure envelope analyses [9], are used to describe the bearing mechanism and calculation methods of suction anchors. Numerical simulation methods are applied to the parameter analysis of suction anchors. Koh et al. [27] analyzed the installation effect using a coupled effective stress–pore pressure large deformation finite element (LDFE) approach. Yang et al. [28] and Cheng et al. [29] analyzed suction anchors’ bearing and failure performance based on numerical methods. Hu et al. [30] conducted numerical simulations to study the local scour around suction anchors. Analytical and numerical simulation methods have obtained many important results, which have greatly contributed to the design and construction technology of suction anchors. However, the mechanical analysis of suction anchors via theoretical analysis and numerical simulation is simplified, meaning that it may not accurately reflect the operational states of suction anchors.
In contrast, test methods play a crucial role in revealing the bearing capacity and mechanical state of a suction anchor. Saue et al. [31] and Utsunomiya et al. [32] reported suction anchors’ installation and working effect using field test results. Wang and Li [33], Cheng et al. [34], and Lee and Do [35] performed a 1 g scale model test to study the deformation and loading capacity of suction anchors. Andersen et al. [36], Kim et al. [37], and Zhu et al. [38] conducted centrifugal model tests to study the installation process and pullout bearing performance of suction anchors. Among these test methods, the centrifugal model test can reflect the natural stress state of the seabed [39], which can accurately simulate the loading process of suction anchors using small models.
In summary, previous studies have obtained valuable insights into the bearing capacity of anchors. Investigations into the interaction mechanism between the seabed and the suction anchors have primarily been conducted through analytical methods and numerical simulations, which make it challenging to reflect the natural state of soil stress in the bearing capacity evolution of suction anchors. The research results regarding anchors in other forms, such as pile anchors [40] and plate anchors [41], provide significant references but cannot be applied to suction anchors directly.
Therefore, for this study, we used a centrifugal model test to investigate the bearing capacity of suction anchors in low-strength muddy clay. The evolution process of the anchoring force with different loading angles was analyzed based on the test results. Numerical modeling was used to validate the test results of anchoring force development, which also showed the displacement characteristic of the soil and suction anchor. The soil pressures around the suction anchors were analyzed based on a comparative numerical and testing analysis. The centrifugal test results revealed the interaction mechanism between a suction anchor and muddy clay soil, and the influence of the loading direction on the interaction mechanism was investigated. The failure behaviors of suction anchors were clarified according to the anchoring force development, the anchor movement, and the mechanical responses of the muddy clay soil.

2. Design and Implementation of Centrifugal Model Test

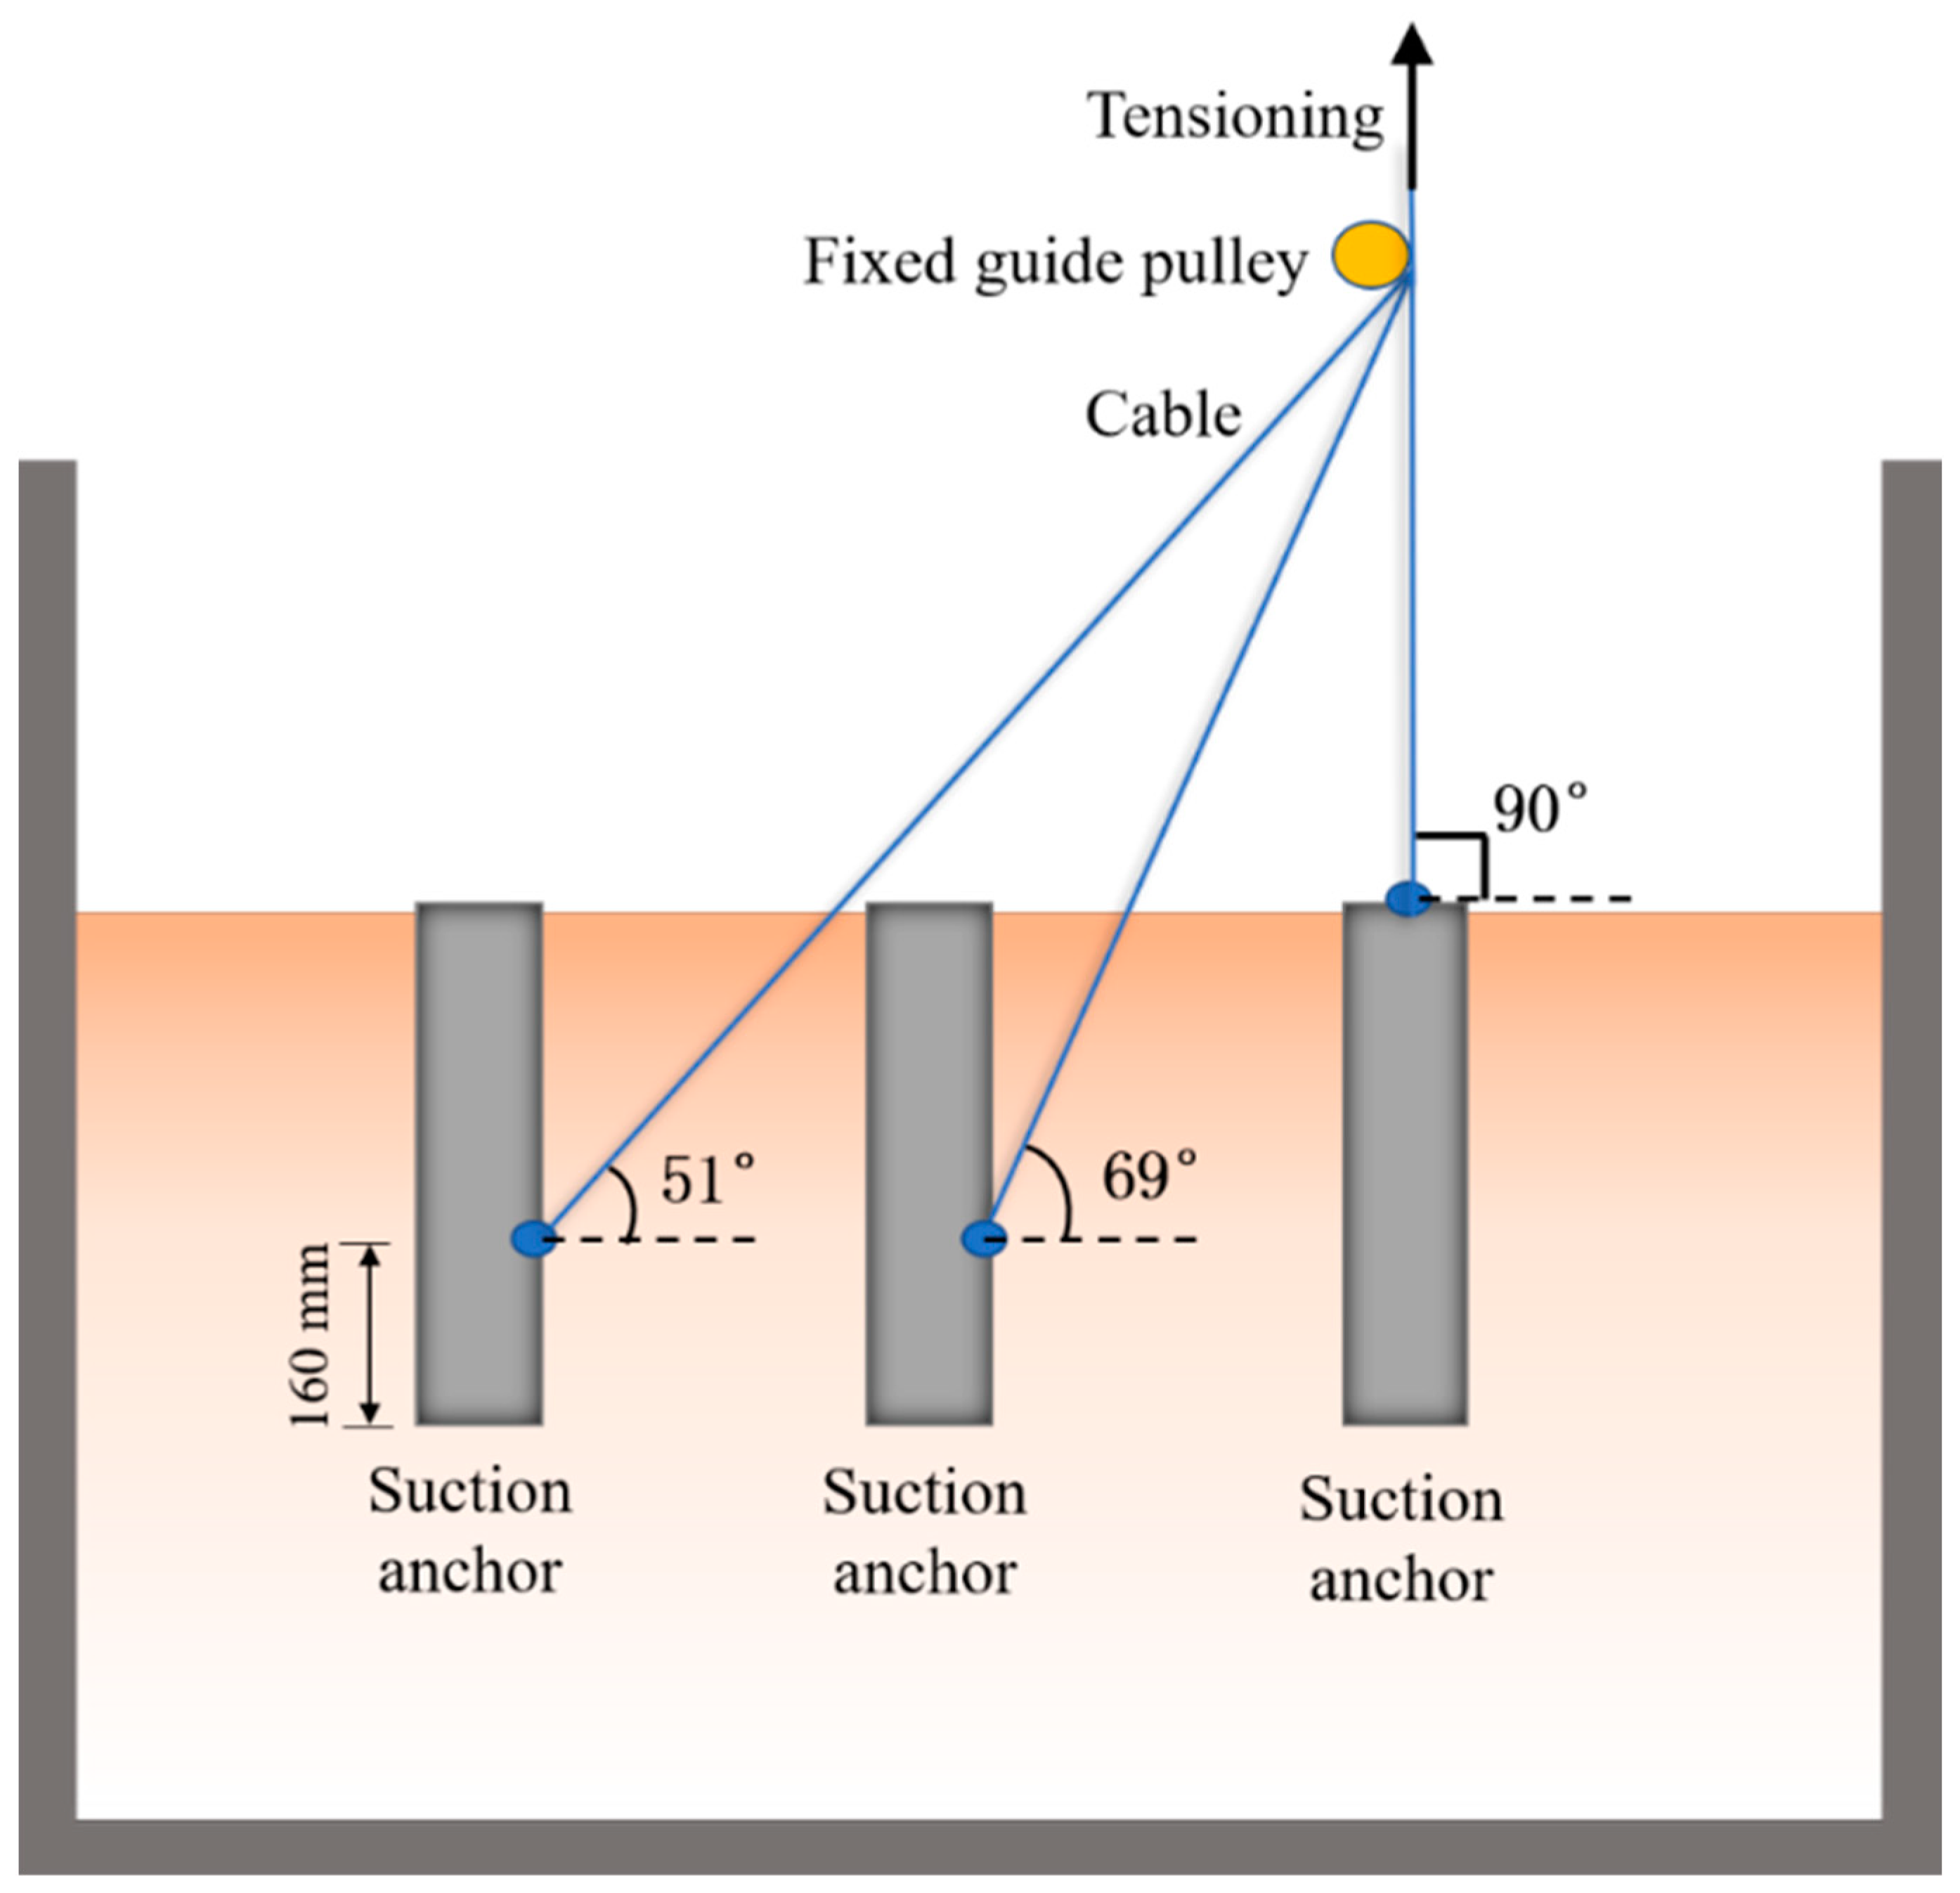
2.1. Model Scale and Main Design Scheme

In this paper, the centrifugal model test was carried out to study the interaction between suction anchors and muddy clay soil. The test was conducted in the centrifuge laboratory of Tianjin Research Institute For Water Transport Engineering, Ministry of Transport. The TK-C500 geotechnical centrifuge used in the test (shown in Figure 1) has an effective capacity of 500 g·t.
Geotechnical centrifuge modeling works by creating in situ soil stresses on a reduced model scale but at higher centrifugal acceleration [42]. The similarity principle is shown in Equation (1).
ρ g h   =   ρ   ×   n g   ×   h / n
where ρ is the soil density, g is the gravitational acceleration, h is the prototype dimension, n g is the centrifugal acceleration, h / n is the model dimension, and n is the model scale. When the centrifugal acceleration increases to n g , the in situ stress becomes equal for both the reduced-scale model and full-scale prototype. Table 1 shows the similarity relationship between the model and prototype.
The arrangement of the suction anchors for the centrifugal model test is shown in Figure 2. The pulling angles were set to 90°, 69°, and 51°, respectively, to investigate the influence of loading direction on the bearing capacity and failure behaviors of the suction anchors. In the 90° vertical pulling test, the loading position was at the top center of the suction anchor to maintain coaxial with the anchor body. The optimal loading point is at the lower part for suction anchors subject to horizontal or inclined load. Therefore, the loading position was 160 mm from the bottom of the suction anchor in the 69° and 51° inclined pulling tests, which differed from the vertical pulling test. Since the suction anchors’ displacement values were much smaller than the cable length, the loading angle change was relatively small and considered negligible in the inclined pulling test.
In the centrifugal model test, a relatively small model scale is helpful, as this can improve the test’s accuracy. Therefore, a model scale of n = 50 was chosen based on various factors, including the structural characteristics of the suction anchors, the size of the model box, the pulling angle, the space demands of the loading device, and the boundary conditions. The centrifuge acceleration was set to 50 g according to the similarity principle. The parameters of the prototype and the model suction anchor are shown in Table 2. The model anchor was a thin-walled cylinder with a diameter of 80 mm and a thickness of 0.8 mm. The top was closed with a reserved small hole for vacuum pumping, and the bottom was open, as shown in Figure 3a. The cable was attached to the anchor top or body through a padeye.

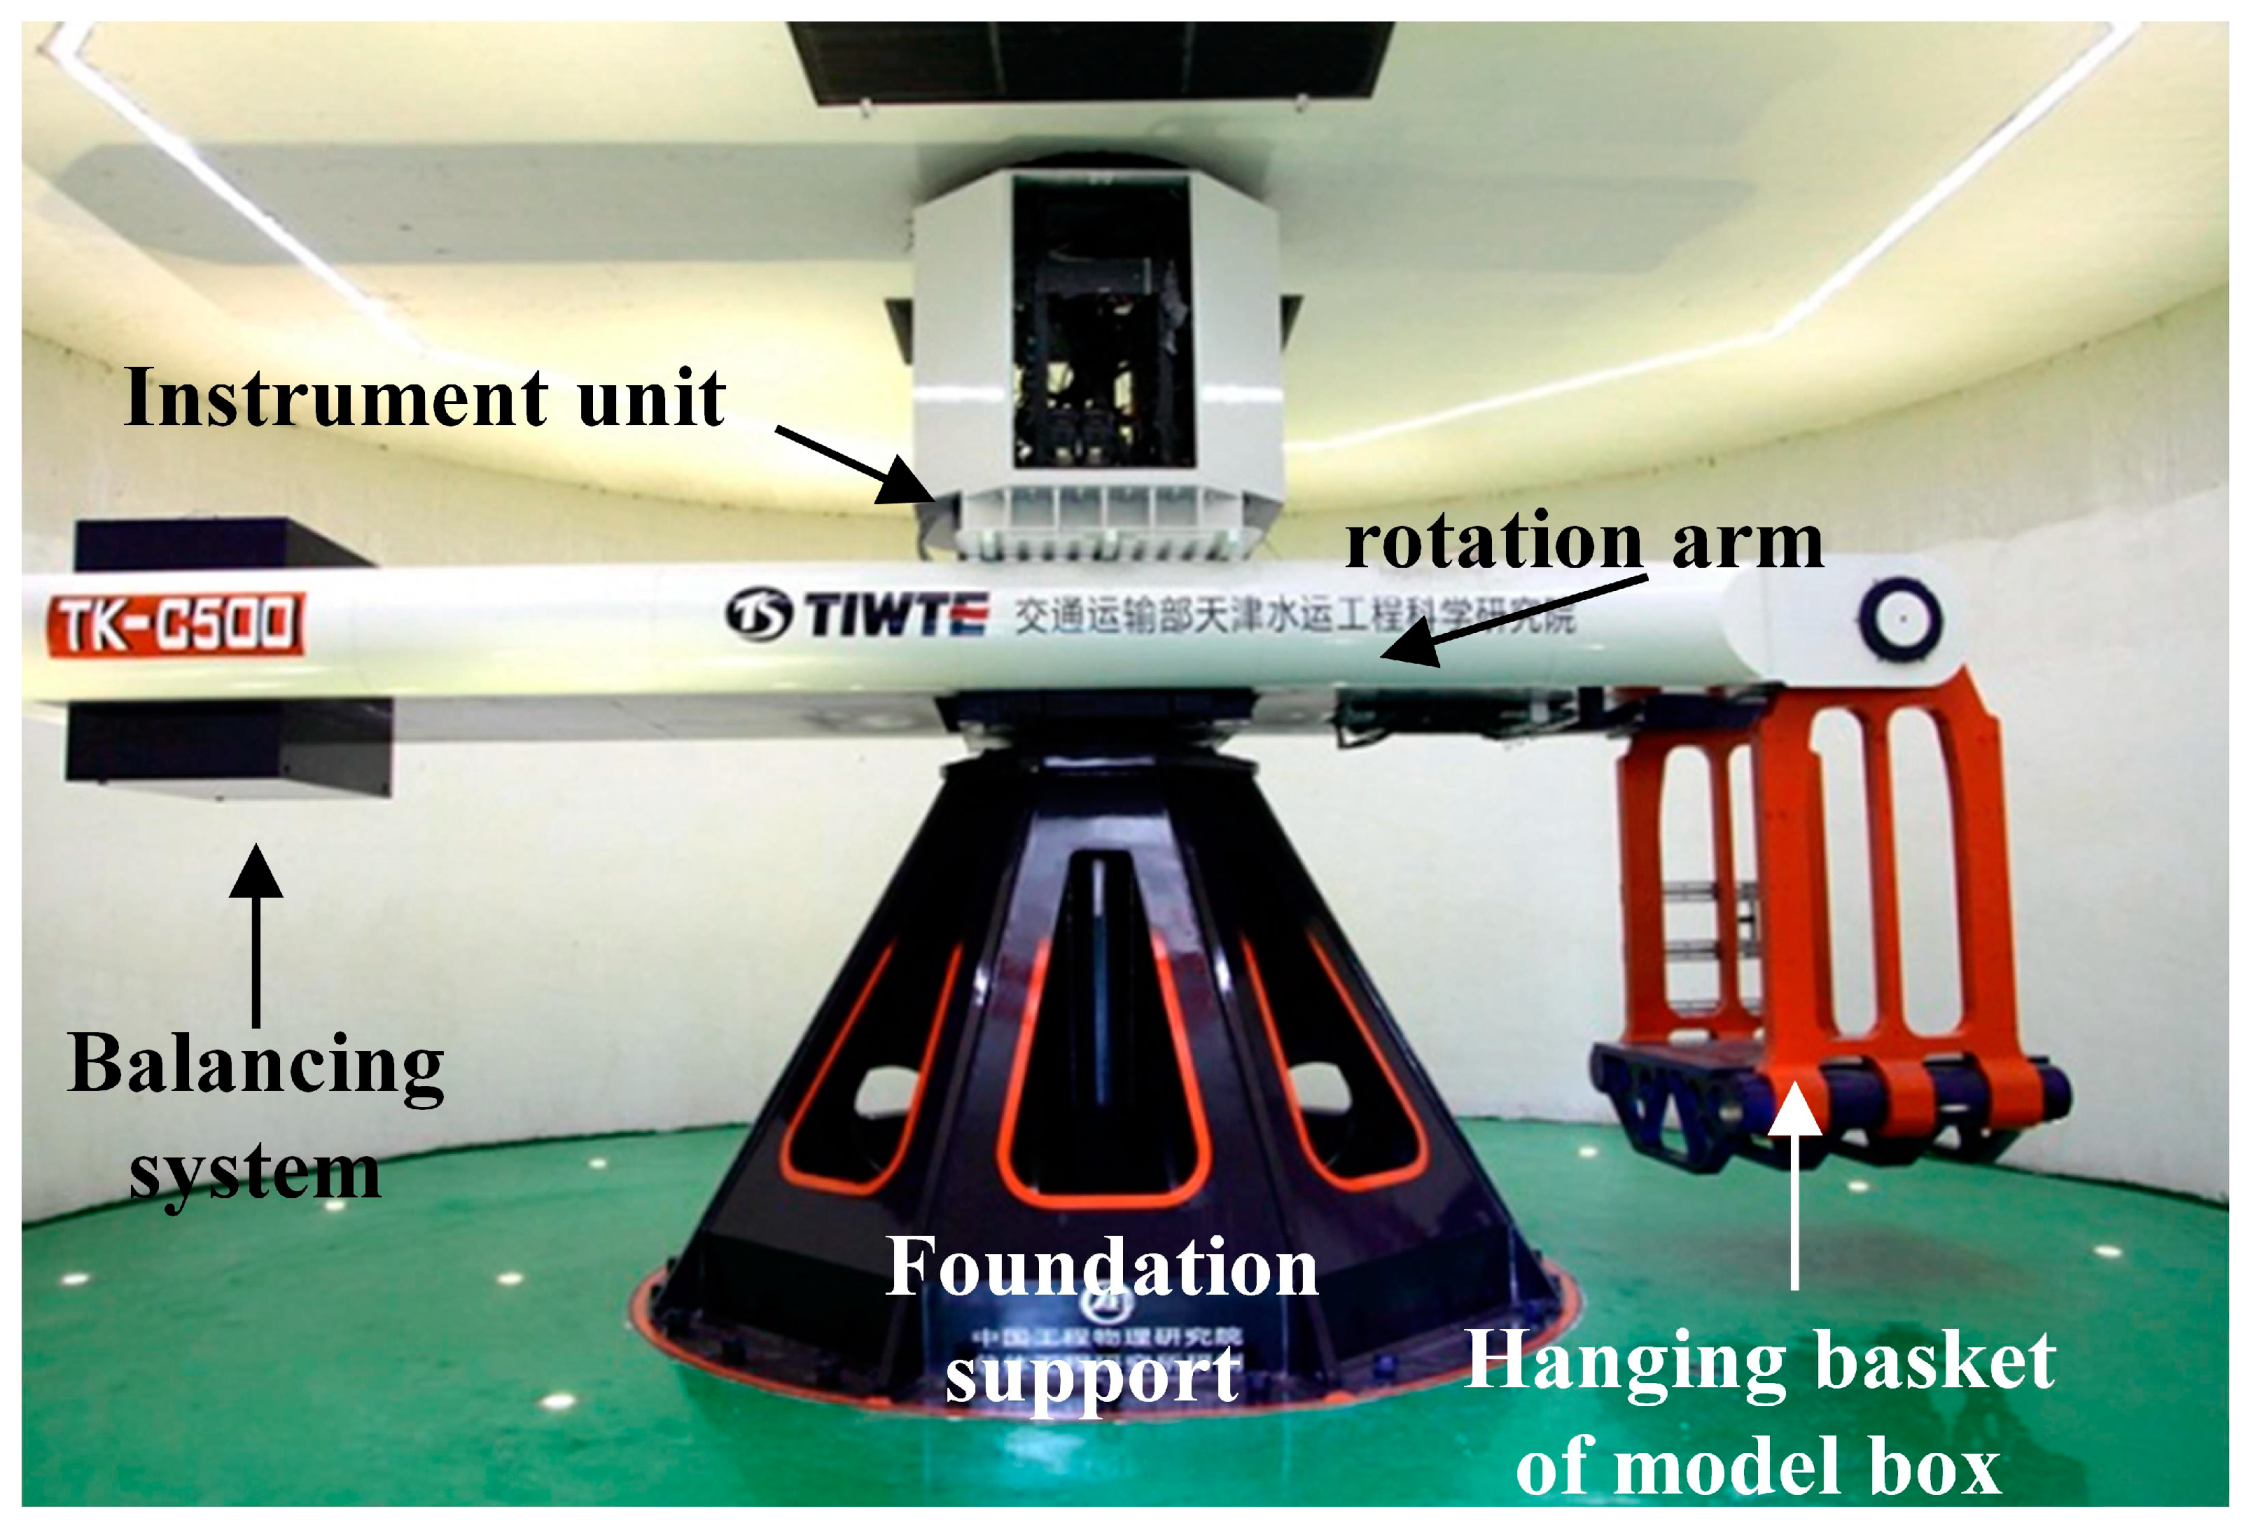
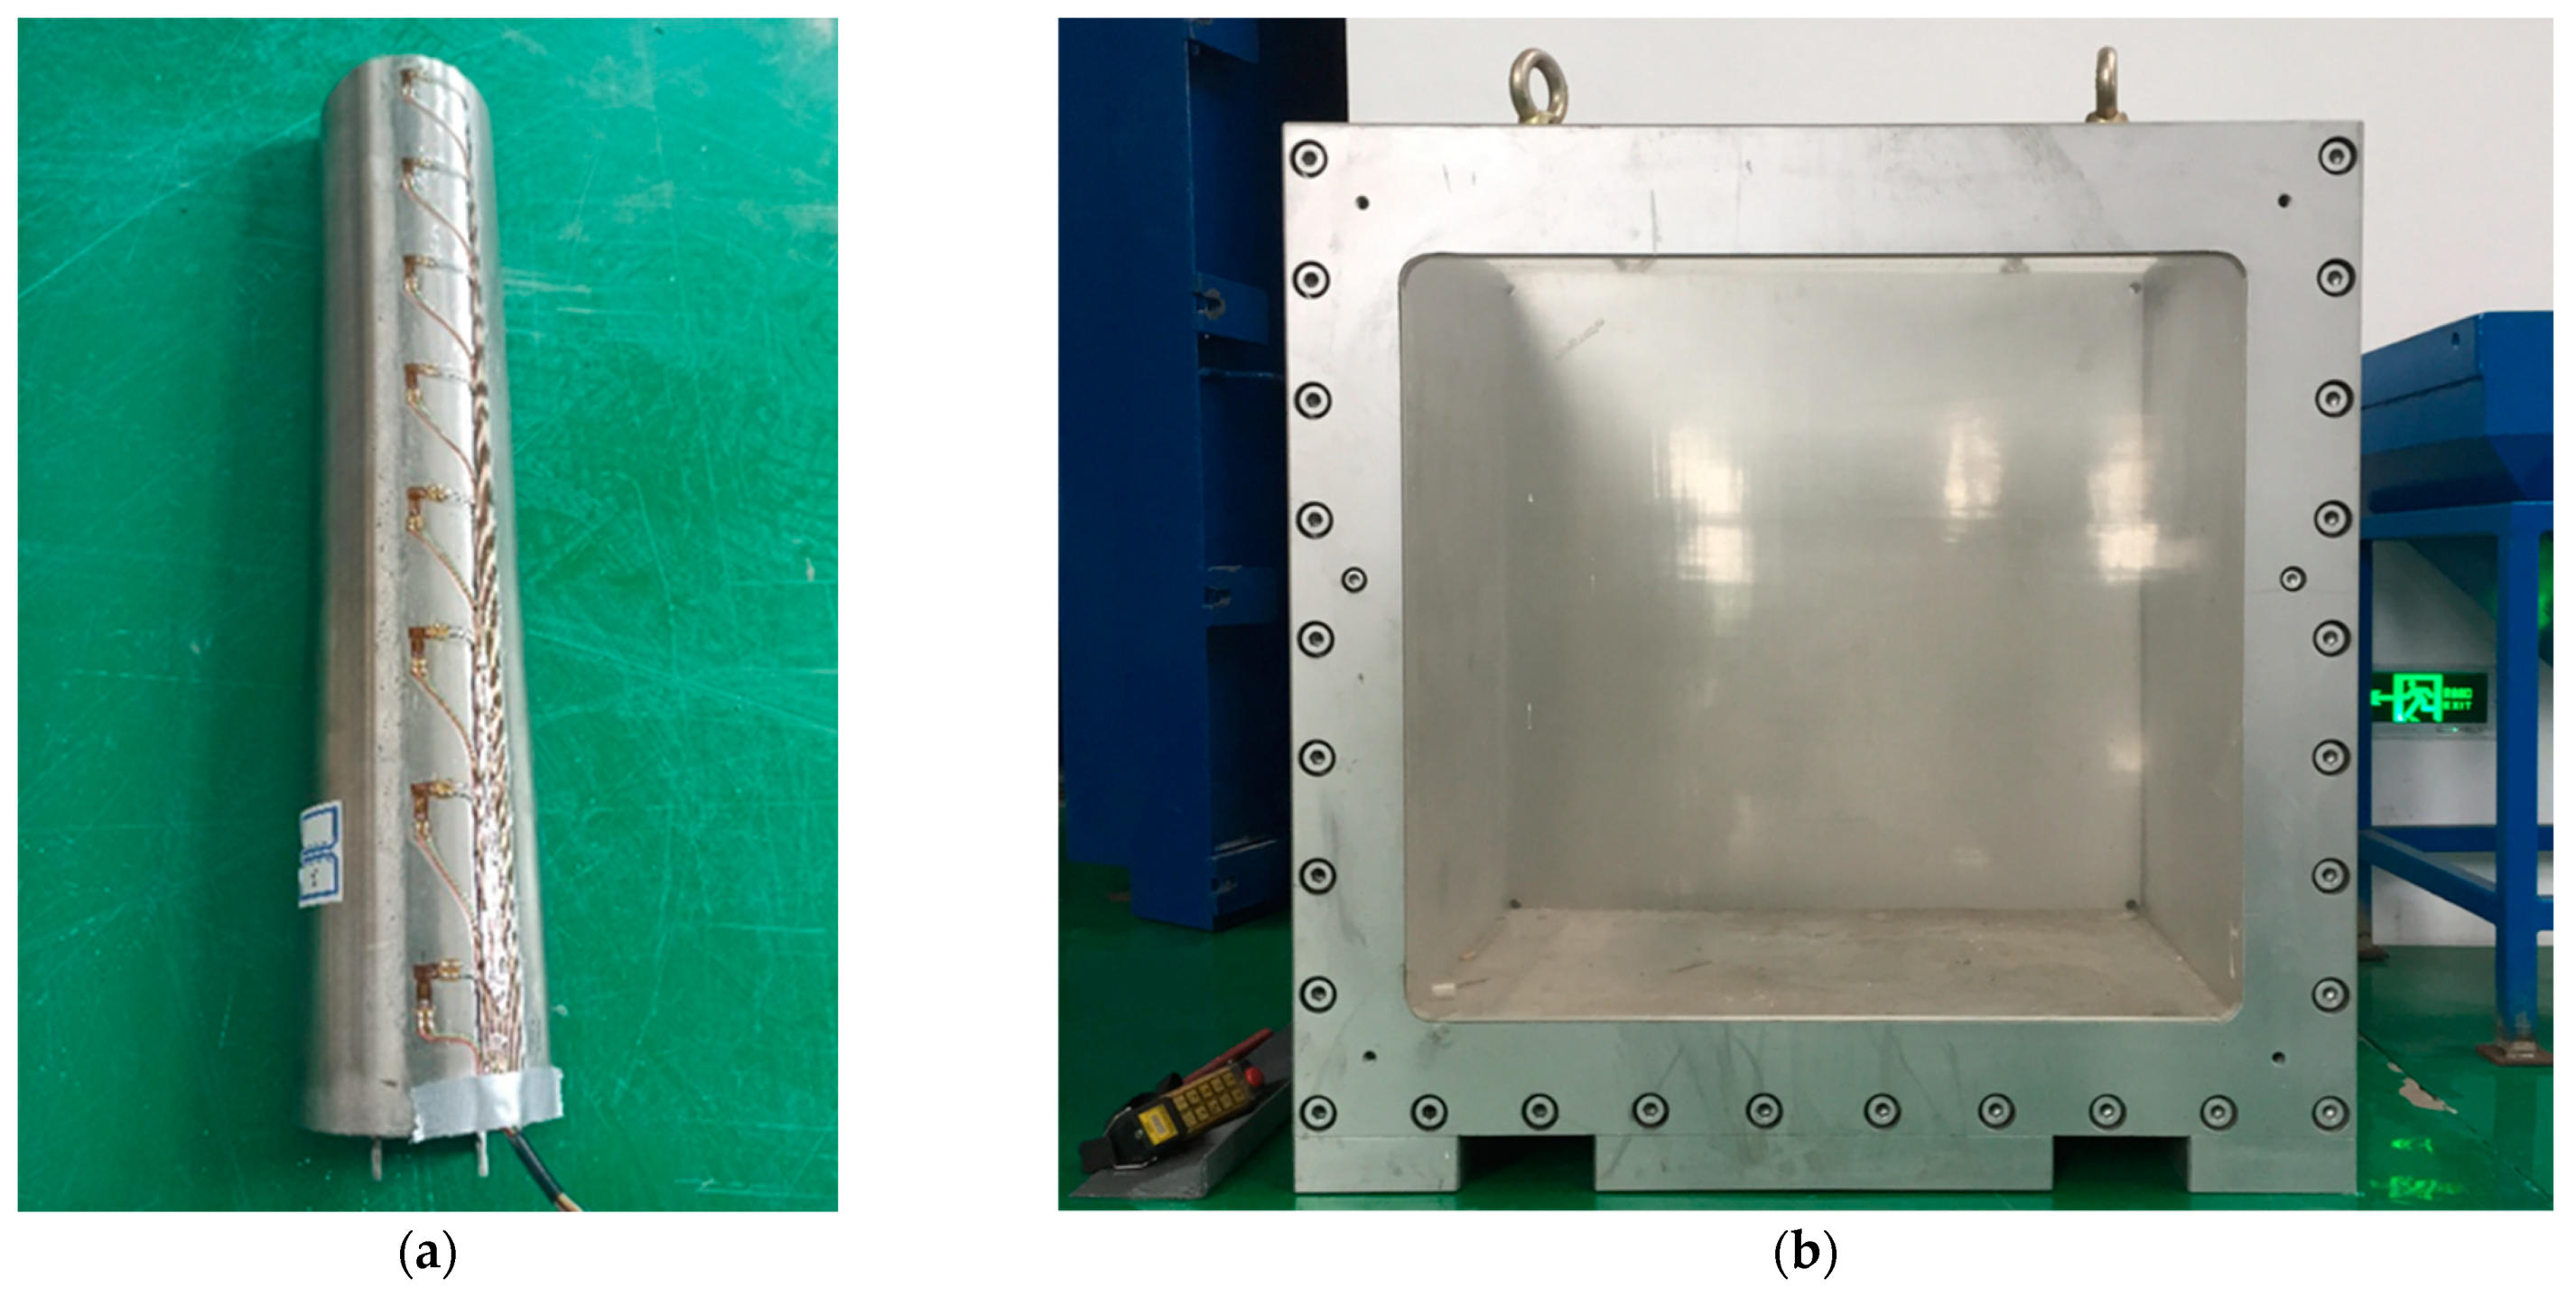
2.2. Test Equipment and Preparation

In the test, the model box had a bottom size of 1000 × 1000 mm, and the simulated range was 50 × 50 m, according to the model scale of n = 50. The thickness of the model soil was 700 mm, and the simulated seabed depth was 35 m. The model box is shown in Figure 3b.
The pressure cells were used to measure the soil pressure around the suction anchor. For the suction anchor experiencing inclined pulling, two groups of pressure sensors were arranged on each side of the anchor, with a vertical arrangement of six sensors per group. The pressure cell distribution is shown in Figure 4. Considering the horizontal movement of the suction anchor, the front pressure cells may be disturbed by the anchor body in the loading process. Hence, the front pressure cells were arranged with larger spacings to deal with the impact of anchor movement. The cable was made of steel wire rope, and a strain gauge unit measured the cable force.
The low-strength muddy clay seabed model was made of kaolin. The vane shear test was used to evaluate the consolidated soil strength. The test results (Figure 5) showed that the undrained shear strength of the surface layer was about 10 kPa, and the strength at a depth of 400 mm nearly reached 50 kPa. The soil strength distribution in the model is shown in the following formula:
S u   =   S u 0   +   k z
where S u is the undrained shear strength, kPa; S u 0 is the undrained shear strength of surface soil (the average linear fitting value of four groups’ test data is S u 0 = 8.75   k P a ); k is the strength gradient (the average linear fitting value of four groups’ test data is k = 0.935   k P a / m ); z is the soil depth, m.
The sinking process of the suction anchor was simulated to reflect its natural working state. The reserved hole on the top of the suction anchor was connected to the vacuum pump via a rubber pipe. The negative pressure caused by the vacuum was applied to the suction anchor. Then, the suction anchor gradually sunk into the clay to the predetermined position, as shown in Figure 6.
A camera was arranged on the top side of the model box, as shown in Figure 7, to capture the motion pattern and failure behaviors of the suction anchor in the loading process. Tension sensors were set at the bottom of the loading device to test the pulling load. The loading device was directly connected to the suction anchor through the cable in the vertical pulling test. The pulley was used to guide the cable tensioning direction in the inclined pulling test, as shown in Figure 7.

2.3. Geotechnical Centrifuge Operation and Model Loading

The geotechnical centrifuge was started after the installation of the test device. The gravity acceleration of the model was gradually increased to 50 g. Once all sensor data were stable under 50 g acceleration, the pulling test of the suction anchors was conducted. Then, a fixed speed load of 0.06 mm/s was applied to the suction anchor. The tensioning force of the cable and horizontal soil pressures around the inclined pulling suction anchors were constantly monitored in the loading process. The loading stopped until the suction anchors reached the maximum bearing capacity and showed a slowly stable decrease in bearing capacity. Finally, the monitoring equipment and the geotechnical centrifuge were closed and the model test was completed.

3. Loading Failure Process and Mechanical Behavior of Suction Anchor

3.1. The 90° Vertical Pulling Test

This paragraph describes the behavior of a suction anchor that has been subjected to a 90° vertical pulling load. The anchoring force and displacement of the suction anchor are shown in Figure 8. Initially, the anchoring force was 0 when the anchor cable was relaxed. Then, the anchoring force increased rapidly with the loading displacement after the cable was tensioned. The anchoring force increased linearly when it was within 70% of the maximum value. The average growth rate ∆F/∆D of the anchoring force was 0.194 kN/mm. Afterward, the force growth rate gradually declined. The rapid growth stage ended when the anchoring force reached 95% of the maximum value, with an average growth rate of 0.098 kN/mm. Then, the anchoring force gradually increased to the maximum value of 1.007 kN, and the vertical displacement reached 7.465 mm. The anchoring force slowly fluctuated and decreased after crossing the maximum value, which remained close to the maximum. Then, the anchoring force significantly declined to 0.987 kN, with an average rate of −0.019 kN/mm. Finally, the anchoring force showed a relatively stable and slow decline stage, with an average decline rate of −2.77 × 10⁻³ kN/mm. The suction anchor was gradually pulled out of the muddy clay soil at this stage, and the contact area between the anchor body and the soil decreased. Therefore, the anchoring force decreased until the suction anchor was pulled out of the soil and lost its bearing capacity.
According to the model similarity theory, the anchoring force of the prototype suction anchor can be calculated using the following equation. The maximum anchoring force of the prototype suction anchor was 2517.5 kN.
F P F M = n 2
where F P is the anchoring force of the prototype suction anchor, F M is the anchoring force of the model suction anchor, and n = 50 is the model similarity ratio.

3.2. The 69° Inclined Pulling Test

The anchoring force and displacement of the suction anchor under a 69° inclined load are shown in Figure 9. The reserved cable length between the loading device and suction anchor was insufficient. The muddy clay soil was secondarily consolidated with high gravity while the centrifuge accelerated to 50 g. The muddy clay soil and suction anchor showed secondary settlement and caused cable tensioning. Consequently, the initial anchoring force was not zero but 0.069 kN during the loading process. Upon the application of the pulling load, the anchoring force increased rapidly to the maximum value of 1.181 kN, with an average growth rate of 0.142 kN/mm. The anchoring force of the prototype suction anchor, calculated using Equation (3), was 2952.5 kN. Afterwards, the anchoring force fluctuated with the increase in displacement. It approached the maximum value until the bearing capacity began to decrease. Then, the anchoring force showed a significant decline stage, with an average rate of −9.22 × 10⁻³ kN/mm. Finally, the anchoring force experienced a slow decline stage, and the average rate was −0.00169 kN/mm. The bearing capacity decreased with the decrease in contact area between the anchor and muddy clay.

3.3. The 51° Inclined Pulling Test

Figure 10 shows the anchoring force and displacement of the suction anchor under a 51° inclined load. The cable was initially relaxed and buried in the muddy clay soil and gradually reached the tension state, overcoming the soil resistance. The anchoring force was small in the early stage of the pulling test. Then, the pulling load was transferred to the suction anchor after the cable was tensioned. The anchoring force increased rapidly to 95% of the maximum value, with an average growth rate of 0.108 kN/mm. The growth rate of the anchoring force was slightly lower at an earlier time of the rapid growth stage, mainly because the cable in the soil had not been fully tensioned and straightened. After the cable was fully straightened, the anchoring force increased more rapidly with the displacement. Subsequently, the anchoring force fluctuated to the maximum value of 1.458 kN, and the converted force of the prototype suction anchor was 3645.0 kN. It differed from the other two tests in that the anchoring force did not significantly decline after reaching the maximum value while displaying a slow decline stage directly with an average rate of −2.05 × 10⁻³ kN/mm.

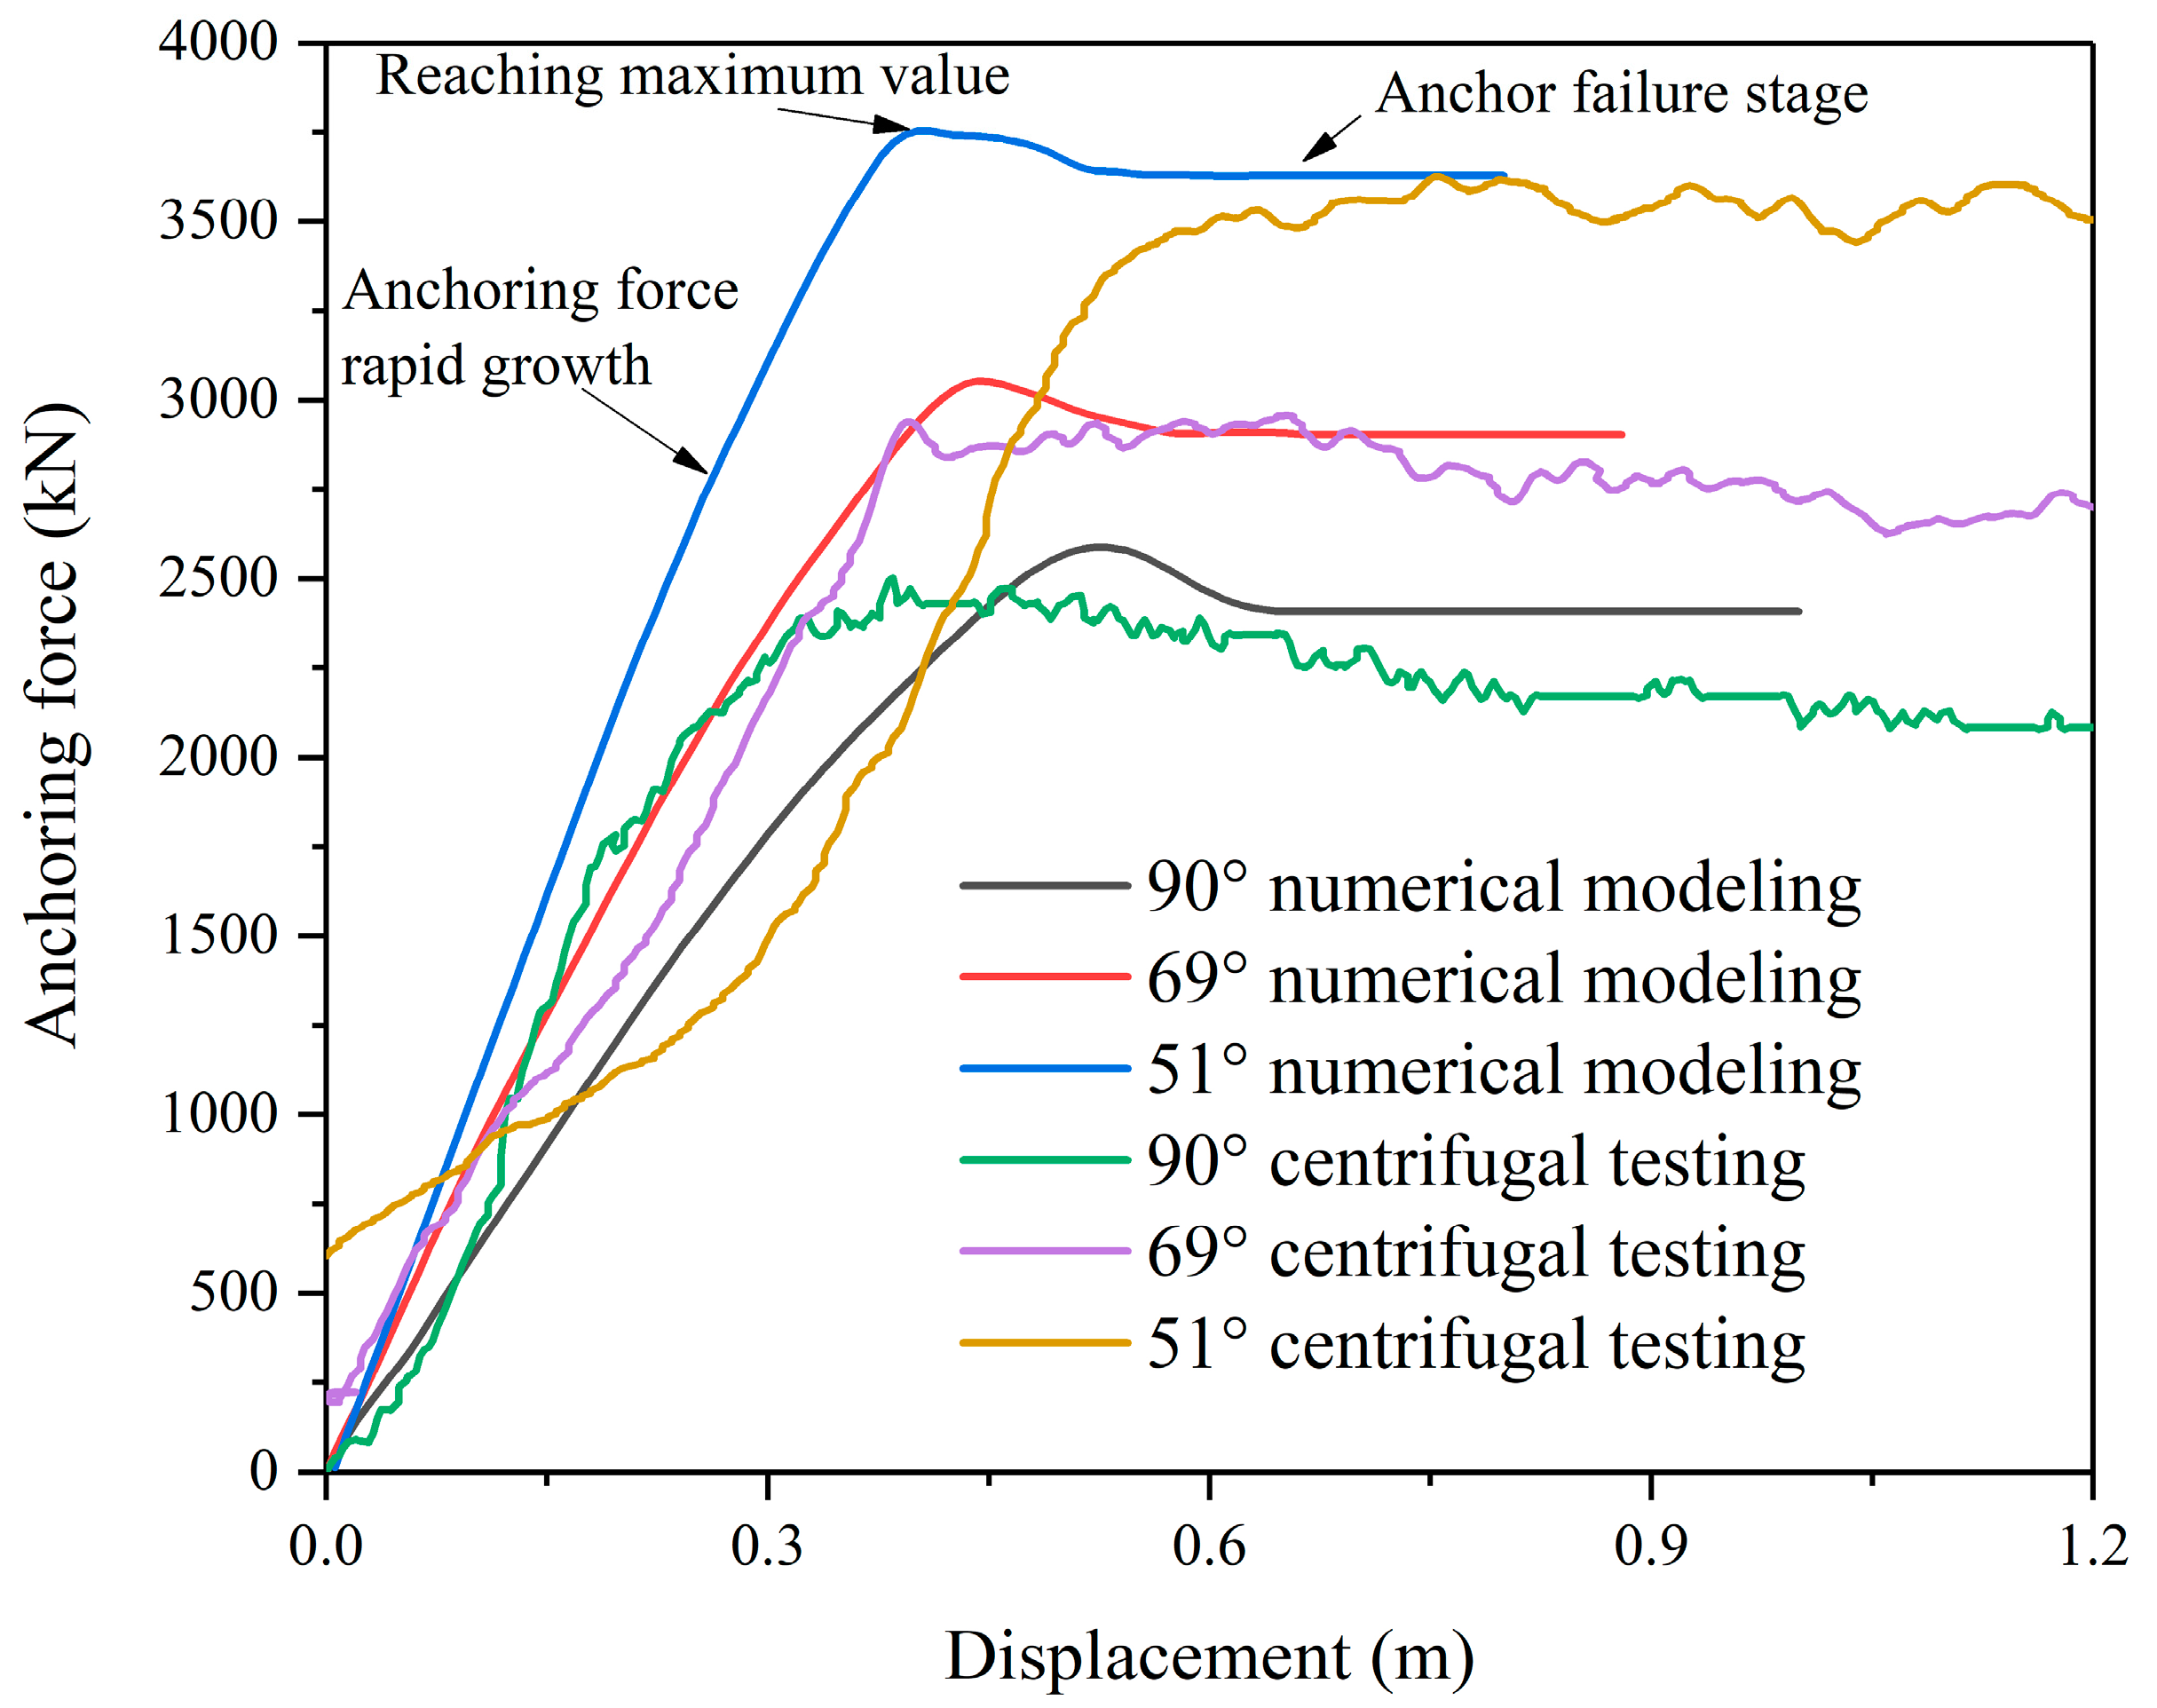
3.4. Influence of Loading Direction on Bearing Capacity of Suction Anchor

Comparing the test results, it is evident that the loading direction significantly impacts the bearing capacity of the suction anchor. The maximum anchoring force of the model and prototype suction anchors in each test is shown in Table 3.
For the prototype suction anchor, the bearing capacity in the 69° inclined pulling test was 435.0 kN larger than that in the vertical pulling test, which showed an increase of 17.3%. Moreover, the bearing capacity of 51° pulling was 1127.5 kN larger than that in the vertical pulling test, which showed an increase of 44.8%. The bearing capacity of the suction anchor increased, with the loading direction tending to be horizontal. When subjected to an inclined pulling load, the bearing capacity of the suction anchor was significantly improved due to horizontal soil pressure. The lateral soil pressure’s contribution to the bearing capacity increased with the decrease in loading angle. Therefore, when the suction anchor is subjected to an inclined pulling load, the horizontal soil pressure is critical to the interaction between the suction anchor and the muddy clay soil.

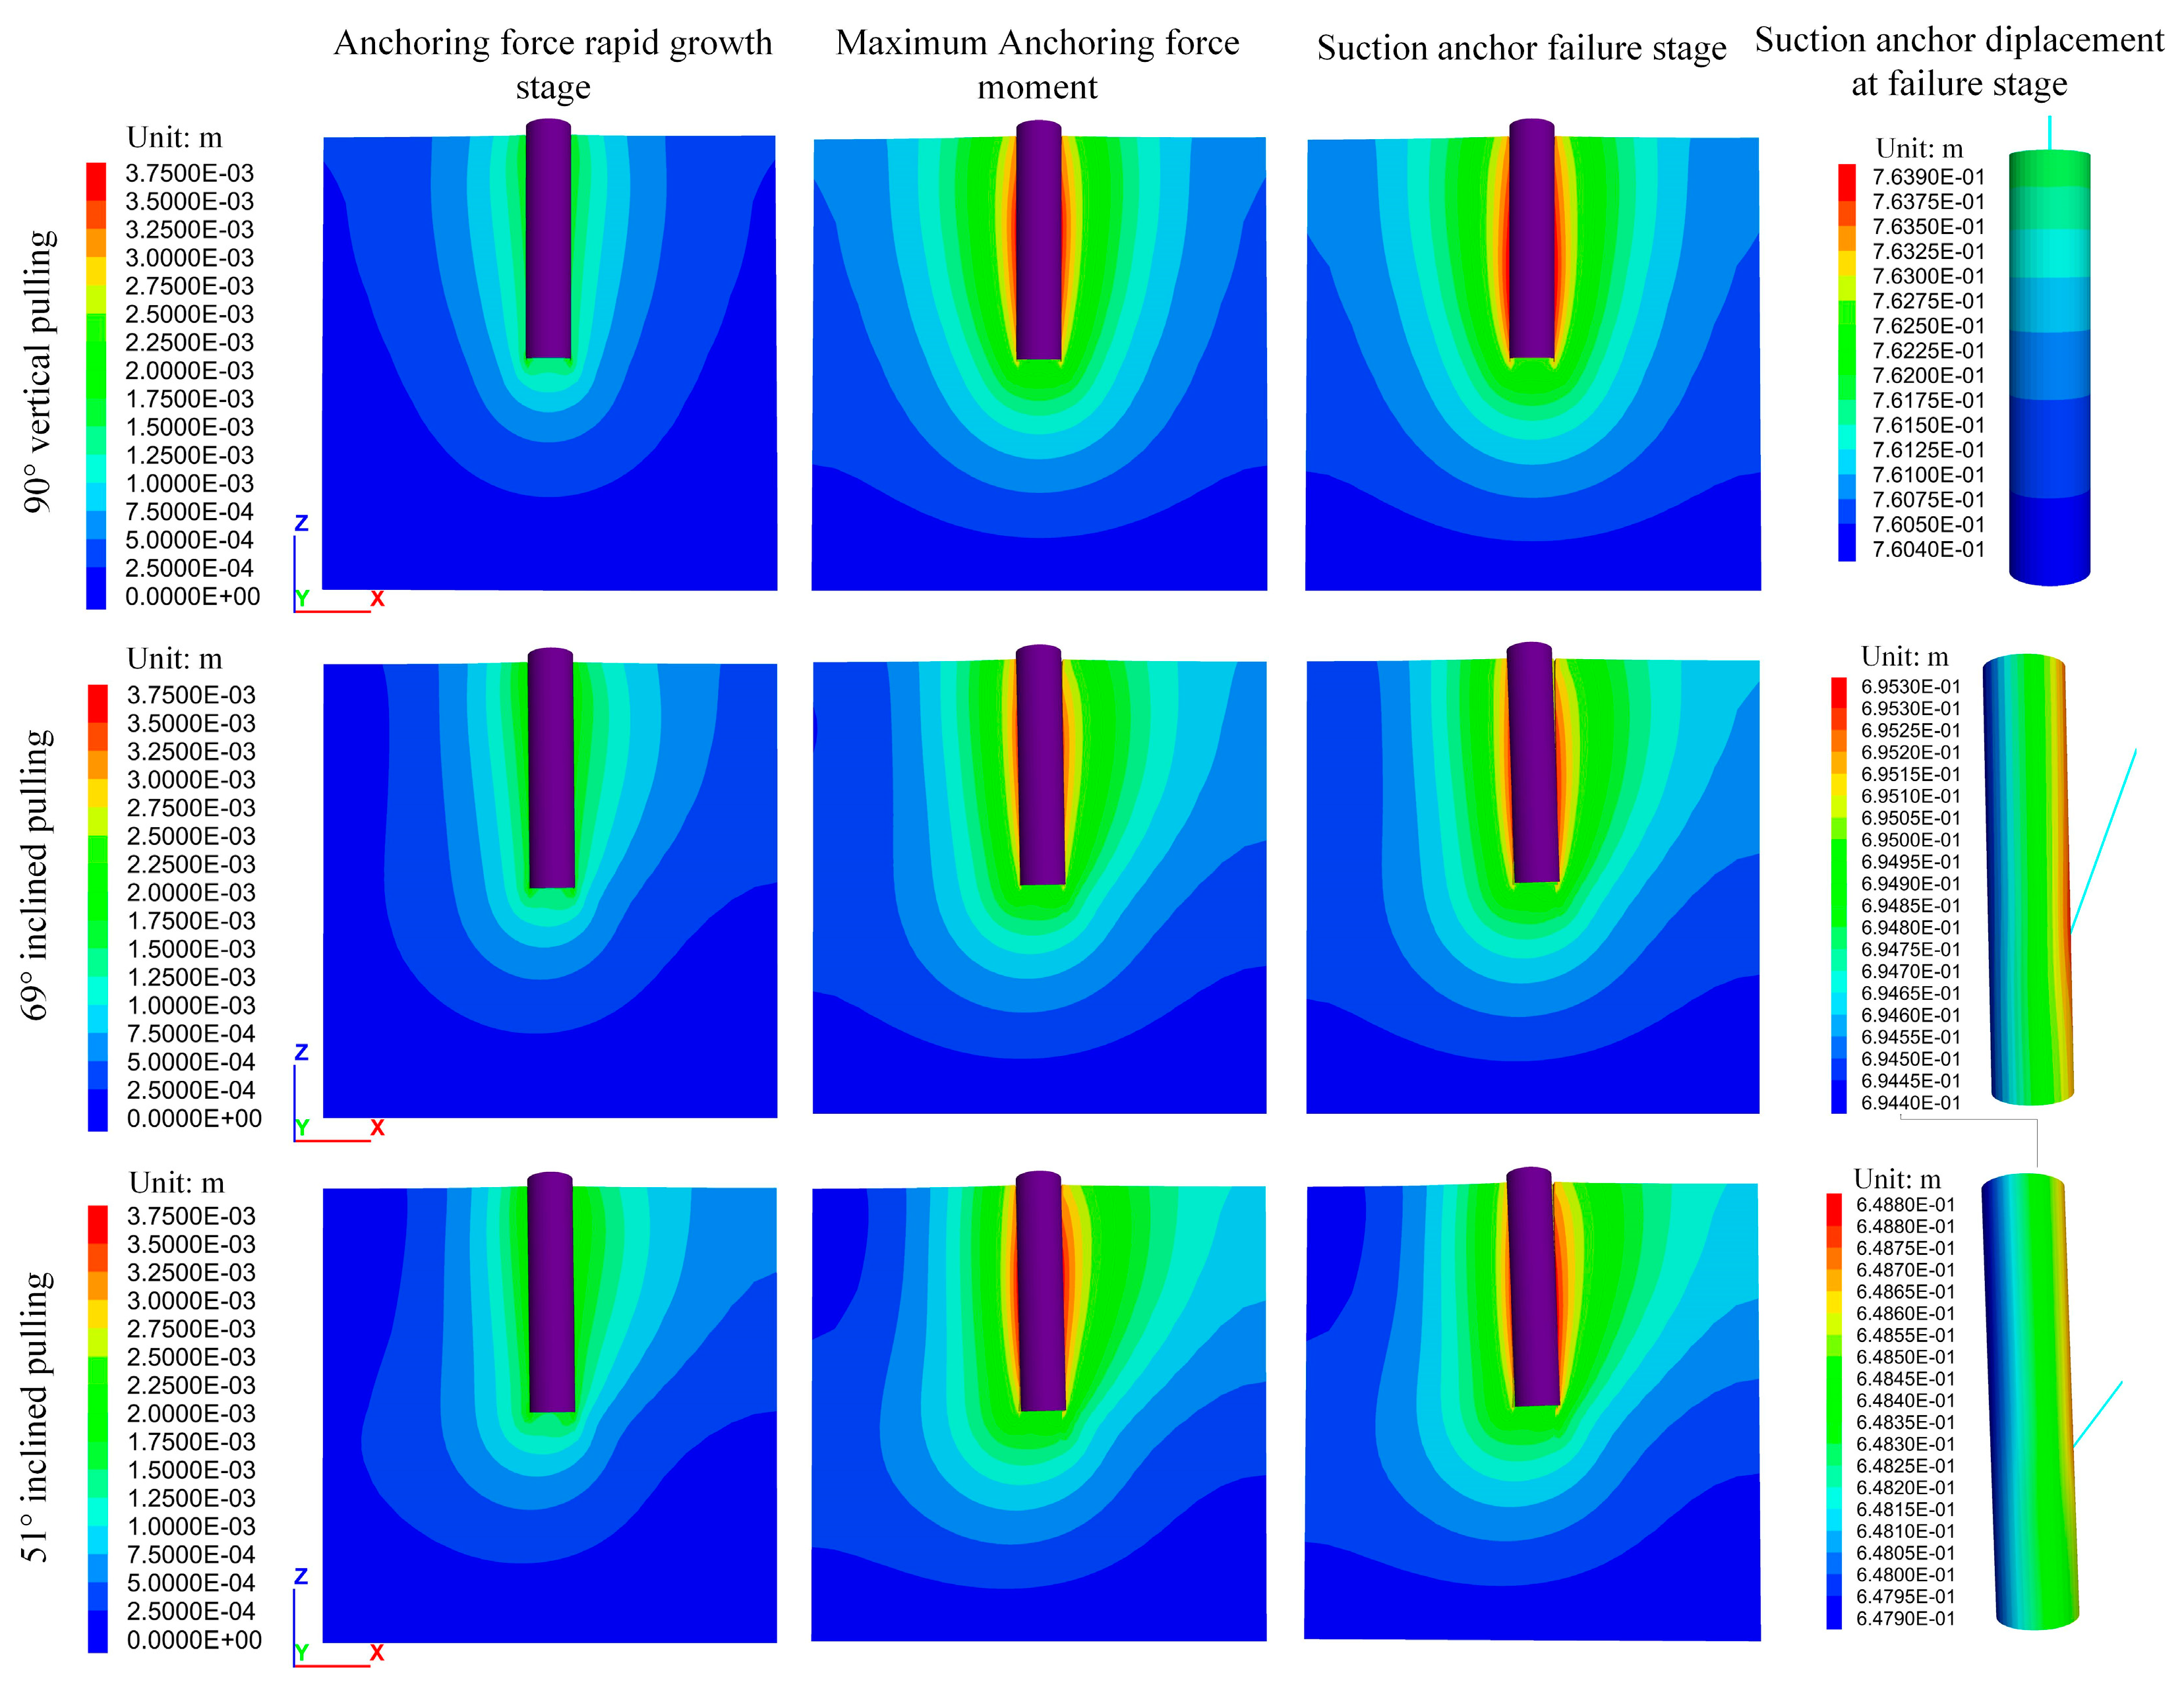
3.5. Numerical Modeling on the Prototype Suction Anchor Used in the Centrifugal Model Test

The 3D finite difference software based on fast lagrangian analysis of continua, FLAC3D, was used for the numerical modeling of the prototype suction anchor. The model was created with 60,925 zones and 66,540 grid points, and its meshing and geometry shown in Figure 11. The x–y–z dimensions of the model were 40 m, 40 m, and 40.5 m, respectively. The normal displacements of the lateral boundaries were fixed, and the x-y-z displacements of the bottom boundary were fixed. The suction anchor was installed in the model’s center along the z-axis. The Mohr-Coulomb constitutive model was used for the muddy clay soil, and the Elastic constitutive model was used for the suction anchor. The Interface Elements built into the FLAC3D software were used to model the contact surface between the suction anchor and the soil, which can be sheared and slid. The cable structure elements (cableSELs) were used to model the cable in the test. The parameters of the muddy clay soil and suction anchor are shown in Table 4.
According to the similarity principle, the prototype suction anchor’s numerical results can be compared to the prototype results converted from the test [13,37]. The anchoring force and displacement of the prototype suction anchor can be obtained from the test results based on the similarity relationship shown in Table 1. The load–displacement curves obtained from centrifugal model tests and numerical simulations are compared in Figure 12. The numerical results demonstrated that the initial anchoring force increased linearly with loading. The growth rate of anchoring force decreased with continuous loading, and the suction anchor gradually reached the maximum bearing capacity. Subsequently, the anchoring force significantly declined until it reached a stable stage, indicating that anchoring failure had occurred. The load–displacement characteristics were consistent between the testing and numerical results. There was a rapid growth stage of anchoring force, a slower increasing stage, a significant decline stage after reaching the maximum value, and a relatively stable stage, with anchoring failure in both curves. The bearing capacity obtained from the centrifugal test and numerical simulation showed the same trend as the variation in the loading angle. The maximum anchoring force of the testing results was close to the numerical results, with the same loading angle. The above results showed that the centrifugal testing results are consistent with the numerical modeling results. Therefore, the centrifugal testing results are reliable.
Figure 13 and Figure 14 show the vertical and horizontal displacement of the muddy clay soil and suction anchor during the loading process. The soil displacement during the 90° vertical loading presented a symmetrical distribution. As the anchoring force increased, the soil mainly moved vertically, and the soil closer to the suction anchor experienced greater displacement. The soil exhibited significant vertical displacement, with the anchoring force reaching the maximum value. After that, the soil displacement showed slight increases as the anchor entered a failure state. This indicates that the soil could no longer provide sufficient resistance for the suction anchor. During the 90° loading process, the horizontal displacement of the soil was minimal. While loading to failure, the vertical displacement of the suction anchor was much greater than that of the soil. This suggests that the contact surface between the suction anchor and the soil underwent slip failure. In the 69° loading model, the soil displacement in front of the suction anchor (the right side) was more significant than the rear. The soil displacement rapidly increased until the anchoring force reached its maximum value. Afterward, the soil displacement developed slightly as the suction anchor was loaded to failure. Compared to the 90° loading, the vertical displacement decreased while the horizontal displacement increased. The vertical displacement of the suction anchor was significantly greater than the soil’s. The movement of the suction anchor was characterized by pulling upward to sliding and slight forward and slight backward rotation. In the 51° loading model, the asymmetric displacement distribution was further enhanced. The soil displacement showed rapid accumulation, with the anchor loading to its maximum bearing capacity. Then, the horizontal deformation of soil continued to increase, while the vertical deformation increased less until reaching the failure stage. Compared to 69° loading, the vertical displacement of the suction anchor and soil in the same loading stage decreased while the horizontal displacement continued to increase. The suction anchor also showed a slight increase in inclination. It can be concluded that the failure deformation of the suction anchor with inclined loading is pulling upward to sliding, accompanied by slight horizontal displacement and inclined deformation.
The distribution of horizontal soil pressure (σxx) during the loading process is shown in Figure 15. The horizontal soil pressure barely changed in the 90° loading model because the suction anchor showed vertical sliding failure and had little squeezing effect on the soil. During the 69° loading, the soil pressure in front of the anchor increased significantly with the increase in loading force, while the back soil pressure decreased. This indicates that the horizontal movement of the anchor resulted in soil compression. There were slight changes in soil pressure during the loading from maximum anchoring force to the failure stage. The changing characteristics of soil pressure were similar in the 51° and 69° pulling processes, while the variation of soil pressure was more significant in the 51° loading model. This indicates that the anchor had a more significant squeezing effect on the soil in the horizontal direction. As the loading direction tended to be horizontal, the suction anchor compressed the soil laterally. This caused the horizontal pressure of the soil to increase, providing resistance for the anchor. As a result, the suction anchor could achieve a greater bearing capacity.

4. Interaction Mechanism between Suction Anchor and Soil

4.1. Mechanical Behaviors of Soil with Suction Anchor Loading

In this section, the interaction between the suction anchor and muddy clay will be analyzed based on the monitoring results of horizontal soil pressures in the inclined pulling tests of the suction anchors.
Figure 16 shows the monitoring results of horizontal soil stresses around the suction anchor in the 69° pulling test. The monitoring arrangement is shown in Figure 4. The development stages of the anchoring force in the 69° pulling process (as shown in Figure 9) are marked in Figure 16 by dotted lines for better comparisons. The suction anchor was loaded when the pressure sensor data stabilized. The soil pressures in front of the suction anchor dramatically increased to a peak value. The peak value coincided with the end of the anchoring force rapid growth stage. This phenomenon was related to the generation and dissipation of excess pore water pressure caused by soil compression.
The front soil pressures initially declined after exceeding the peak values and tended to differentiate at various measuring points. The soil pressures 30 mm in front of the suction anchor are shown in Figure 16a. The pressure at 57 mm depth exhibited a decline, followed by a slight increase, before ultimately stabilizing. The soil pressure at the depths of 114~285 mm declined briefly. Then, it increased, especially at depths of 114~171 mm, indicating that the soil was compressed forward and upward. Moreover, the soil pressure at 171 mm depth underwent significant changes due to the cable’s disturbance. The bottom soil pressure at 342 mm depth was the largest, but it decreased slightly after crossing the peak value and tended to stabilize. The increases in the top and bottom soil pressures were relatively small. It can be concluded that the top pressure was easily released to the free surface, and the pressure increase was inconspicuous. The displacement of the suction anchor also formed a free surface at the bottom, which caused the release of soil pressure. Therefore, the subsequent growth of the bottom soil pressure was minimal.
The horizontal soil pressures 80 mm in front of the suction anchor are shown in Figure 16b. The pressures at the depths of 57~285 mm slightly decreased after crossing the peak value and tended to stabilized. In general, the soil pressures showed an upward trend. The bottom pressure slightly decreased after exceeding the peak value, followed by an increase with the pulling process. Figure 16a,b showed that the front soil pressure was greatly affected by suction anchor pulling during the anchoring force rapid growth stage. The suction anchor’s influence on the soil pressure declined with increasing distance. The results also showed that the interaction between the suction anchor and muddy clay varied during the rapid growth stage and the subsequent stage of the anchoring force. The suction anchor compressed the soil and showed rapid anchoring force growth at the earlier loading time. At the same time, the soil pressures quickly reached peak values. However, the muddy clay soil produced plastic shear deformation with the movement of the suction anchor, causing soil stress redistribution.
The soil stress behind the suction anchor differentiated evidently with development. The soil pressures 20 mm behind the suction anchor are shown in Figure 16c. The soil pressure at 57 mm depth remained stable after an initial increase during the loading process. The soil pressure at 114 mm depth showed an initial increase, followed by stability, and then a slight decrease. The soil pressure at 171 mm depth showed the behaviors of increase–decrease–increase–stable, with minimal changes. The development trend of soil pressure at 228 mm depth was the same as that at 171 mm, but with more noticeable changes. The soil pressures at 285 mm and 342 mm depths showed significant differences. The soil pressures decreased rapidly in the anchoring force rapid growth stage. Then, it decreased slower until the end of loading.
The soil pressures 50 mm behind the suction anchor are shown in Figure 16d. The soil pressure developments were consistent with the pressures 20 mm behind the suction anchor (Figure 16c). The variation ranges of the soil pressures at 57~228 mm depths were minor, while the variation ranges of soil pressure at depths of 285 mm and 342 mm were nearly the same. The more accessible stress release near the bottom free surface caused this phenomenon while the suction anchor was pulled out of the muddy clay.
Figure 17 shows the horizontal soil pressures around the 51° pulling suction anchor. The development stages of the anchoring force in the 51° pulling process (as shown in Figure 10) are marked in Figure 17 by dotted lines for better comparisons. The cable was initially relaxed and gradually tightened with pulling. At this time, the cable would shear and compress the soil along the movement direction, causing an increase or local decrease in soil stress. Subsequently, the suction anchor moved forward and compressed the soil, which caused significant increases in soil pressures and a rapid growth stage for the anchoring force. The soil pressures differentiated with development during loading. Simultaneously, the anchoring force slowly increased to the maximum value. Figure 17a shows the soil pressures 30 mm in front of the suction anchor. The soil pressures at depths of 285 mm and 342 mm reached the peak values with the rapid growth of the anchoring force. Then, the soil pressure development was consistent with the 69° pulling test (Figure 16a). Nevertheless, the pressures at the 57~228 mm depths continued to increase in the fluctuation growth stage of the anchoring force, and there were no periodic peak values. Finally, the soil pressures increased slowly with the continuous loading of the suction anchor.
The horizontal soil pressures 80 mm in front of the 51° pulling suction anchor are shown in Figure 17b. The soil pressure developments were consistent with the test results 30 mm in front of the suction anchor. It should be noted that the soil pressures at 228~342 mm depths reached their peak values and then decreased. These soil pressure responses were related to the generation and dissipation of excess pore water pressure caused by soil compression. The excess pore water pressures in the upper range were small and easily dissipated. Therefore, the soil pressures at 57~171 mm depths increased rapidly at first and tended to increase slowly or stabilize with the continuous loading of the suction anchor.
The horizontal soil pressures 20 mm behind the suction anchor are shown in Figure 17c. The soil pressure at 57 mm depth increased slightly. This indicates that the suction anchor inclined backward, causing its upper part to compress the soil. The soil pressure at 114 mm depth decreased slightly with the pulling of suction anchor. The soil pressure at 171 mm depth showed a noticeable decrease, which was due to local stress release caused by the soil and anchor moving forward. The soil pressure at 228 mm depth showed a decrease–increase–decrease changing process. The soil pressure decreased to a minimum value with the rapid growth of the anchoring force in this process. At depths of 285 mm and 342 mm, the soil pressures exhibited a sharp decline in the anchoring force rapid growth stage. Then, the soil pressures decreased slowly with the continuous loading of the suction anchor.
Figure 17d shows the soil pressures 50 mm behind the suction anchor. The loading suction anchor barely affected the soil pressures at 57~171 mm depths. Nevertheless, the soil pressures at 228~342 mm depth were affected and showed similar responses. The bottom soil pressures decreased significantly with the suction anchor moving forward. At the same time, the anchoring force increased rapidly. The pressure variations were less than those observed 20 mm behind the suction anchor.

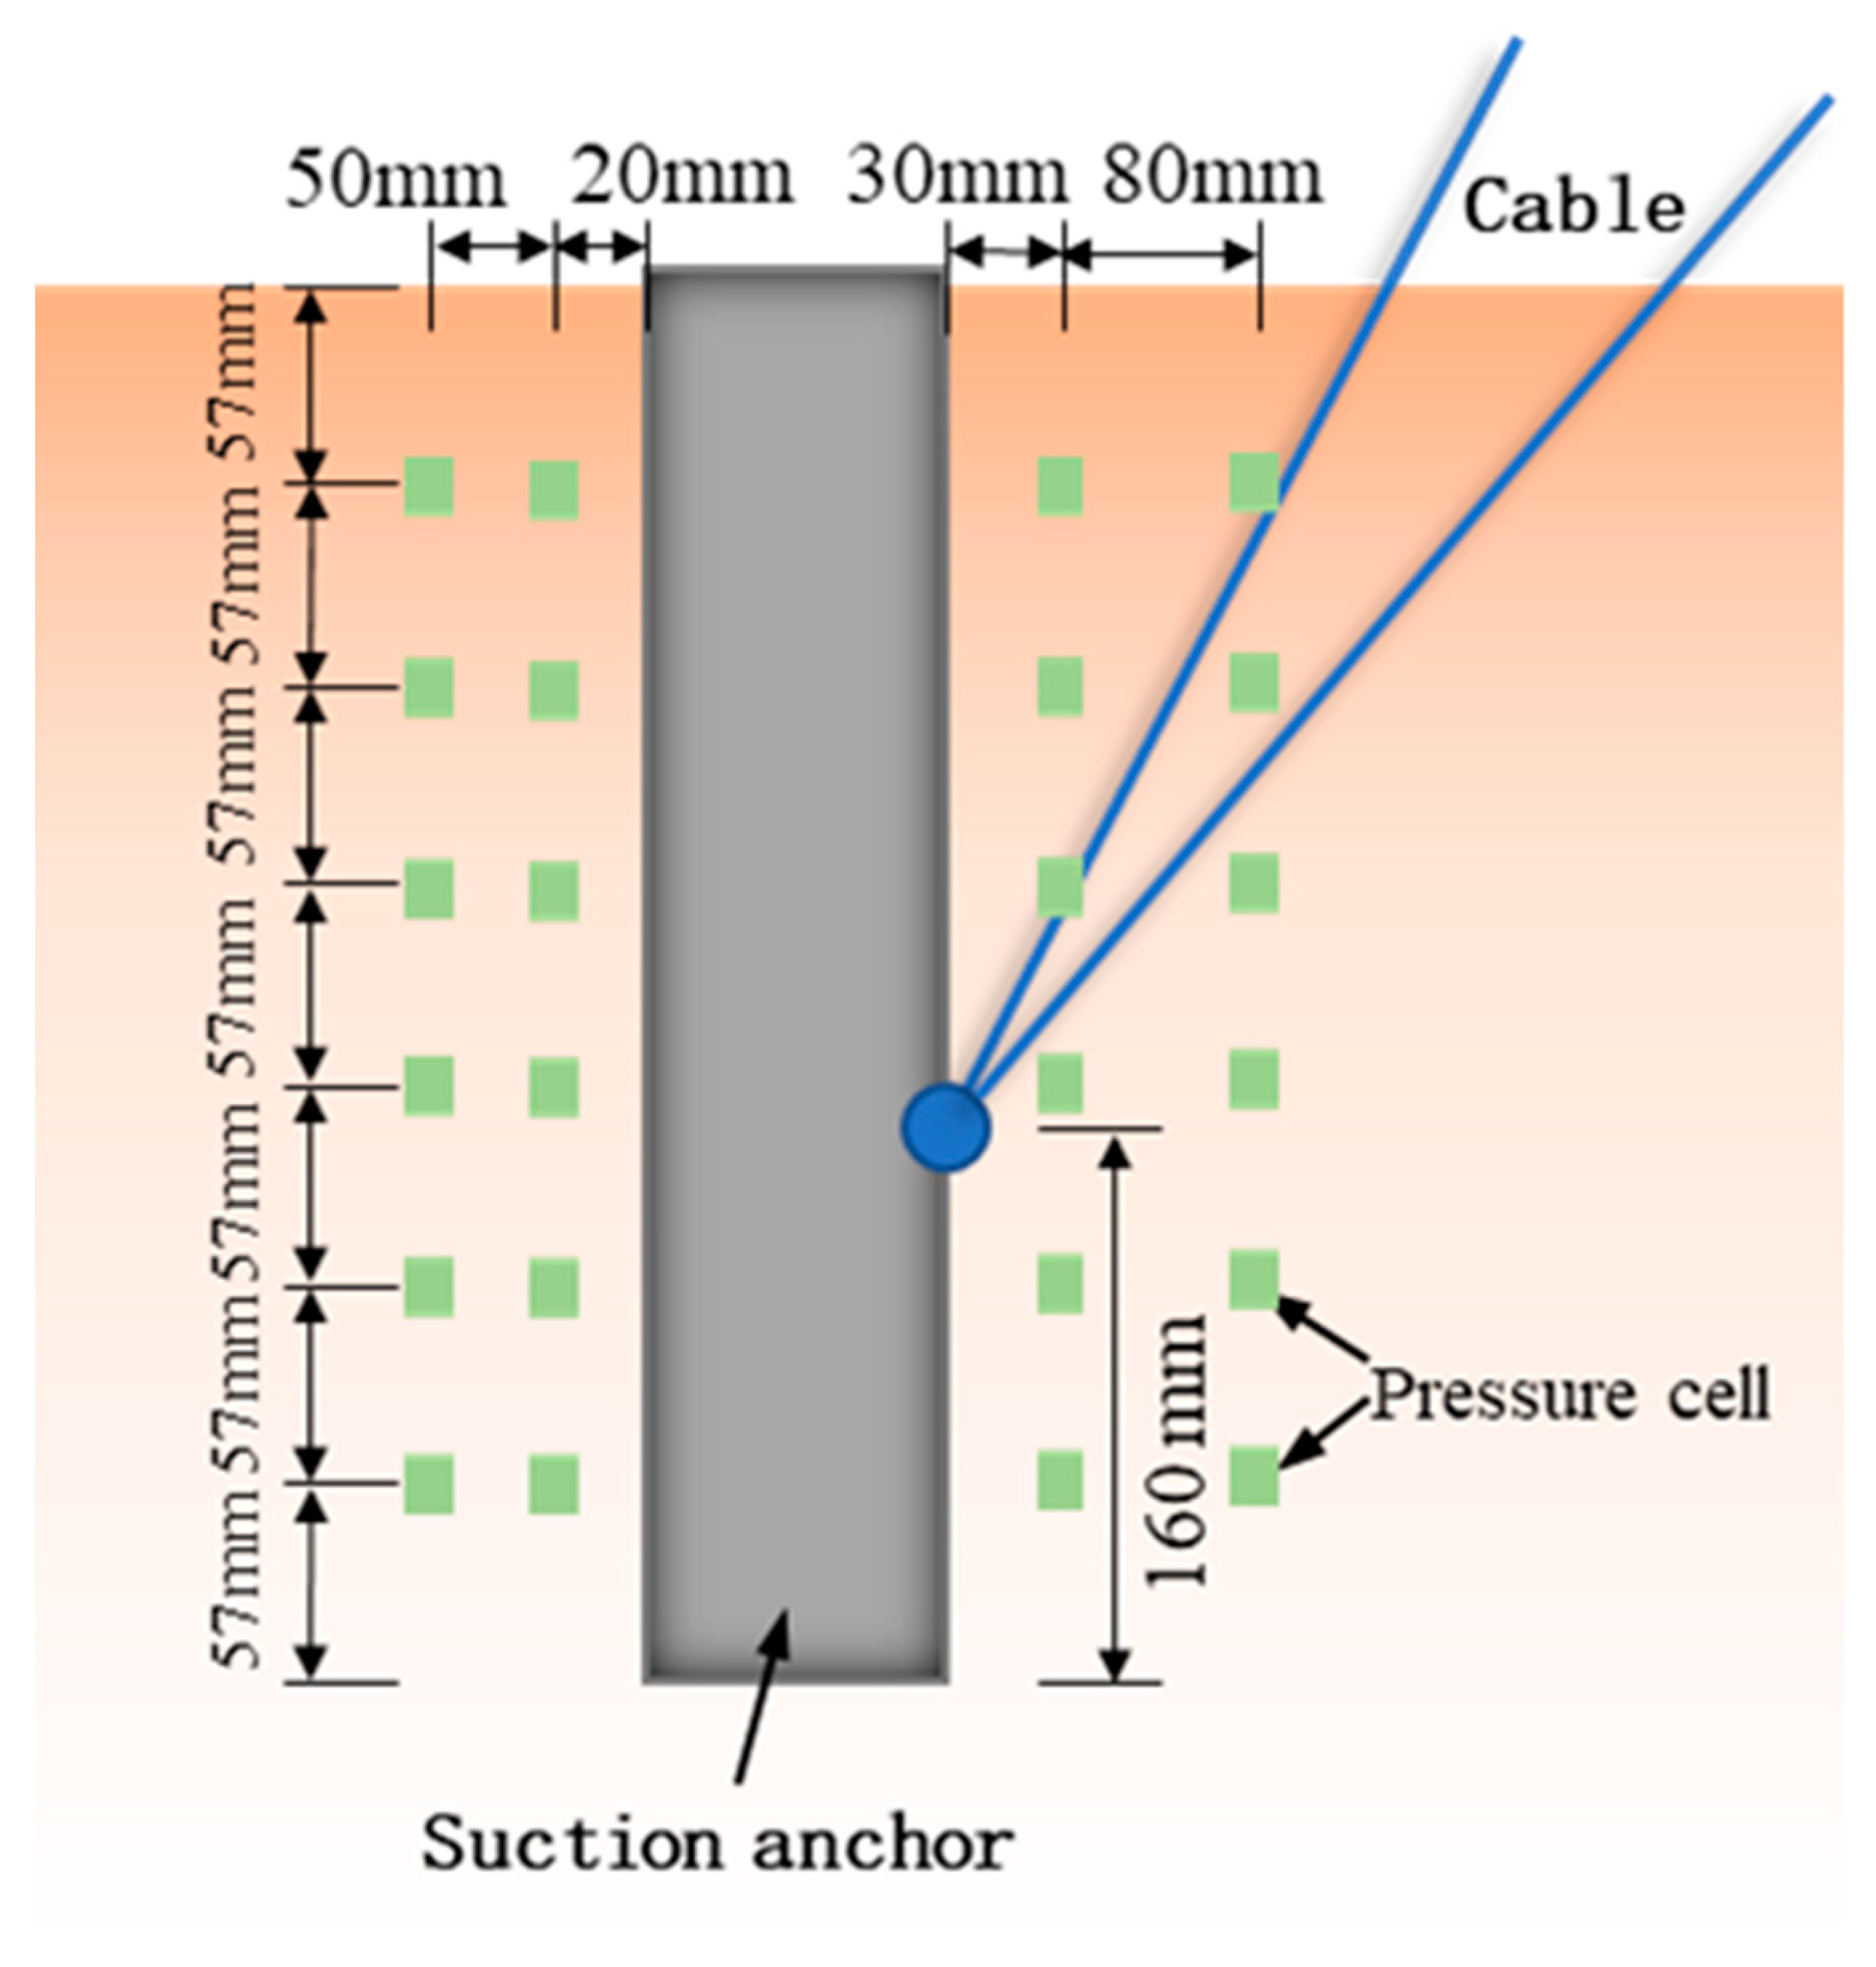
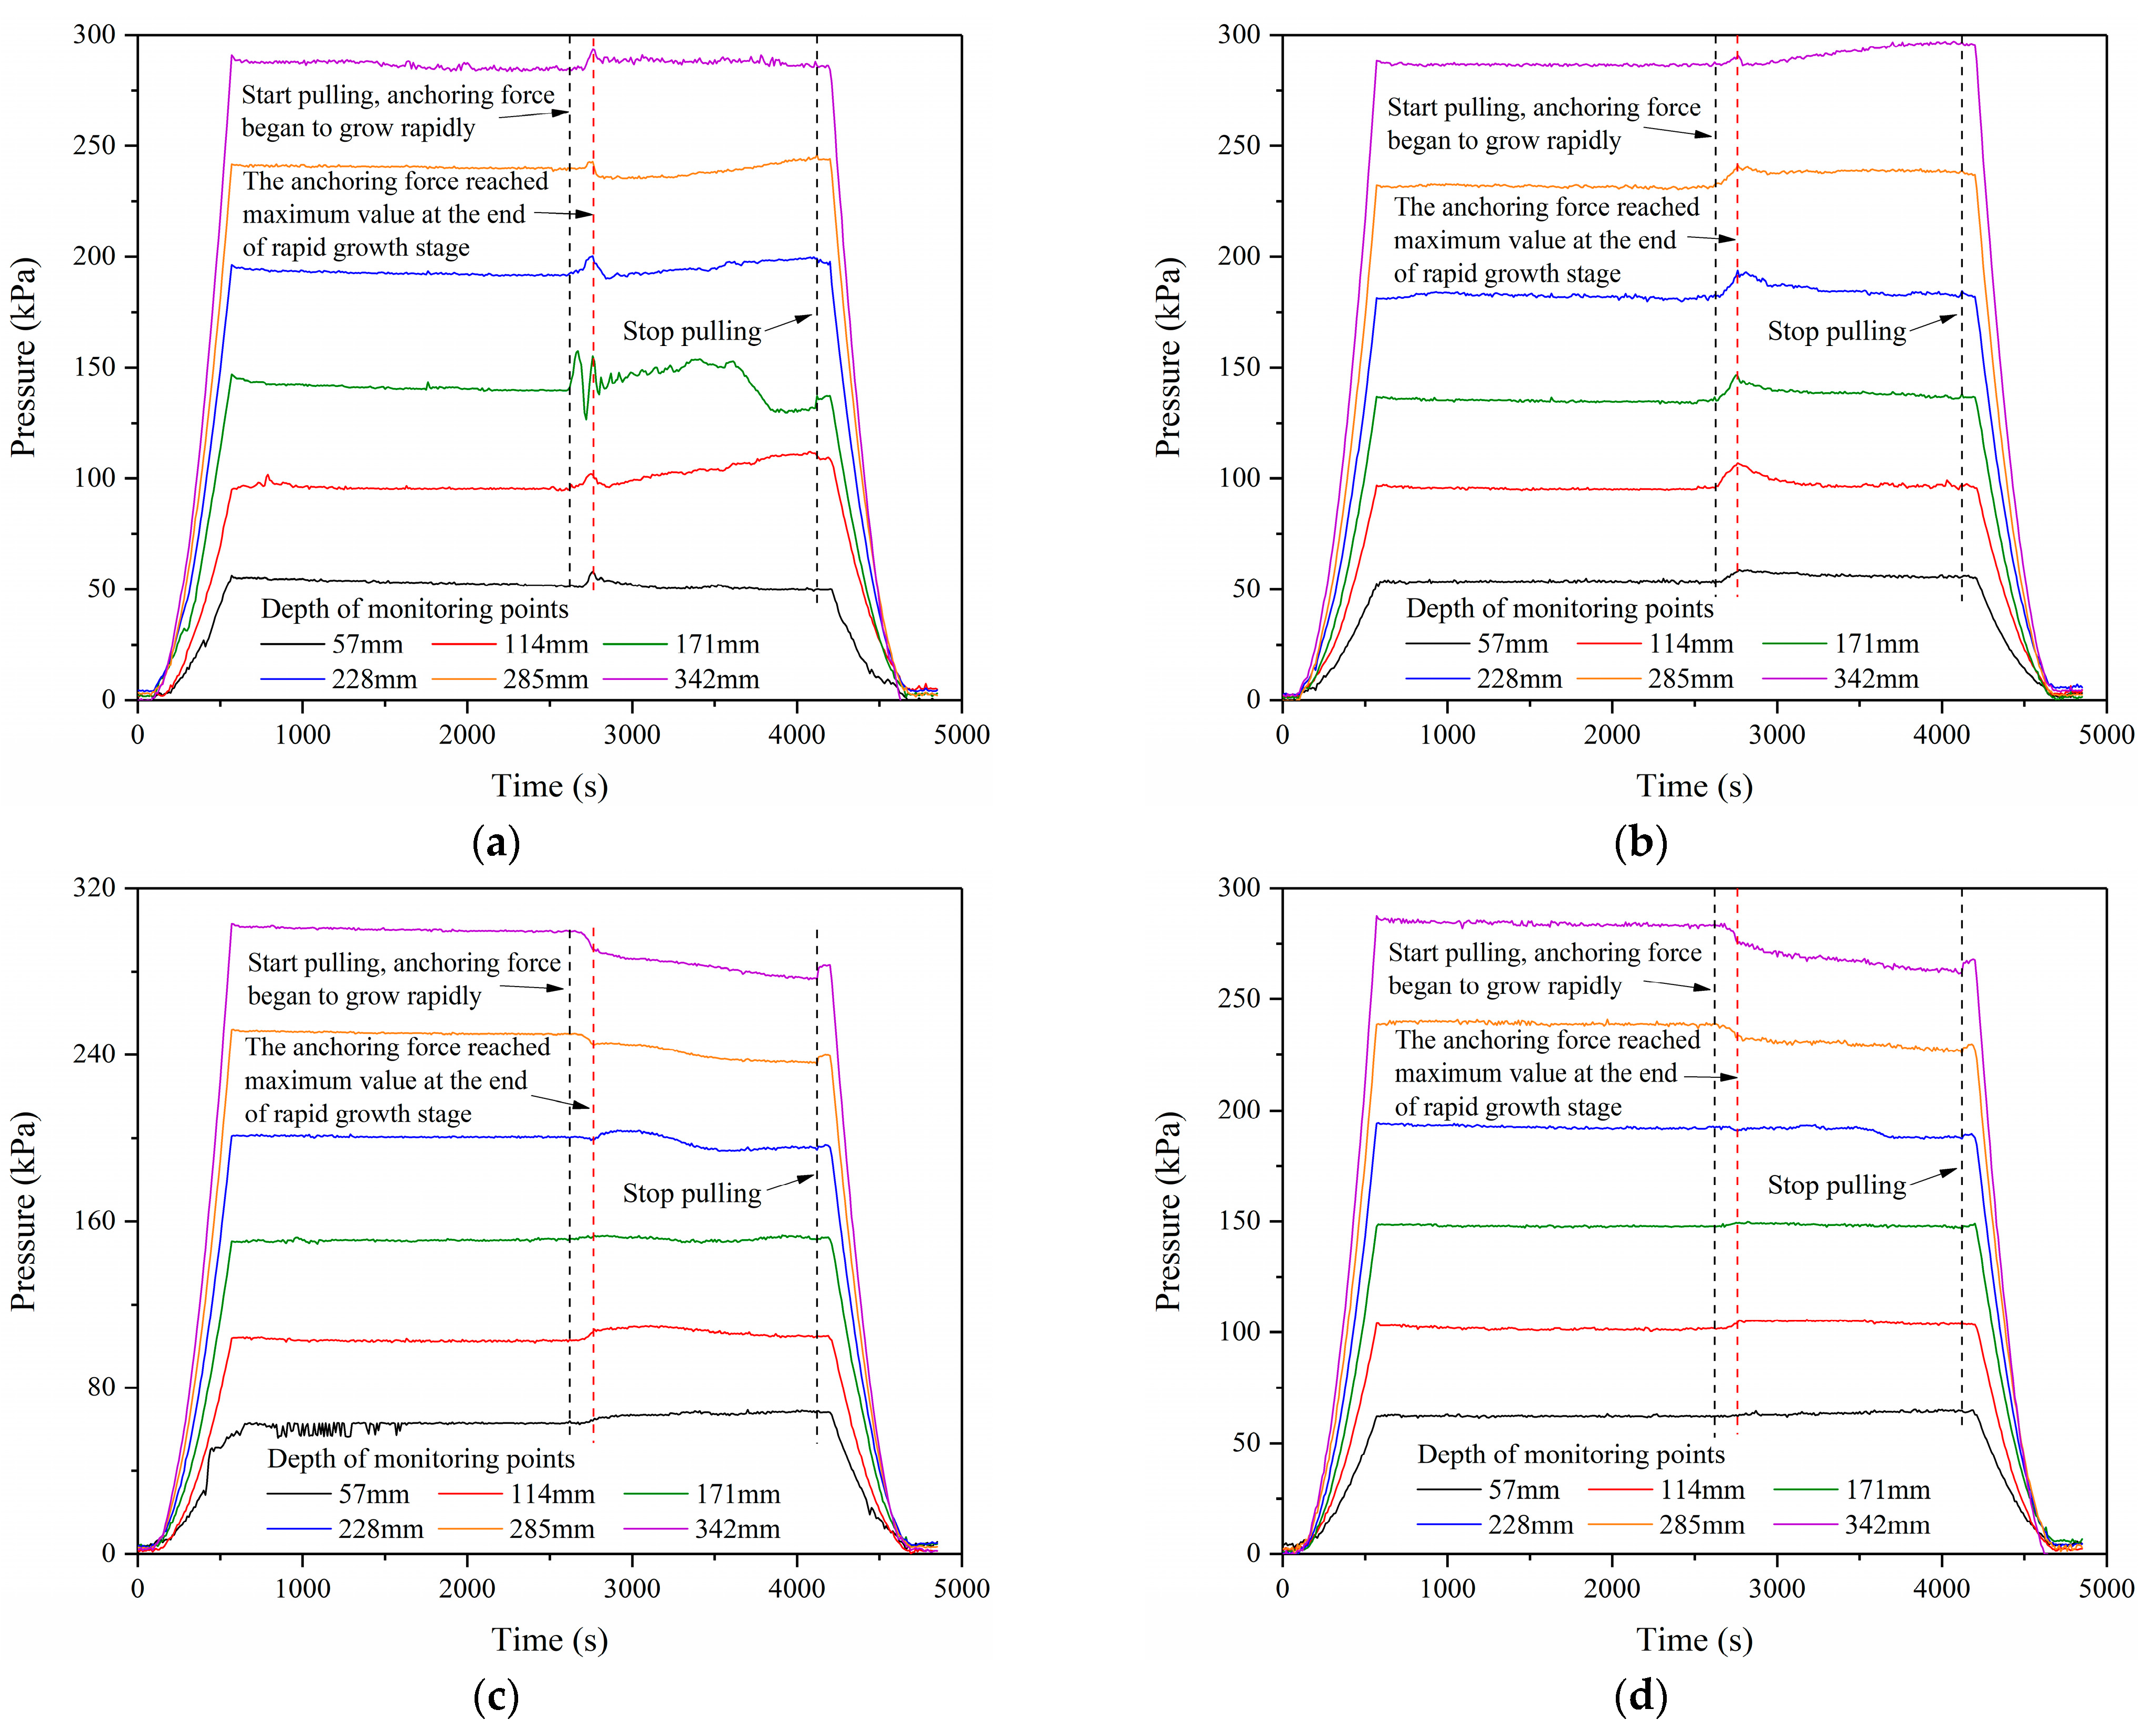
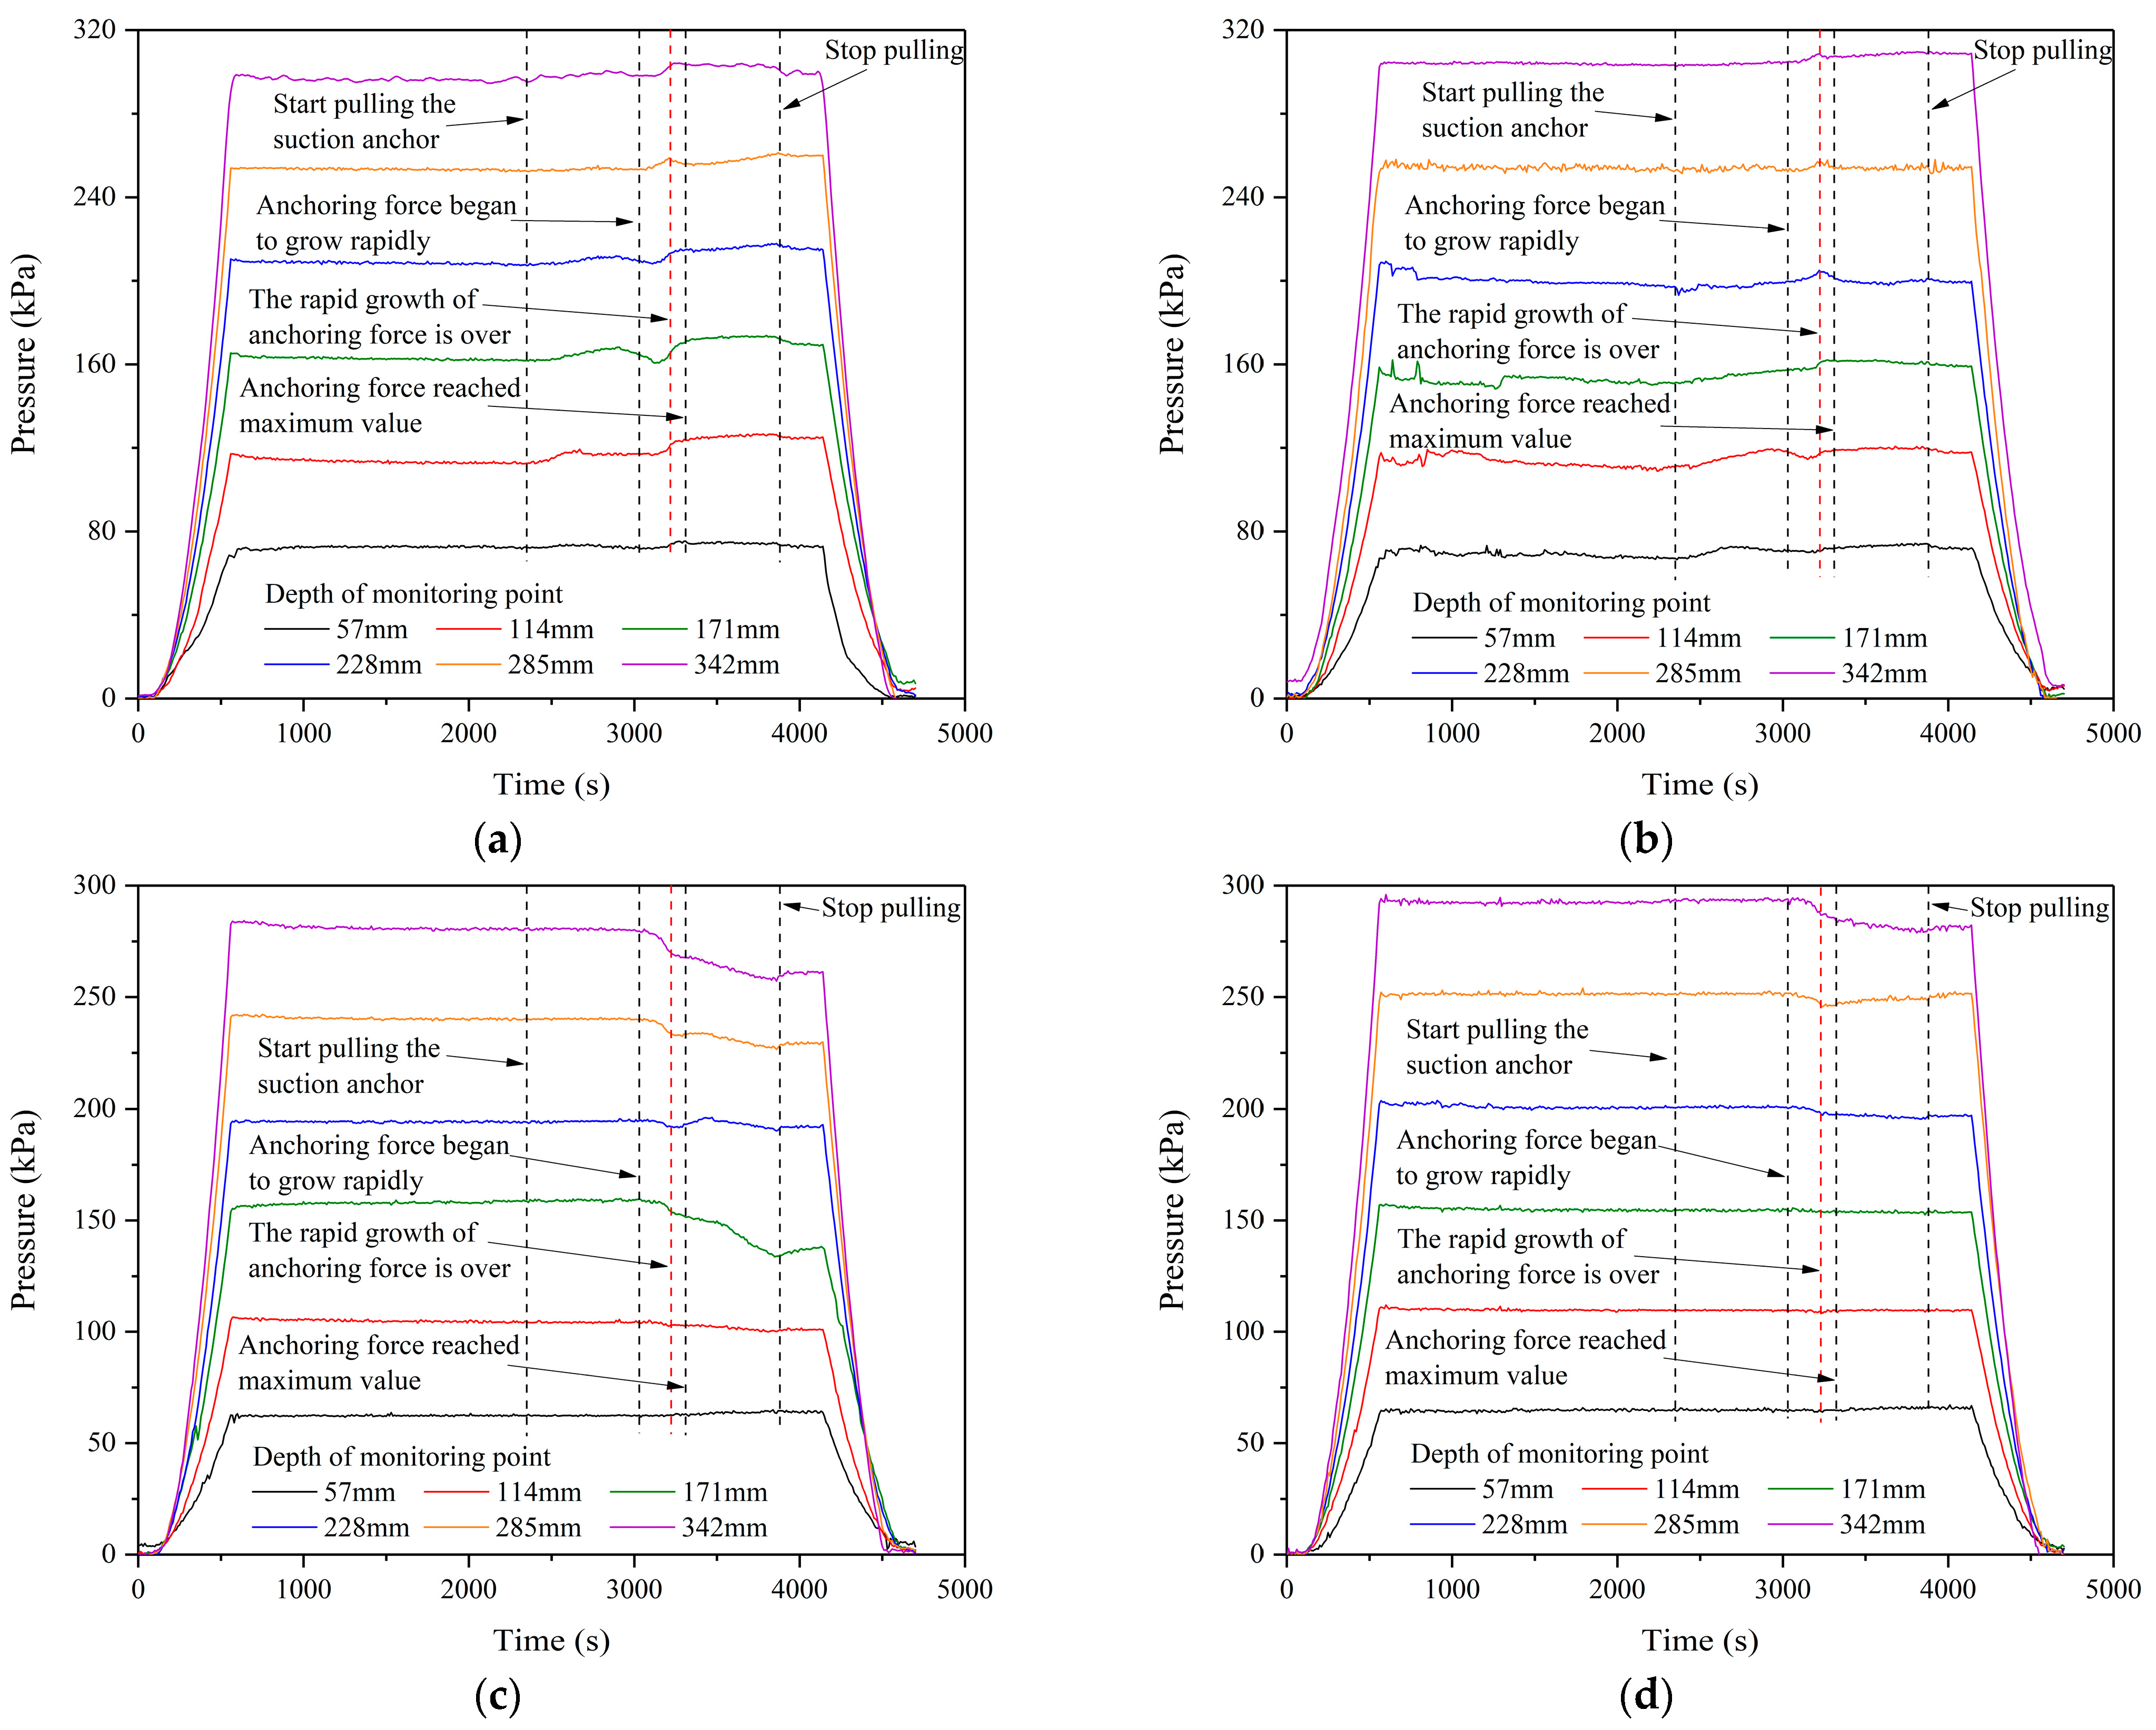
4.2. Distribution Characteristics of Soil Pressures around Suction Anchors

Three representative states have been selected to display the pressure distributions in the loading process: the initial state of soil pressure, the soil pressure at the end of the anchoring force rapid growth stage, and the soil pressure at the end of the pulling test. The horizontal soil pressure distribution around the 51° and 69° pulling suction anchors is shown in Figure 18.
The horizontal soil pressures were approximately linearly distributed along the depth. The soil pressures around the 69° pulling suction anchor are shown in Figure 18a. The soil pressures 30 mm in front of the suction anchor showed marked increases of 2.9~15.6 kPa during the anchoring force rapid growth stage. The increase in the soil pressures 80 mm in front of the suction anchor was 4.0~12.5 kPa, slightly smaller than the former. However, the pressures did not increase linearly with the soil depth. This indicates that the soil compression caused by the suction anchor was not uniform. Due to the dissipation of excess pore water pressure, some soil pressures decreased at the end of the test, but on the whole, the pressures showed a growing trend with the continuous pulling of the suction anchor. Notably, the soil pressures 80 mm in front of the anchor were linearly distributed. In contrast, the soil pressures at 30 mm showed a nonlinear distribution. This indicates that the muddy clay soil near the suction anchor was severely disturbed.
Comparing the pressures behind the suction anchor, it can be seen that the soil pressures of the upper part showed an increasing trend. In contrast, the soil pressures of the lower part showed a decreasing trend. This contrast indicated that the anchor body was inclined backward while moving forward. The loading position in the suction anchor’s lower part caused this response. At the end of the test, only the top pressure behind the suction anchor continued to increase while the pressures at other monitoring points decreased. In the vertical direction, the bottom pressures showed the largest decrease. In the horizontal direction, the soil pressures near and behind the suction anchor were more likely to show larger decreases.
The soil pressure around the 51° pulling suction anchor is shown in Figure 18b. Similar to the 69° pulling test, the soil pressures in front of the suction anchor increased variously during the pulling process. The pressures near the suction anchor experienced greater increases. The soil pressures behind the suction anchor also showed the differentiation of the upper and lower parts. The top pressure 20 mm behind the suction anchor increased, while the others showed a decreasing trend. For the soil pressures 50 mm behind the suction anchor, the upper three monitoring points had either stable or increased soil pressures, while the lower points showed marked decreases. These results indicate that the anchor body was inclined backward while the suction anchor compressed and sheared the front soil.
Comparing the pressure changes on both sides of the suction anchor, the pressure decreases regarding the back side were more significant than the pressure increases regarding the front side. Because the muddy clay soil, where the suction anchors were located, had low strength, the soil on the front side quickly reached the plastic flow state when the suction anchor was pulled forward. Therefore, it was difficult for the muddy clay soil to provide strong resistance to the suction anchor. The stress release on the back side caused decreases in soil pressures. The anchor body inclined backward as the loading position was at the front lower part of the anchor body. Therefore, the upper soil behind the anchor body was compressed, and the soil pressures showed increasing responses. Comparing the pressure changes in the 51° and 69° pulling tests, the soil pressures of the front sides showed larger increases under the 51° pulling load. It was demonstrated that the compressing effect on the front side was more significant, with the loading direction tending to be horizontal.
By comparing the soil stress distribution in Figure 15 and Figure 18, the same characteristics can be found: the soil pressure in front of the suction anchor increased, while the pressure behind it decreased. The pressure changes were more significant in the soil closer to the suction anchor. Moreover, the pressure changes at the lower part were more pronounced. The centrifugal test results were consistent with the numerical results. There were also minor differences. The soil pressure changes in the numerical simulation were more uniform than those in the centrifugal test. Because the soil was assumed to be homogeneous and continuous in the numerical simulation despite not being so in reality, it was impossible to achieve an absolute uniformity of soil, even in the laboratory. Furthermore, the loading motion of the suction anchors caused soil disturbance, leading to differences in soil pressure distribution. Therefore, the non-uniformity of the soil and the disturbance caused by the suction anchor resulted in more complex soil stress responses.

4.3. Failure Mechanism of Suction Anchors in Muddy Clay

The movement of suction anchors and the deformation of muddy clay soil after the test are shown in Figure 19. The relevant displacement profiles of the suction anchors are shown in Figure 20. The suction anchor was vertically pulled up from the soil in the 90° pulling test. The shear–slip failure behaviors occurred on the internal and external contact surfaces between the suction anchor and muddy clay. The shear stress on the contact surface gradually reached the bond shear strength by pulling the suction anchor. Then, shear–slip failure occurred on the surface, and the contact surface area decreased gradually. Therefore, the suction anchor lost its bearing capacity gradually with continuous pulling.
The inclined pulling suction anchors were loaded at the lower part of the anchor body. According to Figure 19b,c and Figure 20, as well as the previous analysis, the suction anchors showed multi-attitude coupling characteristics of rotation and moved forward and upward, which complicated the interaction between the suction anchors and soil. The vertical sliding displacement was relatively significant, whereas the horizontal and rotational movements under the lateral soil resistance were less significant. As the loading direction shifted towards the horizontal, there was an increase in both the horizontal and rotational displacement of the suction anchor. According to the horizontal soil pressure distribution around the suction anchor, the front-side pressure tended to transform into passive soil pressure. In contrast, the back-side pressure tended to transform into active soil pressure. The front-side soil pressures increased with the loading angle decrease, providing higher resistance to the suction anchor. Due to the combined rotation and horizontal displacement of the suction anchor, there was an enhanced soil compression effect in the lower and middle parts, resulting in notable changes in soil pressure. The interaction between the suction anchor and the soil led to the inclined loading suction anchors’ compression–shear–slip coupling failure behaviors. At the initial loading stage, the suction anchor compressed the soil, and the shear stress on the contact surface increased. The suction anchor then moved forward and caused the yielding failure of the muddy clay soil. At the same time, the shear stress of the contact surface reached the shear strength, resulting in the slip of the suction anchor. Therefore, the suction anchor gradually lost its bearing capacity and pulled out of the soil.

5. Conclusions

For this paper, the centrifugal model test was carried out to study the mechanical characteristics of suction anchors in low-strength muddy clay. The pulling load was applied to the suction anchors with vertical and inclined angles. The results showed that the anchoring force developments of suction anchors in muddy clay were complicated multi-stage processes, including the rapid growth stage, the slow growth stage, the fluctuating maintenance stage, the significant decline stage, and the slow decline stage of the anchoring force. Moreover, the anchoring force’s slow growth or significant decline stage might not be evident. The comparative test results showed that the inclined pulling suction anchors had larger bearing capacities than the vertical pulling suction anchor. Furthermore, the reduction in the inclined pulling angle caused an increase in the horizontal resistance of the muddy clay soil. Therefore, the bearing capacity of the suction anchor was improved. Numerical modeling was used to validate the test results of anchoring force development. The load–displacement relationship in the numerical simulation and centrifugal test showed consistency. The displacement distribution and evolution of the suction anchors and muddy clay soil were analyzed based on the numerical results. During the loading process, the soil displacement continued to increase until the anchors reached maximum bearing capacity. Following this, the soil displacement developed slightly with the suction anchor loaded to failure.
The horizontal soil stresses around the suction anchors were obtained in the inclined pulling tests, which provided valuable insights into the stress responses, including the development and distribution of soil stresses. The centrifugal test and numerical simulation showed consistent soil stress responses. The suction anchors significantly interacted with the muddy clay soil in the pulling process. The influence of the loading direction on the interaction mechanism was investigated based on the comparative analysis. The failure mechanism of the suction anchors in the muddy clay was summarized according to the testing and numerical results. The vertical pulling suction anchor showed shear–slip failure behaviors. However, the inclined pulling suction anchors had more complicated failure behaviors. The motion of suction anchors showed multi-attitude coupling characteristics of rotation and moved forward and upward while subjected to the inclined pulling load. The interaction between the suction anchors and the soil led to the compression–shear–slip coupling failure behaviors of the suction anchors subjected to inclined pulling.
The bearing capacity of a suction anchor depends on the interaction between the anchor and the soil. When the contact interface between the suction anchor and the soil reaches its ultimate strength, the suction anchor can bear the maximum load. In challenging geological conditions, including in muddy and soft clay, the design of suction anchors should take into account the negative effect of low-strength soil on anchoring capacity. It is suggested to fully utilize the lateral resistance of soil or increase the critical slip strength in structural optimization to improve the bearing capacity of suction anchors. The findings of this paper are essential for clarifying the mechanical characteristics of suction anchors in muddy clay, providing references for the deep water anchorage of offshore platforms, floating wind turbines, and submerged floating tunnels.
It should be noted that calculating the bearing capacity of suction anchors in muddy clay of varying strengths is challenging. This study conducted centrifugal tests on low-strength muddy clay under one specific condition, without fully considering changes in soil strength. To enhance design support for suction anchors, we recommend carrying out future research via comparative tests under varying conditions. These conditions could include different soil properties, diameter/length ratios, and loading positions. Such tests would provide a comprehensive understanding of the bearing capacity of suction anchors in various conditions.

Author Contributions

Conceptualization, J.L. and X.L. (Xiaoqiang Liu); methodology, J.L.; software, J.L.; validation, X.A.; formal analysis, J.L. and D.Z.; investigation, L.Y. and D.Z.; resources, J.L.; data curation, J.L. and X.A.; writing—original draft preparation, J.L.; writing—review and editing, J.L.; supervision, X.L. (Xianpeng Liu); project administration, J.L. and X.L. (Xianpeng Liu). All authors have read and agreed to the published version of the manuscript.

Funding

This work was funded by the National Key Research and Development Program of China (grant number: 2022YFB2602800), the National Natural Science Foundation of China (grant number: 52308401), the Transportation Technology Development Project of Tianjin (grant number: 2022-43), and the Fundamental Research Funds for the Central Research Institutes (grant numbers: TKS20220102, TKS20220207, and TKS20200101).

Institutional Review Board Statement

Not applicable.

Informed Consent Statement

Not applicable.

Data Availability Statement

The data presented in this study are available from the corresponding author upon email request ([email protected]).

Conflicts of Interest

Author Liqiang Yu was employed by the company: Hebei Construction & Investment Off-shore Wind Power Co., Ltd. The remaining authors declare that the research was conducted in the absence of any commercial or financial relationships that could be construed as a potential conflict of interest.

References

  1. Arany, L.; Bhattacharya, S. Simplified load estimation and sizing of suction anchors for spar buoy type floating offshore wind turbines. Ocean Eng. 2018, 159, 348–357. [Google Scholar] [CrossRef]
  2. Wang, M.; Nacci, V.; Demars, K. Behavior of underwater suction anchor in soil. Ocean Eng. 1975, 3, 47–62. [Google Scholar] [CrossRef]
  3. Dyvik, R.; Andersen, K.H.; Hansen, S.B.; Christophersen, H.P. Field tests of anchors in clay. I: Description. J. Geotech. Geoenviron. 1993, 119, 1515–1531. [Google Scholar] [CrossRef]
  4. Liu, H.; Yang, Y.; Peng, J. A Unified Model for Analyzing Comprehensive Behaviors of Deepwater Anchors. J. Mar. Sci. Eng. 2021, 9, 913. [Google Scholar] [CrossRef]
  5. Ahn, J.; Lee, H.; Kim, Y.-T. Finite element analysis of the holding capacity of shallow suction caisson anchors. Mar. Georesour. Geotechnol. 2015, 33, 33–44. [Google Scholar] [CrossRef]
  6. Wang, P.; Lu, H.; Wang, M.; Nagarajaiah, S.; Du, X. Experimental and numerical investigations on seismic responses of wind turbine structures with amplifying damping transfer system. Soil Dyn. Earthq. Eng. 2023, 175, 108277. [Google Scholar] [CrossRef]
  7. Yang, Z.; Li, J.; Zhang, H.; Yuan, C.; Yang, H. Experimental Study on 2D Motion Characteristics of Submerged Floating Tunnel in Waves. J. Mar. Sci. Eng. 2020, 8, 123. [Google Scholar] [CrossRef]
  8. Wang, C. Nonlinear waves and wave-structure interactions in marine hydrodynamics—Recent progress. Sci. China Technol. Sci. 2012, 55, 3253–3256. [Google Scholar] [CrossRef]
  9. Zdravkovic, L.; Potts, D.; Jardine, R. A parametric study of the pull-out capacity of bucket foundations in soft clay. Geotechnique 2001, 51, 55–67. [Google Scholar] [CrossRef]
  10. Bang, S.; Jones, K.; Kim, Y.S.; Cho, Y. Horizontal capacity of embedded suction anchors in clay. Ocean Eng. 2011, 133, 011104. [Google Scholar] [CrossRef]
  11. Du, J.; Du, S.; Wang, Z. A Comparison of Pull-out Capacity of Suction Anchors in Clay and Sand. Appl. Mech. Mater. 2014, 614, 613–617. [Google Scholar] [CrossRef]
  12. Koh, K.X.; Hossain, M.S.; Kim, Y. Installation and monotonic pullout of a suction caisson anchor in calcareous silt. J. Geotech. Geoenviron. Eng. 2017, 143, 04016098. [Google Scholar] [CrossRef]
  13. Sassi, K.; Zehzouh, S.; Blanc, M.; Thorel, L.; Cathie, D.; Puech, A.; Colliat-Dangus, J.L. Effect of seabed trenching on the holding capacity of suction anchors in soft deepwater Gulf of Guinea clays. In Proceedings of the Offshore Technology Conference, Houston, TX, USA, 30 April–3 May 2018. [Google Scholar]
  14. Wang, X.; Yang, X.; Zeng, X. Lateral capacity assessment of offshore wind suction bucket foundation in clay via centrifuge modelling. J. Renew. Sustain. Energy 2017, 9, 033308. [Google Scholar] [CrossRef]
  15. Wang, H.; Cheng, X. Undrained bearing capacity of suction caissons for offshore wind turbine foundations by numerical limit analysis. Mar. Georesour. Geotechnol. 2016, 34, 252–264. [Google Scholar] [CrossRef]
  16. Monajemi, H.; Razak, H.A. Finite element modeling of suction anchors under combined loading. Mar. Struct. 2009, 22, 660–669. [Google Scholar] [CrossRef]
  17. Li, H.; Chen, X.; Hu, C.; Wang, S.; Liu, J. Accumulation of Pore Pressure in a Soft Clay Seabed around a Suction Anchor Subjected to Cyclic Loads. J. Mar. Sci. Eng. 2019, 7, 308. [Google Scholar] [CrossRef]
  18. Shen, K.; Wang, L.; Guo, Z.; Jeng, D.S. Numerical investigations on pore-pressure response of suction anchors under cyclic tensile loadings. Eng. Geol. 2017, 227, 108–120. [Google Scholar] [CrossRef]
  19. Cheng, X.; Wang, P.; Li, N.; Liu, Z.; Zhou, Y. Predicting the cyclic behaviour of suction anchors based on a stiffness degradation model for soft clays. Comput. Geotech. 2020, 122, 103552. [Google Scholar] [CrossRef]
  20. Randolph, M.; House, A. Analysis of suction caisson capacity in clay. In Proceedings of the Offshore Technology Conference, Houston, TX, USA, 6–9 May 2002. [Google Scholar]
  21. Andersen, K.H.; Dyvik, R.; Schrøder, K.; Hansteen, O.E.; Bysveen, S. Field tests of anchors in clay II, Predictions and interpretation. J. Geotech. Eng. 1993, 119, 1532–1549. [Google Scholar] [CrossRef]
  22. Clukey, E.C.; Morrison, M.J.; Gamier, J.; Corte, J.F. The response of suction caissons in normally consolidated TLP loading conditions. In Proceedings of the Offshore Technology Conference, Houston, TX, USA, 1–4 May 1995. [Google Scholar]
  23. Chen, W.; Randolph, M.F. Uplift Capacity of Suction Caissons under Sustained and Cyclic Loading in Soft Clay. J. Geotech. Geoenviron. Eng. 2007, 133, 1352–1363. [Google Scholar] [CrossRef]
  24. Fu, D.; Zhang, Y.; Yan, Y.; Jostad, H.P. Effects of tension gap on the holding capacity of suction anchors. Mar. Struct. 2020, 69, 102679. [Google Scholar] [CrossRef]
  25. Aubeny, C.; Murff, J.D. Simplified limit solutions for the capacity of suction anchors under undrained conditions. Ocean Eng. 2005, 32, 864–877. [Google Scholar] [CrossRef]
  26. Jones, K.D.; Bang, S.; Cho, Y. Pullout capacity of embedded suction anchors in sand. Ocean Eng. 2007, 34, 2107–2114. [Google Scholar] [CrossRef]
  27. Koh, K.X.; Wang, D.; Hossain, M.S. Numerical simulation of caisson installation and dissipation in kaolin clay and calcareous silt. Bull. Eng. Geol. Environ. 2018, 77, 953–962. [Google Scholar] [CrossRef]
  28. Yang, Q.; Pan, G.; Liu, H.; Wang, Q. Bearing capacity of offshore umbrella suction anchor foundation in silty soil under varying loading modes. Mar. Georesour. Geotechnol. 2018, 36, 781–794. [Google Scholar] [CrossRef]
  29. Cheng, L.; Hossain, M.S.; Hu, Y.; Kim, Y.H.; Ullah, S.N. Failure envelope of suction caisson anchors subjected to combined loadings in sand. Appl. Ocean Res. 2021, 114, 102801. [Google Scholar] [CrossRef]
  30. Hu, R.; Liu, H.; Leng, H.; Yu, P.; Wang, X. Scour Characteristics and Equilibrium Scour Depth Prediction around Umbrella Suction Anchor Foundation under Random Waves. J. Mar. Sci. Eng. 2021, 9, 886. [Google Scholar] [CrossRef]
  31. Saue, M.; Aas, P.M.; Andersen, K.H.; Solhjell, E. Installation of suction anchors in layered soils. In Proceedings of the Offshore Site Investigation Geotechnics 8th International Conference Proceeding, Oslo, Norway, 12–14 September 2017; pp. 507–515. [Google Scholar]
  32. Utsunomiya, T.; Sekita, K.; Kita, K.; Sato, I. Demonstration Test for Using Suction Anchor and Polyester Rope in Floating Offshore Wind Turbine. In Proceedings of the International Conference on Ocean, Offshore and Arctic Engineering, Trondheim, Norway, 25–30 June 2017. [Google Scholar]
  33. Wang, J.; Li, S. Analysis procedure of the cyclic bearing capacity for suction anchors in soft clays. Mar. Georesour. Geotechnol. 2015, 33, 546–555. [Google Scholar] [CrossRef]
  34. Cheng, X.; Yang, A.; Li, G. Model tests and finite element analysis for the cyclic deformation process of suction anchors in soft clays. Ocean Eng. 2018, 151, 329–341. [Google Scholar] [CrossRef]
  35. Lee, J.; Do, J. Effects of the Installation Method, Loading Condition, and Failure Mechanism on the Behavior of Suction Piles under Monotonic Horizontal Loading. J. Mar. Sci. Eng. 2021, 9, 1333. [Google Scholar] [CrossRef]
  36. Andersen, K.H.; Jeanjean, P.; Luger, D.; Jostad, H.P. Centrifuge tests on installation of suction anchors in soft clay. Ocean Eng. 2005, 32, 845–863. [Google Scholar] [CrossRef]
  37. Kim, S.; Choo, Y.W.; Kim, J.H.; Kim, D.S.; Kwon, O. Pullout resistance of group suction anchors in parallel array installed in silty sand subjected to horizontal loading—Centrifuge and numerical modeling. Ocean Eng. 2015, 107, 85–96. [Google Scholar] [CrossRef]
  38. Zhu, B.; Dai, J.; Kong, D.; Feng, L.; Chen, Y. Centrifuge modelling of uplift response of suction caisson groups in soft clay. Can. Geotech. J. 2020, 57, 1294–1303. [Google Scholar] [CrossRef]
  39. Zhang, Y.; He, K.; Li, X.; Ye, J. Centrifuge Shaking Table Test on the Seismic Dynamics of Revetment Breakwater and a Nearby Aircraft Runway Built on Reclaimed Coral Sand Foundation. J. Mar. Sci. Eng. 2023, 11, 41. [Google Scholar] [CrossRef]
  40. Reese, L.C.; Beard, R.M. A design method for an anchor pile in a mooring system. In Proceedings of the Offshore Technology Conference, Houston, TX, USA, 28 April–1 May 1973. [Google Scholar]
  41. Bhattacharya, P. Pullout capacity of shallow inclined anchor in anisotropic and nonhomogeneous undrained clay. Geomech. Eng. 2017, 13, 825–844. [Google Scholar]
  42. Ng, C.W.W.; Shi, J.; Hong, Y. Three-dimensional centrifuge modelling of basement excavation effects on an existing tunnel in dry sand. Can. Geotech. J. 2013, 50, 874–888. [Google Scholar] [CrossRef]
Figure 1. The TK-C500 geotechnical centrifuge used for the model test.
Jmse 11 02190 g001
Figure 2. Arrangement of suction anchors in centrifugal model test.
Jmse 11 02190 g002
Figure 3. The model box and suction anchor in the test: (a) the model suction anchor; (b) the model box.
Jmse 11 02190 g003
Figure 4. Arrangement of pressure cells around the suction anchor.
Jmse 11 02190 g004
Figure 5. The undrained shear strength of muddy clay in the centrifugal model test.
Jmse 11 02190 g005
Figure 6. Installation of the model suction anchor: (a) suction anchor sinking process; (b) suction anchor distribution in the model box.
Jmse 11 02190 g006
Figure 7. Loading device in model test.
Jmse 11 02190 g007
Figure 8. Anchoring force and displacement of the suction anchor in the 90° pulling test.
Jmse 11 02190 g008
Figure 9. Anchoring force and displacement of the suction anchor in the 69° pulling test.
Jmse 11 02190 g009
Figure 10. Anchoring force and displacement of the suction anchor in the 51° pulling test.
Jmse 11 02190 g010
Figure 11. Numerical model of prototype suction anchor and muddy clay soil.
Jmse 11 02190 g011
Figure 12. Load–displacement curves of centrifugal model test and numerical modeling.
Jmse 11 02190 g012
Figure 13. Vertical (z-axis) displacements of muddy clay soil and suction anchor.
Jmse 11 02190 g013
Figure 14. Horizontal (x-axis) displacements of muddy clay soil and suction anchor.
Jmse 11 02190 g014
Figure 15. Horizontal soil pressure (σxx) distribution of muddy clay soil.
Jmse 11 02190 g015
Figure 16. Soil pressures around the suction anchor in the 69° inclined pulling test: (a) 30 mm in front of suction anchor; (b) 80 mm in front of suction anchor; (c) 20 mm behind suction anchor; (d) 50 mm behind suction anchor.
Jmse 11 02190 g016
Figure 17. Soil pressures around the suction anchor in the 51° inclined pulling test: (a) 30 mm in front of suction anchor; (b) 80 mm in front of suction anchor; (c) 20 mm behind suction anchor; (d) 50 mm behind suction anchor.
Jmse 11 02190 g017
Figure 18. The horizontal soil pressure distribution around the suction anchors in the following tests: (a) the 69° pulling test; (b) the 51° pulling test.
Jmse 11 02190 g018
Figure 19. The movement of the suction anchors and the deformation of the muddy clay soil after the following tests: (a) the 90° pulling test; (b) the 69° pulling test; (c) the 51° pulling test.
Jmse 11 02190 g019
Figure 20. The displacement profiles of the suction anchors in the centrifugal model test.
Jmse 11 02190 g020
Table 1. Similarity relationship of model and prototype.
ParametersUnitsModel/Prototype
Accelerationm/s2n/1
Linear dimensionsm1/n
StresskPa1/1
Strain-1/1
DensityKg/m31/1
ForceN1/n2
Bending momentN·m1/n3
Axial rigidityN1/n2
Flexural rigidityN·m21/n4
Consolidation times1/n2
Permeability coefficientm/sn/1
Viscosity coefficientPa·s1/1
Seepage times1/n2
Table 2. Testing parameters of prototype and model suction anchors.
Diameter DLength LThickness tMaterialElastic ModulusSimilarity Ratio
Prototype suction anchor4 m20 m40 mmsteel210 GPa1:50
Model suction anchor 80 mm400 mm0.8 mm
Table 3. Test results related to the maximum anchoring force.
Test GroupSize (L × D × t)90° Loading69° Loading51° Loading
Model suction anchor400 × 80 × 0.8 mm1.007 kN1.181 kN1.458 kN
Prototype suction anchor20 × 4 × 0.04 m2517.5 kN2952.5 kN3645.0 kN
Table 4. Parameters of muddy clay soil and suction anchor.
Muddy Clay SoilSuction Anchor
Parameterc/kPaφE/MPaνE/GPaν
Value8.753.570.850.502050.275
Disclaimer/Publisher’s Note: The statements, opinions and data contained in all publications are solely those of the individual author(s) and contributor(s) and not of MDPI and/or the editor(s). MDPI and/or the editor(s) disclaim responsibility for any injury to people or property resulting from any ideas, methods, instructions or products referred to in the content.

