

Hydrodynamic Loads and Overtopping Processes of a Coastal Seawall under the Coupled Impact of Extreme Waves and Wind


Abstract
:1. Introduction
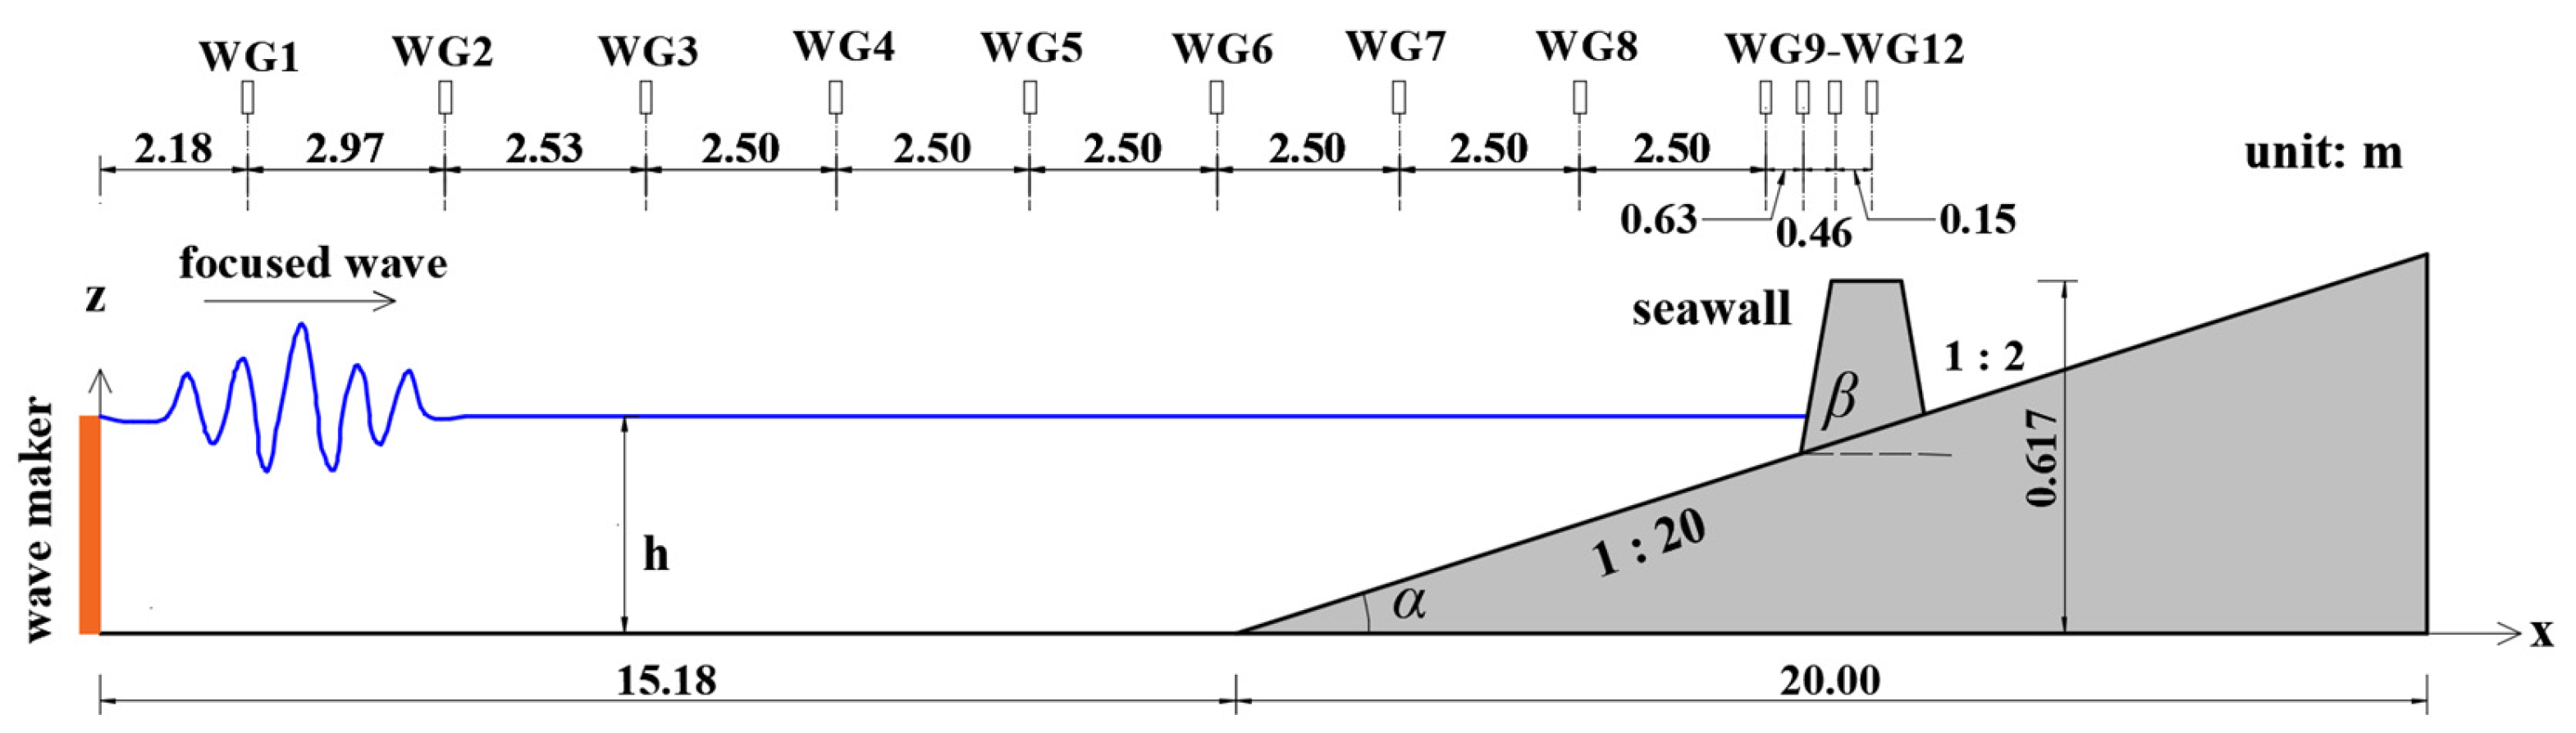
2. Methodology
2.1. Numerical Flow Solver
2.2. Calibration of the Numerical Flow Solver
3. Results and Discussion
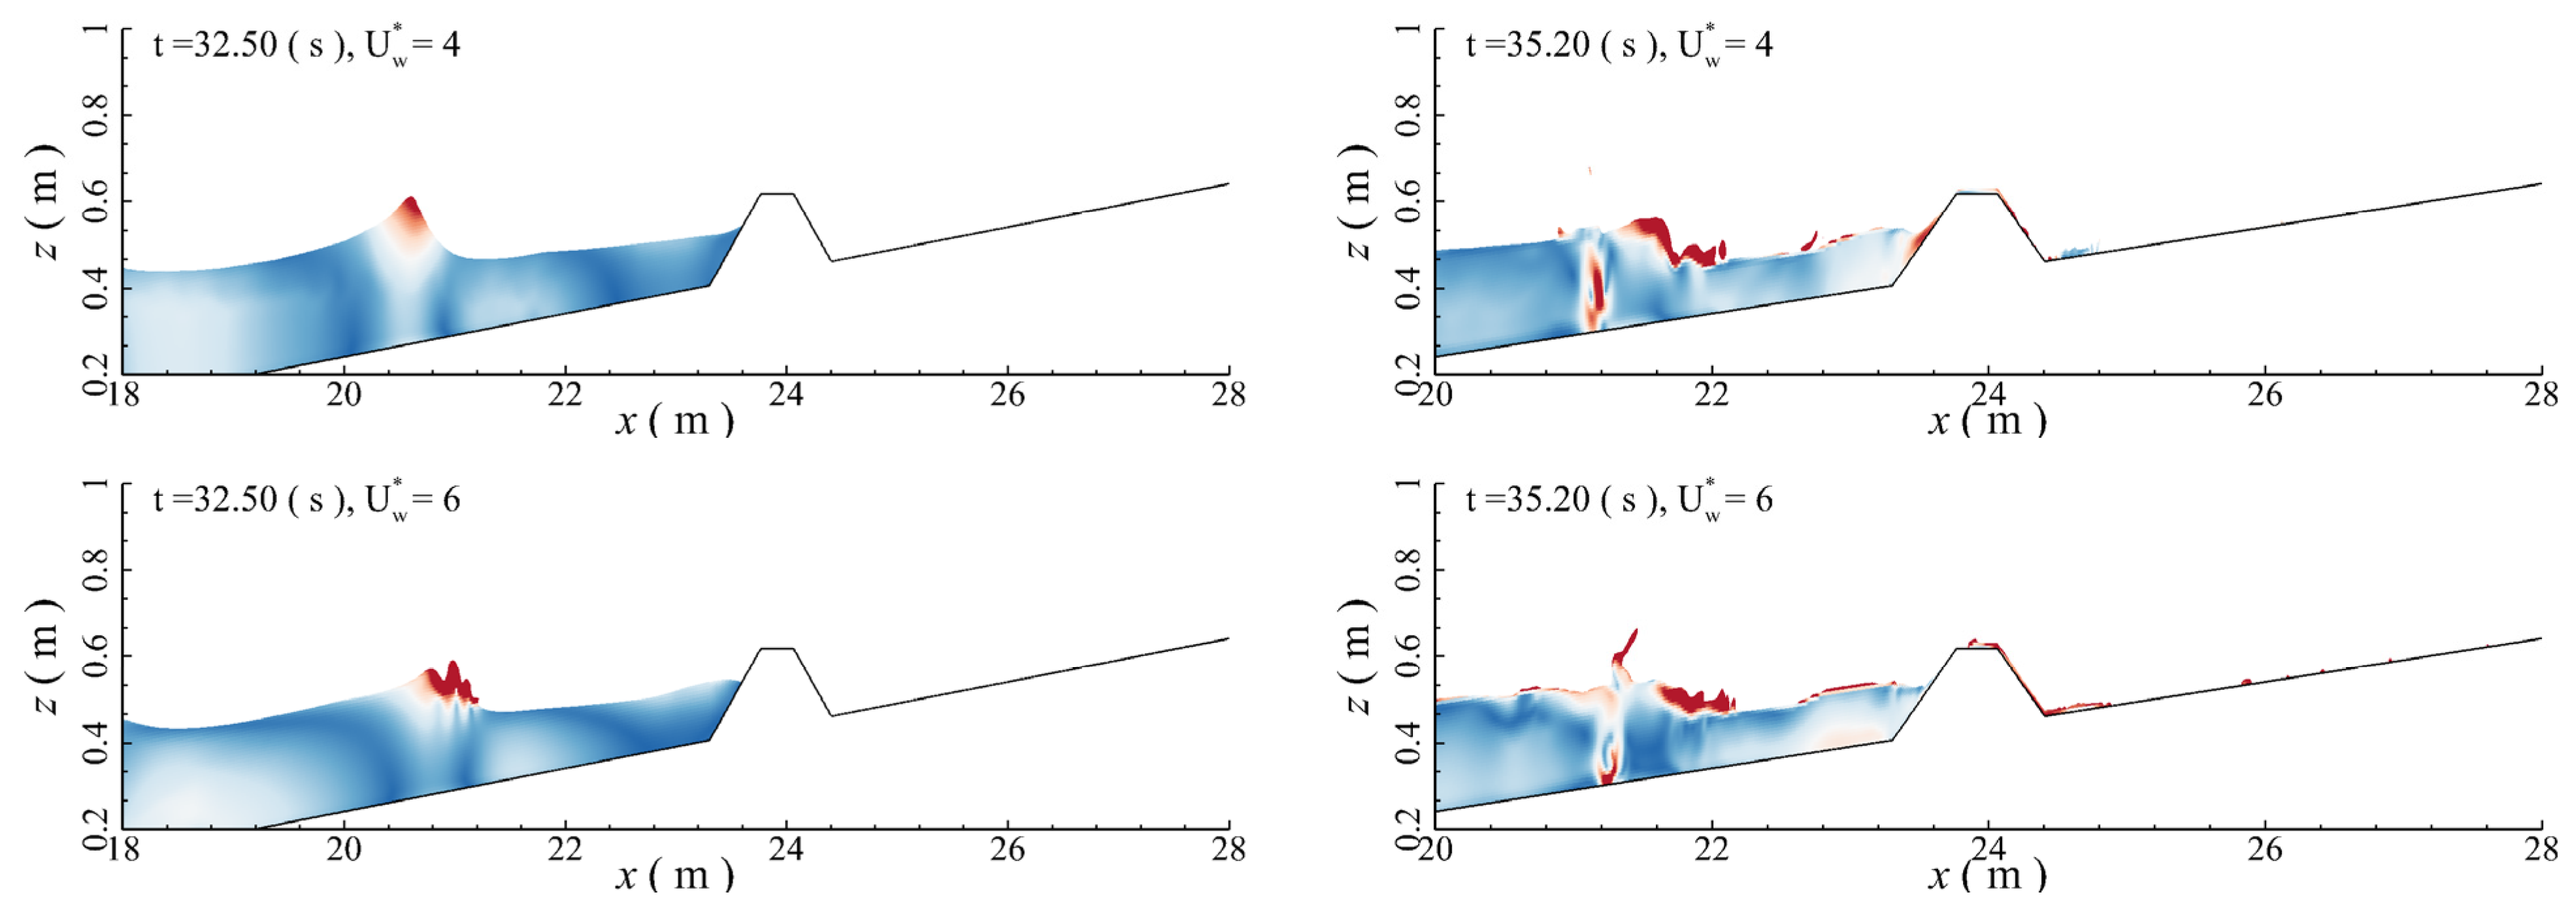
3.1. Complex Flow Phenomena
3.2. Effects of Wind Speed
3.3. Effects of the Significant Wave Height
3.4. Effects of Water Depth
4. Conclusions
- (1)
- The pressure and wind shear stress forces at the water surface can increase the current speed at the water surface and gradually enlarge the wave steepness, which makes wave breaking occur in advance. The wind-strengthened breaking surge bore can increase the total overtopping water volume to some extent. Since the onshore wind can gradually increase the wave celerity, the impact intensity of the breaking surge bores at the seawall can be also enhanced. At the same time, as the wind blows across the surface of the seawall, a low-pressure area can be formed. It can generate a sucking effect on the surface of the seawall, which finally can increase the vertical load of the seawall to some extent.
- (2)
- If is smaller than 2, the existence of wind has a negligible impact on the peak value of the overtopping water volume. When the wind speed is small ( < 2), pressure and wind shear stress imposed at the water surface by the wind are much smaller compared with the hydrostatic force of the water body. However, once , the peak value of the overtopping water volume tends to increase noticeably with . The total overtopping water volume increases by 46.37% if varies from 2 to 6. When , the peak value of the runup height of overtopping water increases sharply with . The maximum value of the runup height increases by 55.18% if from 2 to 6. When , the increase rate in the maximum horizontal load and maximum vertical load is relatively small. If varies from 3 to , the peak values of the horizontal load and vertical load at the seawall can increase by 11.6% and 5.61%, respectively.
- (3)
- The peak value of the overtopping water volume increases linearly with . The maximum overtopping water volume of the focused waves under the wind conditions is 20.36% larger on average than without the wind. The peak value of the runup height of the overtopping water body for the focused waves with the wind is larger than that without the wind by 21.14% on average. The peak values of the horizontal load and the vertical load monotonically increase with . The peak values of the horizontal load and the vertical load of the focused waves with the wind are 5.35% and 1.63% greater on average than without the wind at different significant wave height ratios, respectively.
- (4)
- If is relatively small, the clearance height between the top of the seawall and the still water level is large. Hence, only negligible overtopping water can be observed. Overall, the total overtopping water volume for the focused waves with the wind is 15.55% greater on average than without the wind. When is larger than 0.45 m, the peak value of the runup height of overtopping water of the focused waves with the wind is 17.2% greater on average than without the wind. If is larger than 0.5 m, peak values of the horizontal and vertical loads at the seawall under the focused wave conditions with the wind are 8.66% and 5.92% larger than without the wind, respectively.
- (5)
- Although this study systematically investigated the overtopping of a seawall under the combined effect of focused waves and wind, there are some limitations. For instance, in a real ocean environment, waves tend to propagate in multiple directions. This study only focuses on unidirectional focused waves. Overtopping of a seawall under multidirectional focused wave conditions will be further studied in the future. In addition, this study only numerically analyzed wind–wave interactions using small-scale modeling. At present, it is still challenging to apply a high-accuracy two-phase flow wave model to study large-scale wind–wave interactions and their joint impact on coastal infrastructures.
Author Contributions
Funding
Institutional Review Board Statement
Informed Consent Statement
Data Availability Statement
Conflicts of Interest
References
- Stansell, P. Distributions of freak wave heights measured in the north sea. Appl. Ocean Res. 2004, 26, 35–48. [Google Scholar] [CrossRef]
- Qu, K.; Lie, Y.C.; Wang, X.; Li, X.H. Numerical Analysis on Influences of Emergent Vegetation Patch on Runup Processes of Focused Wave Groups. J. Mar. Sci. Eng. 2022, 1, 8. [Google Scholar] [CrossRef]
- Wen, B.H.; Qu, K.; Lan, G.Y.; Sun, W.Y.; Yao, Y.; Deng, B.; Jiang, C.B. Numerical study on hydrodynamic characteristics of coastal bridge deck under joint action of regular waves and wind. Ocean Eng. 2022, 245, 110450. [Google Scholar] [CrossRef]
- Qu, K.; Zhang, L.B.; Yao, Y.; Jiang, C.B. Numerical evaluation of influences of onshore wind on overtopping characteristics of coastal seawall under solitary wave. Ocean Eng. 2022, 266, 112860. [Google Scholar] [CrossRef]
- Feddersen, F.; Veron, F. Wind effects on shoaling wave shape. J. Phys. Oceanogr. 2005, 35, 1223–1228. [Google Scholar] [CrossRef]
- Douglass, S.L. Influence of wind on breaking waves. J. Waterw. Port Coast. Ocean Eng. 1990, 116, 651–663. [Google Scholar] [CrossRef]
- Clavero, M.; Chiapponi, L.; Longo, S.; Losada, M.A. Laboratory Tests on Wind-Wave Generation, Interaction and Breaking Processes. In Advances on Testing and Experimentation in Civil Engineering: Geotechnics, Transportation, Hydraulics and Natural Resources; Springer International Publishing: Cham, Switzerland, 2022; pp. 259–281. [Google Scholar]
- Ward, D.L.; Wibner, C.G.; Zhang, J.; Edge, B.L. Wind Effects on Runup and Overtopping. In Coastal Engineering 1994; ASCE: Reston, VA, USA, 1994; pp. 1687–1699. [Google Scholar]
- Ward, D.L.; Zhang, J.; Wibner, C.G.; Cinotto, C.M. Wind Effects on Runup and Overtopping of Coastal Structures. In Coastal Engineering 1996; ASCE: Reston, VA, USA, 1996; pp. 2206–2215. [Google Scholar]
- Ward, D.L.; Wibner, C.G.; Zhang, J. Runup on coastal revetments under the influence of onshore wind. J. Coast Res. 1998, 14, 1325–1333. [Google Scholar]
- Iwagaki, Y.; Tsuchiya, Y.; Inoue, M. On the effect of wind on wave overtopping on vertical seawalls. Bull. Disaster Prev. Res. Inst. 1966, 16 Pt 1, 11–30. [Google Scholar]
- Jeffreys, H. On the formation of water waves by wind. Proc. R. Soc. Lond. 1925, 107, 189–206. [Google Scholar]
- Jeffreys, H. On the formation of water waves by wind (second paper). Proc. R. Soc. Lond. 1926, 110, 241–247. [Google Scholar]
- Miles, J.W. Surface-wave generation revisited. J. Fluid Mech. 1993, 256, 427–441. [Google Scholar] [CrossRef]
- Miles, J.W. Surface-wave generation: A viscoelastic model. J. Fluid Mech. 1996, 322, 131–145. [Google Scholar] [CrossRef]
- Kharif, C.; Giovanangeli, J.P.; Touboul, J.; Grare, L.; Pelinovsky, E. Influence of wind on extreme wave events: Experimental and numerical approaches. J. Fluid Mech. 2008, 594, 209–247. [Google Scholar] [CrossRef]
- Di Leo, A.; Dentale, F.; Buccino, M.; Tuozzo, S.; Pugliese Carratelli, E. Numerical Analysis of Wind Effect on Wave Overtopping on a Vertical Seawall. Water 2022, 14, 3891. [Google Scholar] [CrossRef]
- Yan, S.; Ma, Q.W. Numerical simulation of interaction between wind and 2D freak waves. Eur. J. Mech.-B/Fluids 2010, 29, 18–31. [Google Scholar] [CrossRef]
- Hieu, P.D.; Vinh, P.N.; Son, N.T. Study of wave-wind interaction at a seawall using a numerical wave channel. J. Appl. Math. Model. 2014, 38, 5149–5159. [Google Scholar] [CrossRef]
- Xie, Z.H. Numerical modelling of wind effects on breaking solitary waves. Eur. J. Mech.-B/Fluids 2014, 43, 135–147. [Google Scholar] [CrossRef]
- Qu, K.; Wen, B.H.; Ren, X.Y.; Kraatz, S.; Sun, W.Y.; Deng, B.; Jiang, C.B. Numerical investigation on hydrodynamic force of coastal bridge deck under joint action of solitary wave and wind. Ocean Eng. 2020, 217, 108037. [Google Scholar] [CrossRef]
- Guo, L.; Qu, K.; Huang, J.X.; Li, X.H. Numerical study of influences of onshore wind on hydrodynamic processes of solitary wave over fringing reef. J. Mar. Sci. Eng. 2022, 10, 1645. [Google Scholar] [CrossRef]
- Hsiao, S.C.; Hsu, T.W.; Lin, T.C.; Chang, Y.H. On the evolution and run-up of breaking solitary waves on a mild sloping beach. Coast. Eng. 2008, 55, 975–988. [Google Scholar] [CrossRef]
- Sun, W.Y.; Qu, K.; Kraatz, S.; Deng, B.; Jiang, C.B. Numerical investigation on performance of submerged porous breakwater to mitigate hydrodynamic forces of coastal bridge deck under solitary wave. Ocean Eng. 2020, 213, 107660. [Google Scholar] [CrossRef]
- Wen, H.; Ren, B.; Zhang, X.; Yu, X. SPH modeling of wave transformation over a coral reef with seawall. J. Waterw. Port Coast. Ocean Eng. 2019, 145, 04018026. [Google Scholar] [CrossRef]
- Finnegan, W.; Goggins, J. Linear irregular wave generation in a numerical wave tank. Appl. Ocean Res. 2015, 52, 188–200. [Google Scholar] [CrossRef]
- Koosheh, A.; Etemad-Shahidi, A.; Cartwright, N.; Tomlinson, R.; van Gent, M.R.A. Experimental study of wave overtopping at rubble mound seawall. Coast. Eng. 2022, 172, 104062. [Google Scholar] [CrossRef]
- Nassar, K.; Mahmod, W.E.; Tawfik, A.; Rageh, O.; Negm, A.; Fath, H. Developing empirical formulas for assessing the hydrodynamic behaviour of serrated and slotted seawall. Ocean Eng. 2018, 159, 388–409. [Google Scholar] [CrossRef]
- Dong, S.; Abolfathi, S.; Salauddin, M.; Tan, Z.H.; Pearson, J.M. Enhancing climate resilience of vertical seawall with retrofitting—A physical modelling study. Appl. Ocean Res. 2020, 103, 102331. [Google Scholar] [CrossRef]
- Chen, W.; Warmink, J.J.; van Gent, M.R.A.; Hulscher, S.J.M.H. Numerical modelling of wave overtopping at dikes using OpenFOAM. Coast. Eng. 2021, 166, 103890. [Google Scholar] [CrossRef]
- Liu, Y.; Li, S.; Chen, S.; Hu, C.; Fan, Z.; Jin, R. Random wave overtopping of vertical seawalls on coral reefs. Appl. Ocean Res. 2020, 100, 102166. [Google Scholar] [CrossRef]
- EurOtop. Manual on Wave Overtopping of Sea Defences and Related Structures. 2018. Available online: http://www.overtopping-manual.com/ (accessed on 26 October 2023).
- Nikolkina, I.; Didenkulova, I. Rogue waves in 2006–2010. Nat. Hazard. Earth Syst. 2011, 11, 2913–2924. [Google Scholar] [CrossRef]
- Syamsidik; Benazir; Umar, M.; Margaglio, G.; Fitrayansyah, A. Post-tsunami survey of the 28 September 2018 tsunami near palu bay in central sulawesi, Indonesia: Impacts and challenges to coastal communities. Int. J. Disaster Risk Reduct. 2019, 38, 101229. [Google Scholar] [CrossRef]
- Wilcox, D.C. Turbulence Modeling for CFD; DCW Industries, Inc.: La Canada, CA, USA, 1994. [Google Scholar]
- Darwish, M.; Moukalled, F. Convective schemes for capturing interfaces of free surface flow on unstructured grids. Numer. Heat Transf. Part B Fundam. 2006, 49, 19–42. [Google Scholar] [CrossRef]
- Fergizer, J.; Peric, M. Computational Methods for Fluid Dynamics; Springer: Berlin/Heidelberg, Germany, 2002. [Google Scholar]
- Issa, R. Solution of the implicitly discretized fluid flow equations by operator splitting. J. Comput. Phys. 1986, 62, 40–65. [Google Scholar] [CrossRef]
- Rhie, C.; Chow, W. Numerical Study of the Turbulent Flow Past an Isolated Airfoil with Trailing Edge Separation. In Proceedings of the 3rd Joint Thermophysics, Fluids, Plasma and Heat Transfer Conference. AIAA J. 1983, 21, 1525–1532. [Google Scholar] [CrossRef]
- Judge, F.M.; Hunt-Raby, A.C.; Orszaghova, J.; Taylor, P.H.; Borthwick, A.G. Multi-directional focused wave group interactions with a plane beach. Coast. Eng. 2019, 152, 103531. [Google Scholar] [CrossRef]
- Bihs, H.; Chella, M.A.; Kamath, A.A.; Arntsen, Ø.A. Numerical investigation of focused waves and their interaction with a vertical cylinder using REEF3D. J. Offshore Mech. Arct. 2017, 139, 041101. [Google Scholar] [CrossRef]
- Ning, D.Z.; Zang, J.; Liu, S.X.; Taylor, R.E.; Teng, B.; Taylor, P.H. Free-surface evolution and wave kinematics for nonlinear uni-directional focused wave groups. Ocean Eng. 2009, 36, 1226–1243. [Google Scholar] [CrossRef]
- Whittaker, C.N.; Fitzgerald, C.J.; Raby, A.C.; Taylor, P.H.; Borthwick, A.G.L. Extreme coastal responses using focused wave groups: Overtopping and horizontal forces exerted on an inclined seawall. Coast. Eng. 2018, 140, 292–305. [Google Scholar] [CrossRef]
- Willmott, C.J. On the Validation of Models. Phys. Geogr. 1981, 2, 184–194. [Google Scholar] [CrossRef]


| Parameter Setup | ||||||
|---|---|---|---|---|---|---|
| 0 | 0.065 | 0.186 | 0.026 | 6.37 | ||
| 2 | 0.067 | 0.186 | 0.027 | 6.61 | ||
| 3 | 0.067 | 0.186 | 0.029 | 7.25 | ||
| 4 | 0.069 | 0.188 | 0.032 | 7.83 | ||
| 5 | 0.070 | 0.192 | 0.037 | 8.38 | ||
| 6 | 0.075 | 0.196 | 0.041 | 9.67 | ||
| 0.25 | 0.057 | 0.161 | 0.022 | 5.99 | ||
| 0.30 | 0.061 | 0.166 | 0.023 | 6.20 | ||
| 0.35 | 0.065 | 0.186 | 0.026 | 6.37 | ||
| 0.40 | 0.072 | 0.199 | 0.029 | 6.61 | ||
| 0.25 | 0.061 | 0.162 | 0.025 | 6.94 | ||
| 0.30 | 0.064 | 0.168 | 0.028 | 7.31 | ||
| 0.35 | 0.069 | 0.188 | 0.032 | 7.83 | ||
| 0.40 | 0.075 | 0.205 | 0.036 | 8.25 | ||
| 0.45 | 0.045 | 0.093 | 0.002 | 0.44 | ||
| 0.50 | 0.065 | 0.186 | 0.026 | 6.37 | ||
| 0.55 | 0.109 | 0.229 | 0.068 | 17.43 | ||
| 0.60 | 0.134 | 0.403 | 0.094 | 25.07 | ||
| 0.45 | 0.045 | 0.100 | 0.003 | 0.95 | ||
| 0.50 | 0.069 | 0.188 | 0.032 | 7.83 | ||
| 0.55 | 0.122 | 0.252 | 0.080 | 20.10 | ||
| 0.60 | 0.153 | 0.422 | 0.103 | 27.21 | ||
Disclaimer/Publisher’s Note: The statements, opinions and data contained in all publications are solely those of the individual author(s) and contributor(s) and not of MDPI and/or the editor(s). MDPI and/or the editor(s) disclaim responsibility for any injury to people or property resulting from any ideas, methods, instructions or products referred to in the content. |
© 2023 by the authors. Licensee MDPI, Basel, Switzerland. This article is an open access article distributed under the terms and conditions of the Creative Commons Attribution (CC BY) license (https://creativecommons.org/licenses/by/4.0/).
Share and Cite
Yuan, T.; Wang, X.; Qu, K.; Zhang, L.B. Hydrodynamic Loads and Overtopping Processes of a Coastal Seawall under the Coupled Impact of Extreme Waves and Wind. J. Mar. Sci. Eng. 2023, 11, 2087. https://doi.org/10.3390/jmse11112087
Yuan T, Wang X, Qu K, Zhang LB. Hydrodynamic Loads and Overtopping Processes of a Coastal Seawall under the Coupled Impact of Extreme Waves and Wind. Journal of Marine Science and Engineering. 2023; 11(11):2087. https://doi.org/10.3390/jmse11112087
Chicago/Turabian StyleYuan, T., X. Wang, K. Qu, and L. B. Zhang. 2023. "Hydrodynamic Loads and Overtopping Processes of a Coastal Seawall under the Coupled Impact of Extreme Waves and Wind" Journal of Marine Science and Engineering 11, no. 11: 2087. https://doi.org/10.3390/jmse11112087
APA StyleYuan, T., Wang, X., Qu, K., & Zhang, L. B. (2023). Hydrodynamic Loads and Overtopping Processes of a Coastal Seawall under the Coupled Impact of Extreme Waves and Wind. Journal of Marine Science and Engineering, 11(11), 2087. https://doi.org/10.3390/jmse11112087