Article

Life History Parameters to Inform Pattern of Prenatal Investment in Marine Mammals

1
Yantai Institute of Coastal Zone Research, Chinese Academy of Sciences, Yantai 264003, China
2
University of Chinese Academy of Sciences, Beijing 100049, China
3
Marine Mammal and Marine Bioacoustics Laboratory, Institute of Deep-Sea Science and Engineering, Chinese Academy of Sciences, Sanya 572000, China
4
Institute of Zoology, Zoological Society of London, London NW1 4RY, UK
*
Author to whom correspondence should be addressed.
J. Mar. Sci. Eng. 2023, 11(11), 2086; https://doi.org/10.3390/jmse11112086
Submission received: 3 September 2023 / Revised: 3 October 2023 / Accepted: 27 October 2023 / Published: 31 October 2023
(This article belongs to the Section Marine Biology)

Abstract

:
Marine mammals are a diverse group of aquatic animals that exhibit wide variation in body size, living conditions, breeding habitat, social behaviour and phylogeny. Although case studies about prenatal investment in cetaceans and pinnipeds have been investigated, comparative studies across different marine mammal taxonomic groups have not yet been conducted systematically. Here, six life history parameters from 75 marine mammal species were collected based on a meta-analysis of the existing literature, and prenatal investment patterns for different taxonomic groups were explored using an unsupervised artificial neural network of a self-organizing map (SOM). Most marine mammal species can be clearly divided into two clusters of small-bodied taxa (small-bodied toothed whales, pinnipeds) and large-bodied taxa (baleen whales, sperm whales and beaked whales, large-bodied toothed whales) based on their distribution within SOM feature maps. Gestation periods and breeding intervals are significantly shorter in pinnipeds than in small-bodied toothed dolphins despite being similar in body size, indicating their adaption to birthing and nursing on land or ice floes. Specific deep-dive feeding behaviour seems to have no impact on the prenatal investment of beaked whales and sperm whales, as these species exhibit a similar capital breeding strategy to baleen whales. Medium-bodied sirenians adopt an intermediate strategy between small-bodied and large-bodied toothed whales, suggesting their prenatal investment strategy is not affected by herbivorous habits. Overall, our results support the body-size hypothesis and breeding-substrate hypothesis and indicate that prenatal investment strategies of marine mammals are possibly not influenced by feeding habits or social behaviour. We suggest that effective conservation measures for small-bodied toothed whales and pinnipeds should prioritize the protection of habitats and minimize human disturbance, whereas conservation measures for large-bodied whales and beaked whales should focus on strategies to prevent substantial declines in population size.

1. Introduction

Prenatal investment refers to the energy and resources invested by parents during the prenatal period to ensure the survival and growth of their offspring [1]. This investment plays a crucial role in animal life cycles, not only constraining the rate of fetal growth and size at birth but also having long-lasting effects on offspring, influencing their growth, reproduction and survival [2,3,4]. Prenatal investment varies among different animal species and is influenced by various factors such as body size, availability of food, environmental conditions, and individual life history [5,6,7]. Understanding the prenatal investment of threatened species is essential for understanding their ability to adapt to changing environments and thus for developing effective conservation strategies [8].
Marine mammals play important roles in ocean ecosystems, serving as keystone species, apex predators, and important components of food chains [9,10]. Marine mammals include five different extant mammalian groups: cetaceans (whales, dolphins, and porpoises), pinnipeds (seals, sea lions, and walruses), sirenians (manatees and dugongs), marine and sea otters, and the polar bear [11]. These highly diverse groups encompass a wide range of body sizes, feeding habits and different levels of aquatic adaptation, and have significant differences in diets, life span, energy metabolism pattern, reproductive strategies and population growth rates [12,13]. Even within the same mammalian groups, notable differences can be well observed e.g., baleen whales are big, have a longer life span, low metabolic rate, and use their baleen plates to filter out zooplankton, while toothed whales are generally small, have high metabolic rate, high population growth rate, use echolocation to detect fish or cephalopod, and feed with teeth [12]. The differences in life history, physiology and ecological context for these species may be associated with substantial diversity in parental investment strategies. However, due to the challenge of data acquisition, most available parental investment studies of marine mammals have focused only on the lactation stage [14,15,16,17]. The few studies that have addressed prenatal investment in these animals have demonstrated that adult female body size is positively correlated with calf birth size [18] and plays a significant role in determining prenatal investment [19]. Additionally, the length of the gestation period and interbirth interval varies considerably among cetaceans, with this variation closely related to differences in reproductive energetic patterns [20]. Despite the importance of prenatal investment in determining the survival and success of marine mammal reproduction [19,20], understanding in this field remains limited. More research is needed to better understand the mechanisms and factors that influence prenatal investment of marine mammals and to develop effective conservation strategies based on the ecological requirements of species-specific variation in prenatal investment.
Both field observations and laboratory experiments have traditionally been used to study parental investment in many animal groups. However, meta-analysis has also been used recently to understand broad-scale patterns and variations in parental investment in marine mammals [20,21,22,23]. Data from meta-analyses can include a wide range of variables, such as body size, age, sex, and other reproductive characteristics [20,23,24]. These variables can have complex relationships with each other, making it challenging to analyse data and draw meaningful conclusions about prenatal investment strategies. One approach that is commonly used to deal with these complex relationships is dimension reduction, which involves reducing the data to a smaller and more manageable set of variables that capture the most important information within large datasets. Principal component analysis (PCA), factor analysis, and multivariate regression are the most classical dimension reduction methods [25]. However, in addition to these linear-based models, artificial neural networks are also considered as important tools for clustering, dimensionality reduction and visualizing complex data. Following the development of artificial intelligence technology, Kohonen self-organizing map (SOM), one of the most widely-used unsupervised artificial neural networks, has been increasingly applied in ecological research and environmental monitoring, as they can help to identify nonlinear patterns and relationships in complex datasets that would otherwise be difficult to discern [26,27,28,29]. SOMs have previously been used to characterize distributions and habitats of aquatic organisms [30,31], vocalization in some cetaceans [32,33], and habitat utilization of coastal dolphins [29], but so far have not been applied to prenatal investment in mammals.
Here, we utilize meta-analysis to collect data on the life history parameters of 75 species and apply SOM to gain a comprehensive understanding of prenatal investment patterns for all major taxonomic groups of marine mammals. Our objective is to gain insights into how life history parameters influence prenatal investment strategies of marine mammals and to make informed decisions about conservation strategies for these at-risk species.

2. Materials and Methods

2.1. Data Collection

Prenatal investment data were collected for 75 marine mammal species, including 29 pinnipeds, 41 cetaceans, 3 sirenians, 1 polar bear and 1 sea otter (Supplementary Material). Data were collected for six life history traits: adult female mass (Fm), birth mass (Bm), gestation duration (Gt), prenatal growth (rinG), interbirth interval (Ii), and duration of Life (Dol). These traits were selected because they are generally considered to be associated with prenatal investment [12,20] and are available for most species included in this study. Data were obtained from published references, books, or authoritative reports ([11,34,35,36,37,38]; detailed data sources refer to Supplementary Material). We used female adult body weight as a measure of body size [39], which plays a significant role in determining prenatal investment [19]. Adult female mass was not available for two cetacean species (Hyperoodon ampullatus, Balaenoptera borealis), so we used body length to estimate this value according to the linear relationship between the logarithm of weight and body length proposed by Trites and Pauly [40]. As previous studies have shown that there is a general allometric relationship between life history traits in mammals [41,42], unavailable data on birth mass or longevity for some cetacean species were estimated based on the mathematical relationship of:
log Y = a log M + log b ,
where Y is a life history trait such as birth mass and longevity, M represents adult body mass (or body length or volume), a is an allometric growth index, and b is a constant associated with the specific taxon. In addition, following Pontier et al. [43] and Huang et al. [20], rinG was calculated using Gt and Bm according to the following function:
r i n G = B m G t
If available data represented a value range, we used the midpoint as the representative value. In instances when multiple records of the same variable were available for a particular species, the mean of these records was utilized.

2.2. Algorithm of Self-Organizing Map

The SOM is a novel artificial neural network that serves as an unsupervised learning algorithm for the clustering and visualization of high-dimensional data [44]. This algorithm was developed to simulate the processing of input data as it occurs in the human brain [45]. The SOM algorithm employs a competitive learning strategy and a neighborhood function, which preserves the topological properties of the input space, setting it apart from other artificial neural networks such as error backpropagation [46]. At the beginning of the SOM process, each neuron is initially assigned random weights corresponding to each variable (6 in this study). When a sample is input, it falls into the neuron with weights closest to it (“winning neuron”), and then the weights of neighboring neurons are adjusted from closer to farther away accordingly. This dynamic mechanism equips the SOM algorithm to adeptly tackle intricate, nonlinear problems that involve multiple variables. Furthermore, the SOM algorithm does not require prior information about the dataset being analysed, allowing the algorithm to function as an exploratory technique for identifying patterns and similarities in data.
The crucial factor in the implementation of SOM is the selection of map size (i.e., number of output neurons). An appropriate map size is necessary to ensure that the patterns generated are not overly detailed or too generalized. Vesanto et al. [47] suggested that the optimal number of neurons is approximately 5* n 2 , where n represents the number of analysed samples, in this case, n = 75, resulting in a recommended map size of about 40. However, there are no absolute rules for determining optimal map size. To determine the best map size, the network was trained with varying map sizes ranging from 30 to 50, and resulting maps were evaluated using both quantization error and topographic error as measures of quality [48]. Quantization error is the average difference between input samples and their corresponding winning neurons (best matching units), reflecting the ability of SOM to represent the data, with smaller values indicating a better fit. Topographic error is the proportion of input samples with non-adjacent first- and second-best matching units on the feature maps, indicating how well the SOM preserves the topology of the data, with smaller values indicating better preservation [48].
SOM analysis was performed by utilizing the six life history parameters of each species as the input dataset. Normalization of variables was required before conducting the analysis, as the Euclidean metric was employed to measure the similarity (distance) between vectors, and it was thus necessary to ensure that each feature had an equal contribution to the calculation. Following the completion of SOM training, each species was assigned to a distinct output layer neuron. The output plane was then partitioned into clusters based on the similarity of the weight vectors of the output neurons. U-matrix and Ward clustering methods were both employed to determine the number of clusters and the boundaries of each cluster [49]. The U-matrix calculated the distance between adjacent output neurons and represented this in the form of gray-scale differences in the output plane, thus providing a rough picture of the clusters. Output neurons were then clustered using Ward’s method (sum of squares of deviations), which aimed to minimize the increase in the sum of squares of deviations within classes, thus gradually reducing the number of classes and eventually grouping them into one cluster [50]. Matlab version 7.0 (MathWorks, Natick, MA, USA) and SOM Toolbox 2.0 (http://www.cis.hut.fi/somtoolbox/download/ (accessed on 3 March 2023)) were used for the SOM learning process and clustering analyses.

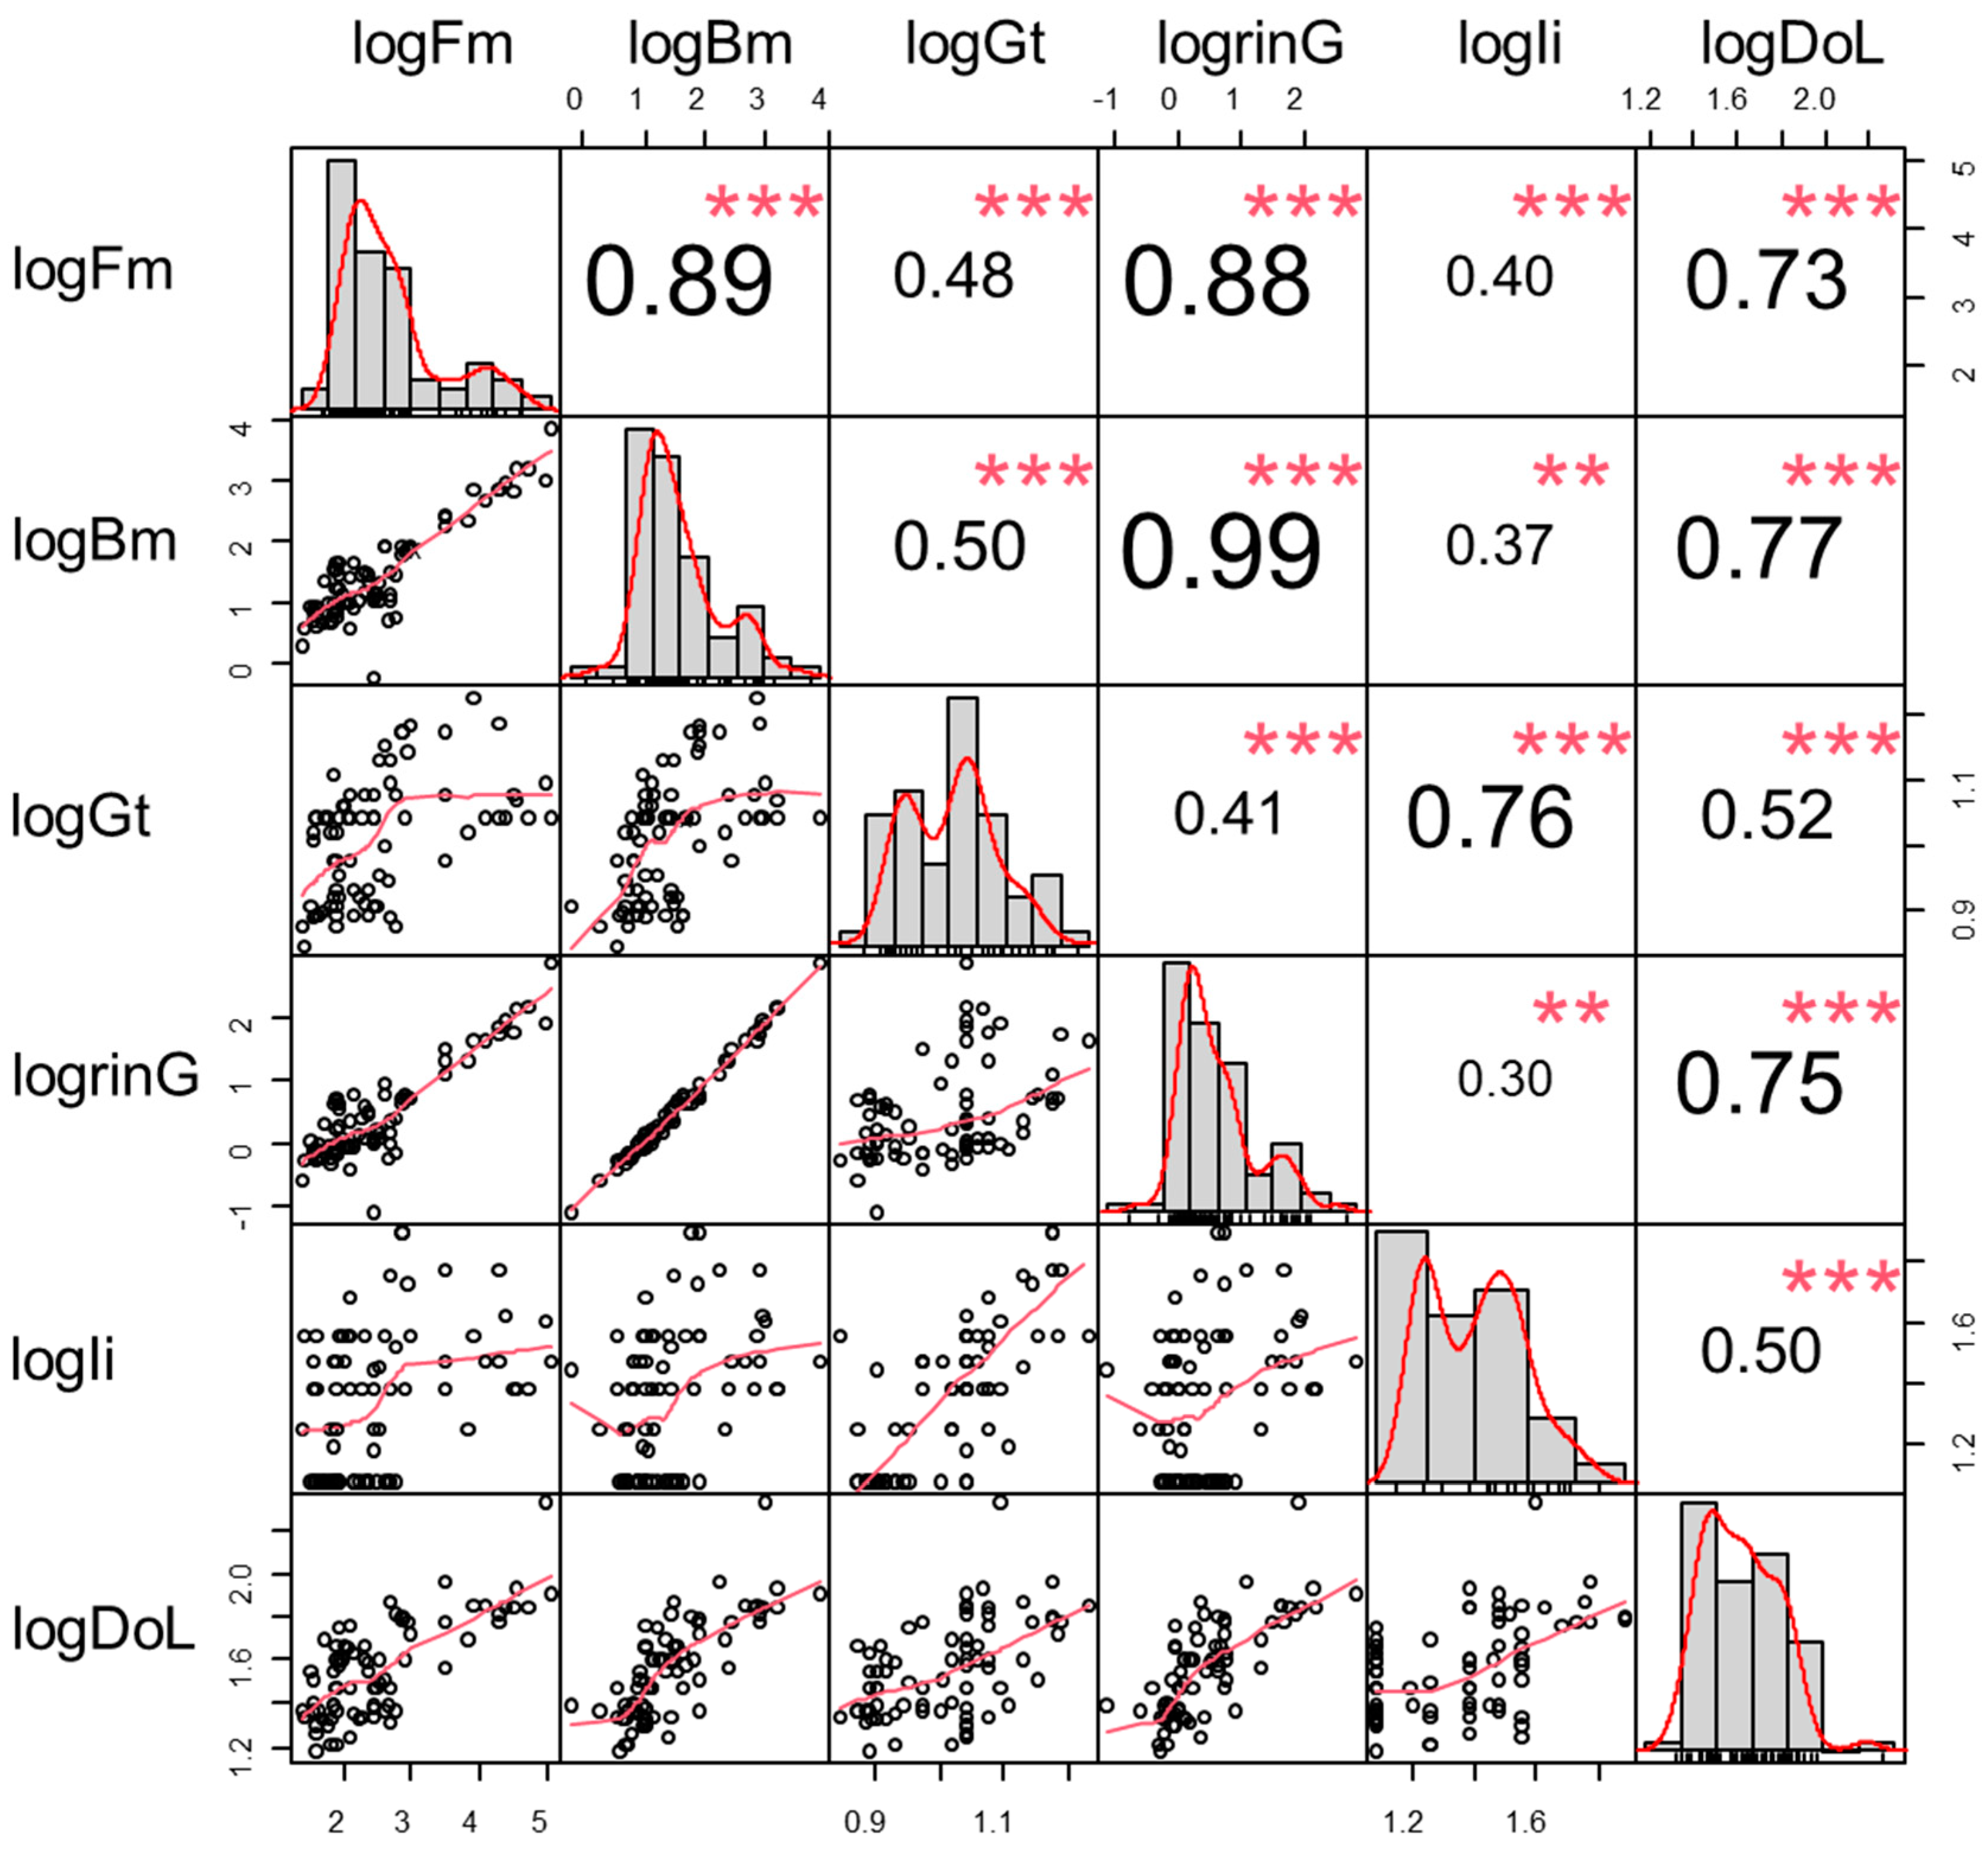
2.3. Statistical Analysis

After defining the boundaries of clusters using SOM, a Kruskal–Wallis ANOVA and Neminyi post-hoc test was employed to examine differences between mean values among clusters, as environmental parameters did not meet the assumption for a normal distribution (all p values < 0.01 using Shapiro–Wilk test). These statistical tests were performed in R version 3.6.3 [51].

3. Results

3.1. Life History Traits

Descriptive statistics of the six life history traits are given in Table 1. Prenatal investment patterns show considerable variability across marine mammals, with considerable collinearity existing among sampled variables. Across species, Fm ranged from 24 to 105,000 kg (mean ± SD = 5643.80 ± 17,641.19), Bm ranged from 0.60 to 7250 kg (mean ± SD = 236.54 ± 880.65), and rinG ranged from 0.08 to 659.09 kg/month (mean ± SD = 20.54 ± 79.49). Mean ± SD was 10.50 ± 2.32 months for Gt (range: 7–17), 25.83 ± 15.25 months for Ii (range: 12–78), and 41.87 ± 27.41 years for DoL (range: 15–211). Correlation analysis revealed a significant positive linear relationship between Fm and Bm (r = 0.89), Bm and rinG (r = 0.88), Fm and rinG (r = 0.99), and Gt and Ii (r = 0.76, all p < 0.001; Figure 1). In addition, DoL exhibited a strong positive correlation with both Fm and Bm, with coefficients of 0.73 (p < 0.001) and 0.77 (p < 0.001), respectively.

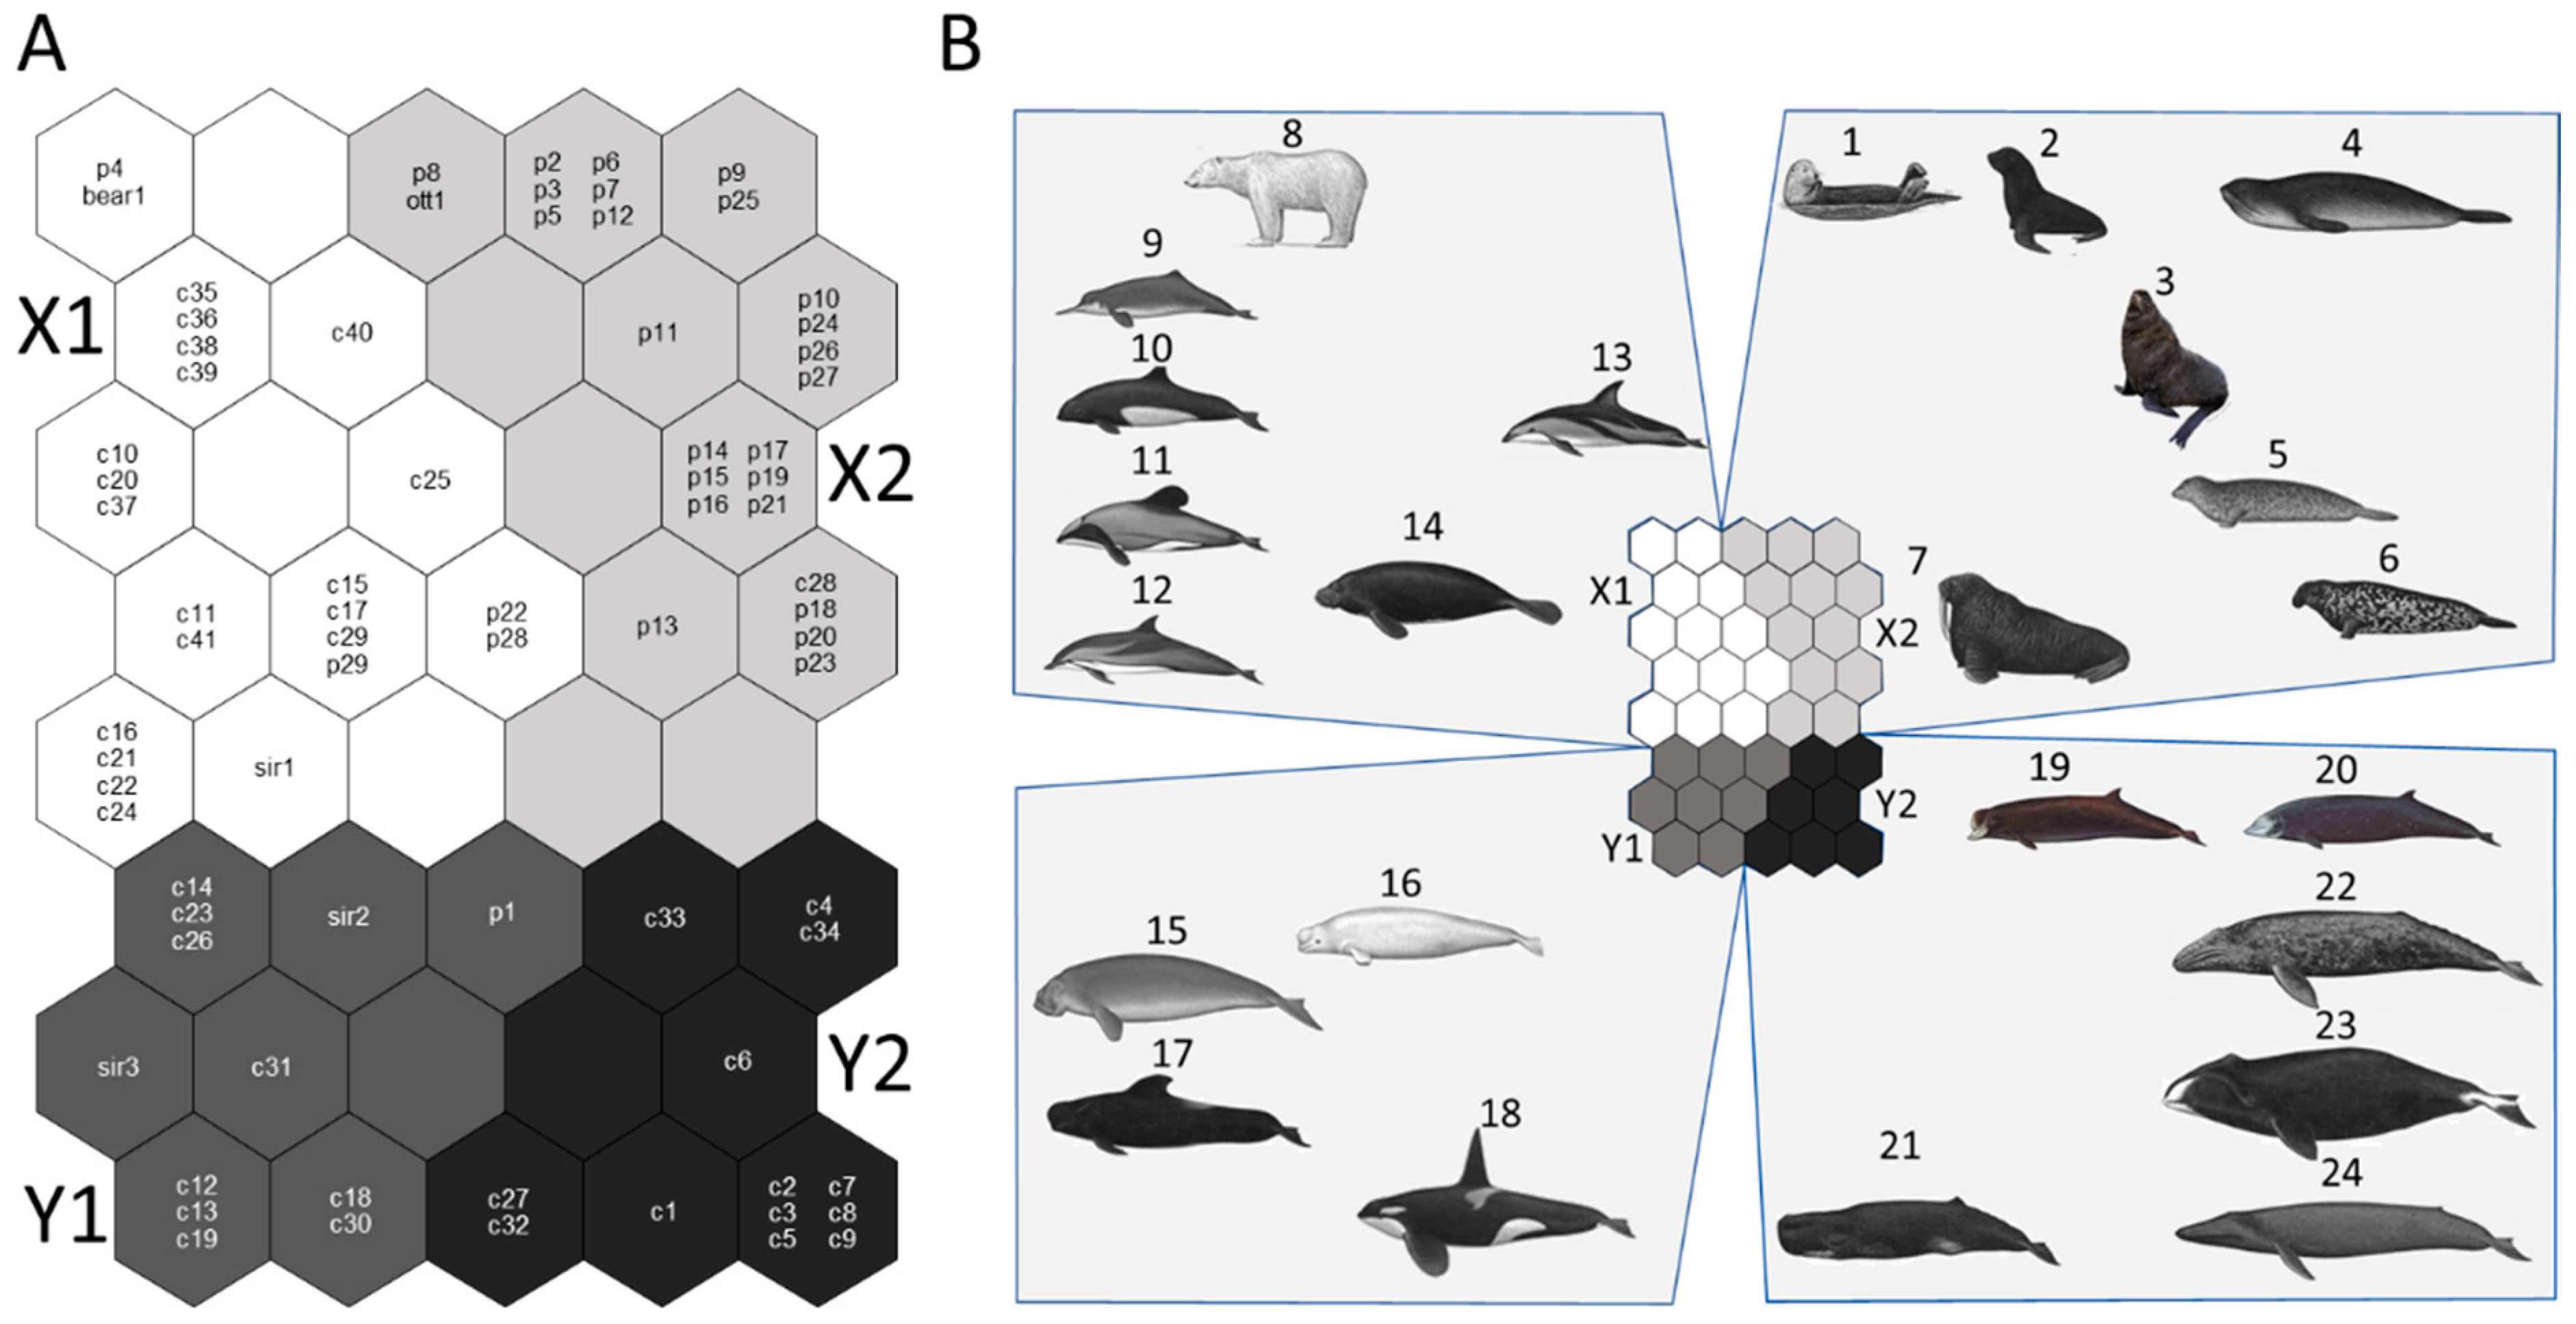
3.2. Optimal Map Size and Species Clustering

An optimal map size of 40 units (8 rows by 5 columns) was selected based on minimum quantization error and topographic error, to minimize the number of empty output neurons (neurons never chosen as winners). The training length for the final selection SOM was 450 in the rough training phase and 1650 in the fine-tuning phase, with a quantisation error of 0.185 and a topographic error of less than 0.001. The output neurons could be divided into two clusters (X and Y) and four subclusters (X1, X2, Y1, Y2) based on U matrix distance and the Ward clustering method (Figure 2). Of the four subclusters, X1, X2, and Y1 exhibited a higher degree of internal homogeneity as indicated by shading in the U matrix. Conversely, Y2 demonstrated comparatively substantial internal variability, indicating that neurons within this cluster exhibited a higher level of diversity and thus the species within this subcluster were more heterogeneous in trait space.
The distribution of species in the two clusters and four subclusters is shown in Figure 3A. In total, 83% of pinniped species (24 out of 29 species) were situated in subcluster X2. Conversely, nearly all cetaceans (40 out of 41 species) were found in subclusters X1, Y1 and Y2. Specifically, X1 was dominated by small-bodied toothed whales (Lipotidae, Phocoenidae, and most species of Delphinidae), accounting for 79% of the entire cluster (19 of 24 species); Y1 was represented by medium-bodied to large-bodied toothed whales (remaining species of Delphinidae), accounting for 75% of the cluster (9 out of 12 species); and Y2 comprised baleen whales (Balaenidae, Balaenopteridae, Eschrichtiidae), which make up 77% of the cluster (10 out of 13 species). All three sampled species of beaked whale and sperm whale were also located in Y2, indicating potential similarities in prenatal investment patterns between these taxa and baleen whales. All three sampled sirenians were located in the border area between subclusters X1 and Y1, while the polar bear and sea otter were situated in a peripheral position within subclusters X1 and X2, reflecting their unique status among marine mammals. Representative species of each subcluster are shown in Figure 3B.

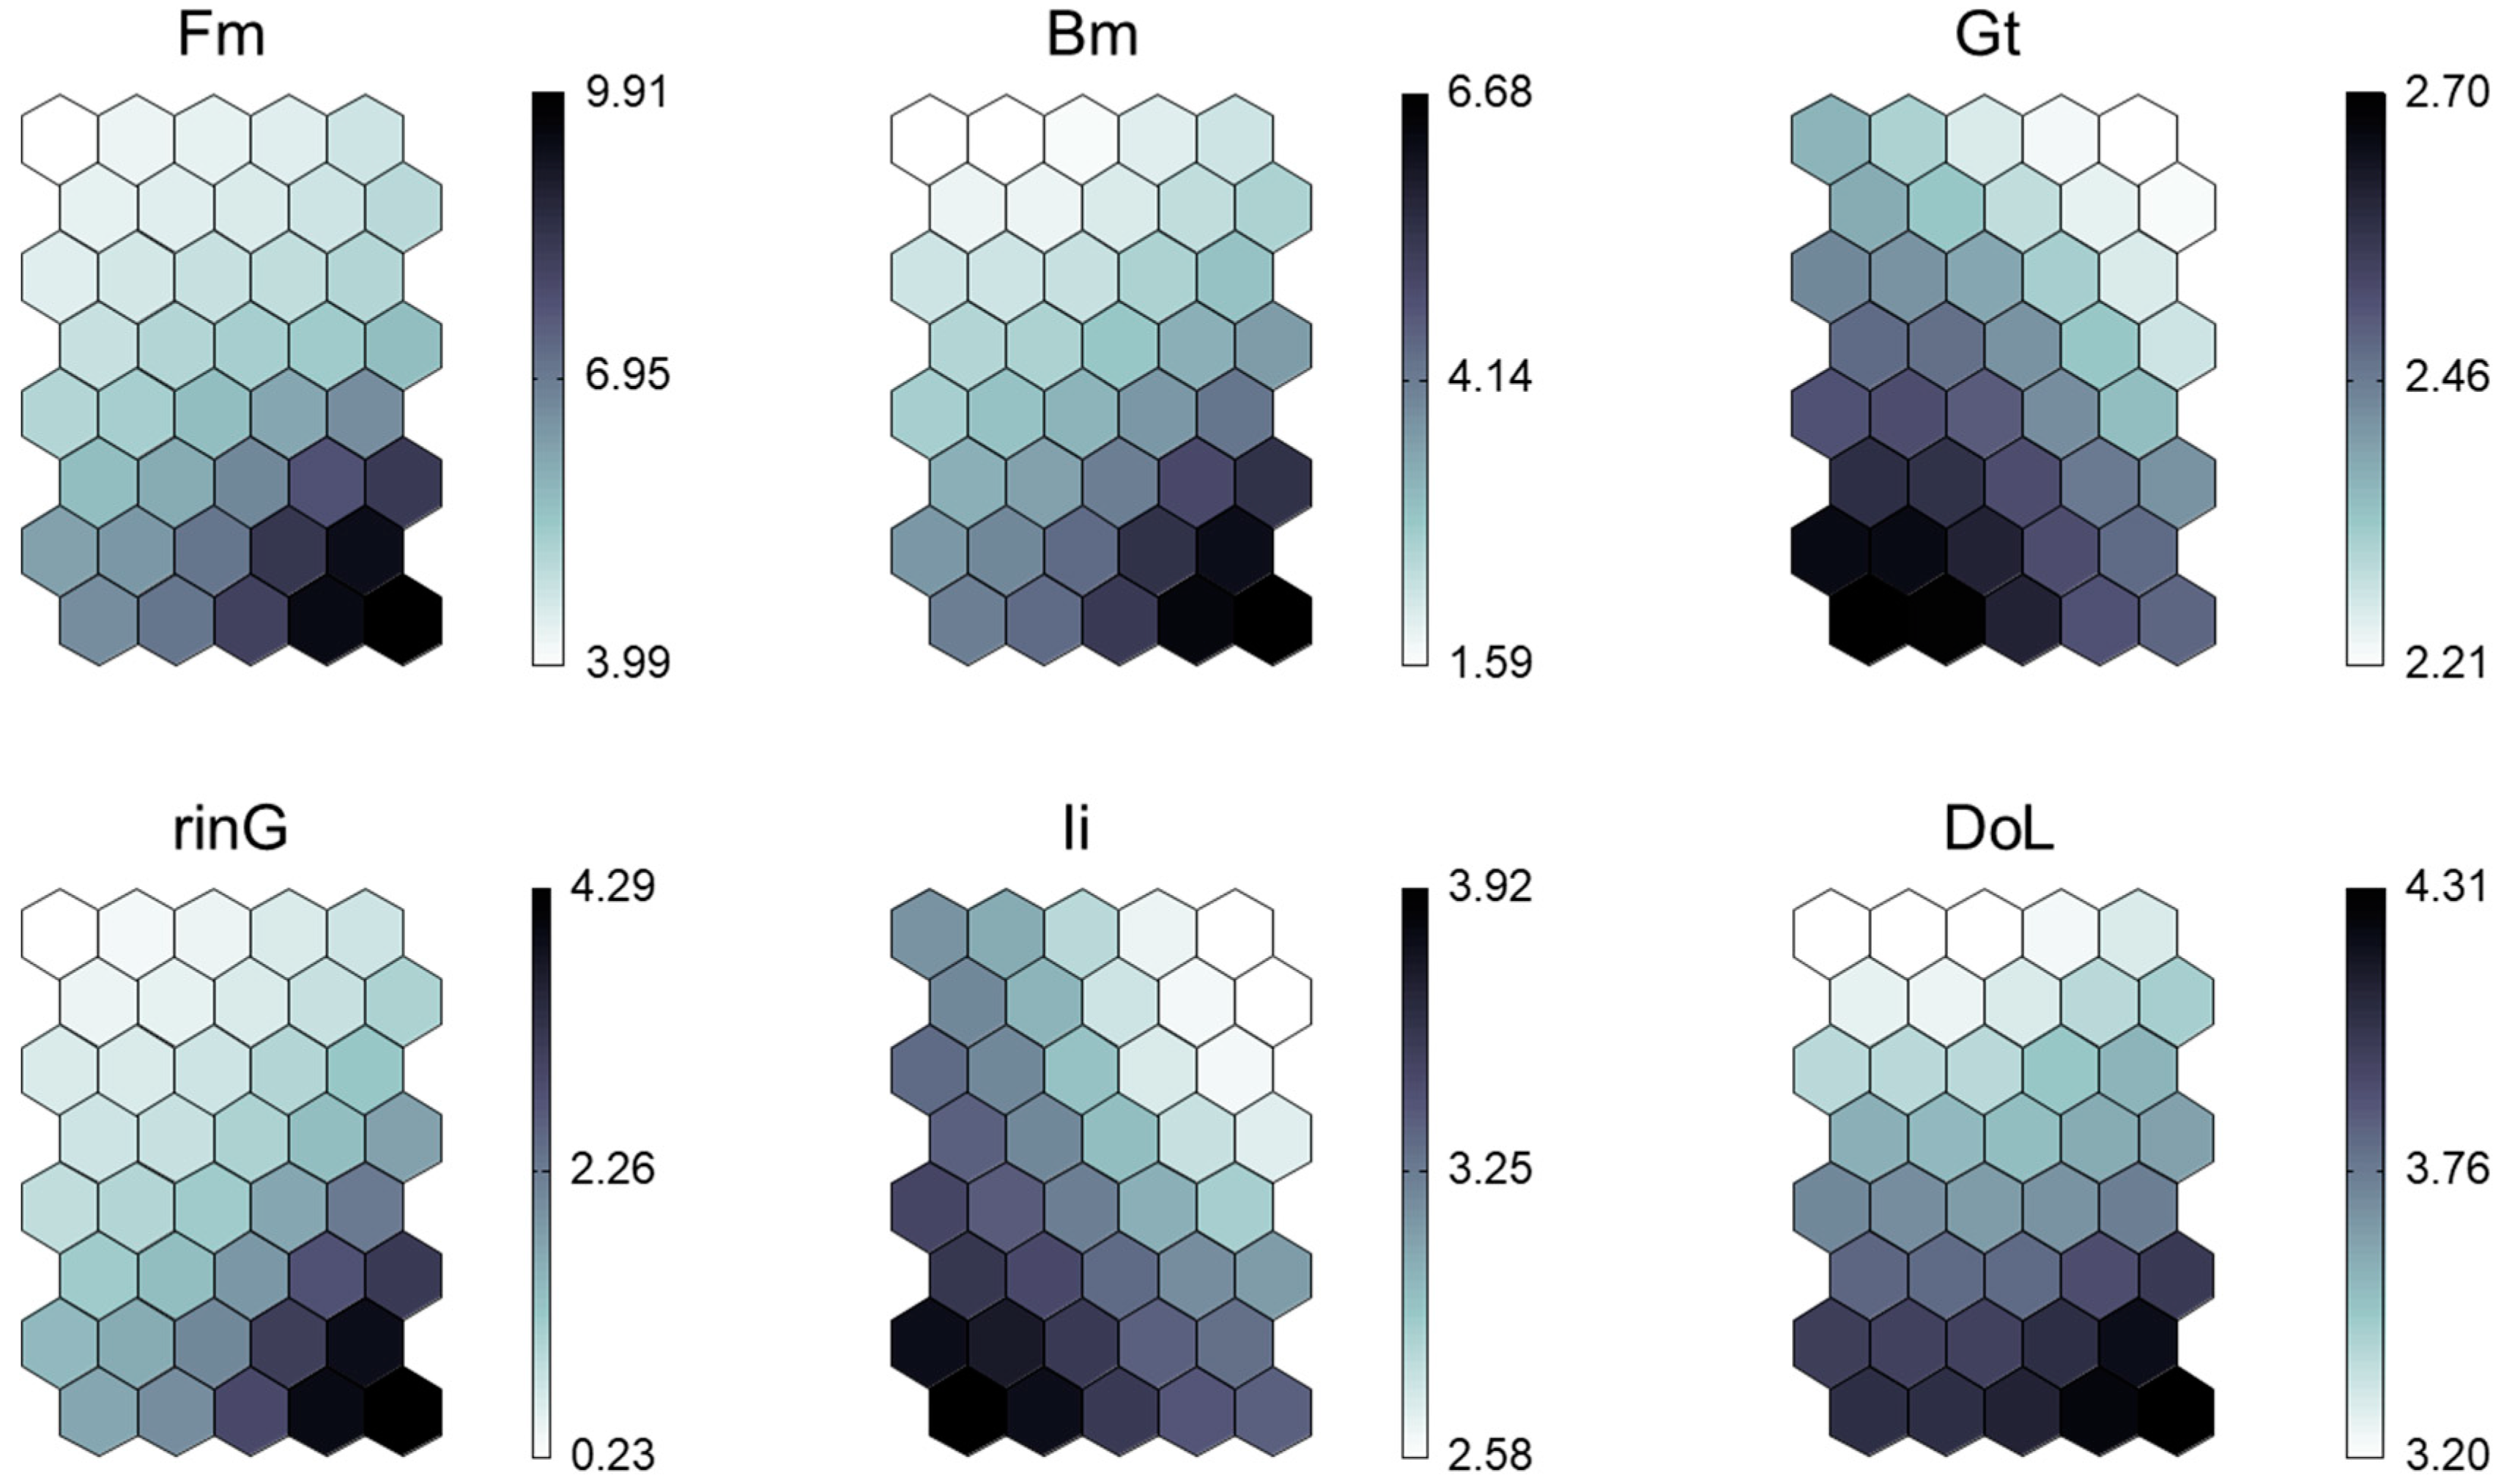
3.3. Trait Characteristics of Clusters

The component plane of each variable in each neuron on the SOM is shown in Figure 4. Grey-scale variation in the SOM planes shows clear distribution gradients for all six variables, and cluster X can be clearly separated from cluster Y by the lower values of Fm, Bm, rinG and Dol. Kruskal–Wallis ANOVA tests indicate that life history parameters were all significantly different between the four subclusters (p < 0.001; Table 2). Although X2 shares similar lower values of Fm, Bm and DoL with X1, it exhibits significantly lower values of Gt and Ii compared to all other subclusters (p < 0.001; Table 2). Subcluster Y1 is characterized by higher Fm and Bm, and longer Gt and Ii. Conversely, subcluster Y2 has much higher values of Fm and Bm compared to other subclusters, but a similar value of DoL to that of subcluster Y1.

4. Discussion

Our results show that SOM can cluster marine mammal species effectively based on life history traits and can visualize the six-dimensional variables into an understandable two-dimensional plane. Previous research on marine mammal life history has mainly concentrated on phenotypic correlation analysis for individual species, with only a small number of studies involving phenotypic correlation analysis across multiple species in cetaceans, otariids, seals and walruses [52,53,54,55]. Such correlation analysis lacks the ability to comprehensively analyse multiple variables, and it also has limitations for clustering multiple species. These deficiencies have led to the application of various dimensionality reduction methods to attempt to better understand relationships among different ecological parameters [20,56]. However, most traditional dimensionality reduction methods assume a linear relationship between variables, which may not be always satisfied in marine mammal life history research (Figure 1). Instead, our results show that SOM can preserve the topological structure of the data by maintaining relative distances and nonlinear relationships between data points compared to traditional dimensionality reduction methods. It also has the advantage of quantifying explanatory variables that contribute to clustering patterns (Figure 4), which is generally beyond the capability of other methods such as cluster analysis. It is important to note that SOM is an unsupervised learning model and does not control for phylogeny. Consequently, this paper did not take into account the impact of phylogeny on the conclusions regarding these species, as comparing evolutionary rates and modes in multivariate phenotypes remains an important aspect for future research and development [57].
Previous studies have suggested that body size plays an important role in determining the utilization of energy reserves during mammal reproduction [58]. The body-size hypothesis thus predicts that large body size coupled with large energy reserves and low mass-specific metabolic rate allows large females to rely solely on previously stored energy throughout breeding [24,59]. Therefore, two distinct reproductive strategies [60] can be recognized among species: one allocates resources to offspring predominantly derived from resources acquired during the breeding season (income breeding strategy), while the other allocates resources originating from energy reserves accumulated prior to the onset of the breeding season (capital breeding strategy). Larger whales instead tend to exhibit capital breeding, while smaller dolphins tend to display income breeding, as a result of differences in their energy reserve needs [61,62]. These differences in reproductive strategies have implications for prenatal investment during the gestation phase, which has been demonstrated in pinnipeds and cetaceans [20,59]. Our study examined prenatal investment across all marine mammal taxa for the first time and confirmed that species differences in body size correspond closely with reproductive patterns, representing the main parameter that defines the two main clusters X and Y (Figure 3). However, four distinct patterns (small-bodied toothed dolphins, pinnipeds, large-bodied toothed whales, baleen whales and beaked whales) were further clearly identified when all six life history variables were considered simultaneously (Table 2; Figure 4), indicating that prenatal investment patterns of marine mammals are also affected by other factors.
Our results found that gestation period and breeding interval, two important aspects of life history, varied among different marine mammal taxa. Both variables were significantly shorter in pinnipeds than in small-bodied toothed whales, despite similar body sizes in these two groups (Table 2, Figure 3). This difference may be due to variations in living environments and breeding habitats between them. Small-bodied toothed whales are fully aquatic and primarily inhabit ocean environments, where they complete all stages of their life history. Conversely, pinnipeds are semi-aquatic, usually inhabiting coastal areas and highly dependent on land or ice floes for birthing and nursing [63]. The breeding-substrate-stability hypothesis suggests that the very short lactation period of many pinniped species forces young calves to forage independently just a few weeks after birth, meaning that seasonal variation in prey availability can significantly affect calf survival rate [24,64]. The short gestation and reproductive interval of pinniped species may therefore represent an important adaptation to ensure successful seasonal reproduction. Combining this prenatal investment strategy with the ability of embryonic diapause, pinnipeds can guarantee the birth of offspring during periods of the year when environmental and food resources are most advantageous, thus maximizing reproductive success [65]. This speculation is further supported by the result of the polar bear. Despite of larger body size, the polar bear is clustered within the same grouping of small-bodied toothed whales and is close to pinnipeds in the SOM feature maps, indicating embryonic diapause and hibernation may allow it to ensure seasonality of the breeding cycle.
Conversely, the fully aquatic cetaceans and sirenians exhibit distinct patterns of prenatal investment, clearly differentiated as X1, Y1 and Y2 in the SOM (Figure 3). Notably, the three sampled sirenian species are positioned in the intermediate zone between small-bodied toothed whales (X1) and large-bodied toothed whales (Y1), indicating that they adopt an intermediate strategy of prenatal investment between income breeding and capital breeding. This strategy seems influenced by their medium-bodied body size (Figure 4), suggesting that herbivores’ feeding habits of these species have a minimal impact on prenatal investment strategies. All three sampled beaked whales are located in Y2, which otherwise mainly consists of baleen whales, agreeing with the previous conclusion of Huang et al. [20] that the reproductive strategy of these species is more akin to that of capital breeding. However, the selection of capital breeding in beaked whales might simply relate to their heavier adult female mass and birth mass (Figure 4, Table 2), but not to behavioral and energetic adaptations associated with their specific deep-dive-feeding niche as suggested by Huang et al. [20]. Moreover, our results do not support the conclusion that eusocial cetaceans have especially slow prenatal growth caused by social compensation too [20]. The reproductive investment of eusocial cetaceans, e.g., sperm whales (Physeter macrocephalus), killer whales (Orcinus orca), short- and long-finned pilot whales (Globicephala macrorhychus and G. melas) is highly correlated with their body-size but not behavioral system (Figure 3, Table 2). Due to the limited knowledge about how deep-diving and eusocial behaviour affect cetaceans’ reproductive biology [66]. Our conclusion about beaked whale and eusocial cetaceans breeding strategy is thus based on data from only a few species and requires further verification across more species. We recommend that further studies should attempt to study prenatal investment and energy reserves used in reproduction in beaked whales and eusocial cetaceans.
Conservation recommendations can be drawn from our findings. Small-bodied toothed whales and pinnipeds have a lower investment of resources and time in their offspring, resulting in the potentially reduced survival rate of their offspring. Given this reproductive strategy, it is crucial to prioritize the survival of their calves during conservation efforts to maximize the number of individuals reaching sexual maturity, thereby enhancing the population’s recovery rate. Consequently, effective conservation measures for these groups should potentially prioritize the protection of habitats and minimize human disturbance [67]. On the other hand, higher prenatal investment in large-bodied toothed whales and baleen whales might improve the survival rates of their offspring, suggesting that these species might be able to better maintain stable populations despite slower recovery rates. Consequently, conservation strategies for these groups should potentially instead be targeted at preventing substantial declines in their population size, associated with direct offtake (whaling) and bycatch. For example, the populations of sperm whales and gray whales in the North Pacific severely declined during the 1840s to 1860s and 1950s to 1970s due to heavy whaling, while the cessation or restriction of direct whaling had resulted in evident population recovery for both species [68,69]. High prenatal investment in sirenians is also associated with slower population recovery, indicating that these species are also sensitive to population change caused by human activities.

Supplementary Materials

The following supporting information can be downloaded at: https://www.mdpi.com/article/10.3390/jmse11112086/s1.

Author Contributions

Conceptualization, M.L. (Mingli Lin) and S.L.; methodology, M.L. (Mingli Lin), X.H. and M.L. (Mingming Liu); validation, M.L. (Mingli Lin), S.L. and S.T.T.; resources, S.L. and S.T.T.; data collection and curation, X.H. and M.L. (Mingli Lin); writing—original draft preparation, X.H., M.L. (Mingli Lin) and M.L. (Mingming Liu); writing—review and editing, X.H., M.L. (Mingli Lin), M.L. (Mingming Liu), S.T.T. and S.L.; funding acquisition, M.L. (Mingli Lin) and S.L.; supervision: S.L. and S.T.T. All authors have read and agreed to the published version of the manuscript.

Funding

This research was financially supported by the National Natural Science Foundation of China (42225604, 41406182, 41306169 and 41422604), and the Development Project of the Institute of Deep-sea Science and Engineering, Chinese Academy of Sciences (E072010101). This work was performed under Ethical Statement IDSSE-SYLL-MMMBL-01.

Institutional Review Board Statement

Not applicable.

Informed Consent Statement

Not applicable.

Data Availability Statement

The raw data supporting the conclusion of this article will be made available by the authors, without undue reservation.

Acknowledgments

We are grateful to Yingxue Gao, Zixin Yang and Mingyue Ouyang for their assistance in the management of the project.

Conflicts of Interest

The authors declare no conflict of interest. The funders had no role in the design of the study; in the collection, analyses, or interpretation of data; in the writing of the manuscript; or in the decision to publish the results.

References

  1. Trivers, R. Parental Investment and Sexual Selection; Biological Laboratories, Harvard University: Cambridge, MA, USA, 1972; pp. 136–179. [Google Scholar]
  2. Clutton-Brock, T.H. Reproductive Success: Studies of Individual Variation in Contrasting Breeding Systems; University of Chicago Press: Chicago, IL, USA, 1988; pp. 1–533. [Google Scholar]
  3. Mcnamara, J.M.; Szekely, T.; Webb, J.N.; Houston, A.I. A dynamic game-theoretic model of parental care. J. Theor. Biol. 2000, 205, 605–623. [Google Scholar] [CrossRef] [PubMed]
  4. Kokko, H.; Jennions, M.D. Parental investment, sexual selection and sex ratios. J. Evol. Biol. 2008, 21, 919–948. [Google Scholar] [CrossRef] [PubMed]
  5. Tallamy, D.W.; Wood, T.K. Convergence patterns in subsocial insects. Annu. Rev. Entomol. 1986, 31, 369–390. [Google Scholar] [CrossRef]
  6. Wilson, E.O. Sociobiology: The New Synthesis; Harvard University Press: Cambridge, MA, USA, 2000; pp. 1–720. [Google Scholar]
  7. Bonsall, M.B.; Klug, H. The evolution of parental care in stochastic environments. J. Evol. Biol. 2011, 24, 645–655. [Google Scholar] [CrossRef]
  8. Ferrière, R.; Dieckmann, U.; Couvet, D. Evolutionary Conservation Biology; Cambridge University Press: Cambridge, UK, 2004; pp. 1–428. [Google Scholar]
  9. Bowen, W.D. Role of marine mammals in aquatic ecosystems. Mar. Ecol. Prog. Ser. 1997, 158, 267–274. [Google Scholar] [CrossRef]
  10. Moore, S.E. Marine mammals as ecosystem sentinels. J. Mammal. 2008, 89, 534–540. [Google Scholar] [CrossRef]
  11. Jefferson, T.A.; Webber, M.A.; Pitman, R.L. Marine Mammals of the World; Academic Press: London, UK, 2015; pp. 1–608. [Google Scholar]
  12. Chivers, S.J. Cetacean Life History. In Encyclopedia of Marine Mammals; Academic Press: San Diego, CA, USA, 2009; pp. 215–220. [Google Scholar]
  13. Stephens, P.A.; Houston, A.I.; Harding, K.C.; Boyd, I.L.; McNamara, J.M. Capital and income breeding: The role of food supply. Ecology 2014, 95, 882–896. [Google Scholar] [CrossRef]
  14. McCann, T.S.; Fedak, M.A.; Harwood, J. Parental investment in southern elephant seals. Mirounga Leonina. Behav. Ecol. Sociobiol. 1989, 25, 81–87. [Google Scholar] [CrossRef]
  15. Boness, D.J.; Bowen, W.D. The evolution of maternal care in pinnipeds. BioScience 1996, 46, 645–654. [Google Scholar] [CrossRef]
  16. Oftedal, O.T. Use of maternal reserves as a lactation strategy in large mammals. Proc. Nutr. Soc. 2000, 59, 99–106. [Google Scholar] [CrossRef]
  17. Mann, J. Maternal Care and Offspring Development in Odontocetes. In Ethology and Behavioral Ecology of Odontocetes; Springer: Berlin/Heidelberg, Germany, 2019; pp. 95–116. [Google Scholar]
  18. Read, A.J. Trends in the maternal investment of harbour porpoises are uncoupled from the dynamics of their primary prey. Proc. R. Soc. Lond. B 2001, 268, 573–577. [Google Scholar] [CrossRef]
  19. Georges, J.Y.; Guinet, C. Prenatal investment in the subantarctic fur seal, Arctocephalus tropicalis. Can. J. Zool. 2001, 79, 601–609. [Google Scholar] [CrossRef]
  20. Huang, S.; Chou, L.; Shih, N.; Ni, I. Implication of life history strategies for prenatal investment in cetaceans. Mar. Mamm. Sci. 2010, 27, 182–194. [Google Scholar] [CrossRef]
  21. Schulz, T.M.; Bowen, W.D. Pinniped lactation strategies: Evaluation of data on maternal and offspring life history traits. Mar. Mamm. Sci. 2004, 20, 86–114. [Google Scholar] [CrossRef]
  22. Ferguson, S.H. The influences of environment, mating habitat, and predation on evolution of pinniped lactation strategies. J. Mamm. Evol. 2006, 13, 63–82. [Google Scholar] [CrossRef]
  23. Klein, C. Cetacean Maternal Investment: Importance in Conservation Across Species and Drivers for Interspecific Altruism. Master’s Thesis, University of South Florida, FL, USA, 2021; pp. 7–28. [Google Scholar]
  24. Schulz, T.M.; Bowen, W.D. The evolution of lactation strategies in pinnipeds: A phylogenetic analysis. Ecol. Monogr. 2005, 75, 159–177. [Google Scholar] [CrossRef]
  25. Fu, L. The discriminate analysis and dimension reduction methods of high dimension. Open. J. Soc. Sci. 2015, 3, 7–13. [Google Scholar] [CrossRef]
  26. Liu, Z.; Peng, C.; Xiang, W.; Tian, D.; Deng, X.; Zhao, M. Application of artificial neural networks in global climate change and ecological research: An overview. Chin. Sci. Bull. 2010, 55, 3853–3863. [Google Scholar] [CrossRef]
  27. Zarra, T.; Galang, M.G.; Ballesteros, F.; Belgiorno, V.; Naddeo, V. Environmental odour management by artificial neural network—A review. Environ. Int. 2019, 133, 105189. [Google Scholar] [CrossRef]
  28. Kang, H.; Jin Jeon, D.; Kim, S.; Jung, K. Estimation of fish assessment index based on ensemble artificial neural network for aquatic ecosystem in South Korea. Ecol. Indic. 2022, 136, 108708. [Google Scholar] [CrossRef]
  29. Lin, M.; Liu, M.; Dong, L.; Caruso, F.; Li, S. Modeling intraspecific variation in habitat utilization of the Indo-Pacific humpback dolphin using self-organizing map. Ecol. Indic. 2022, 144, 109466. [Google Scholar] [CrossRef]
  30. Park, Y.; Verdonschot, P.F.M.; Chon, T.; Lek, S. Patterning and predicting aquatic macroinvertebrate diversities using artificial neural network. Water Res. 2003, 37, 1749–1758. [Google Scholar] [CrossRef]
  31. Lin, M.; Lek, S.; Ren, P.; Li, S.; Li, W.; Du, X.; Guo, C.; Gozlan, R.E.; Li, Z. Predicting impacts of South-to-North Water Diversion Project on fish assemblages in Hongze Lake, China. J. Appl. Ichthyol. 2017, 33, 395–402. [Google Scholar] [CrossRef]
  32. Allen, J.A.; Murray, A.; Noad, M.J.; Dunlop, R.A.; Garland, E.C. Using self-organizing maps to classify humpback whale song units and quantify their similarity. J. Acoust. Soc. Am. 2017, 142, 1943–1952. [Google Scholar] [CrossRef]
  33. Usman, A.M.; Ogundile, O.O.; Versfeld, D.J.J. Review of automatic detection and classification techniques for cetacean vocalization. IEEE Access 2020, 8, 105181–105206. [Google Scholar] [CrossRef]
  34. Mann, J.; Connor, R.C.; Tyack, P.L.; Whitehead, H. Cetacean Societies: Field Studies of Dolphins and Whales; The University of Chicago Press: Chicago, IL, USA, 2000; pp. 1–448. [Google Scholar]
  35. NOAA Fisheries. NOAA Fisheries. 2000. Available online: https://www.fisheries.noaa.gov/ (accessed on 5 June 2023).
  36. Pomeroy, P. Reproductive cycles of marine mammals. Anim. Reprod. Sci. 2011, 124, 184–193. [Google Scholar] [CrossRef]
  37. Berta, A.; Kovacs, K.M.; Sumich, J.L. Marine Mammals: Evolutionary Biology; Academic Press: London, UK, 2015; pp. 1–738. [Google Scholar]
  38. Würsig, B.G.; Thewissen, J.G.M.; Kovacs, K.M. Encyclopedia of Marine Mammals; Academic Press: San Diego, CA, USA, 2018; pp. 1–1190. [Google Scholar]
  39. Cardillo, M.; Mace, G.M.; Gittleman, J.L.; Jones, K.E.; Bielby, J.; Purvis, A. The predictability of extinction: Biological and external correlates of decline in mammals. Proc. R. Soc. B 2008, 275, 1441–1448. [Google Scholar] [CrossRef]
  40. Trites, A.W.; Pauly, D. Estimating mean body masses of marine mammals from maximum body lengths. Can. J. Zool. 1998, 76, 886–896. [Google Scholar] [CrossRef]
  41. Blueweiss, L.; Fox, H.; Kudzma, V.; Nakashima, D.; Peters, R.; Sams, S. Relationships between body size and some life history parameters. Oecologia 1978, 37, 257–272. [Google Scholar] [CrossRef]
  42. Charnov, E.L. Evolution of life history variation among female mammals. Proc. Natl. Acad. Sci. USA 1991, 88, 1134–1137. [Google Scholar] [CrossRef]
  43. Pontier, D.; Gaillard, J.M.; Allainé, D.; Allaine, D. Maternal investment per offspring and demographic tactics in placental mammals. Oikos 1993, 66, 424. [Google Scholar] [CrossRef]
  44. Kohonen, T.; Honkela, T. Kohonen network. Scholarpedia 2007, 2, 1568. [Google Scholar] [CrossRef]
  45. Kohonen, T. Self-organized formation of topologically correct feature maps. Biol. Cybern. 1982, 43, 59–69. [Google Scholar] [CrossRef]
  46. Rumelhart, D.E.; Hinton, G.E.; Williams, R.J. Learning representations by back-propagating errors. Nature 1986, 323, 533–536. [Google Scholar] [CrossRef]
  47. Vesanto, J.; Himberg, J.; Alhoniemi, E.; Parhankangas, J. SOM toolbox for Matlab 5; Helsinki University of Technology Finland: Helsinki, Finland, 2000; p. 57. [Google Scholar]
  48. Kiviluoto, K. Topology Preservation in Self-organizing Maps. In Proceedings of the International Conference on Neural Networks (ICNN’96), Washington, DC, USA, 3–6 June 1996; pp. 294–299. [Google Scholar]
  49. Park, Y.S.; Chon, T.S.; Bae, M.J.; Kim, D.H.; Lek, S. Multivariate Data Analysis by Means of Self-organizing Maps. In Ecological Informatics; Springer: Berlin/Heidelberg, Germany, 2018; pp. 251–272. [Google Scholar]
  50. Legendre, P.; Legendre, L. Numerical Ecology; Elsevier: Amsterdam, Netherlands, 1998; pp. 1–870. [Google Scholar]
  51. R Development Core Team. R: A Language and Environment for Statistical Computing. R Foundation for Statistical Computing: Vienna, Austria. 2020. Available online: https://www.r-project.org/ (accessed on 25 July 2023).
  52. Kovacs, K.M.; Lavigne, D.M. Maternal investment in otariid seals and walruses. Can. J. Zool. 1992, 70, 1953–1964. [Google Scholar] [CrossRef]
  53. Lockyer, C. All creatures great and smaller: A study in cetacean life history energetics. J. Mar. Biol. Assoc. UK 2007, 87, 1035–1045. [Google Scholar] [CrossRef]
  54. Roff, D.A. Contributions of genomics to life-history theory. Nat. Rev. Genet. 2007, 8, 116–125. [Google Scholar] [CrossRef]
  55. Huang, S.; Chou, L.; Ni, I. Comparable length at weaning in cetaceans. Mar. Mamm. Sci. 2009, 25, 875–887. [Google Scholar] [CrossRef]
  56. Churchill, M.; Clementz, M.T.; Kohno, N. Predictive equations for the estimation of body size in seals and sea lions (Carnivora: Pinnipedia). J. Anat. 2014, 225, 232–245. [Google Scholar] [CrossRef]
  57. Adams, D.C.; Collyer, M.L. Phylogenetic comparative methods and the evolution of multivariate phenotypes. Annu. Rev. Ecol. Evol. Syst. 2019, 50, 405–425. [Google Scholar] [CrossRef]
  58. Tuomi, J. Mammalian reproductive strategies: A generalized relation of litter size to body size. Oecologia 1980, 45, 39–44. [Google Scholar] [CrossRef]
  59. Geffen, E.; Gompper, M.E.; Gittleman, J.L.; Luh, H.K.; MacDonald, D.W.; Wayne, R.K. Size, life-history traits, and social organization in the Canidae: A reevaluation. Am. Nat. 1996, 147, 140–160. [Google Scholar] [CrossRef]
  60. Houston, A.I.; Stephens, P.A.; Boyd, I.L.; Harding, K.C.; McNamara, J.M. Capital or income breeding? A theoretical model of female reproductive strategies. Behav. Ecol. 2006, 18, 241–250. [Google Scholar] [CrossRef]
  61. Jonsson, K.I. Capital and income breeding as alternative tactics of resource use in reproduction. Oikos 1997, 78, 57–66. [Google Scholar] [CrossRef]
  62. Ejsmond, M.J.; Varpe, Ø.; Czarnoleski, M.; Kozłowski, J. Seasonality in offspring value and trade-offs with growth explain capital breeding. Am. Nat. 2015, 186, 111–125. [Google Scholar] [CrossRef]
  63. Boyd, I.L. Time and energy constraints in pinniped lactation. Am. Nat. 1998, 152, 717–728. [Google Scholar] [CrossRef] [PubMed]
  64. Horning, M.; Mellish, J.A.E. Predation on an upper trophic marine predator, the Steller sea lion: Evaluating high juvenile mortality in a density dependent conceptual framework. PLoS ONE 2012, 7, e30173. [Google Scholar] [CrossRef] [PubMed]
  65. Boyd, I.L. Environmental and physiological factors controlling the reproductive cycles of pinnipeds. Can. J. Zool. 1991, 69, 1135–1148. [Google Scholar] [CrossRef]
  66. New, L.F.; Moretti, D.J.; Hooker, S.K.; Costa, D.P.; Simmons, S.E. Using energetic models to investigate the survival and reproduction of beaked whales (family Ziphiidae). PLoS ONE 2013, 8, e68725. [Google Scholar] [CrossRef]
  67. Senigaglia, V.; Christiansen, F.; Sprogis, K.R. Food-provisioning negatively affects calf survival and female reproductive success in bottlenose dolphins. Sci. Rep. 2019, 9, 8981. [Google Scholar] [CrossRef]
  68. Whitehead, H.; Shin, M. Current global population size, post-whaling trend and historical trajectory of sperm whales. Sci. Rep. 2022, 12, 19468. [Google Scholar] [CrossRef] [PubMed]
  69. Swartz, S.L.; Taylor, B.L.; Rugh, D.J. Gray whale Eschrichtius robustus population and stock identity. Mamm. Rev. 2006, 36, 66–84. [Google Scholar] [CrossRef]
Figure 1. Plot of correlation analysis between the logarithmic transfer of six prenatal investment variables (Fm: adult female mass, Bm: birth mass, Gt: gestation duration, rinG: prenatal growth, Ii: interbirth interval, DoL: duration of Life) for 75 marine mammal species. The plot on the diagonal shows the bar chart of the distribution of variables; bottom left shows scatter plots between variables; top right shows Pearson correlation coefficients and significance levels (** and *** indicate p < 0.01 and p < 0.001, respectively).
Jmse 11 02086 g001
Figure 2. A self-organizing map formed by 40 hexagons representing neurons. The two neuronal clusters (X, Y) and four subclusters (X1, X2, Y1, Y2) are distinguished on the basis of the U-matrix (dark shading indicates substantial disparities between neurons) and a hierarchical cluster analysis with Ward linkage method using a Euclidean distance measure.
Jmse 11 02086 g002
Figure 3. Distribution of 75 marine mammal species (A) and representative species of each cluster (B) in the self-organizing map. (A) Different letters indicate taxonomic group (c: cetacean; p: pinniped; sir: manatee; bear: polar bear; ot: sea otter); different base colours indicate range of individual neuronal clusters (X1, X2, Y1, Y2); and codes after letters represent species numbers. (B) Position of each species in outer frame reflects its relative position on the map. (1) Sea otter (Enhydra lutris); (2) Galapagos fur seal (Arctocephalus galapagoensis); (3) Northern fur seal (Callorhinus ursinus); (4) Ross seal (Ommatophoca rossii); (5) Harbor seal (Phoca vitulina); (6) Hooded seal (Cystophora cristata); (7) Walrus (Odobenus rosmarus); (8) Polar bear (Ursus maritimus); (9) Baiji (Lipotes vexillifer); (10) Dall’s porpoise (Phocoenoides dalli); (11) Hector’s dolphin (Cephalorhynchus hectori); (12) Striped dolphin (Stenella coeruleoalba); (13) Dusky dolphin (Lagenorhynchus obscurus); (14) Amazonian manatee (Trichechus inunguis); (15) Dugong (Dugong dugon); (16) Beluga (Delphinapterus leucas); (17) Short-finned pilot whale (Globicephala macrorhynchus); (18) Killer whale (Orcinus orca); (19) Northern bottlenose whale (Hyperoodon ampullatus); (20) Cuvier’s beaked whale (Ziphius cavirostris); (21) Sperm whale (Physeter macrocephalus); (22) Gray whale (Eschrichtius robustus); (23) Bowhead whale (Balaena mysticetus); (24) Blue whale (Balaenoptera musculus).
Jmse 11 02086 g003
Figure 4. Distribution pattern of six life history trait variables (Fm: adult female mass, Bm: birth mass, Gt: gestation duration, rinG: prenatal growth, Ii: interbirth interval, DoL: duration of Life) for marine mammals in self-organizing map (SOM). Dark indicates high value of corresponding parameter, and light indicates low value.
Jmse 11 02086 g004
Table 1. Descriptive statistics for six life history trait variables collected from 75 marine mammal species.
AbbrVariablesRangeMean ± SD
FmAdult female mass (kg)24.00–105,000.005643.80 ± 17,641.19
BmBirth mass (kg)0.60–7250.00236.54 ± 880.65
GtGestation duration (m)7.00–17.0010.50 ± 2.32
rinGPrenatal growth (kg/m)0.08–659.0920.54 ± 79.49
IiInterbirth interval (m)12.00–78.0025.83 ± 15.25
DoLDuration of Life (y)15.00–211.0041.87 ± 27.41
Table 2. Means ± standard deviations of life history trait variables for the four clusters identified in the self-organizing map model. Means that do not share a letter are significantly different (p < 0.05). Fm: adult female mass (kg), Bm: birth mass (kg), Gt: gestation duration (months), rinG: prenatal growth (kg/month), Ii: interbirth interval (months), DoL: duration of Life (years).
VariableCluster X1Cluster X2Cluster Y1Cluster Y2p
Mean ± SDMean ± SDMean ± SDMean ± SD
logFm2.01 ± 0.35 a2.03 ± 0.39 a2.78 ± 0.35 b4.26 ± 0.50 b***
logBm0.96 ± 0.36 a1.09 ± 0.41 a1.65 ± 0.37 b2.88 ± 0.40 b***
logGt1.02 ± 0.06 a0.91 ± 0.04 b1.13 ± 0.05 c1.07 ± 0.07 ac***
logrinG−0.07 ± 0.33 a0.17 ± 0.40 ab0.52 ± 0.34 bc1.80 ± 0.40 c***
logIi1.40 ± 0.14 a1.09 ± 0.05 b1.65 ± 0.17 a1.48 ± 0.14 a***
logDoL1.43 ± 0.13 a1.46 ± 0.16 a1.74 ± 0.12 b1.85 ± 0.17 b***
*** indicates significance level < 0.001.
Disclaimer/Publisher’s Note: The statements, opinions and data contained in all publications are solely those of the individual author(s) and contributor(s) and not of MDPI and/or the editor(s). MDPI and/or the editor(s) disclaim responsibility for any injury to people or property resulting from any ideas, methods, instructions or products referred to in the content.

