
Potential Use of Image Analysis in Breeding Programs for Growth and Yield Traits in Meagre (Argyrosomus regius)

 ,
, 
Abstract
:1. Introduction
2. Materials and Methods
2.1. Biological Material
2.2. Slaughtering, Image Capturing, and Sampling
2.3. Images Analysis
2.4. Genotyping
2.5. Statistical Data Analysis
3. Results
3.1. Phenotyping
3.2. Heritability and Correlations
4. Discussion
5. Conclusions
Author Contributions
Funding
Institutional Review Board Statement
Informed Consent Statement
Data Availability Statement
Conflicts of Interest
References
- Carvalho, M.; Peres, H.; Saleh, R.; Fontanillas, R.; Rosenlund, G.; Oliva-Teles, A.; Izquierdo, M. Dietary Requirement for N-3 Long-Chain Polyunsaturated Fatty Acids for Fast Growth of Meagre (Argyrosomus regius, Asso 1801) Fingerlings. Aquaculture 2018, 488, 105–113. [Google Scholar] [CrossRef]
- DIVERSIFY: New Species for EU Aquaculture. 2018. Available online: https://www.diversifyfish.eu/ (accessed on 25 August 2023).
- APROMAR Informe la Acuicultura en España. 2022. Available online: http://www.apromar.es/ (accessed on 28 August 2023).
- Fountoulaki, E.; Grigorakis, K.; Kounna, C.; Rigos, G.; Papandroulakis, N.; Diakogeorgakis, J.; Kokou, F. Growth Performance and Product Quality of Meagre (Argyrosomus regius) Fed Diets of Different Protein/Lipid Levels at Industrial Scale. Ital. J. Anim. Sci. 2017, 16, 685–694. [Google Scholar] [CrossRef]
- Roo, J.; Hernández-Cruz, C.M.; Borrero, C.; Schuchardt, D.; Fernández-Palacios, H. Effect of Larval Density and Feeding Sequence on Meagre (Argyrosomus regius; Asso, 1801) Larval Rearing. Aquaculture 2010, 302, 82–88. [Google Scholar] [CrossRef]
- Vallecillos, A.; María-Dolores, E.; Villa, J.; Rueda, F.M.; Carrillo, J.; Ramis, G.; Soula, M.; Afonso, J.M.; Armero, E. Phenotypic and Genetic Components for Growth, Morphology, and Flesh-Quality Traits of Meagre (Argyrosomus regius) Reared in Tank and Sea Cage. Animals 2021, 11, 3285. [Google Scholar] [CrossRef] [PubMed]
- Johnston, I.A.; Li, X.; Vieira, V.L.A.; Nickell, D.; Dingwall, A.; Alderson, R.; Campbell, P.; Bickerdike, R. Muscle and Flesh Quality Traits in Wild and Farmed Atlantic Salmon. Aquaculture 2006, 256, 323–336. [Google Scholar] [CrossRef]
- León-Bernabeu, S.; Shin, H.S.; Lorenzo-Felipe, Á.; García-Pérez, C.; Berbel, C.; Elalfy, I.S.; Armero, E.; Pérez-Sánchez, J.; Arizcun, M.; Zamorano, M.J.; et al. Genetic Parameter Estimations of New Traits of Morphological Quality on Gilthead Seabream (Sparus aurata) by Using IMAFISH_ML Software. Aquac. Rep. 2021, 21, 100883. [Google Scholar] [CrossRef]
- Freitas, M.V.; Lemos, C.G.; Ariede, R.B.; Agudelo, J.F.G.; Neto, R.R.O.; Borges, C.H.S.; Mastrochirico-Filho, V.A.; Porto-Foresti, F.; Iope, R.L.; Batista, F.M.; et al. High-Throughput Phenotyping by Deep Learning to Include Body Shape in the Breeding Program of Pacu (Piaractus mesopotamicus). Aquaculture 2023, 562, 738847. [Google Scholar] [CrossRef]
- Kankainen, M.; Setälä, J.; Kause, A.; Quinton, C.; Airaksinen, S.; Koskela, J. Economic Values of Supply Chain Productivity and Quality Traits Calculated for a Farmed European Whitefish Breeding Program. Aquac. Econ. Manag. 2016, 20, 131–164. [Google Scholar] [CrossRef]
- Fraslin, C.; Dupont-Nivet, M.; Haffray, P.; Bestin, A.; Vandeputte, M. How to Genetically Increase Fillet Yield in Fish: New Insights from Simulations Based on Field Data. Aquaculture 2018, 486, 175–183. [Google Scholar] [CrossRef]
- Prchal, M.; Vandeputte, M.; Gela, D.; Doležal, M.; Buchtová, H.; Rodina, M.; Flajšhans, M.; Kocour, M. Estimation of Genetic Parameters of Fatty Acids Composition in Flesh of Market Size Common Carp (Cyprinus carpio L.) and Their Relation to Performance Traits Revealed That Selective Breeding Can Indirectly Affect Flesh Quality. Czech J. Anim. Sci. 2018, 63, 280–291. [Google Scholar] [CrossRef]
- Janssen, K.; Chavanne, H.; Berentsen, P.; Komen, H. Impact of Selective Breeding on European Aquaculture. Aquaculture 2017, 472, 8–16. [Google Scholar] [CrossRef]
- Garber, A.F.; Amini, F.; Gezan, S.A.; Swift, B.D.; Hodkinson, S.E.; Nickerson, J.; Bridger, C.J. Genetic and Phenotypic Evaluation of Harvest Traits from a Comprehensive Commercial Atlantic Salmon, Salmo salar L., Broodstock Program. Aquaculture 2019, 503, 242–253. [Google Scholar] [CrossRef]
- Quinton, C.D.; McMillan, I.; Glebe, B.D. Development of an Atlantic Salmon (Salmo salar) Genetic Improvement Program: Genetic Parameters of Harvest Body Weight and Carcass Quality Traits Estimated with Animal Models. Aquaculture 2005, 247, 211–217. [Google Scholar] [CrossRef]
- Neira, R.; Lhorente, J.P.; Araneda, C.; Díaz, N.; Bustos, E.; Alert, A. Studies on Carcass Quality Traits in Two Populations of Coho Salmon (Oncorhynchus kisutch): Phenotypic and Genetic Parameters. Aquaculture 2004, 241, 117–131. [Google Scholar] [CrossRef]
- Fernandes, A.F.A.; Silva, M.D.A.; Alvarenga, E.R.D.; Teixeira, E.D.A.; Silva Junior, A.F.D.; Alves, G.F.D.O.; Salles, S.C.M.D.; Manduca, L.G.; Turra, E.M. Morphometric Traits as Selection Criteria for Carcass Yield and Body Weight in Nile Tilapia (Oreochromis niloticus L.) at Five Ages. Aquaculture 2015, 446, 303–309. [Google Scholar] [CrossRef]
- Maldonado Turra, E.; Aparecida Andrade de Oliveira, D.; Dourado Valente, B.; de Alencar Teixeira, E.; de Assis Prado, S.; Ramos de Alvarenga, É.; Chemim de Melo, D.; Silva Felipe, V.P.; Araújo Fernandes, A.F.; de Almeida e Silva, M. Longitudinal Genetic Analyses of Fillet Traits in Nile Tilapia, Oreochromis niloticus. Aquaculture 2012, 356–357, 381–390. [Google Scholar] [CrossRef]
- Vandeputte, M.; Puledda, A.; Tyran, A.S.; Bestin, A.; Coulombet, C.; Bajek, A.; Baldit, G.; Vergnet, A.; Allal, F.; Bugeon, J.; et al. Investigation of Morphological Predictors of Fillet and Carcass Yield in European Sea Bass (Dicentrarchus labrax) for Application in Selective Breeding. Aquaculture 2017, 470, 40–49. [Google Scholar] [CrossRef]
- Navarro, A.; Zamorano, M.J.; Hildebrandt, S.; Ginés, R.; Aguilera, C.; Afonso, J.M. Estimates of Heritabilities and Genetic Correlations for Growth and Carcass Traits in Gilthead Seabream (Sparus auratus L.), under Industrial Conditions. Aquaculture 2009, 289, 225–230. [Google Scholar] [CrossRef]
- Navarro, A.; Zamorano, M.J.; Hildebrandt, S.; Ginés, R.; Aguilera, C.; Afonso, J.M. Estimates of Heritabilities and Genetic Correlations for Body Composition Traits and G × E Interactions, in Gilthead Seabream (Sparus auratus L.). Aquaculture 2009, 295, 183–187. [Google Scholar] [CrossRef]
- García-Celdrán, M.; Ramis, G.; Manchado, M.; Estévez, A.; Navarro, A.; Armero, E. Estimates of Heritabilities and Genetic Correlations of Raw Flesh Quality Traits in a Reared Gilthead Sea Bream (Sparus aurata L.) Population Sourced from Broodstocks along the Spanish Coasts. Aquaculture 2015, 446, 181–186. [Google Scholar] [CrossRef]
- Nousias, O.; Tsakogiannis, A.; Duncan, N.; Villa, J.; Tzokas, K.; Estevez, A.; Chatziplis, D.; Tsigenopoulos, C.S. Parentage Assignment, Estimates of Heritability and Genetic Correlation for Growth-Related Traits in Meagre Argyrosomus regius. Aquaculture 2020, 518, 734663. [Google Scholar] [CrossRef]
- Navarro, A.; Lee-Montero, I.; Santana, D.; Henríquez, P.; Ferrer, M.A.; Morales, A.; Soula, M.; Badilla, R.; Negrín-Báez, D.; Zamorano, M.J.; et al. IMAFISH_ML: A Fully-Automated Image Analysis Software for Assessing Fish Morphometric Traits on Gilthead Seabream (Sparus aurata L.), Meagre (Argyrosomus regius) and Red Porgy (Pagrus pagrus). Comput. Electron. Agric. 2016, 121, 66–73. [Google Scholar] [CrossRef]
- Vallecillos, A.; María-Dolores, E.; Villa, J.; Rueda, F.M.; Carrillo, J.; Ramis, G.; Soula, M.; Afonso, J.M.; Armero, E. Development of the First Microsatellite Multiplex PCR Panel for Meagre (Argyrosomus regius), a Commercial Aquaculture Species. Fishes 2022, 7, 117. [Google Scholar] [CrossRef]
- Misztal, I.; Tsuruta, S.; Lourenco, D.; Aguilar, I.; Legarra, A.; Vitezica, Z. BLUPF90 Family of Programs; University of Georgia: Athens, GA, USA, 2015; pp. 1–125. [Google Scholar]
- R Development Core Team. R: A Language and Environment for Statistical Computing; R Foundation for Statistical Computing: Vienna, Austria, 2020; Available online: https://www.R-project.org/ (accessed on 28 August 2023).
- Poli, B.M.; Zampacavallo, G.; Iurzan, F.; Mecatti, M.; Lupi, P.; Bonelli, A. Preliminary Results on Quality and Quality Changes in Reared Meagre (Argyrosomus regius): Body and Fillet Traits and Freshness Changes in Refrigerated Commercial-Size Fish. Aquac. Int. 2003, 11, 301–311. [Google Scholar] [CrossRef]
- Piccolo, G.; Bovera, F.; De Riu, N.; Marono, S.; Salati, F.; Cappuccinelli, R.; Moniello, G. Effect of Two Different Protein/Fat Ratios of the Diet on Meagre (Argyrosomus regius) Traits. Ital. J. Anim. Sci. 2008, 7, 363–371. [Google Scholar] [CrossRef]
- Elalfy, I.; Shin, H.S.; Negrín-Báez, D.; Navarro, A.; Zamorano, M.J.; Manchado, M.; Afonso, J.M. Genetic Parameters for Quality Traits by Non-Invasive Methods and Their G x E Interactions in Ocean Cages and Estuaries on Gilthead Seabream (Sparus aurata). Aquaculture 2021, 537, 736462. [Google Scholar] [CrossRef]
- Vandeputte, M.; Garouste, R.; Dupont-Nivet, M.; Haffray, P.; Vergnet, A.; Chavanne, H.; Laureau, S.; Ron, T.B.; Pagelson, G.; Mazorra, C.; et al. Multi-Site Evaluation of the Rearing Performances of 5 Wild Populations of European Sea Bass (Dicentrarchus labrax). Aquaculture 2014, 424–425, 239–248. [Google Scholar] [CrossRef]
- García-Celdrán, M.; Ramis, G.; Manchado, M.; Estévez, A.; Afonso, J.M.; Armero, E. Estimates of Heritabilities and Genetic Correlations of Carcass Quality Traits in a Reared Gilthead Sea Bream (Sparus aurata L.) Population Sourced from Three Broodstocks along the Spanish Coasts. Aquaculture 2015, 446, 175–180. [Google Scholar] [CrossRef]
- Reeve, E. Introduction to Quantitative Genetics, by D. S. Falconer. Harlow, Essex: Longman Group UK. 1989 ISBN 0 582 016428. Also published in the United States by John Wiley & Sons, New York, as ISBN 0 470 21162 8. Genet. Res. 1989, 54, 163–164. [Google Scholar] [CrossRef]
- Vallecillos, A.; Marín, M.; Bortoletti, M.; López, J.; Afonso, J.M.; Ramis, G.; Arizcun, M.; María-Dolores, E.; Armero, E. Genetic Analysis of the Fatty Acid Profile in Gilthead Seabream (Sparus aurata L.). Animals 2021, 11, 2889. [Google Scholar] [CrossRef]
- García-Ballesteros, S.; Fernández, J.; Kause, A.; Villanueva, B. Predicted Genetic Gain for Carcass Yield in Rainbow Trout from Indirect and Genomic Selection. Aquaculture 2022, 554, 738119. [Google Scholar] [CrossRef]
- Freitas, M.V.; Lira, L.V.G.; Ariede, R.B.; Agudelo, J.F.G.; Oliveira Neto, R.R.D.; Borges, C.H.S.; Mastrochirico-Filho, V.A.; Garcia Neto, B.F.; Carvalheiro, R.; Hashimoto, D.T. Genotype by Environment Interaction and Genetic Parameters for Growth Traits in the Neotropical Fish Pacu (Piaractus mesopotamicus). Aquaculture 2021, 530, 735933. [Google Scholar] [CrossRef]
- Pérez-Ruiz, M.; Tarrat-Martín, D.; Sánchez-Guerrero, M.J.; Valera, M. Advances in Horse Morphometric Measurements Using LiDAR. Comput. Electron. Agric. 2020, 174, 105510. [Google Scholar] [CrossRef]
- Saeed, R.; Feng, H.; Wang, X.; Zhang, X.; Fu, Z. Fish Quality Evaluation by Sensor and Machine Learning: A Mechanistic Review. Food Control 2022, 137, 108902. [Google Scholar] [CrossRef]

| Housing System | Location | Stock Density | Water Temperature | Water Conditions |
|---|---|---|---|---|
| Sea cage | Cabo Cope, Águilas (Murcia) | 3.82 Kg/m3 | 20.4 °C (13–28 °C) | Salinity: 34‰; oxygen saturation: 6.4 ppm |
| Continental tank | Burriana (Castellón) | 15 Kg/m3 | 21.0 °C (19–23 °C) | Salinity: 36‰; oxygen saturation: 10 ppm |
| Trait Category | Trait | Abbreviation | Description |
|---|---|---|---|
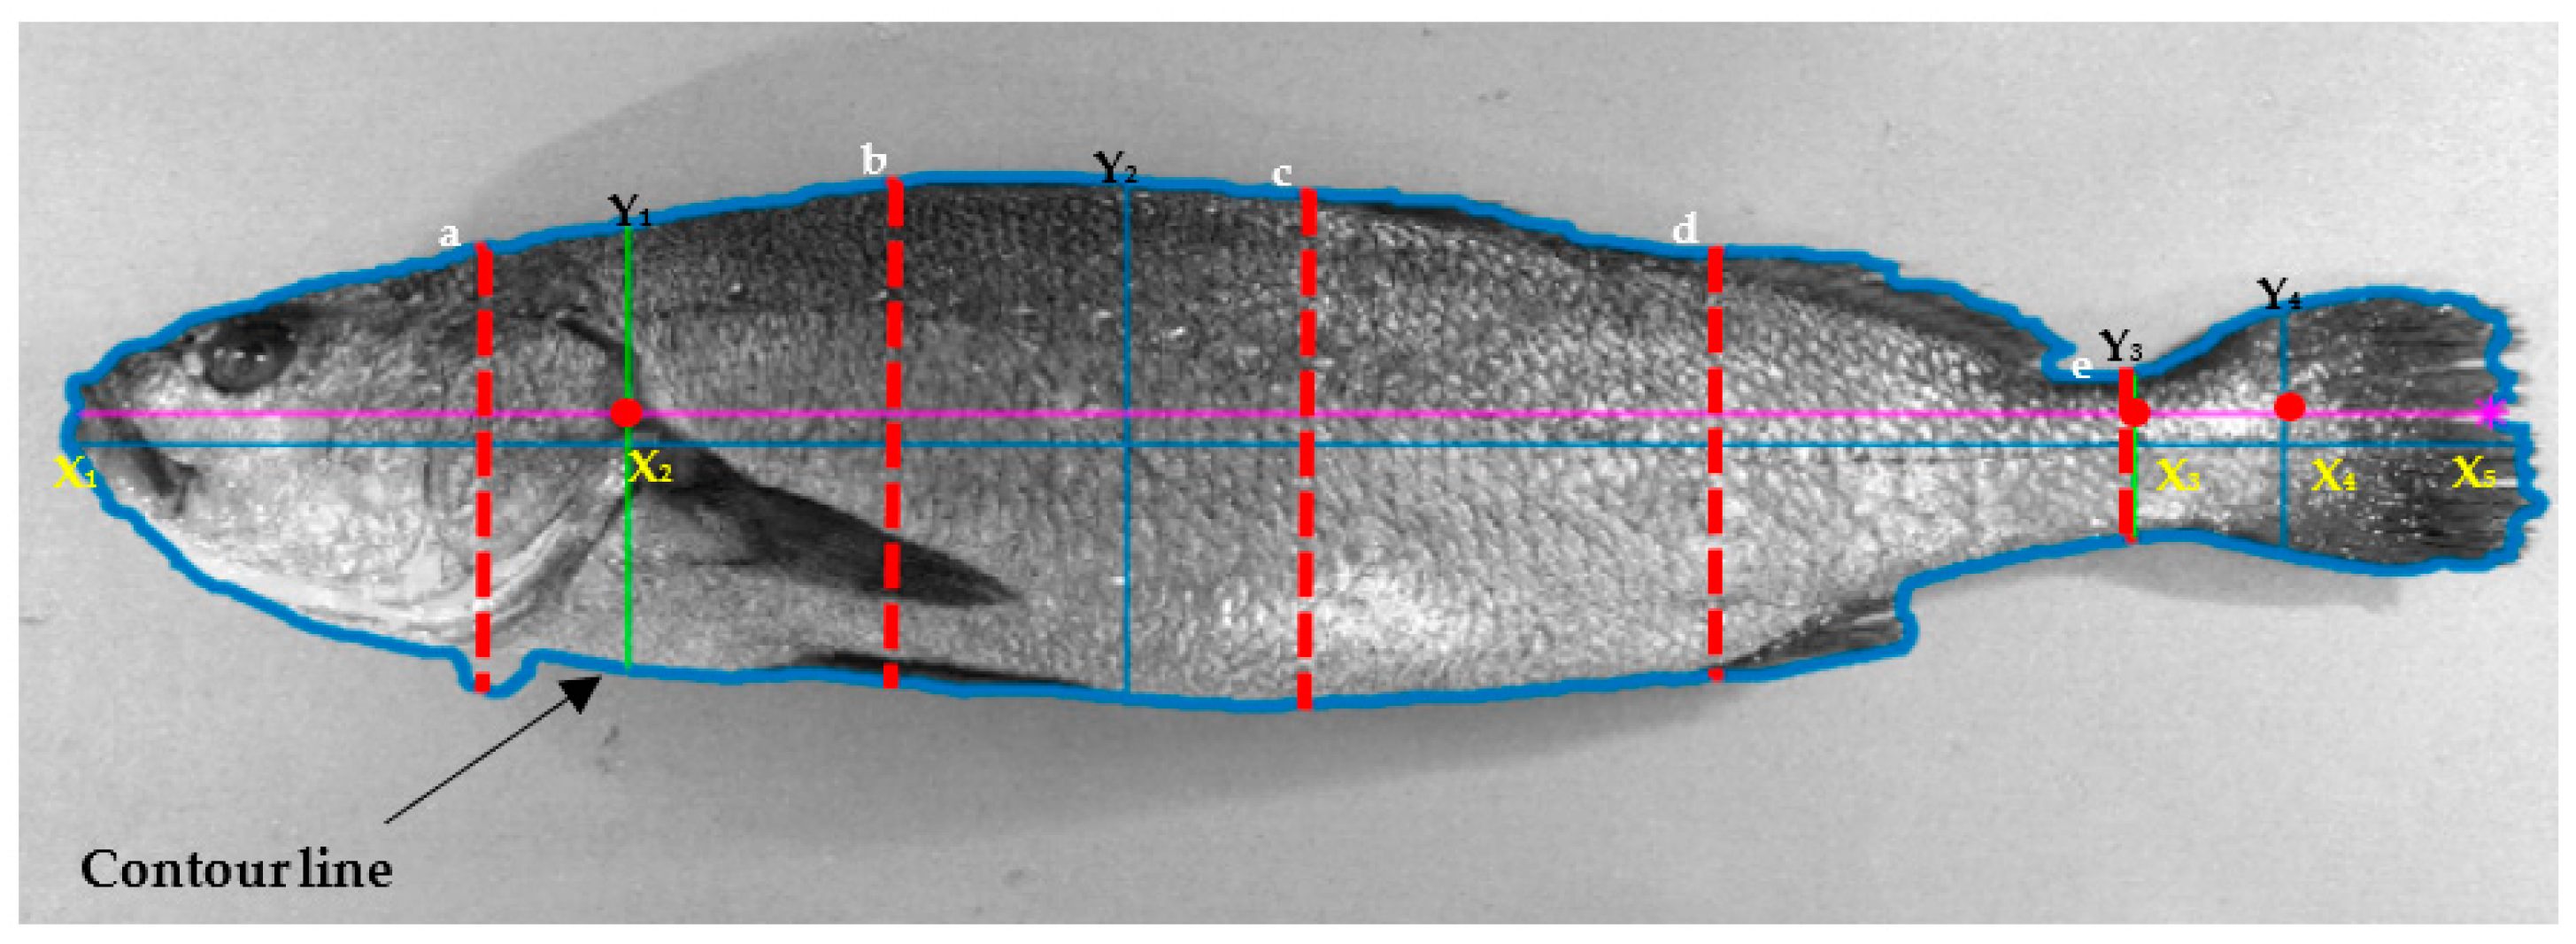
| Area (cNiT) | Total Lateral Area | TLA (cm2) | It corresponds to the outline of the area of the fish. Delimited with a thick blue line in Figure 1. |
| Fillet Area | FilA (cm2) | Contour zone of the fish without head or tail. The area from the Y1 axis to Y3 axis. | |
| Fillet Area ratio | FilAr | With respect to the total area of the fish. (FilA/TLA) | |
| Length (mNiT) | Total Lateral Length | TLL (cm) | From X1 to X4 within the longitudinal axis. |
| Fillet Maximum Length | FilML (cm) | From X2 to X3 within the longitudinal axis. | |
| Tail Excluded length | TaEL (cm) | From X1 to X3 within the longitudinal axis. | |
| Height (mNiT) | Head Height | HeH (cm) | Axis Y1 |
| Fish Maximum Height | FMH (cm) | Axis Y2 | |
| Shape (mNiT) | Fish Eccentricity | FEc | Describes the degree of ovalness of the fish, excluding the tail. This measurement encompasses the region between X1 and X3. Eccentricity is a ratio between the distance separating the foci of the ellipse and the length of its major axis. An eccentricity of 0 indicates that the fish’s shape is nearly circular, while an eccentricity of 1 suggests that the fish’s shape resembles a straight line. |
| Head Eccentricity | HeEc | Describes the degree of ovalness of the fish head, excluding the tail. This measurement encompasses the region between X1 and X2. Eccentricity represents the ratio between the distance separating the foci of the ellipse and the length of its major axis. A value of 0 signifies that the fish’s head shape closely resembles a circle, while a value of 1 indicates that the fish’s head takes on a linear appearance. |
| Trait Category | Cage | Tank | Covariate BW | |||
|---|---|---|---|---|---|---|
| Mean | S.D. | Mean | S.D. | b | S.D. | |
| BW (g) | 1267 | 79.1 | 864 | 77.8 | - | - |
| TL (cm) | 39.4 | 0.36 | 38.9 | 0.28 | 0.014 | 0.0002 |
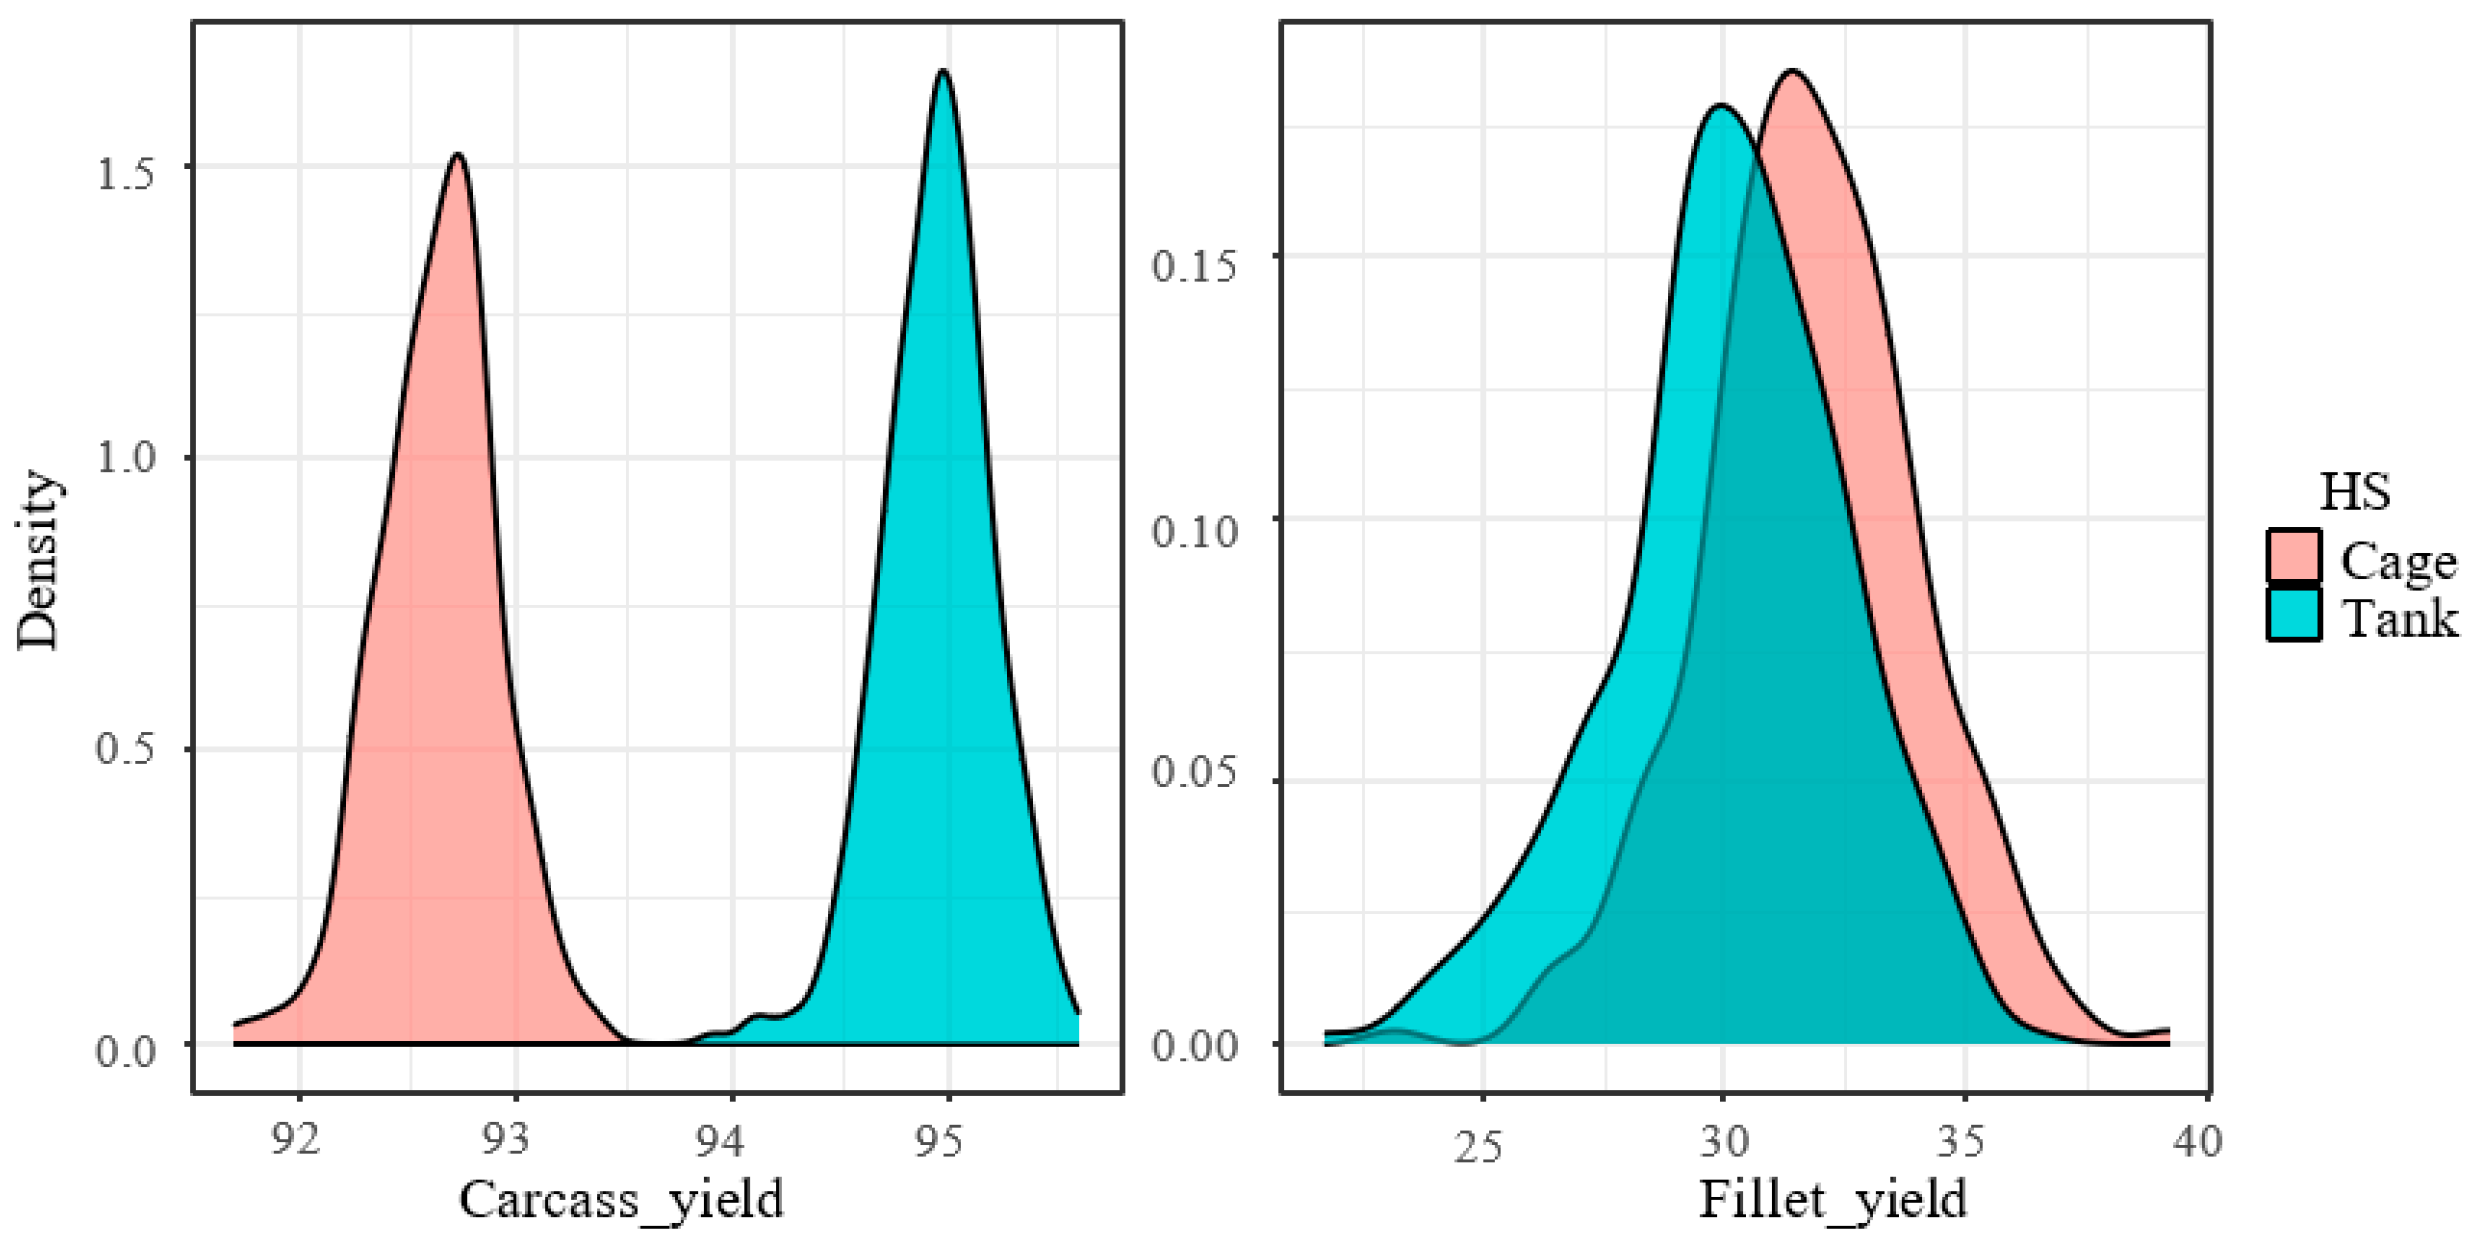
| Carcass yield (%) | 92.8 | 0.29 | 94.9 | 0.25 | <0.000 | 0.0001 |
| Fillet yield (%) | 33.3 | 1.72 | 29.5 | 1.55 | 0.005 | 0.0007 |
| TLA (cm2) | 310.7 | 18.7 | 285.7 | 16.06 | 0.193 | 0.0098 |
| FilA (cm2) | 204.5 | 14.2 | 180.3 | 11.6 | 0.124 | 0.0088 |
| FilAr | 0.64 | 0.008 | 0.63 | 0.007 | <0.000 | <0.0000 |
| TLL (cm) | 41.4 | 1.37 | 40.1 | 1.17 | 0.013 | 0.0008 |
| FilML (cm) | 23.7 | 0.80 | 22.1 | 0.70 | 0.008 | 0.0004 |
| TaEL (cm) | 34.7 | 1.09 | 32.9 | 0.92 | 0.011 | 0.0006 |
| HeH (cm) | 9.03 | 0.26 | 8.80 | 0.22 | 0.003 | 0.0001 |
| FMH (cm) | 9.89 | 0.29 | 9.47 | 0.25 | 0.004 | 0.0001 |
| FEc | 0.95 | 0.001 | 0.94 | 0.001 | <0.000 | <0.0000 |
| HeEc | 0.91 | 0.003 | 0.91 | 0.003 | <0.000 | <0.0000 |
| Traits | TL | BW | Carcass Yield | Fillet Yield | TLA | FilA | FilAr | TLL | FilML | TaEL | HeH | FMH | FEc | HeEc |
|---|---|---|---|---|---|---|---|---|---|---|---|---|---|---|
| TL | 0.34 (0.19) | 0.94 (0.00) | 0.25 (0.10) | 0.30 (0.10) | 0.72 (0.04) | 0.70 (0.04) | 0.05 (0.11) | 0.75 (0.04) | 0.72 (0.04) | 0.75 (0.03) | 0.70 (0.04) | 0.73 (0.04) | 0.04 (0.12) | 0.08 (0.13) |
| BW | 0.96 (0.15) | 0.39 (0.20) | 0.17 (0.12) | 0.29 (0.11) | 0.71 (0.04) | 0.70 (0.04) | 0.07 (0.12) | 0.70 (0.04) | 0.68 (0.05) | 0.71 (0.04) | 0.71 (0.04) | 0.75 (0.03) | 0.03 (0.38) | 0.03 (0.13) |
| Carcass yield | 0.50 (0.60) | 0.44 (0.61) | 0.21 (0.20) | −0.29 (0.10) | 0.03 (0.67) | 0.14 (0.10) | 0.05 (0.10) | 0.19 (0.10) | 0.20 (0.10) | 0.18 (0.10) | 0.11 (0.10) | 0.14 (0.10) | 0.09 (0.11) | −0.03 (0.12) |
| Fillet yield | 0.35 (0.66) | 0.40 (0.64) | −0.39 (0.62) | 0.31 (0.22) | 0.17 (0.10) | 0.18 (0.11) | 0.11 (0.11) | 0.14 (0.11) | 0.17 (0.11) | 0.17 (0.09) | 0.19 (0.10) | 0.19 (0.10) | −0.04 (0.12) | −0.04 (0.13) |
| TLA | 0.75 (0.43) | 0.74 (0.44) | 0.03 (0.67) | 0.78 (0.35) | 0.32 (0.24) | 0.96 (0.00) | 0.02 (0.10) | 0.96 (0.00) | 0.89 (0.01) | 0.96 (0.00) | 0.89 (0.01) | 0.93 (0.01) | 0.14 (0.09) | −0.03 (0.10) |
| FilA | 0.76 (0.41) | 0.74 (0.44) | 0.02 (0.67) | 0.81 (0.31) | 0.97 (0.07) | 0.27 (0.20) | 0.27 (0.09) | 0.92 (0.01) | 0.95 (0.08) | 0.92 (0.01) | 0.79 (0.04) | 0.90 (0.01) | 0.12 (0.09) | −0.21 (0.10) |
| FilAr | 0.39 (0.65) | 0.31 (0.67) | 0.19 (0.69) | 0.43 (0.58) | −0.03 (0.72) | 0.35 (0.66) | 0.27 (0.20) | −0.01 (0.10) | 0.40 (0.08) | 0.00 (0.10) | −0.28 (0.10) | 0.01 (0.11) | −0.03 (0.09) | −0.71 (0.04) |
| TLL | 0.75 (0.43) | 0.67 (0.50) | 0.06 (0.69) | 0.77 (0.36) | 0.98 (0.05) | 0.94 (0.16) | −0.05 (0.71) | 0.30 (0.19) | 0.92 (0.01) | 0.98 (0.00) | 0.85 (0.03) | 0.89 (0.02) | 0.25 (0.09) | 0.03 (0.11) |
| FilML | 0.77 (0.40) | 0.66 (0.50) | 0.03 (0.70) | 0.76 (0.36) | 0.91 (0.21) | 0.96 (0.09) | 0.55 (0.56) | 0.93 (0.17) | 0.35 (0.20) | 0.92 (0.01) | 0.65 (0.07) | 0.79 (0.05) | 0.25 (0.10) | −0.27 (0.10) |
| TaEL | 0.77 (0.41) | 0.71 (0.46) | 0.06 (0.70) | 0.77 (0.36) | 0.96 (0.12) | 0.97 (0.06) | 0.03 (0.71) | 0.99 (0.02) | 0.94 (0.13) | 0.29 (0.22) | 0.86 (0.02) | 0.89 (0.02) | 0.29 (0.09) | 0.08 (0.10) |
| HeH | 0.63 (0.52) | 0.72 (0.45) | 0.20 (0.68) | 0.87 (0.24) | 0.92 (0.18) | 0.82 (0.32) | −0.26 (0.67) | 0.86 (0.26) | 0.62 (0.51) | 0.87 (0.26) | 0.37 (0.20) | 0.91 (0.01) | −0.02 (0.04) | 0.11 (0.13) |
| FMH | 0.74 (0.43) | 0.77 (0.40) | 0.14 (0.69) | 0.87 (0.23) | 0.92 (0.16) | 0.83 (0.31) | −0.21 (0.69) | 0.89 (0.23) | 0.57 (0.53) | 0.89 (0.24) | 0.97 (0.06) | 0.29 (0.21) | −0.05 (0.04) | −0.06 (0.12) |
| FEc | 0.19 (0.66) | 0.14 (0.70) | −0.09 (0.65) | −0.50 (0.49) | 0.13 (0.65) | 0.17 (0.64) | 0.16 (0.64) | 0.14 (0.66) | 0.28 (0.63) | 0.19 (0.62) | −0.37 (0.58) | −0.27 (0.61) | 0.15 (0.16) | 0.34 (0.09) |
| HeEc | −0.14 (0.69) | −0.05 (0.69) | −0.16 (0.69) | −0.50 (0.54) | −0.10 (0.70) | −0.32 (0.65) | −0.87 (0.25) | −0.11 (0.71) | −0.49 (0.59) | −0.05 (0.69) | 0.00 (0.70) | 0.06 (0.70) | 0.34 (0.57) | 0.21 (0.17) |
Disclaimer/Publisher’s Note: The statements, opinions and data contained in all publications are solely those of the individual author(s) and contributor(s) and not of MDPI and/or the editor(s). MDPI and/or the editor(s) disclaim responsibility for any injury to people or property resulting from any ideas, methods, instructions or products referred to in the content. |
© 2023 by the authors. Licensee MDPI, Basel, Switzerland. This article is an open access article distributed under the terms and conditions of the Creative Commons Attribution (CC BY) license (https://creativecommons.org/licenses/by/4.0/).
Share and Cite
Vallecillos, A.; María-Dolores, E.; Villa, J.; Afonso, J.M.; Armero, E. Potential Use of Image Analysis in Breeding Programs for Growth and Yield Traits in Meagre (Argyrosomus regius). J. Mar. Sci. Eng. 2023, 11, 2067. https://doi.org/10.3390/jmse11112067
Vallecillos A, María-Dolores E, Villa J, Afonso JM, Armero E. Potential Use of Image Analysis in Breeding Programs for Growth and Yield Traits in Meagre (Argyrosomus regius). Journal of Marine Science and Engineering. 2023; 11(11):2067. https://doi.org/10.3390/jmse11112067
Chicago/Turabian StyleVallecillos, Antonio, Emilio María-Dolores, Javier Villa, Juan Manuel Afonso, and Eva Armero. 2023. "Potential Use of Image Analysis in Breeding Programs for Growth and Yield Traits in Meagre (Argyrosomus regius)" Journal of Marine Science and Engineering 11, no. 11: 2067. https://doi.org/10.3390/jmse11112067
APA StyleVallecillos, A., María-Dolores, E., Villa, J., Afonso, J. M., & Armero, E. (2023). Potential Use of Image Analysis in Breeding Programs for Growth and Yield Traits in Meagre (Argyrosomus regius). Journal of Marine Science and Engineering, 11(11), 2067. https://doi.org/10.3390/jmse11112067