
An Investigation about Stability in Waves of Large Pleasure Yachts


Abstract
:1. Introduction
2. Rule Context
2.1. Overview of Present Safety Rules for Yacht Units
2.2. Second Generation Intact Stability Criteria
2.2.1. Structure of the First Vulnerability Levels
2.2.2. Structure of the Second Vulnerability Levels
3. Case Study
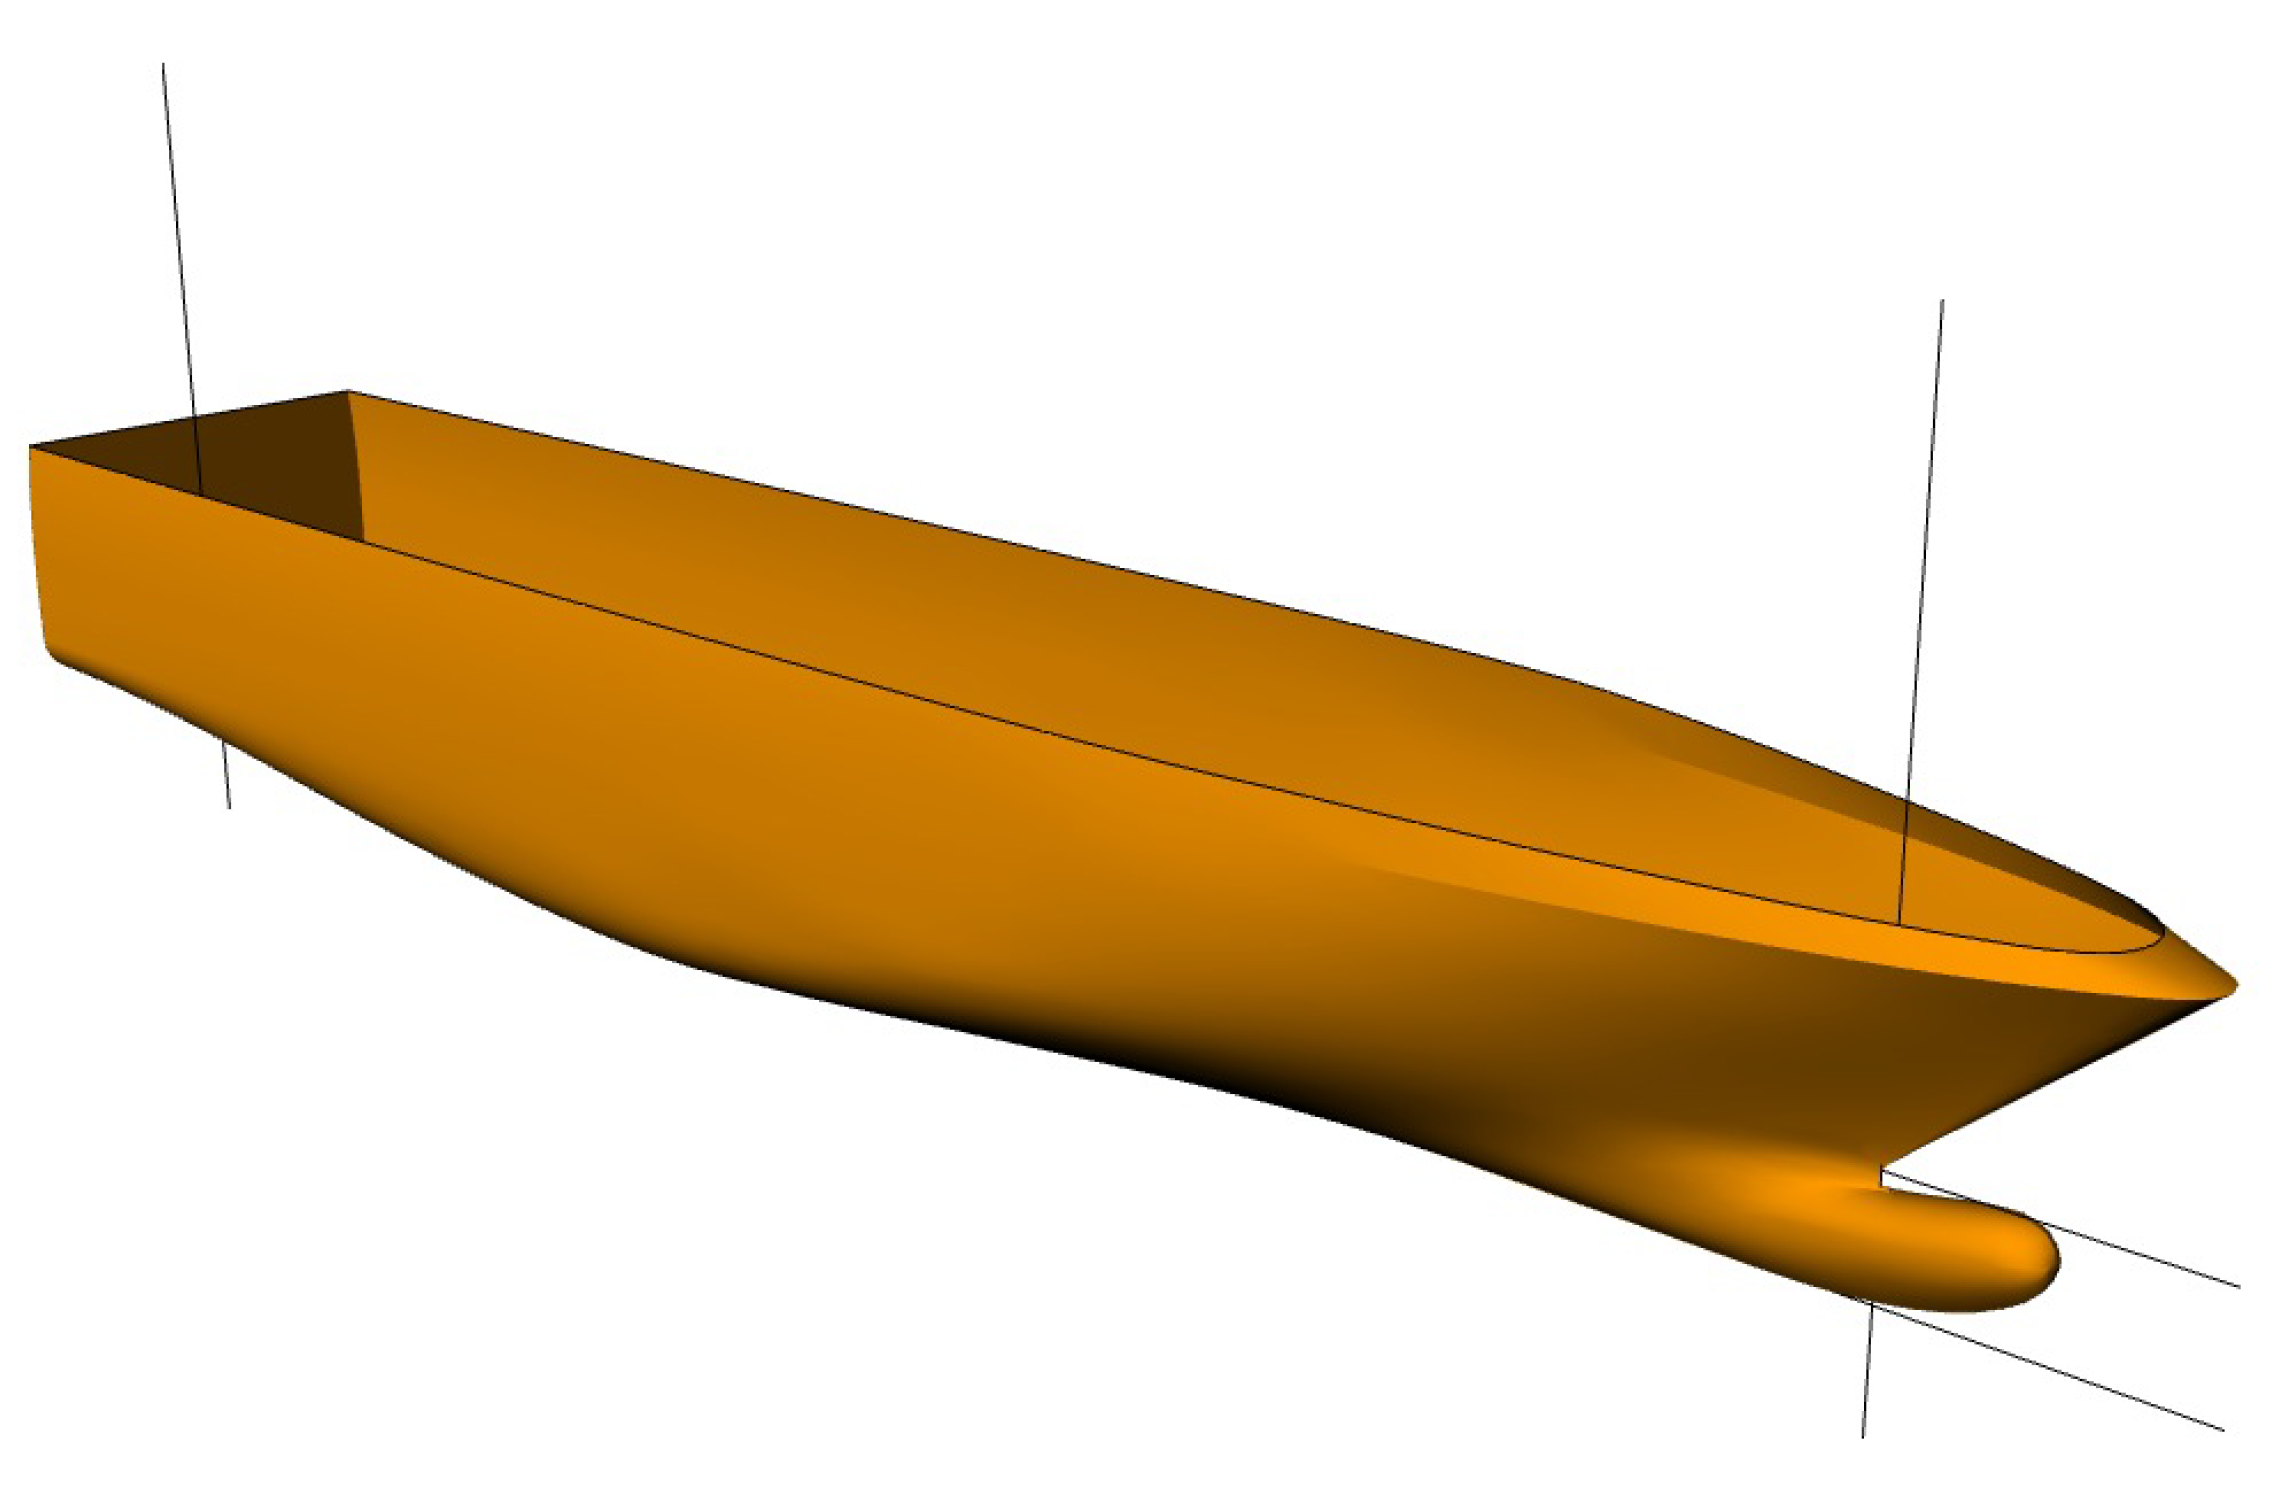
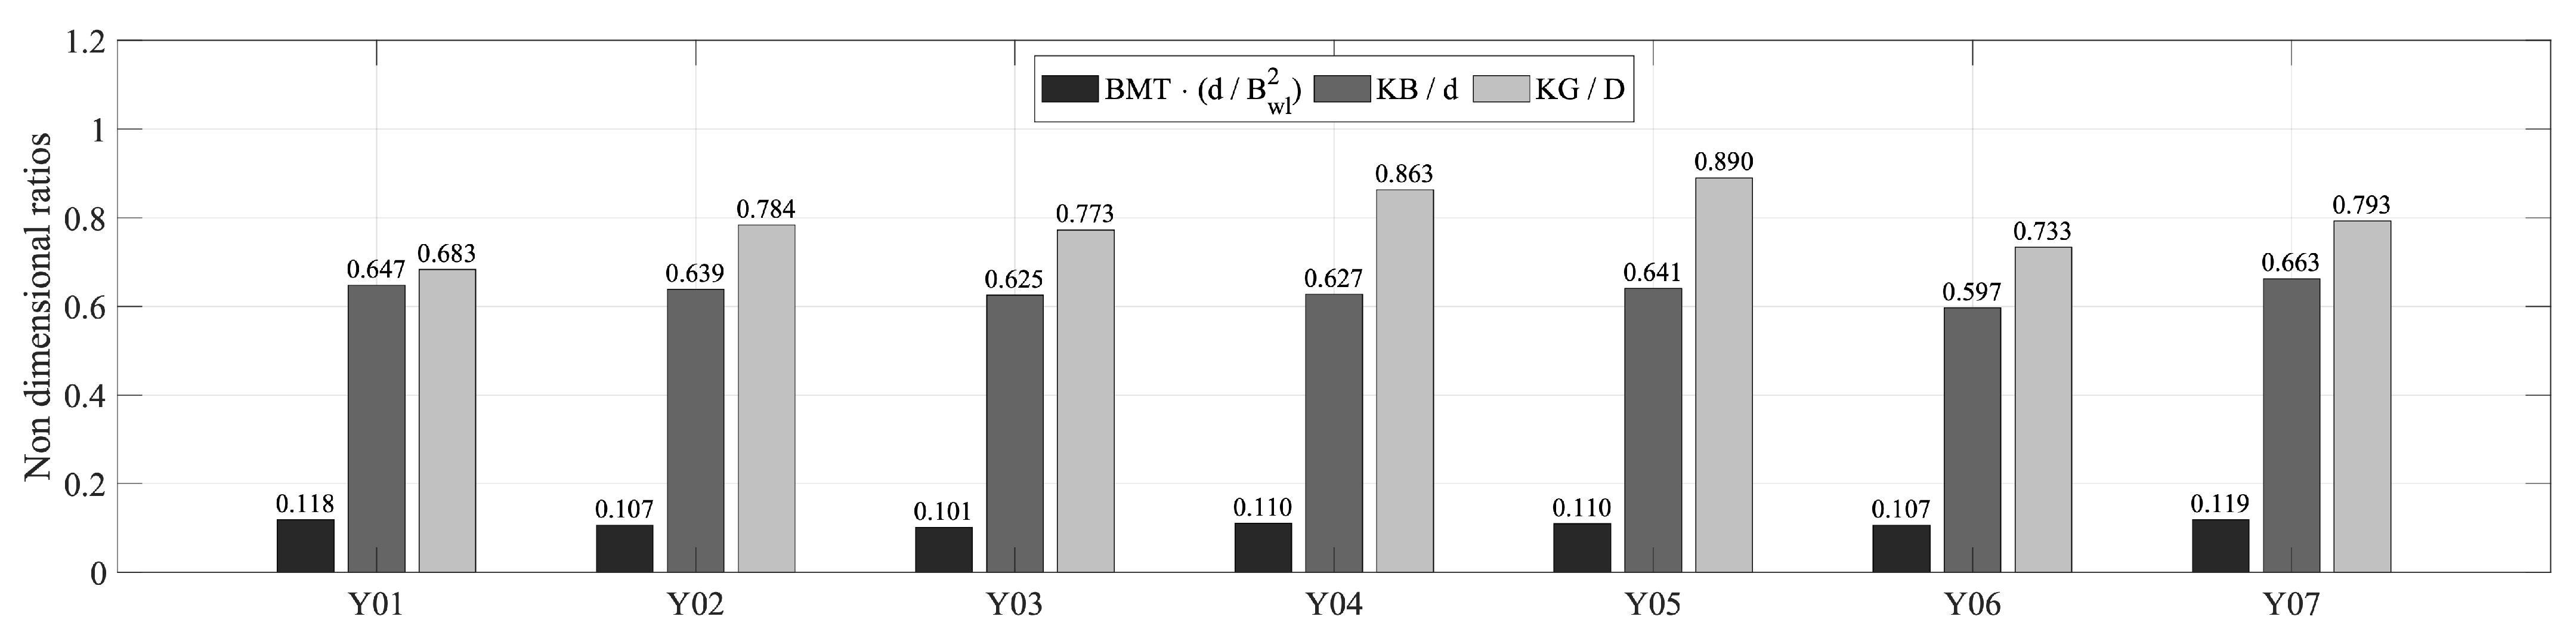
3.1. Description of the Investigated Vessels
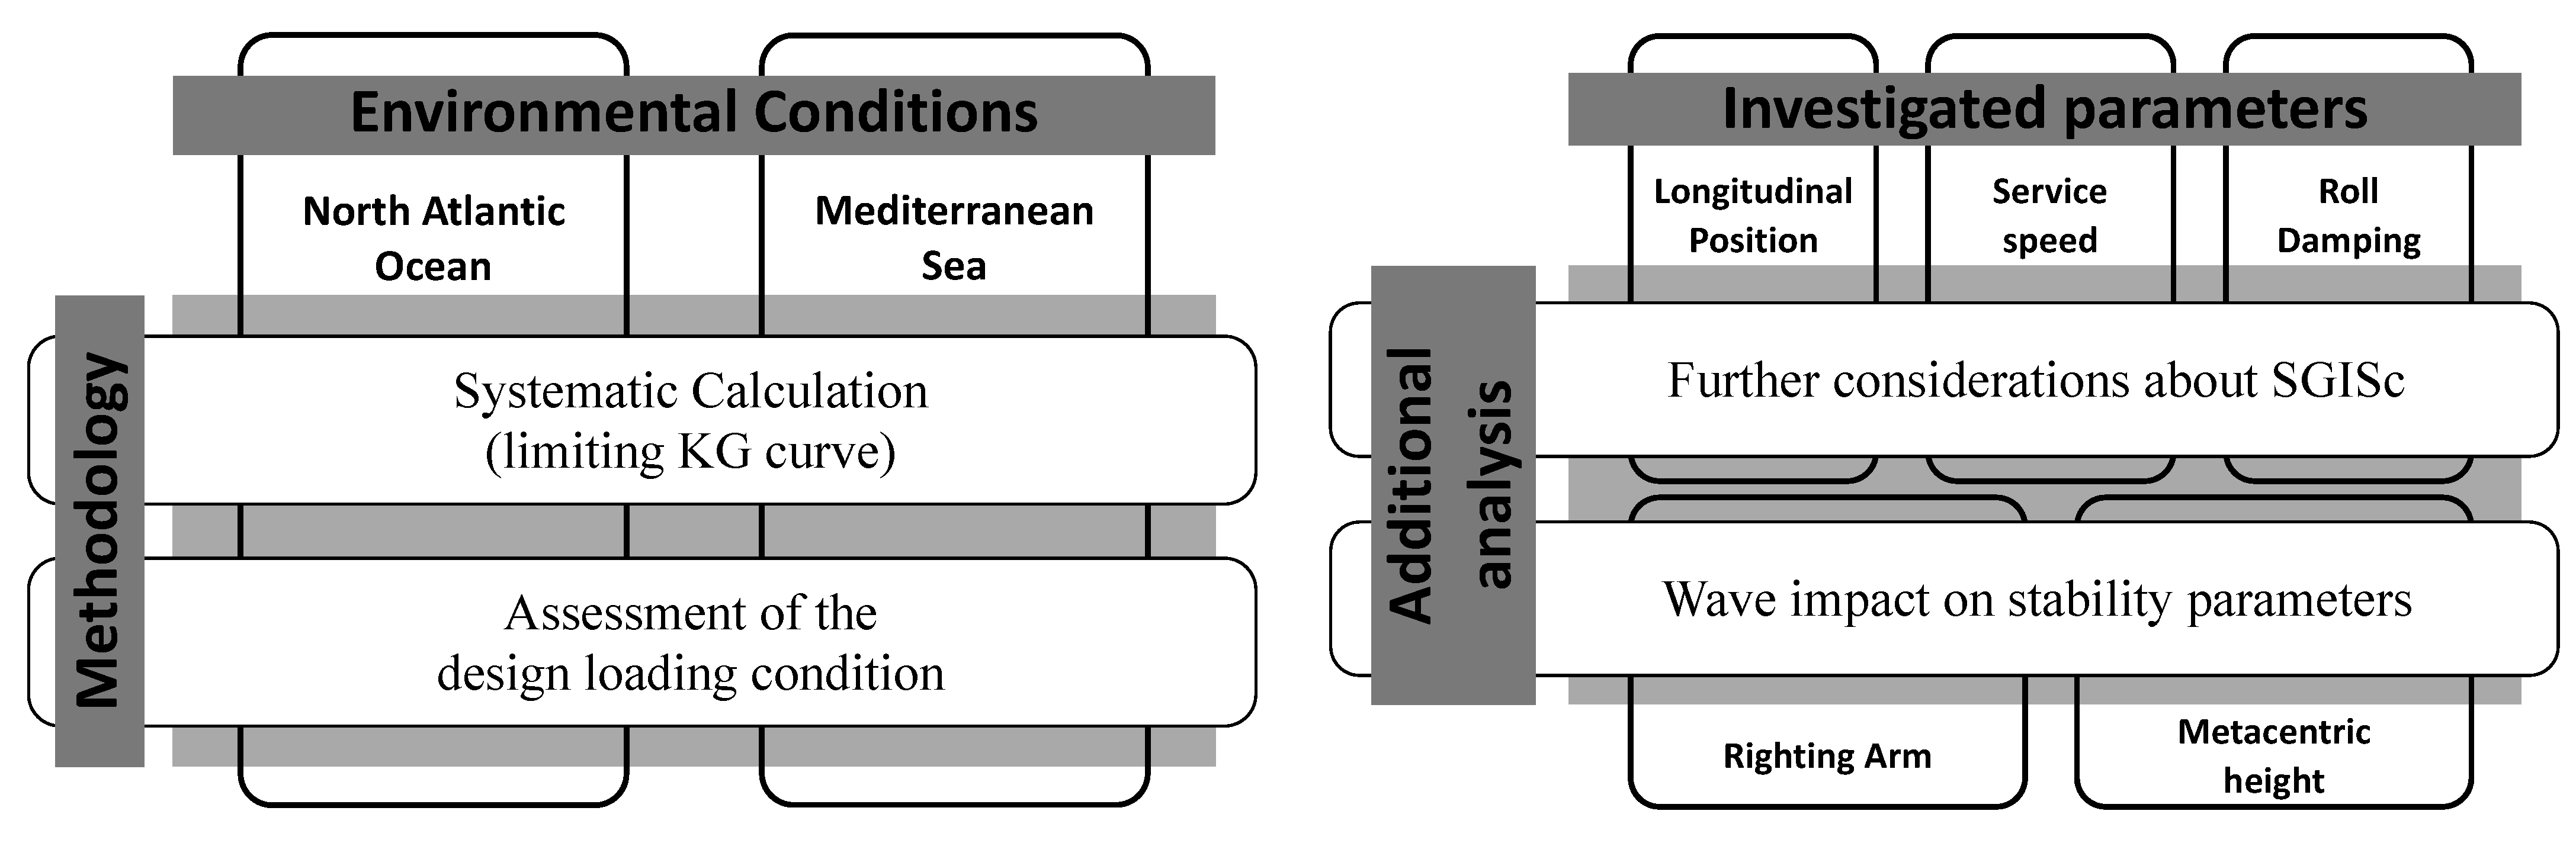
3.2. Details on the Assessment Process
4. Results Overview
4.1. Example of the Complete Outcomes for Y01
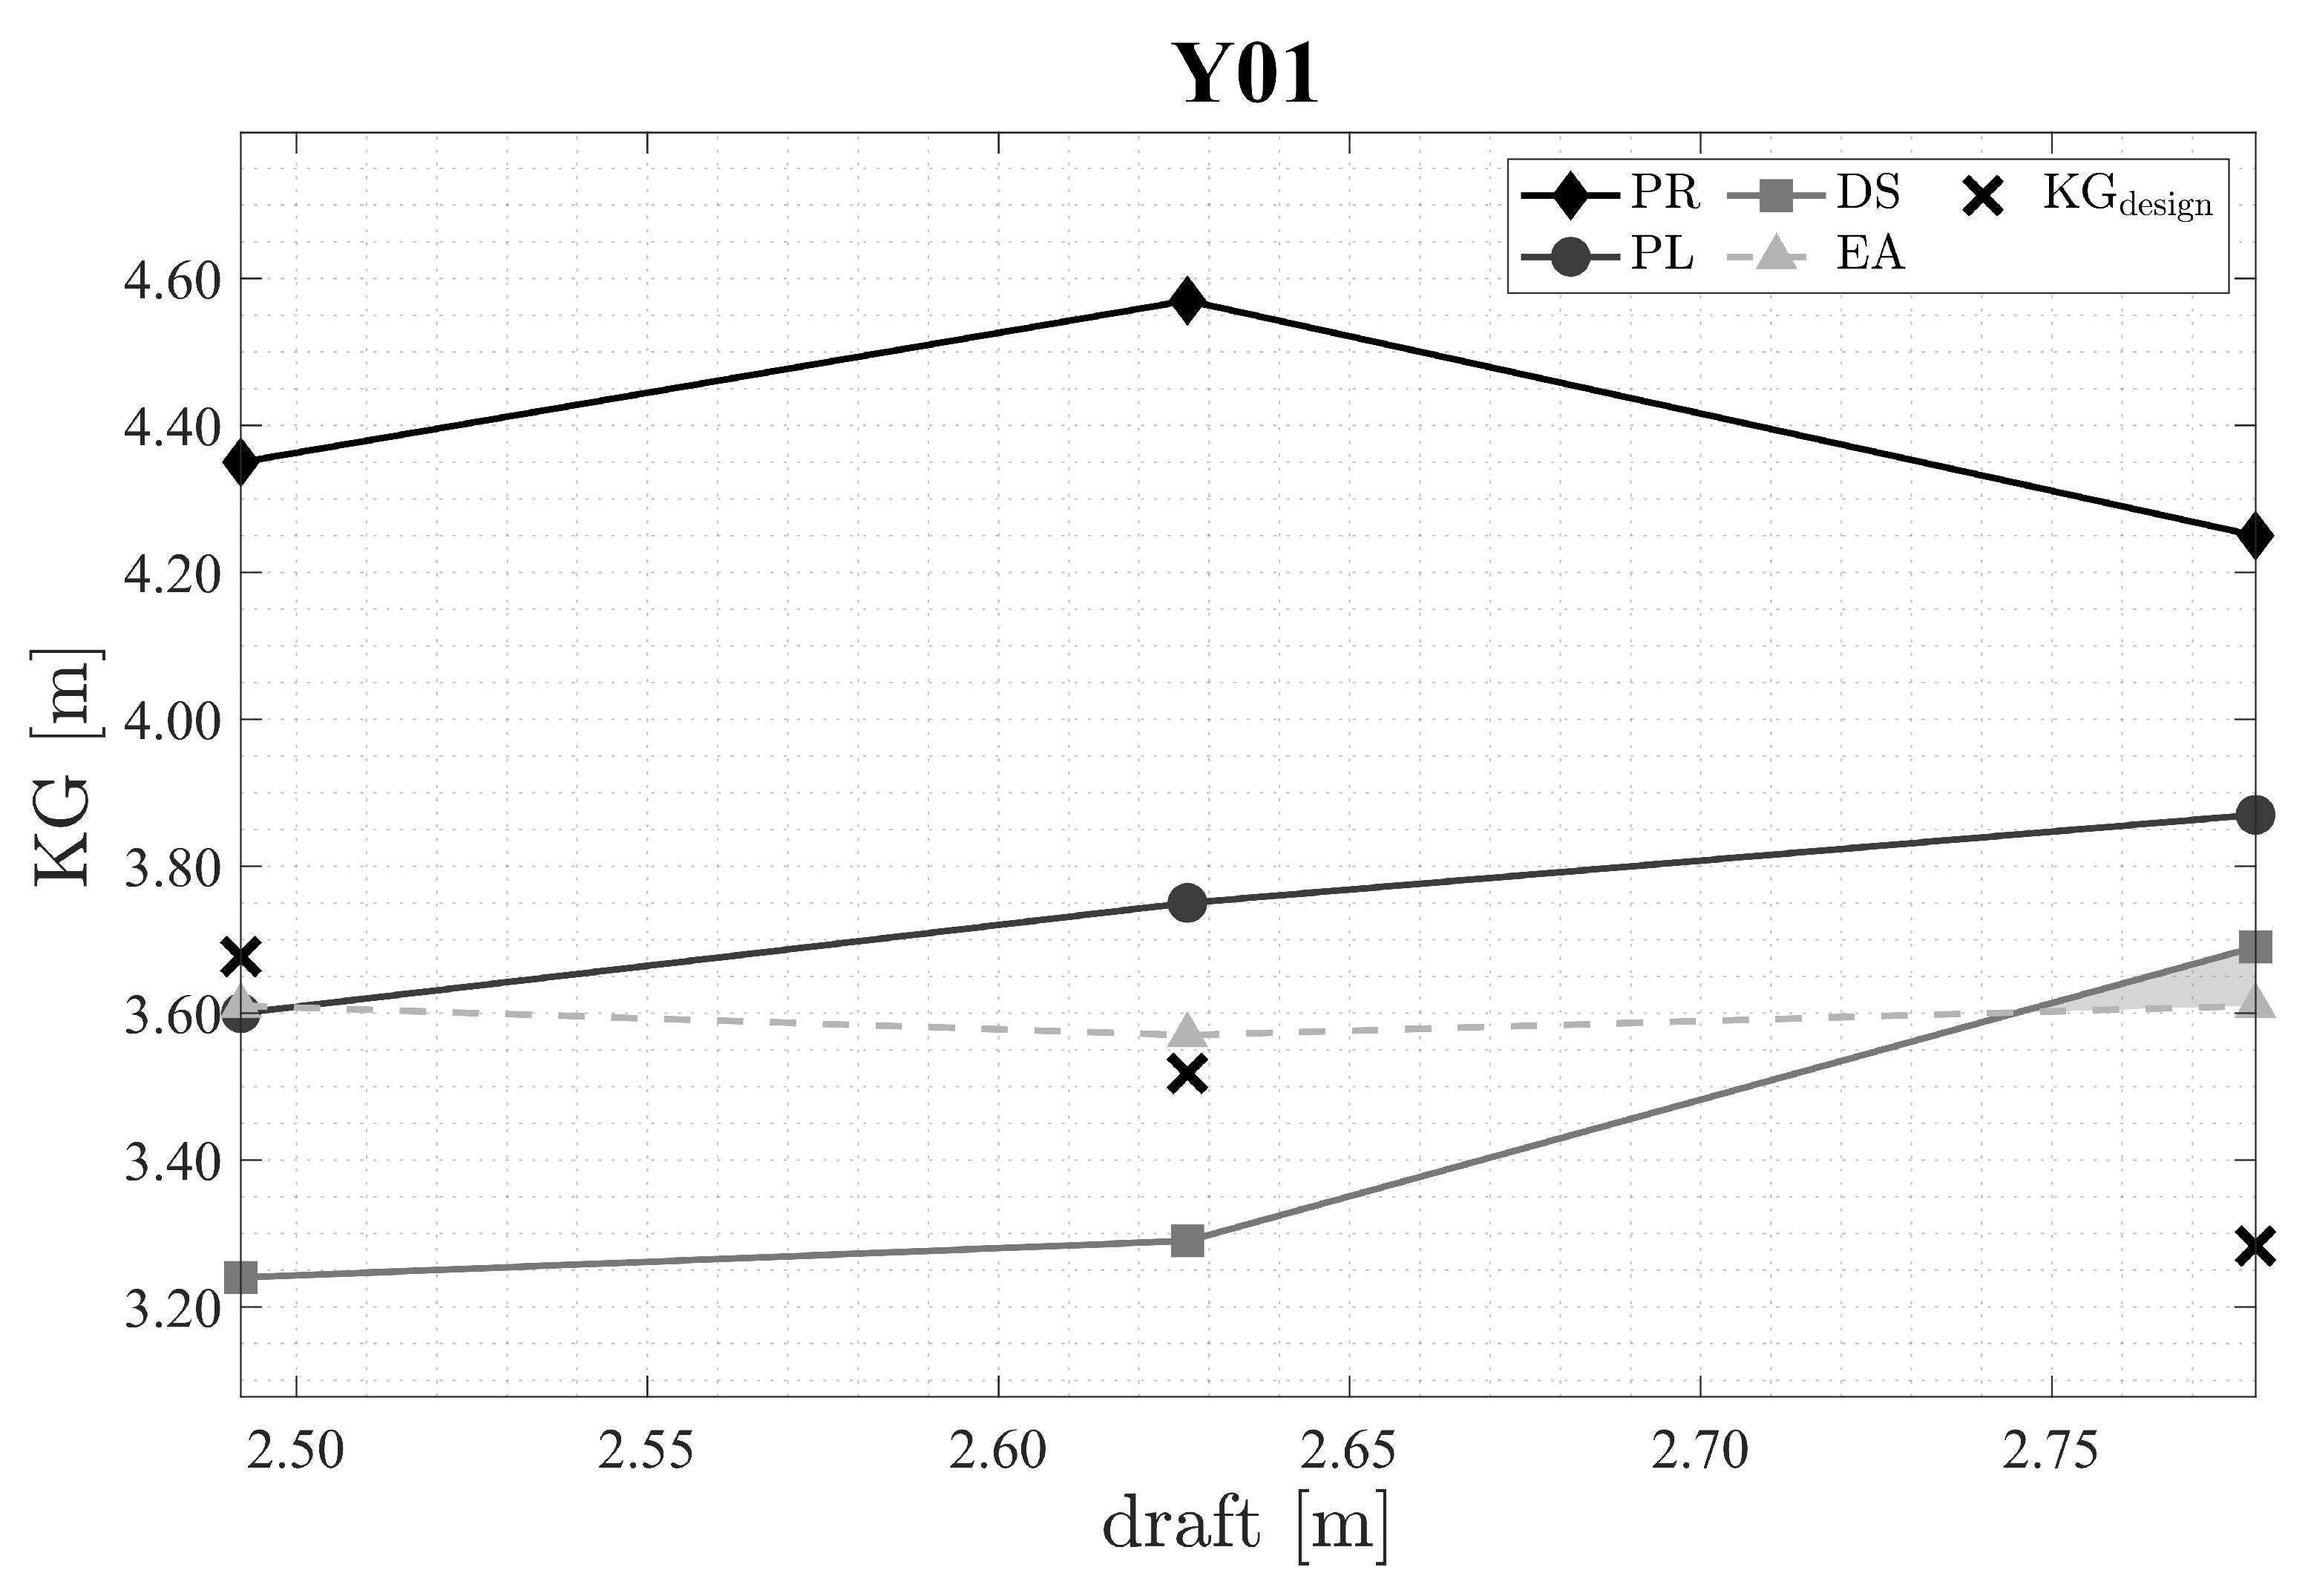
4.1.1. Outcomes of the Vulnerability Assessment
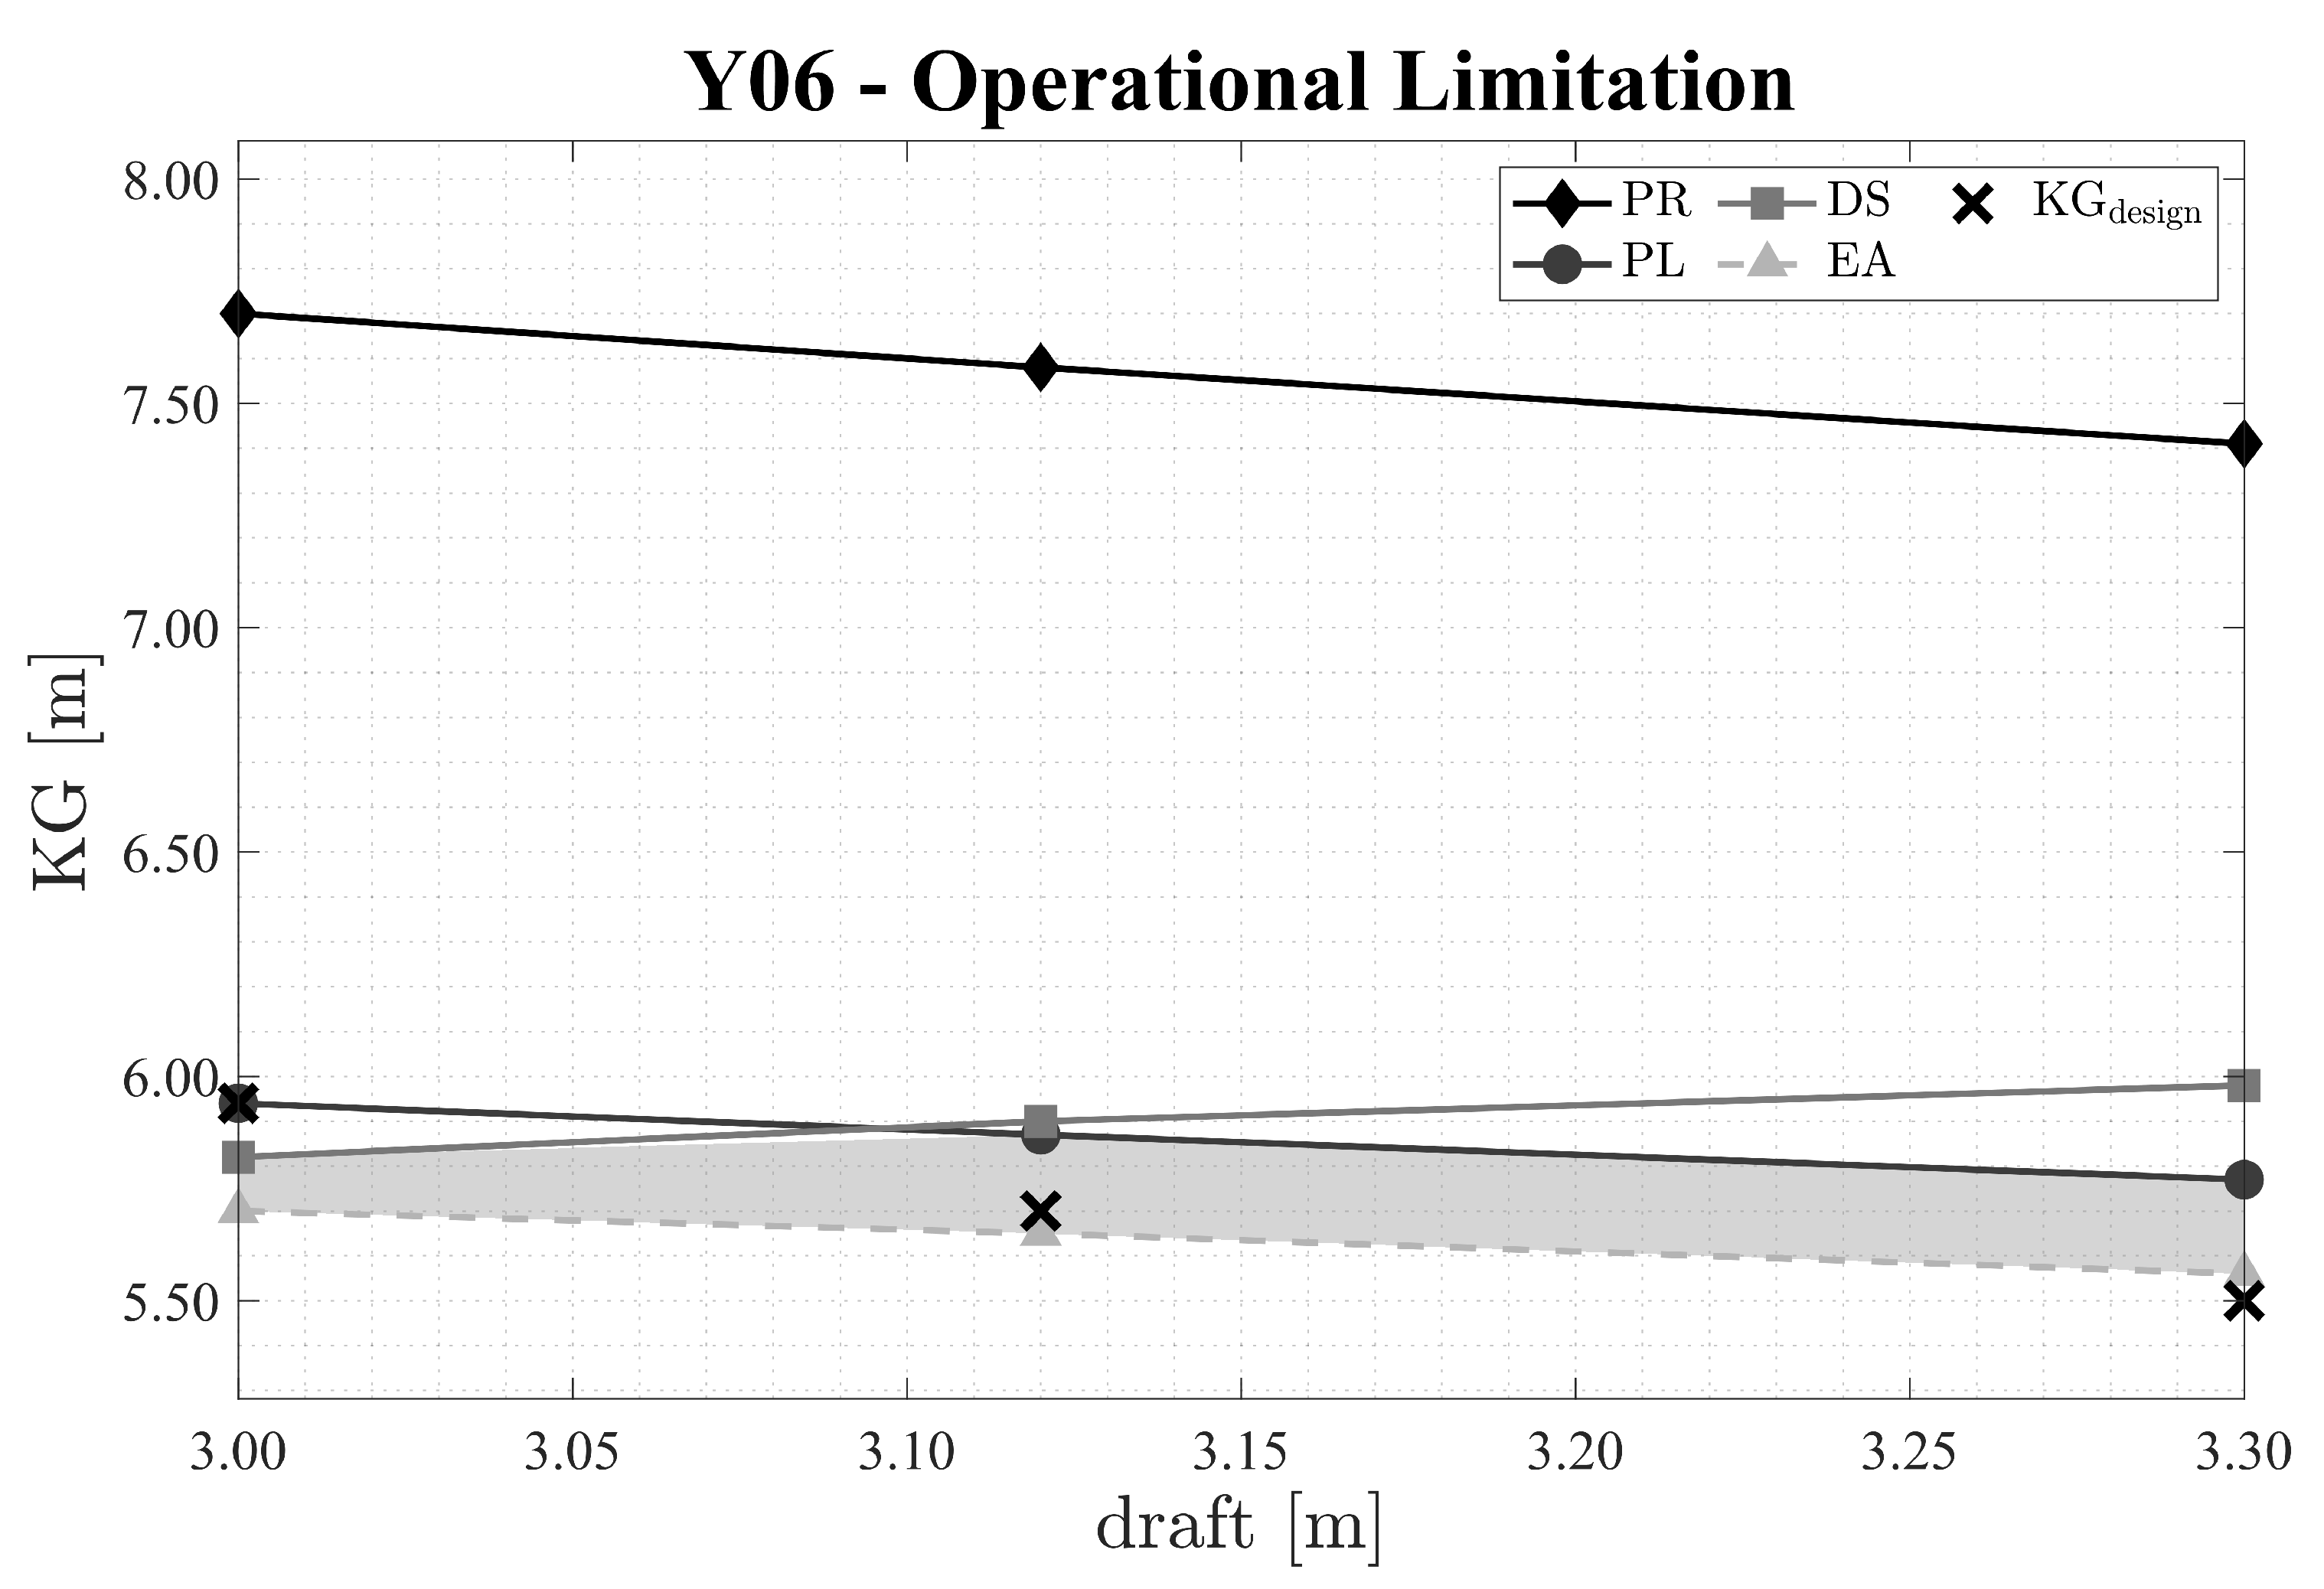
4.1.2. Outcomes of the Vulnerability Assessment with Operational Limitations
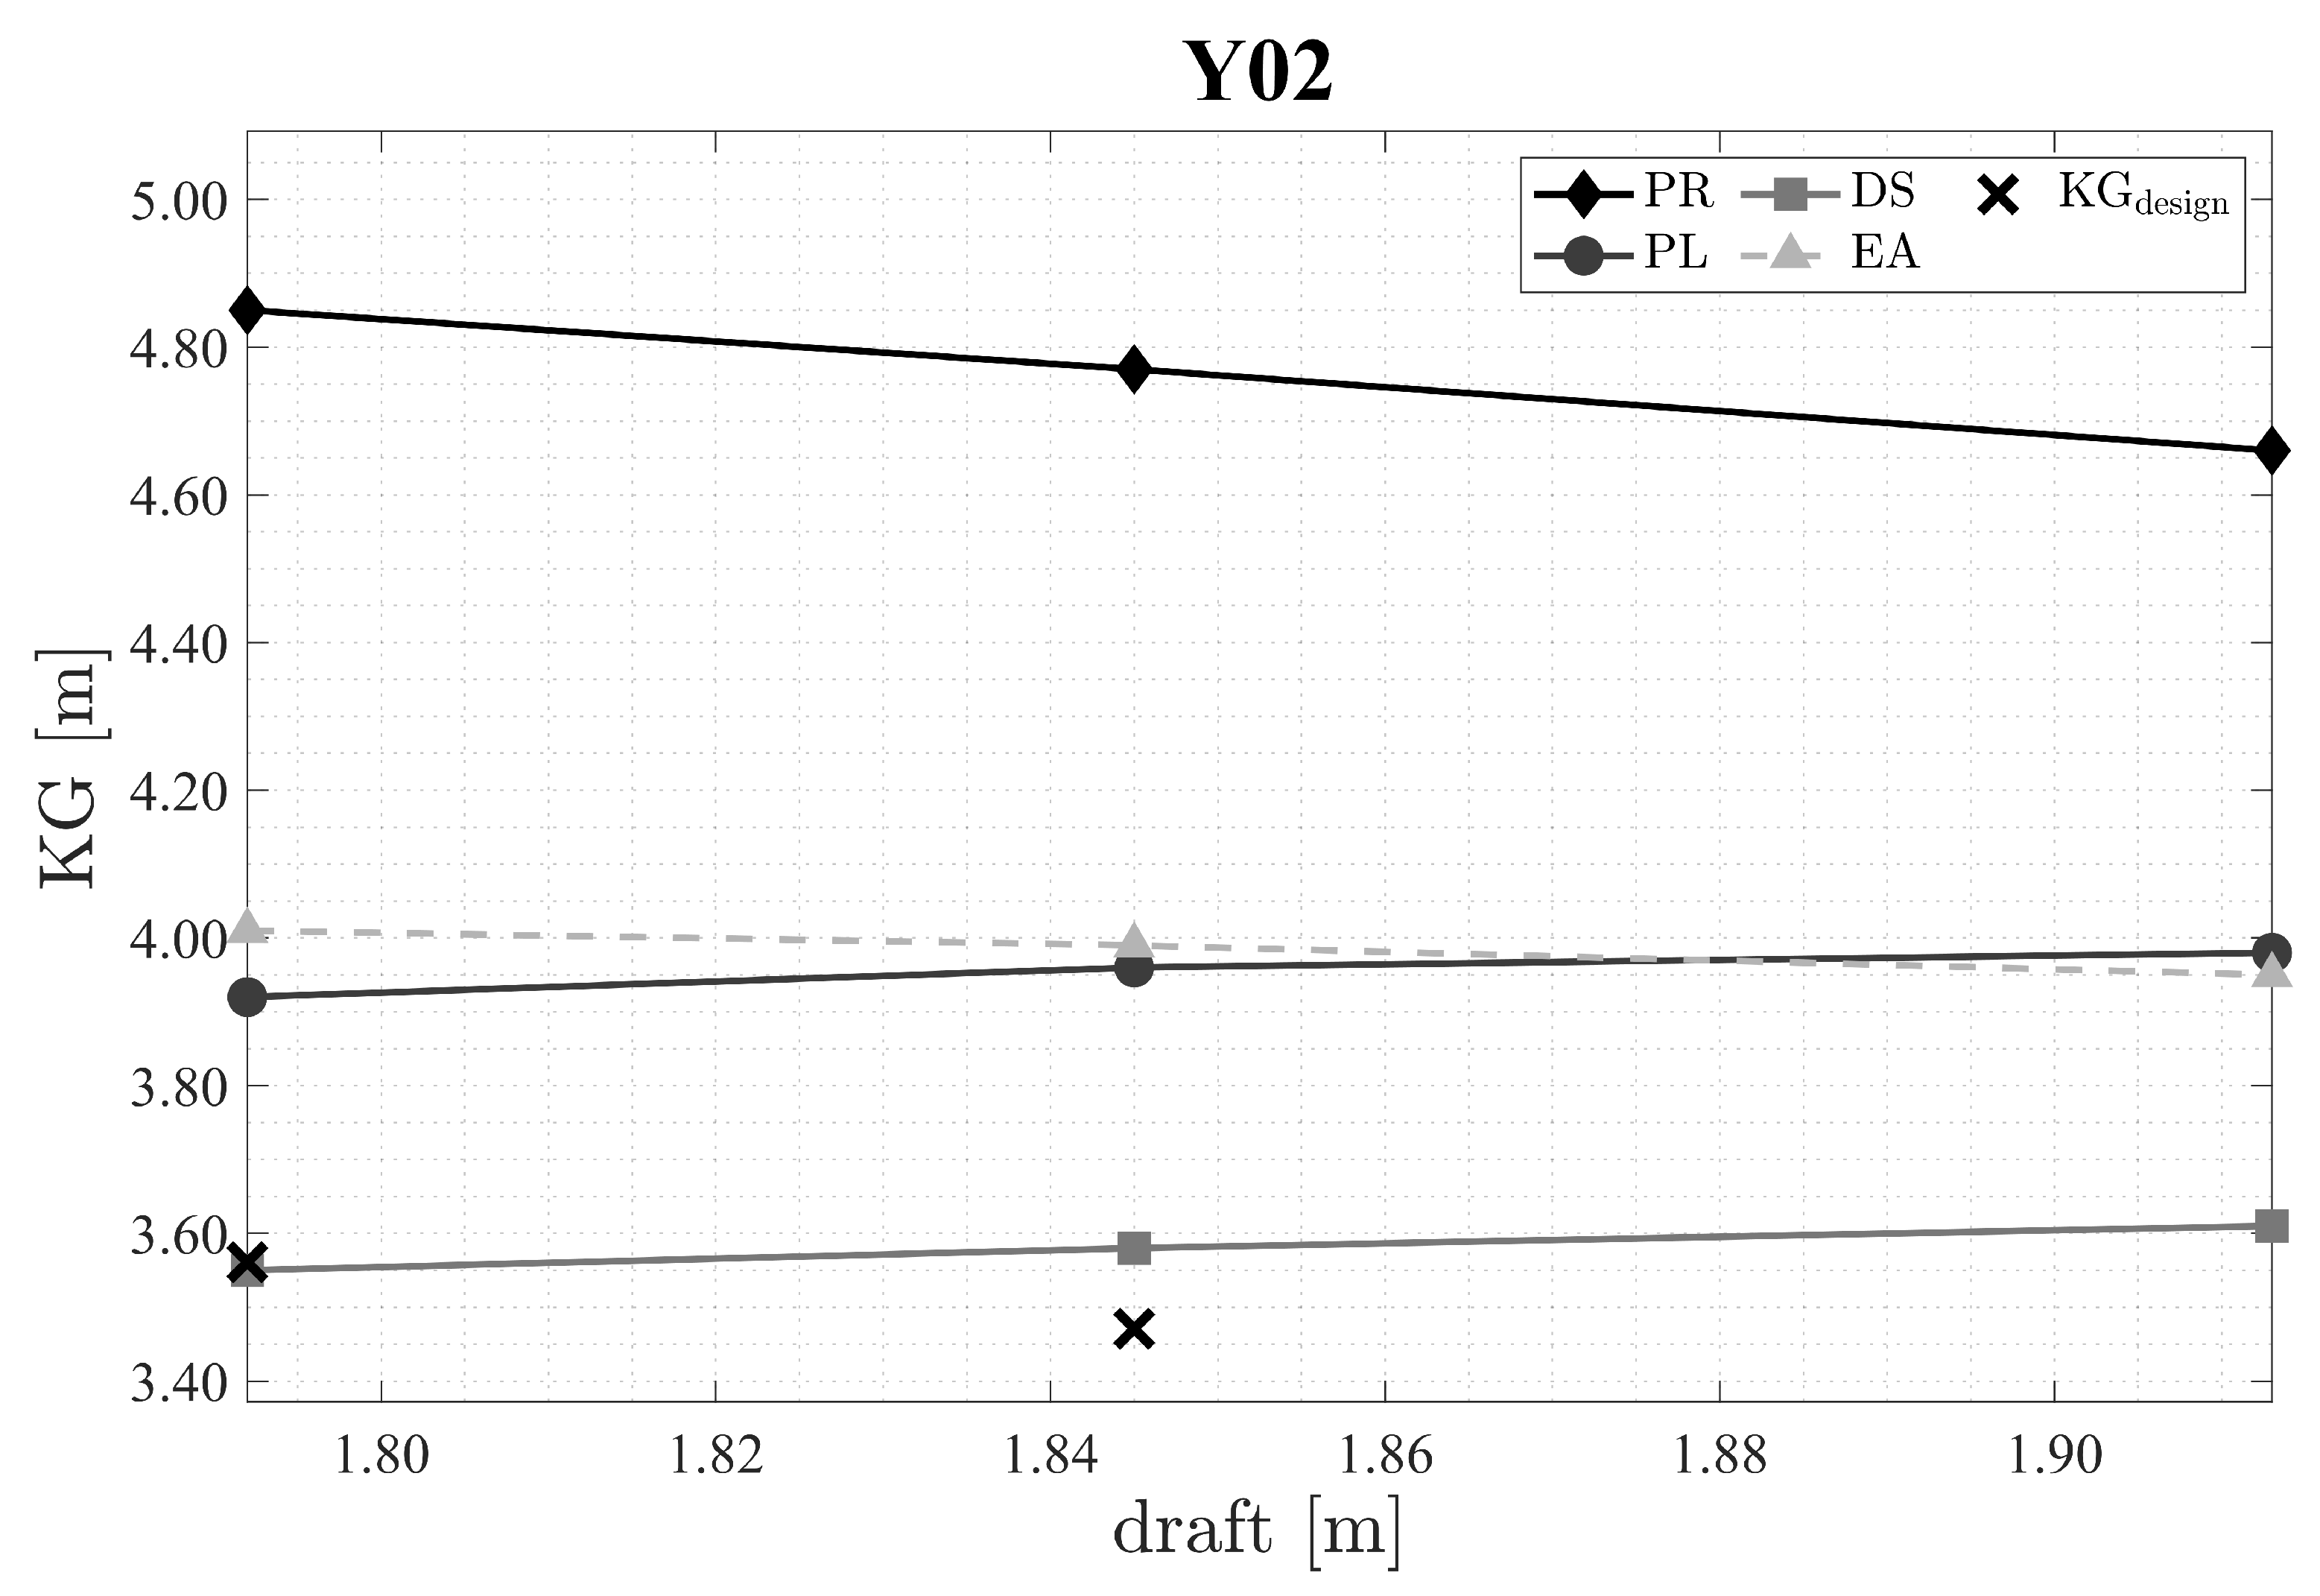
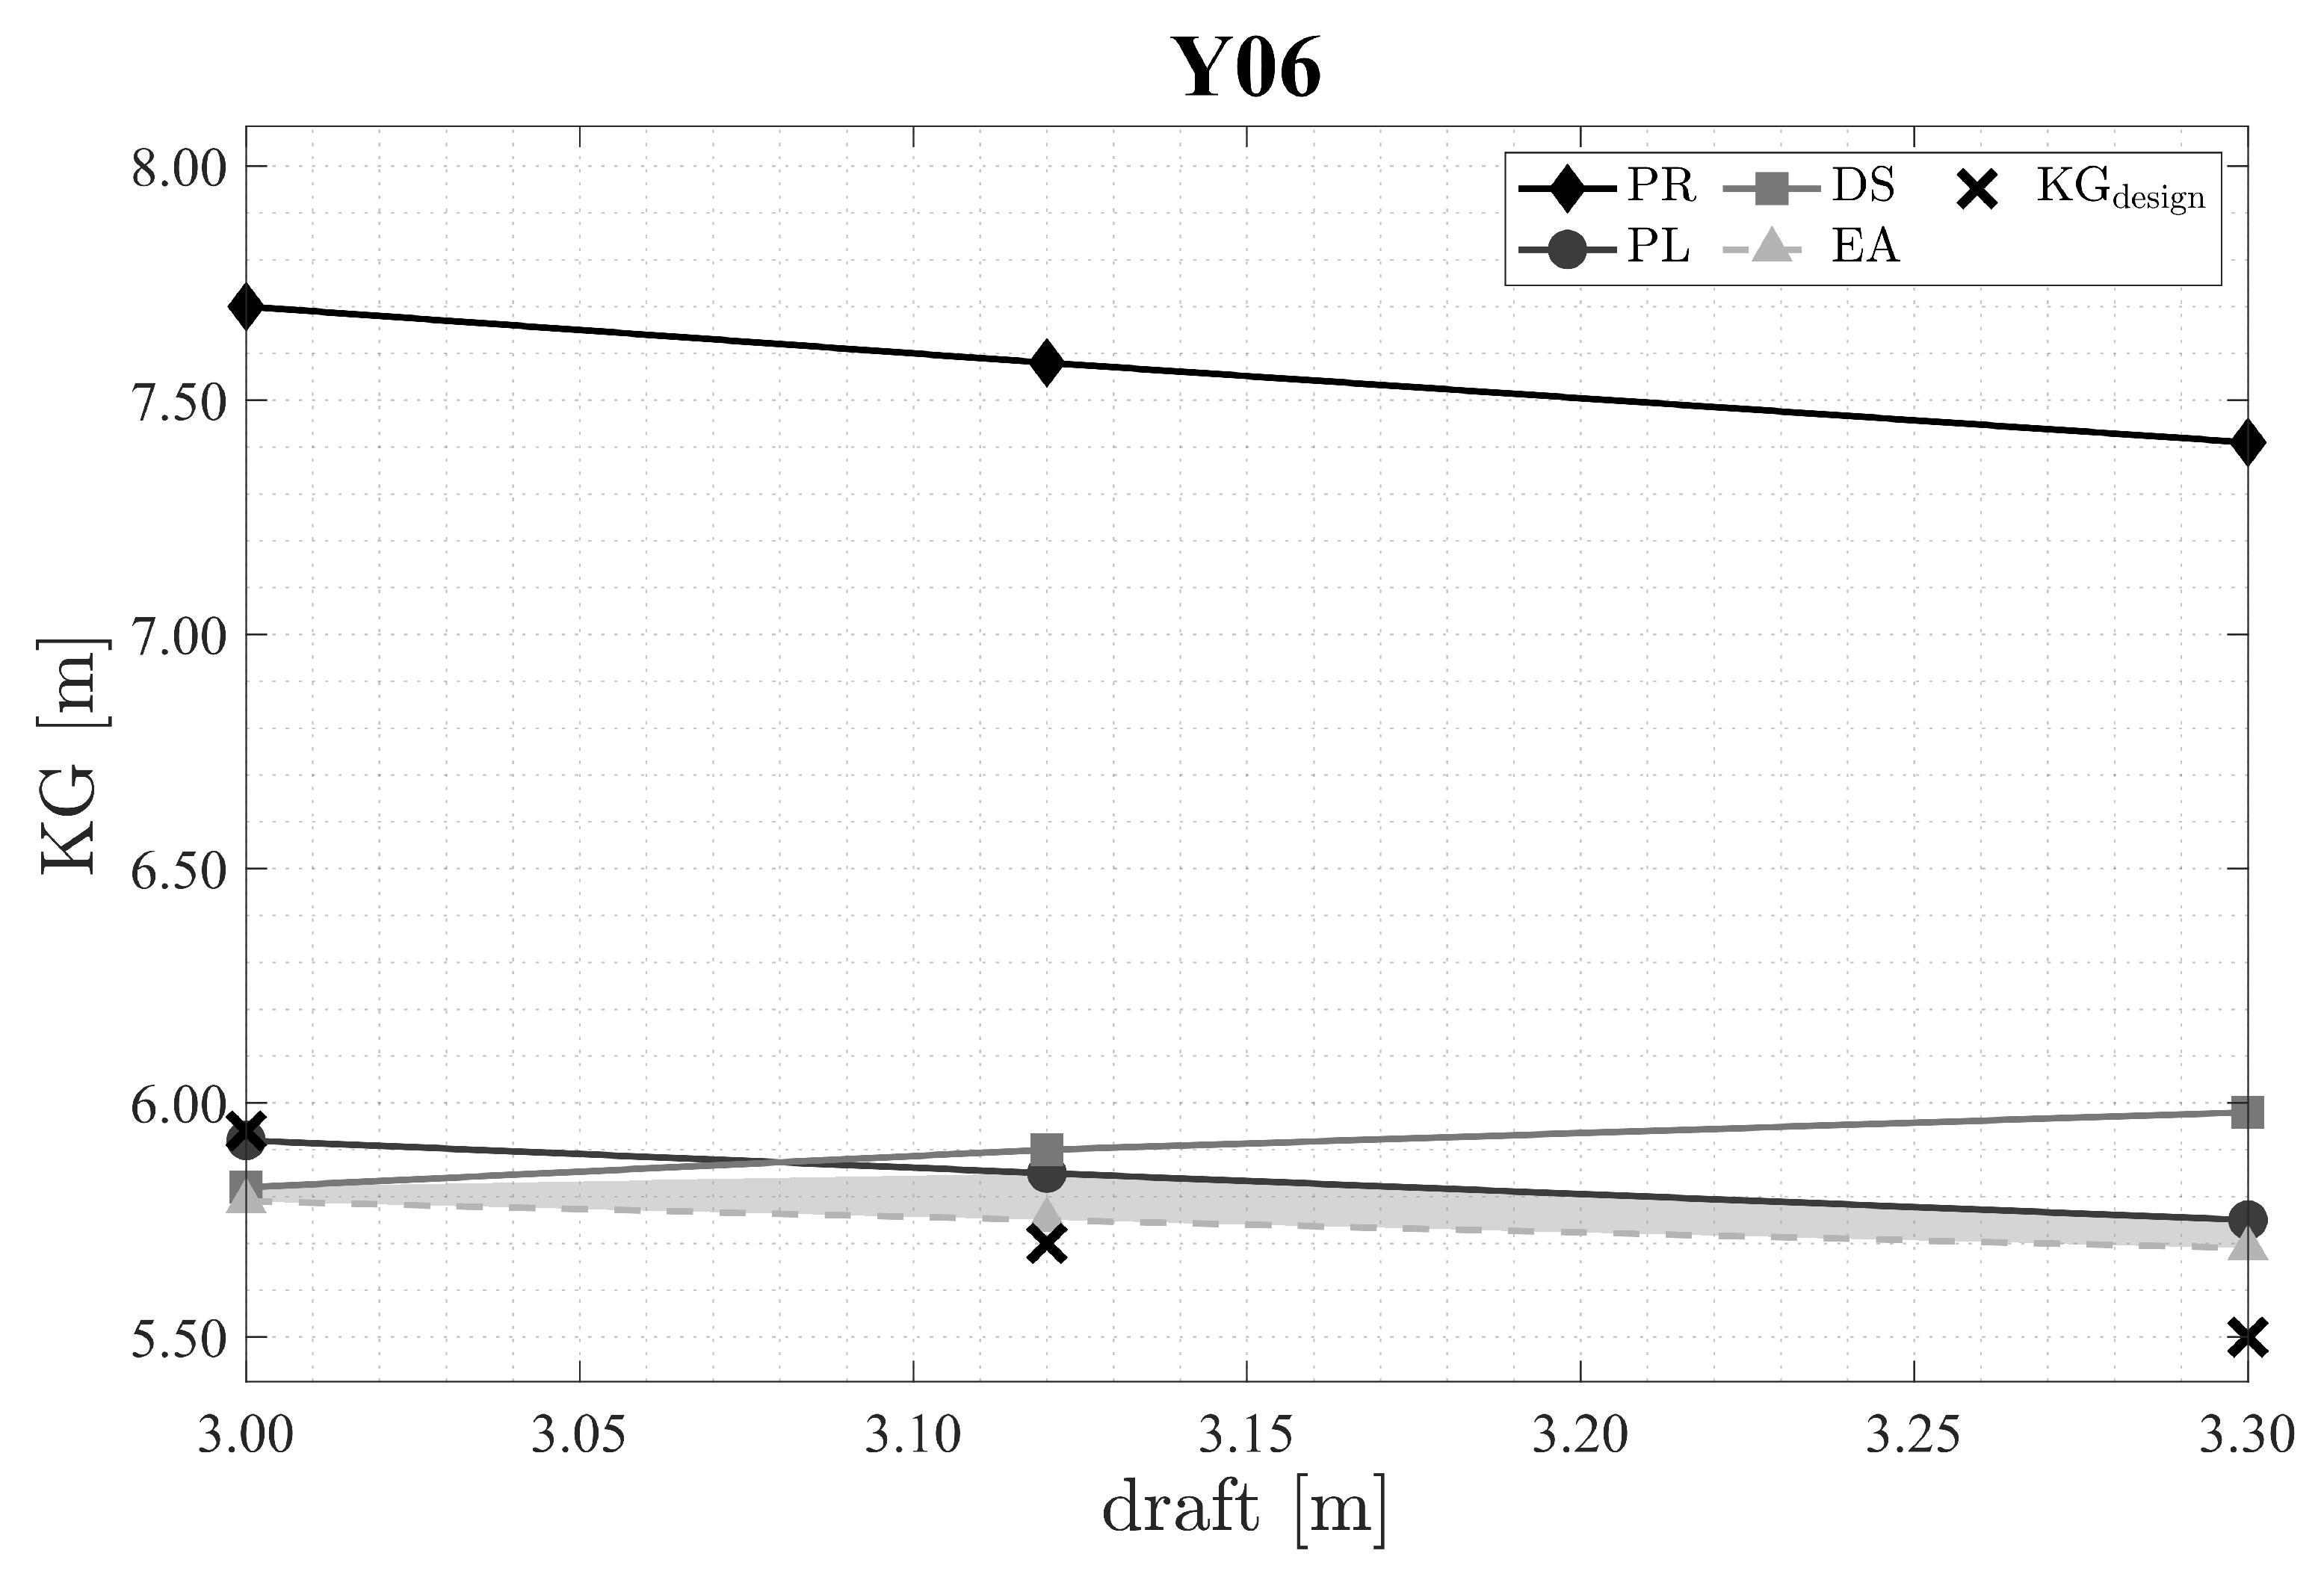
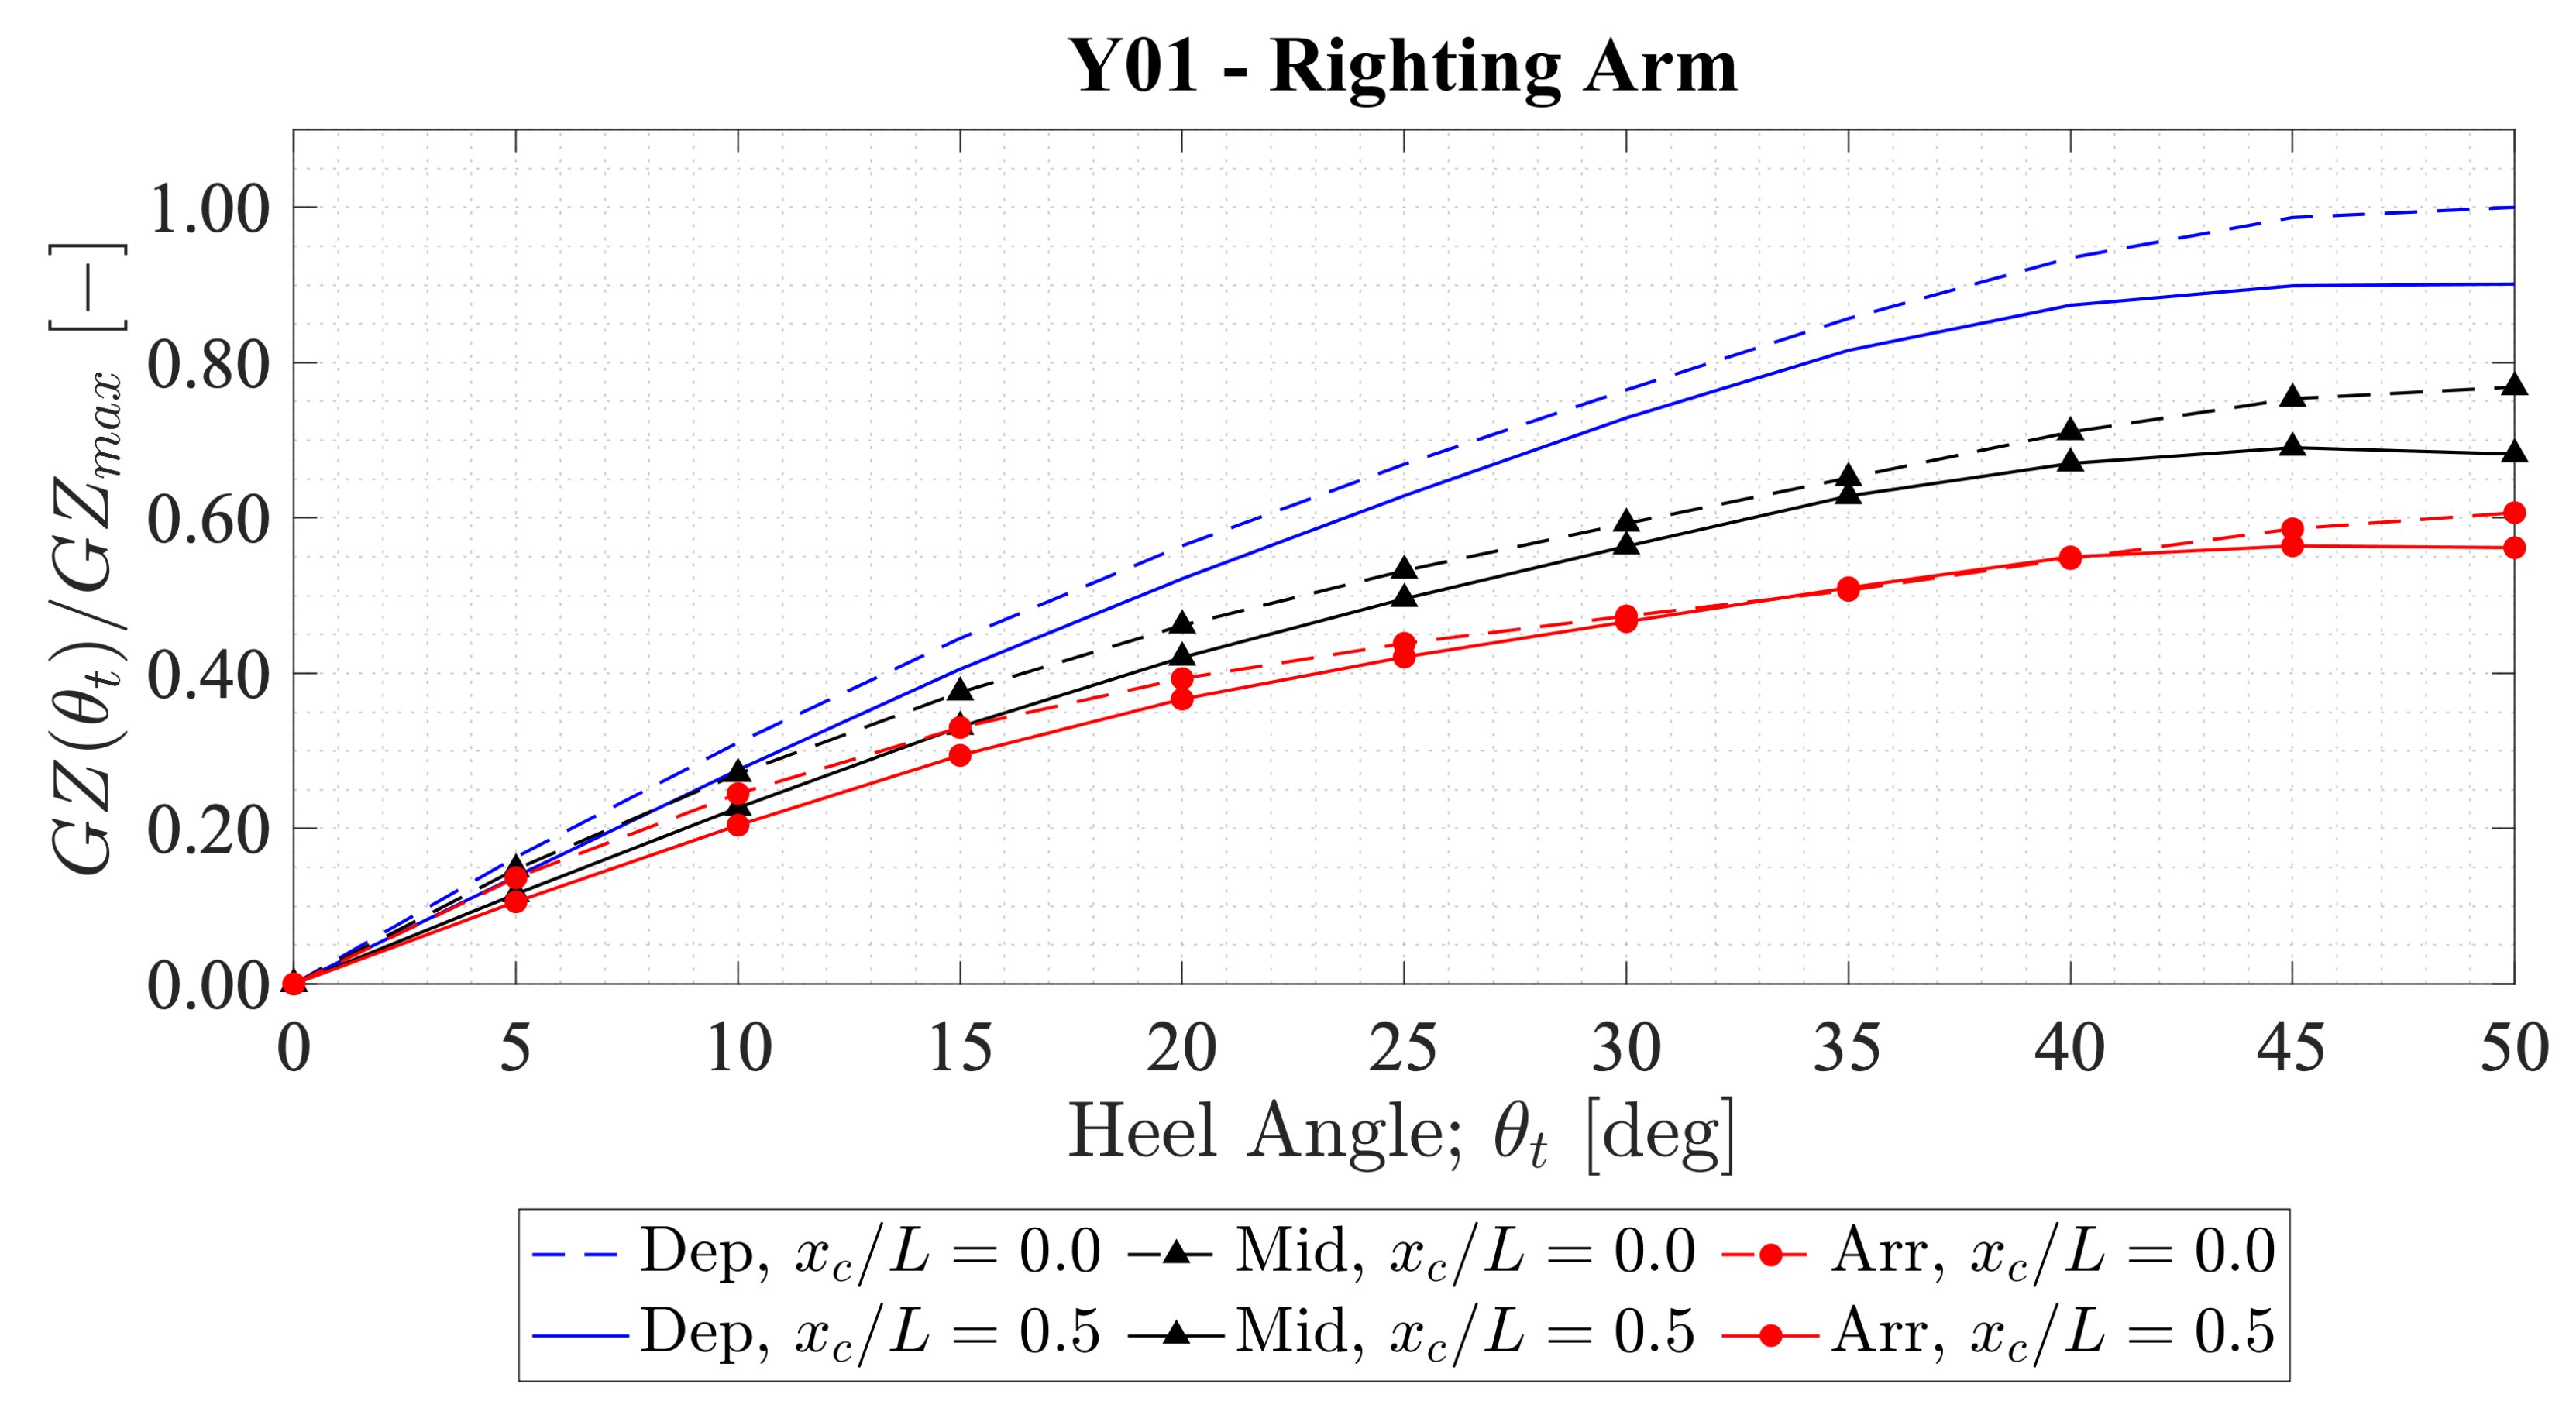
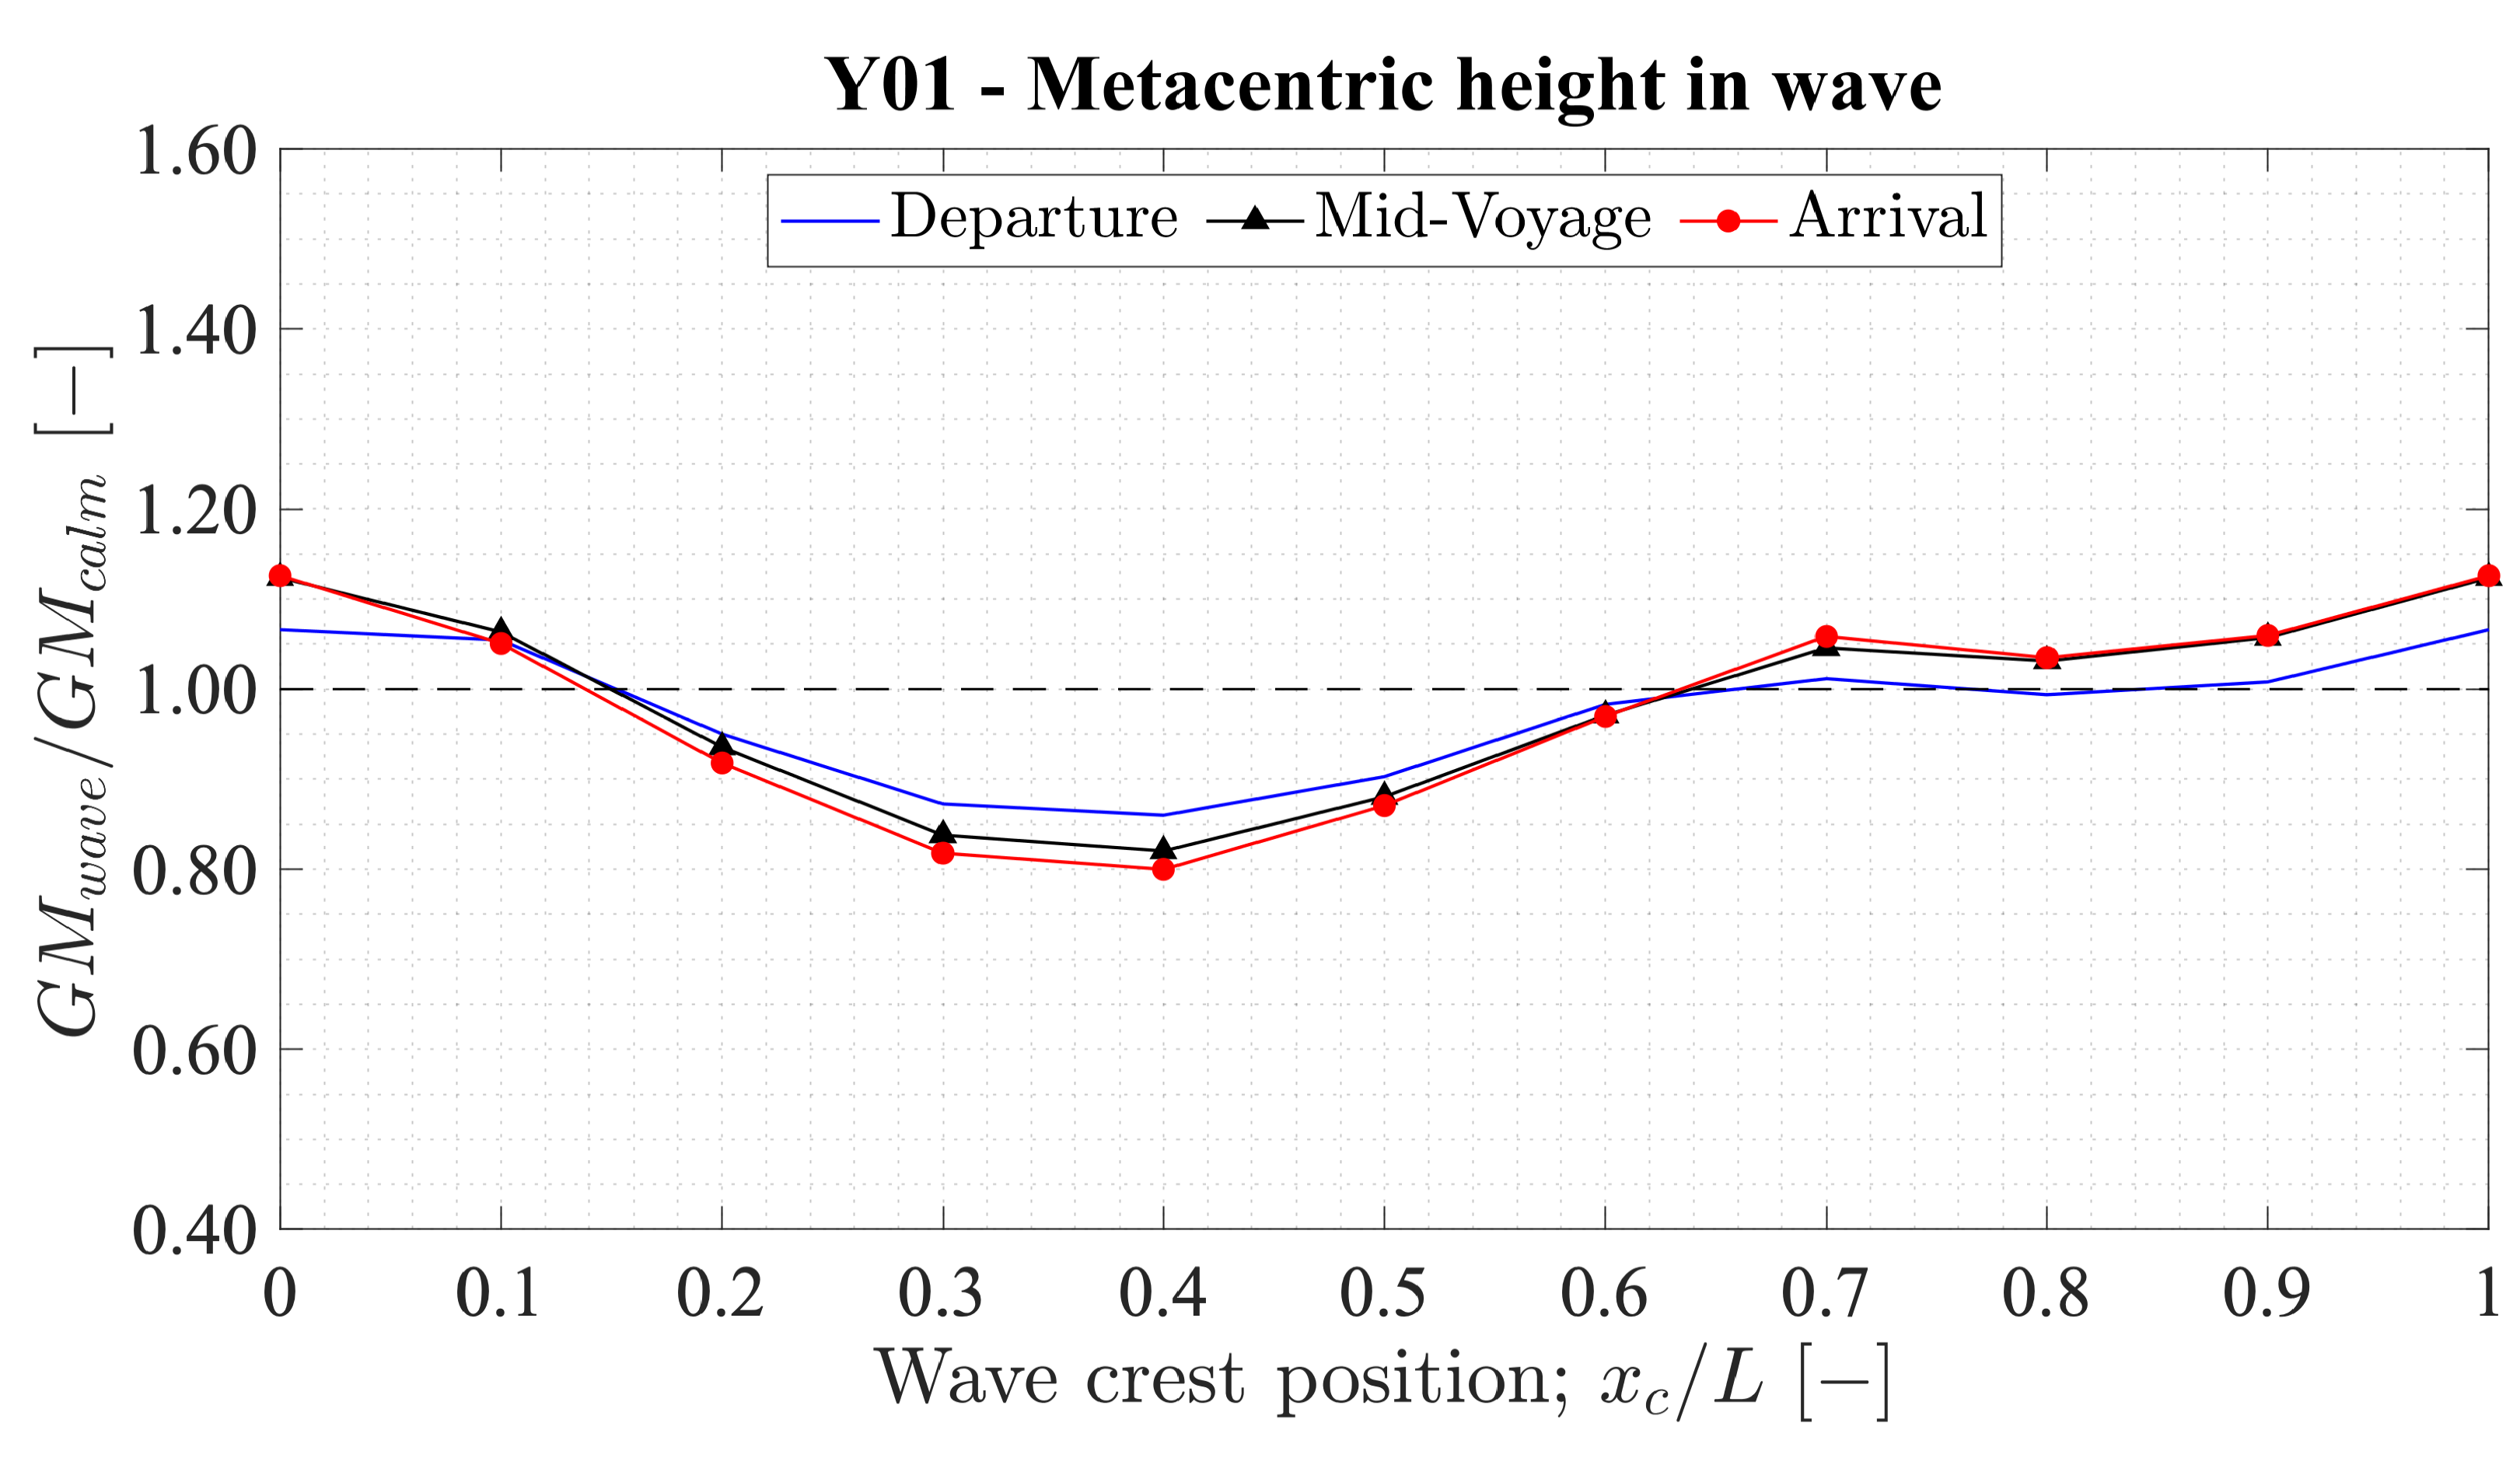
4.2. Wave Profile Influence on the Intact Stability Parameters
4.3. Outcome Summary for All Vessels
5. Further Considerations for SGISc
- –
- The effects of the assessed longitudinal position on the EA criterion;
- –
- The effect of the service speed on the surf-riding criterion;
- –
- The effect of the experimental evaluation of the roll damping on PR, DS, and EA.
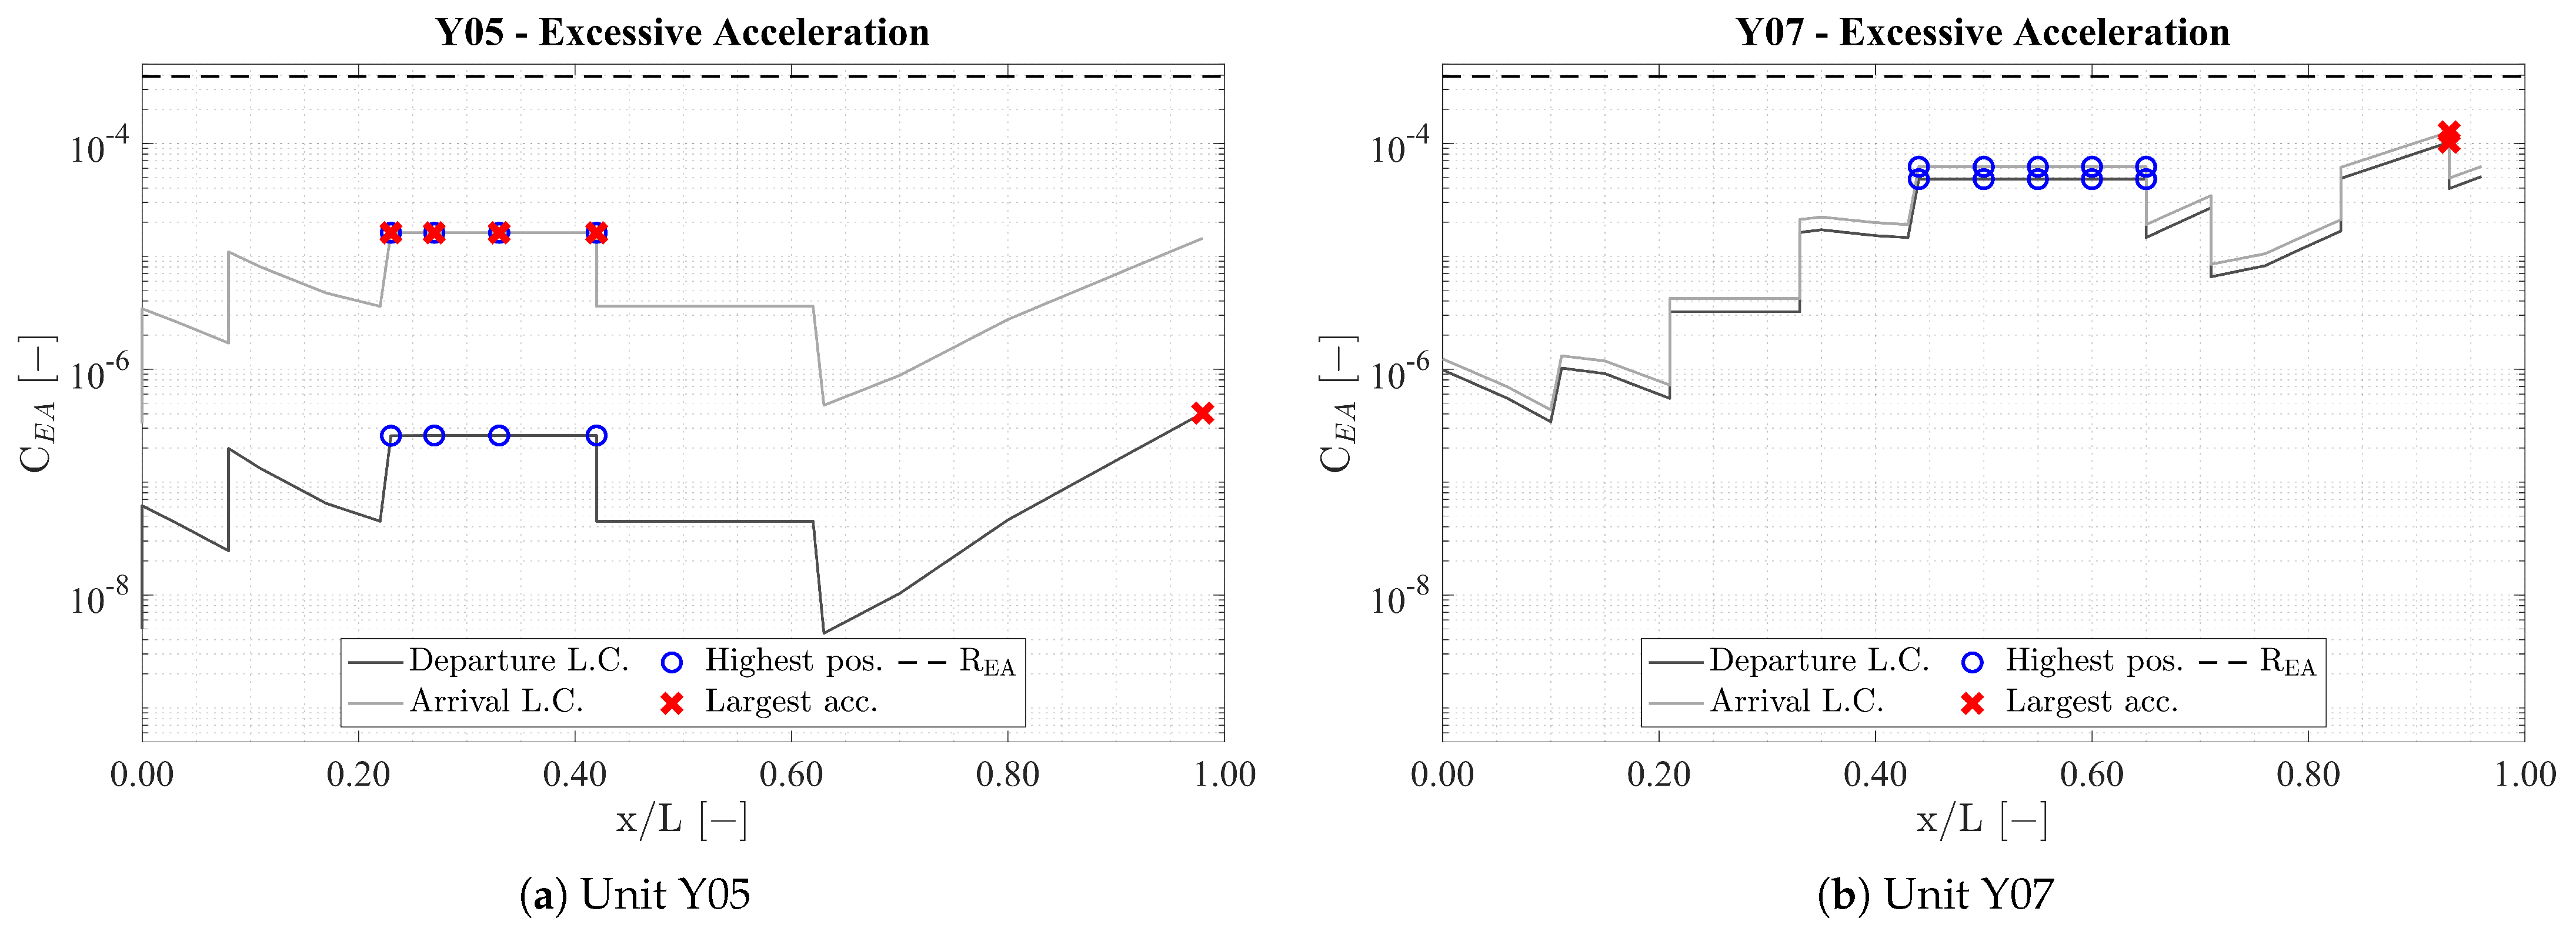
5.1. Effects of the Longitudinal Position on the Excessive Acceleration Criterion
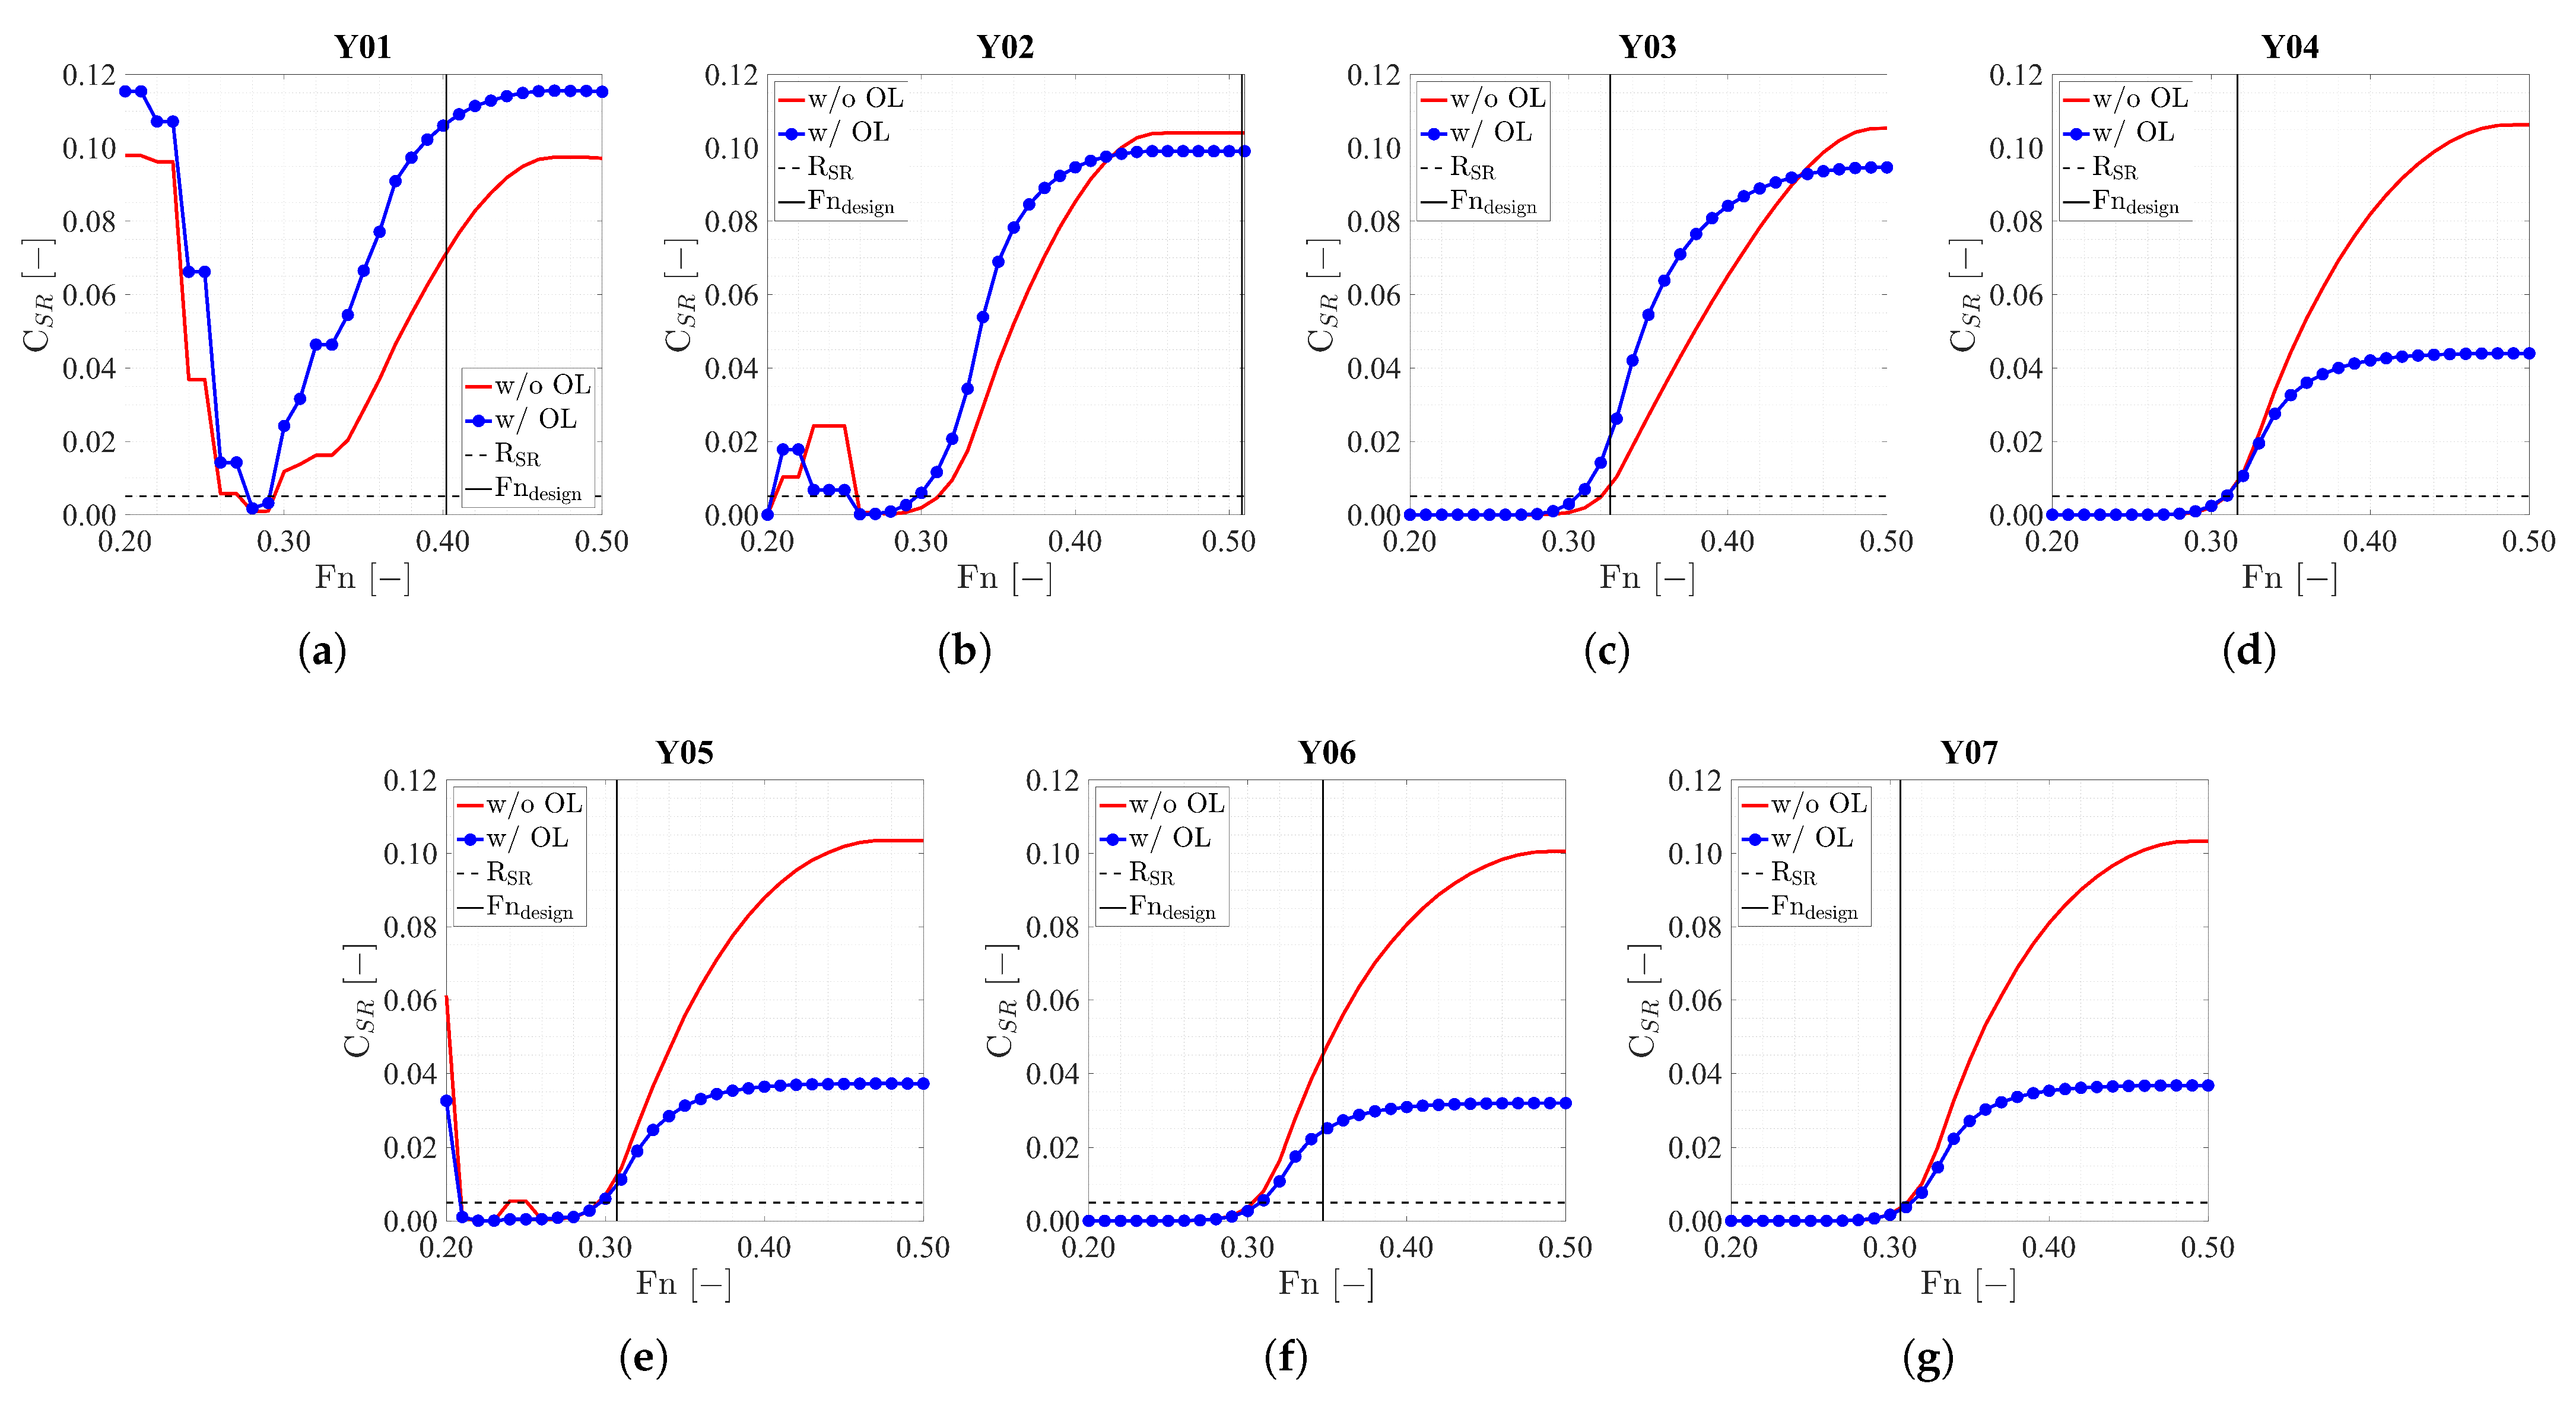
5.2. Effects of the Service Speed on the Surf-Riding Criterion
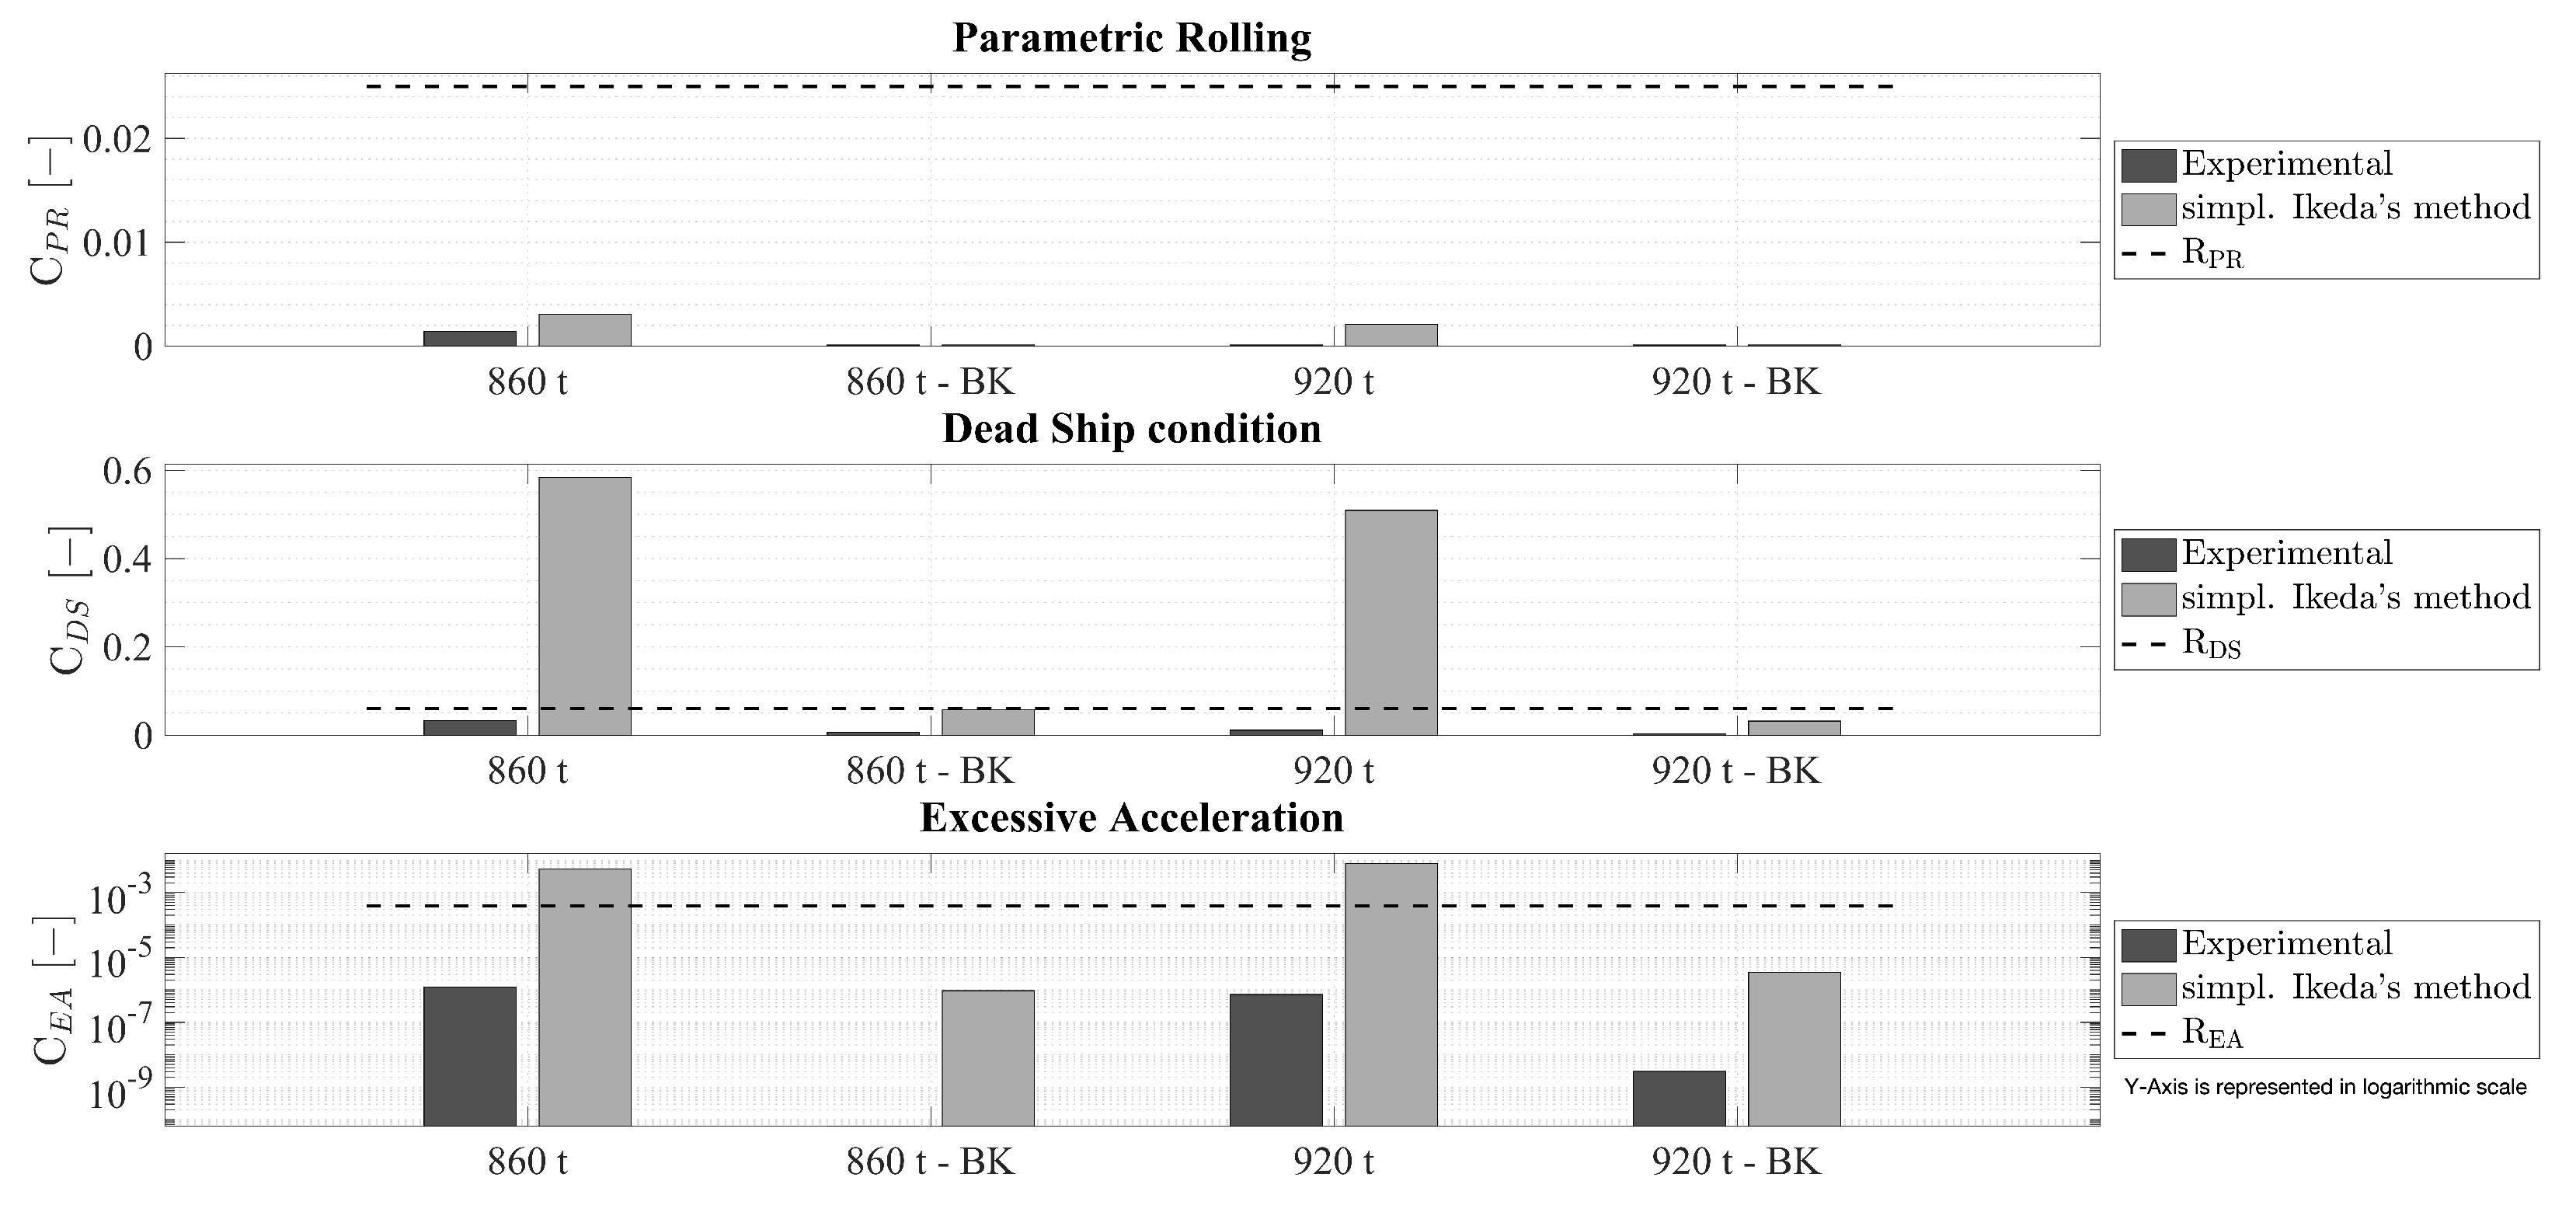
5.3. Effects of Experimental Evaluation of the Roll Damping
6. Conclusions
- –
- Application of SGISc shows that all units are not vulnerable to PR failure, while vulnerability to SR failure affects almost all vessels under any investigated loading conditions. Actually, due to the relatively small dimension, vulnerability to SR was expected. Moreover, it is worth noting that, for this kind of vessel, the application of the weather criterion of the IS code is not mandatory. This is reflected in the results, when compliance with the DS failure mode is assessed.
- –
- The OL related to the Mediterranean Sea has been applied, aimed at softening of the criteria compliance issues. This application points out that the expected improvement in terms of criteria compliance does not occur. In a general overview, OL reduces the vulnerability of loading conditions to DS and, in turn, vulnerability to PL seems to increase. Other stability failure modes are not affected by the application of OL related to the Mediterranean Sea.
- –
- From the investigation carried out during the research activity, the important influence of the longitudinal position has been demonstrated as well, especially for the largest units. In such cases, the worst situation is spotted in a position near the bow, which is lower than the highest location on board. This is due to the coupling factor among motions related to lateral acceleration, i.e., roll, pitch, and yaw, and modeled in the criterion by the factor. Nevertheless, it is an outcome to be considered in the refinement of the SGISc.
- –
- As expected, the study of the effects of service speed on the SR criterion points out that, the greater the speed, the larger the criterion, although the criterion curve starts flattening over . Moreover, for some units at low speeds (i.e., ), instabilities in the curve appear. This aspect requires further study because, in some cases, the unstable bounces may lead the unit to be considered vulnerable.
- –
- The analysis of the damping coefficient demonstrates that the Ikeda simplified method seems to underestimate the damping coefficient compared to the free roll decay test. It is worth noting that the investigated unit is partially outside the applicability range of the Ikeda simplified method; thus, this may affect the final outcomes.
Author Contributions
Funding
Data Availability Statement
Conflicts of Interest
Nomenclature and Acronyms
| SYMBOL | DEFINITION | |
| - | Metacentric height variation in wave according to PR Lv1 | |
| (t) | Ship displacement at full load condition | |
| (m) | Wave length | |
| (m) | Immersed volume at a draft equal to D | |
| ∇ | (m) | Immersed volume at a draft equal to d |
| - | Characteristic roll amplitude | |
| (m) | Waterplane area at a draft equal to d | |
| a | (m rad) | Left-hand area below the curve according to weather criterion in IS code |
| (m) | Maximum ship breadth | |
| (m) | Ship breadth at the design waterline | |
| b | (m rad) | Right-hand area below the curve according to weather criterion in IS code |
| (m) | Metacentric radius in calm water | |
| - | Criterion on hull shape according to PL and PR Lv1 | |
| - | Block coefficient: | |
| (m s) | EA Lv1 criterion | |
| - | Long-term vulnerability criterion according to Lv2 | |
| - | Midship coefficient: | |
| - | Shot-term vulnerability criterion according to Lv1 | |
| - | Vertical prismatic coefficient: | |
| D | (m) | Hull depth |
| D | (m) | Propeller diameter |
| d | (m) | Draft |
| - | Froude number: | |
| g | (m s) | Gravity acceleration |
| (m) | Minimum metacentric height in wave according to PL Lv1 | |
| (m) | Metacentric height in calm water | |
| (m) | Righting arm | |
| (m) | Maximum value of the righting arm | |
| (m) | Wave height | |
| (m) | Vertical position above the roll axis where person may be present | |
| - | Coupling factor considering simultaneous pitch, roll, and heave motions | |
| (m) | Vertical coordinate of the CoG | |
| (m) | Overall ship length | |
| (m) | Ship length at the design waterline | |
| L | (m) | Ship length according to IS code |
| (m) | Longitudinal coordinate of the CoG | |
| - | Standard threshold of PR Lv1 | |
| - | Wave steepness: | |
| - | Natural roll period | |
| (m s) | Ship service speed | |
| (m) | Vertical coordinate of the CoB | |
| - | Statistical weight of a sea state | |
| ACRONYM | DEFINITION | |
| CoB | Center of Buoyancy | |
| CoG | Center of Gravity | |
| DS | Dead Ship condition failure mode | |
| DSA | Direct Stability Assessment | |
| EA | Excessive Acceleration failure mode | |
| IMO | International Maritime Organization | |
| IS code | Intact Stability code | |
| Lv1 | First vulnerability level | |
| Lv2 | Second vulnerability level | |
| LY | Large Yacht code issued by the UK’s Maritime and Coastguard Agency | |
| MSC | IMO Maritime Safety Committee | |
| OG | Operational Guidance | |
| OL | Operational Limitation | |
| PL | Pure Loss of stability failure mode | |
| PR | Parametric Rolling failure mode | |
| SGISc | Second Generation Intact Stability criteria | |
| SOLAS | Safety Of Life At Sea convention | |
| SR | Surf-Riding/Broaching-to failure mode | |
| SYBAss | Superyacht Builders Association | |
Appendix A
Appendix A.1. Outcomes of the Complete Vulnerability Assessment

| Level 1 | Loading Condition | Level 2 | Loading Condition | ||||||
|---|---|---|---|---|---|---|---|---|---|
| Criterion | Arrival | Mid-Voyage | Departure | Criterion | Arrival | Mid-Voyage | Departure | ||
| PR | 0.206 | 0.183 | 0.192 | PR | 0.115 | 0.000 | 0.000 | ||
| 1.100 | 1.096 | 1.078 | 3.77 × | 3.67 × | 7.24 × | ||||
| PL | 0.409 | 0.543 | 0.639 | PL | 0.305 | 0.004 | 0.000 | ||
| 1.100 | 1.096 | 1.078 | 0.090 | 0.053 | 0.039 | ||||
| DS | 0.986 | 1.393 | 7.986 | DS | 0.790 | 0.745 | 0.655 | ||
| EA | m s | 6.226 | 5.957 | 7.813 | EA | 2.27 × | 2.43 × | 2.20 × | |
| SR | 0.508 | 0.508 | 0.402 | SR | 0.104 | 0.104 | 0.104 | ||
| 200 m | 41.641 | 41.663 | 37.510 | ||||||
| Level 1 | Loading Condition | Level 2 | Loading Condition | ||||||
|---|---|---|---|---|---|---|---|---|---|
| Criterion | Arrival | Mid-Voyage | Departure | Criterion | Arrival | Mid-Voyage | Departure | ||
| PR | 0.479 | 0.490 | 0.475 | PR | 0.000 | 0.000 | 0.000 | ||
| 1.077 | 1.077 | 1.075 | 0.000 | 0.000 | 0.000 | ||||
| PL | −0.041 | −0.044 | 0.082 | PL | 0.000 | 0.000 | 0.000 | ||
| 1.077 | 1.077 | 1.075 | 0.009 | 0.013 | 0.029 | ||||
| DS | 0.769 | 0.675 | 0.704 | DS | 0.392 | 0.405 | 0.400 | ||
| EA | m s | 6.226 | 5.957 | 5.686 | EA | 5.86 × | 3.79 × | 2.11 × | |
| SR | 0.326 | 0.326 | 0.326 | SR | 0.0079 | 0.0076 | 0.0078 | ||
| 200 m | 45.515 | 45.270 | 42.864 | ||||||
| Level 1 | Loading Condition | Level 2 | Loading Condition | ||||||
|---|---|---|---|---|---|---|---|---|---|
| Criterion | Arrival | Mid-Voyage | Departure | Criterion | Arrival | Mid-Voyage | Departure | ||
| PR | 0.245 | 0.195 | 0.109 | PR | 0.000 | 0.000 | 0.000 | ||
| 1.120 | 1.108 | 1.102 | 5.40 × | 8.87 × | 0.000 | ||||
| PL | m | 0.100 | 0.055 | 0.517 | PL | 0.000 | 0.000 | 0.000 | |
| 1.120 | 1.108 | 1.102 | 0.094 | 0.102 | 0.015 | ||||
| DS | 0.791 | 0.787 | 2.567 | DS | 0.127 | 0.097 | 0.024 | ||
| EA | m s | 5.206 | 3.830 | 4.356 | EA | 1.72 × | 1.30 × | 8.10 × | |
| SR | 0.316 | 0.316 | 0.316 | SR | 0.0141 | 0.0105 | 0.0089 | ||
| 200 m | 60.570 | 60.570 | 60.570 | ||||||
| Level 1 | Loading Condition | Level 2 | Loading Condition | ||||
|---|---|---|---|---|---|---|---|
| Criterion | Arrival | Departure | Criterion | Arrival | Departure | ||
| PR | 0.710 | 0.256 | PR | 0.000 | 0.000 | ||
| 1.217 | 1.185 | 0.000 | 0.000 | ||||
| PL | −1.740 | −1.399 | PL | 0.000 | 0.000 | ||
| 1.217 | 1.185 | 0.020 | 0.002 | ||||
| DS | 0.227 | 3.424 | DS | 0.106 | 0.017 | ||
| EA | m s | 4.569 | 5.340 | EA | 2.60 × 10 | 1.62 ×10 | |
| SR | 0.307 | 0.307 | SR | 0.0169 | 0.0121 | ||
| 200 m | 64.230 | 64.230 | |||||
| Level 1 | Loading Condition | Level 2 | Loading Condition | ||||||
|---|---|---|---|---|---|---|---|---|---|
| Criterion | Arrival | Mid-Voyage | Departure | Criterion | Arrival | Mid-Voyage | Departure | ||
| PR | 0.506 | 0.408 | 0.299 | PR | 0.000 | 0.000 | 0.000 | ||
| 1.043 | 1.050 | 1.092 | 0.012 | 0.007 | 0.008 | ||||
| PL | −0.440 | −0.116 | 0.176 | PL | 0.000 | 0.000 | 0.000 | ||
| 1.043 | 1.050 | 1.092 | 0.070 | 0.033 | 0.013 | ||||
| DS | 0.445 | 0.441 | 0.436 | DS | 0.213 | 0.183 | 0.161 | ||
| EA | m s | 7.042 | 7.379 | 7.470 | EA | 2.01 × | 4.70 × | 7.91 × | |
| SR | 0.347 | 0.347 | 0.347 | SR | 0.0329 | 0.0320 | 0.0455 | ||
| 200 m | 67.630 | 67.630 | 67.630 | ||||||
| Level 1 | Loading Condition | Level 2 | Loading Condition | ||||
|---|---|---|---|---|---|---|---|
| Criterion | Arrival | Departure | Criterion | Arrival | Departure | ||
| PR | 0.572 | 0.473 | PR | 0.000 | 0.000 | ||
| 1.039 | 1.031 | 7.05 × 10 | 6.10 × 10 | ||||
| PL | −0.660 | −0.491 | PL | 0.000 | 0.000 | ||
| 1.039 | 1.031 | 0.139 | 0.102 | ||||
| DS | 0.998 | 1.184 | DS | 0.254 | 0.252 | ||
| EA | m s | 5.737 | 5.817 | EA | 4.50 × 10 | 6.20 × 10 | |
| SR | 0.306 | 0.306 | SR | 0.0039 | 0.0034 | ||
| 200 m | 64.540 | 64.540 | |||||
| Y02 | Loading Condition | Y03 | Loading Condition | ||||
|---|---|---|---|---|---|---|---|
| Stability Failure | Arrival | Mid-Voyage | Departure | Stability Failure | Arrival | Mid-Voyage | Departure |
| PR | MET | MET | MET | PR | MET | MET | MET |
| PL | MET | MET | MET | PL | MET | MET | MET |
| DS | NOT MET | MET | MET | DS | NOT MET | NOT MET | NOT MET |
| EA | NOT MET | NOT MET | NOT MET | EA | NOT MET | MET | MET |
| SR | NOT MET | NOT MET | NOT MET | SR | NOT MET | NOT MET | NOT MET |
| Y04 | Loading Condition | Y05 | Loading Condition | ||||
| Stability Failure | Arrival | Mid-Voyage | Departure | Stability Failure | Arrival | Departure | |
| PR | MET | MET | MET | PR | MET | MET | |
| PL | MET | MET | MET | PL | MET | MET | |
| DS | NOT MET | NOT MET | MET | DS | NOT MET | MET | |
| EA | MET | MET | MET | EA | MET | MET | |
| SR | NOT MET | NOT MET | NOT MET | SR | NOT MET | NOT MET | |
| Y06 | Loading Condition | Y07 | Loading Condition | ||||
| Stability Failure | Arrival | Mid-Voyage | Departure | Stability Failure | Arrival | Departure | |
| PR | MET | MET | MET | PR | MET | MET | |
| PL | NOT MET | MET | MET | PL | NOT MET | NOT MET | |
| DS | NOT MET | NOT MET | NOT MET | DS | NOT MET | MET | |
| EA | MET | NOT MET | NOT MET | EA | MET | MET | |
| SR | NOT MET | NOT MET | NOT MET | SR | MET | MET | |
| Stability | Loading Condition | ||
|---|---|---|---|
| Failure | Arrival | Mid-Voyage | Departure |
| maximum (m) | |||
| PR | 4.85 | 4.77 | 4.66 |
| PL | 3.92 | 3.96 | 3.98 |
| DS | 3.55 | 3.58 | 3.61 |
| minimum (m) | |||
| EA | 4.01 | 3.99 | 3.95 |
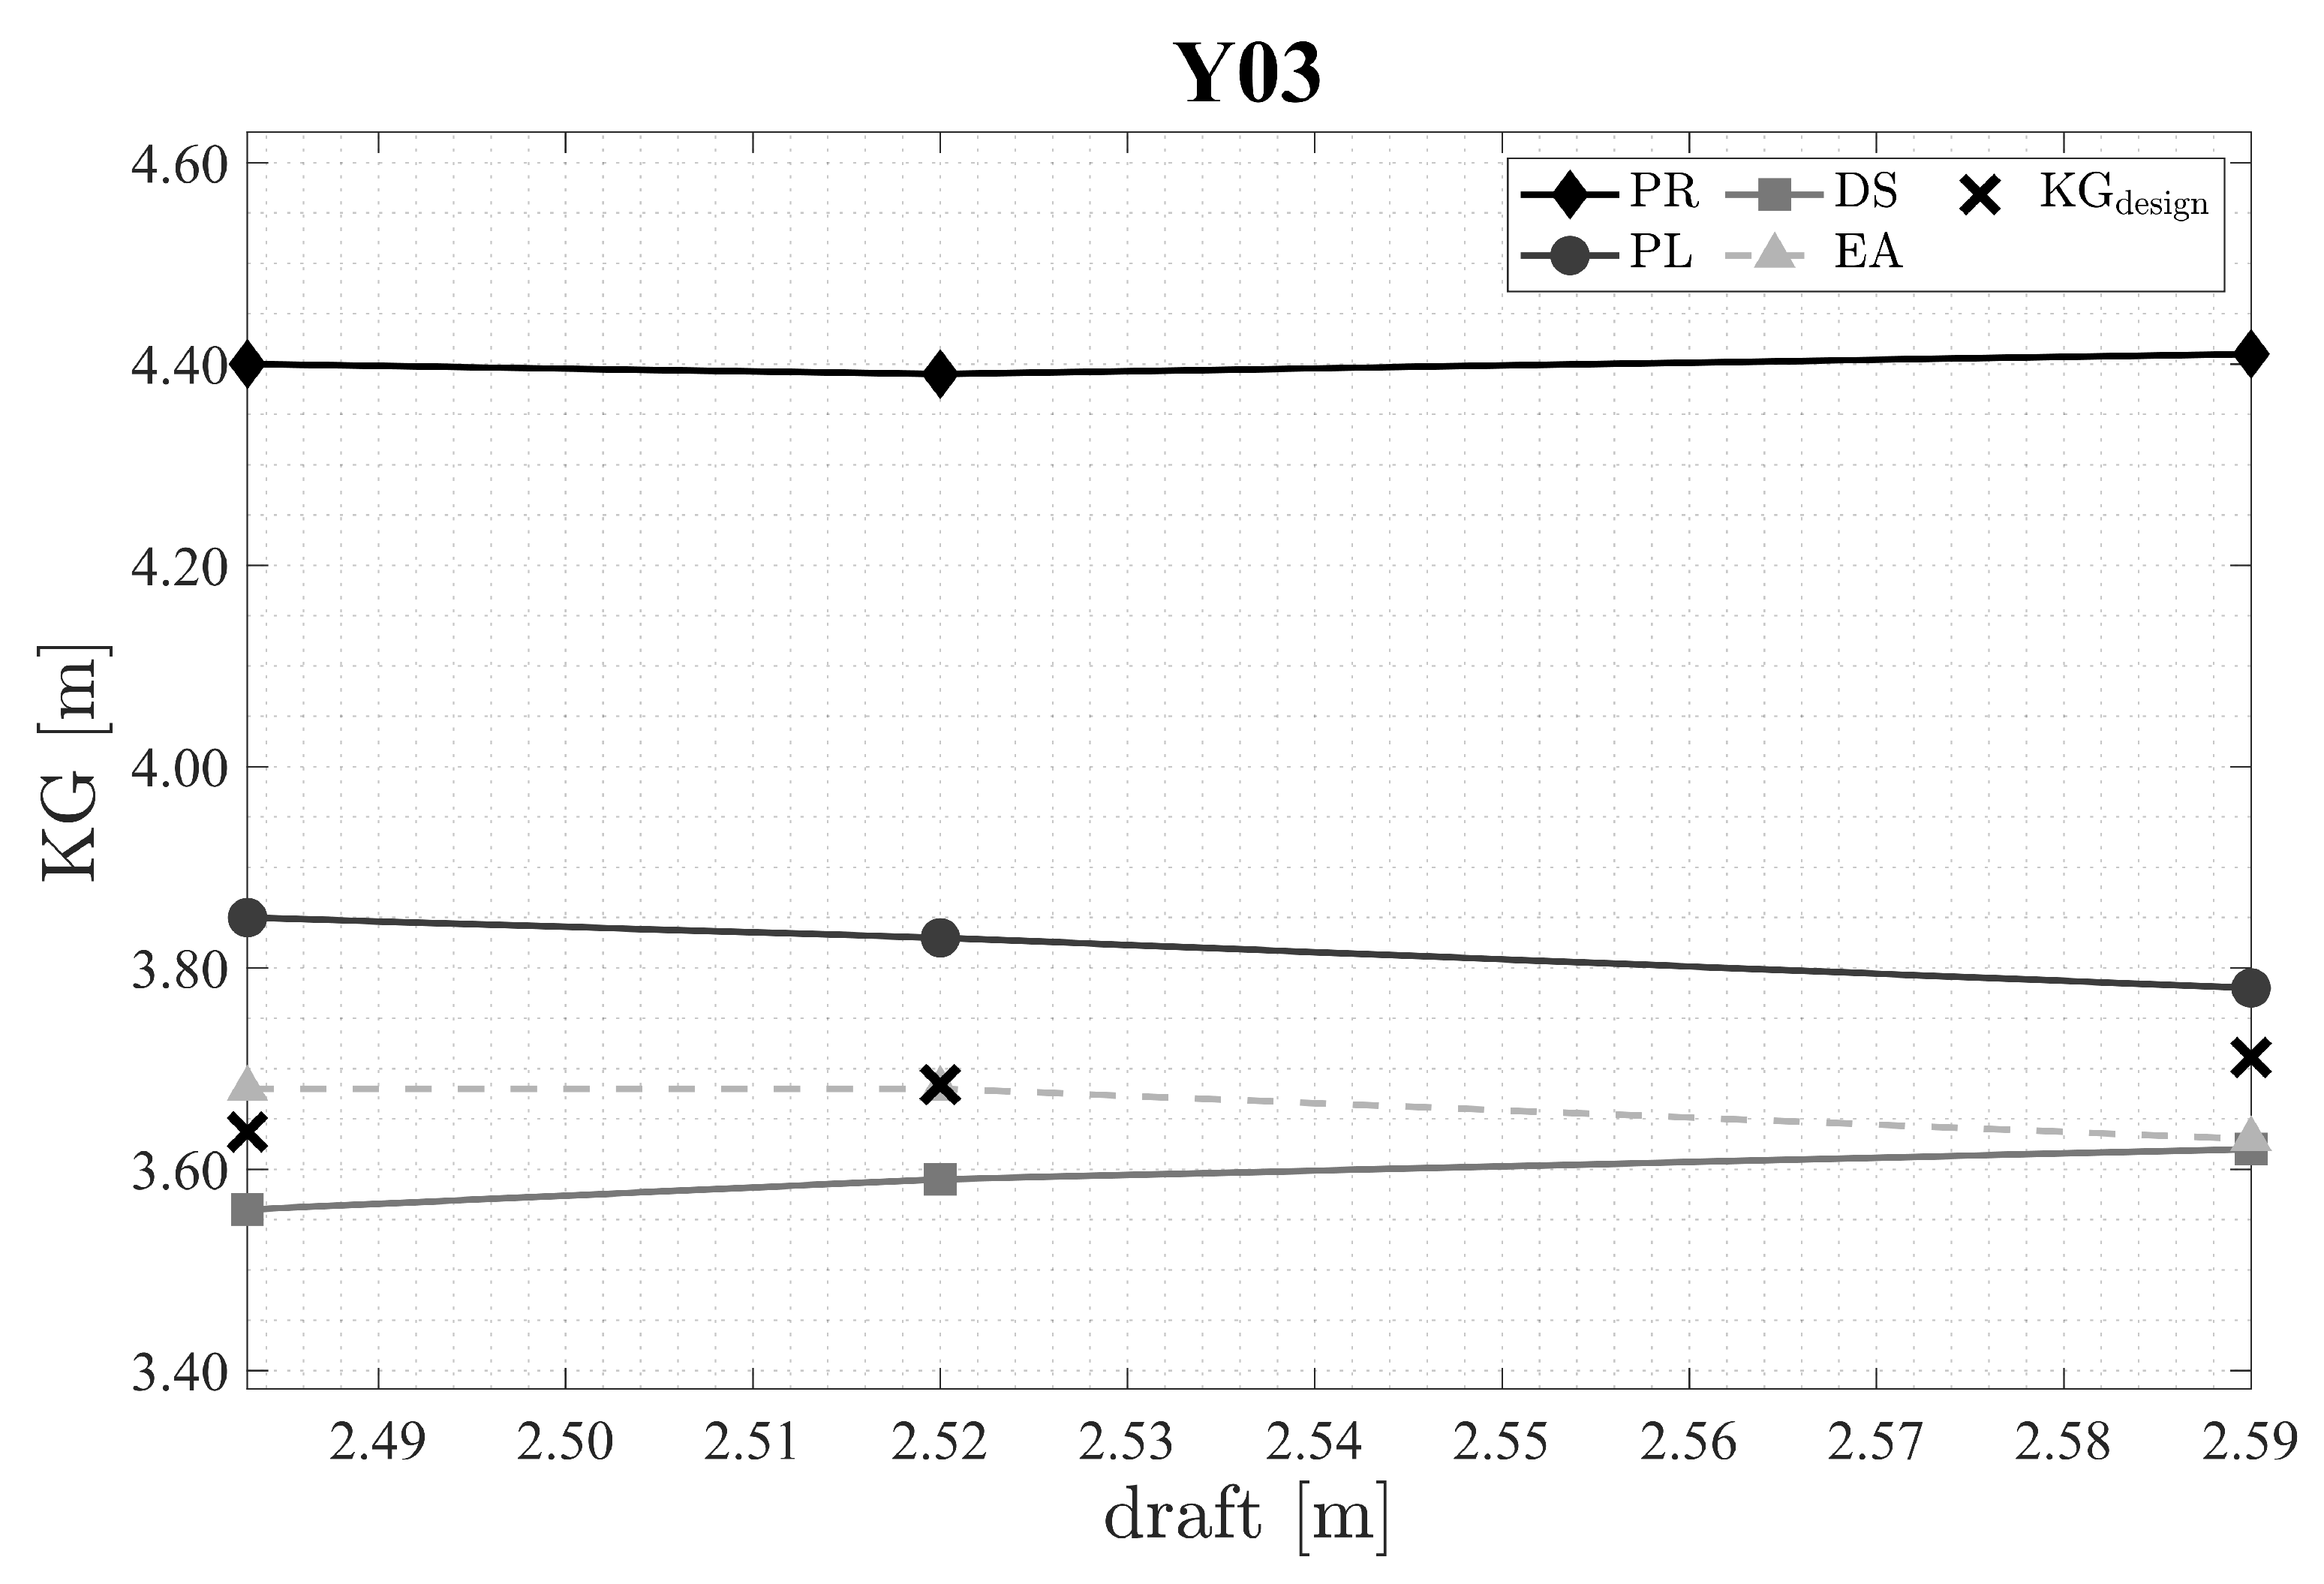
| Stability | Loading Condition | ||
|---|---|---|---|
| Failure | Arrival | Mid-Voyage | Departure |
| maximum (m) | |||
| PR | 4.40 | 4.39 | 4.41 |
| PL | 3.85 | 3.83 | 3.78 |
| DS | 3.56 | 3.59 | 3.62 |
| minimum (m) | |||
| EA | 3.68 | 3.68 | 3.63 |

| Stability | Loading Condition | ||
|---|---|---|---|
| Failure | Arrival | Mid-Voyage | Departure |
| maximum (m) | |||
| PR | 6.81 | 6.15 | 6.03 |
| PL | 5.52 | 5.60 | 5.64 |
| DS | 5.37 | 5.50 | 5.82 |
| minimum (m) | |||
| EA | 4.39 | 4.23 | 4.15 |

| Stability | Loading Condition | ||
|---|---|---|---|
| Failure | Arrival | Mid-Voyage | Departure |
| maximum (m) | |||
| PR | 6.38 | 6.24 | 5.94 |
| PL | 5.41 | 5.11 | 5.07 |
| DS | 5.07 | 5.12 | 5.25 |
| minimum (m) | |||
| EA | 4.07 | 3.98 | 3.89 |
| Stability | Loading Condition | ||
|---|---|---|---|
| Failure | Arrival | Mid-Voyage | Departure |
| maximum (m) | |||
| PR | 7.70 | 7.58 | 7.41 |
| PL | 5.92 | 5.85 | 5.75 |
| DS | 5.82 | 5.90 | 5.98 |
| minimum (m) | |||
| EA | 5.79 | 5.75 | 5.69 |
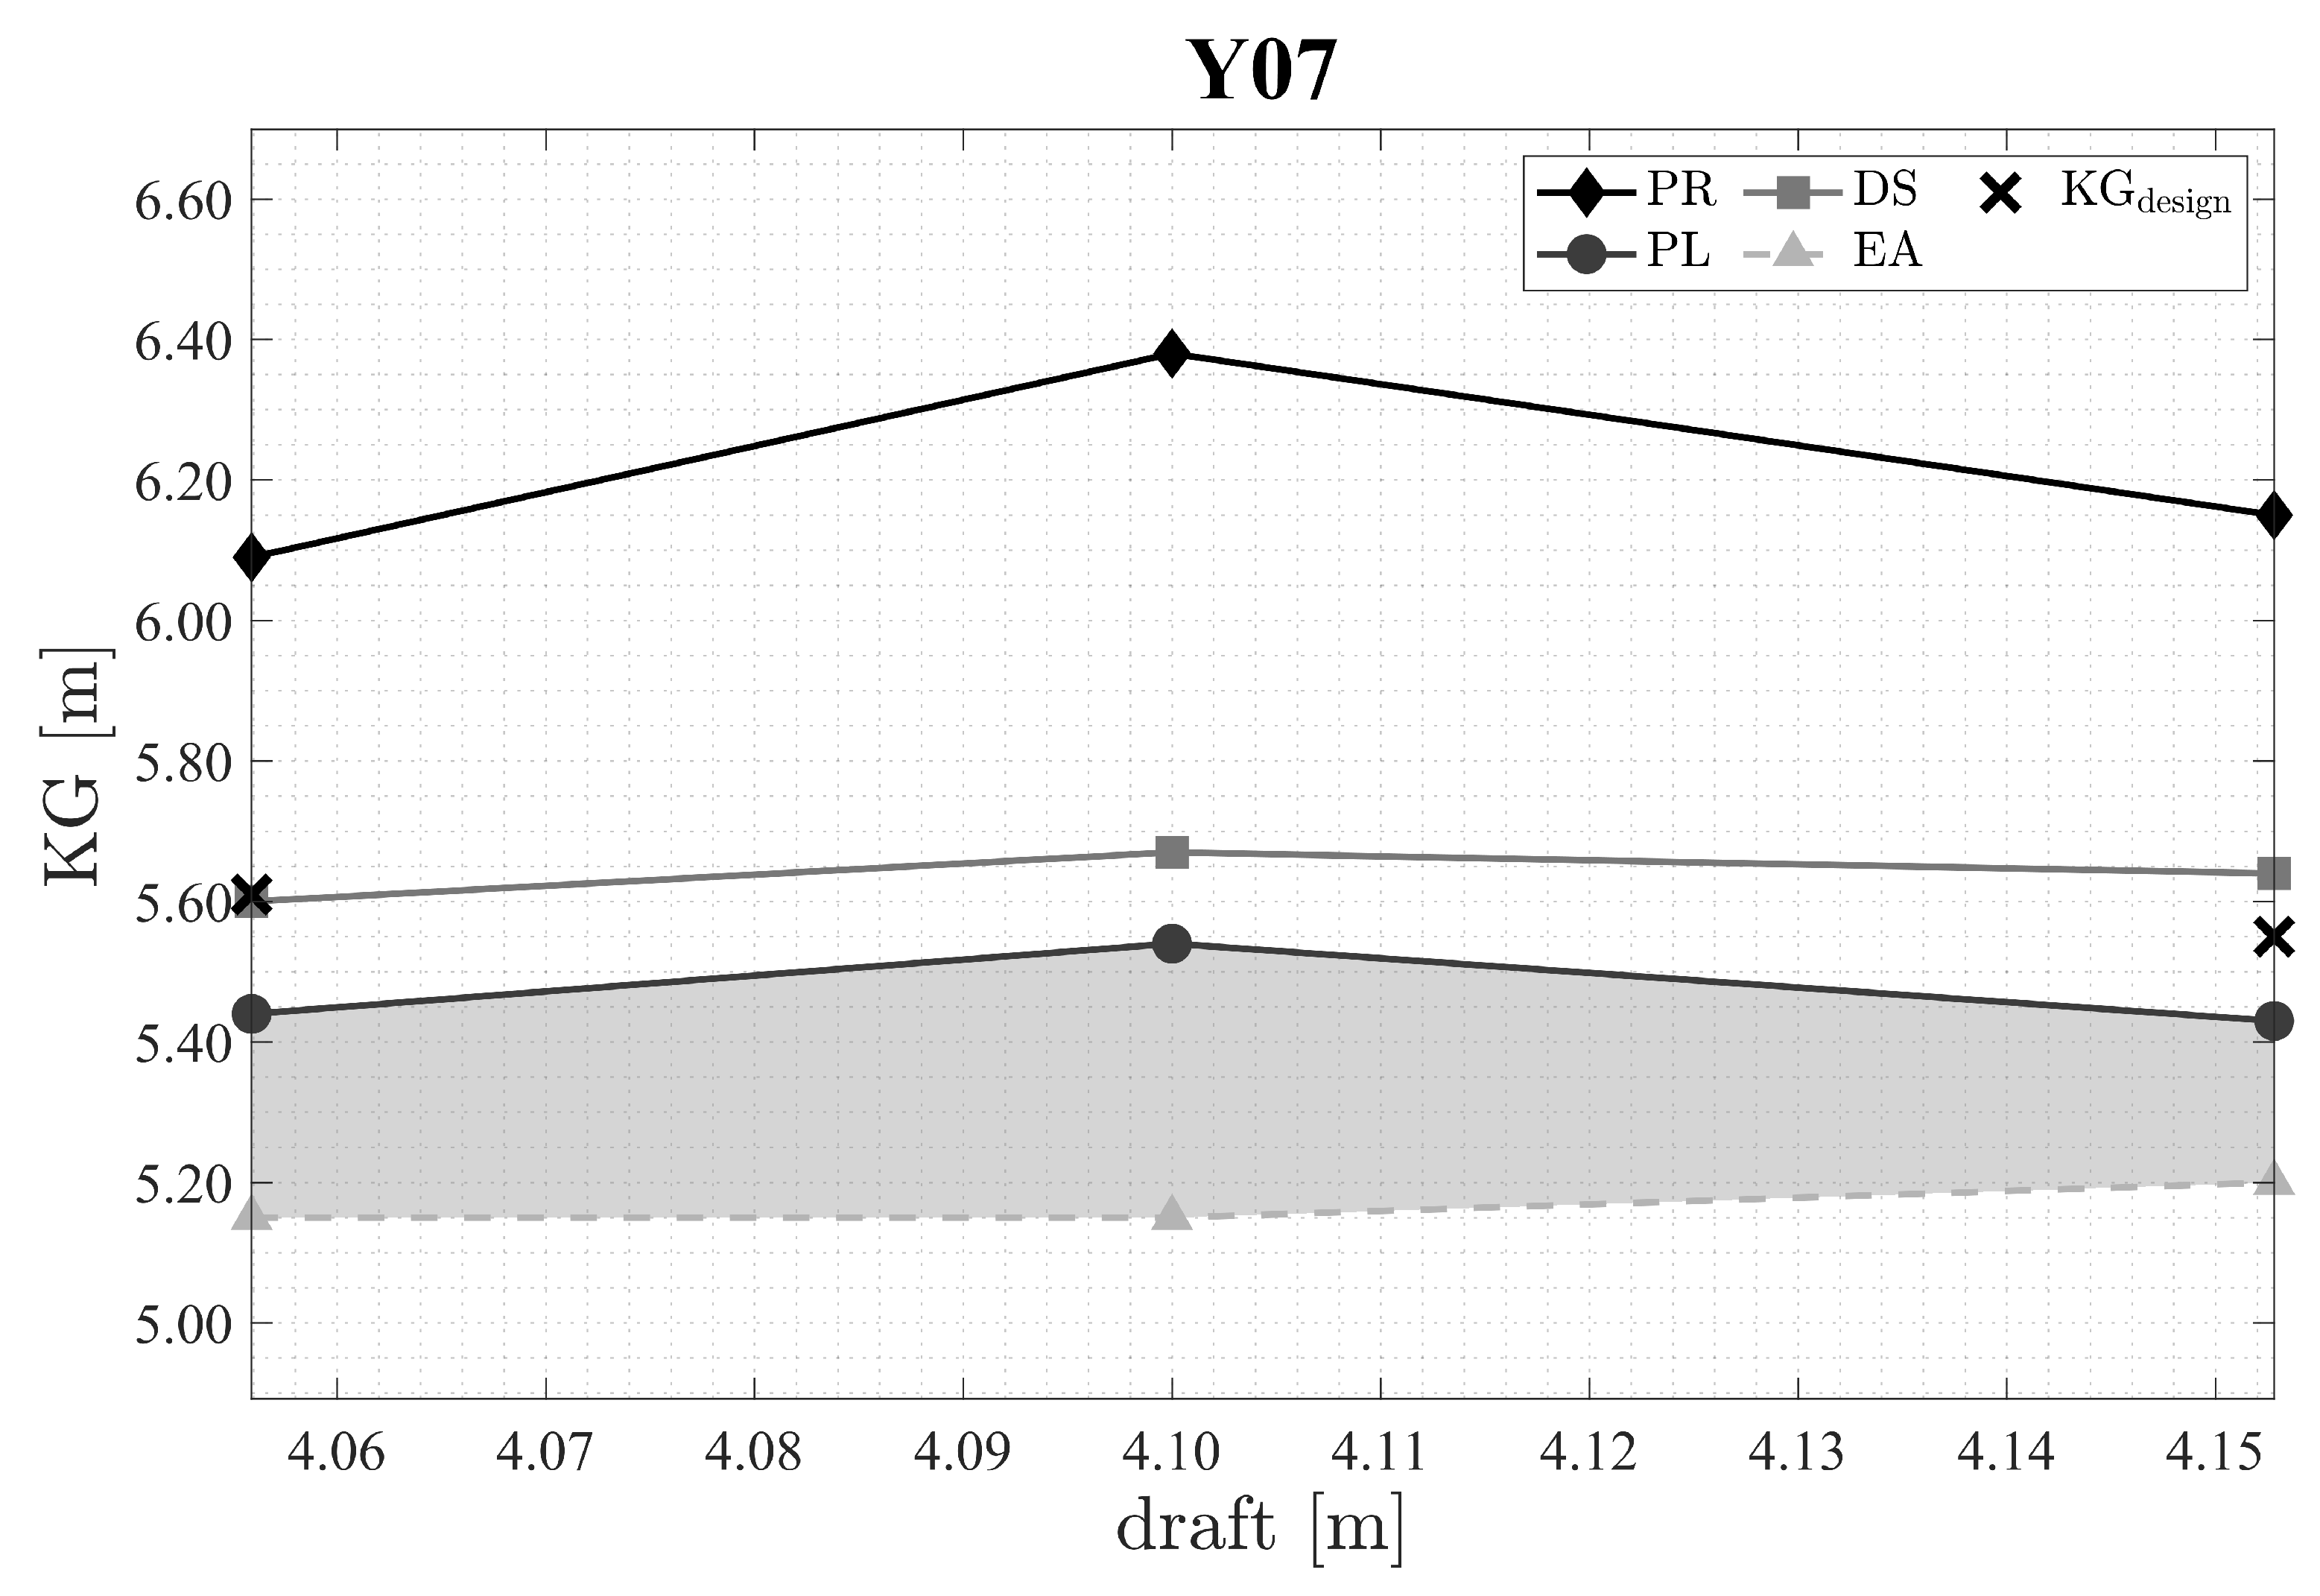
| Stability | Loading Condition | ||
|---|---|---|---|
| Failure | Arrival | Mid-Voyage | Departure |
| maximum (m) | |||
| PR | 6.09 | 6.38 | 6.15 |
| PL | 5.44 | 5.54 | 5.43 |
| DS | 5.60 | 5.67 | 5.64 |
| minimum (m) | |||
| EA | 5.15 | 5.15 | 5.20 |
Appendix A.2. Outcomes of the Complete Vulnerability Assessment with Operational Limitations Related to the Mediterranean Sea
| Level 1 | Loading Condition | Level 2 | Loading Condition | ||||||
|---|---|---|---|---|---|---|---|---|---|
| Criterion | Arrival | Mid-Voyage | Departure | Criterion | Arrival | Mid-Voyage | Departure | ||
| PR | 0.973 | 0.875 | 0.717 | PR | 0.899 | 0.027 | 0.000 | ||
| 1.100 | 1.096 | 1.091 | 1.50 × | 5.51 × 10 | 2.12 × 10 | ||||
| PL | −2.152 | −2.021 | −1.867 | PL | 0.282 | 0.027 | 0.000 | ||
| 1.100 | 1.096 | 1.091 | 0.144 | 0.116 | 0.076 | ||||
| DS | 0.986 | 1.393 | 1.858 | DS | 0.652 | 0.635 | 0.581 | ||
| EA | m s | 6.226 | 5.957 | 5.686 | EA | 2.69 × | 2.89 × | 2.72 × | |
| SR | 0.508 | 0.508 | 0.508 | SR | 0.0991 | 0.0993 | 0.0991 | ||
| 41.641 | 41.663 | 41.690 | |||||||
| Level 1 | Loading Condition | Level 2 | Loading Condition | ||||||
|---|---|---|---|---|---|---|---|---|---|
| Criterion | Arrival | Mid-Voyage | Departure | Criterion | Arrival | Mid-Voyage | Departure | ||
| PR | 1.058 | 1.088 | 1.001 | PR | 0.000 | 0.000 | 0.000 | ||
| 1.077 | 1.077 | 1.075 | 0.000 | 0.000 | 0.000 | ||||
| PL | −1.762 | −1.786 | −1.767 | PL | 0.000 | 0.000 | 0.000 | ||
| 1.077 | 1.077 | 1.075 | 0.028 | 0.038 | 0.076 | ||||
| DS | 0.769 | 0.675 | 0.704 | DS | 0.218 | 0.208 | 0.205 | ||
| EA | m s | 6.226 | 5.957 | 5.686 | EA | 5.00 × 10 | 2.63 × 10 | 1.12 × 10 | |
| SR | 0.326 | 0.326 | 0.326 | SR | 0.0179 | 0.0177 | 0.0208 | ||
| 45.515 | 45.270 | 42.864 | |||||||
| Level 1 | Loading Condition | Level 2 | Loading Condition | ||||||
|---|---|---|---|---|---|---|---|---|---|
| Criterion | Arrival | Mid-Voyage | Departure | Criterion | Arrival | Mid-Voyage | Departure | ||
| PR | 0.872 | 0.953 | 0.560 | PR | 0.000 | 0.000 | 0.000 | ||
| 1.120 | 1.108 | 1.102 | 4.24 × 10 | 4.45 × 10 | 0.000 | ||||
| PL | −3.075 | −2.944 | −2.323 | PL | 0.000 | 0.000 | 0.000 | ||
| 1.120 | 1.108 | 1.102 | 0.082 | 0.106 | 0.028 | ||||
| DS | 0.791 | 0.787 | 2.567 | DS | 0.058 | 0.015 | 0.008 | ||
| EA | m s | 5.206 | 3.830 | 4.356 | EA | 1.09 × 10 | 9.43 × 10 | 5.40 × 10 | |
| SR | 0.316 | 0.316 | 0.316 | SR | 0.0127 | 0.0098 | 0.0085 | ||
| 60.570 | 60.570 | 60.570 | |||||||
| Level 1 | Loading Condition | Level 2 | Loading Condition | ||||
|---|---|---|---|---|---|---|---|
| Criterion | Arrival | Departure | Criterion | Arrival | Departure | ||
| PR | 1.684 | 0.957 | PR | 0.000 | 0.000 | ||
| 1.217 | 1.185 | 0.000 | 0.000 | ||||
| PL | −3.711 | −3.426 | PL | 0.000 | 0.000 | ||
| 1.217 | 1.185 | 0.030 | 0.006 | ||||
| DS | 0.227 | 3.424 | DS | 0.046 | 0.021 | ||
| EA | m s | 4.569 | 5.340 | EA | 7.96 × 10 | 2.82 × 10 | |
| SR | 0.307 | 0.307 | SR | 0.0130 | 0.0097 | ||
| 64.230 | 64.230 | ||||||
| Level 1 | Loading Condition | Level 2 | Loading Condition | ||||||
|---|---|---|---|---|---|---|---|---|---|
| Criterion | Arrival | Mid-Voyage | Departure | Criterion | Arrival | Mid-Voyage | Departure | ||
| PR | 1.149 | 0.971 | 0.820 | PR | 0.000 | 0.000 | 0.000 | ||
| 1.043 | 1.050 | 1.092 | 7.70 × 10 | 5.00 × 10 | 5.40 × 10 | ||||
| PL | −2.491 | −2.217 | −1.963 | PL | 0.000 | 0.000 | 0.000 | ||
| 1.043 | 1.050 | 1.092 | 0.041 | 0.031 | 0.024 | ||||
| DS | 0.445 | 0.441 | 0.436 | DS | 0.087 | 0.087 | 0.083 | ||
| EA | m s | 7.042 | 7.379 | 7.470 | EA | 2.27 × 10 | 2.43 × 10 | 2.20 × 10 | |
| SR | 0.347 | 0.347 | 0.347 | SR | 0.0204 | 0.0200 | 0.0245 | ||
| 67.630 | 67.630 | 67.630 | |||||||
| Level 1 | Loading Condition | Level 2 | Loading Condition | ||||
|---|---|---|---|---|---|---|---|
| Criterion | Arrival | Departure | Criterion | Arrival | Departure | ||
| PR | PR | 1.077 | 0.982 | PR | 0.000 | 0.000 | |
| 1.039 | 1.031 | 1.50 × 10 | 1.20 × 10 | ||||
| PL | −2.636 | −2.450 | PL | 0.000 | 0.000 | ||
| 1.039 | 1.031 | 0.106 | 0.106 | ||||
| DS | 0.998 | 1.184 | DS | 0.098 | 0.108 | ||
| EA | m s | 5.737 | 5.817 | EA | 2.60 × 10 | 3.82 × 10 | |
| SR | 0.306 | 0.306 | SR | 0.0032 | 0.0029 | ||
| 64.540 | 64.540 | ||||||
| Y02 | Loading Condition | Y03 | Loading Condition | ||||
|---|---|---|---|---|---|---|---|
| Stability Failure | Arrival | Mid-Voyage | Departure | Stability Failure | Arrival | Mid-Voyage | Departure |
| PR | MET | MET | MET | PR | MET | MET | MET |
| PL | NOT MET | NOT MET | NOT MET | PL | MET | MET | NOT MET |
| DS | NOT MET | MET | MET | DS | NOT MET | NOT MET | NOT MET |
| EA | NOT MET | NOT MET | NOT MET | EA | NOT MET | MET | MET |
| SR | NOT MET | NOT MET | NOT MET | SR | NOT MET | NOT MET | NOT MET |
| Y04 | Loading Condition | Y05 | Loading Condition | ||||
| Stability Failure | Arrival | Mid-Voyage | Departure | Stability Failure | Arrival | Departure | |
| PR | MET | MET | MET | PR | MET | MET | |
| PL | NOT MET | NOT MET | MET | PL | MET | MET | |
| DS | MET | MET | MET | DS | MET | MET | |
| EA | MET | MET | MET | EA | MET | MET | |
| SR | NOT MET | NOT MET | NOT MET | SR | NOT MET | NOT MET | |
| Y06 | Loading Condition | Y07 | Loading Condition | ||||
| Stability Failure | Arrival | Mid-Voyage | Departure | Stability Failure | Arrival | Departure | |
| PR | MET | MET | MET | PR | MET | MET | |
| PL | MET | MET | MET | PL | NOT MET | NOT MET | |
| DS | NOT MET | NOT MET | NOT MET | DS | NOT MET | MET | |
| EA | MET | MET | NOT MET | EA | MET | MET | |
| SR | NOT MET | NOT MET | NOT MET | SR | MET | MET | |
| Stability | Loading Condition | ||
|---|---|---|---|
| Failure | Arrival | Mid-Voyage | Departure |
| maximum (m) | |||
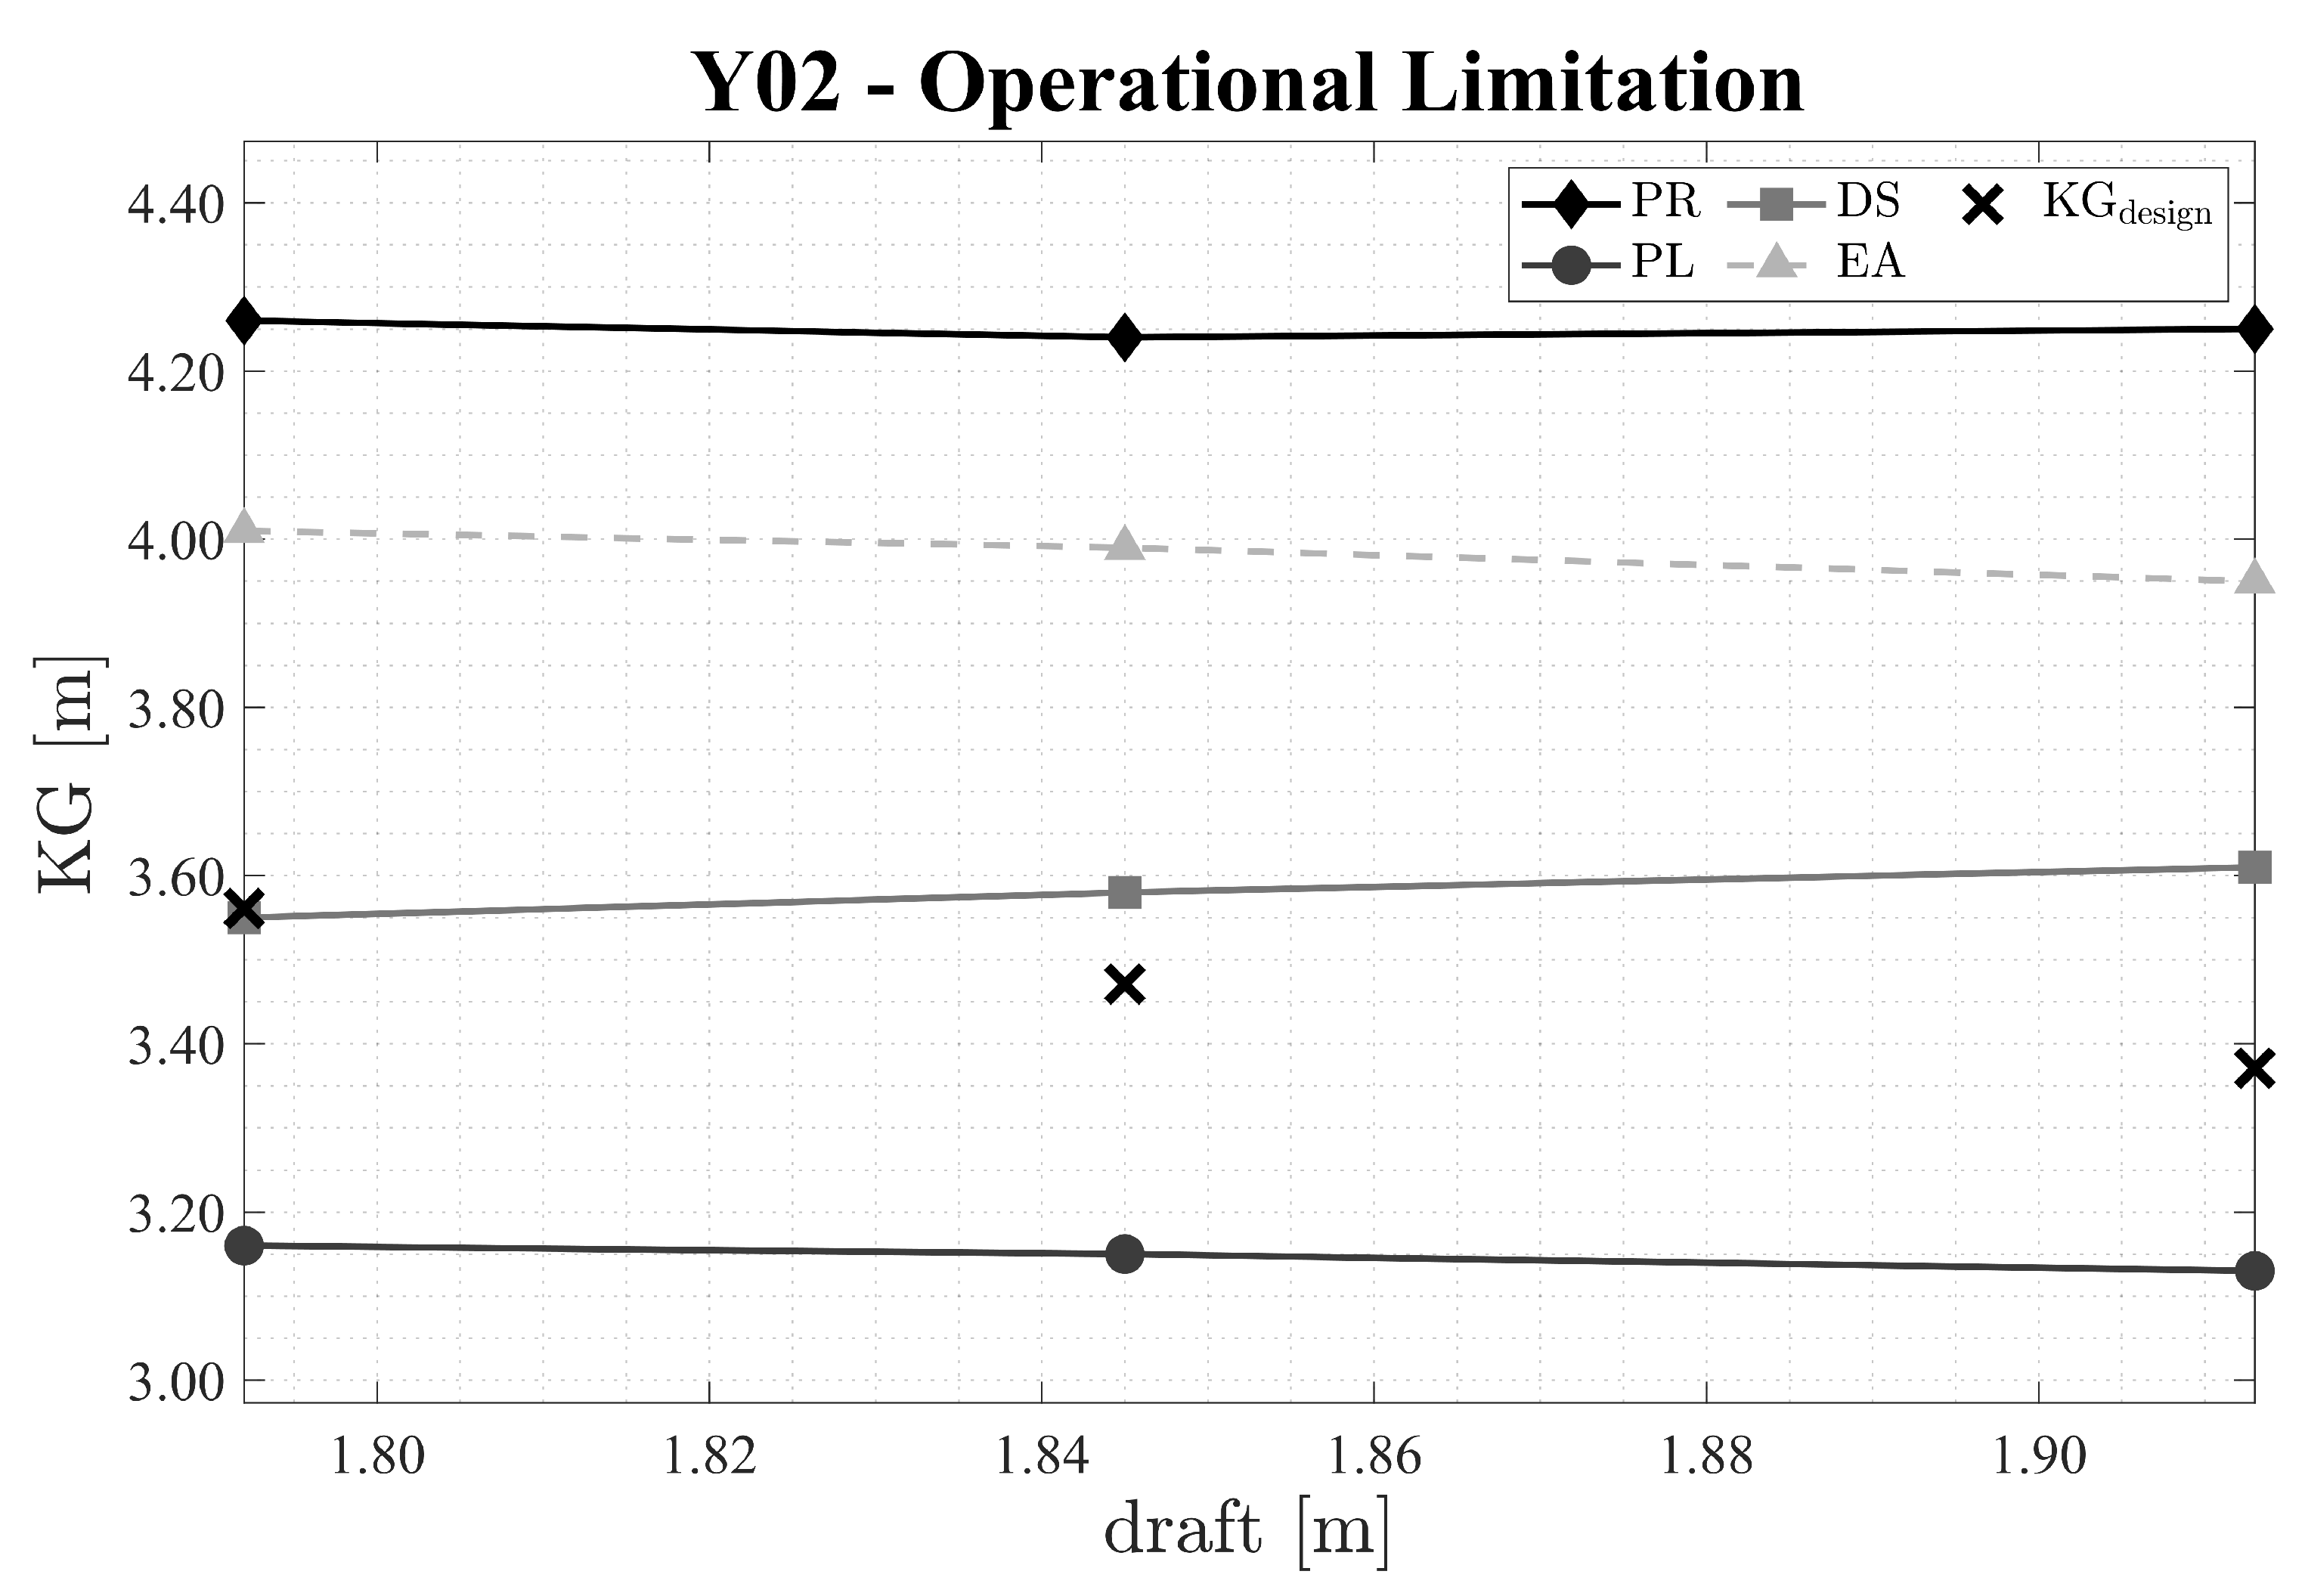
| PR | 4.26 | 4.24 | 4.25 |
| PL | 3.16 | 3.15 | 3.13 |
| DS | 3.55 | 3.58 | 3.61 |
| minimum (m) | |||
| EA | 4.01 | 3.99 | 3.95 |
| Stability | Loading Condition | ||
|---|---|---|---|
| Failure | Arrival | Mid-Voyage | Departure |
| maximum (m) | |||
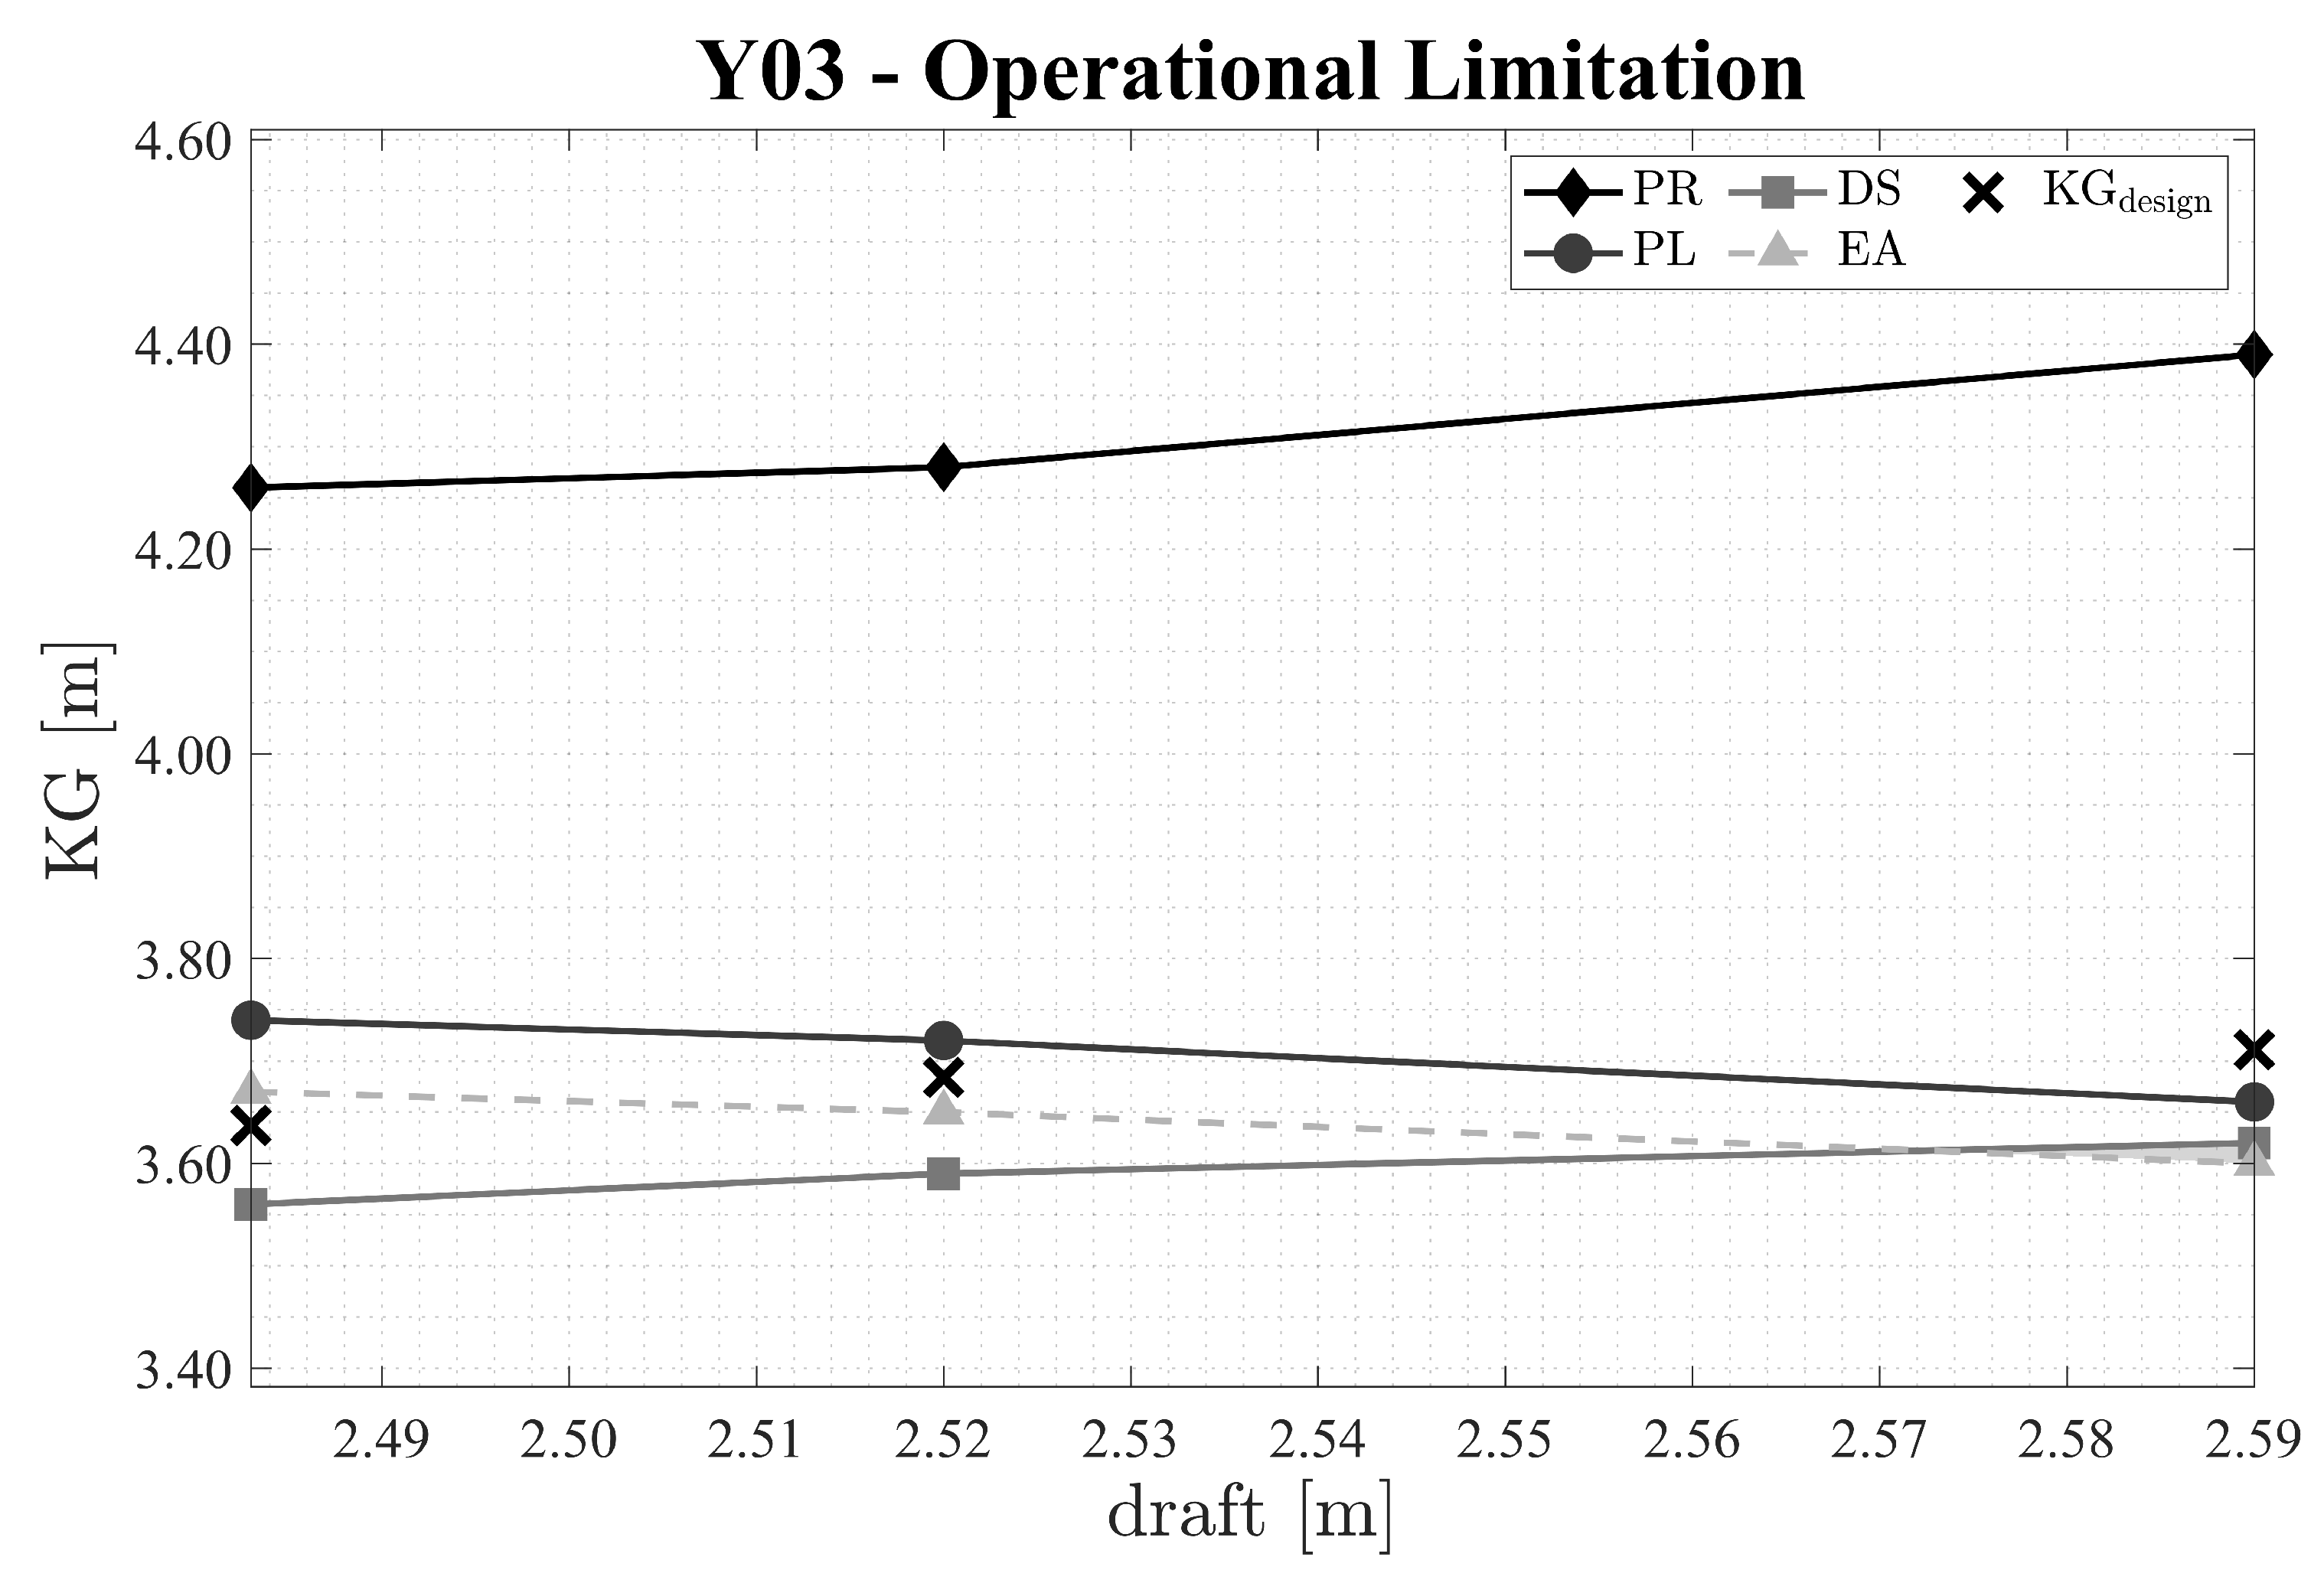
| PR | 4.26 | 4.28 | 4.39 |
| PL | 3.74 | 3.72 | 3.66 |
| DS | 3.56 | 3.59 | 3.62 |
| minimum (m) | |||
| EA | 3.67 | 3.65 | 3.60 |
| Stability | Loading Condition | ||
|---|---|---|---|
| Failure | Arrival | Mid-Voyage | Departure |
| maximum (m) | |||
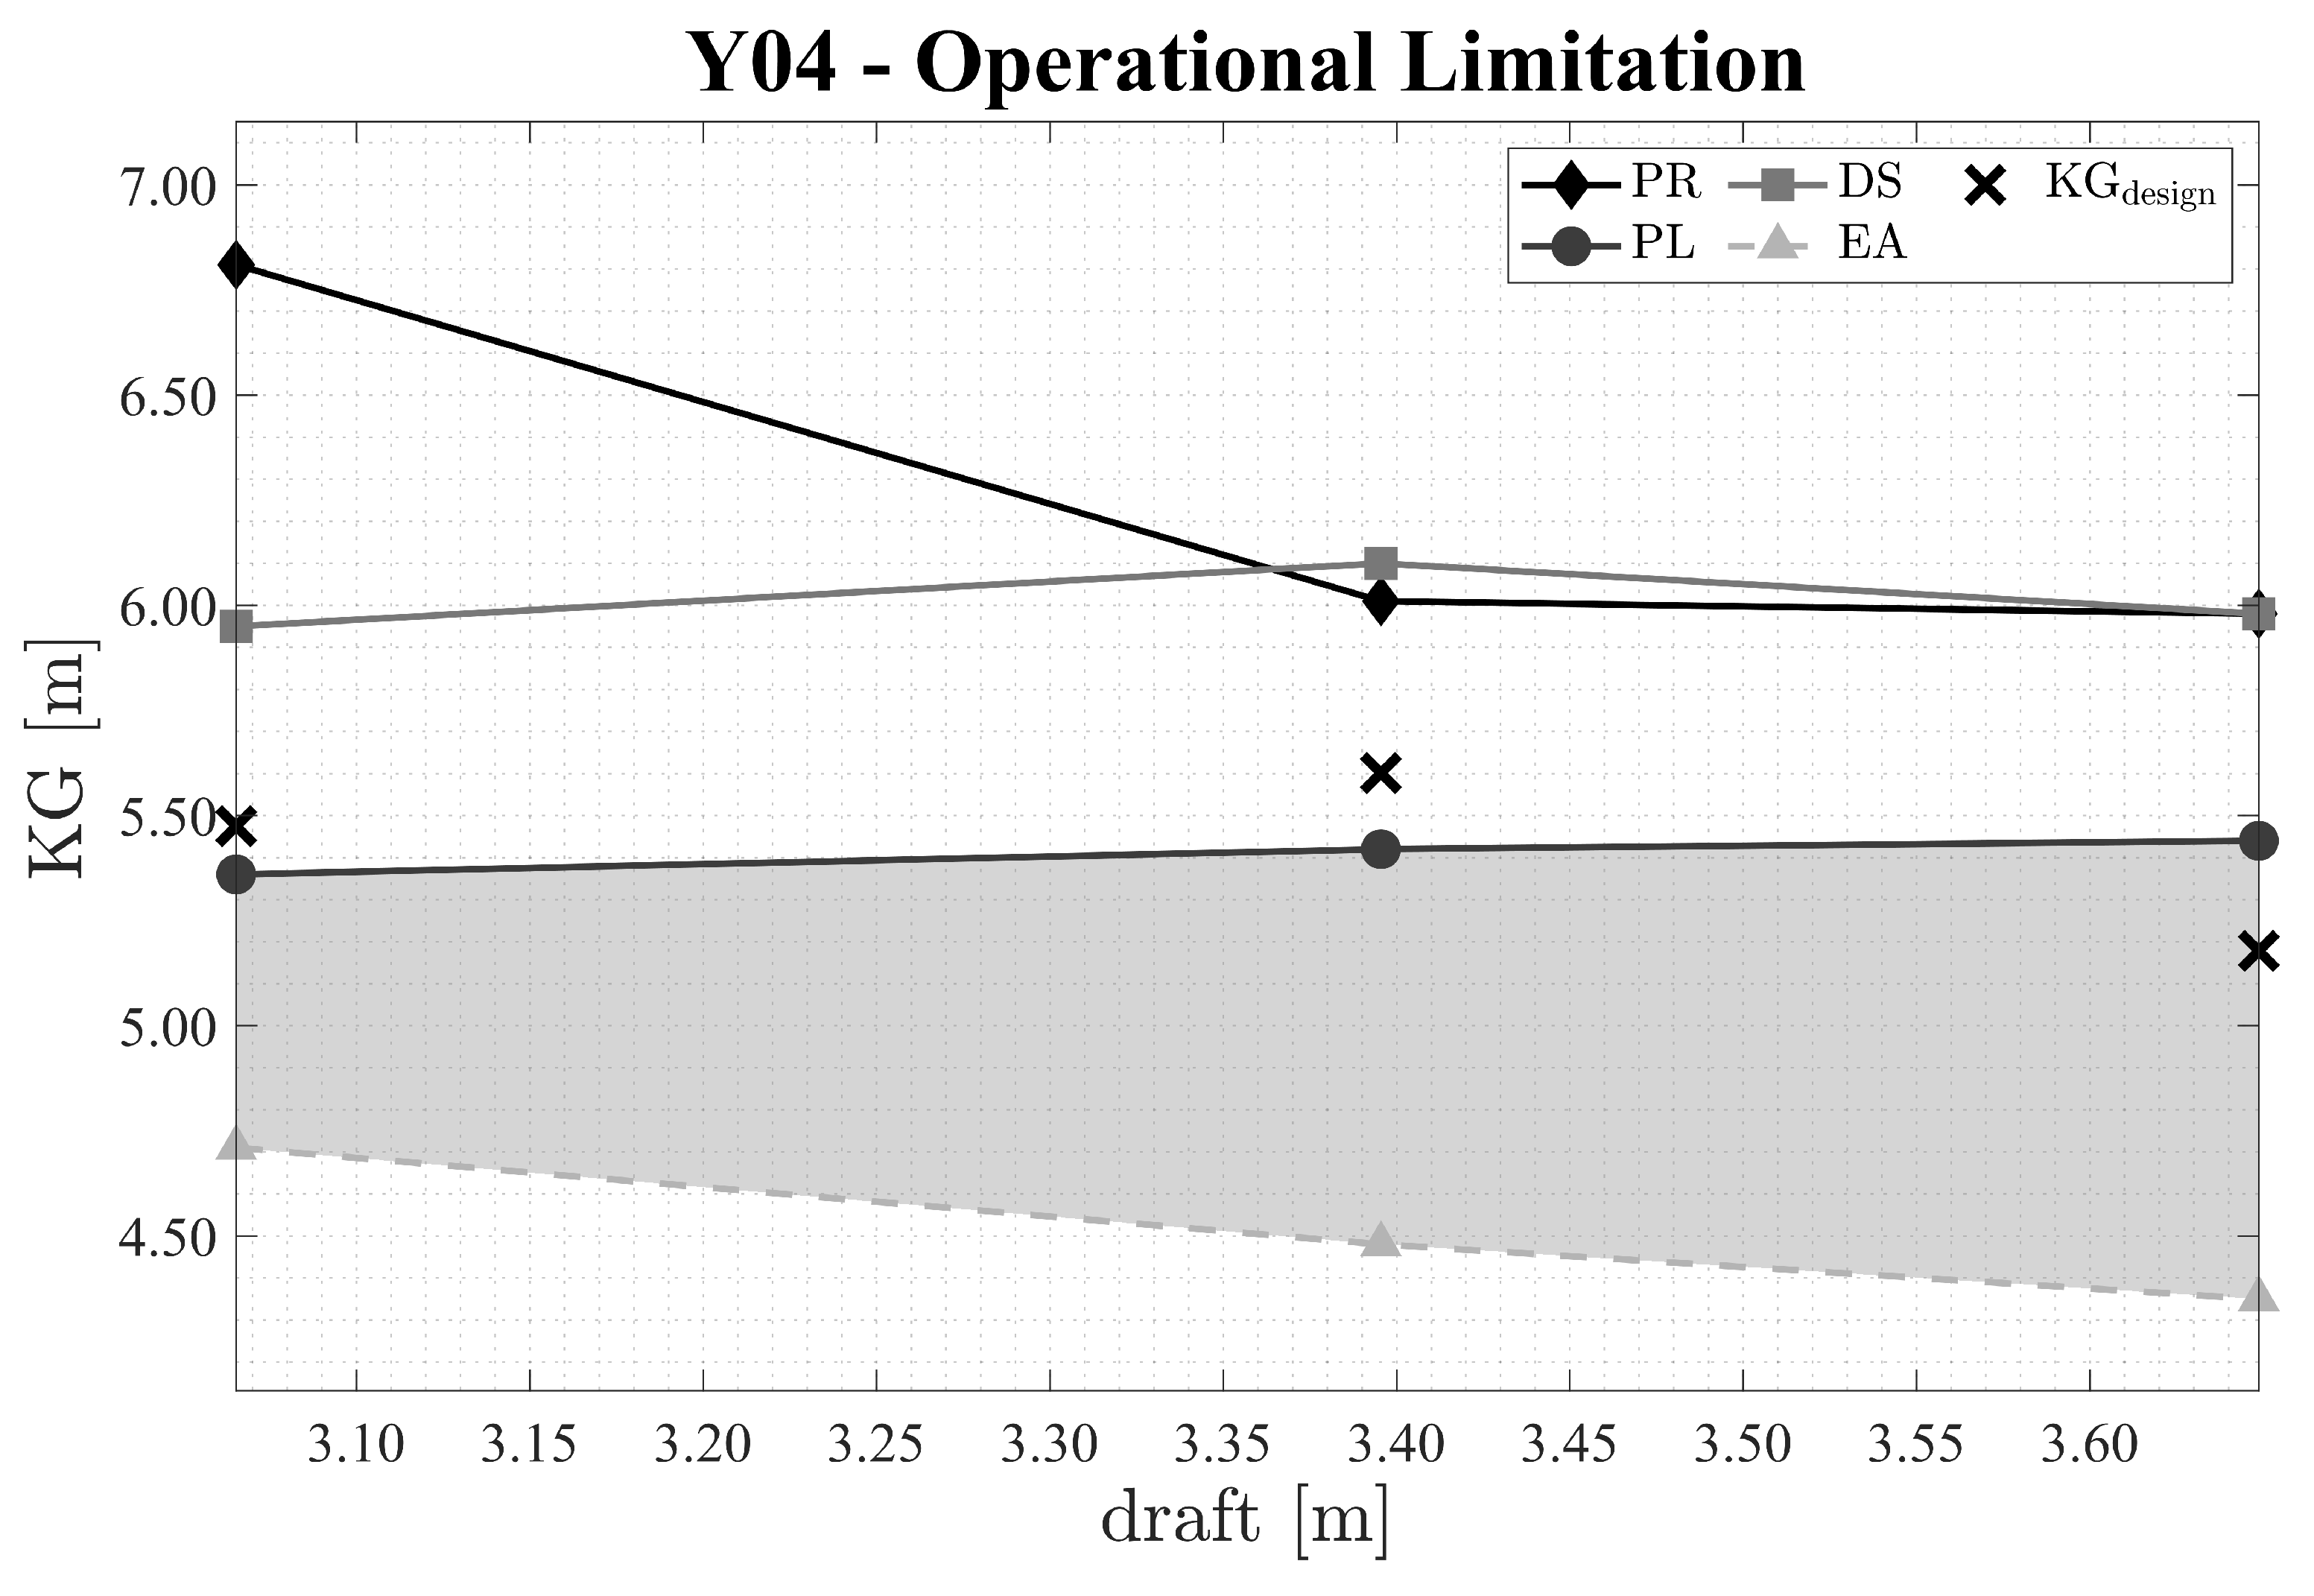
| PR | 6.81 | 6.01 | 5.98 |
| PL | 5.36 | 5.42 | 5.44 |
| DS | 5.95 | 6.10 | 5.98 |
| minimum (m) | |||
| EA | 4.71 | 4.48 | 4.35 |
| Stability | Loading Condition | ||
|---|---|---|---|
| Failure | Arrival | Mid-Voyage | Departure |
| maximum (m) | |||
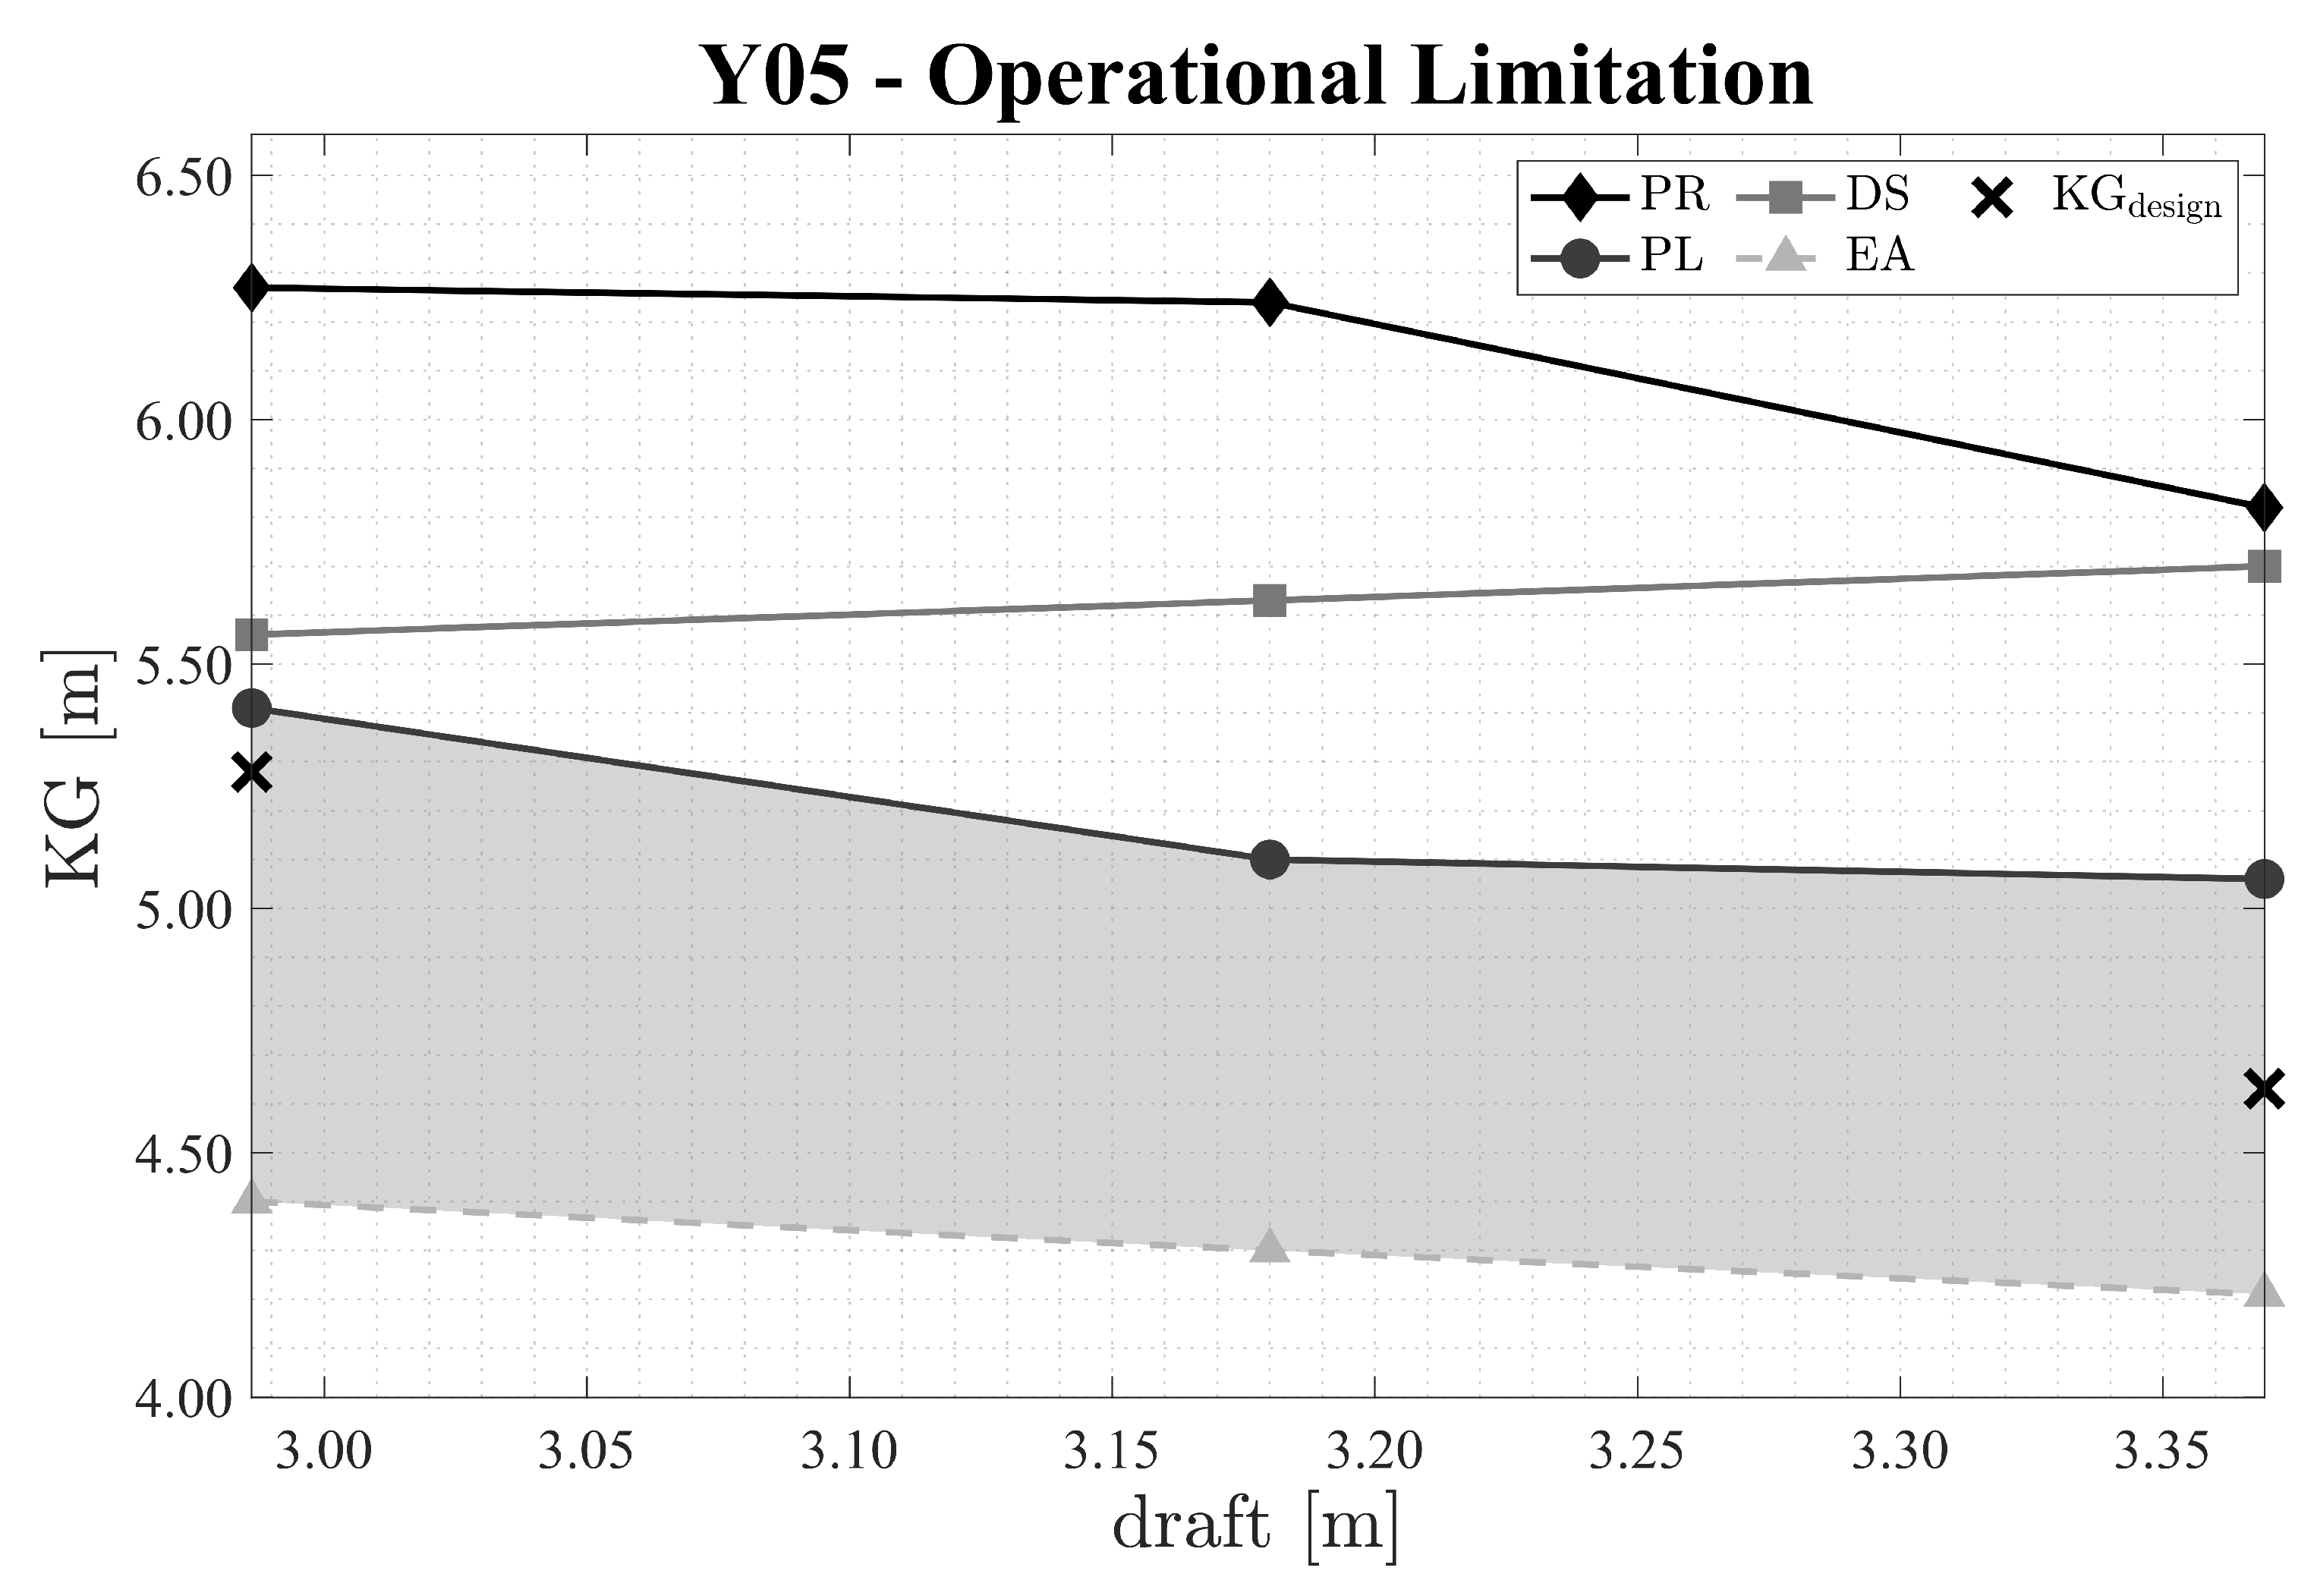
| PR | 6.27 | 6.24 | 5.82 |
| PL | 5.41 | 5.10 | 5.06 |
| DS | 5.56 | 5.63 | 5.70 |
| minimum (m) | |||
| EA | 4.40 | 4.30 | 4.21 |
| Stability | Loading Condition | ||
|---|---|---|---|
| Failure | Arrival | Mid-Voyage | Departure |
| maximum (m) | |||
| PR | 7.70 | 7.58 | 7.41 |
| PL | 5.94 | 5.87 | 5.77 |
| DS | 5.82 | 5.90 | 5.98 |
| minimum (m) | |||
| EA | 5.70 | 5.65 | 5.56 |

| Stability | Loading Condition | ||
|---|---|---|---|
| Failure | Arrival | Mid-Voyage | Departure |
| maximum (m) | |||
| PR | 5.94 | 6.19 | 6.01 |
| PL | 5.43 | 5.54 | 5.42 |
| DS | 5.60 | 5.67 | 5.64 |
| minimum (m) | |||
| EA | 5.20 | 5.19 | 5.18 |
Appendix B
| (s) | |||||||
|---|---|---|---|---|---|---|---|
| (m) | 3.50 | 4.50 | 5.50 | 6.50 | 7.50 | 8.50 | 9.50 |
| 0.50 | 0.0064 | 0.1485 | 0.1082 | 0.0350 | 0.0074 | 0.0011 | 0.0000 |
| 1.50 | 0.0159 | 0.1018 | 0.1463 | 0.0817 | 0.0255 | 0.0053 | 0.0011 |
| 2.50 | 0.0032 | 0.0339 | 0.0700 | 0.0530 | 0.0212 | 0.0064 | 0.0011 |
| 3.50 | 0.0010 | 0.0095 | 0.0255 | 0.0244 | 0.0117 | 0.0042 | 0.0011 |
| 4.50 | 0.0000 | 0.0032 | 0.0085 | 0.0095 | 0.0053 | 0.0021 | 0.0011 |
| 5.50 | 0.0000 | 0.0011 | 0.0032 | 0.0042 | 0.0021 | 0.0011 | 0.0000 |
| 6.50 | 0.0000 | 0.0000 | 0.0010 | 0.0021 | 0.0010 | 0.0011 | 0.0000 |
| 7.50 | 0.0000 | 0.0000 | 0.0010 | 0.0010 | 0.1000 | 0.0000 | 0.0000 |
References
- Merendino, A.; Deidda Gagliardo, E.; Coronella, S. The efficiency of the top Mega yacht builders across the world: A financial ratio-based data envelopment analysis. Int. J. Manag. Decis. Mak. 2018, 17, 125–147. [Google Scholar] [CrossRef]
- IMO. SDC 1/INF.8—Information Collected by the Correspondence Group on Intact Stability; Submitted by Japan; International Maritime Organization: London, UK, 2013. [Google Scholar]
- IMO. Interim Guidelines on the Second Generation Intact Stability Criteria; Circular MSC.1/1627; International Maritime Organization: London, UK, 2020. [Google Scholar]
- Ruggiero, V. Analysis of changings in mega yacht geometrical characteristics of hulls with consequences on resistance and stability. In Proceedings of the Design and Construction of Super and Mega Yachts, Genoa, Italy, 14–15 May 2019; RINA, Royal Institution of Naval Architects: London, UK, 2019. [Google Scholar]
- Vukić, L.; Guidi, G.; Krämer, I. Air pollutant emission calculation and shipping costs: The case of yacht transport between the North Sea and Mediterranea ports. Mar. Policy 2023, 148, 105447. [Google Scholar] [CrossRef]
- Mentes, A.; Helvacioglu, S. An integrated methodology for enhancing safety assessment in yacht system design. Ships Offshore Struct. 2021, 17, 1852–1862. [Google Scholar] [CrossRef]
- Demirel, H.; Sener, B.; Yildiz, B.; Balin, A. A real case study on the selection of suitable roll stabilizer type for motor yachts using hybrid fuzzy AHP and VIKOR methodology. Ocean. Eng. 2020, 217, 108125. [Google Scholar] [CrossRef]
- Giallanza, A.; Elms, T. Interactive roll stabilization comparative analysis for large yacht: Gyroscope versus active fins. Int. J. Interact. Des. Manuf. 2020, 14, 143–151. [Google Scholar] [CrossRef]
- Angelou, M.; Spyrou, K.J. Broaching-to of Sailing Yachts. In Proceedings of the Proceedings of 1st International Conference on the Stability and Safety of Ships and Ocean Vehicles, Glasgow, UK, 7–11 June 2021. [Google Scholar]
- Angelou, M.; Spyrou, K. Dynamic stability assessment of yacht downwind sailing in regular waves. Appl. Ocean. Res. 2021, 111, 102651. [Google Scholar] [CrossRef]
- Ruggiero, V. New interactive method to determine parameters for large motor yacht stability. Int. J. Interact. Des. Manuf. 2019, 13, 1557–1564. [Google Scholar] [CrossRef]
- Oh, D.; Lee, C.-W. Improving the Design Process of Pleasure Yachts for CE RCD Certification via Modification to Buoyancy and Stability Assessment Method. J. Korean Soc. Mar. Environ. Saf. 2017, 23, 301–312. [Google Scholar] [CrossRef]
- Ivaldi, A. Growing length in the megayacht industry and structure-related design topics. Ships Offshore Struct. 2015, 10, 221–231. [Google Scholar] [CrossRef]
- IMO. Adoption of the International Code on Intact Stability; Resolution MSC.267(85); International Maritime Organization: London, UK, 2008. [Google Scholar]
- Paulling, J. Parametric Rolling of Ships—Then and Nows. In Contemporary Ideas on Ship Stability and Capsizing in Wave; Fluid Mechanics and Its Applications; Neves, M., Belenky, V., de Kat, J., Spyrou, K., Umeda, N., Eds.; Springer: Dordrecht, The Netherlands, 2011; Volume 93. [Google Scholar]
- Belenky, V.; Bassler, C.; Spyrou, K. Development of Second Generation Intact Stability Criteria; Hydromechanics Department Report; Naval Warfare Center Carderock Division: Carderock, MD, USA, 2011. [Google Scholar]
- U.S. Coast Guard. Continued Development of Second Generation Intact Stability Criteria; Naval Architecture Division Report; U.S. Coast Guard Office of Design and Engineering Standards: Washington, DC, USA, 2019. [Google Scholar]
- IMO. SDC 8/WP. 4—Development of Explanatory Notes to the Interim Guidelines on Second Generation Intact Stability criteria. Report of the Drafting Group on Intact Stability; International Maritime Organization: London, UK, 2022. [Google Scholar]
- Shin, D.; Chung, J. Application of dead ship condition based on IMO second-generation intact stability criteria for 13K oil chemical tanker. Ocean. Eng. 2021, 238, 109776. [Google Scholar] [CrossRef]
- Petacco, N.; Vernengo, G.; Villa, D.; Coppedé, A.; Gualeni, P. Influence of Systematic Hull Shape Variations on Ship Stability Performances in Waves. J. Ship Res. 2021, 65, 243–256. [Google Scholar] [CrossRef]
- Szodza, S.; Krata, P. Towards Evaluation of the Second Generation Intact Stability Criteria - Examination of a Fishing Vessel Vulnerability to Surf-Riding, Based on Historical Capsizing. Ocean. Eng. 2022, 248, 110796. [Google Scholar] [CrossRef]
- Shigunov, V.; Themelis, N.; Spyrou, K. Contemporary Ideas on Ship Stability. In Fluid Mechanics and Its Applications; Chapter Critical Wave Groups Versus Direct Monte-Carlo Simulations for Typical Stability Failure Modes of a Container Ship; Springer: Cham, Switzerland, 2019; Volume 119, pp. 407–421. [Google Scholar]
- Shigunov, V.; Wandji, C.; Belenky, V. Benchmarking of direct counting approaches. In Proceedings of the 18th International Ship Stability Workshop (ISSW), Gdańsk, Poland, 12–14 September 2022. [Google Scholar]
- Yang, S. Study on the Parametric Rolling of Medium-Sized Containership Based on Nonlinear Time Domain Analysis. In Proceedings of the 39th International conference on Offshore Mechanics and Arctic Engineering (ASME), Online, 28 June–3 July 2020; Volume 6b. [Google Scholar]
- Gualeni, P.; Paolobello, D.; Petacco, N.; Lena, C. Seakeeping time domain simulations for surf-riding/broaching: Investigations toward a direct stability assessment. J. Mar. Sci. Technol. 2020, 25, 1120–1128. [Google Scholar] [CrossRef]
- Petacco, N. An alternative methodology for the simplified operational guidance in the framework of second generation intact stability criteria. Ocean. Eng. 2022, 266, 112665. [Google Scholar] [CrossRef]
- Begović, E.; Boccadamo, G.; Rosano, G.; Rinauro, B. Excessive acceleration simplified Operational Guidance. Int. J. Nav. Archit. Ocean. Eng. 2022, 14, 100473. [Google Scholar] [CrossRef]
- Bulian, G.; Orlandi, A. Effect of environmental data uncertainty in the framework of second generation intact stability criteria. Ocean. Eng. 2022, 253, 111253. [Google Scholar] [CrossRef]
- IMO. Interim Guidelines for Alternative Assessment of the Weather Criterion; Circular MSC.1/1200; International Maritime Organization: London, UK, 2006. [Google Scholar]
- Holtrop, J.; Mennen, G. An approximate power prediction method. Int. Shipbuild. Prog. 1982, 29, 166–170. [Google Scholar] [CrossRef]
- Barnitsas, M.; Ray, D.; Kinley, P. KT, KQ and Efficiency Curves for the Wageningen B-Series Propellers; Technical report; University of Michigan: Ann Arbor, MI, USA, 1981. [Google Scholar]
- Schrøter, C.; Lützen, M.; Erichsen, H.; Jensen, J.J.; Kristensen, H.O.; Hagelskjær Lauridsen, P.; Tunccan, O.; Baltsersen, J.P. Sample Applications of the Second Generation Intact Stability Criteria—Robustness and Consistency Analysis. In Proceedings of the 16th International Ship Stability Workshop, Belgrade, Serbia, 5–7 June 2017; pp. 9–13. [Google Scholar]
- Kyle, E.; Kim, S.; Hurt, L. Implementation of the IMO Second Generation Intact Stability Guidelines. J. Mar. Sci. Eng. 2021, 10, 41. [Google Scholar] [CrossRef]
- Kawahara, Y.; Maekawa, K.; Ikeda, Y. A Simple Prediction Formula of Roll Damping of Conventional Cargo Ships on the Basis of Ikeda’s Method and Its Limitation. In Proceedings of the 10th International Conference on Stability of Ships and Ocean Vehicles, St. Petersburg, Russia, 22–26 June 2009. [Google Scholar]


| Megayachts | D | D | |||||||||||
|---|---|---|---|---|---|---|---|---|---|---|---|---|---|
| (m) | (m) | (m) | (m) | (m) | (kn) | (t) | (m) | (m) | - | - | - | (m) | |
| Y01 | 42.65 | 38.00 | 8.21 | 8.17 | 4.80 | 15.0 | 400 | 17.02 | 3.28 | 0.451 | 0.697 | 0.582 | 1.40 |
| Y02 | 44.70 | 42.10 | 8.60 | 8.01 | 4.30 | 20.0 | 330 | 17.09 | 3.37 | 0.495 | 0.791 | 0.618 | 1.60 |
| Y03 | 47.00 | 42.40 | 9.00 | 8.62 | 4.80 | 13.0 | 460 | 17.08 | 3.71 | 0.475 | 0.773 | 0.612 | 1.40 |
| Y04 | 65.00 | 58.68 | 11.31 | 11.30 | 6.00 | 15.0 | 1360 | 22.71 | 5.18 | 0.548 | 0.800 | 0.643 | 1.91 |
| Y05 | 67.50 | 60.31 | 11.02 | 11.01 | 5.20 | 15.0 | 940 | 22.75 | 4.63 | 0.411 | 0.746 | 0.545 | 1.94 |
| Y06 | 74.40 | 66.74 | 13.20 | 12.97 | 7.50 | 17.5 | 1580 | 31.74 | 5.50 | 0.539 | 0.903 | 0.653 | 1.90 |
| Y07 | 77.70 | 67.93 | 13.00 | 12.32 | 7.00 | 15.0 | 1410 | 30.05 | 5.55 | 0.397 | 0.677 | 0.527 | 1.90 |
| Level 1 | Loading Condition | Level 2 | Loading Condition | ||||||
|---|---|---|---|---|---|---|---|---|---|
| Criterion | Arrival | Mid-Voyage | Departure | Criterion | Arrival | Mid-Voyage | Departure | ||
| PR | 0.431 | 0.305 | 0.192 | PR | 0.000 | 0.000 | 0.000 | ||
| 1.128 | 1.113 | 1.078 | 0.000 | 0.000 | 0.000 | ||||
| PL | −0.018 | 0.290 | 0.639 | PL | 0.000 | 0.000 | 0.000 | ||
| 1.128 | 1.113 | 1.078 | 0.104 | 0.098 | 0.036 | ||||
| DS | 0.206 | 0.654 | 7.986 | DS | 0.502 | 0.369 | 0.094 | ||
| EA | 6.914 | 7.169 | 7.813 | EA | 2.50 × | 5.11× | 1.90 × | ||
| SR | 0.402 | 0.402 | 0.402 | SR | 0.0713 | 0.0687 | 0.0702 | ||
| 37.307 | 37.367 | 37.510 | |||||||
| Loading Condition | |||
|---|---|---|---|
| Stability Failure | Arrival | Mid-Voyage | Departure |
| PR | MET | MET | MET |
| PL | NOT MET | MET | MET |
| DS | NOT MET | NOT MET | MET |
| EA | MET | NOT MET | NOT MET |
| SR | NOT MET | NOT MET | NOT MET |
| Stability | Loading Condition | ||
|---|---|---|---|
| Failure | Arrival | Mid-Voyage | Departure |
| maximum (m) | |||
| PR | 4.35 | 4.57 | 4.25 |
| PL | 3.60 | 3.75 | 3.87 |
| DS | 3.24 | 3.29 | 3.69 |
| minimum (m) | |||
| EA | 3.61 | 3.57 | 3.61 |
| Level 1 | Loading Condition | Level 2 | Loading Condition | ||||||
|---|---|---|---|---|---|---|---|---|---|
| Criterion | Arrival | Mid-Voyage | Departure | Criterion | Arrival | Mid-Voyage | Departure | ||
| PR | 0.991 | 0.305 | 0.192 | PR | 0.000 | 0.000 | 0.000 | ||
| 1.128 | 1.113 | 1.078 | 0.000 | 0.000 | 0.000 | ||||
| PL | −1.785 | 0.290 | 0.639 | PL | 0.000 | 0.000 | 0.000 | ||
| 1.128 | 1.113 | 1.078 | 0.214 | 0.144 | 0.114 | ||||
| DS | 0.206 | 0.654 | 7.986 | DS | 0.313 | 0.273 | 0.128 | ||
| EA | 6.914 | 7.169 | 7.813 | EA | 3.90 × | 1.00 × | 4.80 × | ||
| SR | 0.402 | 0.402 | 0.402 | SR | 0.1078 | 0.1064 | 0.1064 | ||
| 37.307 | 37.367 | 37.510 | |||||||
| Loading Condition | |||
|---|---|---|---|
| Stability Failure | Arrival | Mid-Voyage | Departure |
| PR | MET | MET | MET |
| PL | NOT MET | NOT MET | NOT MET |
| DS | NOT MET | NOT MET | MET |
| EA | NOT MET | NOT MET | NOT MET |
| SR | NOT MET | NOT MET | NOT MET |
| Stability | Loading Condition | ||
|---|---|---|---|
| Failure | Arrival | Mid-Voyage | Departure |
| maximum (m) | |||
| PR | 4.14 | 4.57 | 4.10 |
| PL | 3.28 | 3.18 | 3.11 |
| DS | 3.24 | 3.29 | 3.69 |
| minimum (m) | |||
| EA | 3.70 | 3.65 | 3.70 |
| w/o OL | Across 19 Cases for Each Stability Failure | w/ OL | Across 19 Cases for Each Stability Failure | ||||
|---|---|---|---|---|---|---|---|
| Stability Failure | n MET | n NOT MET | % of MET | Stability Failure | n MET | n NOT MET | % of MET |
| PR | 19 | 0 | 100.0% | PR | 19 | 0 | 100.0% |
| PL | 15 | 4 | 78.9% | PL | 8 | 11 | 42.1% |
| DS | 6 | 13 | 31.6% | DS | 9 | 10 | 47.4% |
| EA | 11 | 8 | 57.9% | EA | 11 | 8 | 57.9% |
| SR | 2 | 17 | 10.5% | SR | 2 | 17 | 10.5% |
| Loading | d | KG | |
|---|---|---|---|
| Condition | (t) | (m) | (m) |
| LC01 | 860 | 3.10 | 5.12 |
| LC02 | 920 | 3.20 | 4.91 |
| Experimental Roll Damping Coefficient | Simplified Ikeda Method | ||||||||
|---|---|---|---|---|---|---|---|---|---|
| Loading Condition | Loading Condition | ||||||||
| Stability | LC01 | LC01 | LC02 | LC02 | Stability | LC01 | LC01 | LC02 | LC02 |
| Failure | w/o BK | w/ BK | w/o BK | w/ BK | Failure | w/o BK | w/ BK | w/o BK | w/ BK |
| PR | 1.44 | 0.00 | 0.000 | 0.000 | PR | 3.06 × 10 | 0.000 | 2.09 × 10 | 0.000 |
| DS | 0.033 | 0.007 | 0.011 | 0.003 | DS | 0.584 | 0.057 | 0.509 | 0.032 |
| EA | 1.22 × 10 | 6.31 × 10 | 7.16 × 10 | 3.04 × 10 | EA | 5.34 × 10 | 9.39 × 10 | 7.73 × 10 | 3.53 × 10 |
Disclaimer/Publisher’s Note: The statements, opinions and data contained in all publications are solely those of the individual author(s) and contributor(s) and not of MDPI and/or the editor(s). MDPI and/or the editor(s) disclaim responsibility for any injury to people or property resulting from any ideas, methods, instructions or products referred to in the content. |
© 2023 by the authors. Licensee MDPI, Basel, Switzerland. This article is an open access article distributed under the terms and conditions of the Creative Commons Attribution (CC BY) license (https://creativecommons.org/licenses/by/4.0/).
Share and Cite
Petacco, N.; Ruggiero, V.; Gualeni, P. An Investigation about Stability in Waves of Large Pleasure Yachts. J. Mar. Sci. Eng. 2023, 11, 2039. https://doi.org/10.3390/jmse11112039
Petacco N, Ruggiero V, Gualeni P. An Investigation about Stability in Waves of Large Pleasure Yachts. Journal of Marine Science and Engineering. 2023; 11(11):2039. https://doi.org/10.3390/jmse11112039
Chicago/Turabian StylePetacco, Nicola, Valerio Ruggiero, and Paola Gualeni. 2023. "An Investigation about Stability in Waves of Large Pleasure Yachts" Journal of Marine Science and Engineering 11, no. 11: 2039. https://doi.org/10.3390/jmse11112039
APA StylePetacco, N., Ruggiero, V., & Gualeni, P. (2023). An Investigation about Stability in Waves of Large Pleasure Yachts. Journal of Marine Science and Engineering, 11(11), 2039. https://doi.org/10.3390/jmse11112039