
A Paleo-Changjiang Delta Complex on the East China Sea Shelf Formed Some 30 ka Ago (at the MIS 3 Stage)


Abstract
:1. Introduction
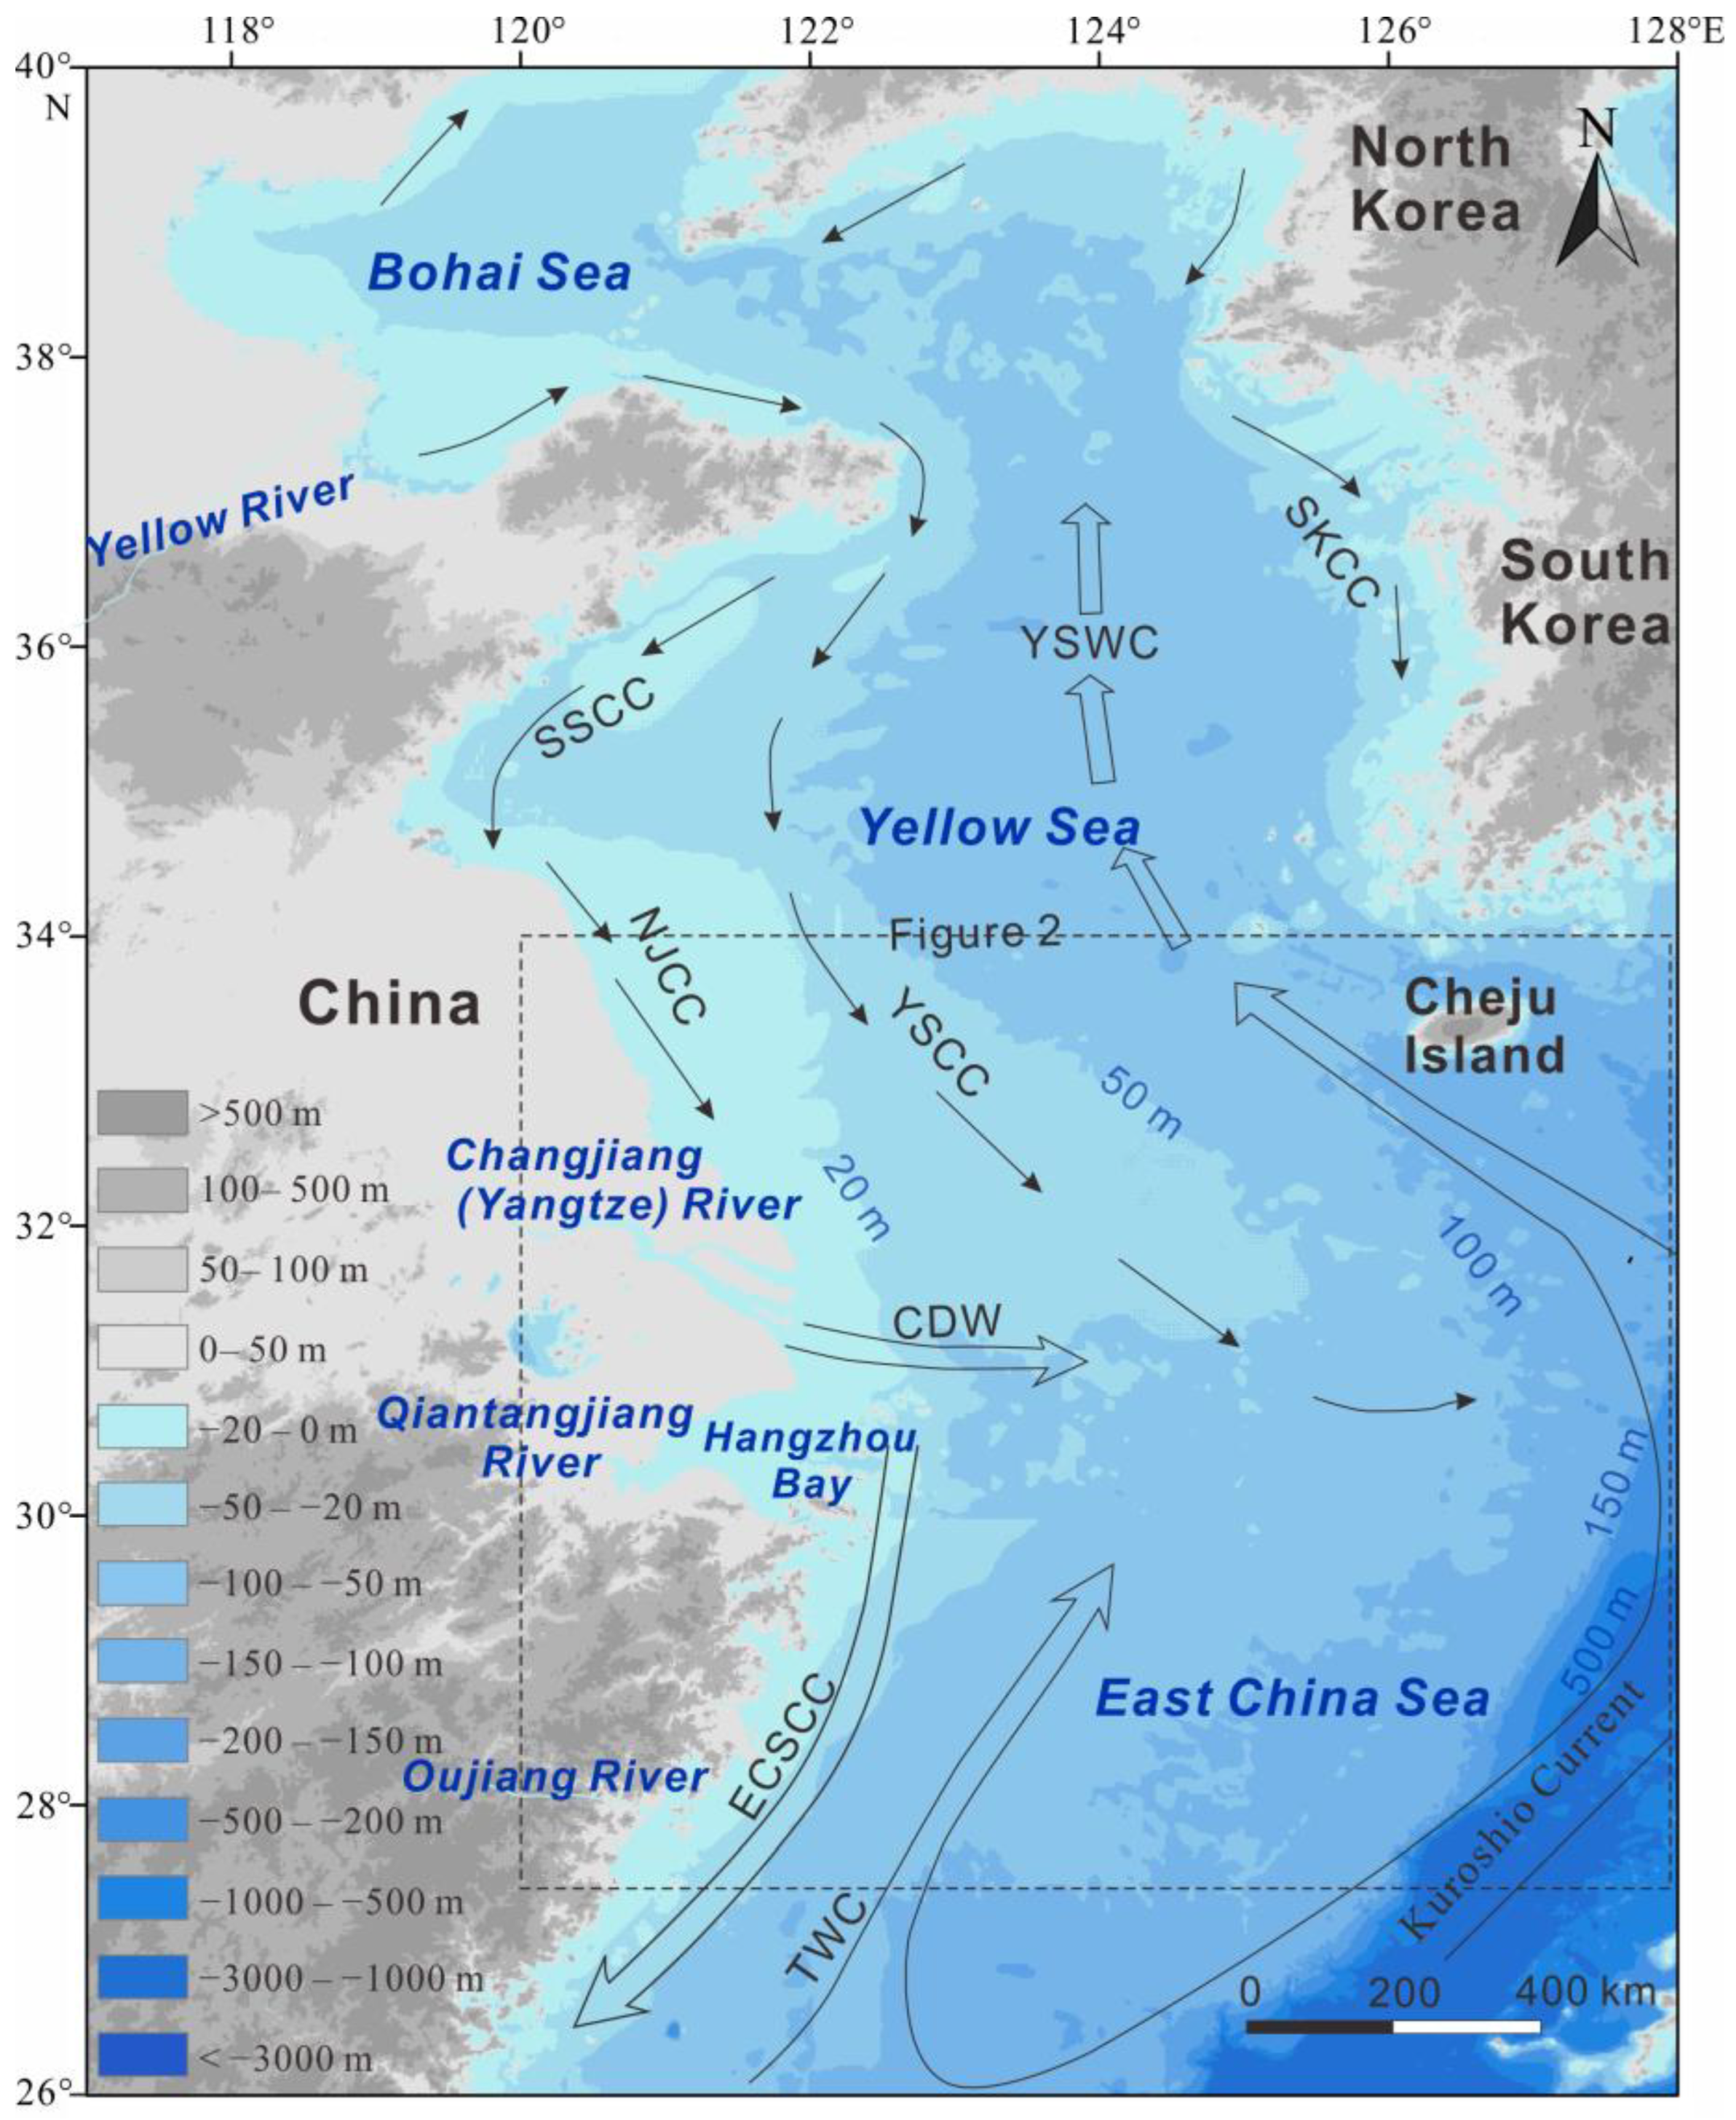
2. Regional Setting
3. Materials and Methods
3.1. Seismic Data
3.2. Borehole Data
4. Results
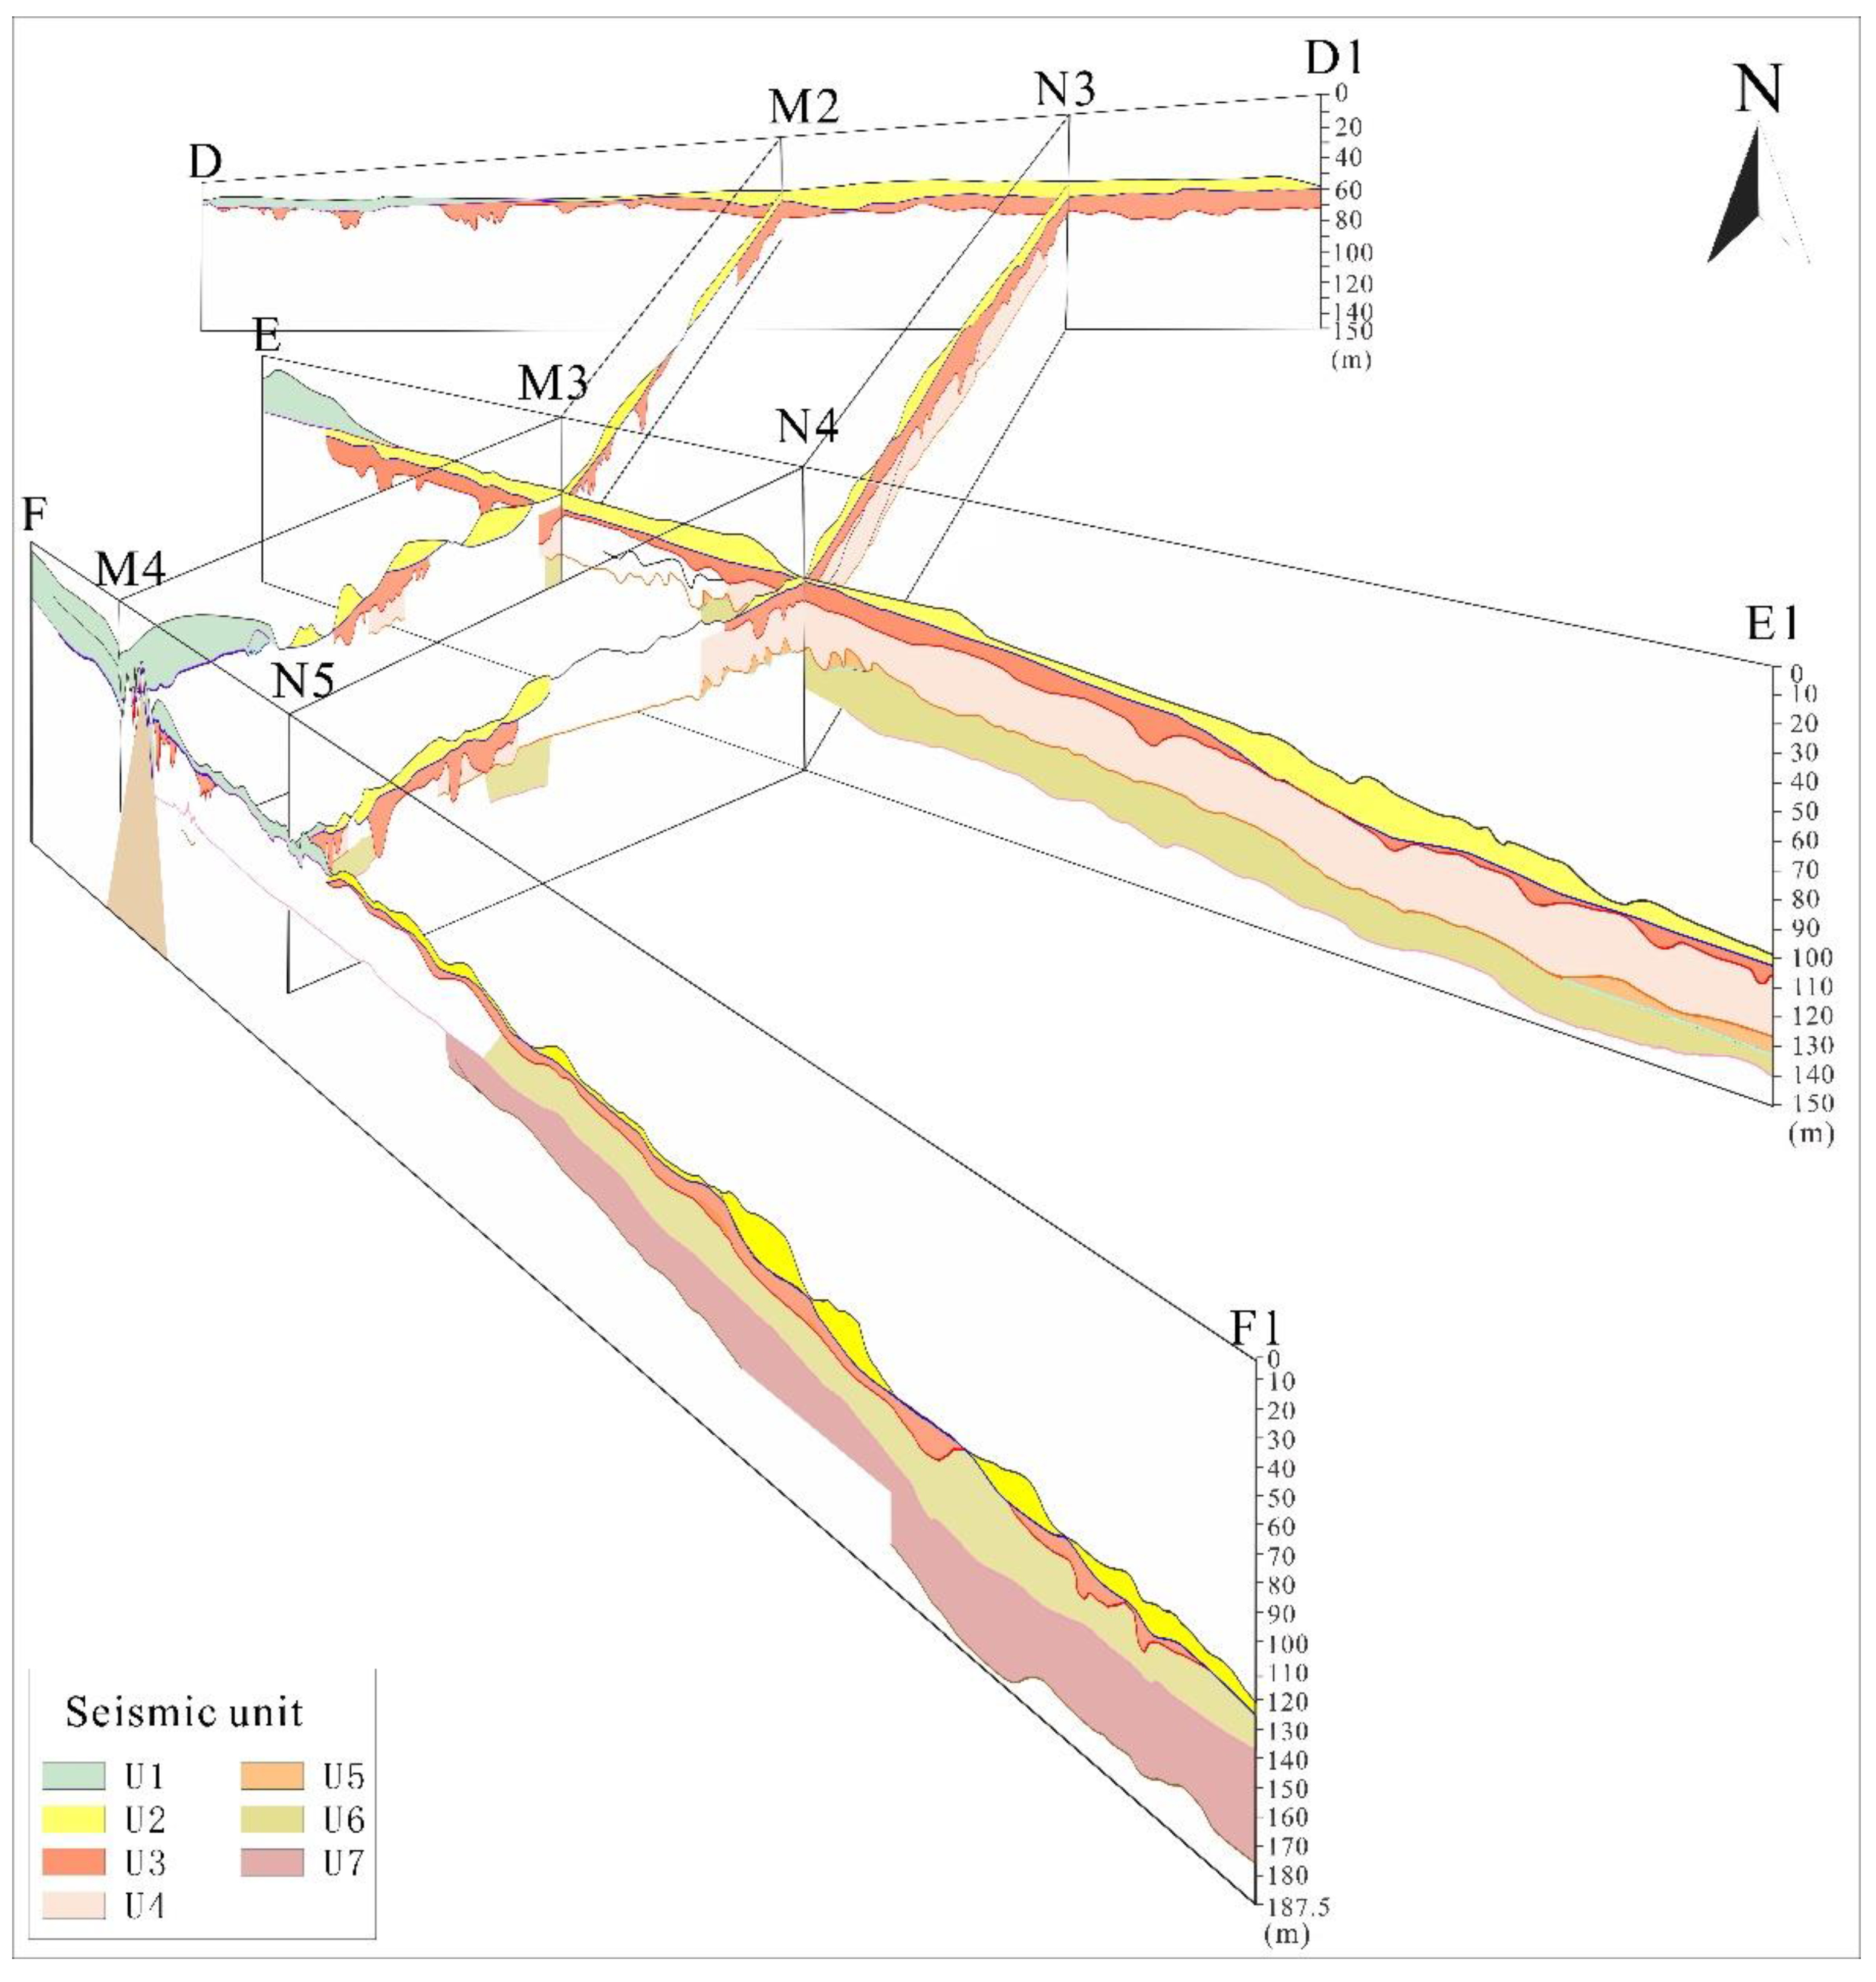
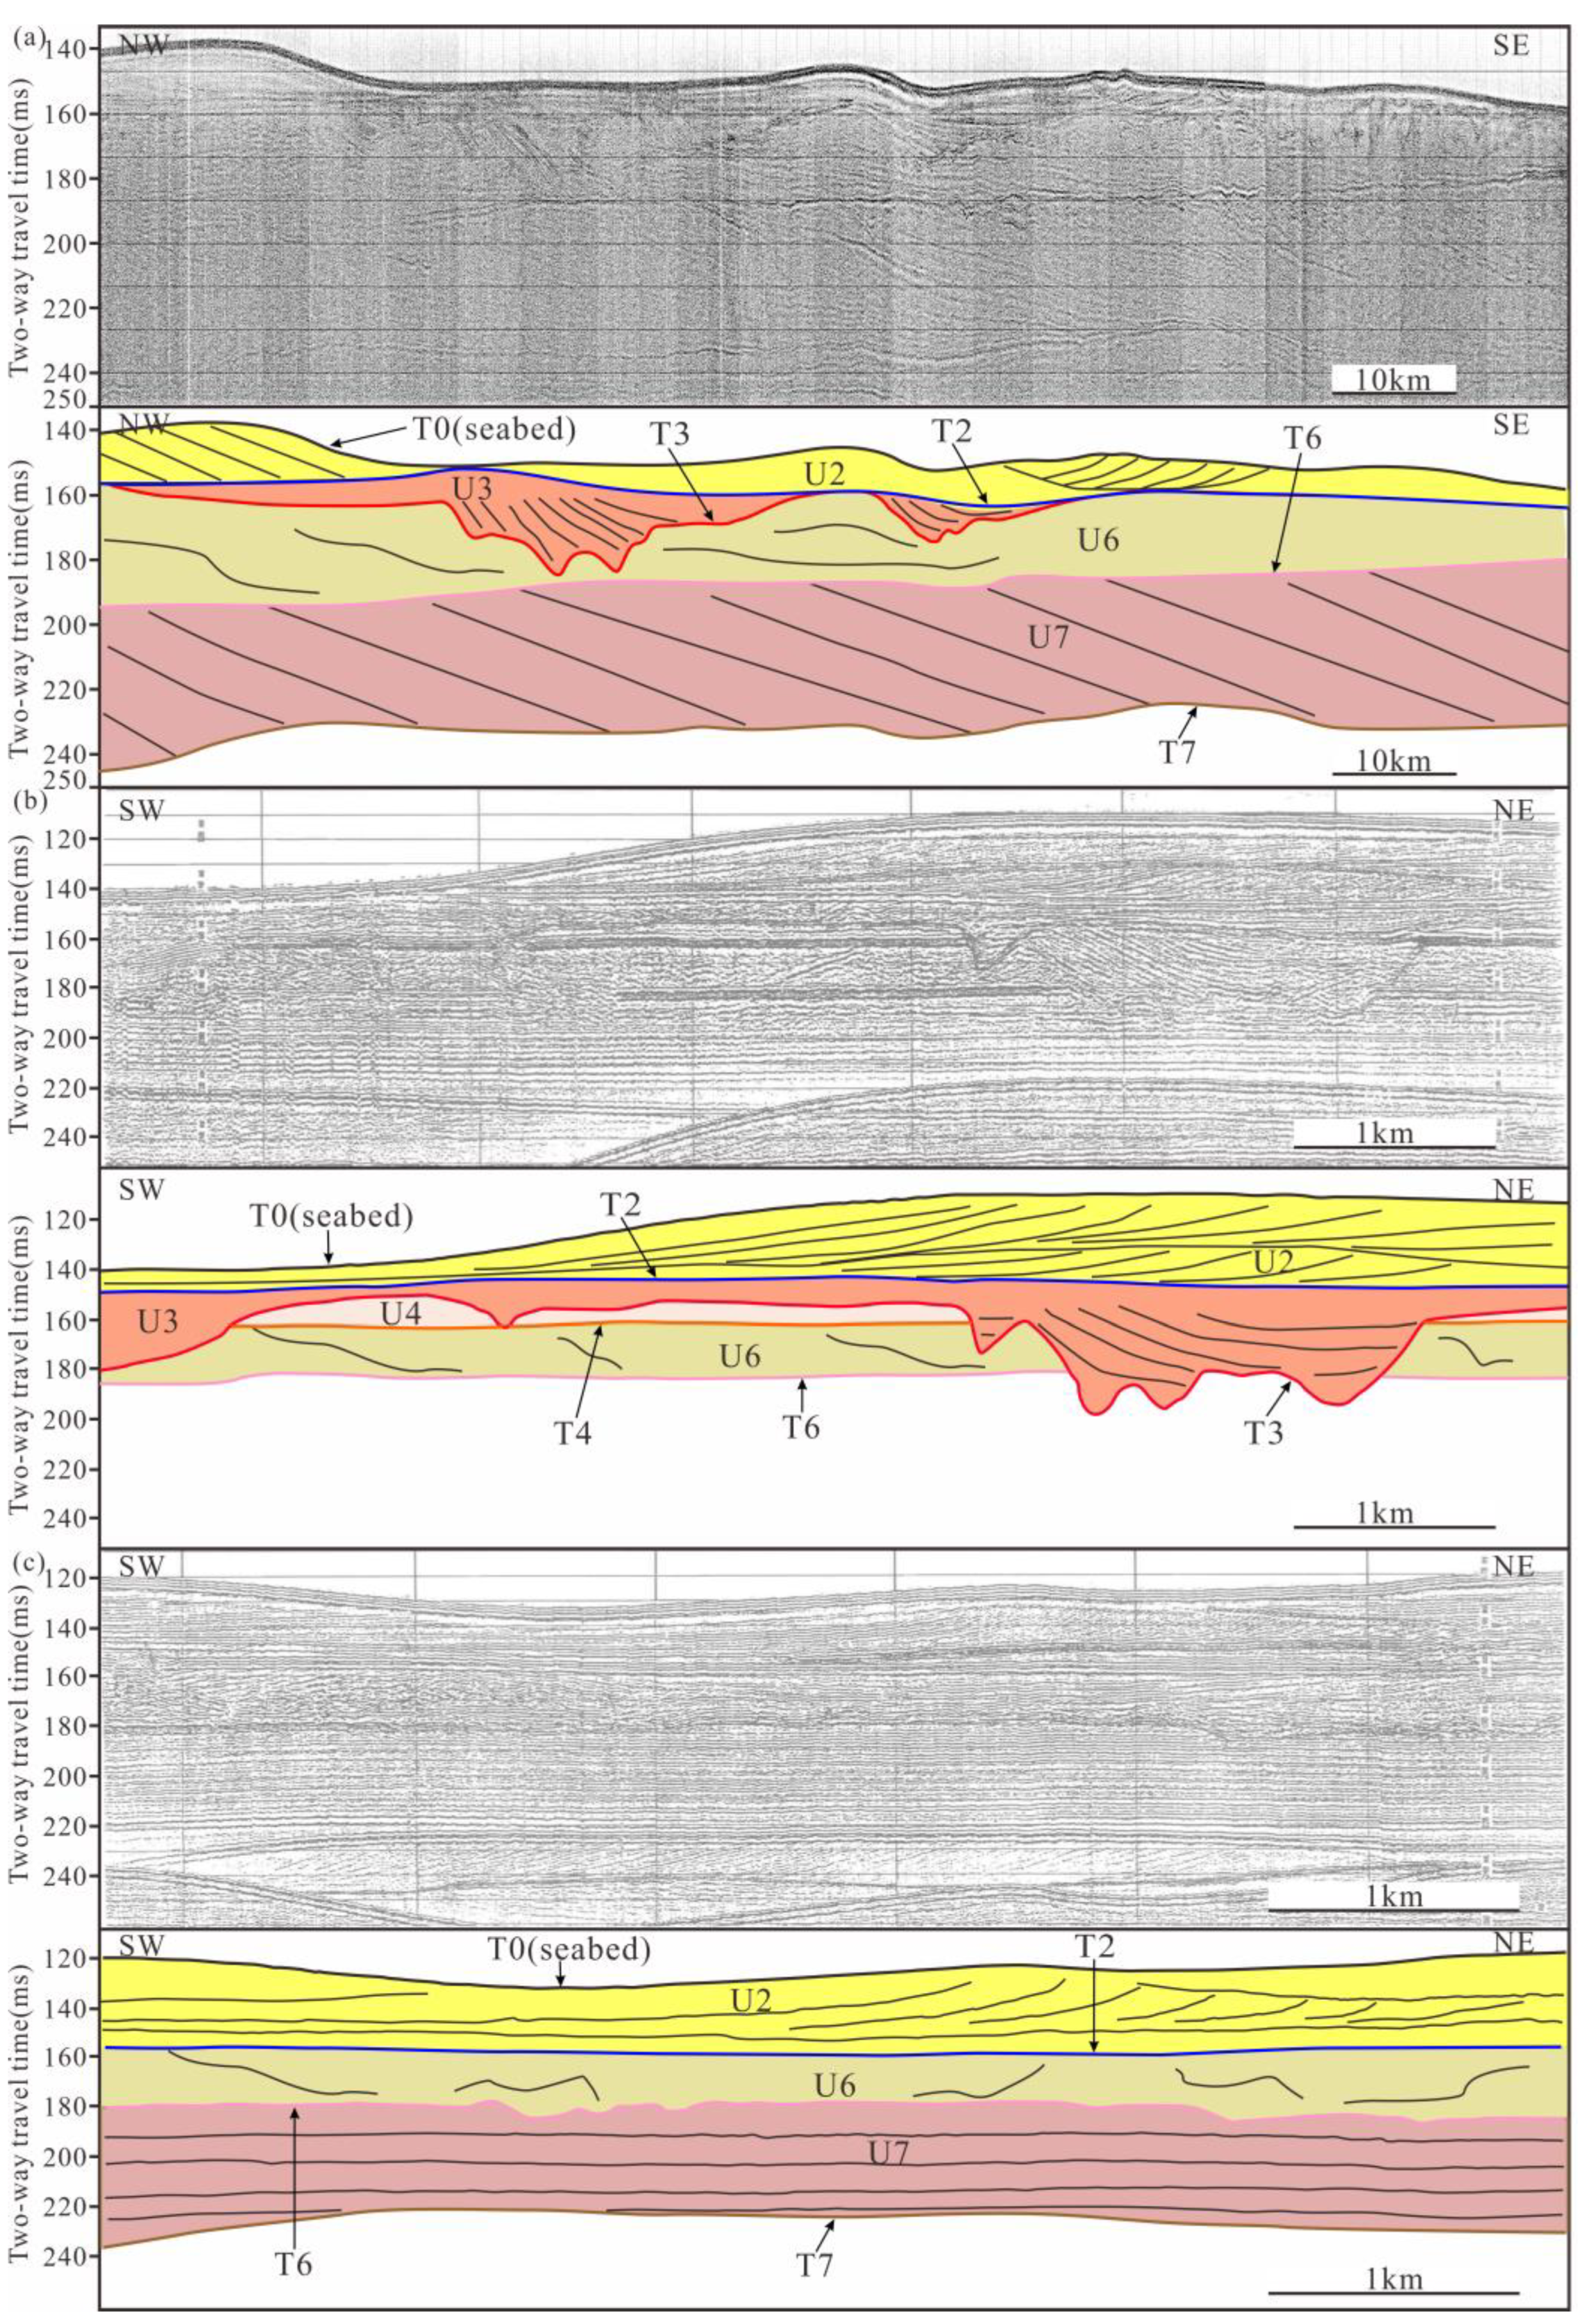
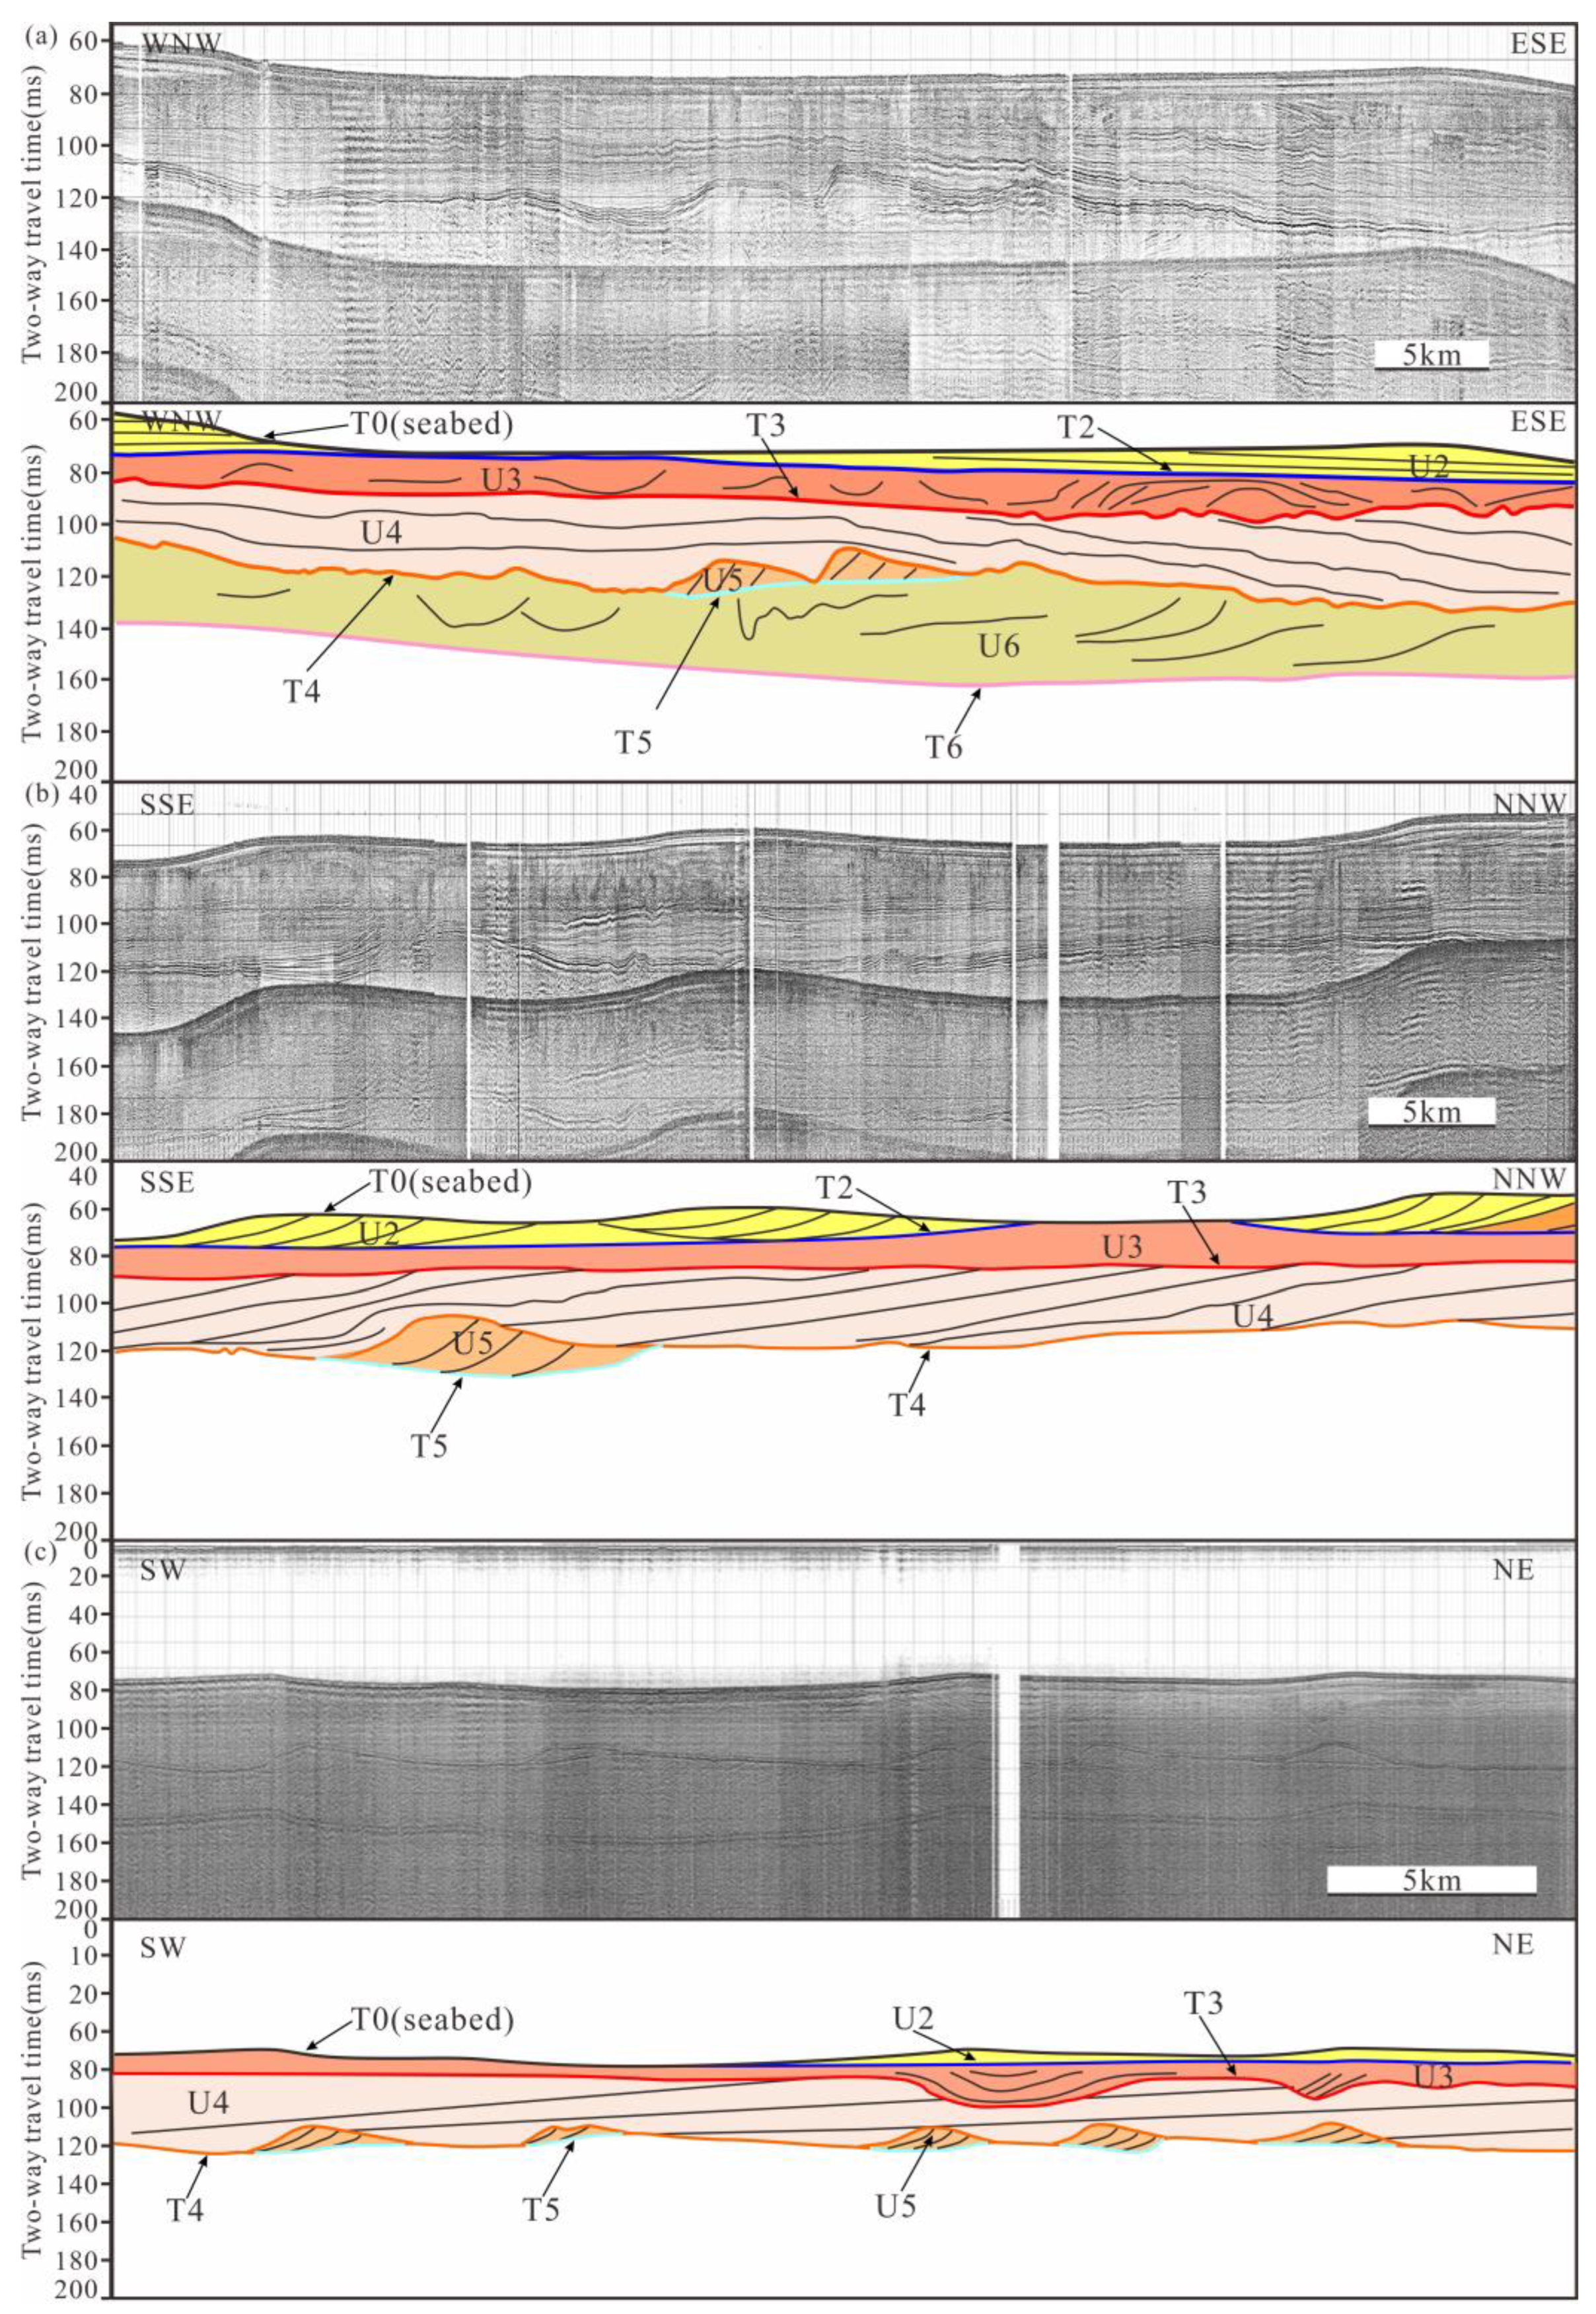
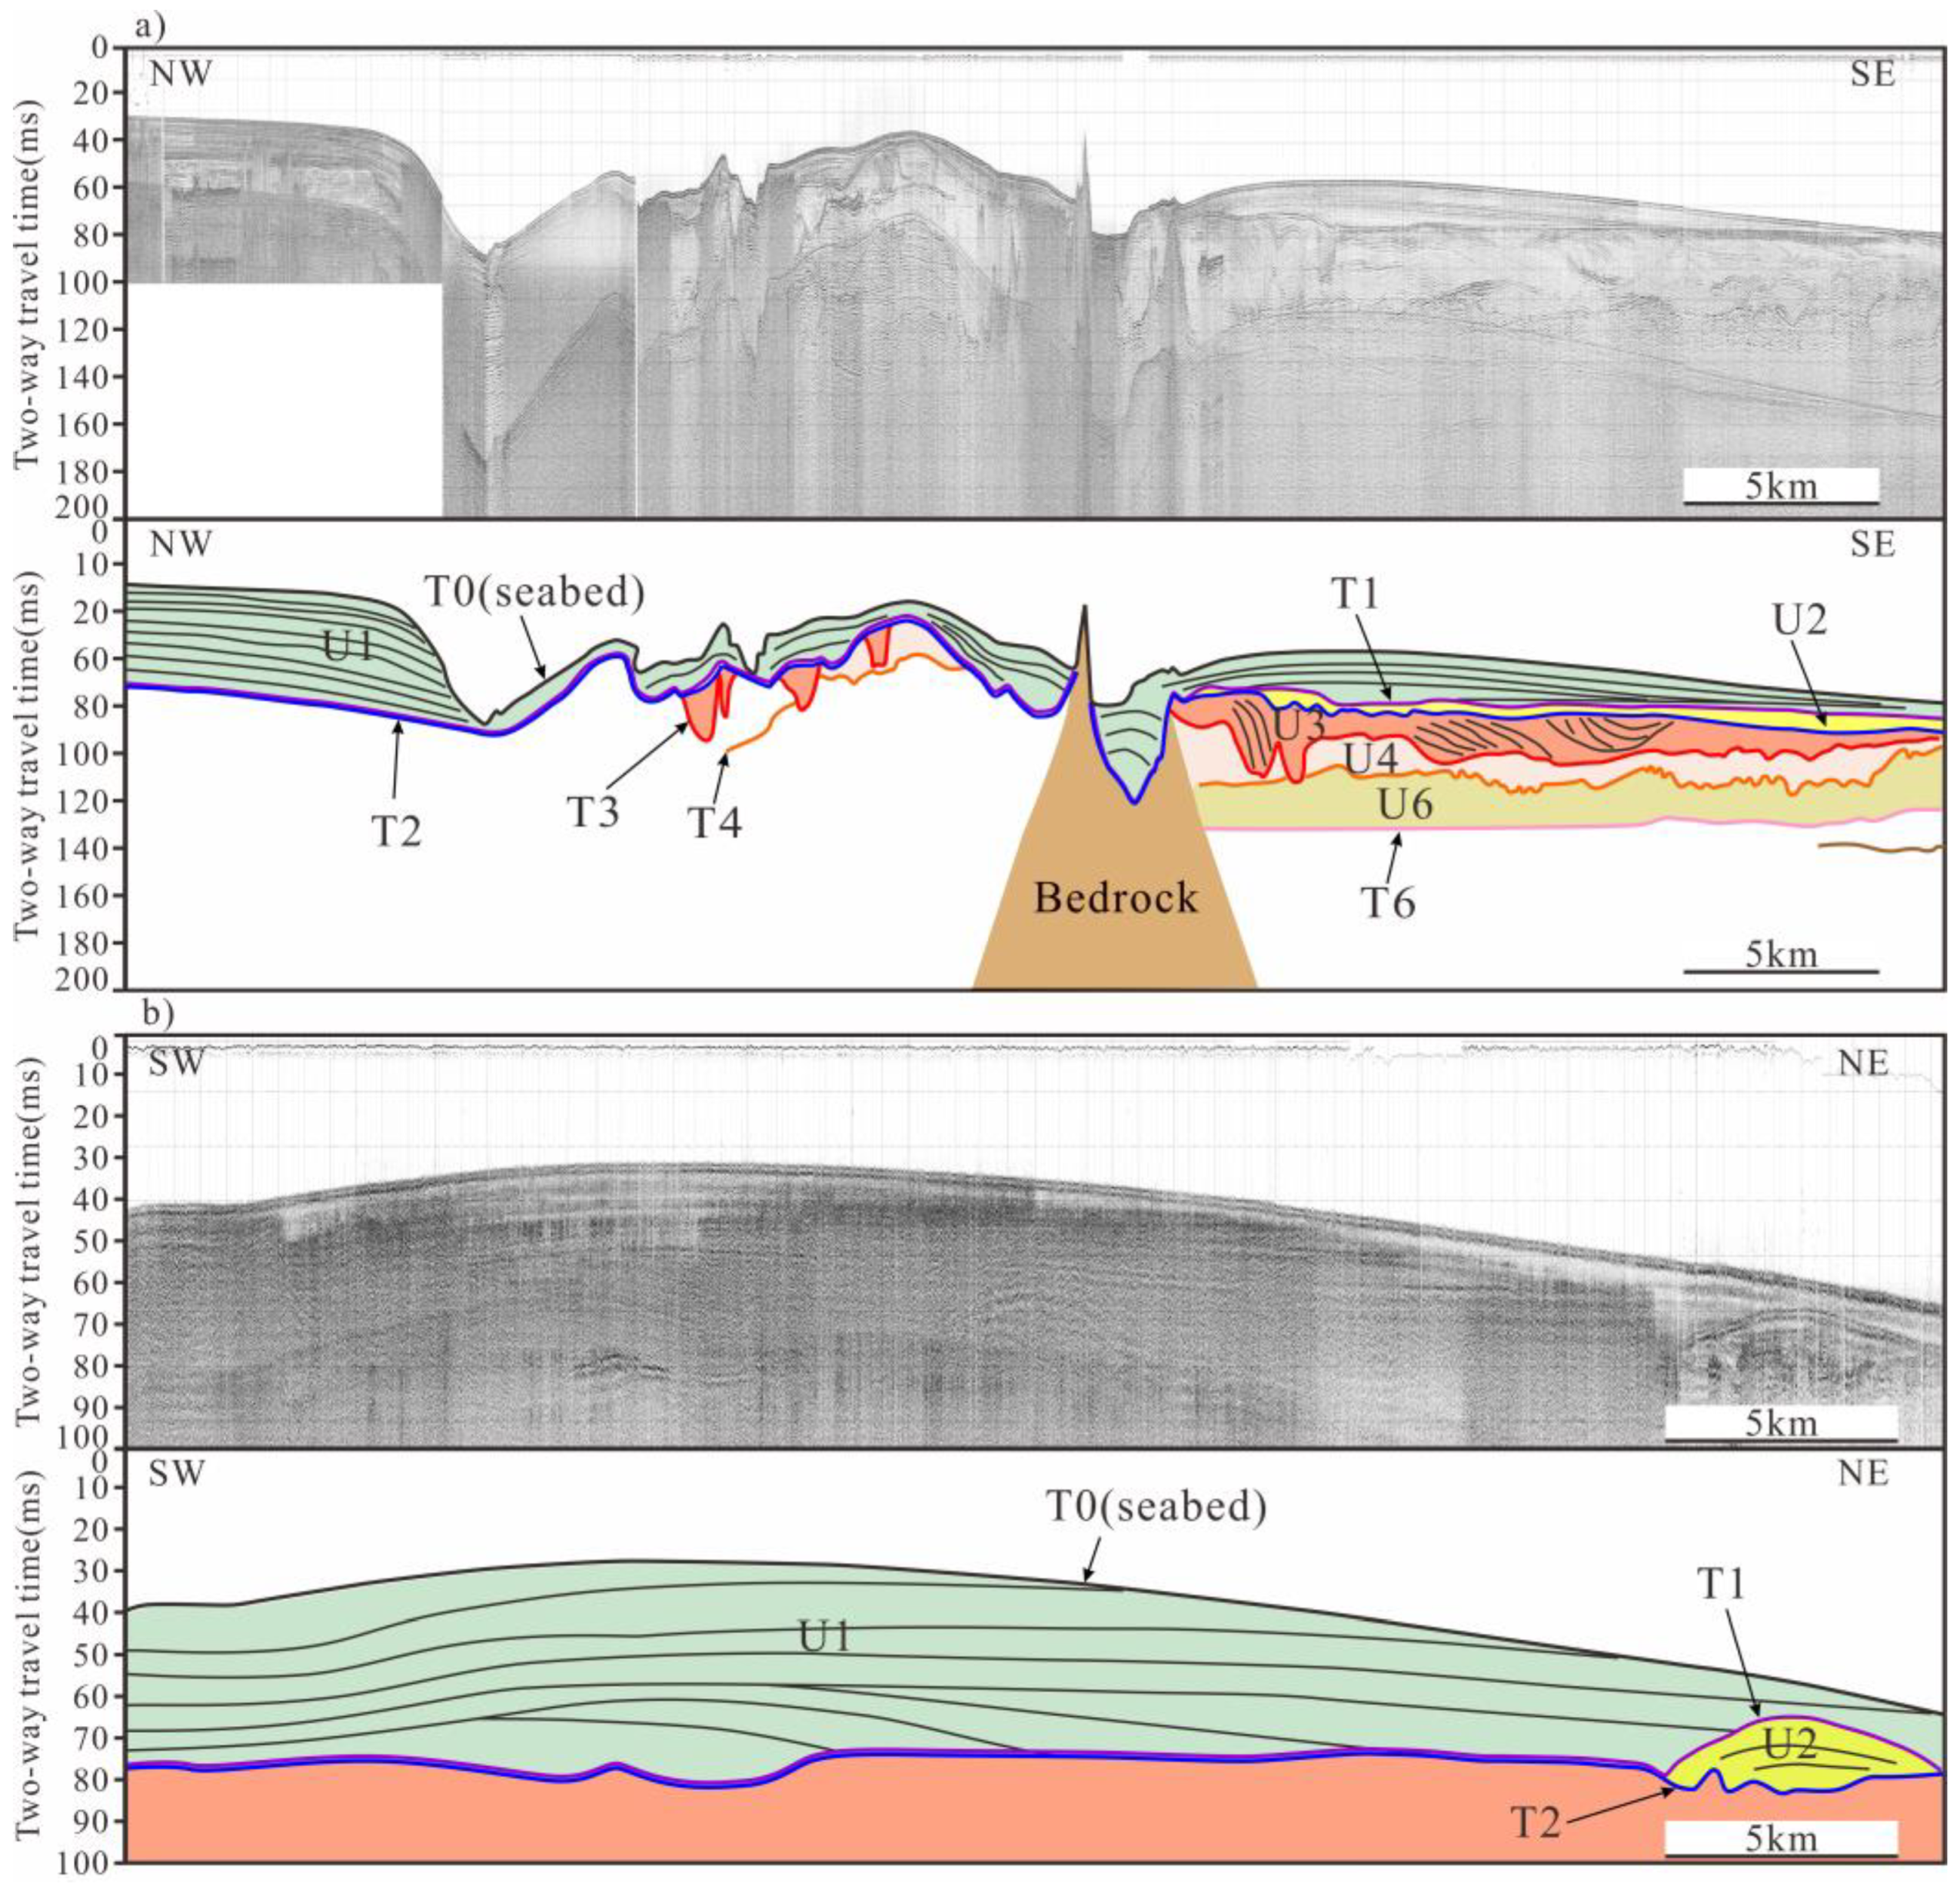
4.1. Seismic Facies and Stratigraphic Framework
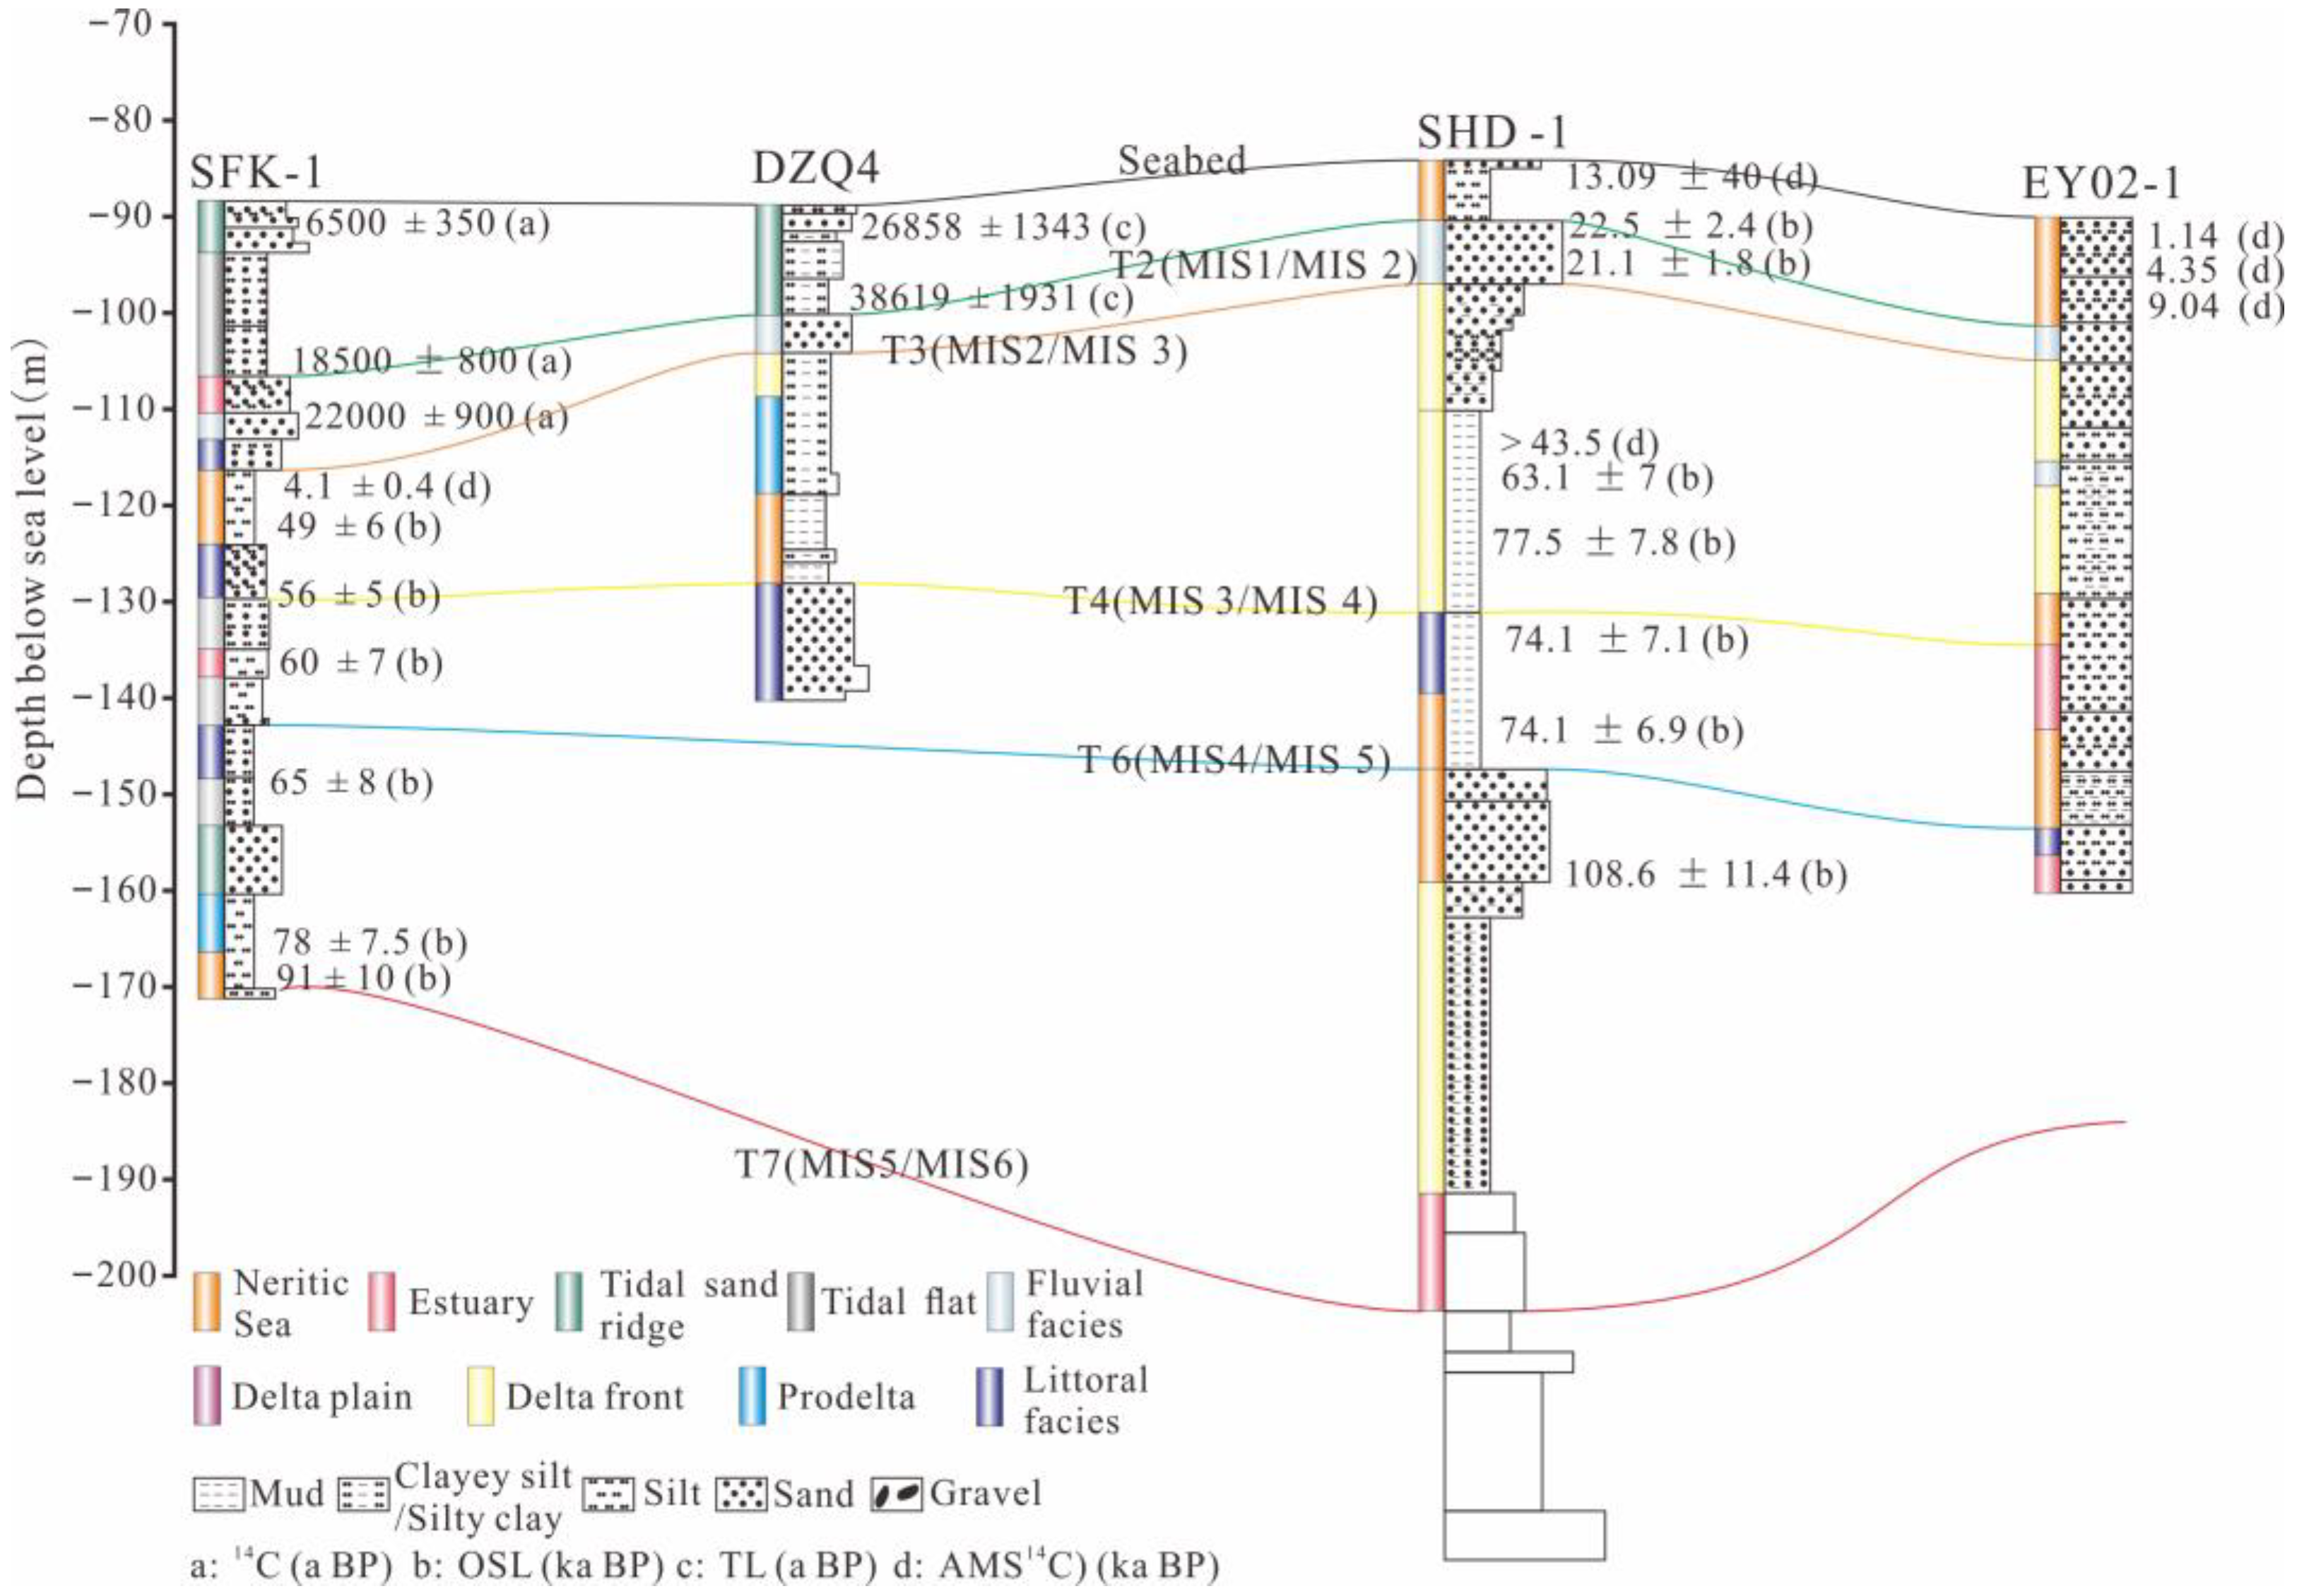
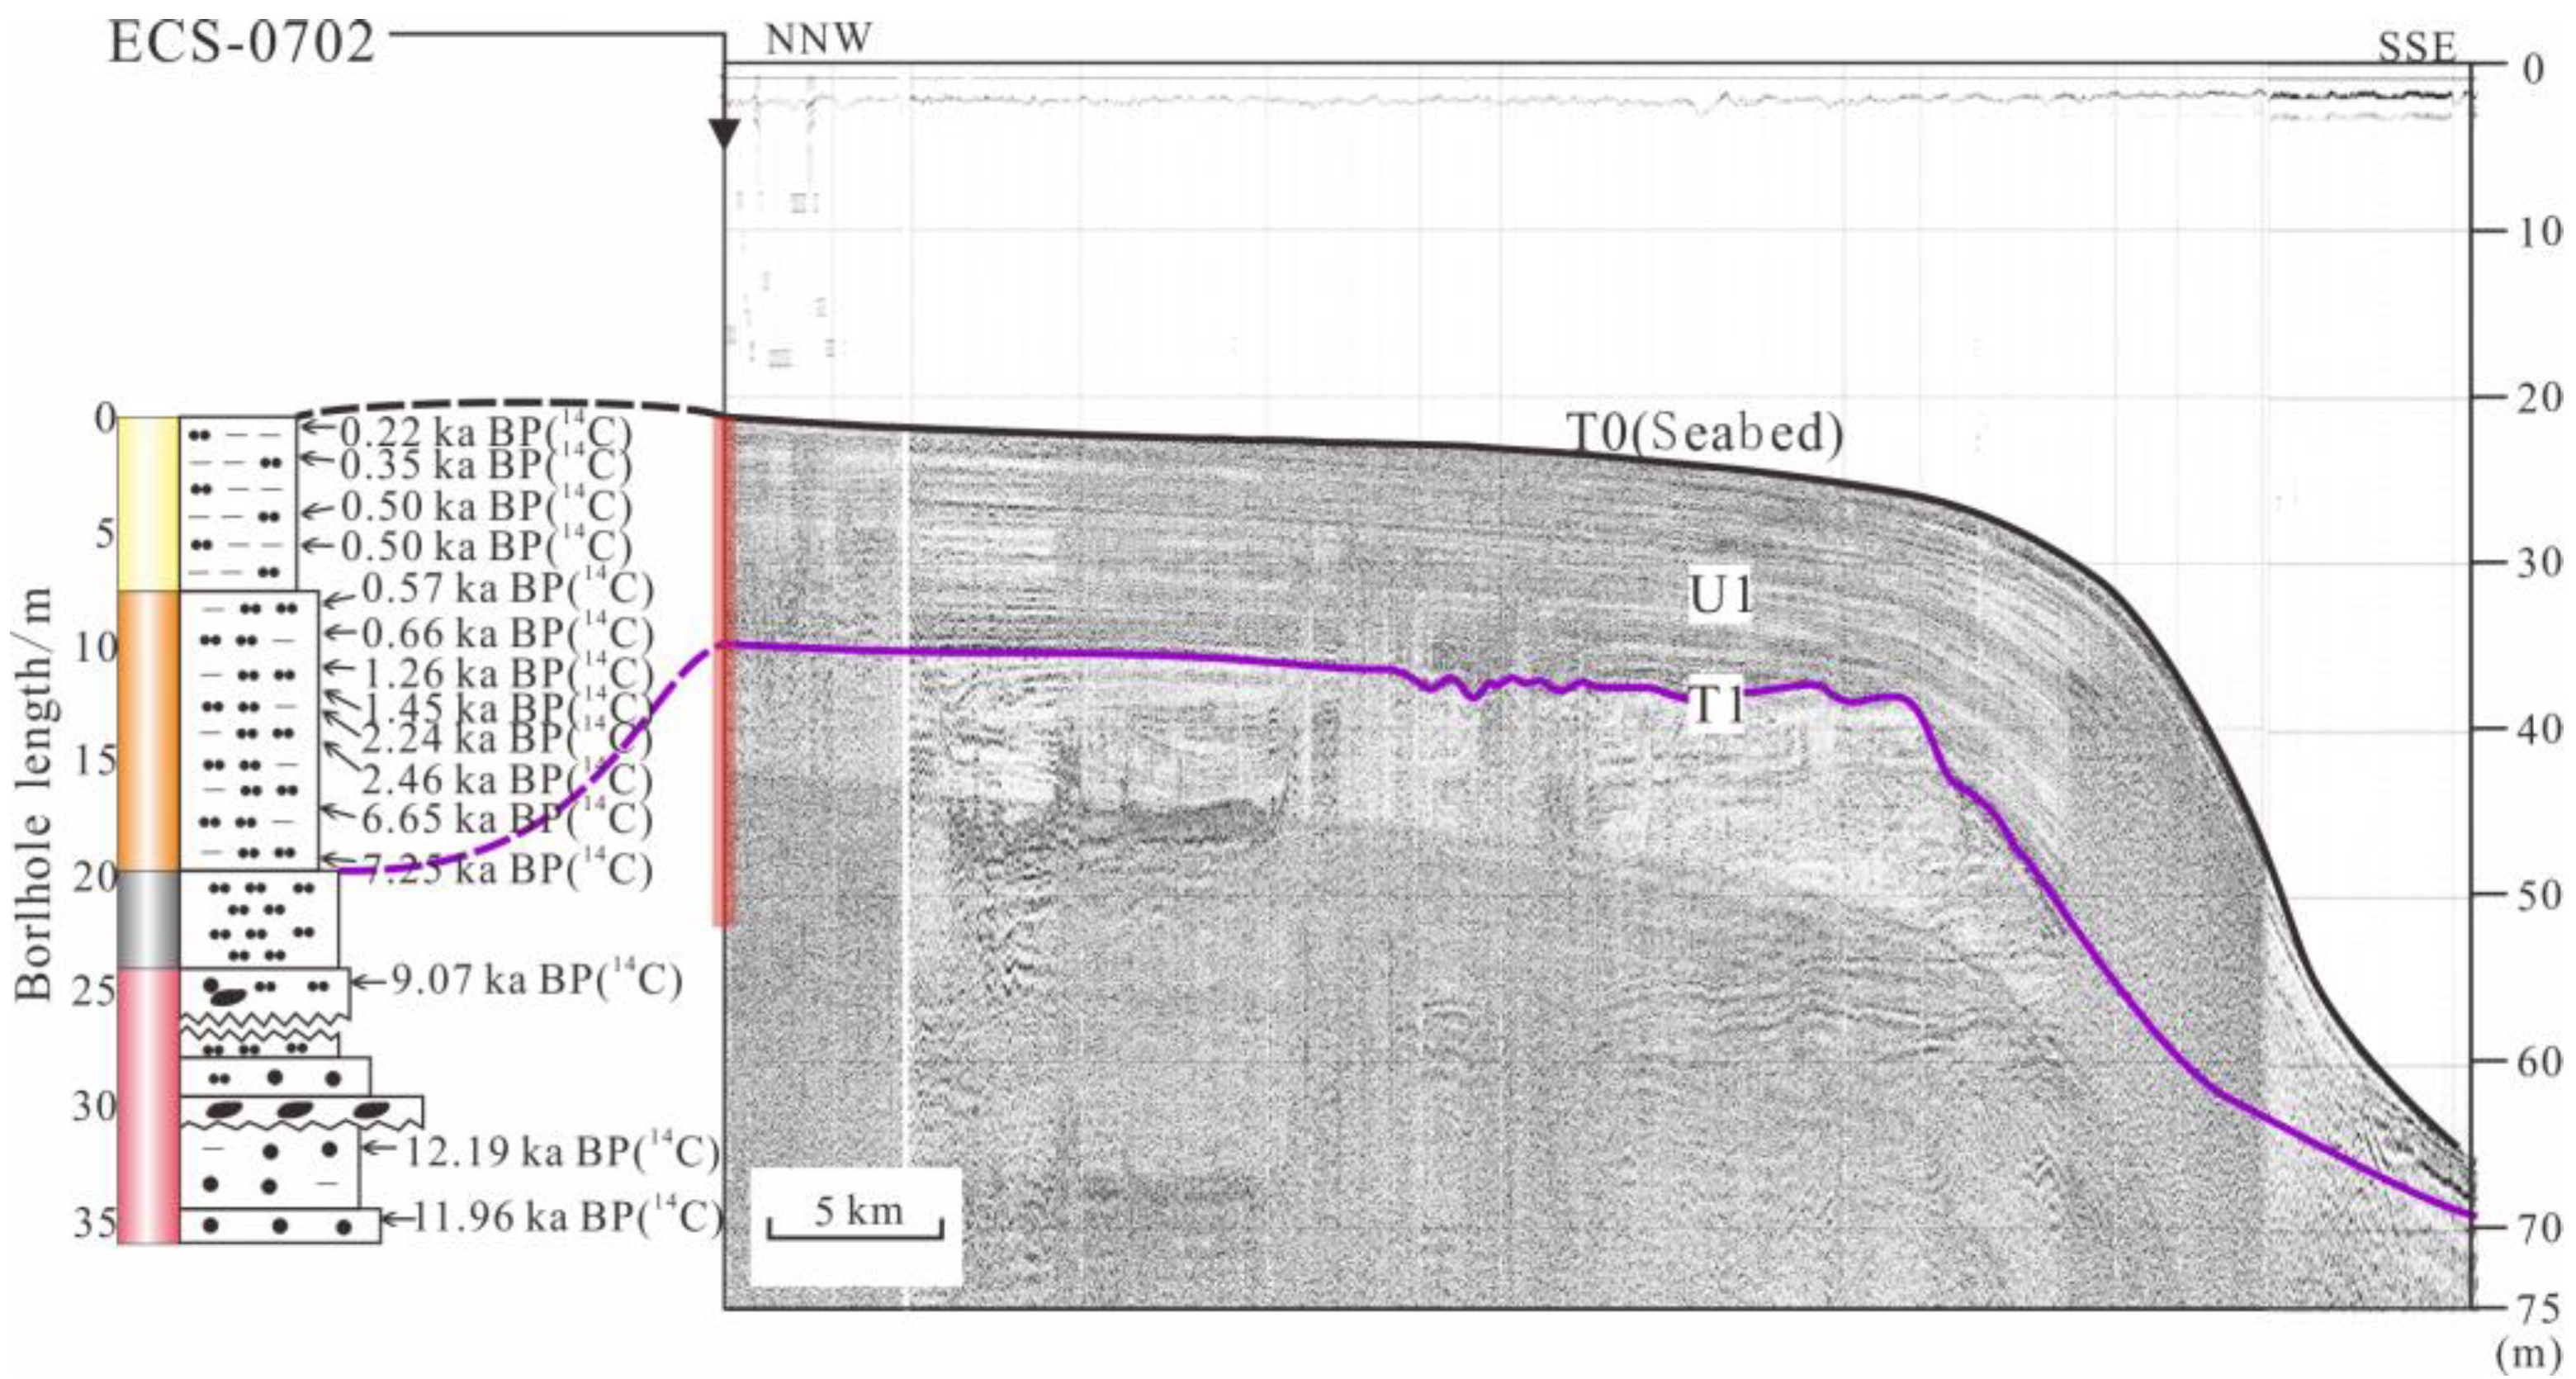
4.2. Chronostratigraphic Frameworks
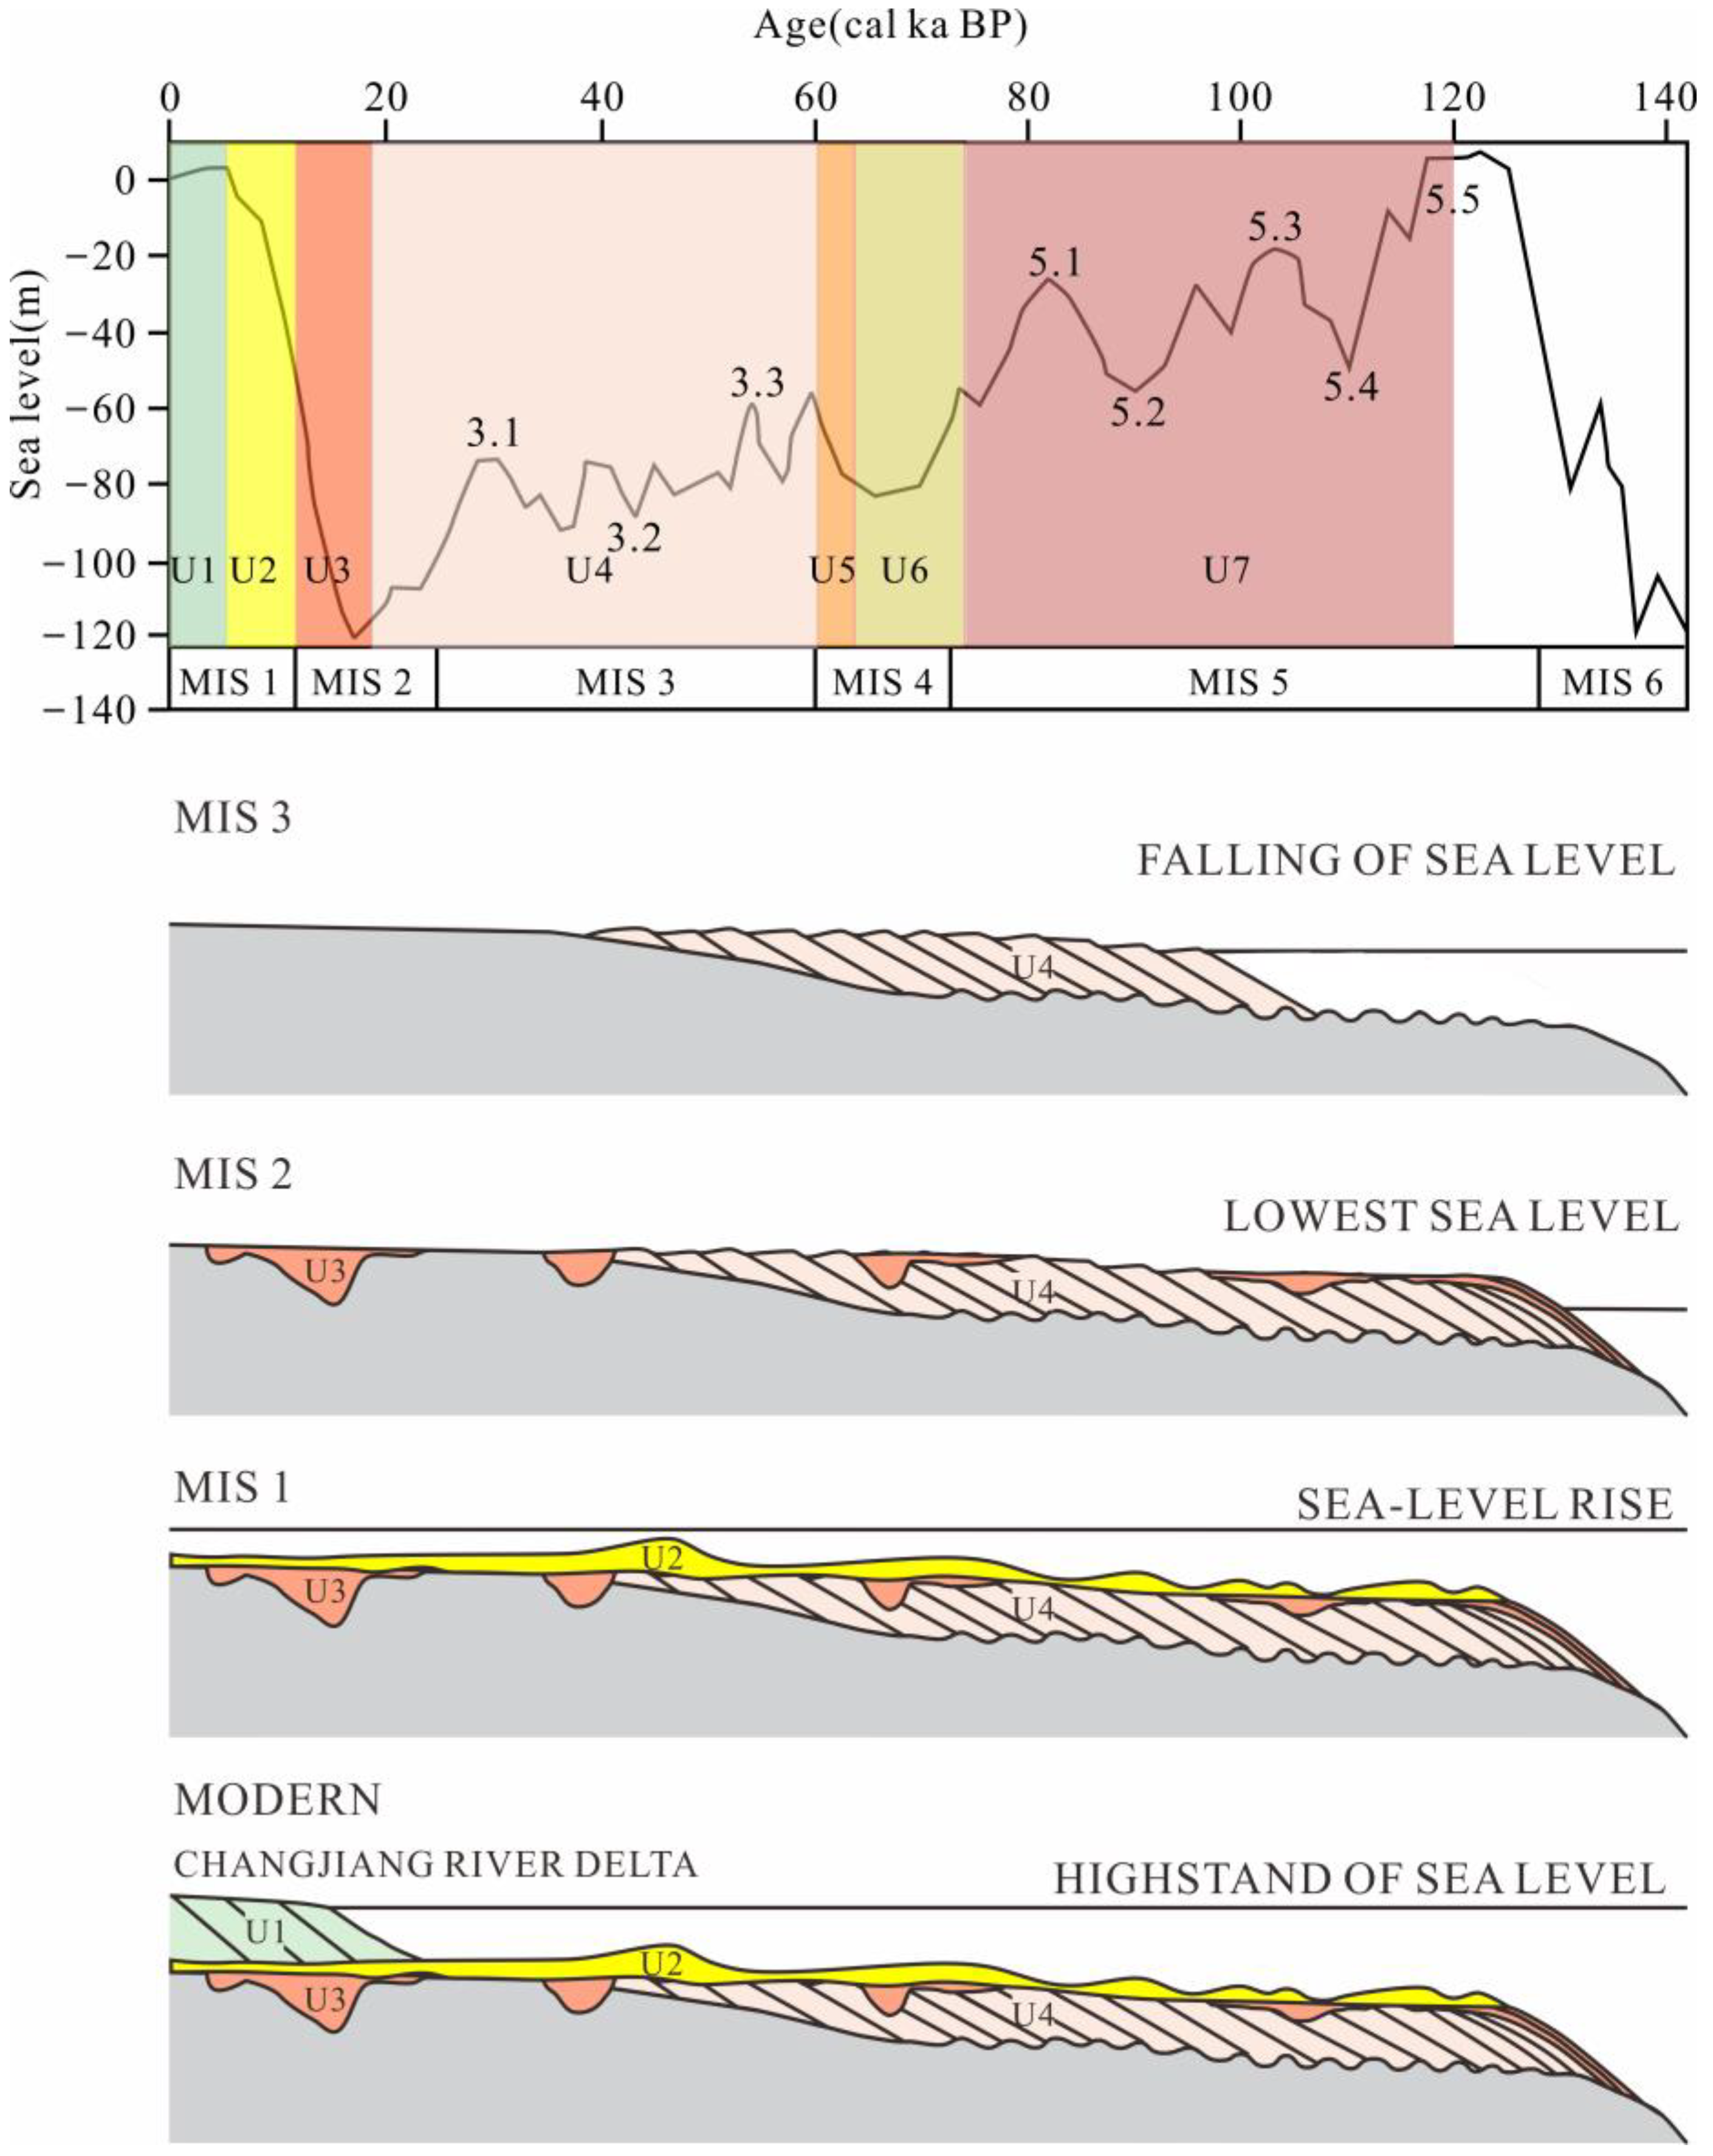
4.3. Sedimentary Evolution on the East China Sea since MIS 5
5. Discussion
5.1. Spatial Distribution Pattern and Thickness of the Paleodelta during MIS 3
5.2. Controlling Factors in Delta Development during MIS 3
6. Conclusions
Author Contributions
Funding
Institutional Review Board Statement
Informed Consent Statement
Data Availability Statement
Acknowledgments
Conflicts of Interest
References
- Gao, S.; Wang, D.D.; Yang, Y.; Zhou, L.; Zhao, Y.Y.; Gao, W.H.; Han, Z.C.; Yu, Q. Holocene sedimentary systems of the Bohai, Yellow and East China Seas, eastern Asia. In River-Dominated Shelf Sediments of East Asia Seas; Clift, P., Harff, J., Wu, J., Yan, Q., Eds.; Geological Society: London, UK, 2016; Volume 429, pp. 231–268. [Google Scholar]
- Gao, S. Revisiting the concept of river delta sedimentary systems. Mar. Geol. Quat. Geol. 2023, 43, 1–13. [Google Scholar]
- Morton, R.A.; Suter, J.R. Sequence stratigraphy and composition of late Quaternary shelf-margin deltas, northern Gulf of Mexico. Am. Assoc. Pet. Geol. Bull. 1996, 80, 505–530. [Google Scholar]
- Liu, Z.X.; Berné, S.; The L’Atalante Scientific Party. Paleo-environment in the continental shelf of the East China Sea since the mid-pleistocene. Mar. Geol. Quat. Geol. 1999, 19, 1–10. [Google Scholar]
- Steckler, M.S.; Mountain, G.S.; Miller, K.G.; Christieblick, N. Reconstruction of Tertiary progradation and clinoform development on the New Jersey passive margin by 2-D backstripping. Mar. Geol. 1999, 154, 399–420. [Google Scholar] [CrossRef]
- Hanebuth, T.J.; Stattegger, K.; Schimanski, A.; Lüdmann, T.; Wong, H.K. Late Pleistocene forced regressive deposits on the Sunda Shelf (SE Asia). Mar. Geol. 2003, 199, 139–157. [Google Scholar] [CrossRef]
- Hübscher, C.; Spieß, V. Forced regression systems tracts on the Bengal Shelf. Mar. Geol. 2005, 219, 207–218. [Google Scholar] [CrossRef]
- Liu, J.; Saito, Y.; Kong, X.H.; Wen, C.; Yang, Z.; Nakashima, R. Delta development and channel incision during marine isotope stages 3 and 2 in the western South Yellow Sea. Mar. Geol. 2010, 278, 54–76. [Google Scholar] [CrossRef]
- Posamentier, H.W.; Allen, P.G.; James, D.P.; Tesson, M. Forced regression in a sequence stratigraphic framework: Concepts, examples, and exploitation significance. AAPG Bull. 1992, 76, 1687–1709. [Google Scholar]
- Hunt, D.; Tucker, M.E. Stranded parasequences and the forced regressive wedge systems tract: Deposition during base-level’fall. Sediment. Geol. 1992, 81, 1–9. [Google Scholar] [CrossRef]
- Tesson, M.; Gensous, B.; Allen, G.P.; Ravenne, C. Late quaternary deltaic lowstand wedges on the rhône continental shelf, France. Mar. Geol. 1990, 91, 325–332. [Google Scholar] [CrossRef]
- Tesson, M.; Posamentier, H.W.; Gensous, B. Stratigraphic organization of late pleistocene deposits of the western part of the golfe du lion shelf (languedoc shelf), western mediterranean sea, using high-resolution seismic and core data. AAPG Bull. 2000, 84, 119–150. [Google Scholar]
- Trincardi, F.; Field, M.E. Geometry, lateral variation, and preservation of downlapping regressive shelf deposits: Eastern Tyrrhenian Sea margin, Italy. J. Sediment. Res. 1991, 61, 775–790. [Google Scholar]
- Porębski, J.; Steel, J. Shelf-margin deltas: Their stratigraphic significance and relation to deepwater sands. Earth Sci. Rev. 2003, 62, 283–326. [Google Scholar] [CrossRef]
- Qin, Y.S.; Zhao, Y.Y.; Chen, L.R. Geology of the East China Sea; Science Press: Beijing, China, 1987; pp. 125–134. [Google Scholar]
- Liu, J.; Saito, Y.; Kong, X.H.; Wang, H.; Xiang, L.H.; Wen, C.; Nakashima, R. Sedimentary record of environmental evolution off the Yangtze River estuary, East China Sea, during the last 13,000 years, with special reference to the influence of the Yellow River on the Yangtze River delta during the last 600 years. Quat. Sci. Rev. 2010, 29, 2424–2438. [Google Scholar] [CrossRef]
- Wang, P.X.; Sun, X. Last glacial maximum in China: Comparison between land and sea. Catena 1994, 23, 341–353. [Google Scholar]
- Chen, Z.Y.; Stanley, D.J. Quaternary Subsidence and River Channel Migration in the Yangtze Delta Plain, Eastern China. J. Coast. Res. 1995, 11, 927–945. [Google Scholar]
- Liu, Z.X.; Berné, S.; The L’Atalante Scientific Party. Paleochannels and paleodeltas in the continental shelf of the East China Sea. Mar. Geol. Quat. Geol. 2000, 19, 9–14. [Google Scholar]
- Hori, K. Sedimentary facies and Holocene progradation rates of the Changjiang (Yangtze) delta, China. Geomorphology 2001, 41, 233–248. [Google Scholar] [CrossRef]
- Li, C.X.; Chen, Q.Q.; Zhang, J.Q.; Yang, S.Y.; Fan, D.D. Stratigraphy and paleoenvironmental changes in the yangtze delta during the late quaternary. J. Asian Earth Sci. 2000, 18, 453–469. [Google Scholar] [CrossRef]
- Hori, K.; Saito, Y. An early Holocene sea-level jump and delta initiation. Geophys. Res. Lett. 2007, 34. [Google Scholar] [CrossRef]
- Li, C.X.; Fan, D.D.; Yang, S.Y.; Cai, J.G. Characteristics and formation of the Late Quaternary incised-valley sequences in estuary and delta areas in China. J. Palaeogeogr. 2008, 10, 87–97. [Google Scholar]
- Saito, Y.; Katayama, H.; Ikehara, K.; Kato, Y.; Matsumoto, E.; Oguri, K.; Oda, M.; Yumoto, M. Transgressive and highstand systems tracts and post-glacial transgression, the East China Sea. Sediment. Geol. 1998, 122, 217–232. [Google Scholar] [CrossRef]
- Berné, S.; Vagner, P.; Guichard, F.; Lericolais, G.; Liu, Z.X.; Trentesaux, A.; Yin, P.; Yi, H.I. Pleistocene forced regressions and tidal sand ridges in the East China Sea. Mar. Geol. 2002, 188, 293–315. [Google Scholar] [CrossRef]
- Lee, G.S.; Kim, D.Y.; Yoo, D.G.; Yi, H.I. Sedimentary environment and sequence stratigraphy of late Quaternary deposits in the East China Sea. Mar. Georesources Geotechnol. 2013, 31, 17–39. [Google Scholar] [CrossRef]
- Wellner, R.W.; Bartek, L.R. The effect of sea level, climate, and shelf physiography on the development of incised-valley complexes: A modern example from the East China Sea. J. Sediment. Res. 2003, 73, 926–940. [Google Scholar] [CrossRef]
- Li, G.X.; Liu, Y.; Yang, Z.G.; Yue, S.H.; Yang, W.D.; Han, X.B. Ancient Changjiang channel system in the East China Sea continental shelf during the last glaciation. Sci. China Ser. D Earth Sci. 2005, 48, 1972–1978. [Google Scholar] [CrossRef]
- Tang, B.G. The Quaternary stratigraphy of the East China Sea shelf. In Quaternary Stratigraphy in China and Its International Correlation; Yang, Z.G., Lin, H.M., Eds.; Geology Press: Beijing, China, 1996; pp. 56–75. [Google Scholar]
- Li, S.Q.; Li, S.L.; Chen, Z.X.; Tang, B.G.; Chen, Y.X. Deltaic sedimentary sequences developed during Last Glacial Maximum in the EA01 core on the outer shelf of the East China Sea. Mar. Geol. Quat. Geol. 2002, 22, 19–26. [Google Scholar]
- Yoo, D.G.; Lee, C.W.; Kim, S.P.; Jin, J.H.; Kim, J.K.; Han, H.C. Late Quaternary transgressive and highstand systems tracts in the northern East China Sea mid-shelf. Mar. Geol. 2002, 187, 313–328. [Google Scholar] [CrossRef]
- Wang, Z.B.; Yang, S.Y.; Wang, Q.; Zhang, Z.X.; Zhang, X.H.; Lan, X.H.; Li, R.H.; Huang, L. Late Quaternary stratigraphic evolution on the outer shelf of the East China Sea. Cont. Shelf Res. 2014, 90, 5–16. [Google Scholar] [CrossRef]
- Wang, Z.B.; Zhang, J.Y.; Mei, X.; Chen, X.H.; Zhao, L.; Zhang, Y.; Zhang, Z.X.; Li, X.J.; Li, R.H.; Lu, K.; et al. The stratigraphy and depositional environments of China’s sea shelves since MIS5 74–128 ka. Geol. China 2020, 47, 1370–1394. [Google Scholar]
- Xu, T.Y.; Shi, X.F.; Liu, S.F.; Qiao, S.Q.; Yao, Z.Q.; Fang, X.S.; Wu, Y.H.; Shan, X.; Liu, J.X.; Yang, G.; et al. Late Quaternary sedimentary evolution of the outer shelf of the East China Sea. Quat. Int. 2018, 493, 59–69. [Google Scholar] [CrossRef]
- Chen, S.S.; Wang, Z.B.; Lu, K.; Qi, J.H.; Zhang, Z.X. Sedimentary stratigraphic framework and palaeoenvironmental evolution of the northern outer shelf of East China Sea since MIS 6. Mar. Geol. Quat. Geol. 2019, 39, 124–137. [Google Scholar]
- Niu, Z.M. Deposition environment sub-division of the East China Sea and their basic features. Mar. Geol. Quat. Geol. 1985, 2, 29–38. [Google Scholar]
- Milliman, J.D.; Farnsworth, K.L. River Discharge to the Coastal Ocean: A Global Synthesis; Cambridge University Press: Cambridge, UK, 2011; pp. 143–144. [Google Scholar]
- Zhu, Y.Q.; Zeng, C.K.; Feng, Y. The shelf geomorphic features of the East China Sea. Donghhai Mar. Sci. 1984, 2, 1–13. [Google Scholar]
- Fan, F.X.; Yan, J.; Li, C.G.; Chen, C.A.; Luan, Z.D.; Zhuang, L.H. Paleo-delta deposition in the west slope of the northern Okinawa Trough. Stud. Mar. Sin. 2007, 48, 42–54. [Google Scholar]
- Chappell, J. Sea Level Changes Forced Ice Breakouts in the Last Glacial Cycle: New Results from Coral Terraces. Quat. Sci. Rev. 2002, 21, 1229–1240. [Google Scholar] [CrossRef]
- Ge, S.L.; Shi, X.F.; Wu, Y.H.; Xiong, Y.Q.; Han, Y.B.; Tang, B.G. Magnetostratigraphy of Borehole EY 02–1 in the northern outer continental shelf of the East China Sea. Acta Oceanol. Sin. 2008, 30, 51–61. [Google Scholar]
- Zhuang, L.H.; Li, T.G.; Chang, F.M.; Sun, R.T.; Yan, J. Quantitative analysis on the benthic foraminifer fauna in late quaternary period in the north continental shelf of the East China Sea. Mar. Geol. Quat. Geol. 2004, 24, 43–50. [Google Scholar]
- Vail, P.R.; Mitchum, R.M., Jr.; Thompson, S. Seismic stratigraphy and global changes of sea level, part 3: Relative changes of sea level from coastal onlap. Geophys. Res. Lett. 1977, 29. [Google Scholar] [CrossRef]
- Sun, J.Z.; Li, L.B. Comprehensive Interpretation Couse of Seismic Geology; China University of Geosciences Press: Wuhan, China, 2002; pp. 114–140. [Google Scholar]
- Stirling, C.H.; Esat, T.M.; Lambeck, K.; McCulloch, M. Timing and duration of the Last Interglacial: Evidence for a restricted interval of widespread coral reef growth. Earth Planet. Sci. Lett. 1998, 160, 745–762. [Google Scholar] [CrossRef]
- Vézina, J.L.; Jones, B.; Ford, D.C. Sea-level highstands over the last 500,000 years; evidence from the Ironshore Formation on Grand Cayman, British West Indies. J. Sediment. Res. 1999, 69, 317–327. [Google Scholar] [CrossRef]
- Wang, Z.B.; Yang, S.Y.; Zhang, Z.X.; Lan, X.H.; Gu, Z.F.; Zhang, X.H. Paleo-fluvial sedimentation on the outer shelf of the East China Sea during the last glacial maximum. Chin. J. Oceanol. Limnol. 2013, 31, 886–894. [Google Scholar] [CrossRef]
- Wang, Y.Q.; Wu, J.Y.; Wu, J.Q. Correlation between high-resolution climate records from a Nanjing stalagmite and GRIP ice core during the last glaciation. Sci. China Ser. D 2001, 44, 14–23. [Google Scholar] [CrossRef]
- Zhang, M.H.; Xia, Y.F.; Meng, J.W.; Lai, Z.P.; Wang, Y.J. The especially warm and wet during MIS 3 recorded by Xiashu Loess. Acta Pedol. Sin. 2008, 45, 9–15. [Google Scholar]
- Zhang, J.Q.; Tang, L.L.; Zou, H. The response to the variety of paleocliamte and sea level in the East China Sea after the Late Pleistocene. Trans. Oceanol. Limnol. 2008, 1, 25–31. [Google Scholar]


| Seismic Line | Start and End Point | Water Depth (m) | Longitude (E) | Latitude (N) | Length (km) |
|---|---|---|---|---|---|
| EE1 | E | 14.4 | 122.030° | 31.952° | 497.2 |
| E1 | 100 | 126.877° | 30.832° | ||
| DD1 | D | 17.5 | 121.696° | 32.426° | 273.6 |
| D1 | 59.6 | 124.506° | 32.790° | ||
| N3N4 | N4 | 55 | 124.741° | 31.329° | 157.5 |
| N3 | 47 | 124.291° | 32.770° | ||
| M2M3 | M3 | 41.8 | 123.590° | 31.605° | 115.5 |
| M2 | 40 | 123.372° | 32.655° | ||
| FF1 | F | 6.5 | 122.199° | 31.229° | 505.5 |
| F1 | 118 | 125.988° | 28.101° | ||
| N5N4 | N4 | 55 | 124.736° | 31.319° | 170.1 |
| N5 | 67 | 123.404° | 30.221° | ||
| M4M3 | M3 | 41.8 | 123.551° | 31.553° | 115.4 |
| M4 | 31 | 122.694° | 30.823° |
| Core No. | Longitude (E) | Latitude (°N) | Water Depth (m) | Core Length (m) | Reference |
|---|---|---|---|---|---|
| SHD-1 | 126.05° | 29.92° | 84.1 | 150.4 | [33,35] |
| SFK-1 | 125.25° | 29.05° | 88.3 | 82.90 | [33] |
| DZQ4 | 125.36° | 29.41° | 88.7 | 51.65 | [4,2529] |
| EY02-1 | 126.57° | 30.73° | 80 | 70.2 | [41,42] |
| ECS0702 | 31° | 122.67° | 22 | 35.6 | [16] |
Disclaimer/Publisher’s Note: The statements, opinions and data contained in all publications are solely those of the individual author(s) and contributor(s) and not of MDPI and/or the editor(s). MDPI and/or the editor(s) disclaim responsibility for any injury to people or property resulting from any ideas, methods, instructions or products referred to in the content. |
© 2023 by the authors. Licensee MDPI, Basel, Switzerland. This article is an open access article distributed under the terms and conditions of the Creative Commons Attribution (CC BY) license (https://creativecommons.org/licenses/by/4.0/).
Share and Cite
Dai, C.; Gao, S.; Zhang, Y.; Xia, F.; Wang, D. A Paleo-Changjiang Delta Complex on the East China Sea Shelf Formed Some 30 ka Ago (at the MIS 3 Stage). J. Mar. Sci. Eng. 2023, 11, 2035. https://doi.org/10.3390/jmse11112035
Dai C, Gao S, Zhang Y, Xia F, Wang D. A Paleo-Changjiang Delta Complex on the East China Sea Shelf Formed Some 30 ka Ago (at the MIS 3 Stage). Journal of Marine Science and Engineering. 2023; 11(11):2035. https://doi.org/10.3390/jmse11112035
Chicago/Turabian StyleDai, Chen, Shu Gao, Yongzhan Zhang, Fei Xia, and Dandan Wang. 2023. "A Paleo-Changjiang Delta Complex on the East China Sea Shelf Formed Some 30 ka Ago (at the MIS 3 Stage)" Journal of Marine Science and Engineering 11, no. 11: 2035. https://doi.org/10.3390/jmse11112035
APA StyleDai, C., Gao, S., Zhang, Y., Xia, F., & Wang, D. (2023). A Paleo-Changjiang Delta Complex on the East China Sea Shelf Formed Some 30 ka Ago (at the MIS 3 Stage). Journal of Marine Science and Engineering, 11(11), 2035. https://doi.org/10.3390/jmse11112035