1. Introduction
Offshore structures for ocean space development are mainly divided into fixed and floating structures depending on the water depth and installation location. Jackets are fixed structures that are mainly used for ocean space development in shallow waters and are fixed to the seabed using pipes or column-shaped legs at the bottom of the structures. Jacket structures have been widely used in the development of oil fields in shallow waters. They are also widely used as a substructure for offshore wind generators based on the recent development of marine eco-friendly energy production technology.
Floating offshore structures are deployed in deep waters. A typical example of a vessel-type floating offshore structure is the floating production, storage, and offloading unit (FPSO), which is typically deployed in deep waters and areas that lack infrastructure. In addition, semi-submersibles, which have a column and pontoon structure, have the advantage of having a small waterplane area and excellent movement performance in the ocean environment; however, owing to their limited displacement, they are widely used as production facilities and drilling rigs in harsh environmental conditions rather than storage facilities in oil field development. In addition, semi-submersibles are suitable substructures for floating offshore wind turbines; therefore, semi-submersible-type substructures for floating offshore wind turbines have been developed [
1,
2].
In general, the most basic requirement for the design of a floating offshore structure is the six-degrees-of-freedom dynamic behavior of the platform in the ocean environment, data on the horizontal nonlinear drift motion, relative motion, and acceleration. In particular, it is important to design and apply an appropriate mooring system so that the floating offshore structure can maintain a specific position designed for horizontal drift motion owing to external forces caused by the ocean environment, such as waves, winds, and currents. The mooring system is designed considering the installation depth, type of offshore structure, ocean environmental conditions, and positioning design criteria. The system can be categorized into chain mooring, chain combination mooring with wire or fiber rope, etc., according to the combination of mooring lines. For the design verification and performance evaluation of mooring systems for positioning offshore structures, second-order drift forces caused by different wave components were calculated and applied through potential-based numerical techniques. In addition, the performance evaluation and design verification of floating structures were performed using a model test in an offshore basin that can reproduce ocean environmental conditions by combining waves, wind, and currents.
Semi-submersible offshore structures have a deck on top of a column. The dynamic behavior under waves and the relative wave height between the wave and the deck are important design factors. A certain air gap, which is the distance between the bottom of the semi-submersible deck and the waterline, must be secured to prevent structural damage due to wave impact loads. Similarly, the relative wave height is an important factor in the design of the side shell of the column because the top of the column in the direction of wave incidence may be subjected to impact loading by waves. DNV-GL-OTG13 [
3] mentions the method of calculating the air gap for structures with columns. The air gap can be calculated as a combination of wave-frequency upwells, low-frequency upwells, mean upwells, and wave elevations. Among these, the low-frequency component dynamic behavior is mainly represented as roll and pitch motion with a natural period of 40–60 s, which is caused by the Quadratic Transfer Function (QTF) of the second-order difference frequency component.
Since semi-submersibles have a small waterplane area, the restoring coefficient in the vertical direction is less than that in a ship-type structure. The restoring force of the mooring system consisting of a chain is mainly affected by the unit submerged weight of the mooring line in the catenary equation and acts in the horizontal and vertical directions at the point connected to the platform. Therefore, the mooring system is designed to maintain its position by increasing the restoring forces of the mooring line acting on the platform as the distance from the reference point is increased. Thus, the vertical motion of the semi-submersible is influenced by the mooring system as the platform drifts away from its original location.
Nam et al. [
4] conducted a wave measurement experiment considering the floating body motion of K-Semi using two types of relative wave gauges (resistive and capacitive) attached to the floating body in the ocean engineering basin of the Korea Institute of Shipbuilding and Offshore Engineering. They calculated the relative wave height using the method presented in DNV-GL-OTG13 [
3] and estimated the asymmetric factor and extreme upwell. Kim et al. [
5] presented the results of a model test on the nonlinear run-up characteristics of a semi-submersible offshore structure as a function of wave height during a regular wave under two draft conditions. It was found that semi-submersible offshore structures exhibited nonlinear run-up characteristics in short periods combined with low draft conditions when evaluating the air gap of the semi-submersible.
Reig et al. [
6] proposed a technique for fast QTF calculations using the slender body theory and model truncation for the column structure of a semi-submersible. For the semi-submersible substructure of the DTU 10 MW wind turbine, Cao et al. [
7] studied the dynamic behavior due to second-order wave component using the full QTF and Newman approximation and found that the full QTF provided relatively accurate results for the low-frequency pitch motion.
Jung et al. [
8] investigated the effects of a truncated mooring system on the restoring force under limited water depth conditions through model tests of two truncated mooring systems in the deep-ocean engineering basin of the Korea Institute of Shipbuilding and Offshore Engineering (KRISO). It mentions that two types of truncated mooring were designed according to the water depth conditions that can simulate the original mooring system and applied to the model test and that similar results were obtained compared to the original mooring system even when truncated mooring was applied. Nam et al. [
9] investigated the effects of the wave drift and viscous drag forces on the horizontal drift motion of a K-semi and the effects of surge and pitch motion due to the mooring system configuration applied in the model test. It also examines the effects of surge and pitch coupling via numerical analysis under soft mooring conditions as well as under truncated mooring and confirms that the effect of pitch behavior due to surge behavior is relatively small under soft mooring conditions. Ghafari and Dardel [
10] investigated the motion characteristics of a semi-submersible with and without a mooring system through frequency and time–domain analyses as well as model tests. Kim et al. [
11] performed a time–domain coupled analysis of a mooring system and platform using the linear spring method and the nonlinear finite element method (FEM) and found that the nonlinear method yielded relatively better results. It is also stated in [
11] that the large weight of the mooring or large wave drifting force had a significant influence on the surge and pitch-coupled motion caused by the mooring system. Matos et al. [
12] confirmed the occurrence of long-period roll and pitch motions caused by second wave forces in a P-52 semi-submersible deployed in the Campos Basin, which are sometimes larger than the wave frequency motions.
Molins et al. [
13] suggest the use of truncated mooring systems to evaluate original mooring systems, which is an alternative when there is insufficient space in test facilities. For a mooring system applied to Windcrete, a new concrete spa platform for floating offshore wind turbines (FOWTs) has been developed. An algorithm was developed and applied to optimise the design of a scaled truncated mooring system using lines of different weights, and it was found that the static restoring force of the truncated mooring system matched well with the original mooring system. Ferreira et al. [
14] mentioned the problem of mooring system similarity due to the water depth condition in the model test and proposed a design optimisation technique to find the ideal truncated design considering dynamic effects. The calibration method was applied to adjust the design parameters to optimally fit the truncated mooring system to the full-depth mooring system in order to minimise the differences in motion response and tension for two mooring systems, catenary and semi-taut. In addition, the optimum truncated design was carried out for various wave conditions through dynamic simulation, and it was found that the truncated and full-depth mooring designs yielded equivalent results in both cases. Kim et al. [
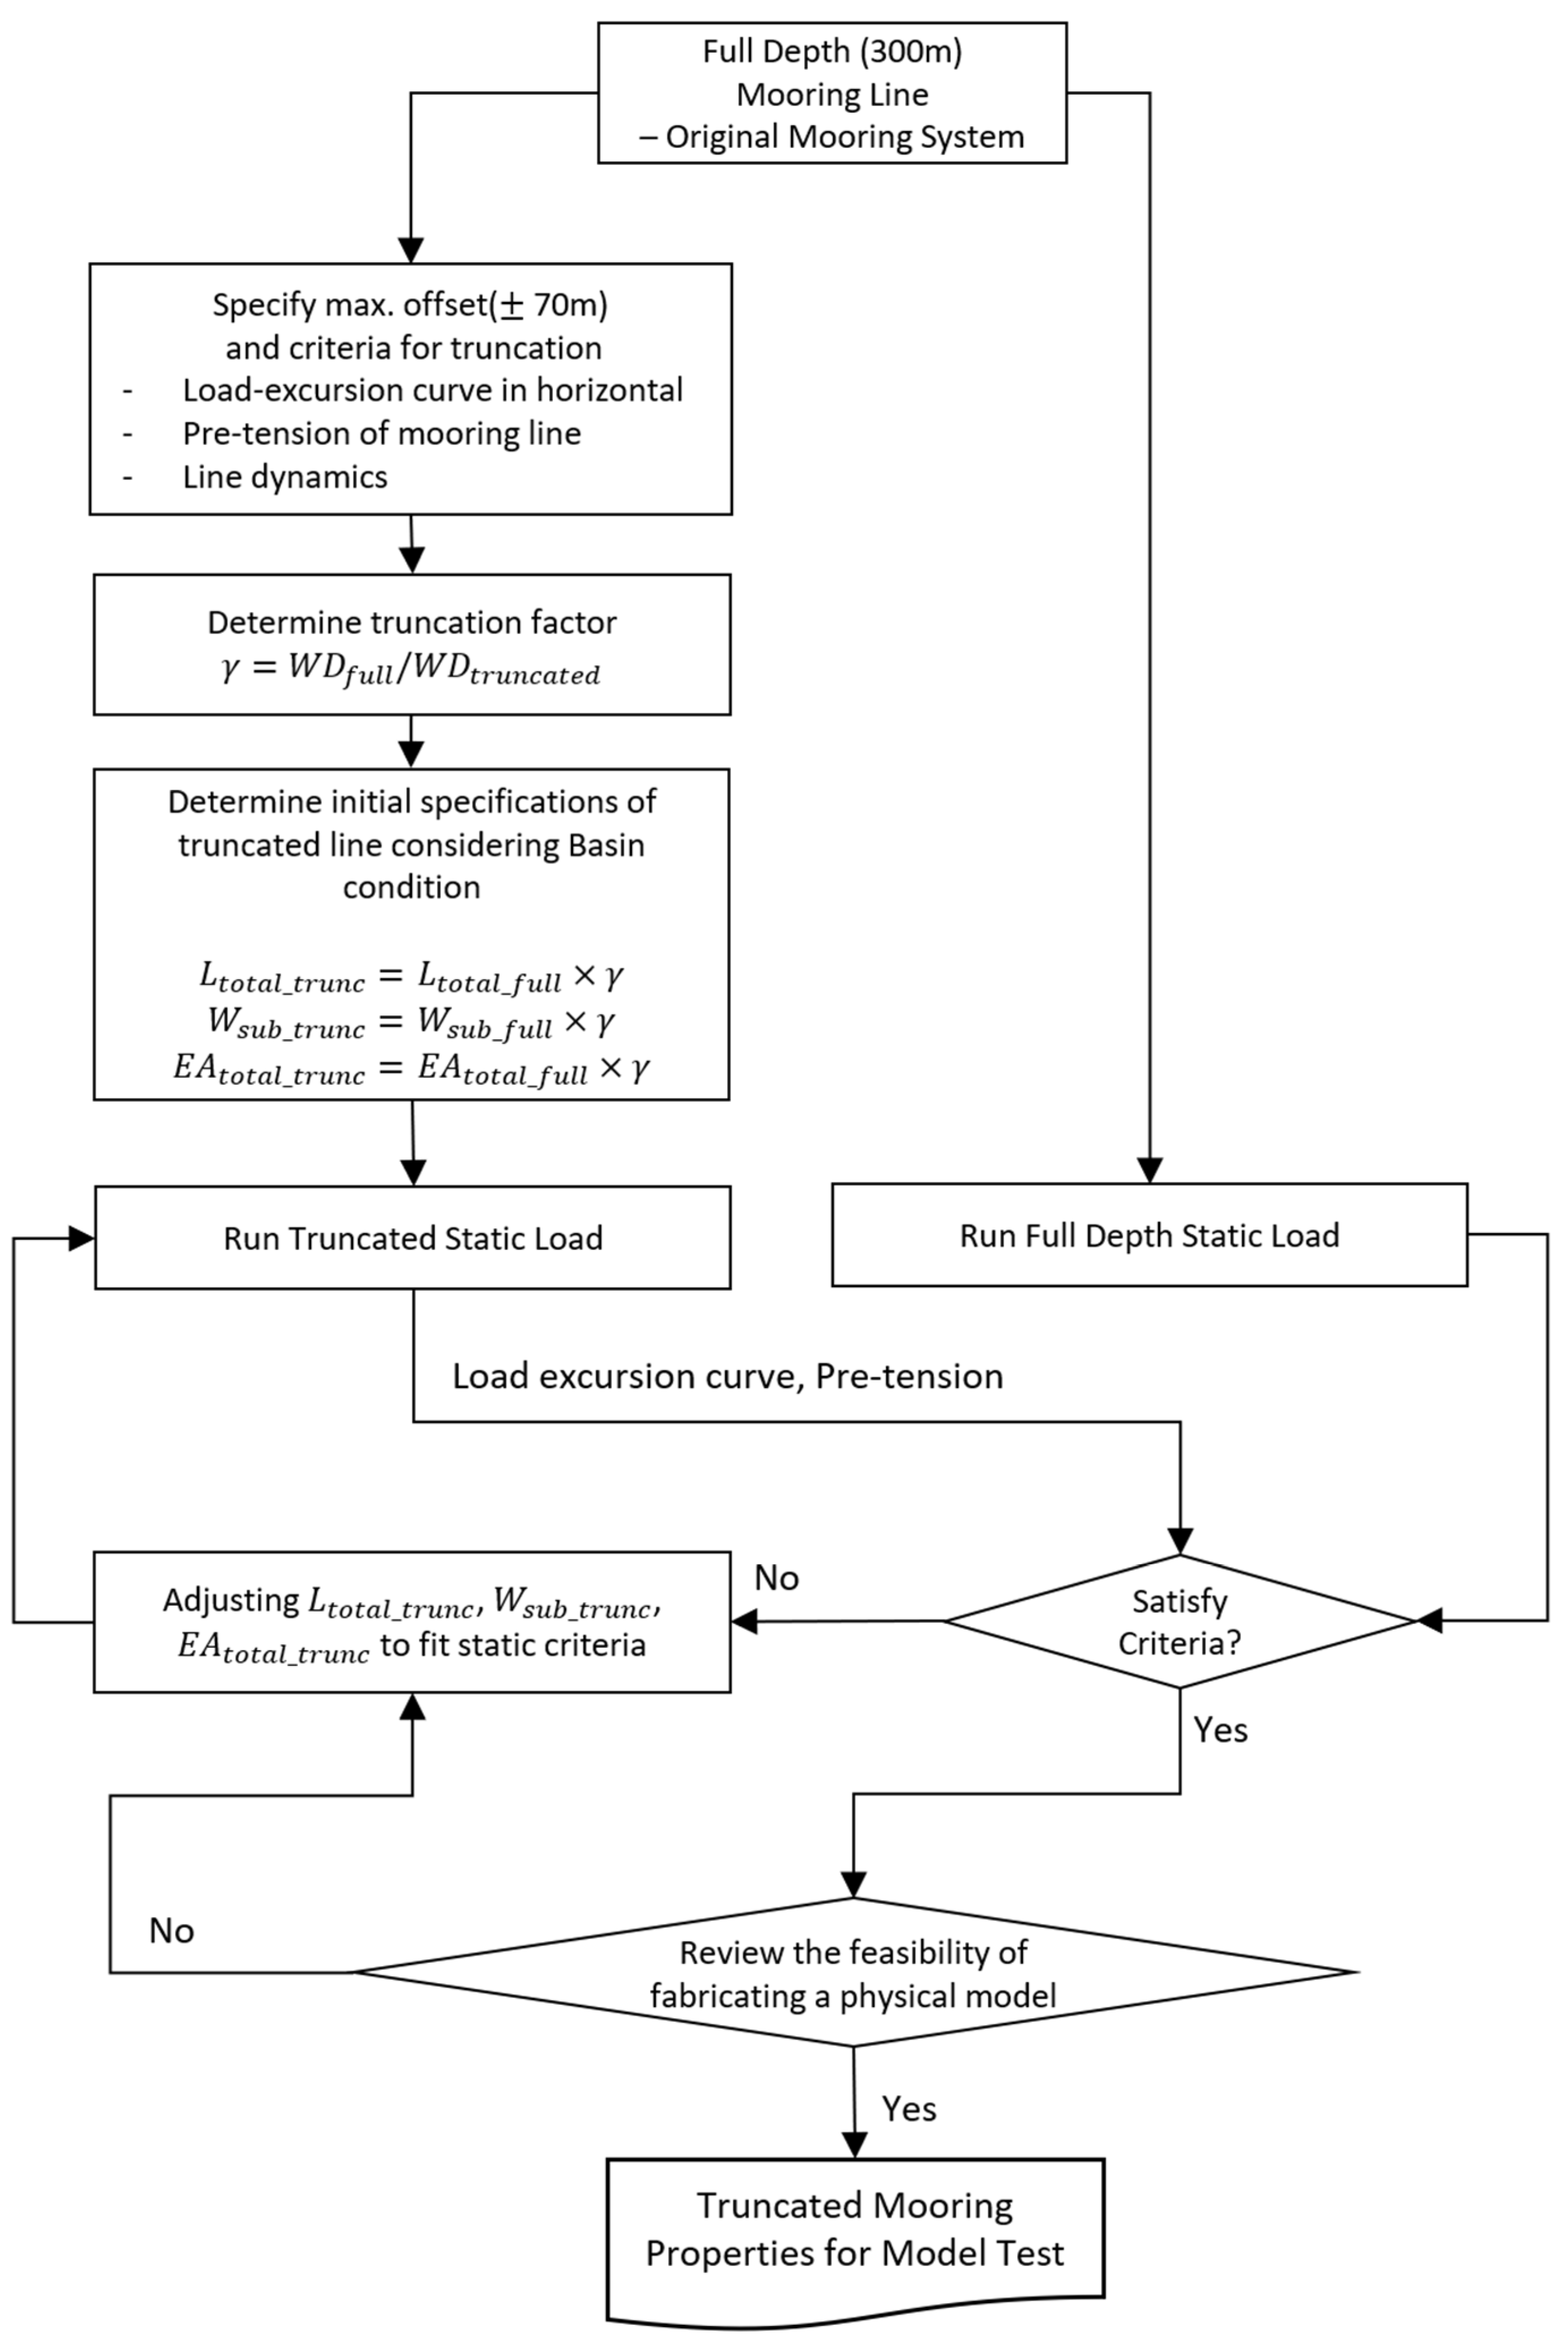
15] mention a technique for designing a truncated mooring system to suit basin conditions, as a full-depth mooring system is difficult to apply directly to a model test due to the limitations of basin size and water depth conditions. Wang et al. [
16] designed and conducted a station-keeping performance evaluation of truncated mooring systems at two water depths, 736 m and 460 m, for FPSO with a turret mooring system in 914 m of water depth. The truncated mooring system was designed to be as similar as possible to the original mooring system in terms of static and dynamic characteristics, dynamic characteristics of the floater and tension characteristics of each mooring line. The truncation factor was defined as the ratio of the original mooring system to the truncated mooring system in water conditions, and the results showed relatively good agreement with the original mooring system results when the truncation factor was large, which is 736 m water depth condition.
Waals and Dijk [
17] discuss the design technique of a truncated mooring system for performing mooring system model tests. The design of a truncated mooring system is carried out in two steps to design a truncated mooring system similar to a full-depth mooring system under static and dynamic conditions. First, the optimum design conditions are found for static loading conditions with variations in mooring length, weight in water and axial stiffness, and then the optimum design conditions are found for dynamic loading conditions with variations in mooring weight and diameter. It is also mentioned that for floating platforms with lower vertical restoring coefficient, it is necessary to consider the coupling behavior due to the mooring system. This is because the pre-tension angle changes of the mooring line when moving in the surge direction, and this induces a pitch moment. Li et al. [
18] investigated the effect of the horizontal and vertical stiffness of the mooring system on the estimation of the air gap of a semi-submersible. In the model test, three wave probes were installed to measure the relative wave height and the air gap was estimated. The results of the model test showed that the effect of horizontal stiffness on the air gap was significant. The effect of vertical stiffness was investigated using the ratio of the heave restoring coefficient of the floater to the vertical stiffness of the mooring. The effect of air gap was insignificant when the vertical stiffness of the mooring was small compared to the heave restoring coefficient, but the effect of air gap was significant when the vertical stiffness of the mooring was large compared to the heave restoring coefficient.
This research investigates the coupling effects of surge and pitch motions of a moored semi-submersible used for offshore development. Column structures such as semi-submersibles are characterized by a small waterplane area, resulting in small heave, roll and pitch restoring coefficients and a long natural period of each motion. In the case of roll and pitch motions with long natural periods, such as a semi-submersible, the pitch motion caused by the 2nd order component is important in addition to the wave frequency component. In addition, the pitch motion of a semi-submersible is inevitably affected by the vertical force of the mooring system, and the greater the surge motion, the greater the force of the mooring system and, therefore, the greater the effect on the pitch motion.
In this study, K-Semi, a KRISO standard offshore structure, was used as a target offshore structure for model testing to evaluate the dynamic behavior of K-Semi in a truncated mooring system in the Deep Ocean Engineering Basin of KRISO, Busan, and the results were compared with frequency and time domain numerical analyses. Model tests and numerical analyses were used to investigate the wave frequency and low-frequency motions caused by the second-order wave force of the K-Semi and the low-frequency pitch motion of the semi-submersible influenced by the mooring system as the platform drifted away. The three main components (wave frequency motion, 2nd order motion and low-frequency motion due to surge drift motion) of the pitch motion appear through spectrum analysis of the pitch time series measured in the model test. These pitch motions coupled with surge motions can cause higher relative wave heights on the semi-submersible. The relative wave height on an offshore structure is a major factor that can cause impact loads on the structure, so it should be treated as an important issue.
4. Comparison Result between Model Test and Analysis
4.1. Free Decay Test
To investigate the motion characteristics of the K-Semi connected to the truncated mooring system, a decay test and regular wave model test were performed to measure the six-degrees-of-freedom motion of the K-semi.
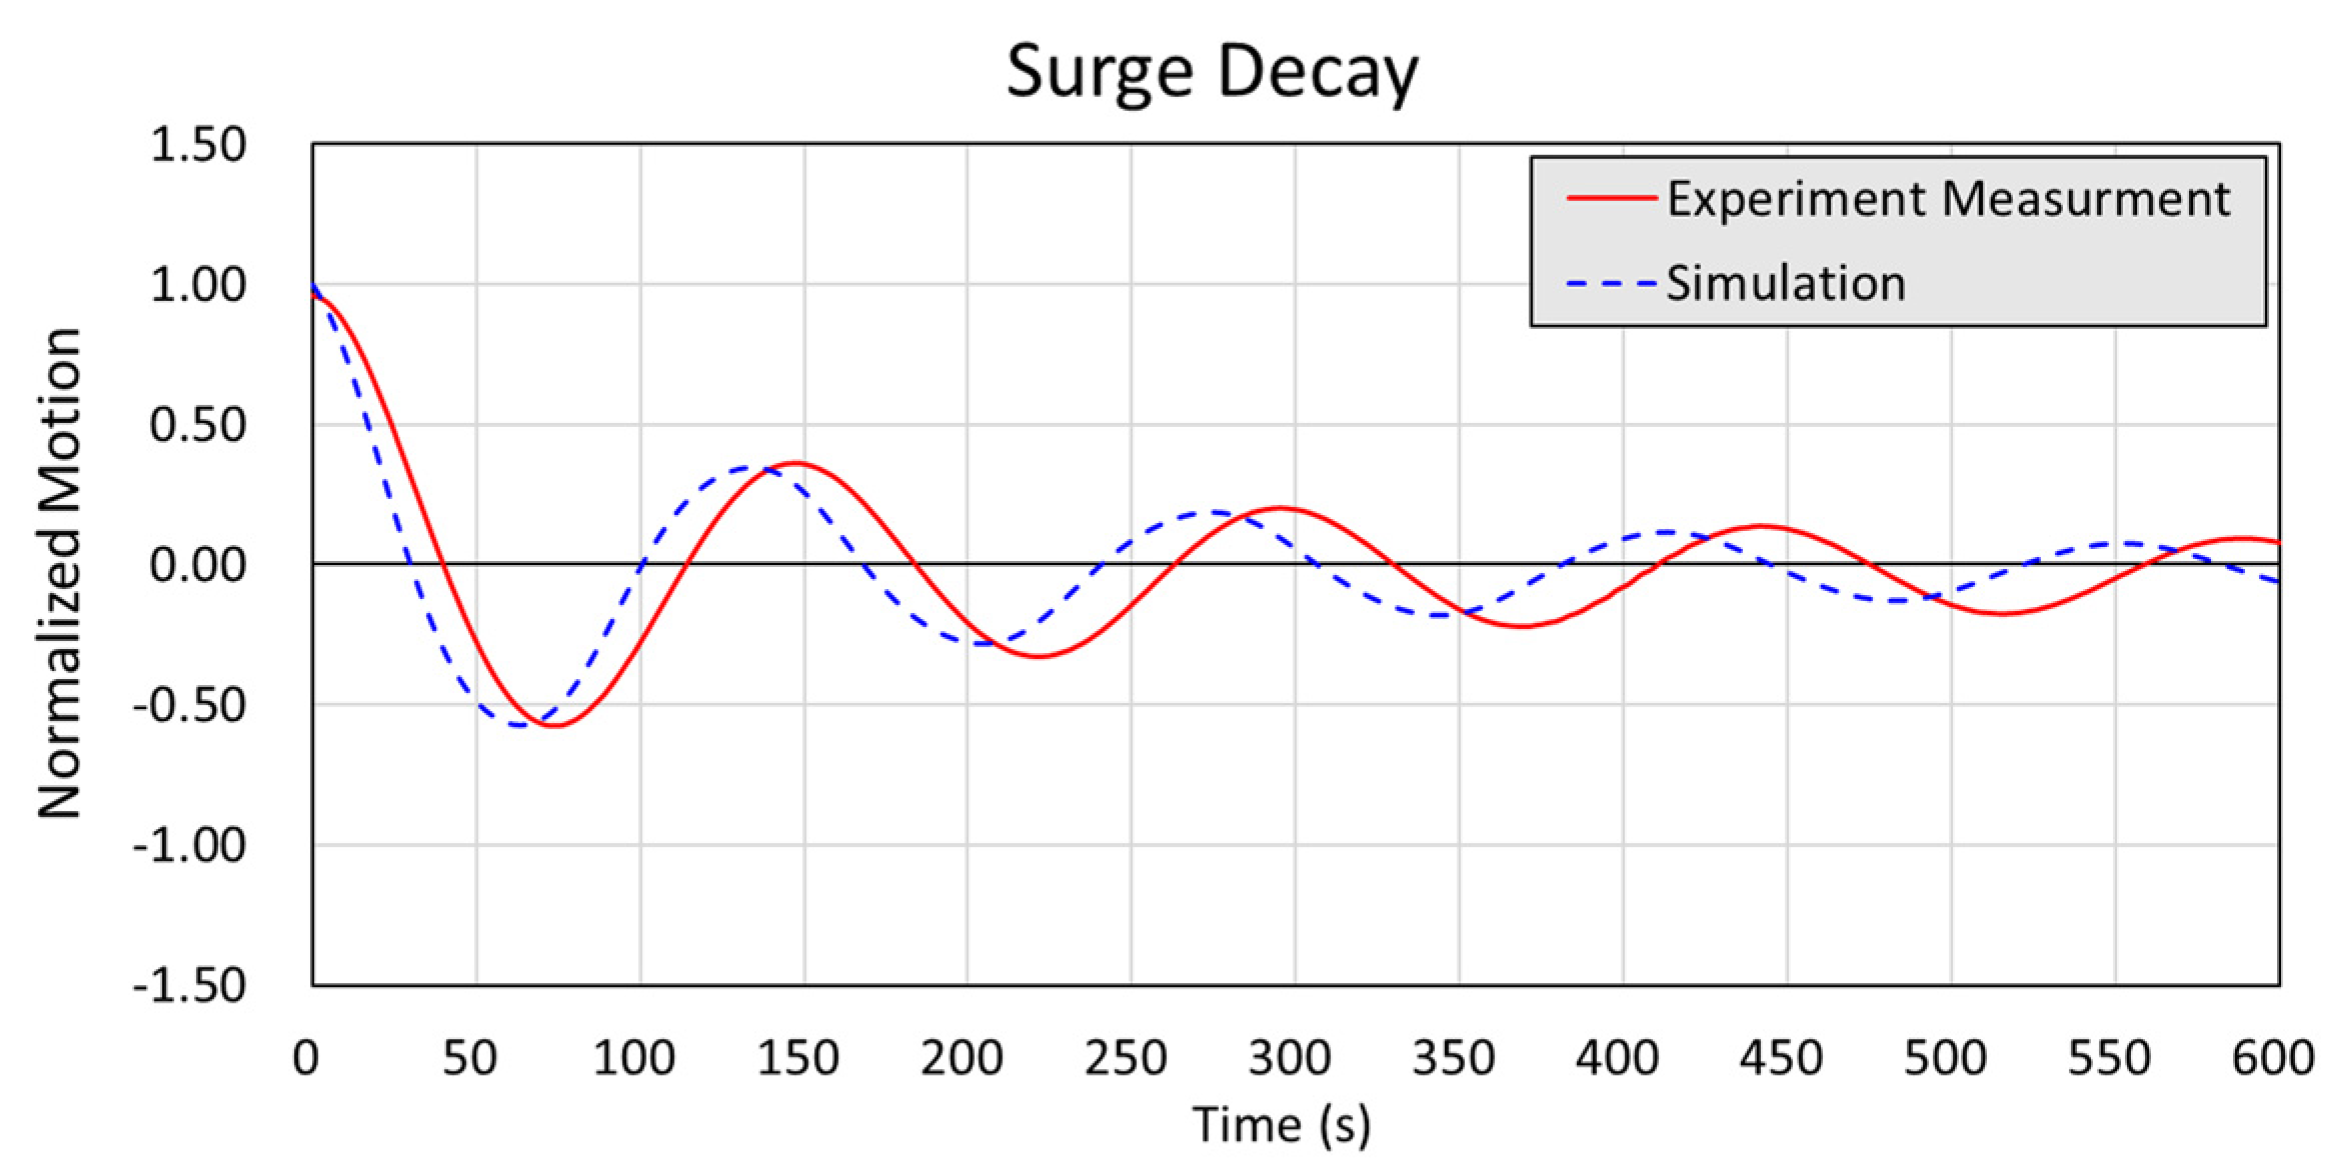
A six-degrees-of-freedom motion was performed in the decay test, and the results of the surge motion are shown in
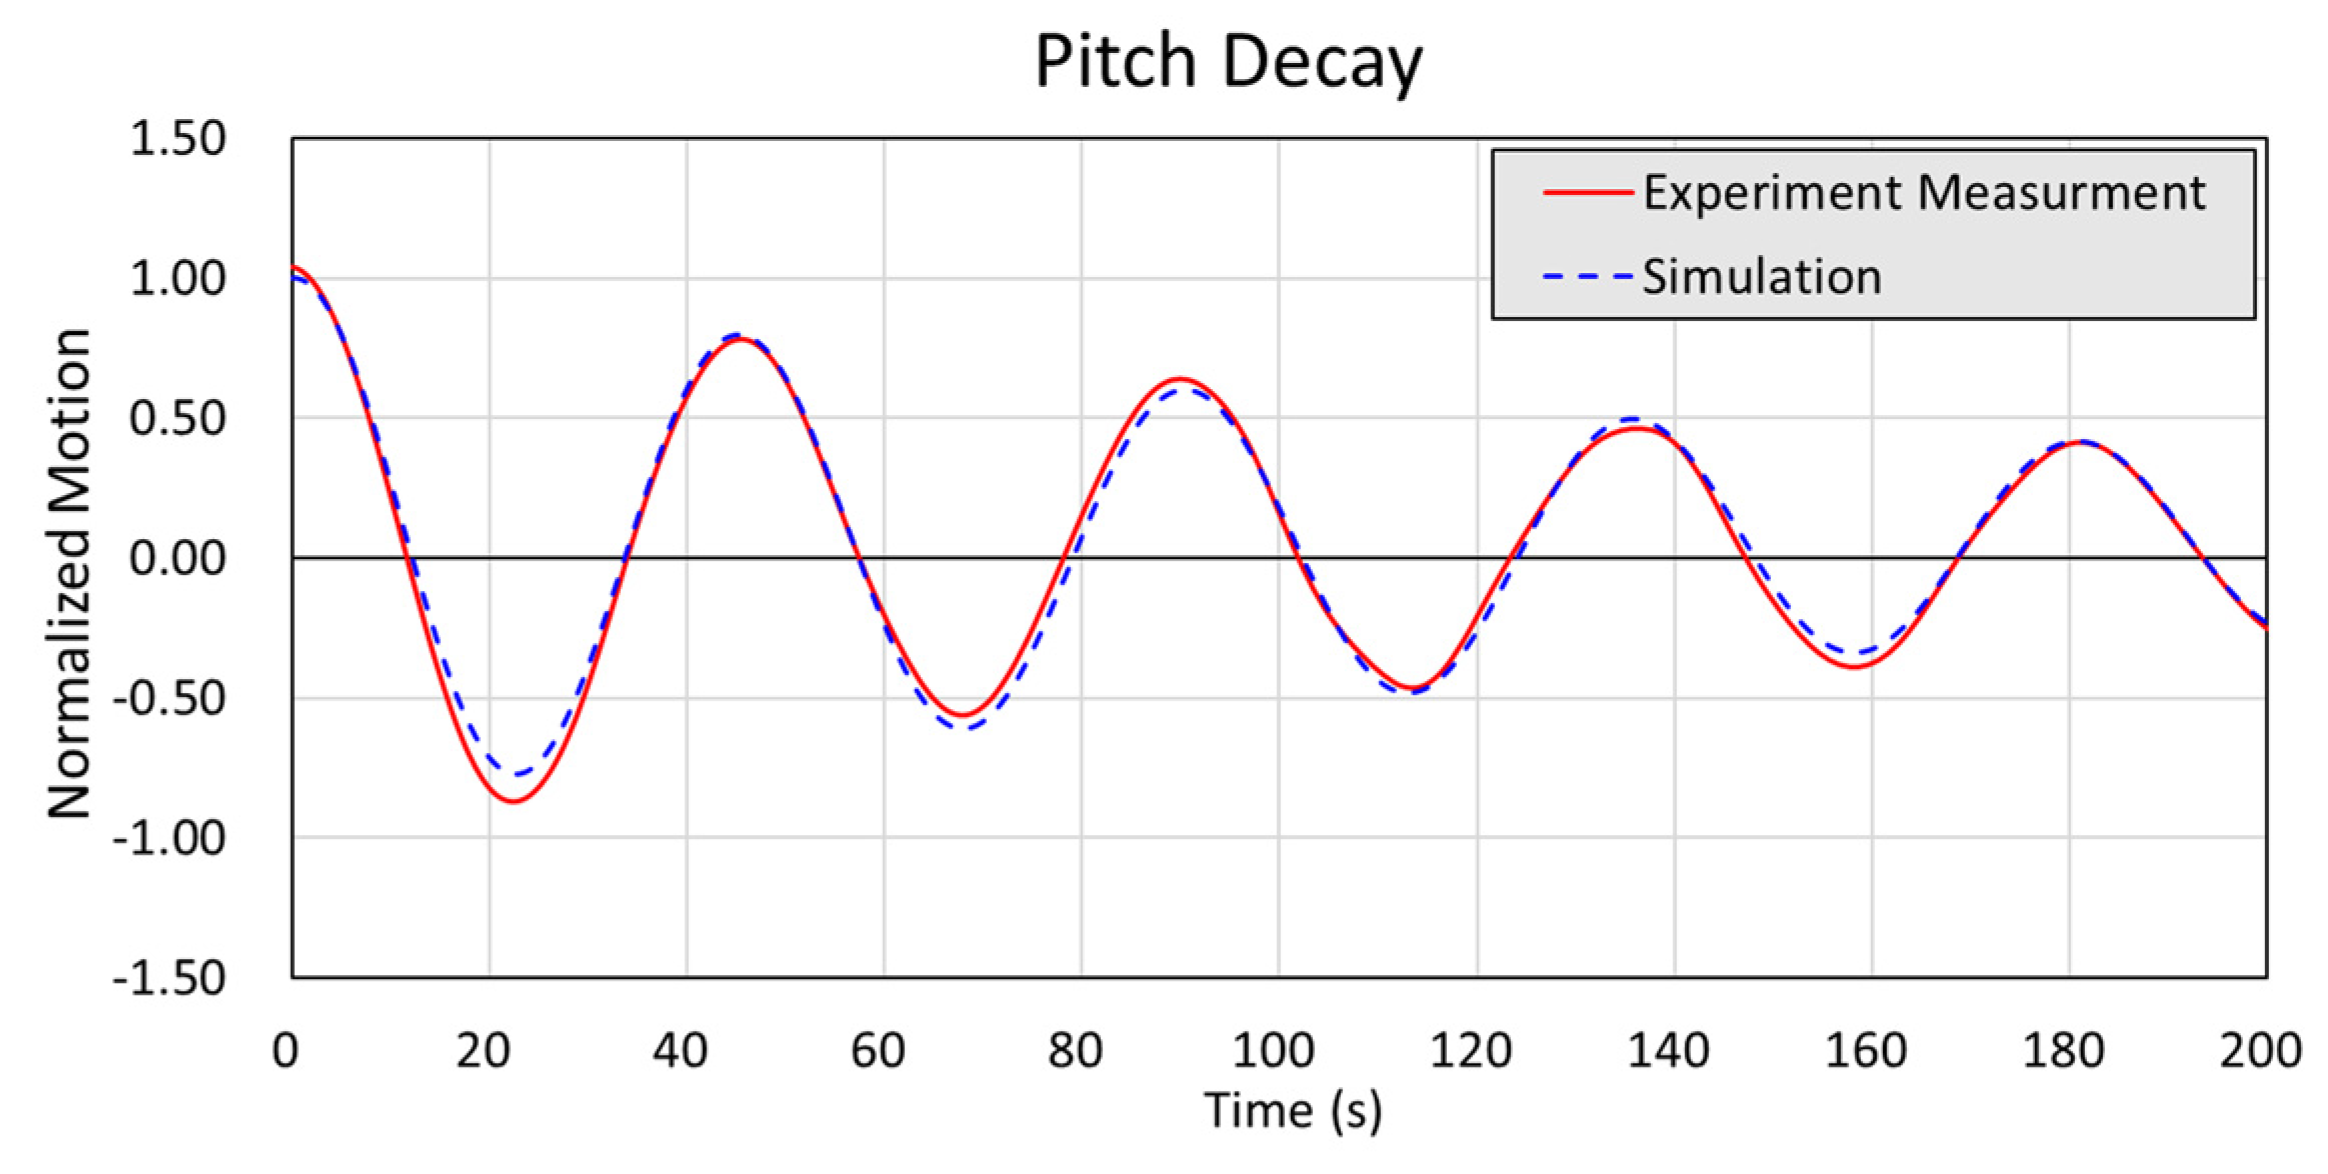
Figure 13. The pitch motion results, which are of interest in this study, are shown in
Figure 14. These are normalized with respect to the initial values and are compared with the results of the numerical analysis. In K–Semi’s numerical model, the damping coefficients for the floating body were chosen such that they had the same motion characteristics as in the experimental results. The initial damping coefficients were estimated using the free-decay model test to determine the linear and nonlinear damping coefficients. These were then incorporated into the numerical analysis. To ensure accurate representation, the model test time series was used, and adjustments were made through the trial-error method until a match was achieved. The free decay analysis results are similar to those of the model test for the pitch motion time series. However, variations in the periods of the surge motion are observed. It is believed that this is due to the difference in the added mass of the mooring line considered in the time domain analysis model and the influence of the low-frequency motion caused by the fluid drag component of the floating body and mooring, which is not considered in this study [
9].
4.2. Regular Wave Test
To investigate the six-degrees-of-freedom motion characteristics of K-Semi, a model test under regular waves. The test included 10 different periods, each with a wave height of 5 m and 180° incident wave. Details of this condition in full scale are presented in
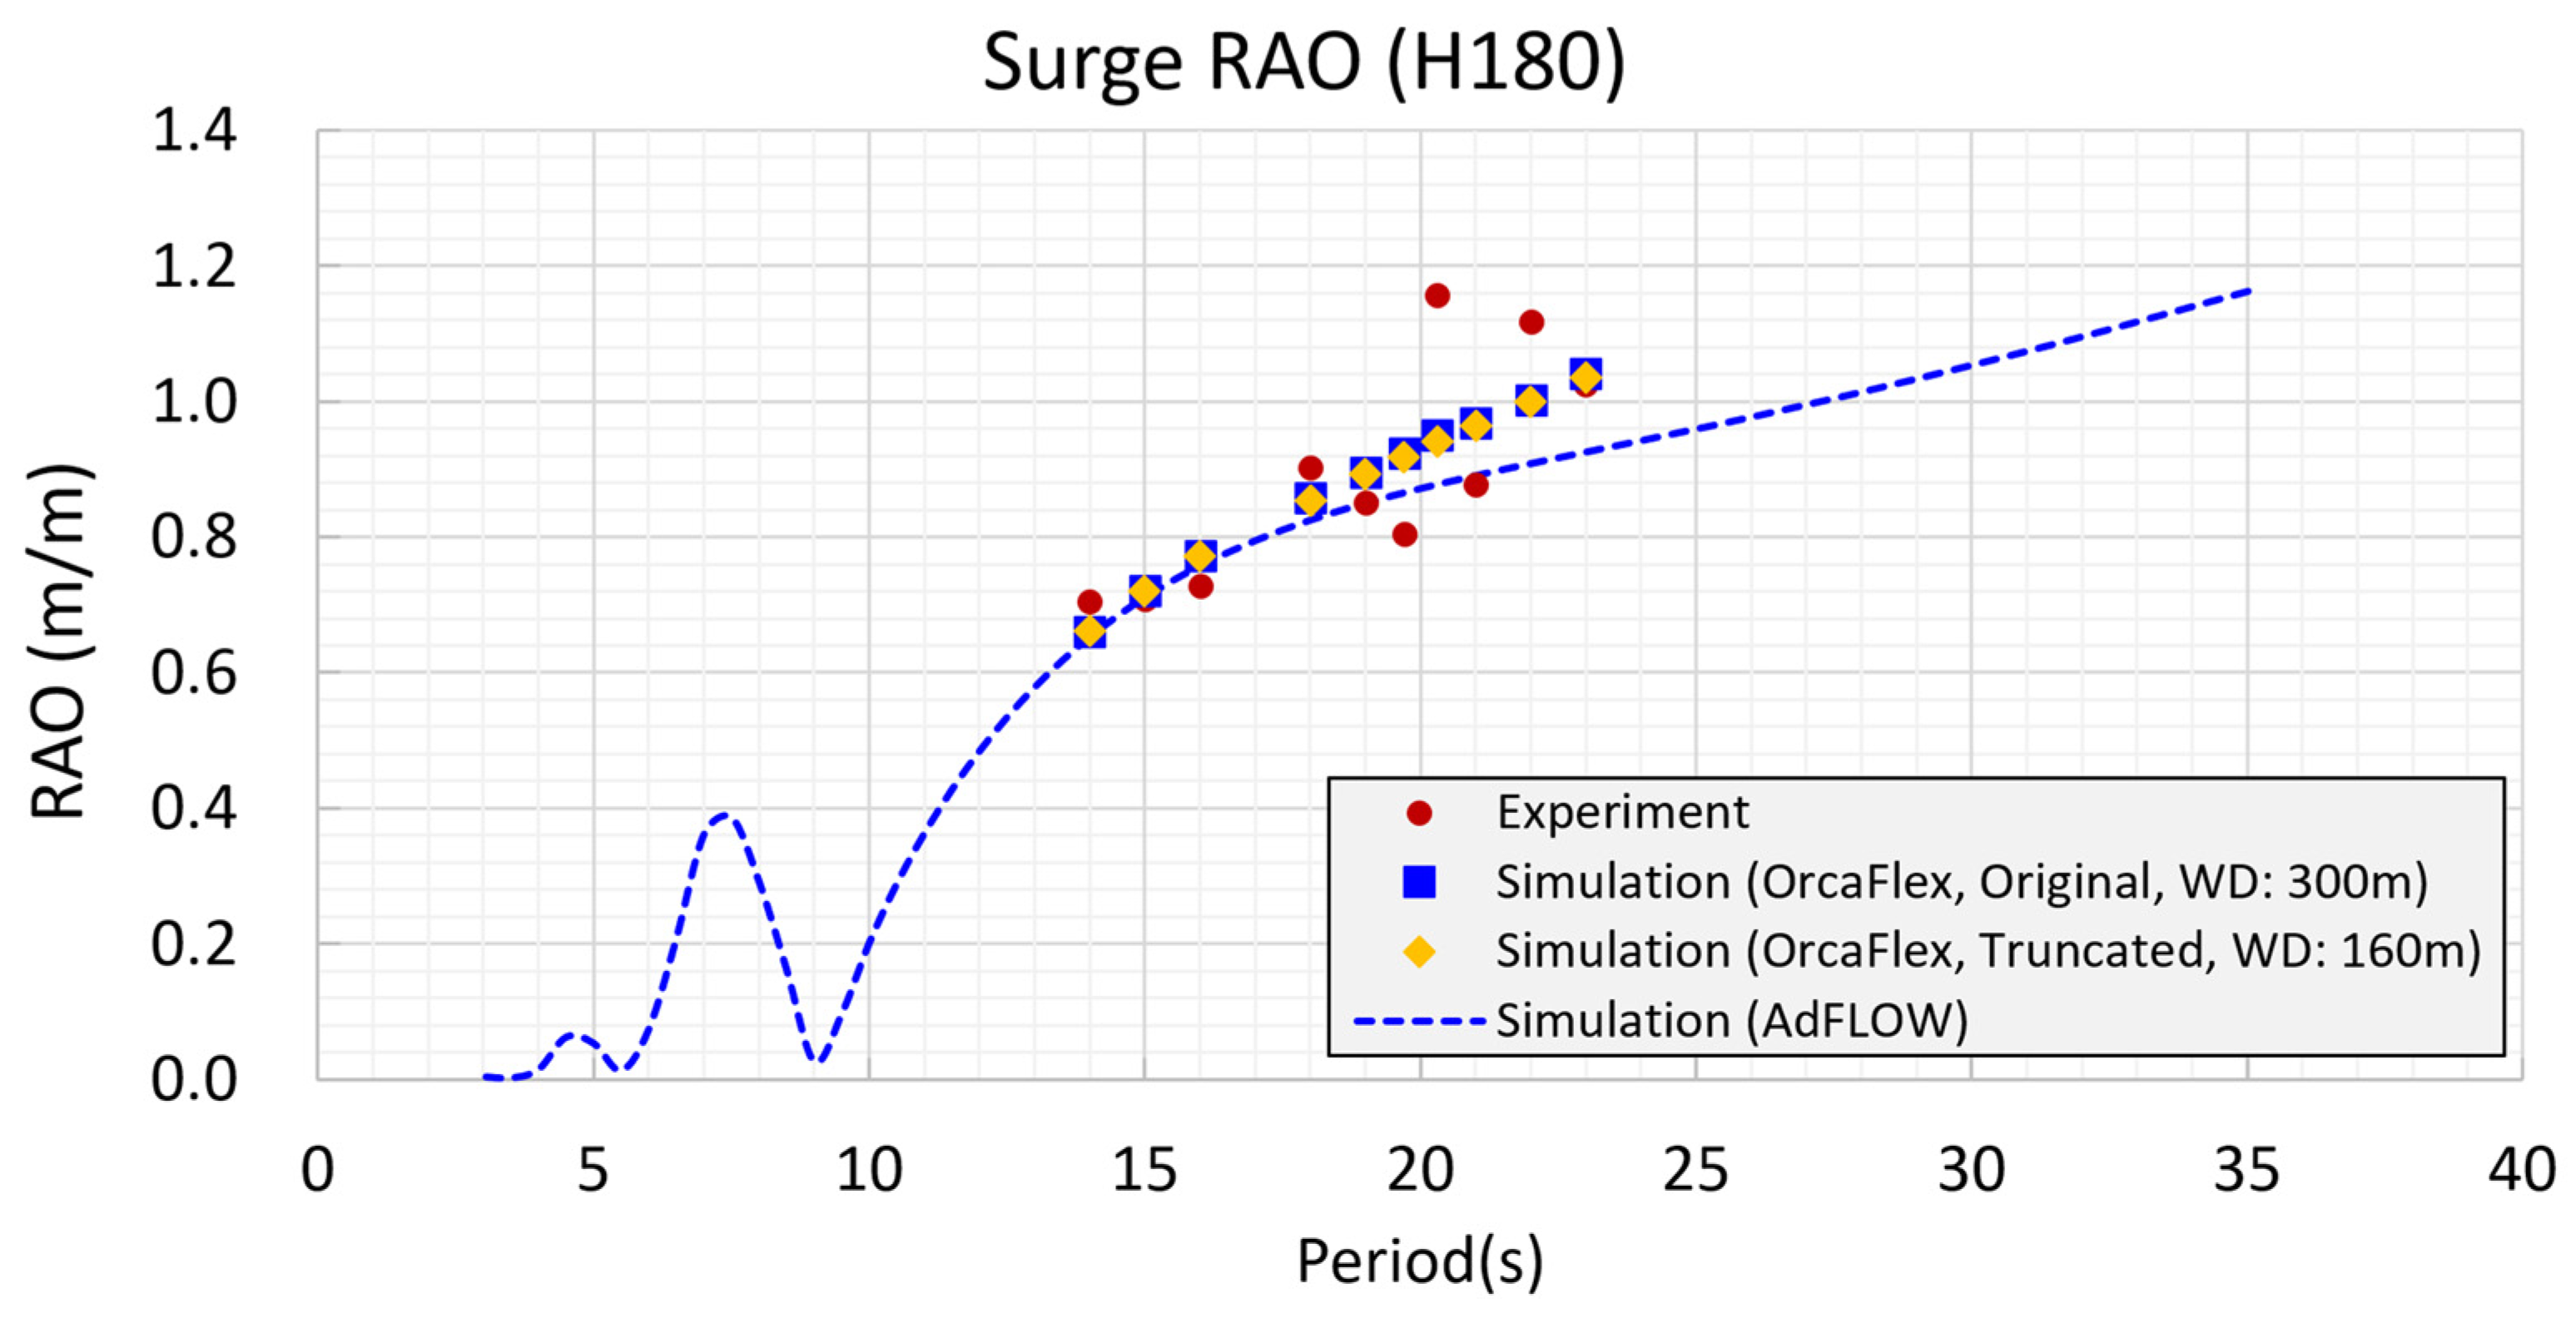
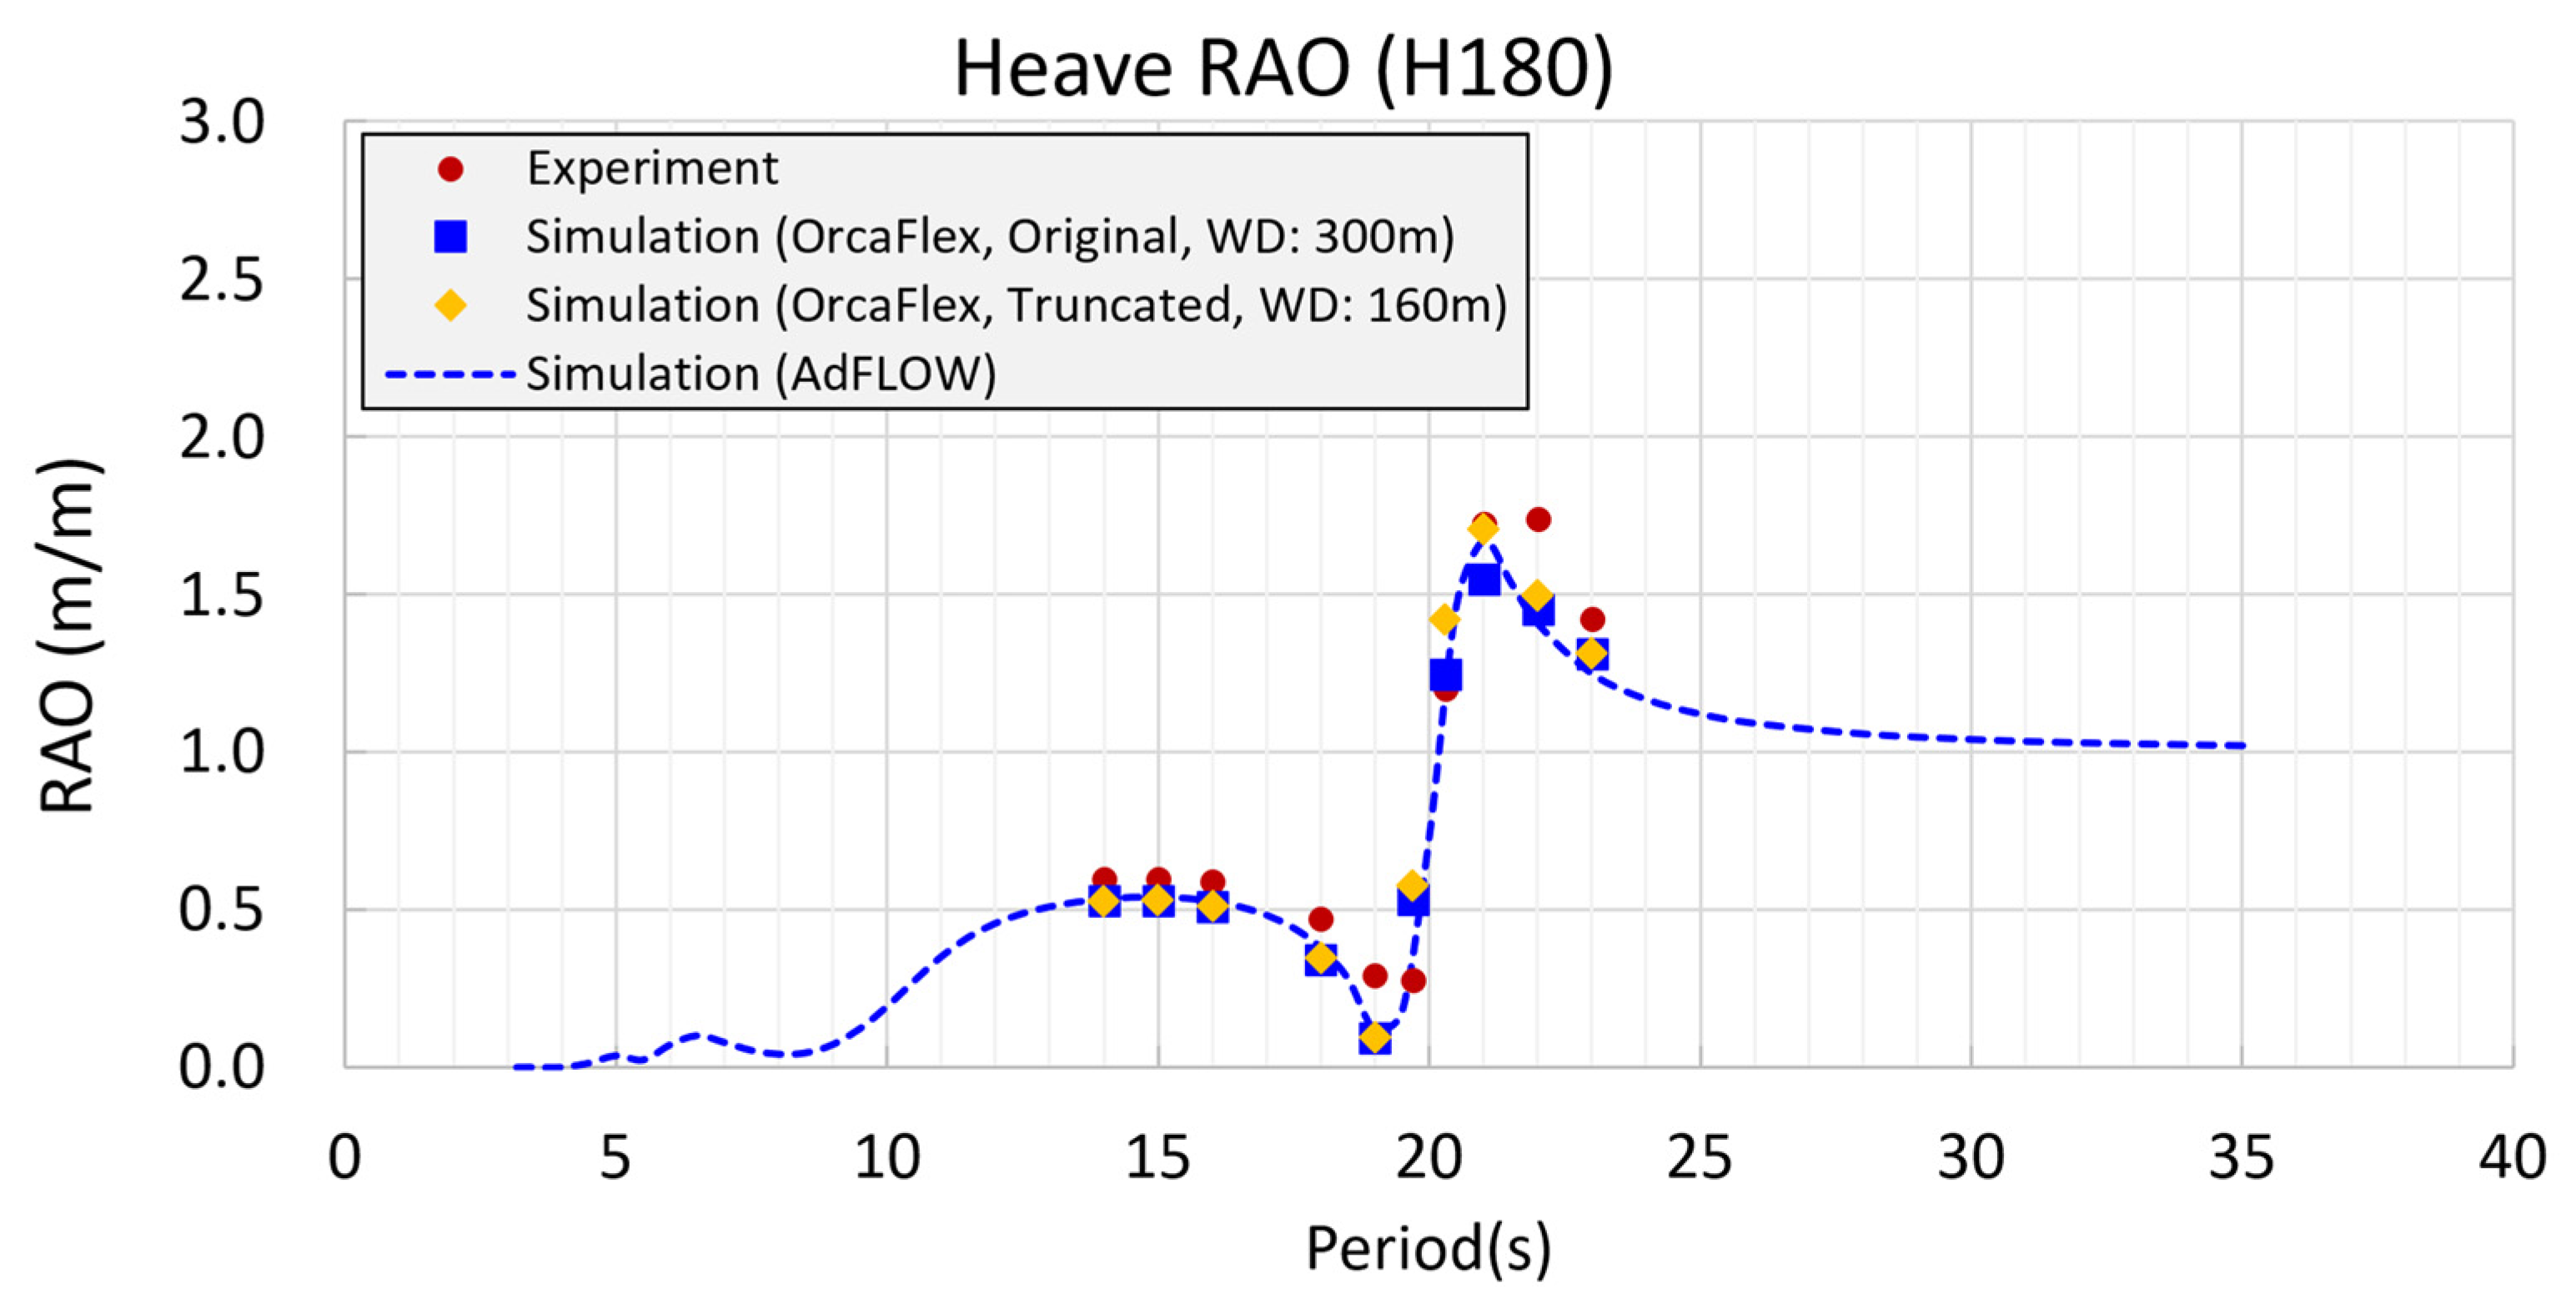
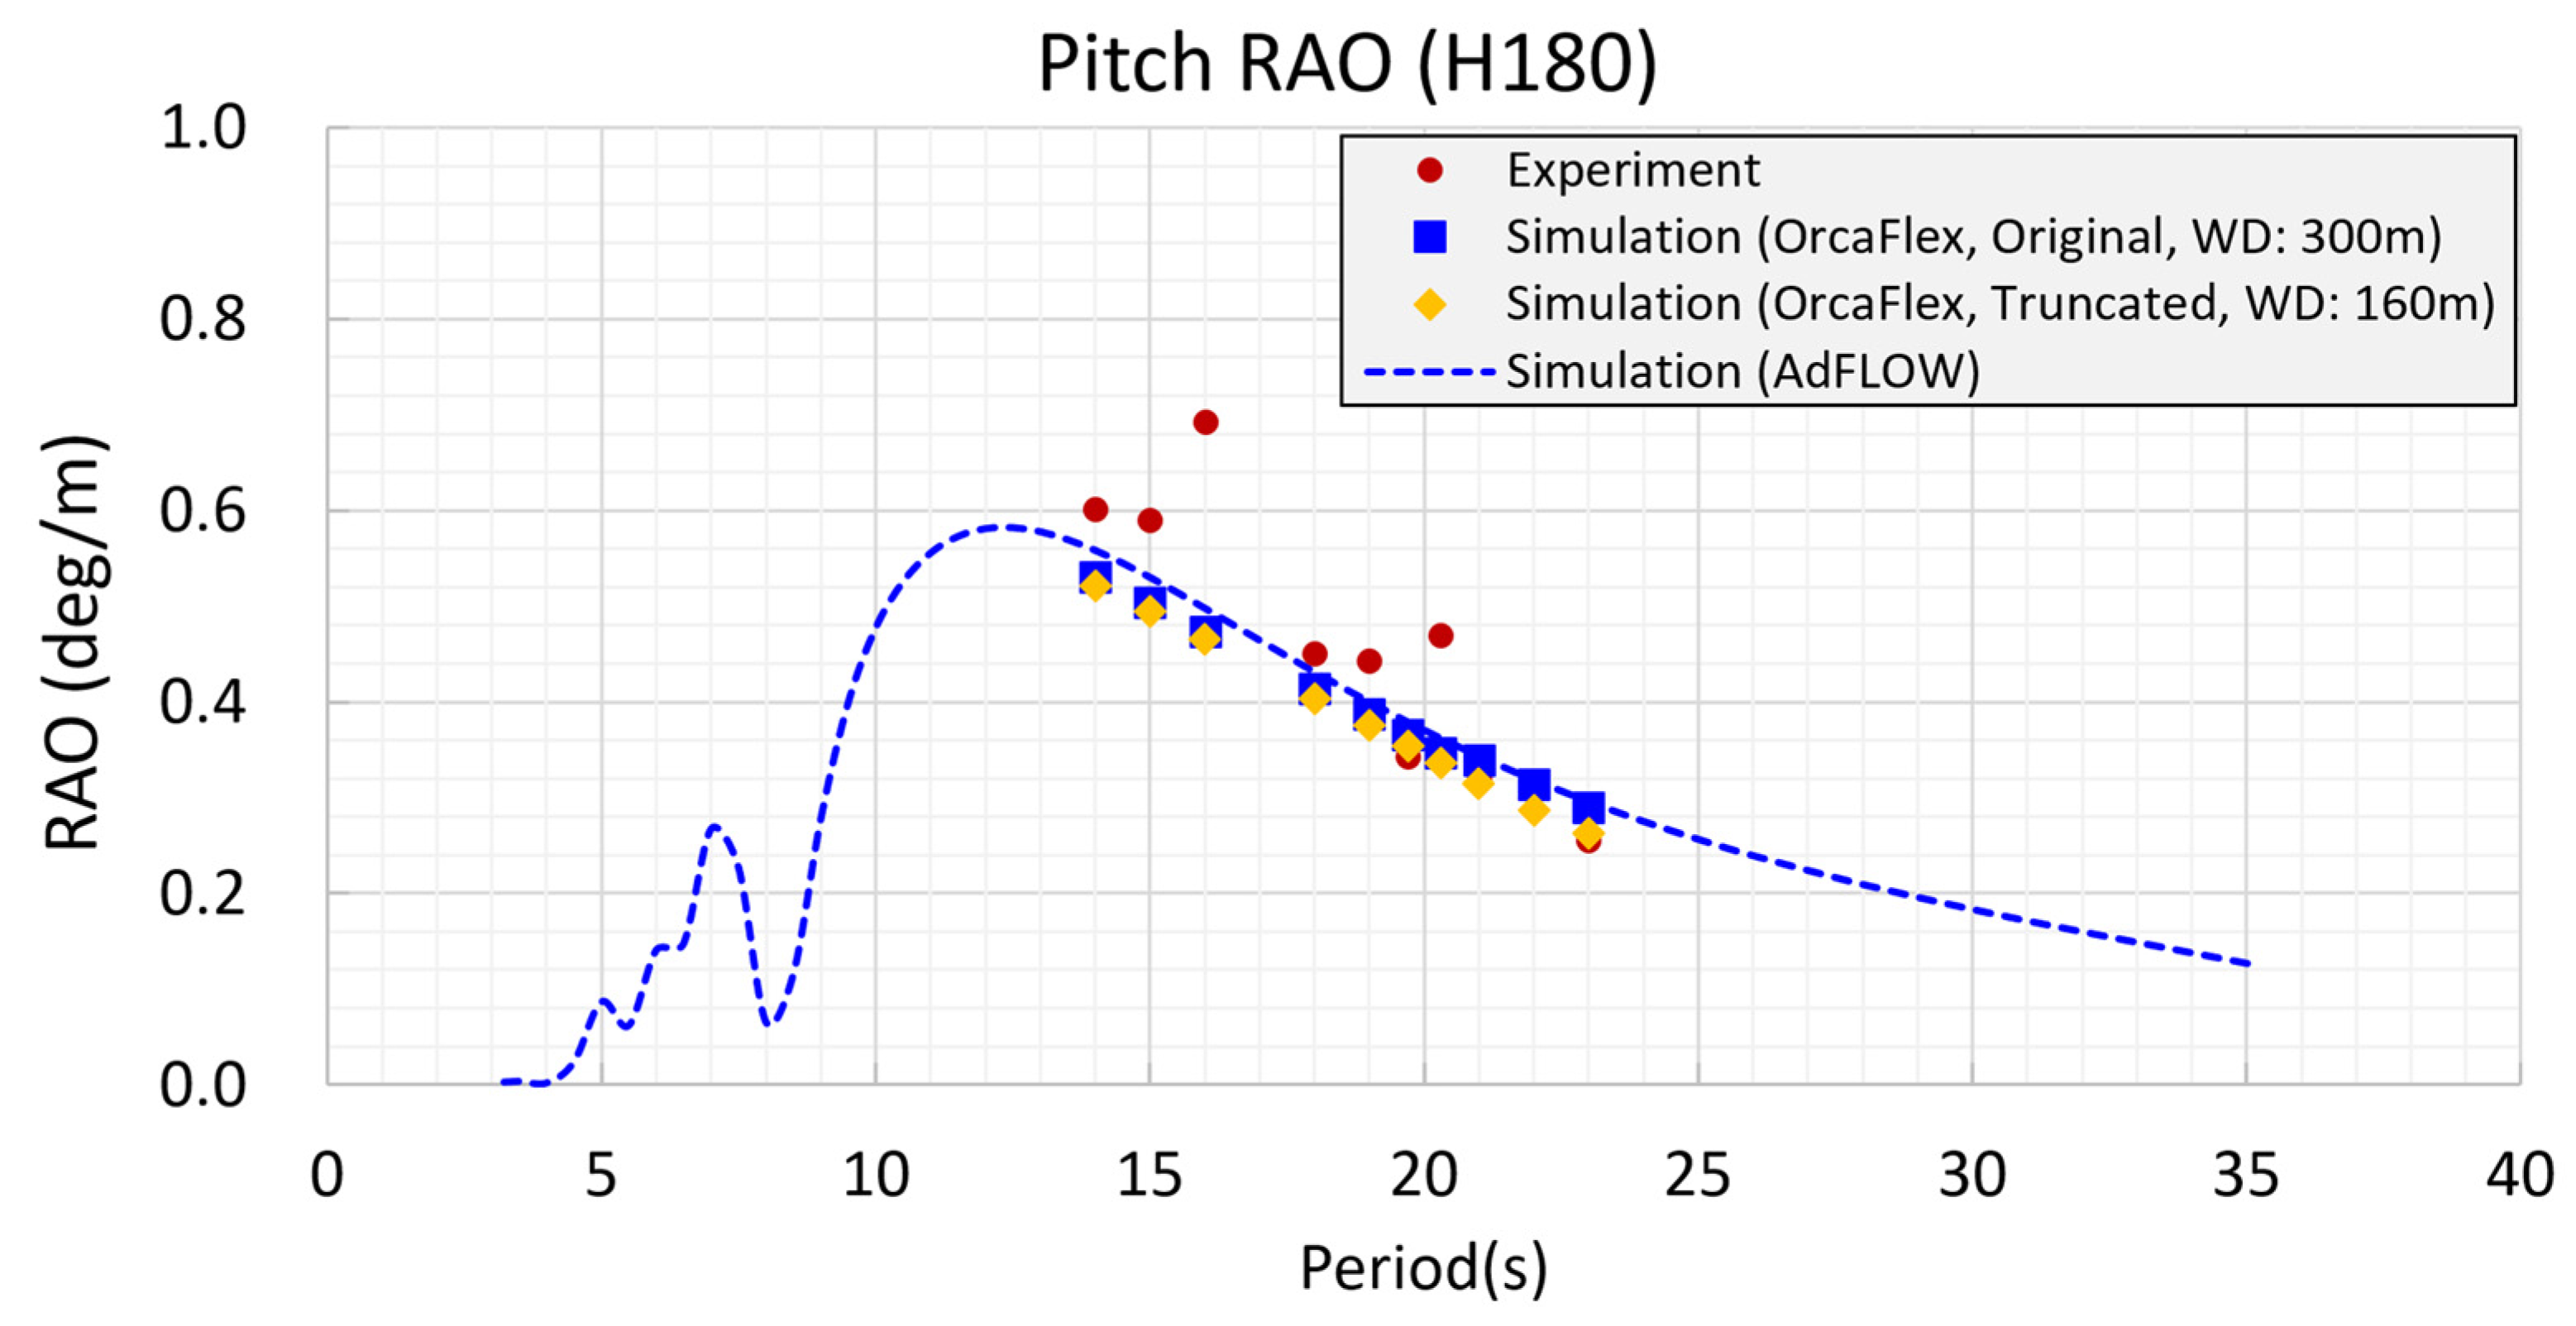
Table 3. The measured motion response of the model test was normalized with respect to the height of the incident wave to obtain the RAO under the incident wave period condition. A comparison between the results of the model test and those of the numerical analysis, both in the time and frequency domains, for the surge, heave, and pitch motions are presented in
Figure 15,
Figure 16 and
Figure 17. AdFlow was used for the frequency domain analysis, whereas the time–domain analysis was the result of the original and truncated mooring systems based on the numerical model using damping results from
Section 4.1.
In summary, the results of the RAO, the model test, frequency-domain analysis, and time–domain analysis are similar. In particular, there was no significant difference in the RAO between the analysis results of the original and truncated mooring systems. The objective of the regular wave test was to investigate the motion characteristics of the K-Semi under specific wave period conditions of the incident wave. In the test, there was no significant offset in the surge direction. Consequently, the variations in the motion characteristics owing to the variations in the heave restoring force and pitch restoring moment of the original and truncated mooring systems were not significant. However, in the case of the occurrence of a low-frequency drift motion, leading to a large offset in the wave direction, the variation in the heave restoring force and pitch restoring will increase, which may affect the motion characteristics of the K-Semi.
4.3. Low-Frequency Pitch Motion by Second-Order Wave Force
Semi-submersible offshore structures have the advantage of excellent motion performance due to their small waterplane areas. In the case of K-Semi, the natural period of the heave motion is approximately 20 s, whereas the natural period of roll and pitch motions is approximately 45 s. These periods are advantageous in avoiding resonance in the 10–20 s region, where wave energy is predominantly distributed. Therefore, excellent motion performance can be expected for the K-Semi because of the avoidance of the resonance region.
The horizontal motion of a moored floating body is characterized by a long natural period, principally due to the mooring system. The motion is mainly influenced by the second-order components of the waves—the mean drift force and second-order wave drift force. For ship-shaped offshore structures, the period of the roll motion is less than 20 s. Hence, the influence of these low-frequency nonlinear waves is minimal. However, some structures with longer natural periods are known to be influenced by second-order wave components. Similarly, because the natural periods of the roll and pitch motions were greater than 45 s, these motions of a semi-submersible were expected to be affected by the second-order components of the waves. These effects can be investigated by calculating the second-order pitch moment spectrum in Equation (1) using the QTF and the wave spectrum. The spectral density of the second-order motion can be calculated using Equation (2), and the standard deviation of the pitch motion due to the nonlinear wave component can be derived from Equation (3) [
21].
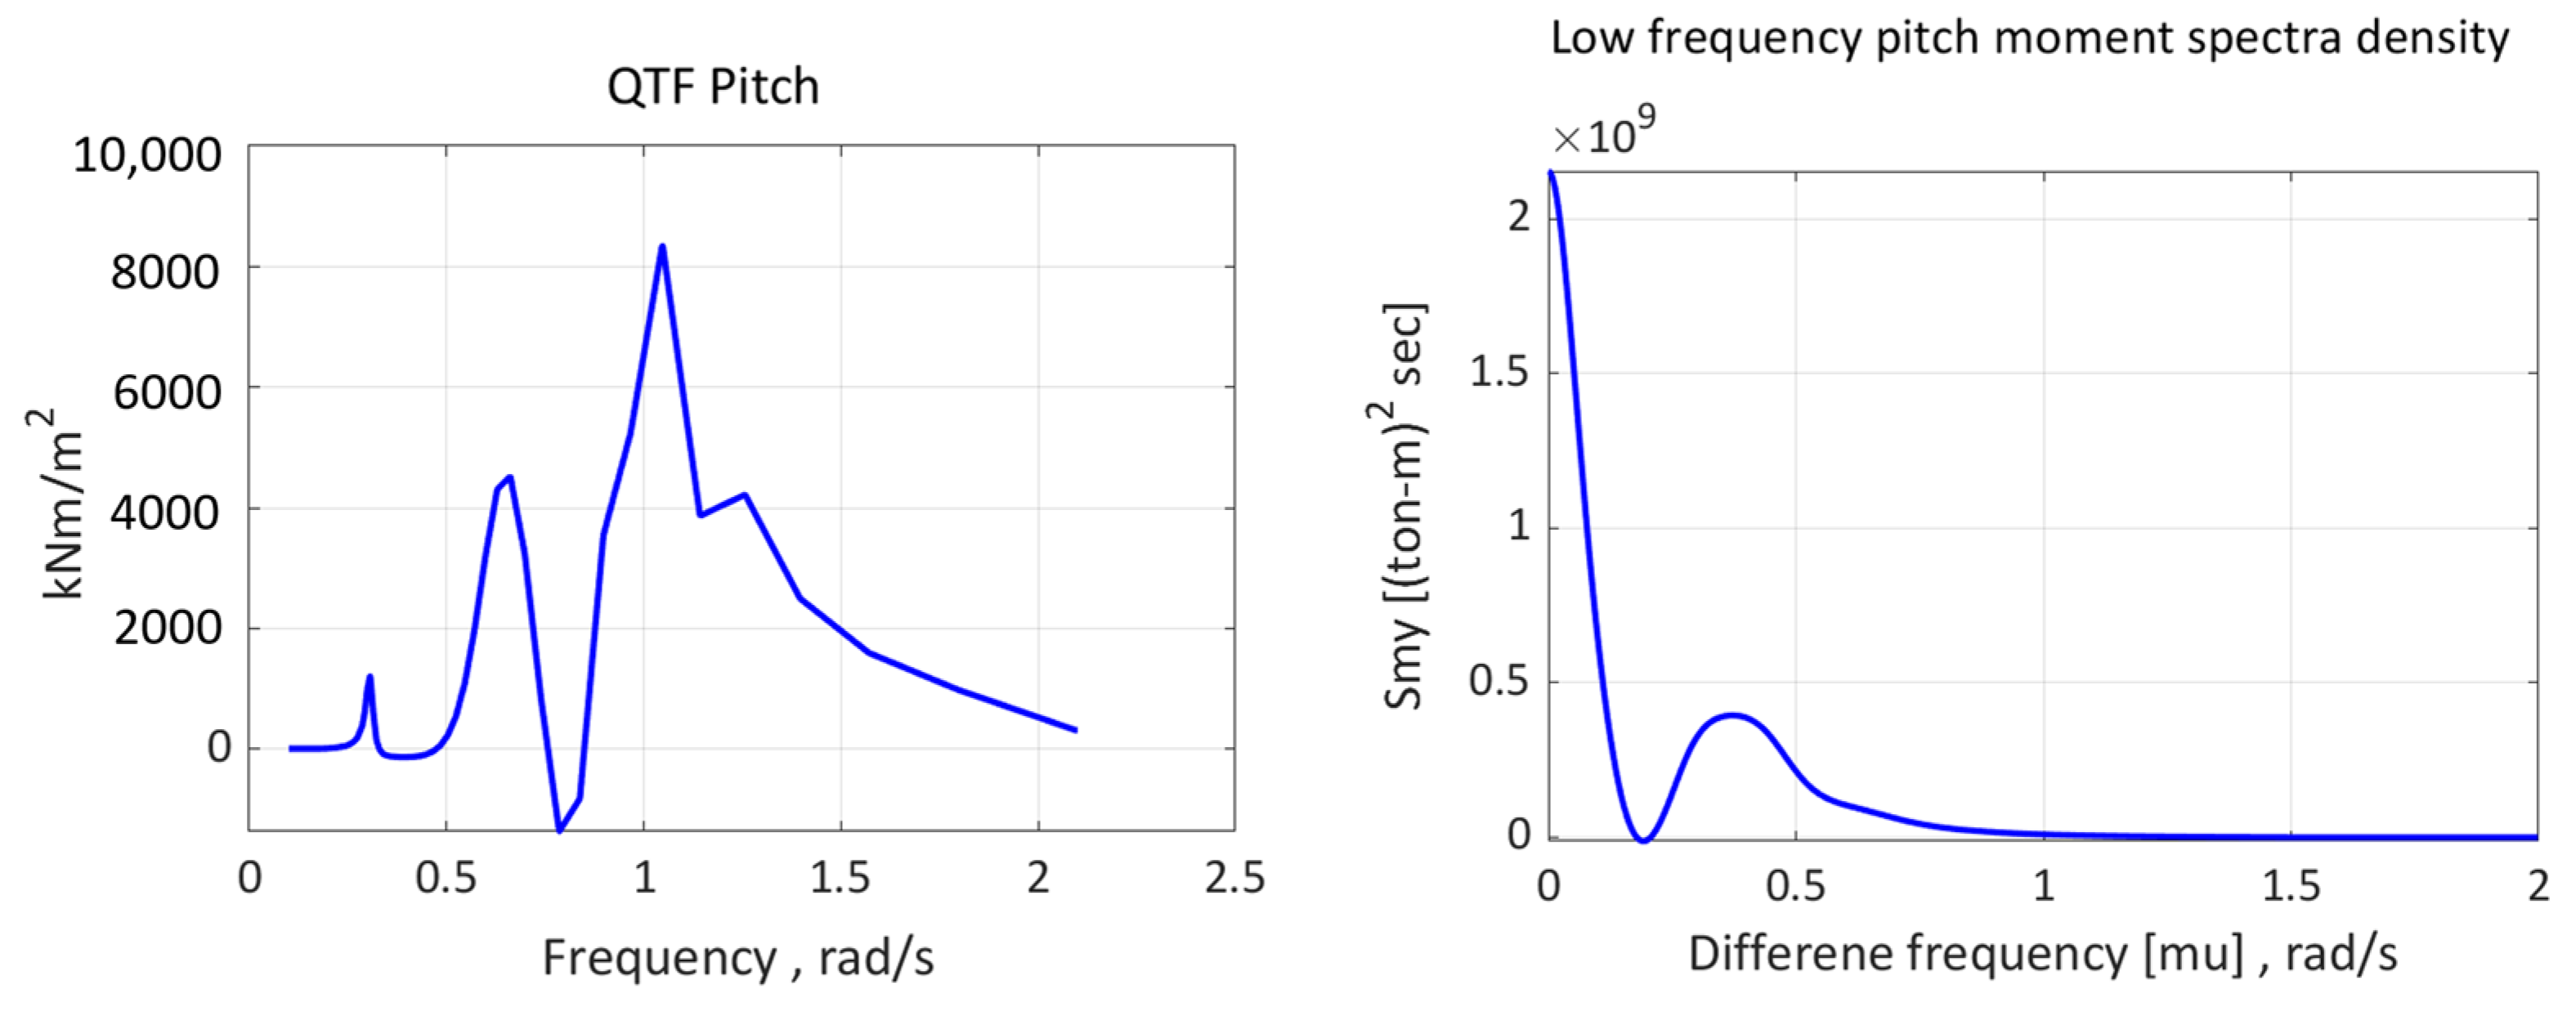
The left-hand side of
Figure 18 shows the QTF analysis result of the second-order wave force for the pitch motion of K-Semi using AdFlow, and the right-hand side shows the low-frequency pitch moment spectral density result of K-Semi obtained using Equation (2).
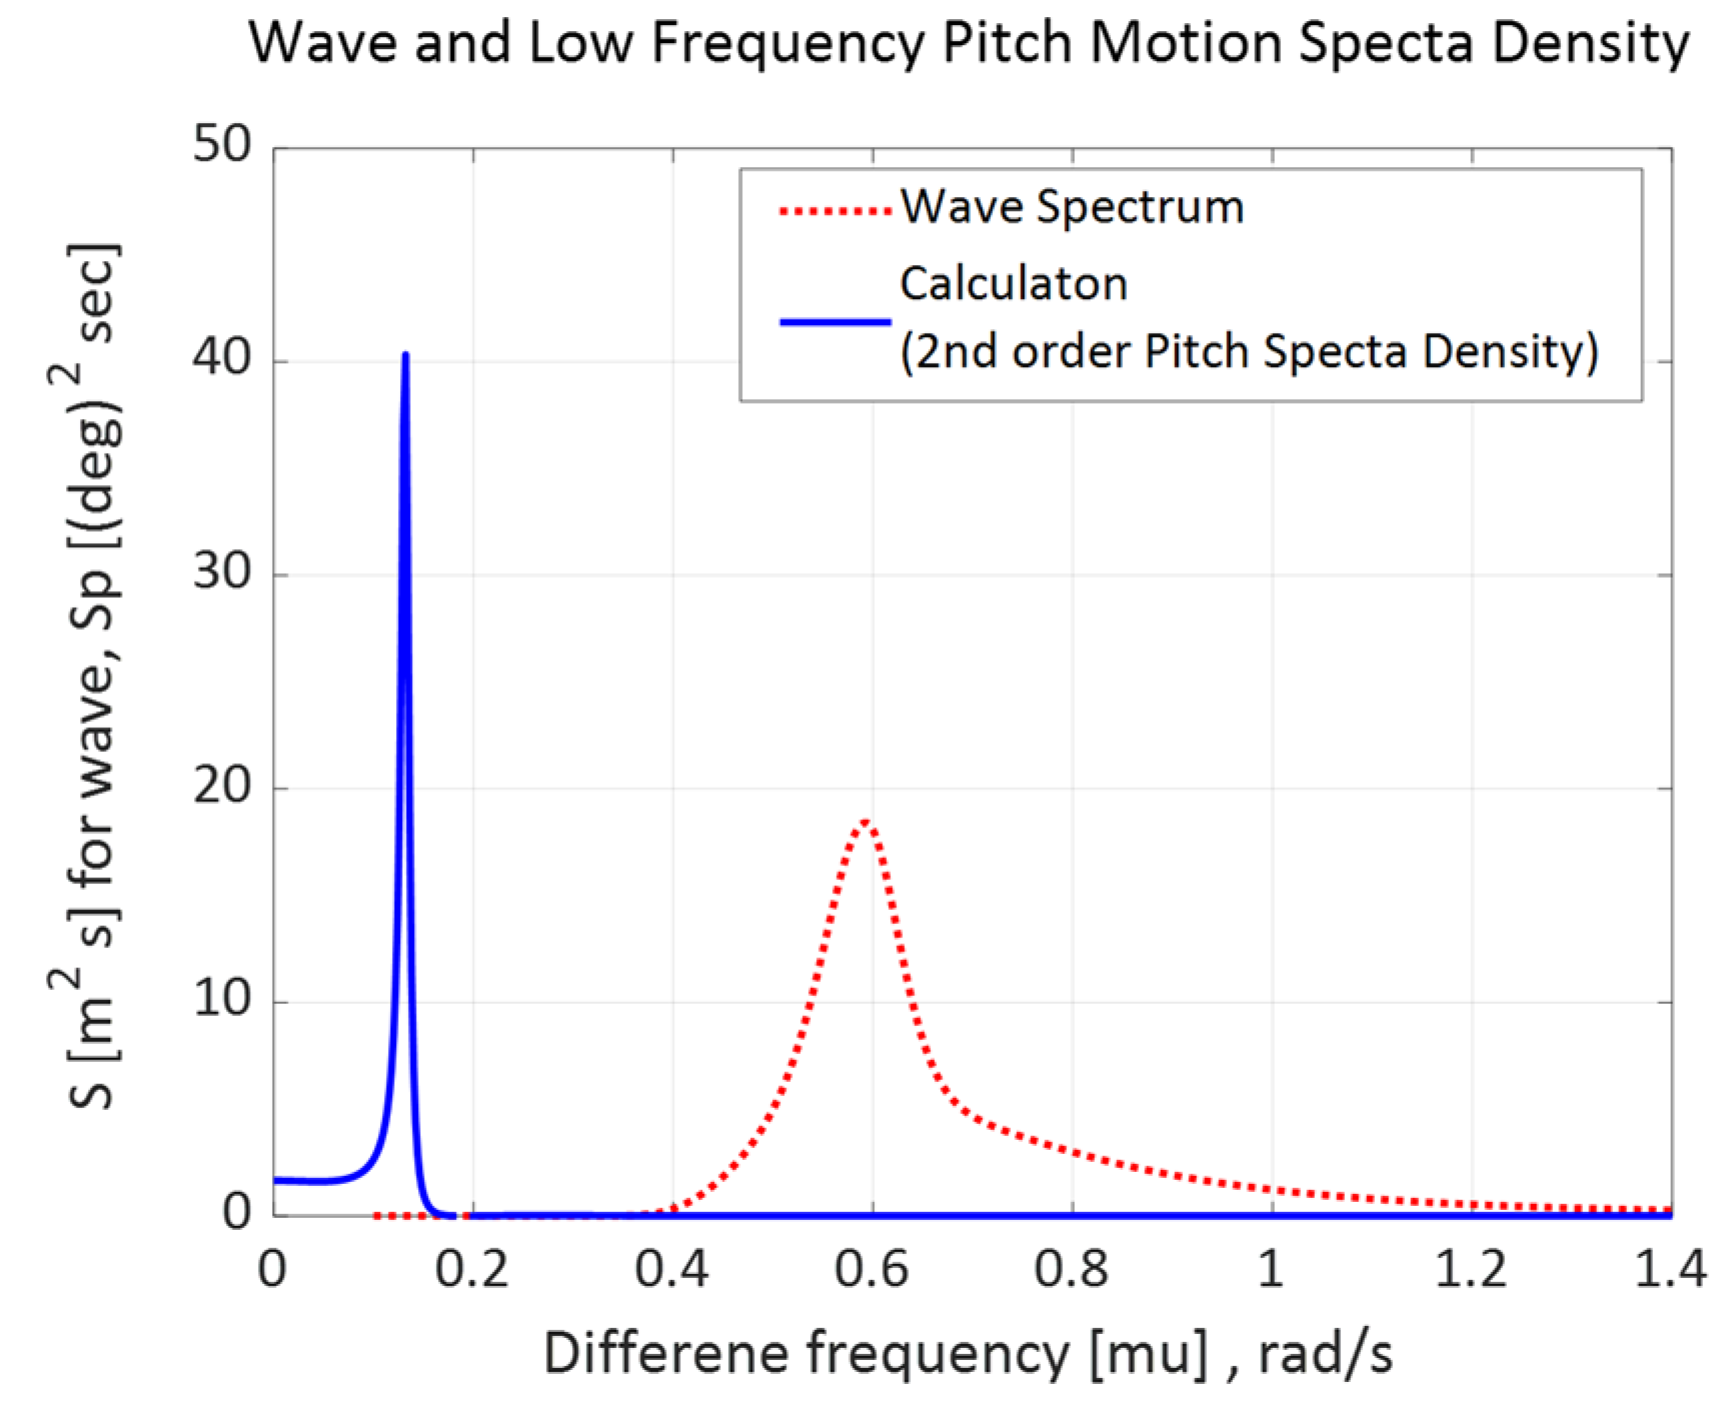
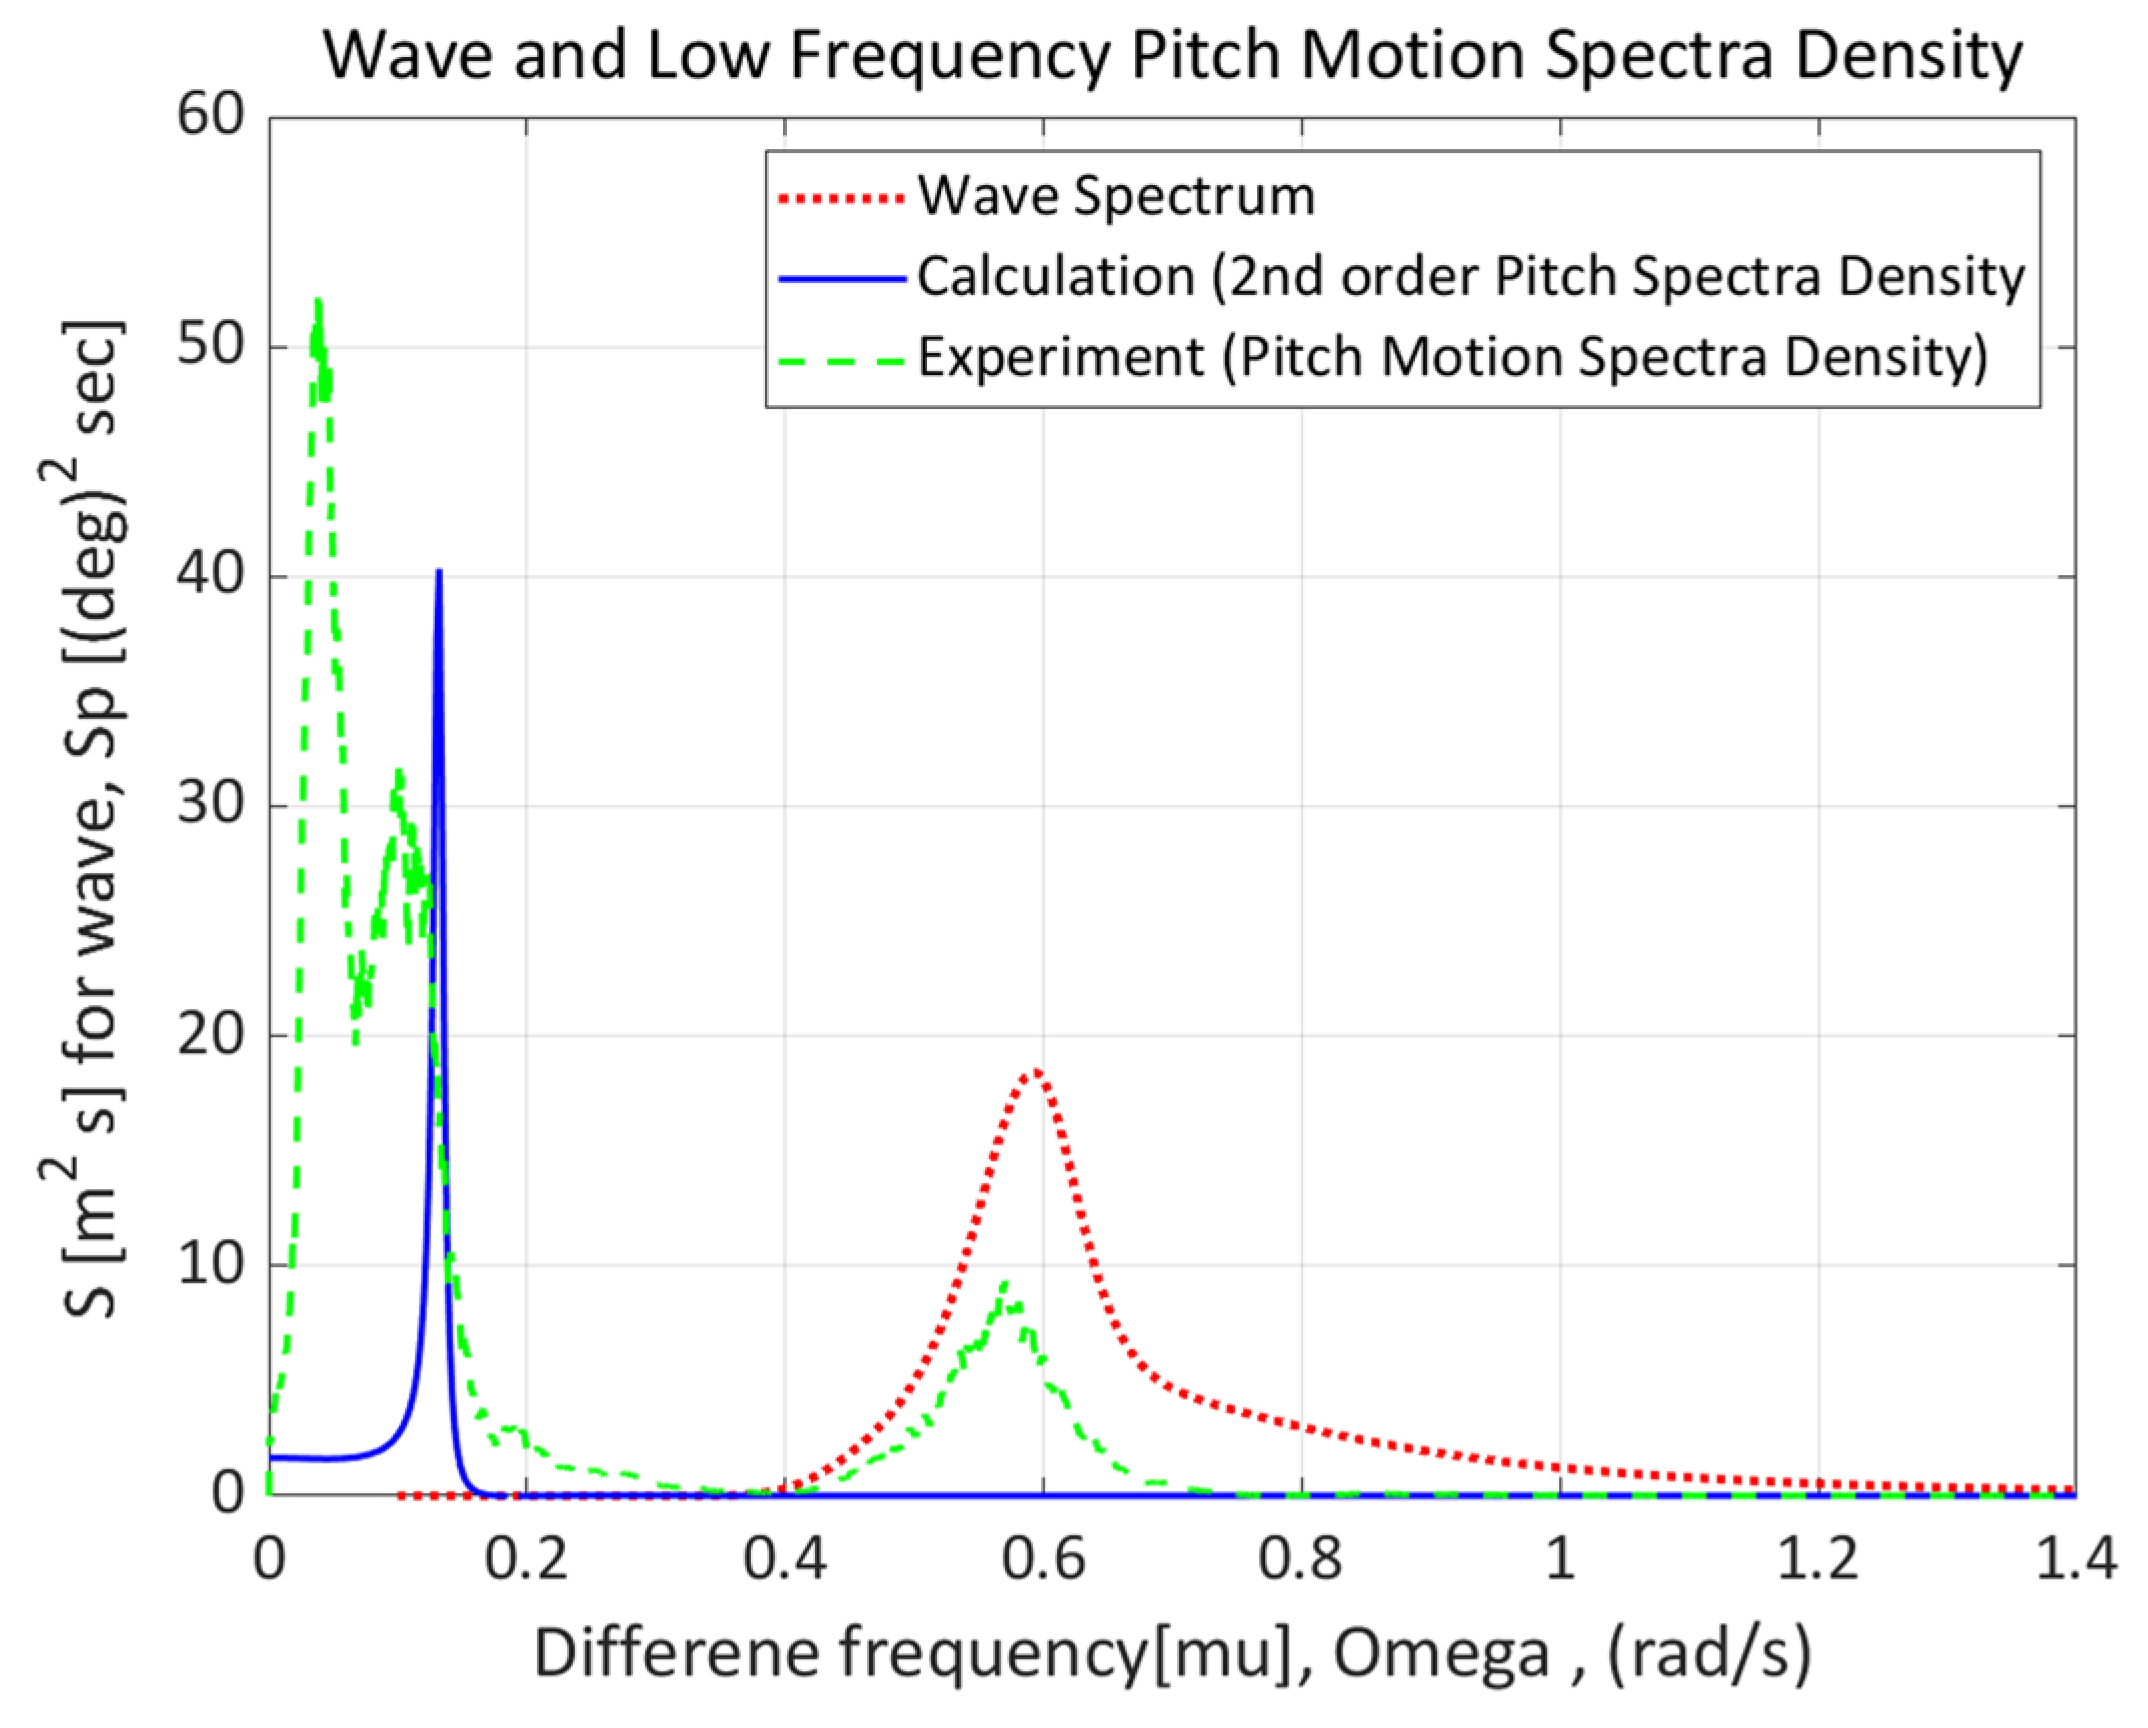
Figure 19 shows the results of the low-frequency pitch motion spectral density calculation before integrating the right-hand side of Equation (3) and the wave spectrum of the irregular wave condition in the K-semi-model test. According to
Figure 19, the wave energy was concentrated at approximately 0.59 rad/s (10.64 s), which was the period condition of the incident wave used in the irregular wave model test. However, the secondary pitch motion appeared at approximately 0.14 rad/s (for approximately 45 s), which is the low-frequency region with no wave energy. This result indicates that K-Semi exhibits a characteristic low-frequency behavior driven by the second-order wave force of the wave.
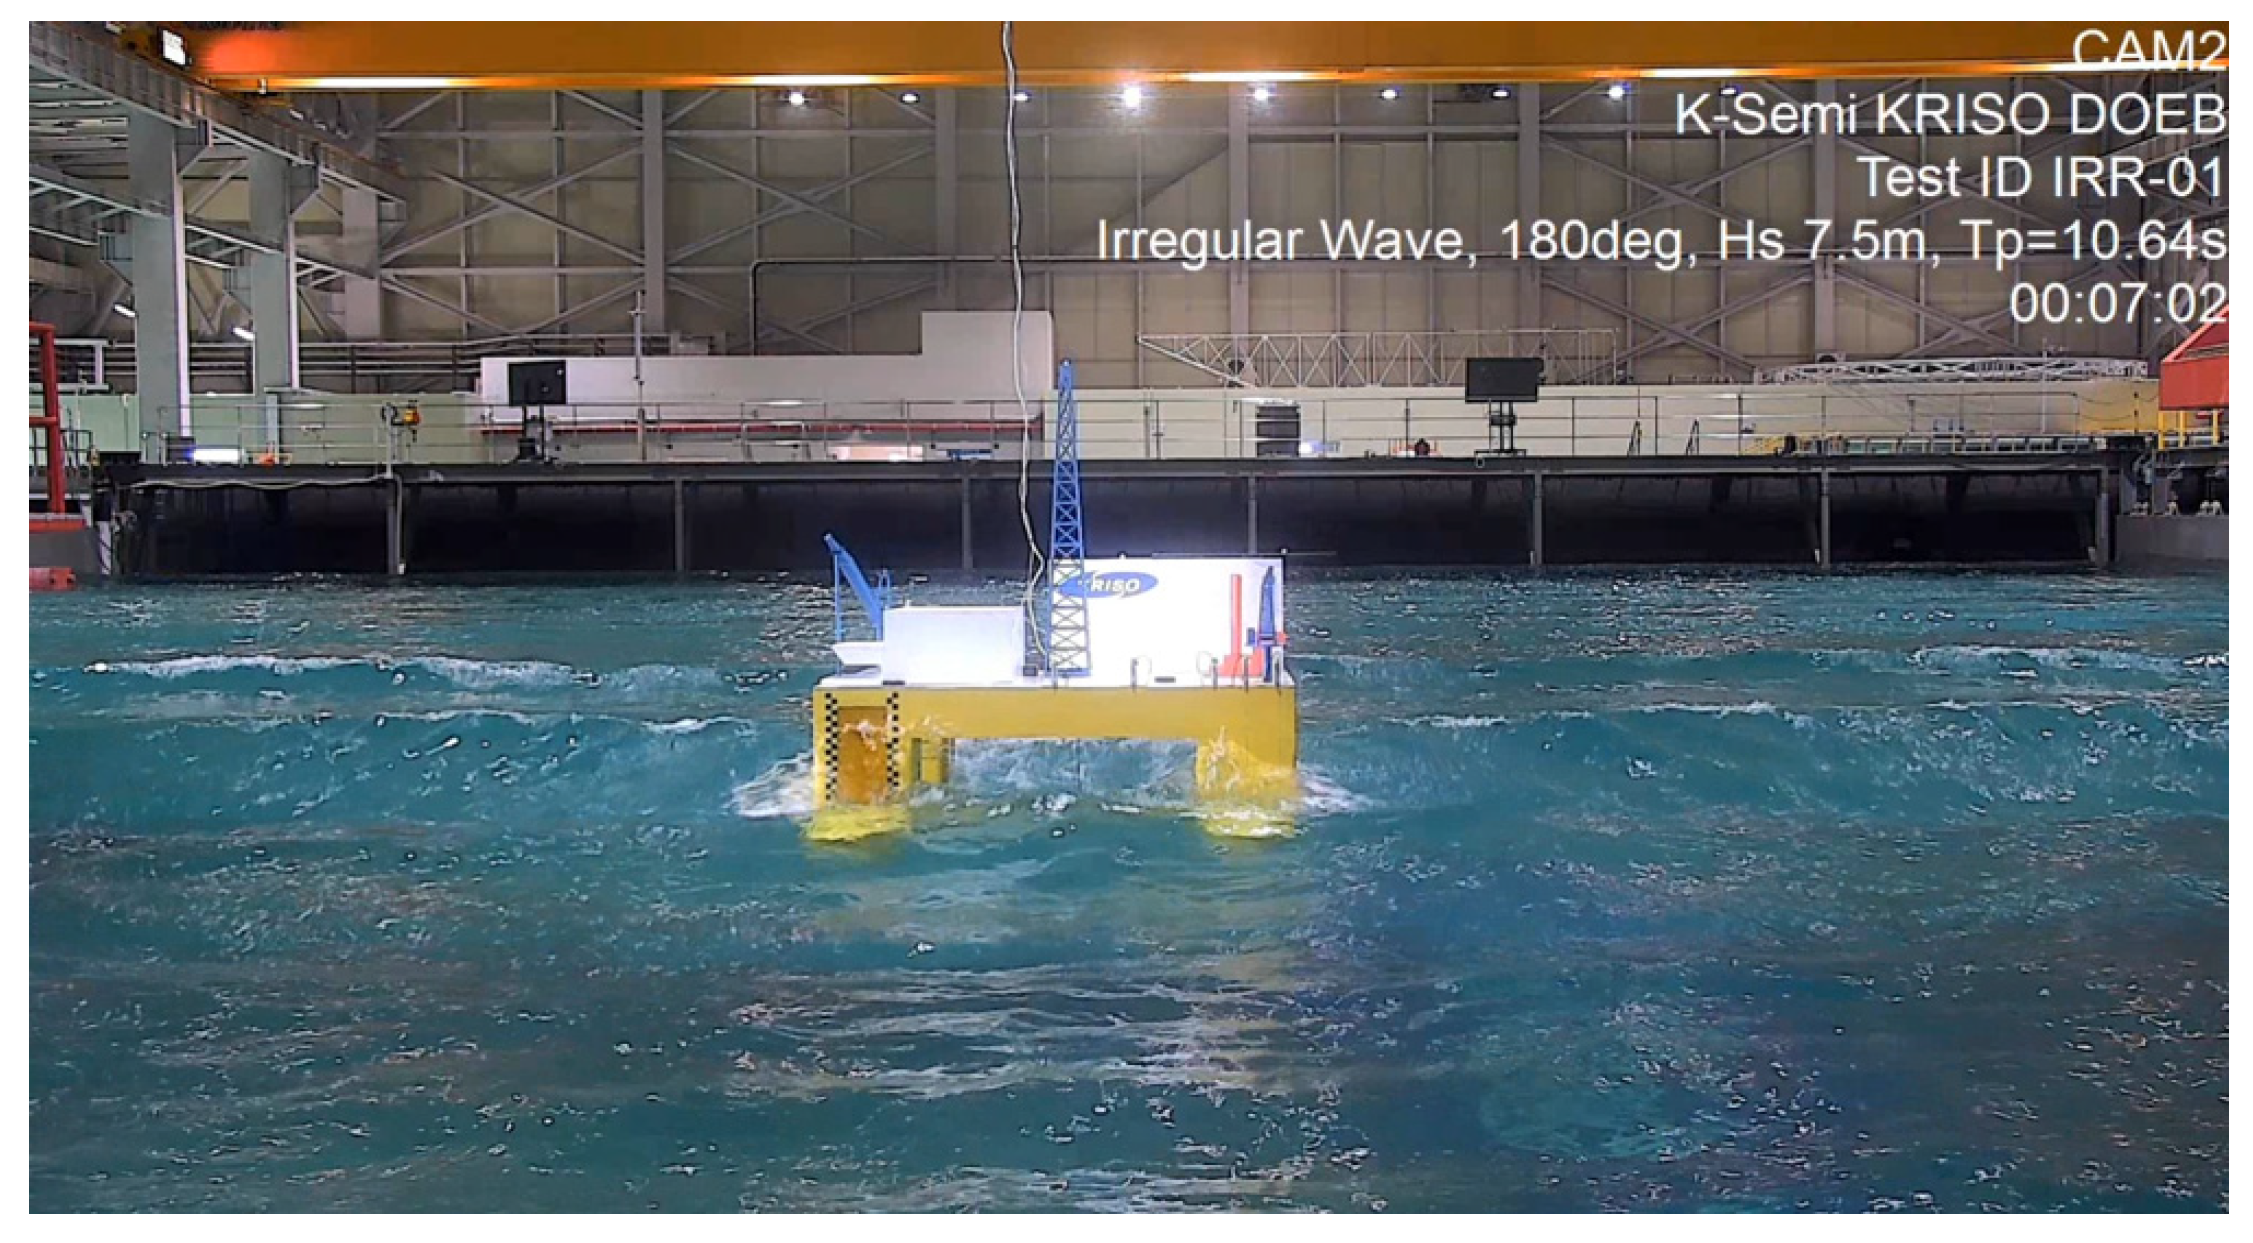
4.4. Irregular Wave Test
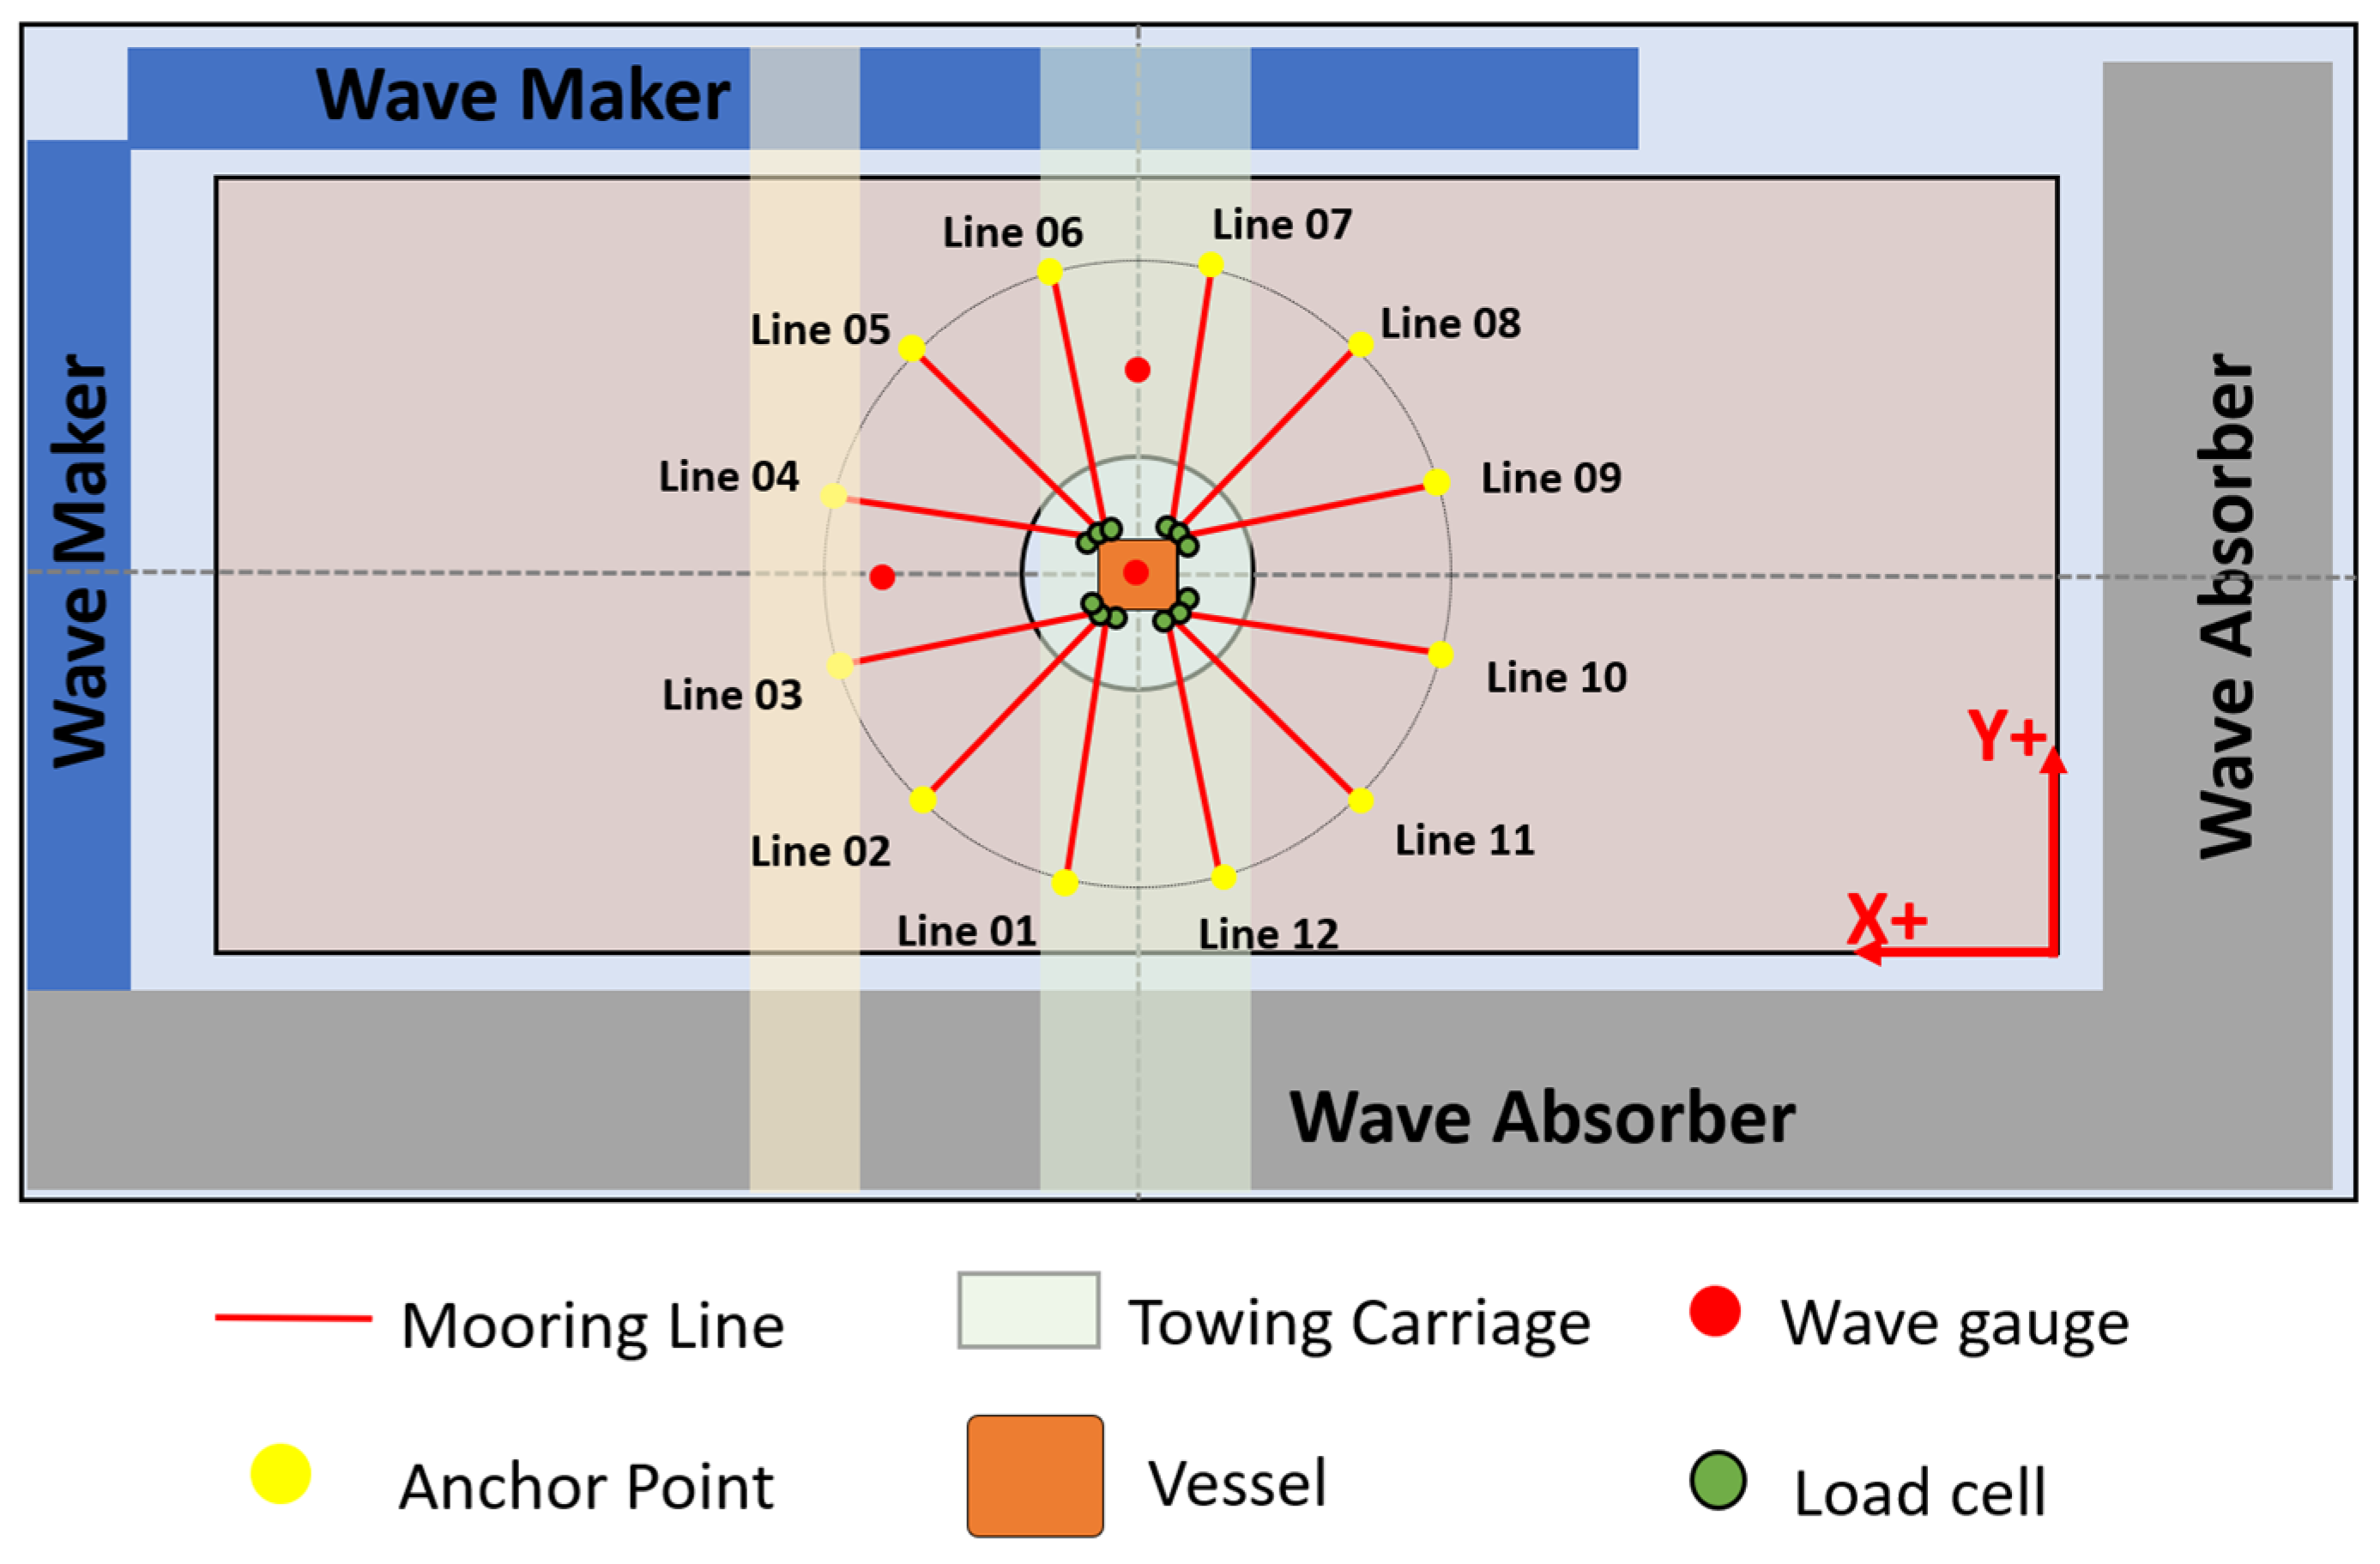
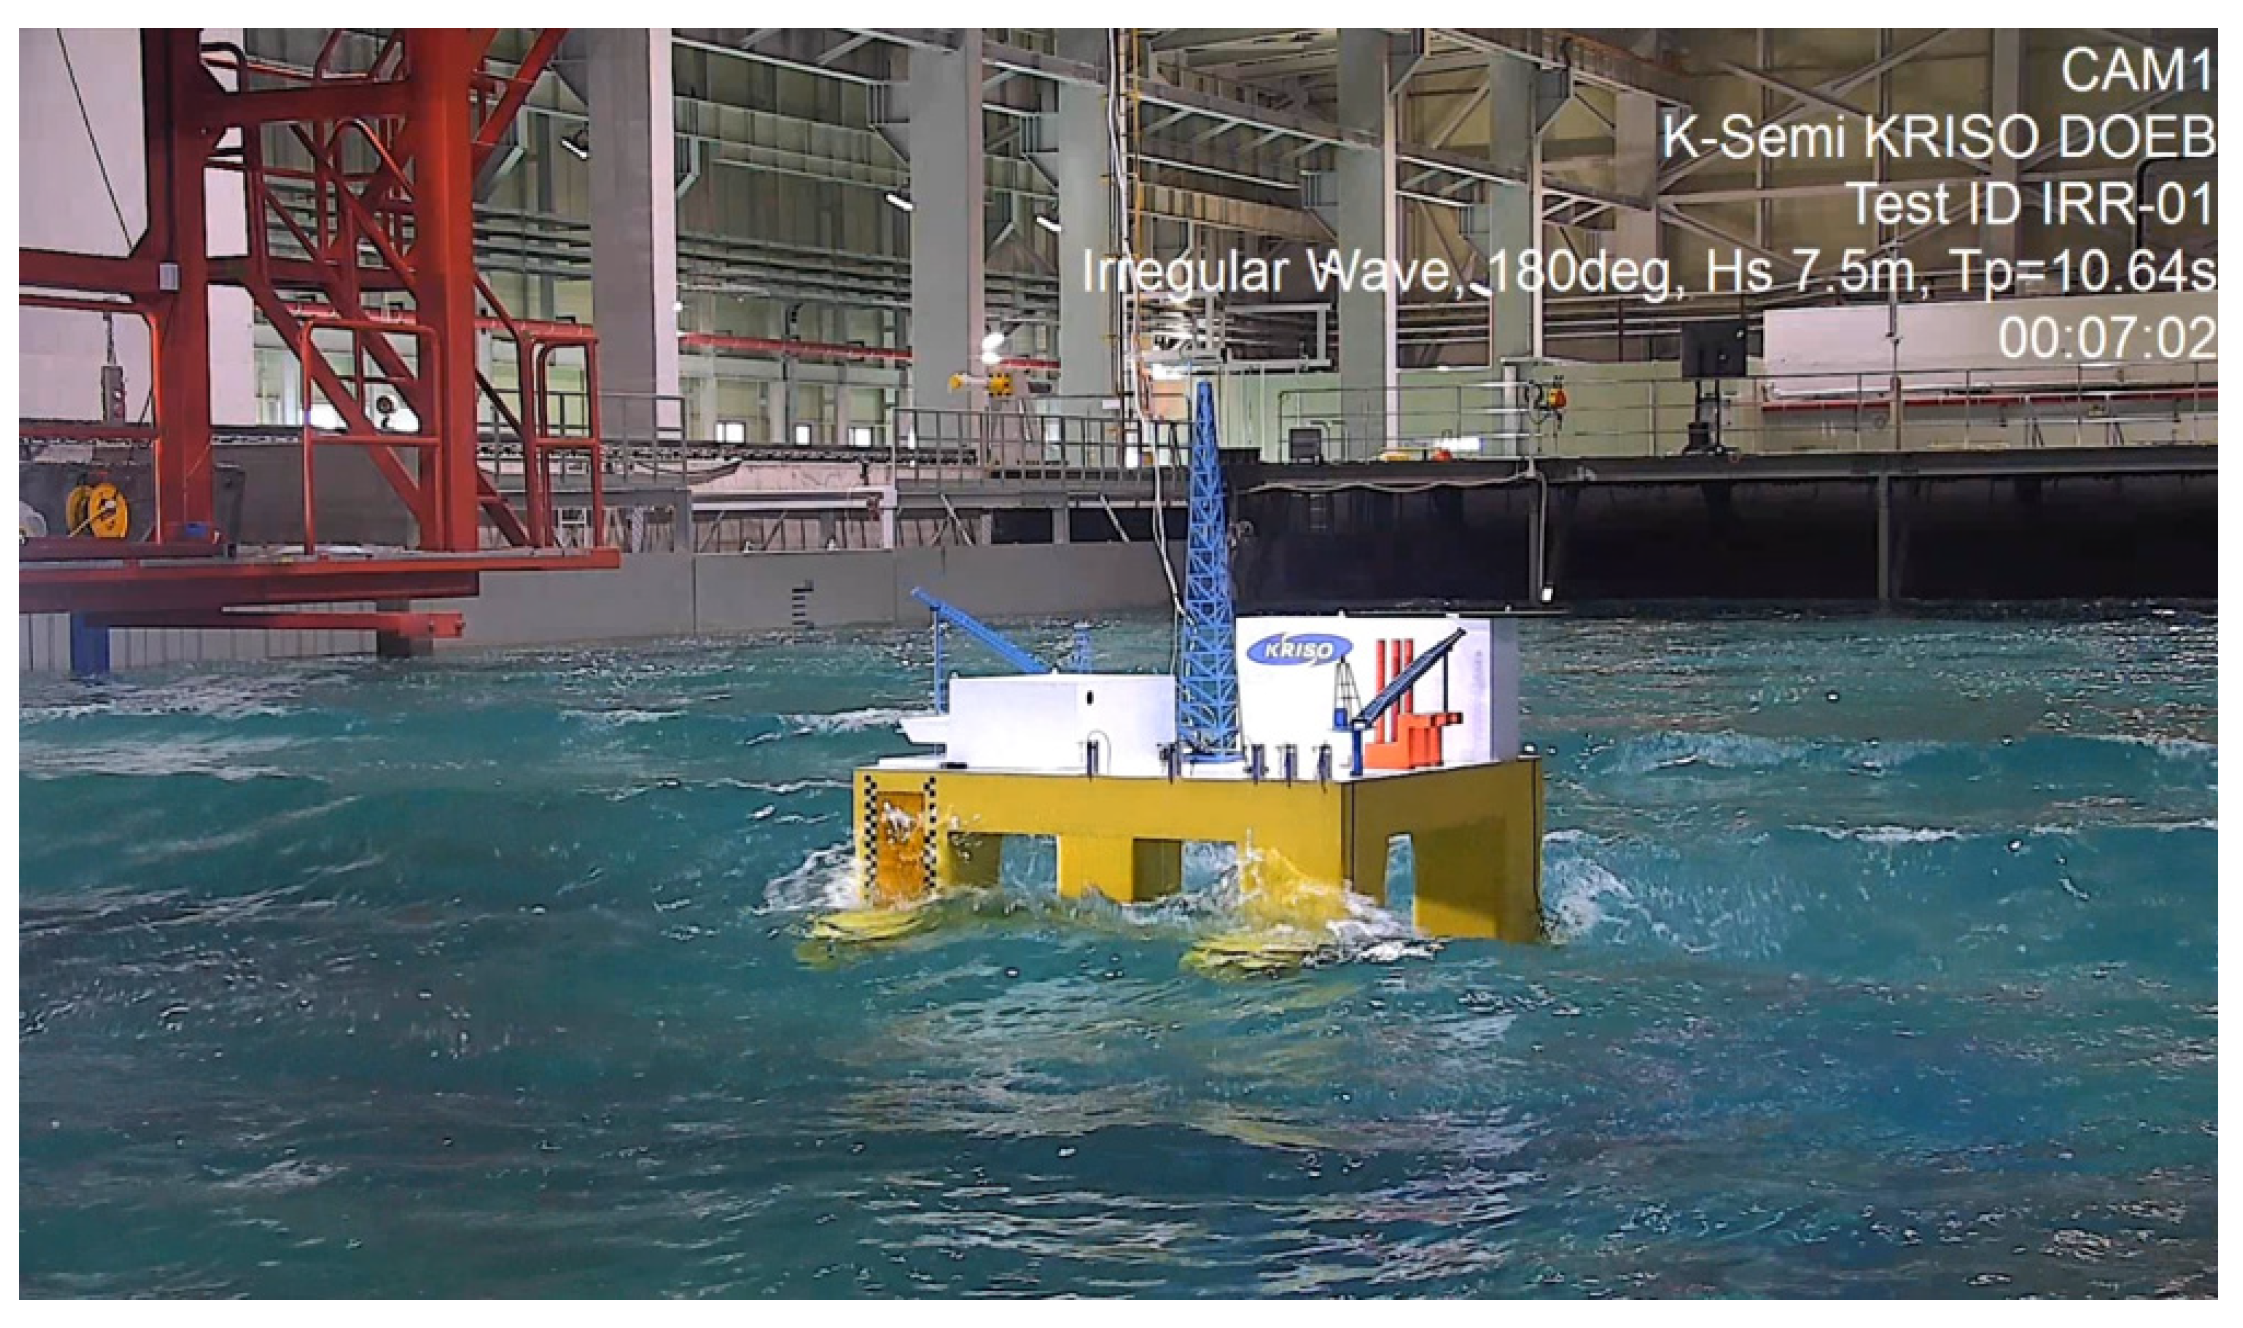
In order to investigate the motion response with truncated mooring, the model test of the K-semi was performed under the irregular wave conditions listed in
Table 3 in the arrangement shown in
Figure 8.
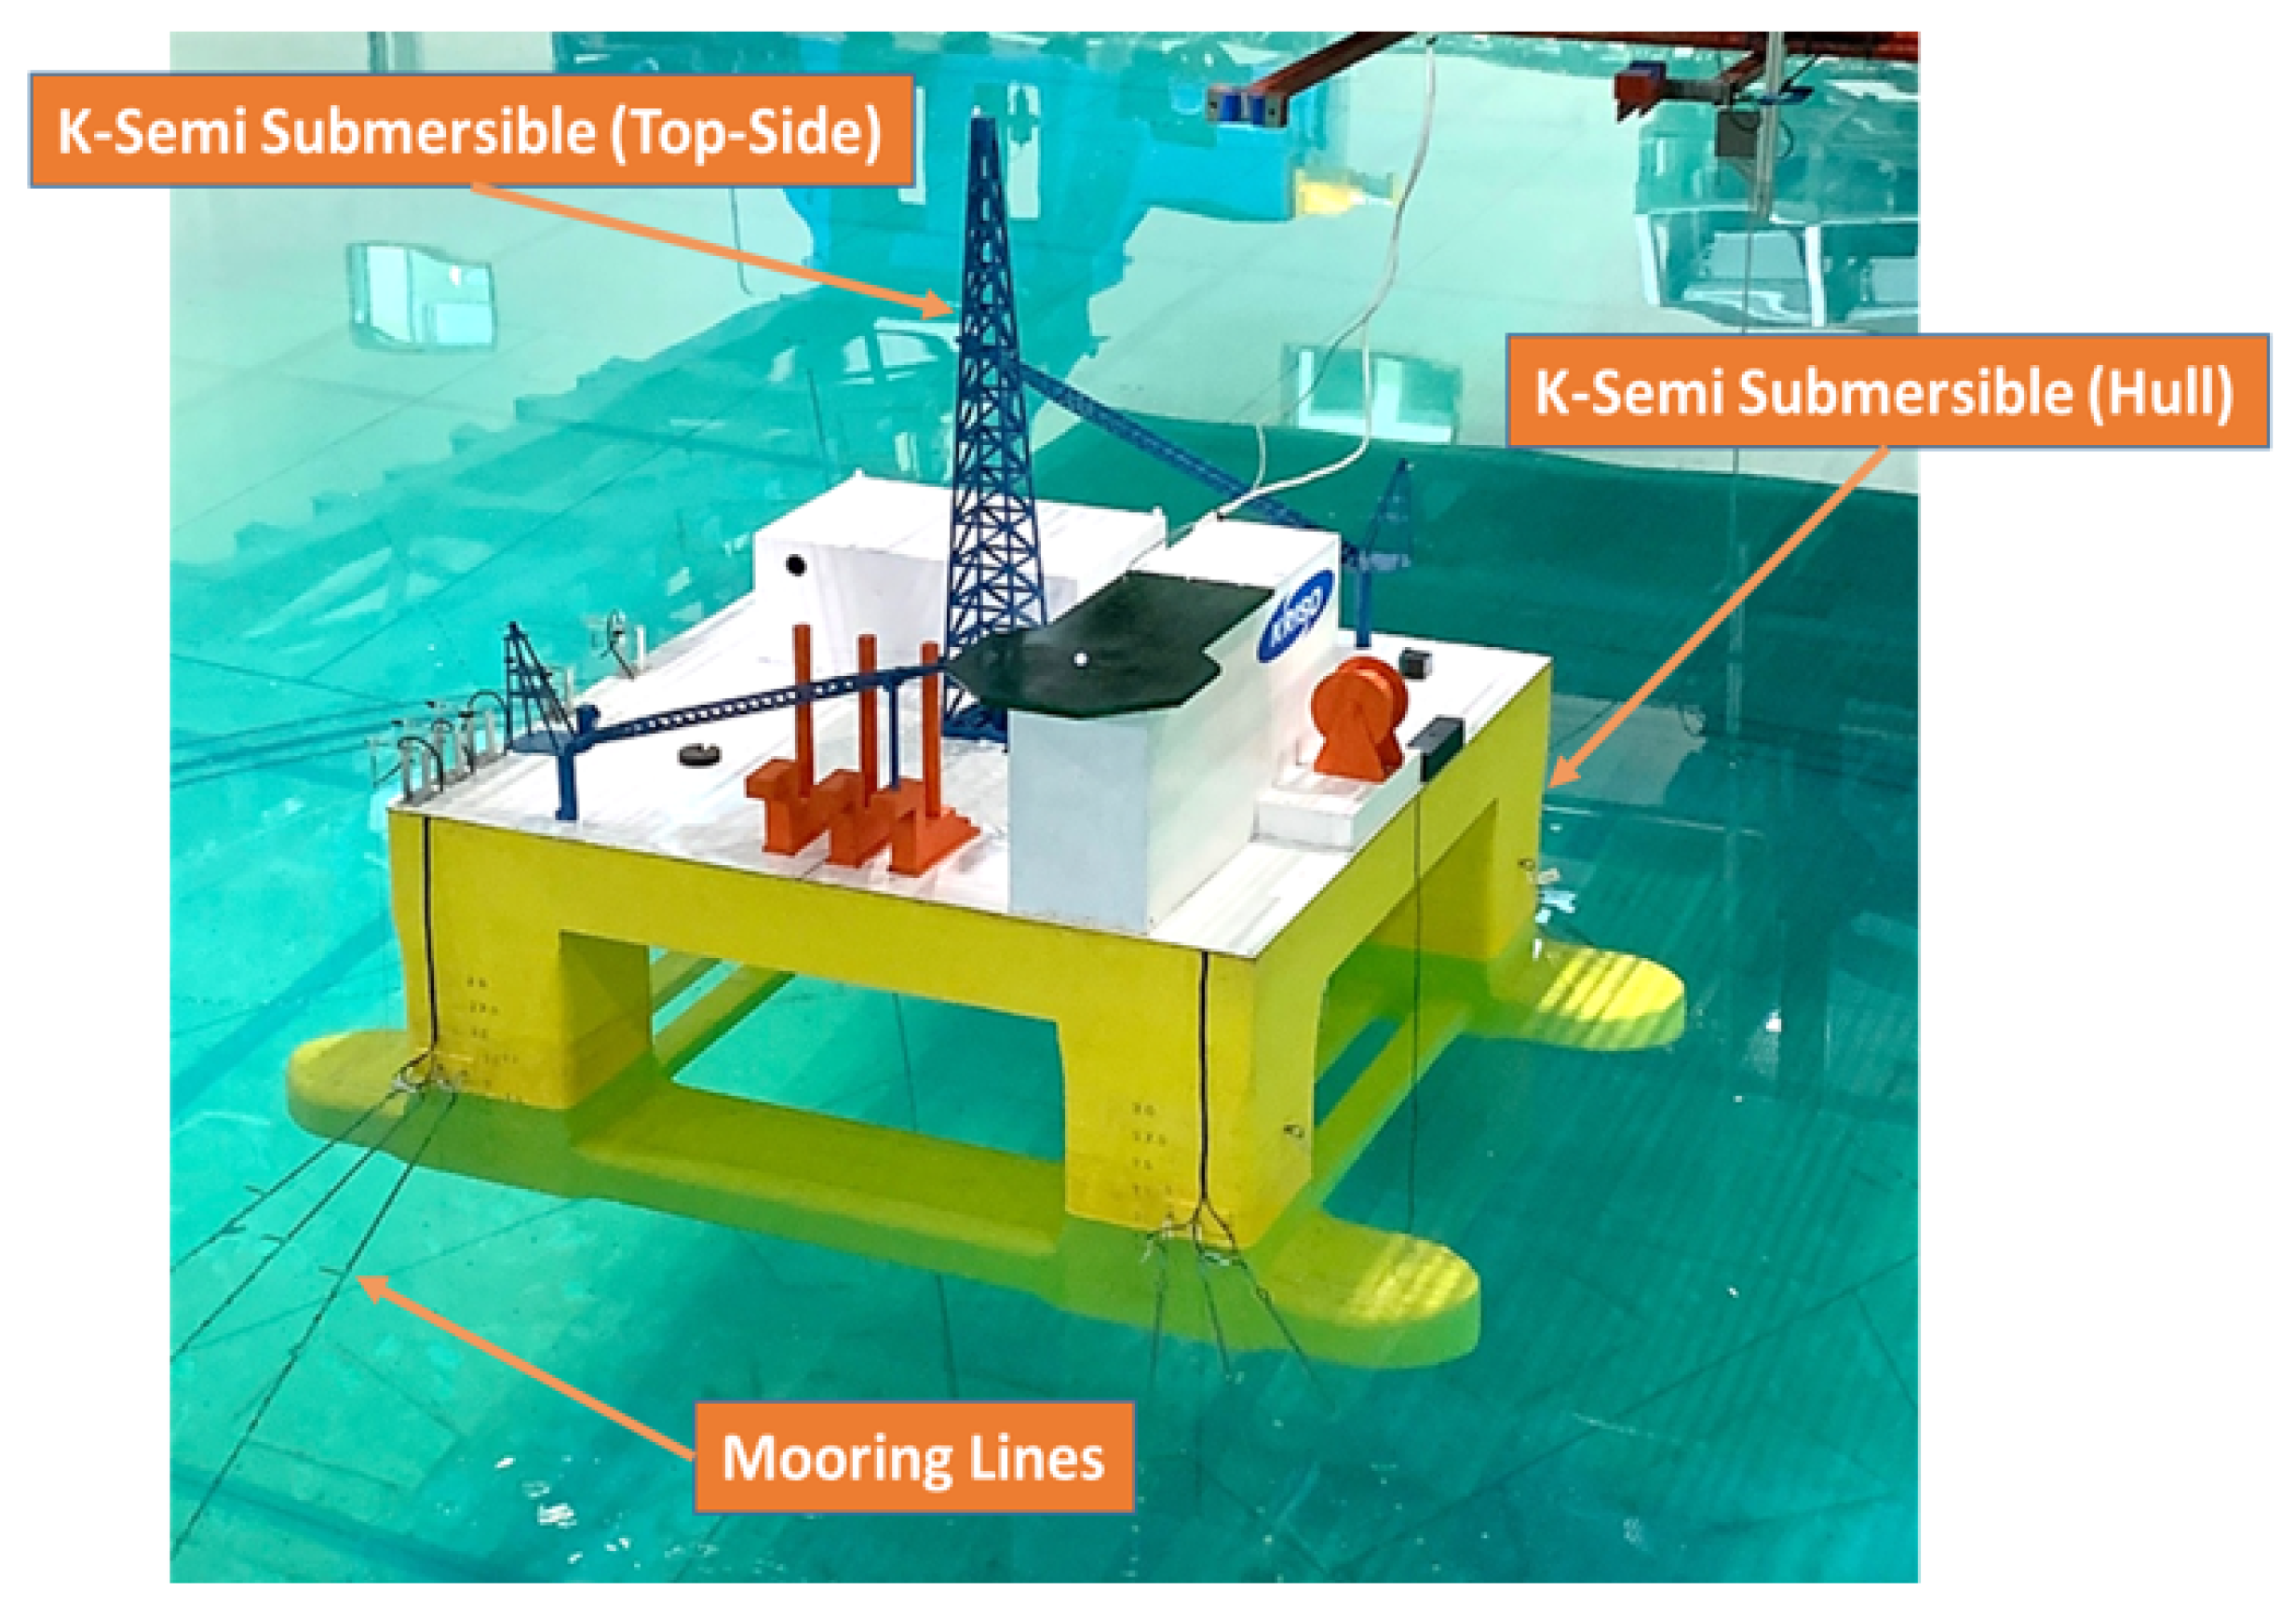
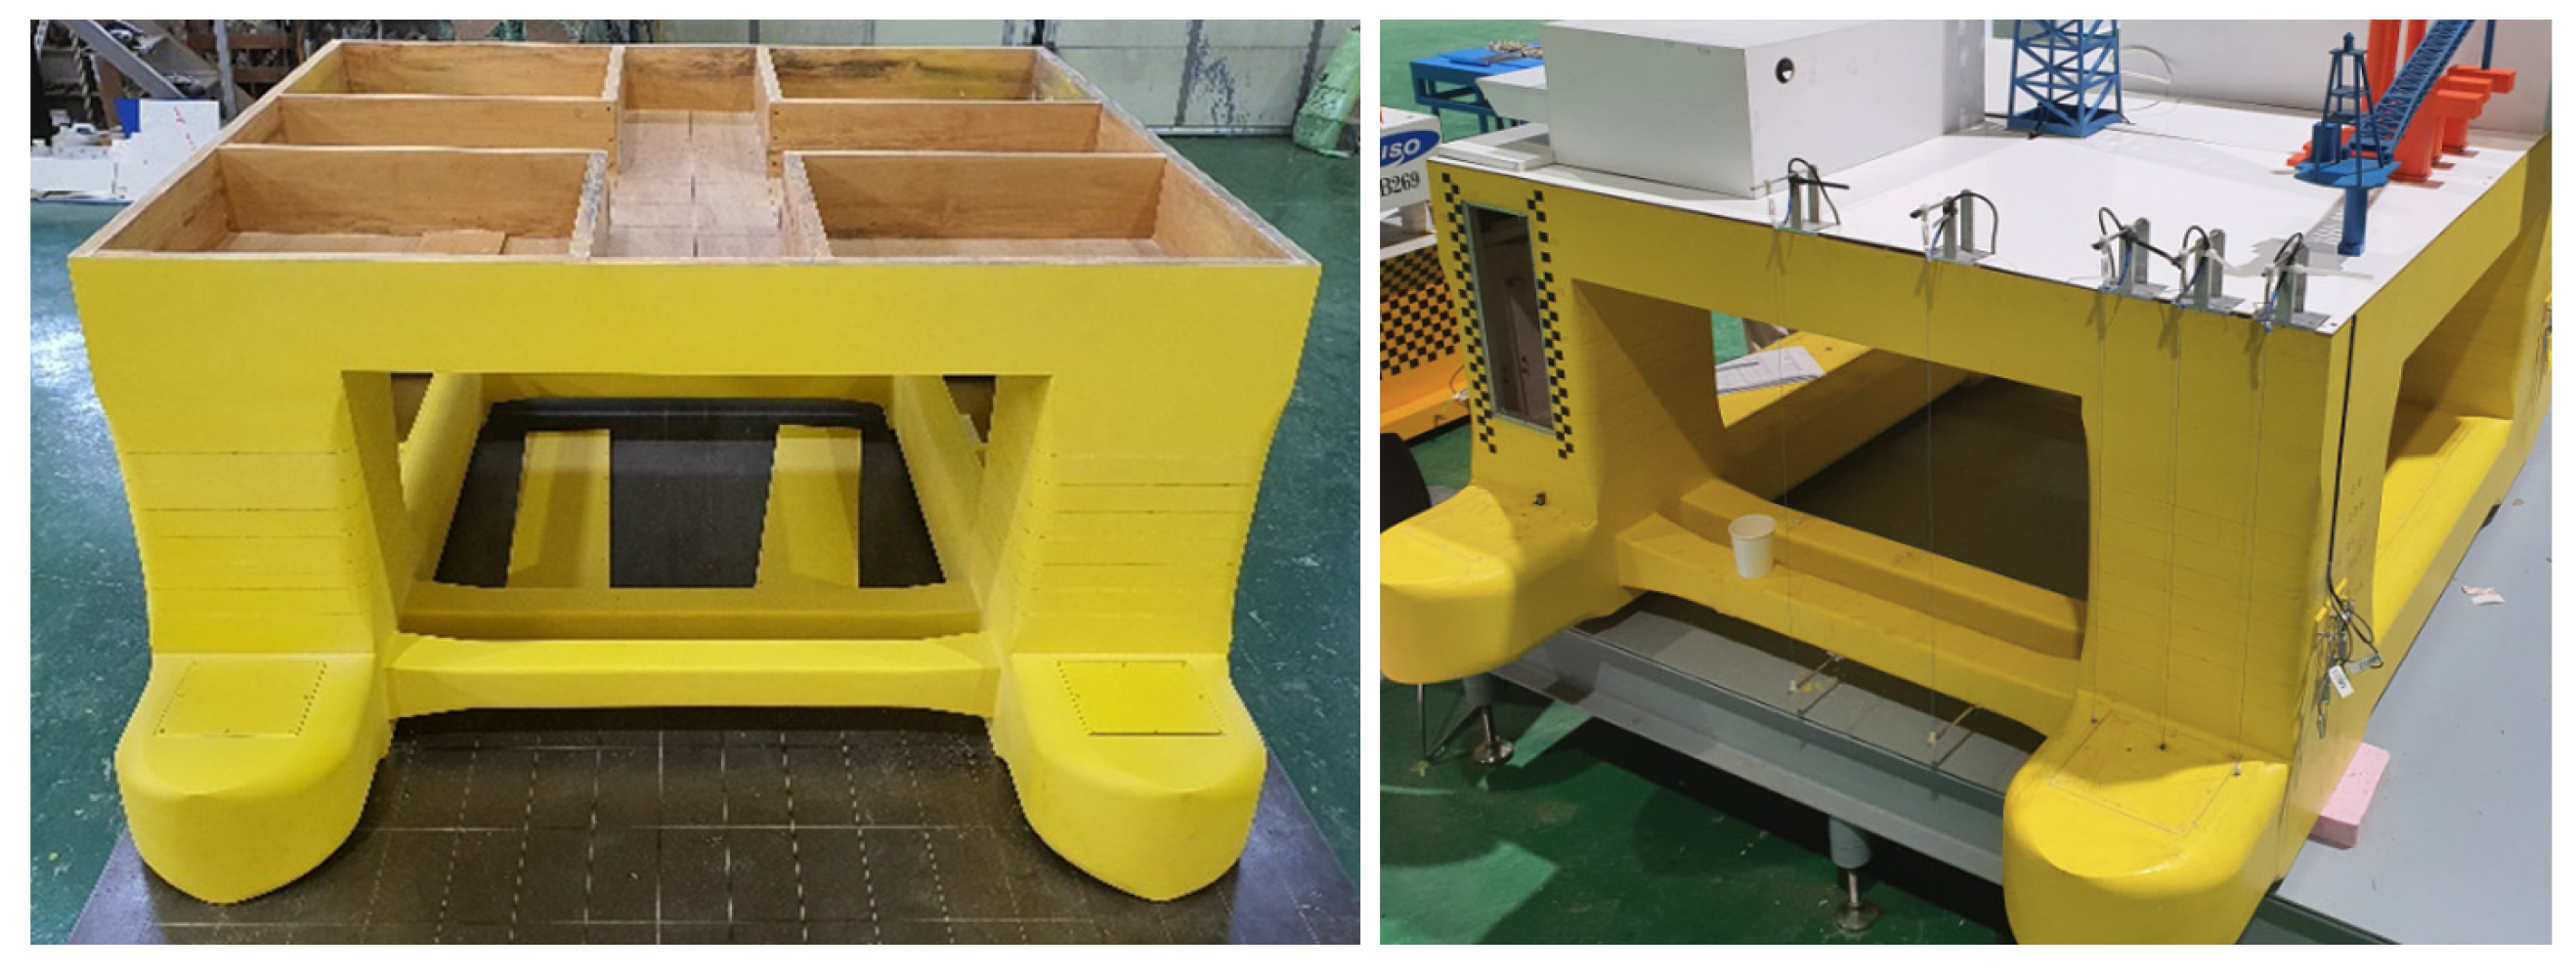
Figure 20 and
Figure 21 show photographs of the model tests conducted in the DOEB. The measurement time was set to 3 h at full scale, and the motion characteristics of the K-Semi connected to the truncated mooring system were investigated based on the measured six-degrees-of-freedom motion results.
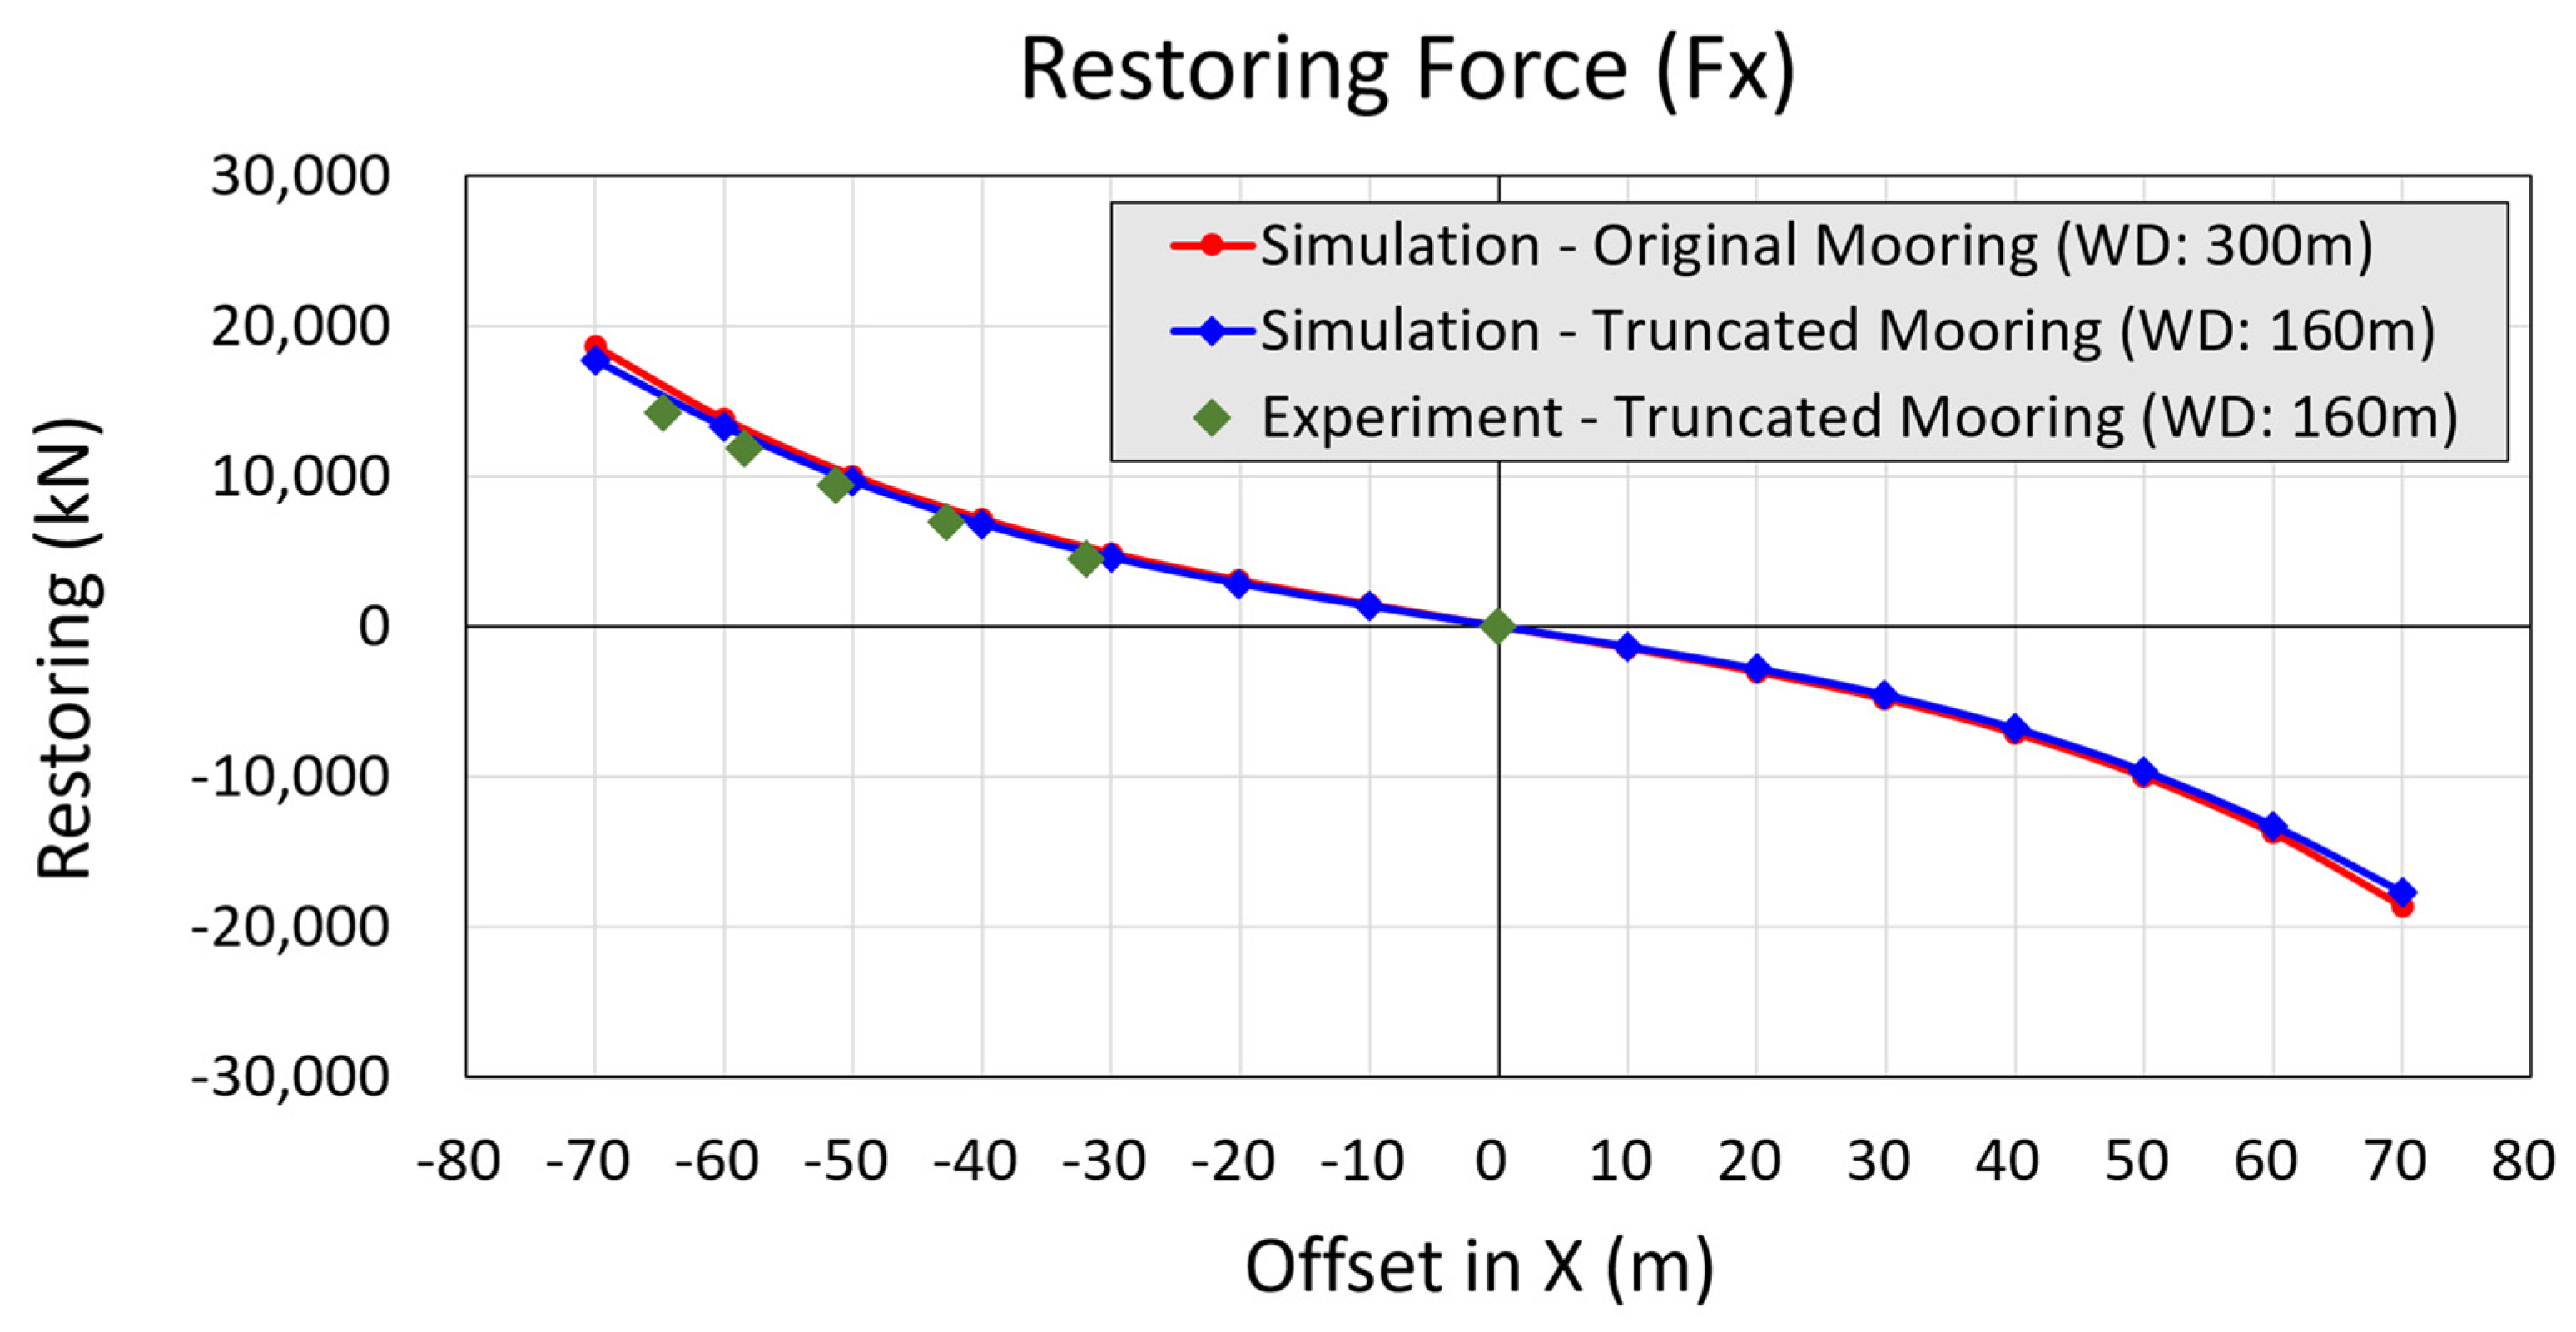
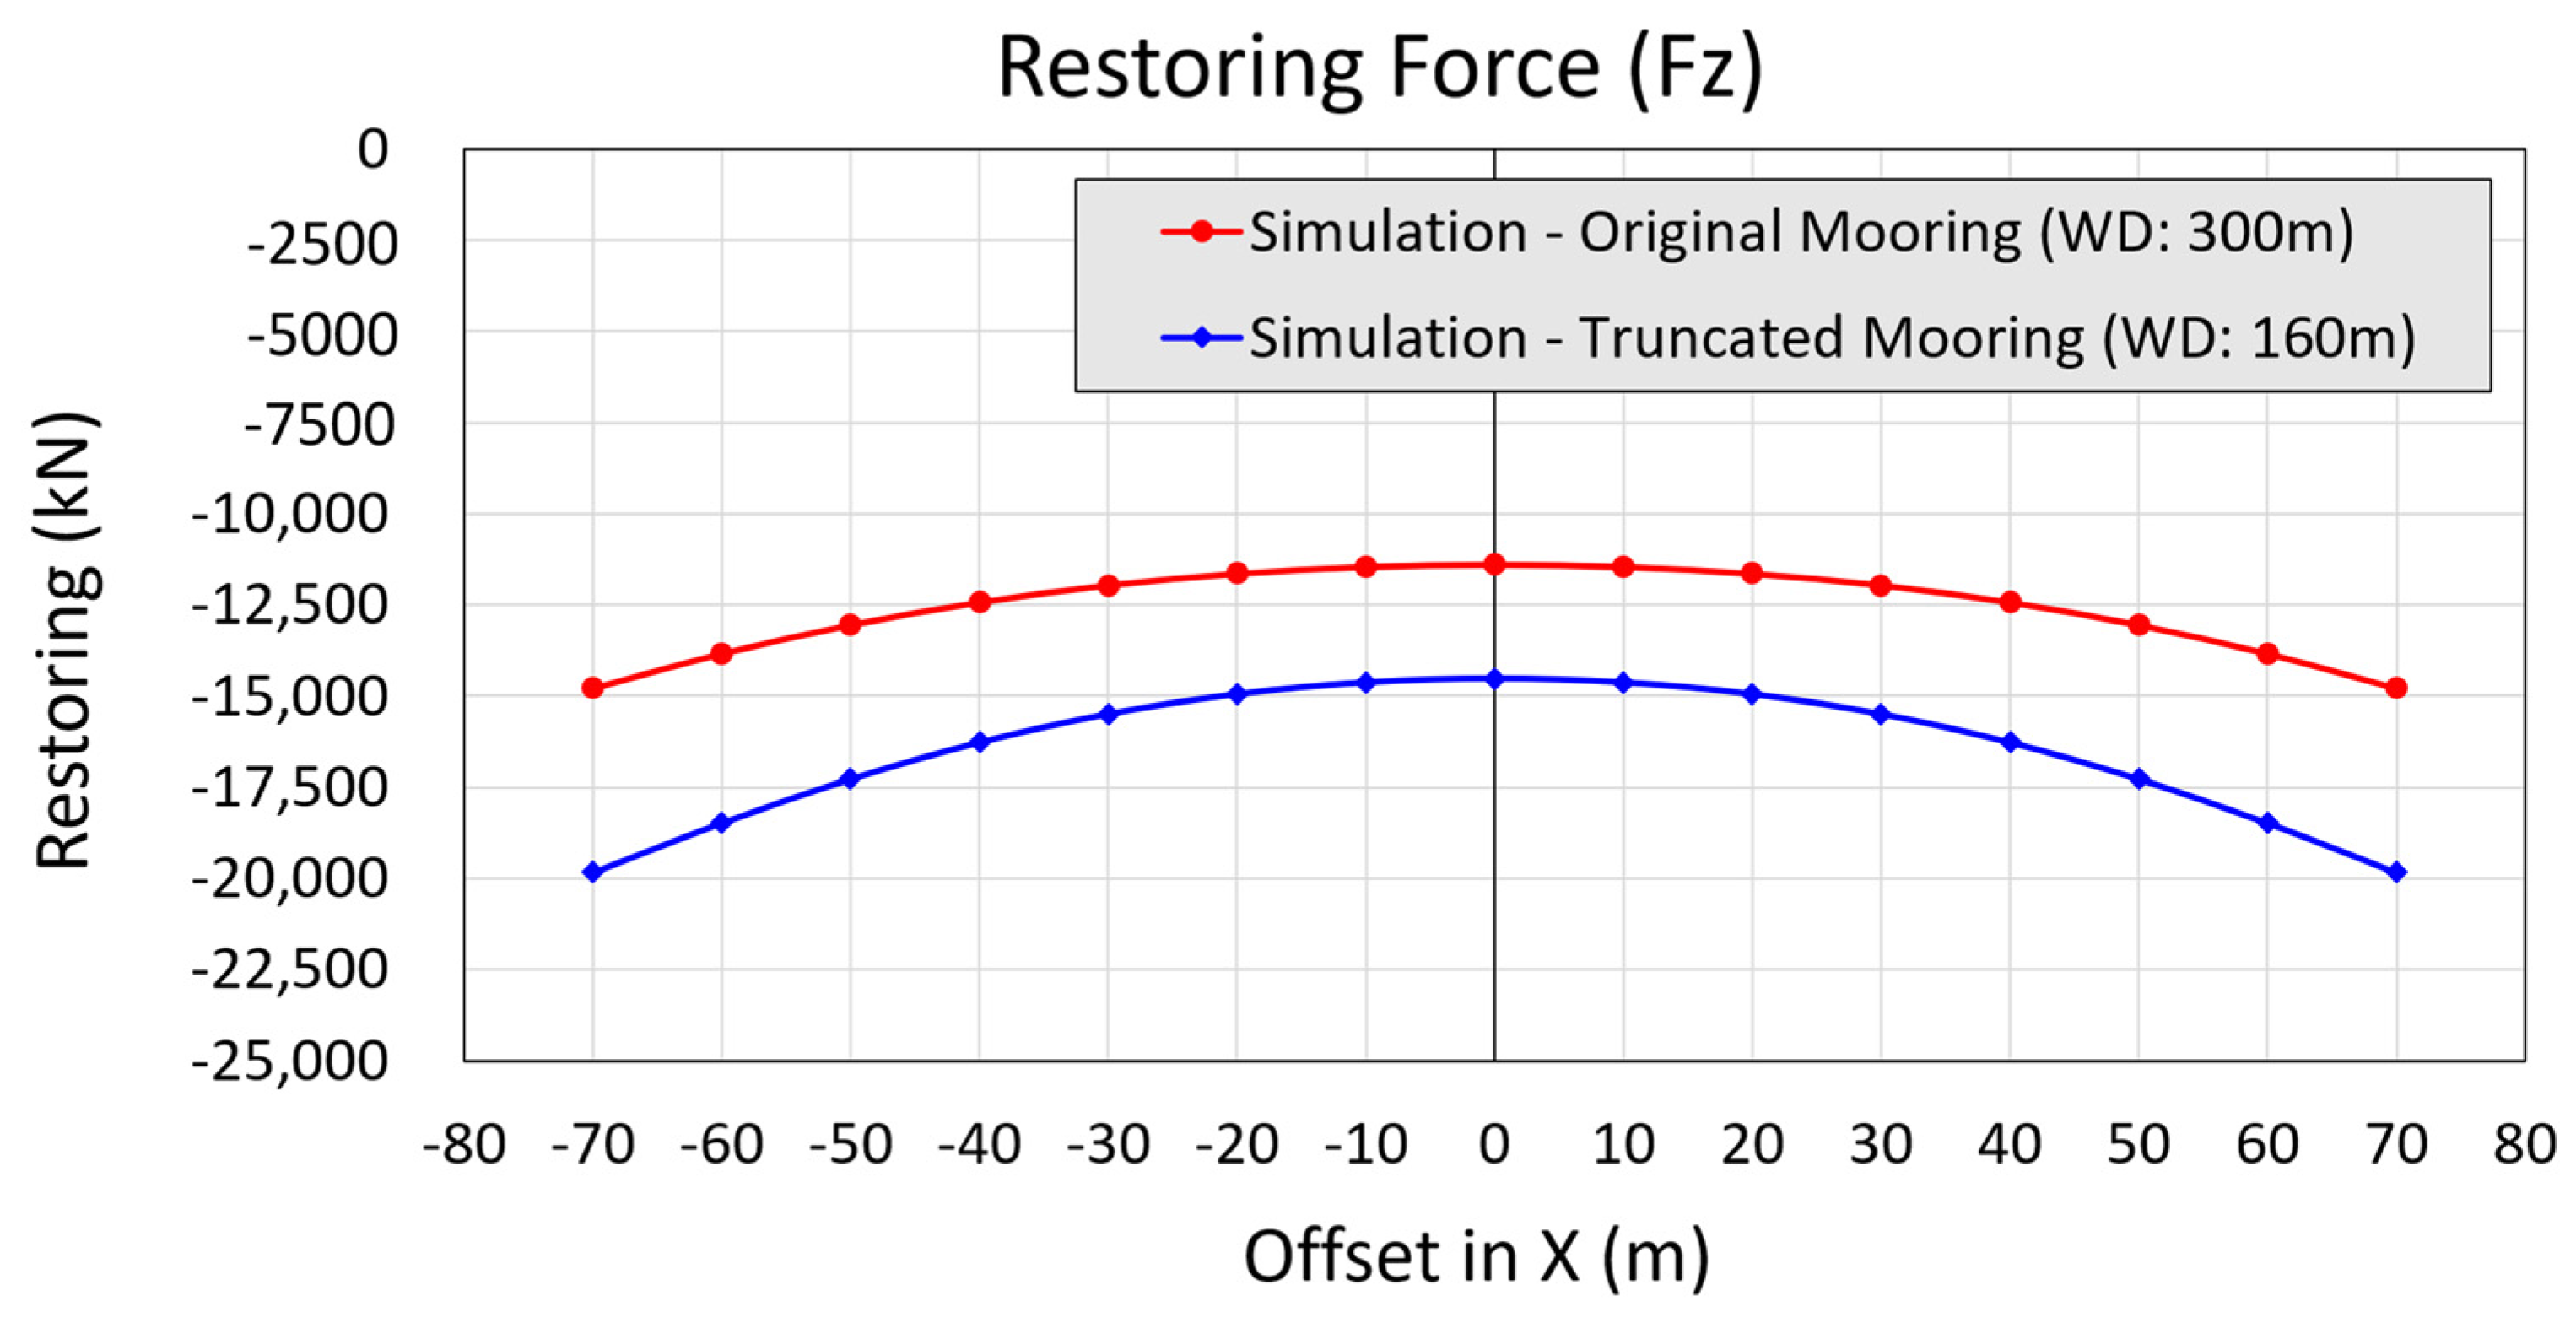
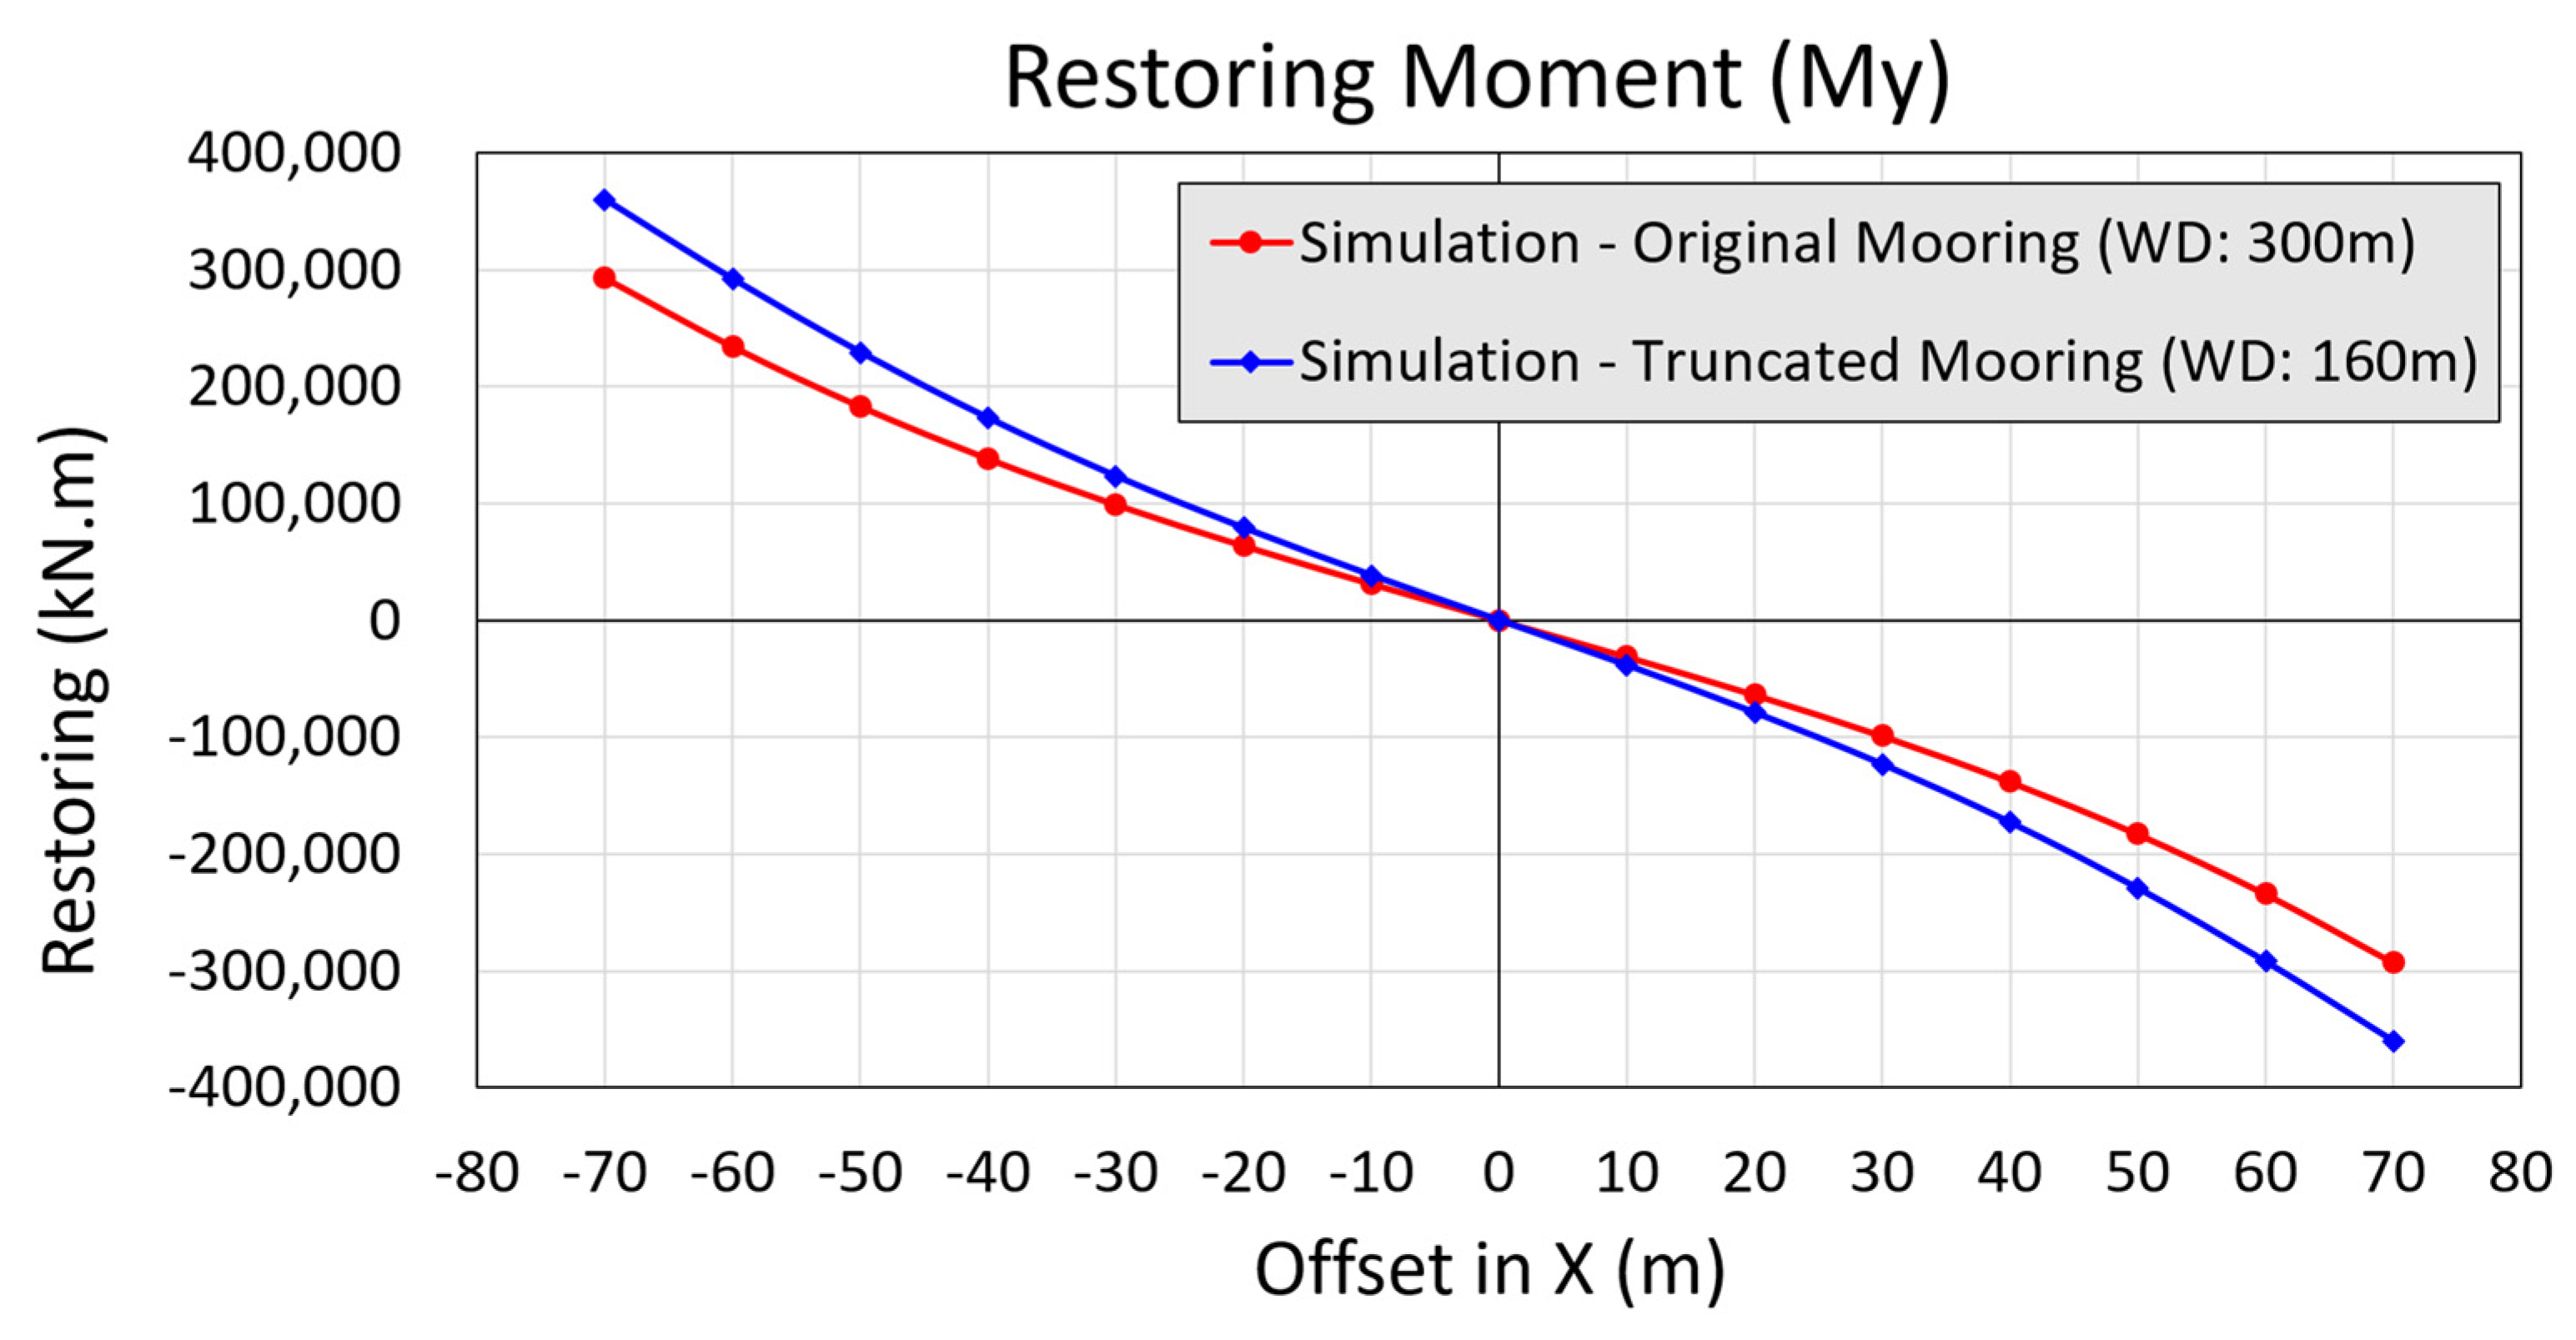
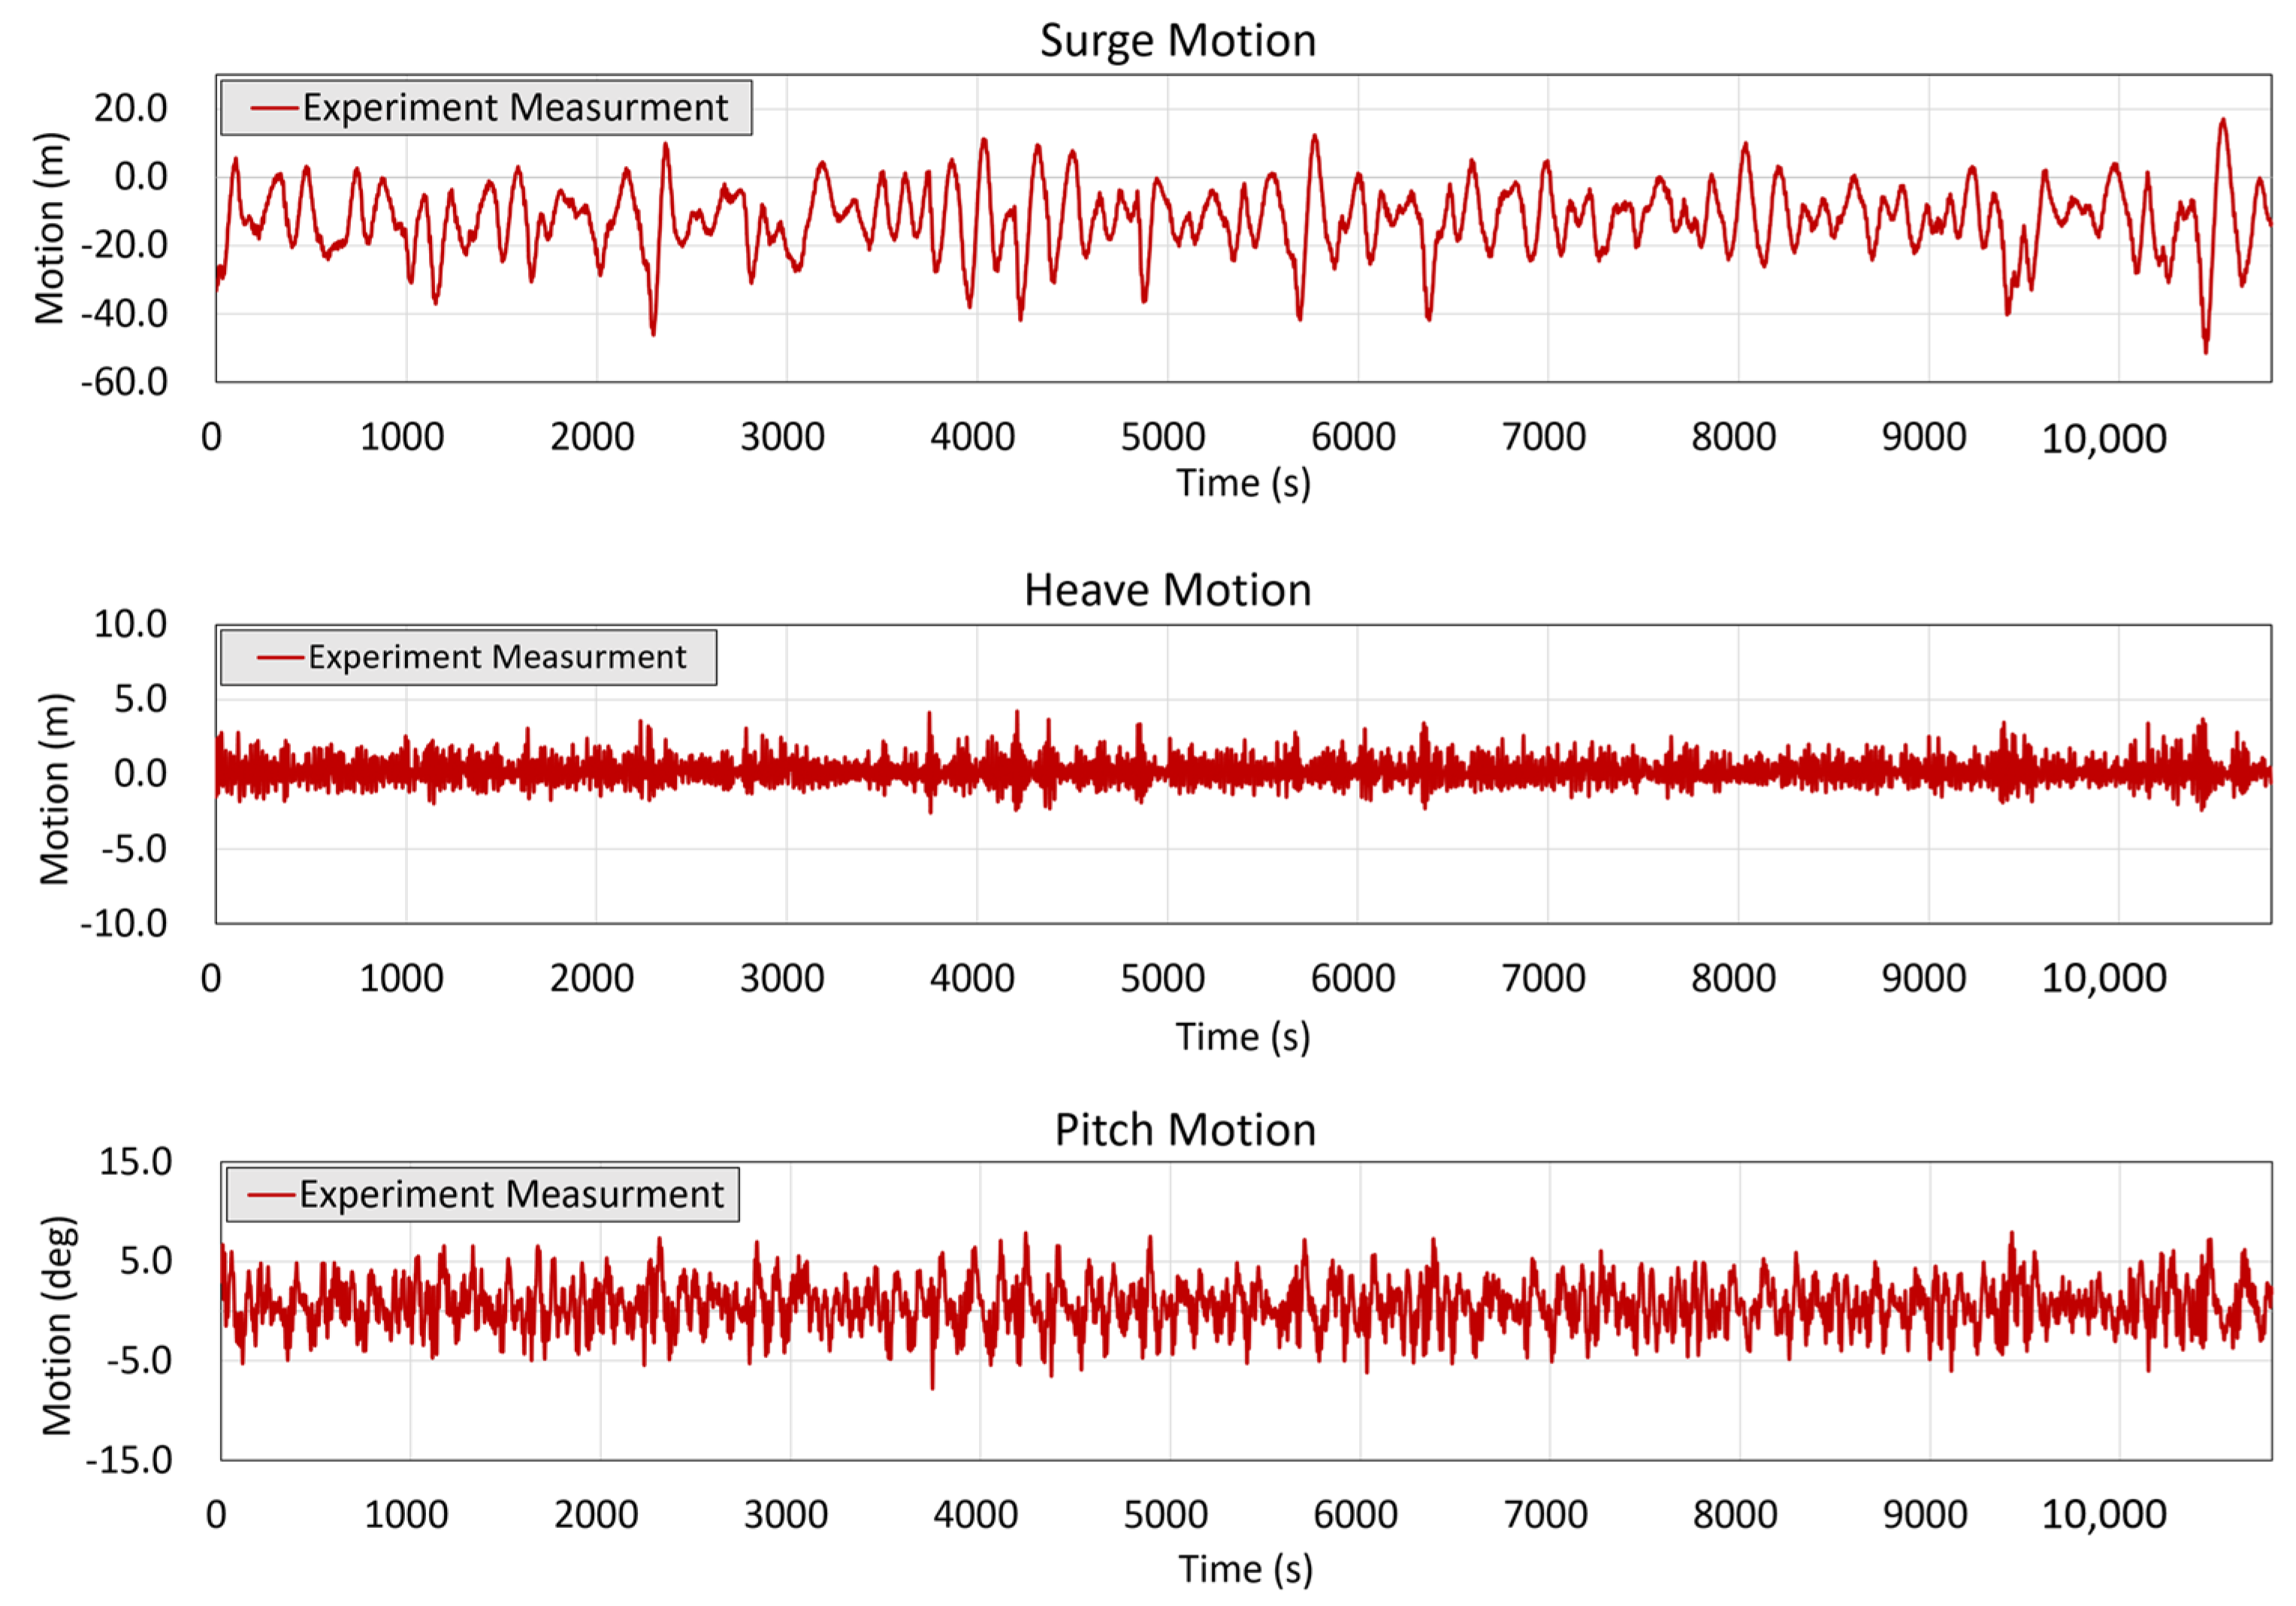
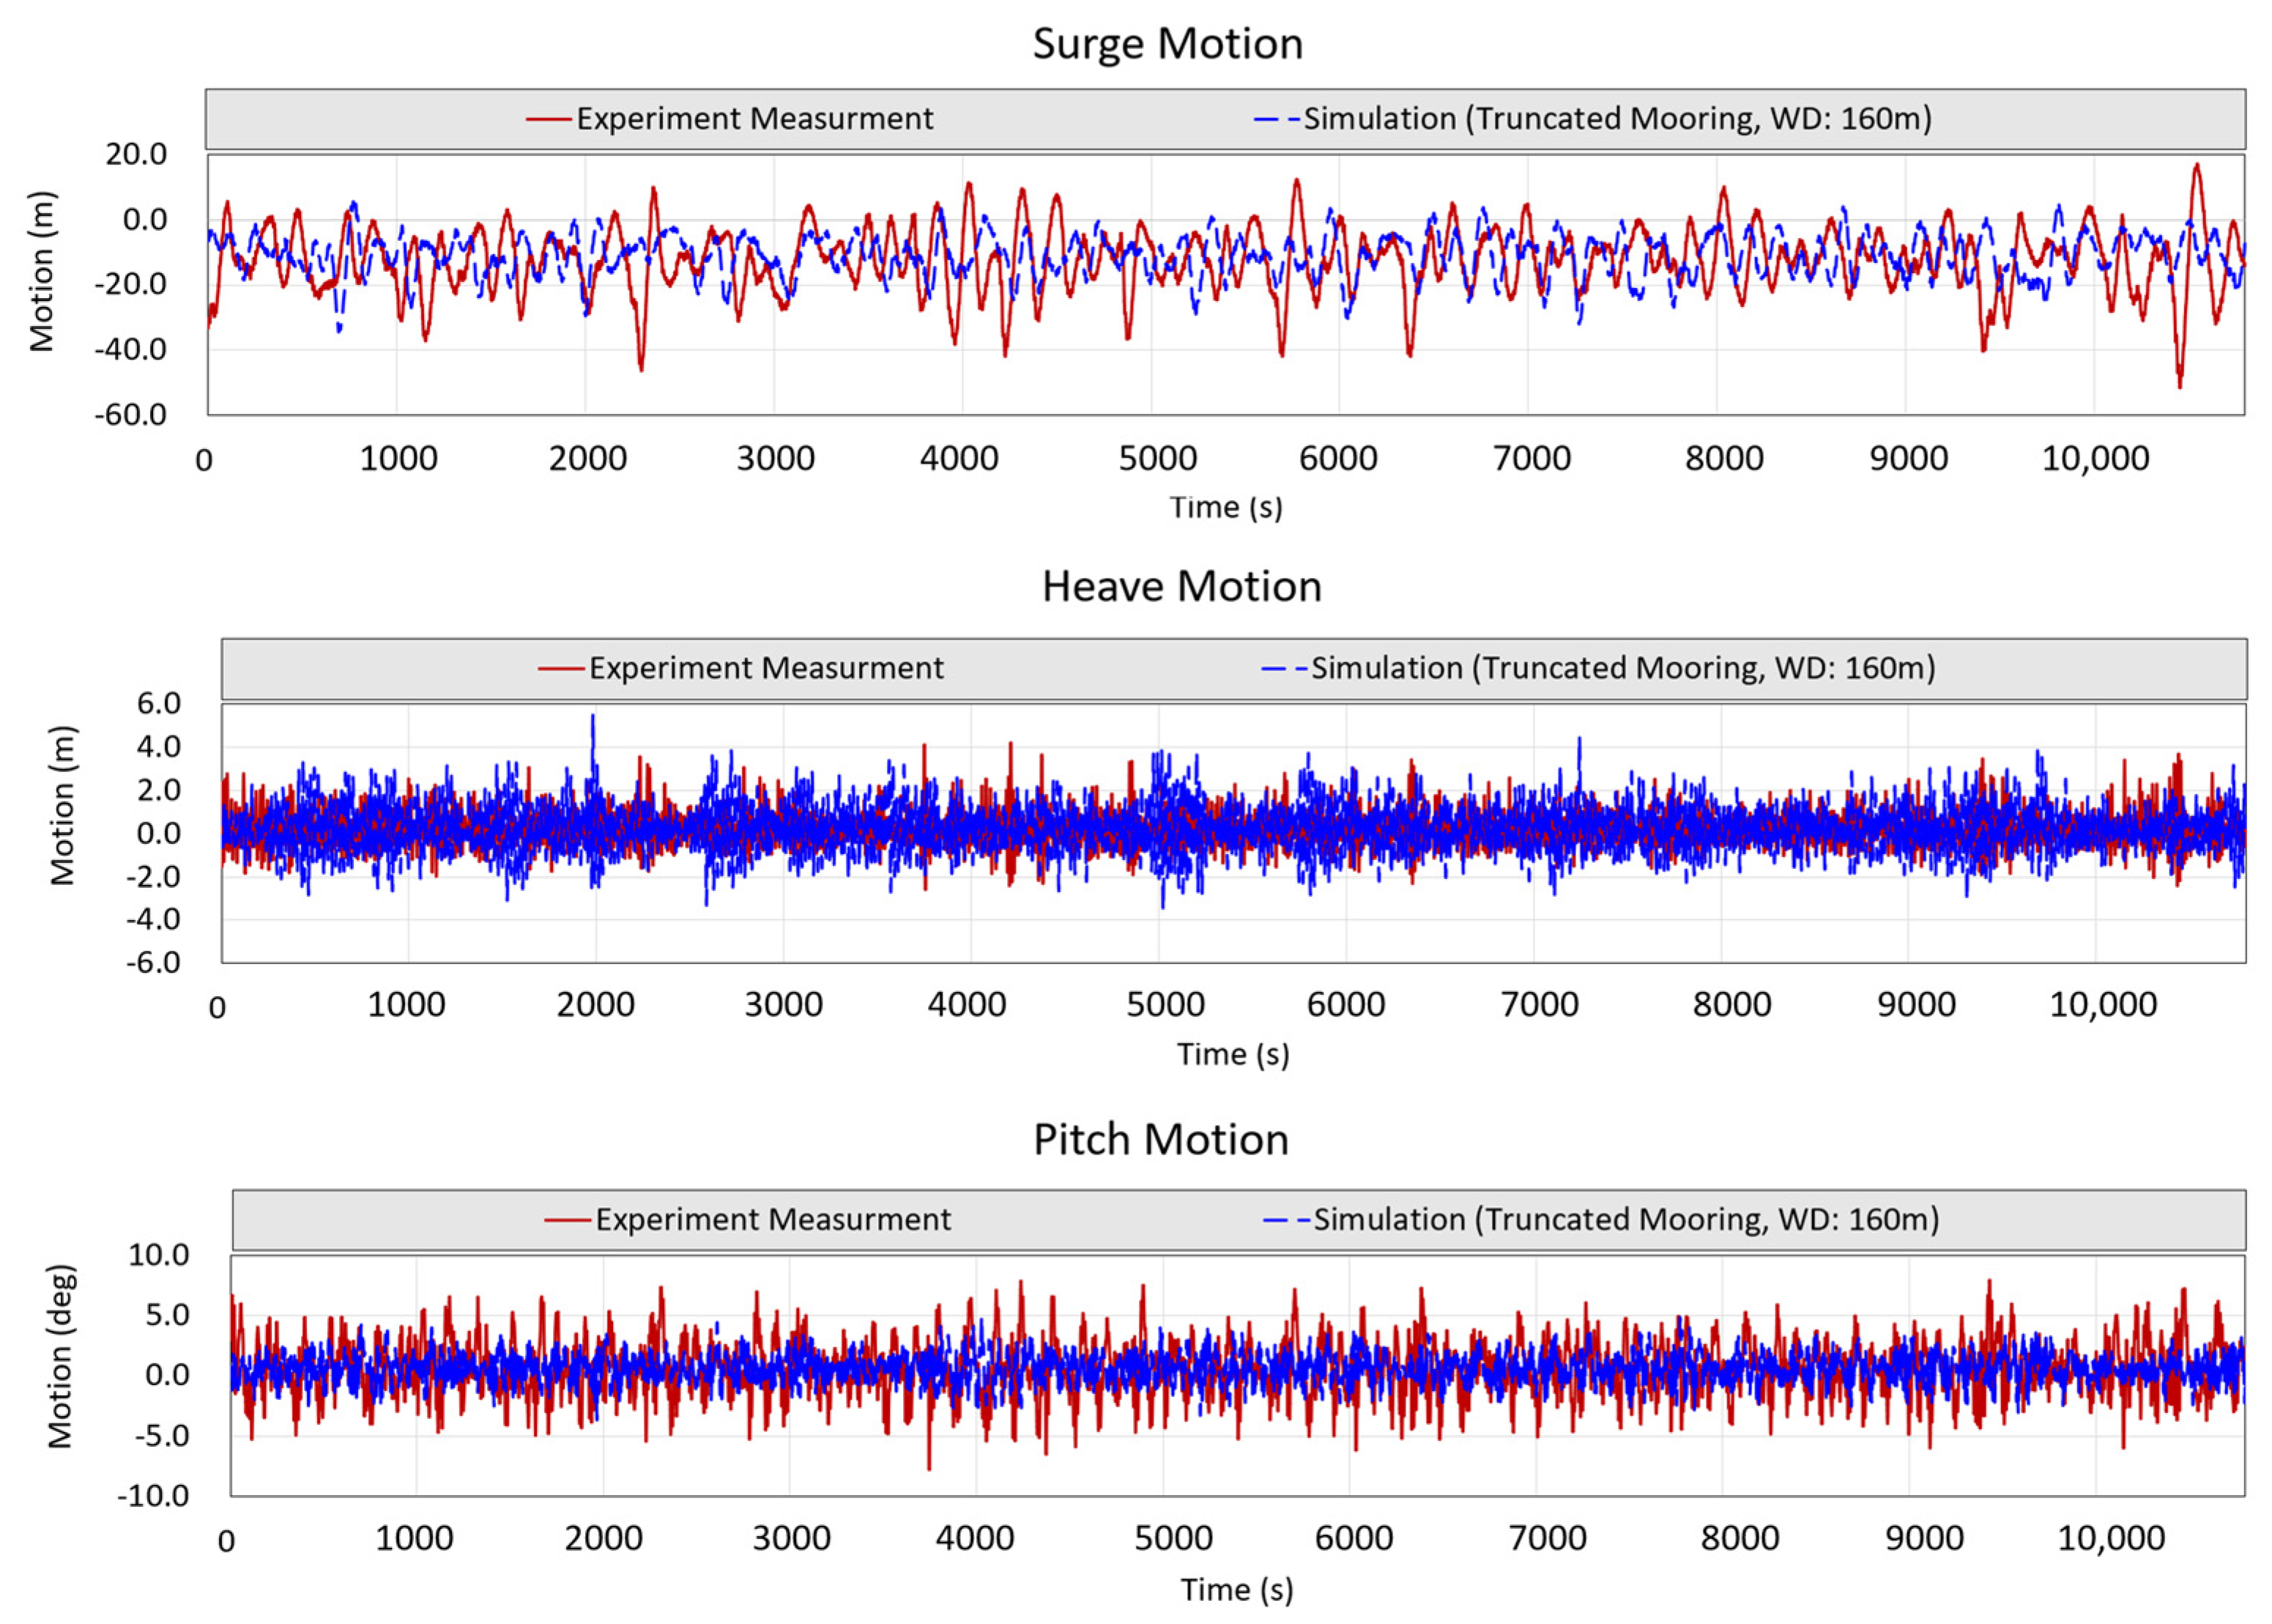
Figure 22 shows the full-scale results of the time series of the surge, heave, and pitch motion measurements obtained from the model test. The findings show that the low-frequency surge motion is substantial, where the K-Semi moves up to −40 m from its initial position. Because of the large surge motion of the K-Semi, there is a large variation in the vertical restoration of the mooring system, as shown in
Figure 10 and
Figure 11. Consequently, it is expected to affect the pitch motion characteristics of the K-Semi. This is evident in
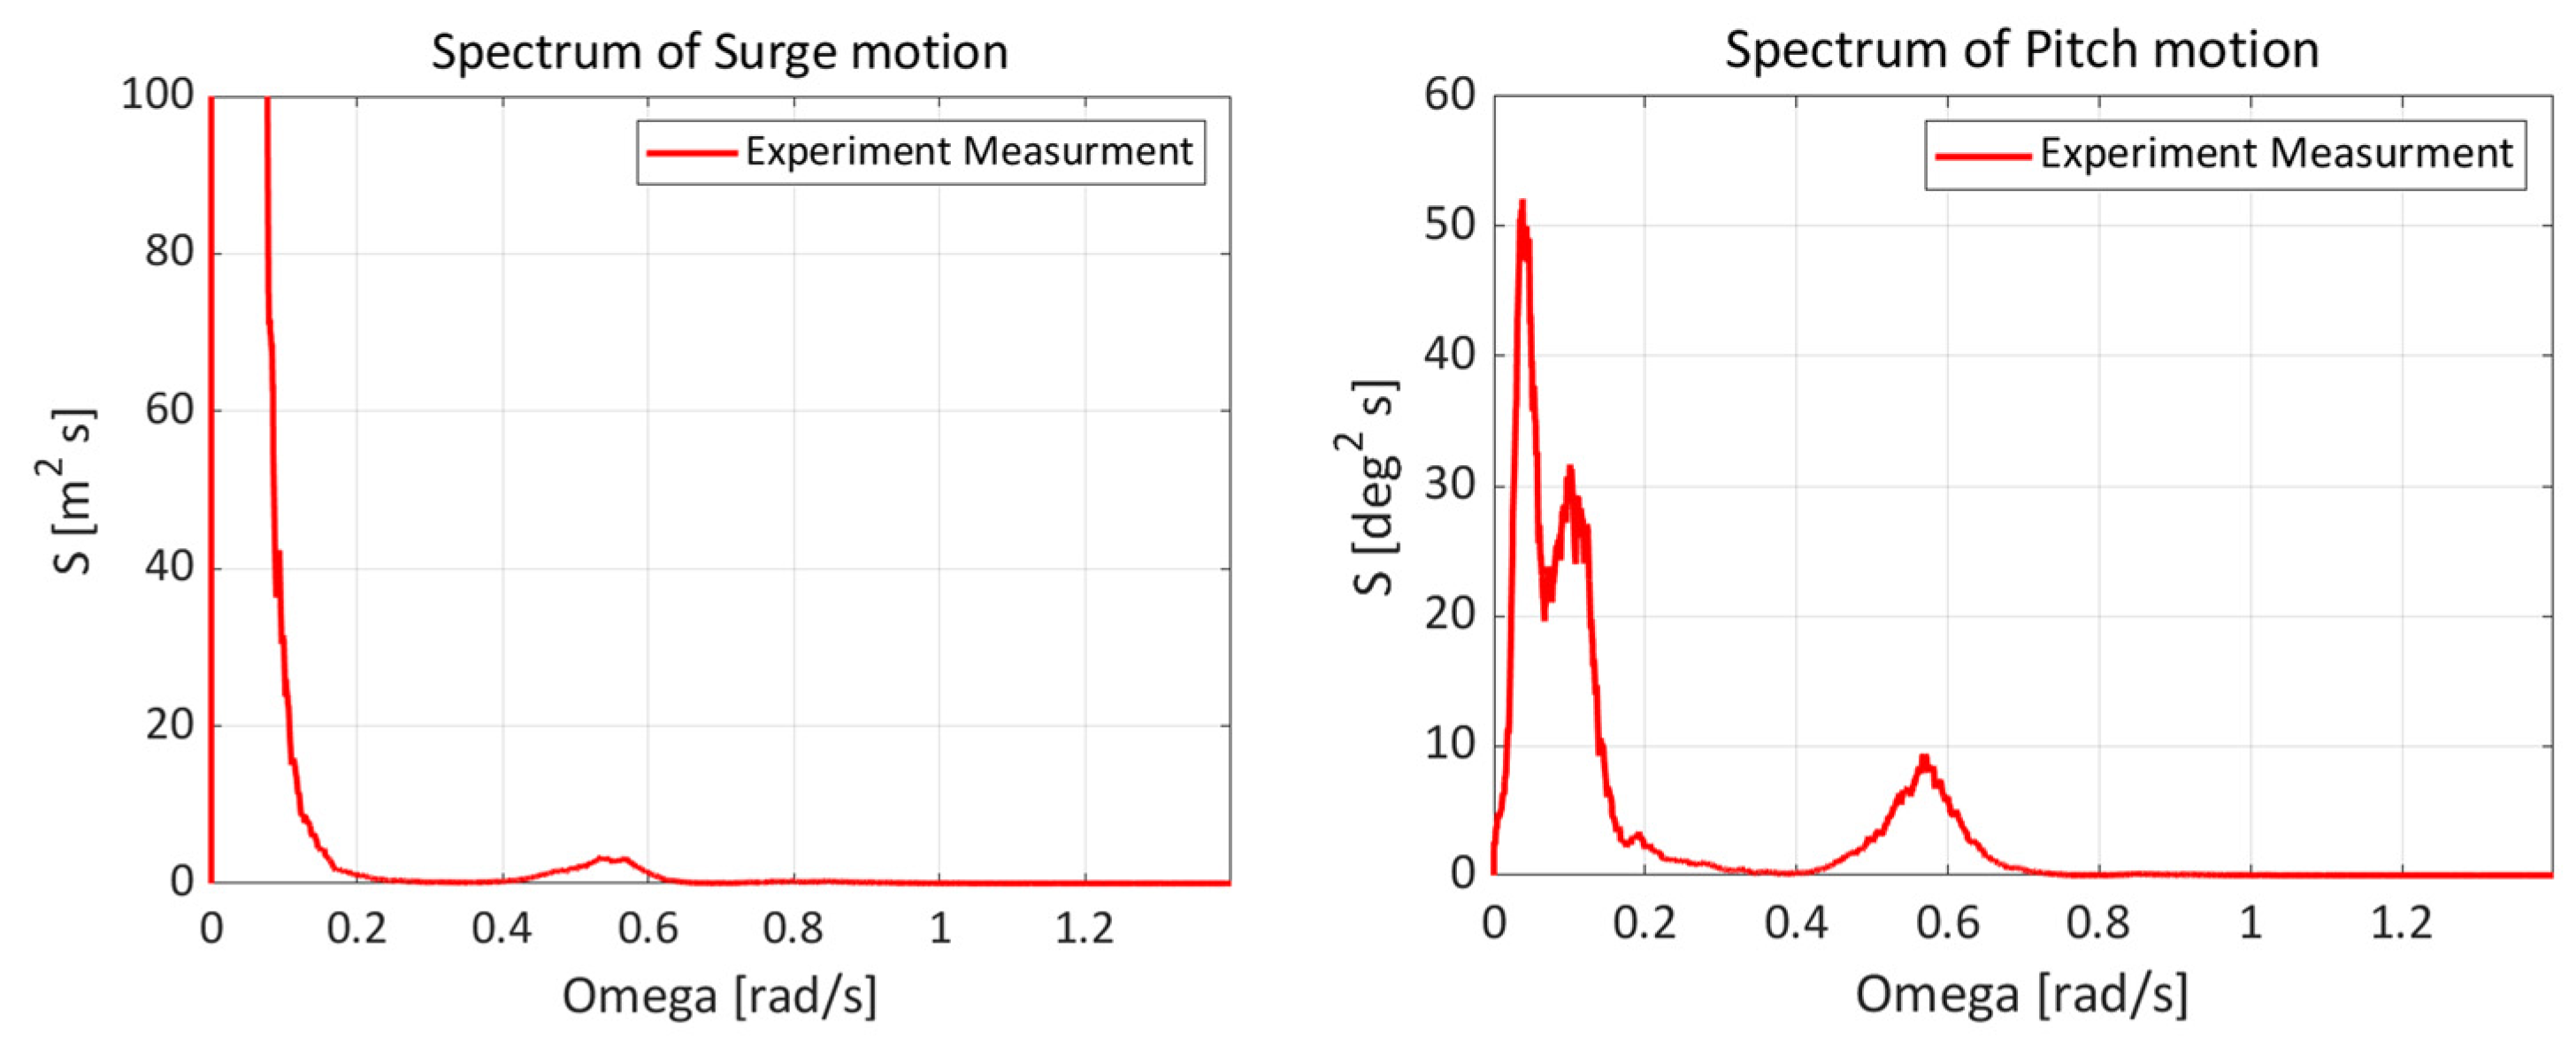
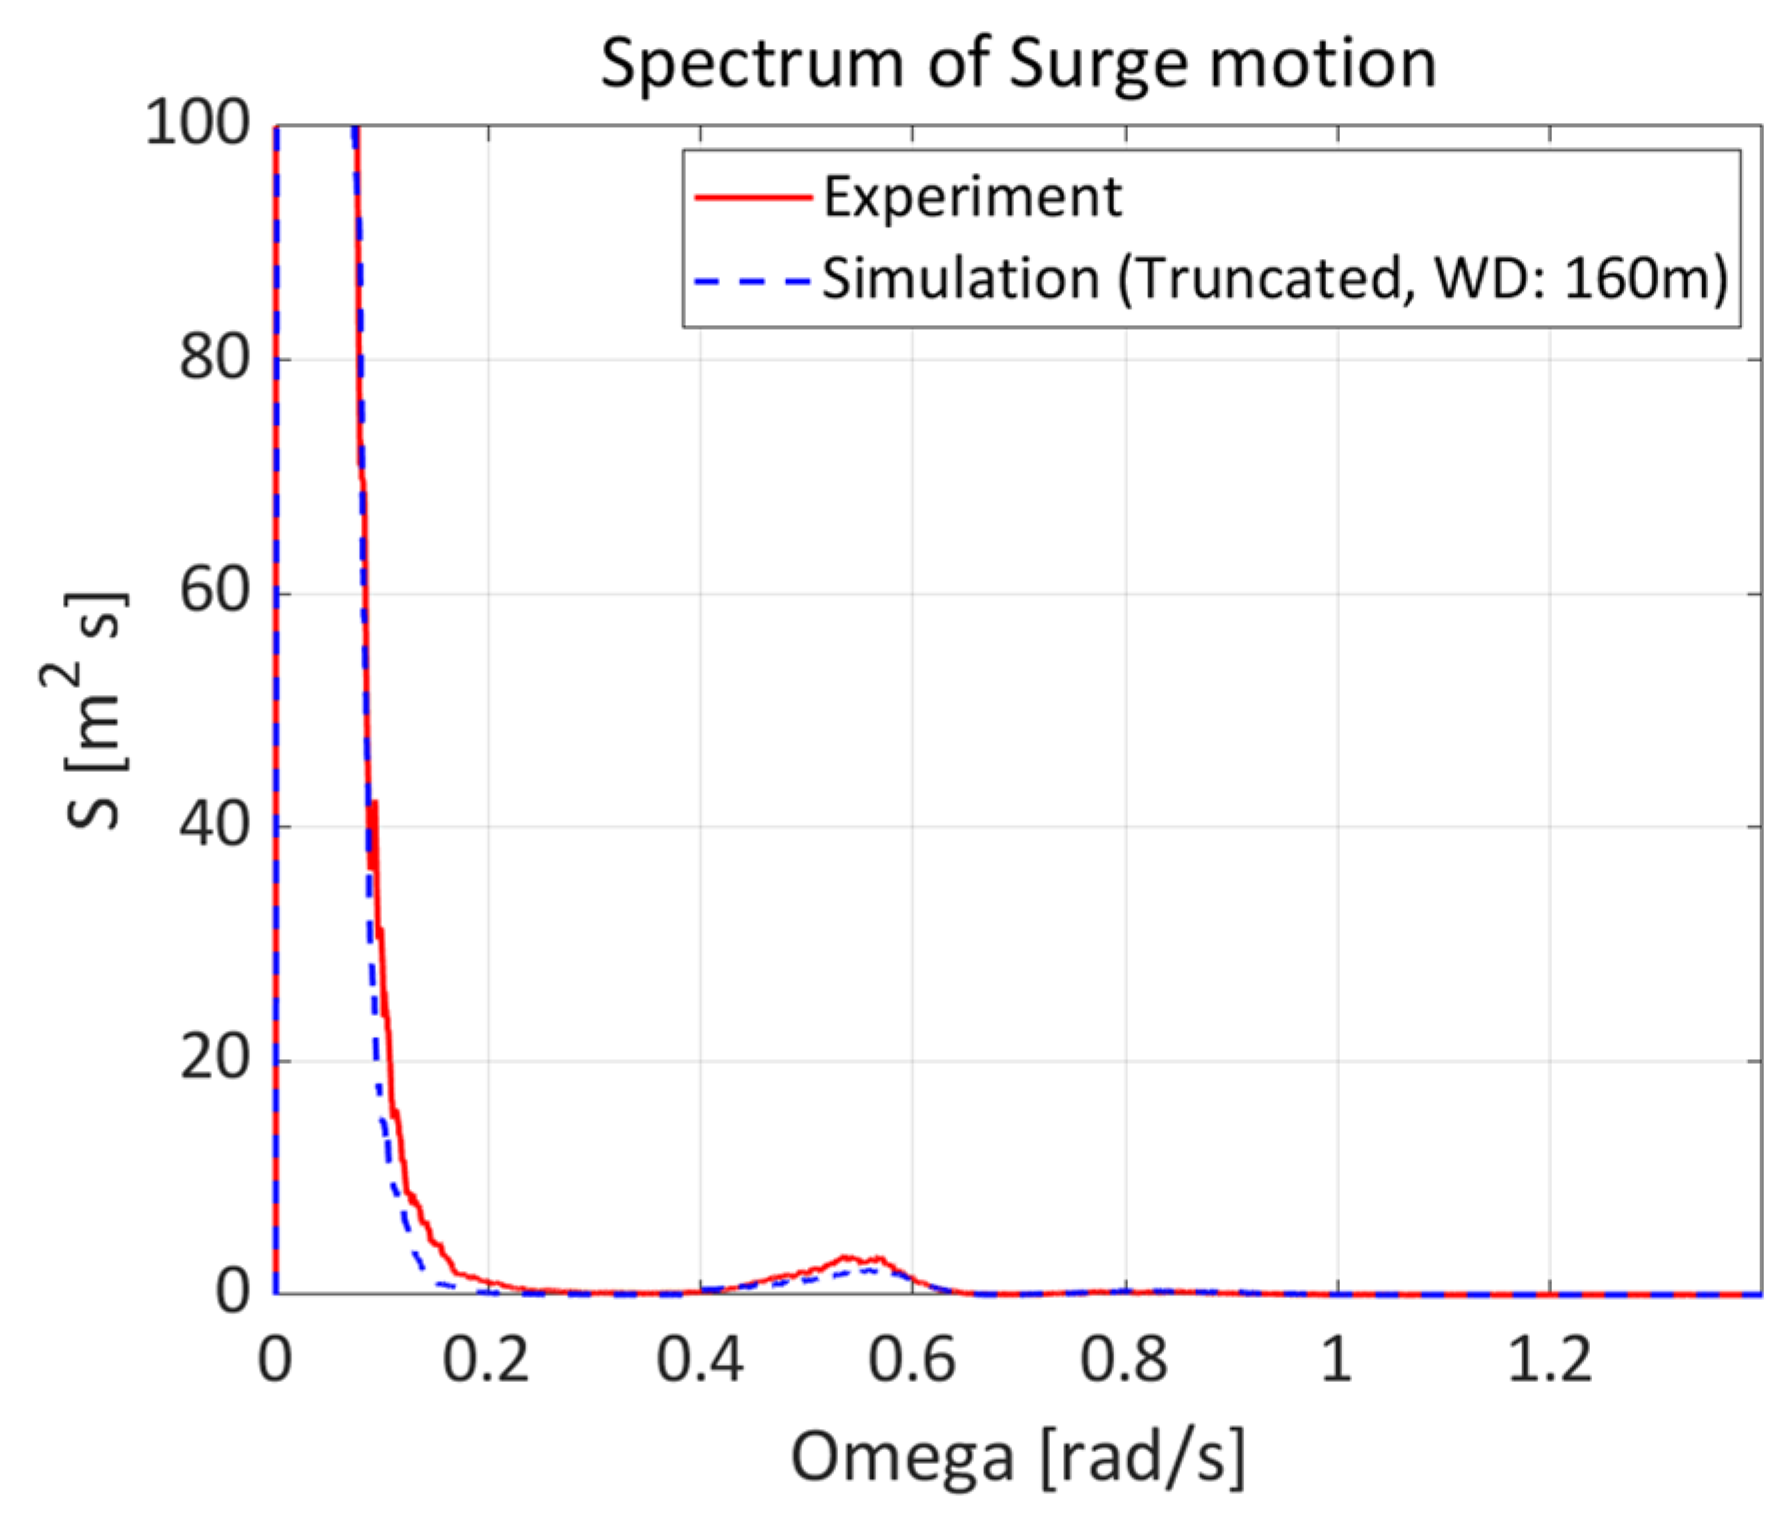
Figure 23, which shows the motion response spectra for surge and pitch motions. The motion response spectrum is shown in
Figure 23. In the motion response spectrum, the low-frequency component of the surge motion is large, and the pitch response spectrum is characterized by three peaks. The first peak corresponds to the period of the incident wave at about 0.59 rad/s (10.64 s), and the second peak corresponds to the second-order pitch motion region at about 0.14 rad/s (greater than about 45 s).
Figure 24 shows the second-order pitch motion spectrum calculated using Equation (3) and also the model test pitch motion spectrum results. The second-order pitch motion of the model test was in good agreement with the low-frequency pitch motion results calculated by the QTF, confirming the presence of the second-order pitch motion of the K-Semi.
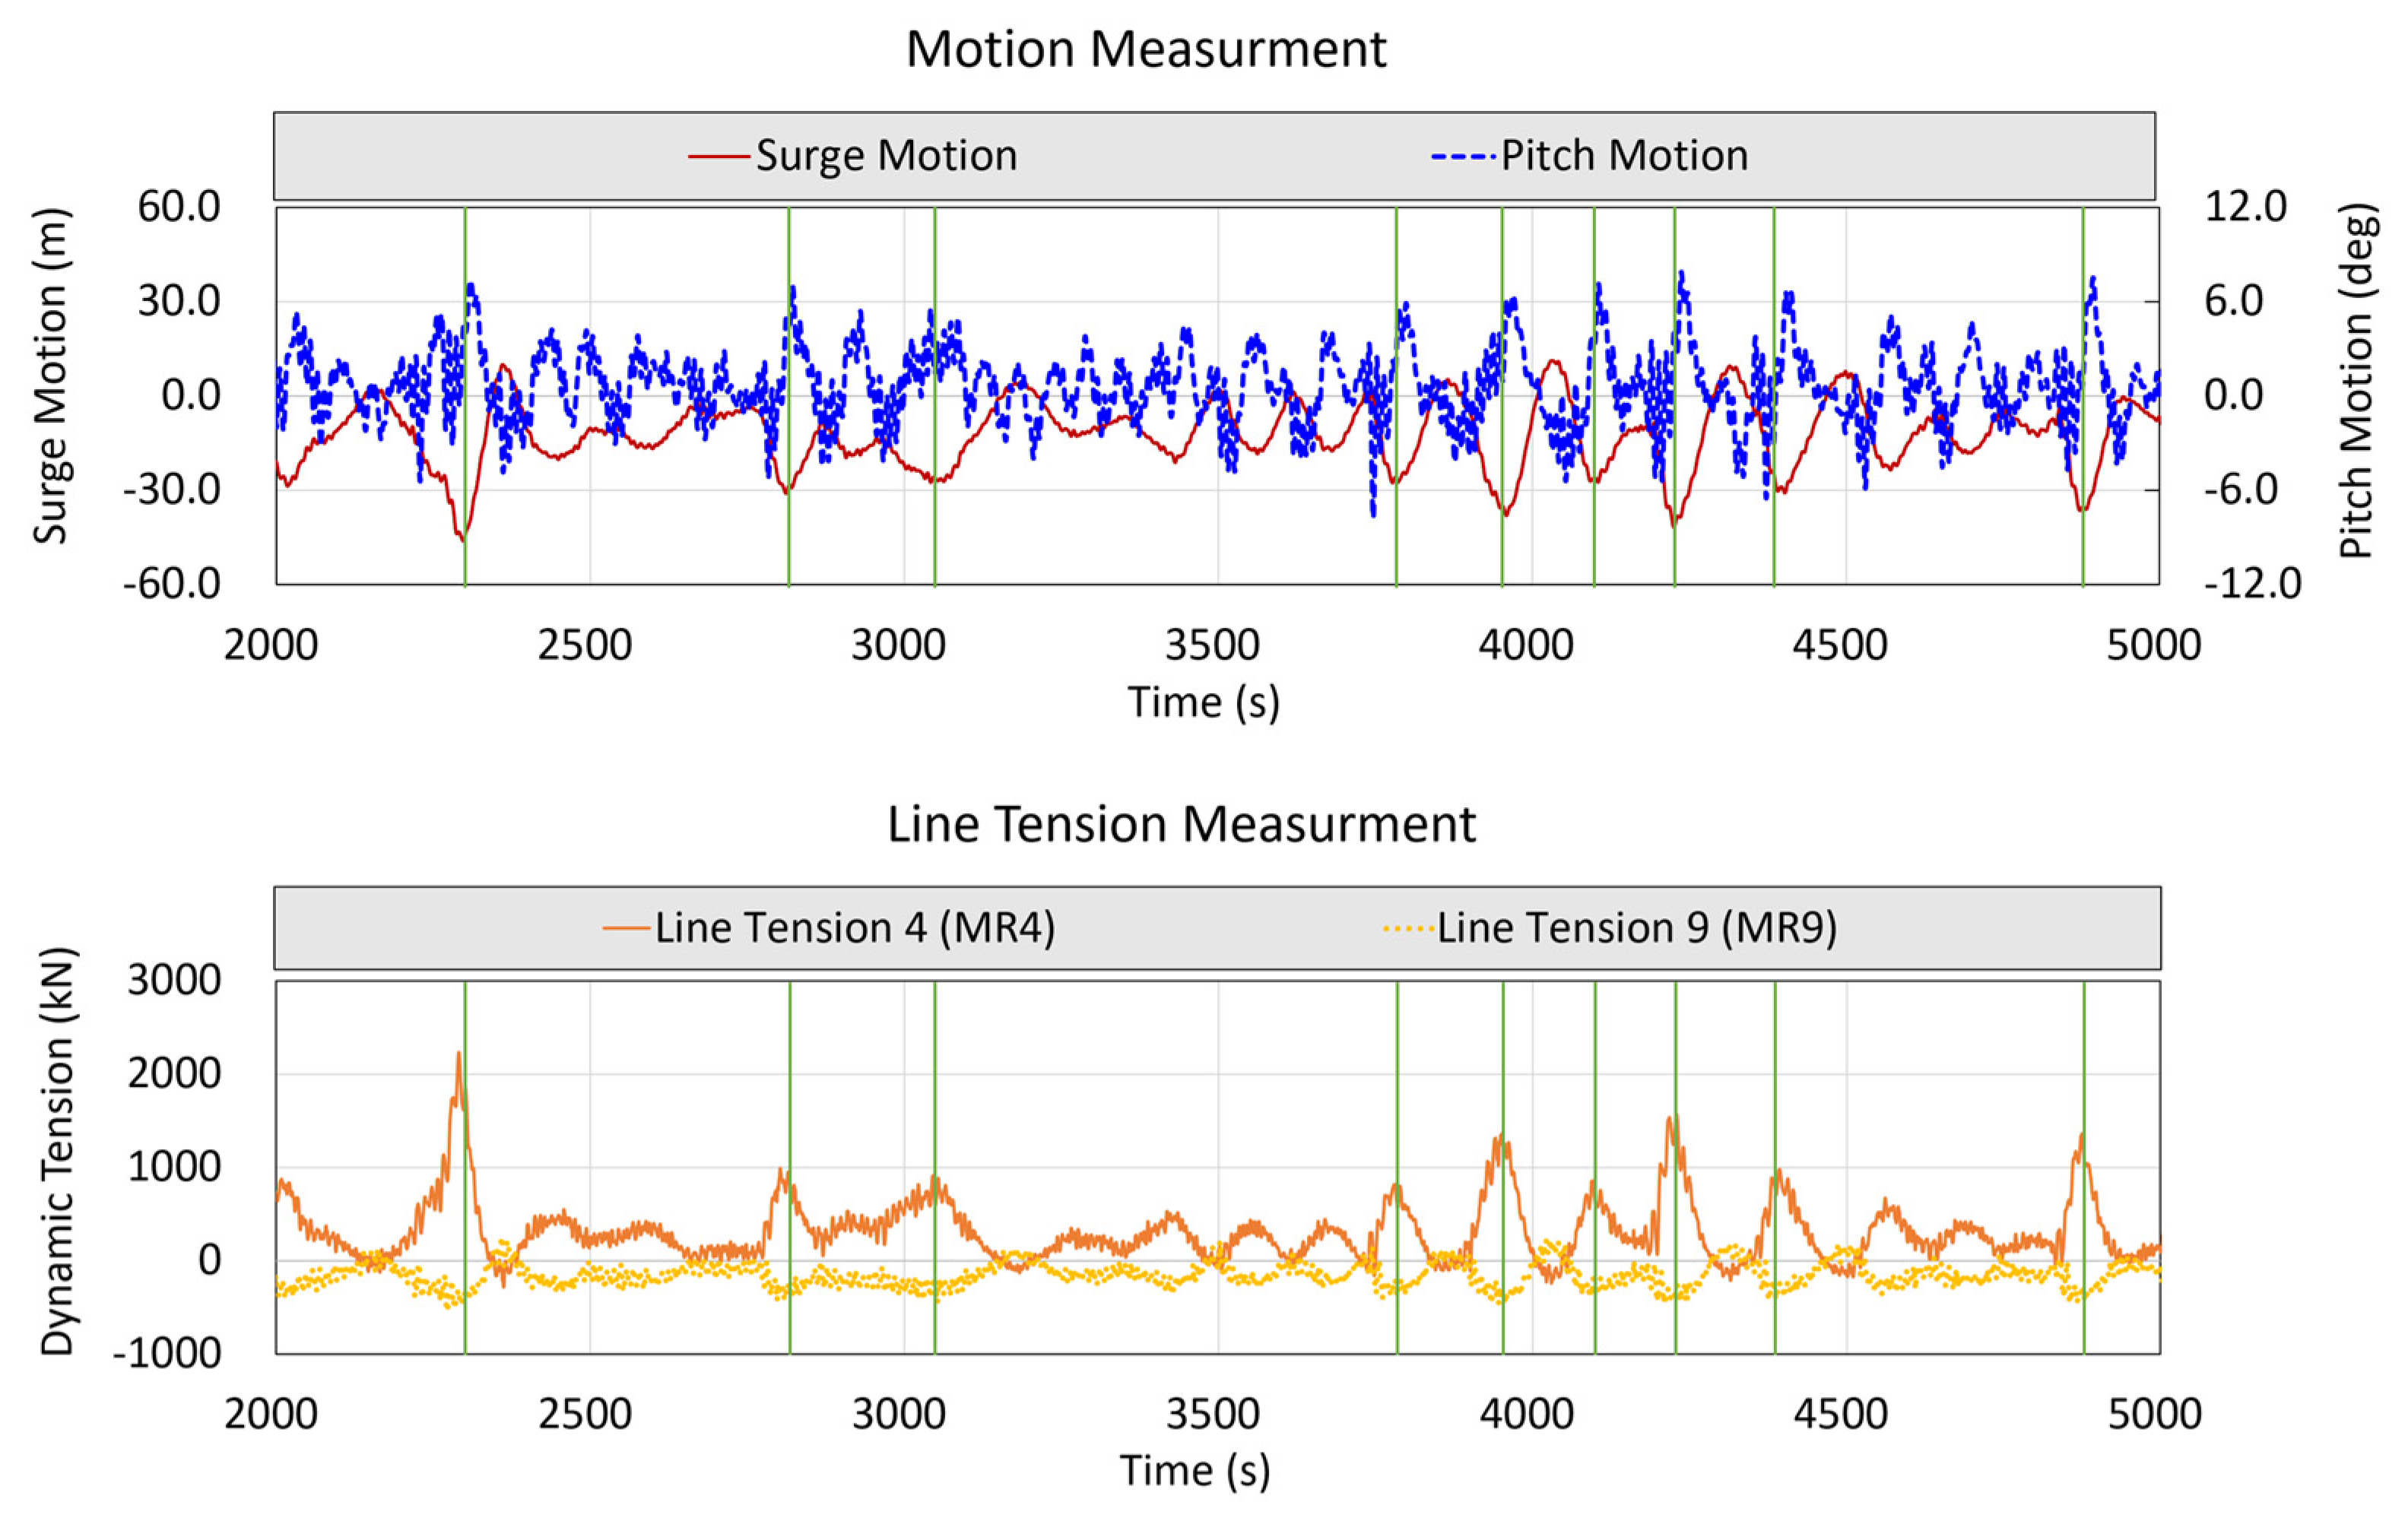
The peak region below 0.08 rad/s (over 78.5 s) corresponds to the lowest frequency pitch motion component, which has a longer period than the second-order pitch motion component. This is close to the period of low-frequency drift motion in the surge direction. When large surges occur, the low-frequency pitch motions are large due to the difference in the restoring force between the front and rear ends of the mooring system connected to the K-Semi as well as the pitch moment. From the time series results shown in
Figure 25, it is clear that the experiment shows an instantaneous increase in the surge due to the low-frequency surge motions caused by second-order low-frequency wave force, with a simultaneous large pitch motion. The tension results of the mooring line measured in the model test show the cause of coupling with surge and pitch motion. The mooring configuration in
Figure 8 shows mooring line 4 connected in the bow direction and mooring line 9 connected in the stern direction of the K-Semi. In
Figure 25, the line tension on mooring line 4 becomes larger while the load on mooring line 9 becomes smaller when the surge occurs. This asymmetry of load acts as a pitch moment on the floater, and the pitch moment results in a large pitch motion.
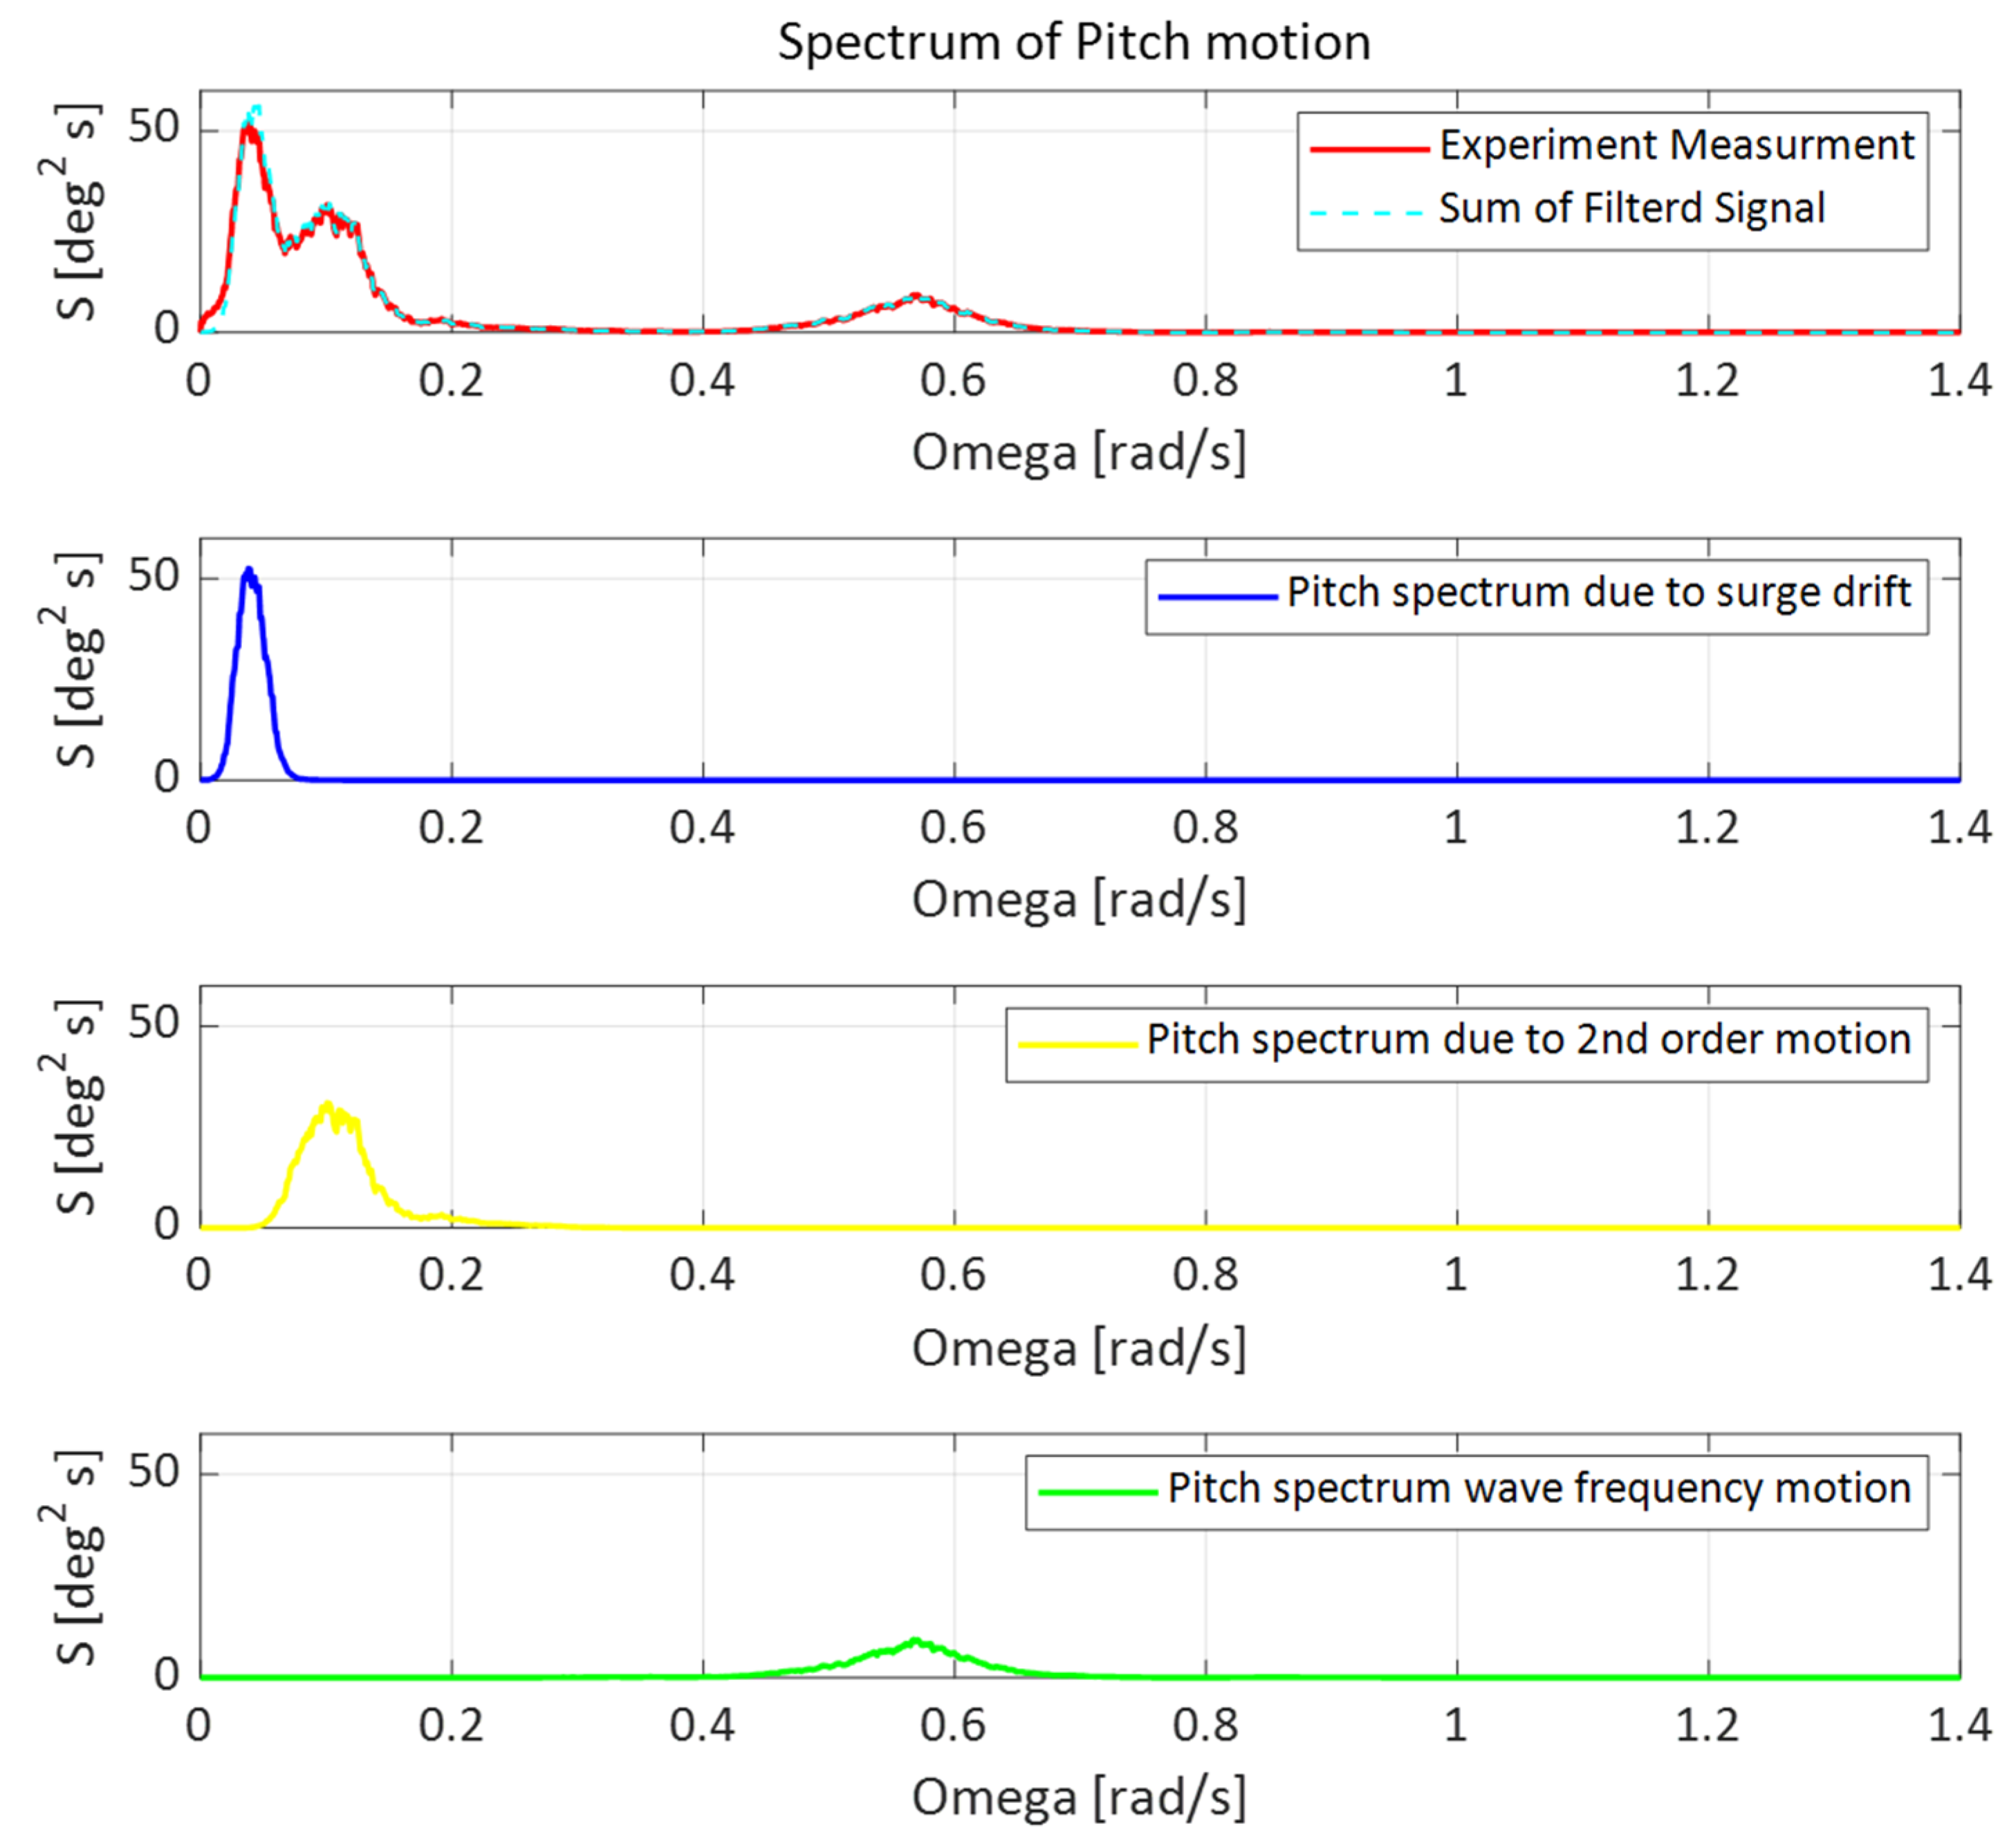
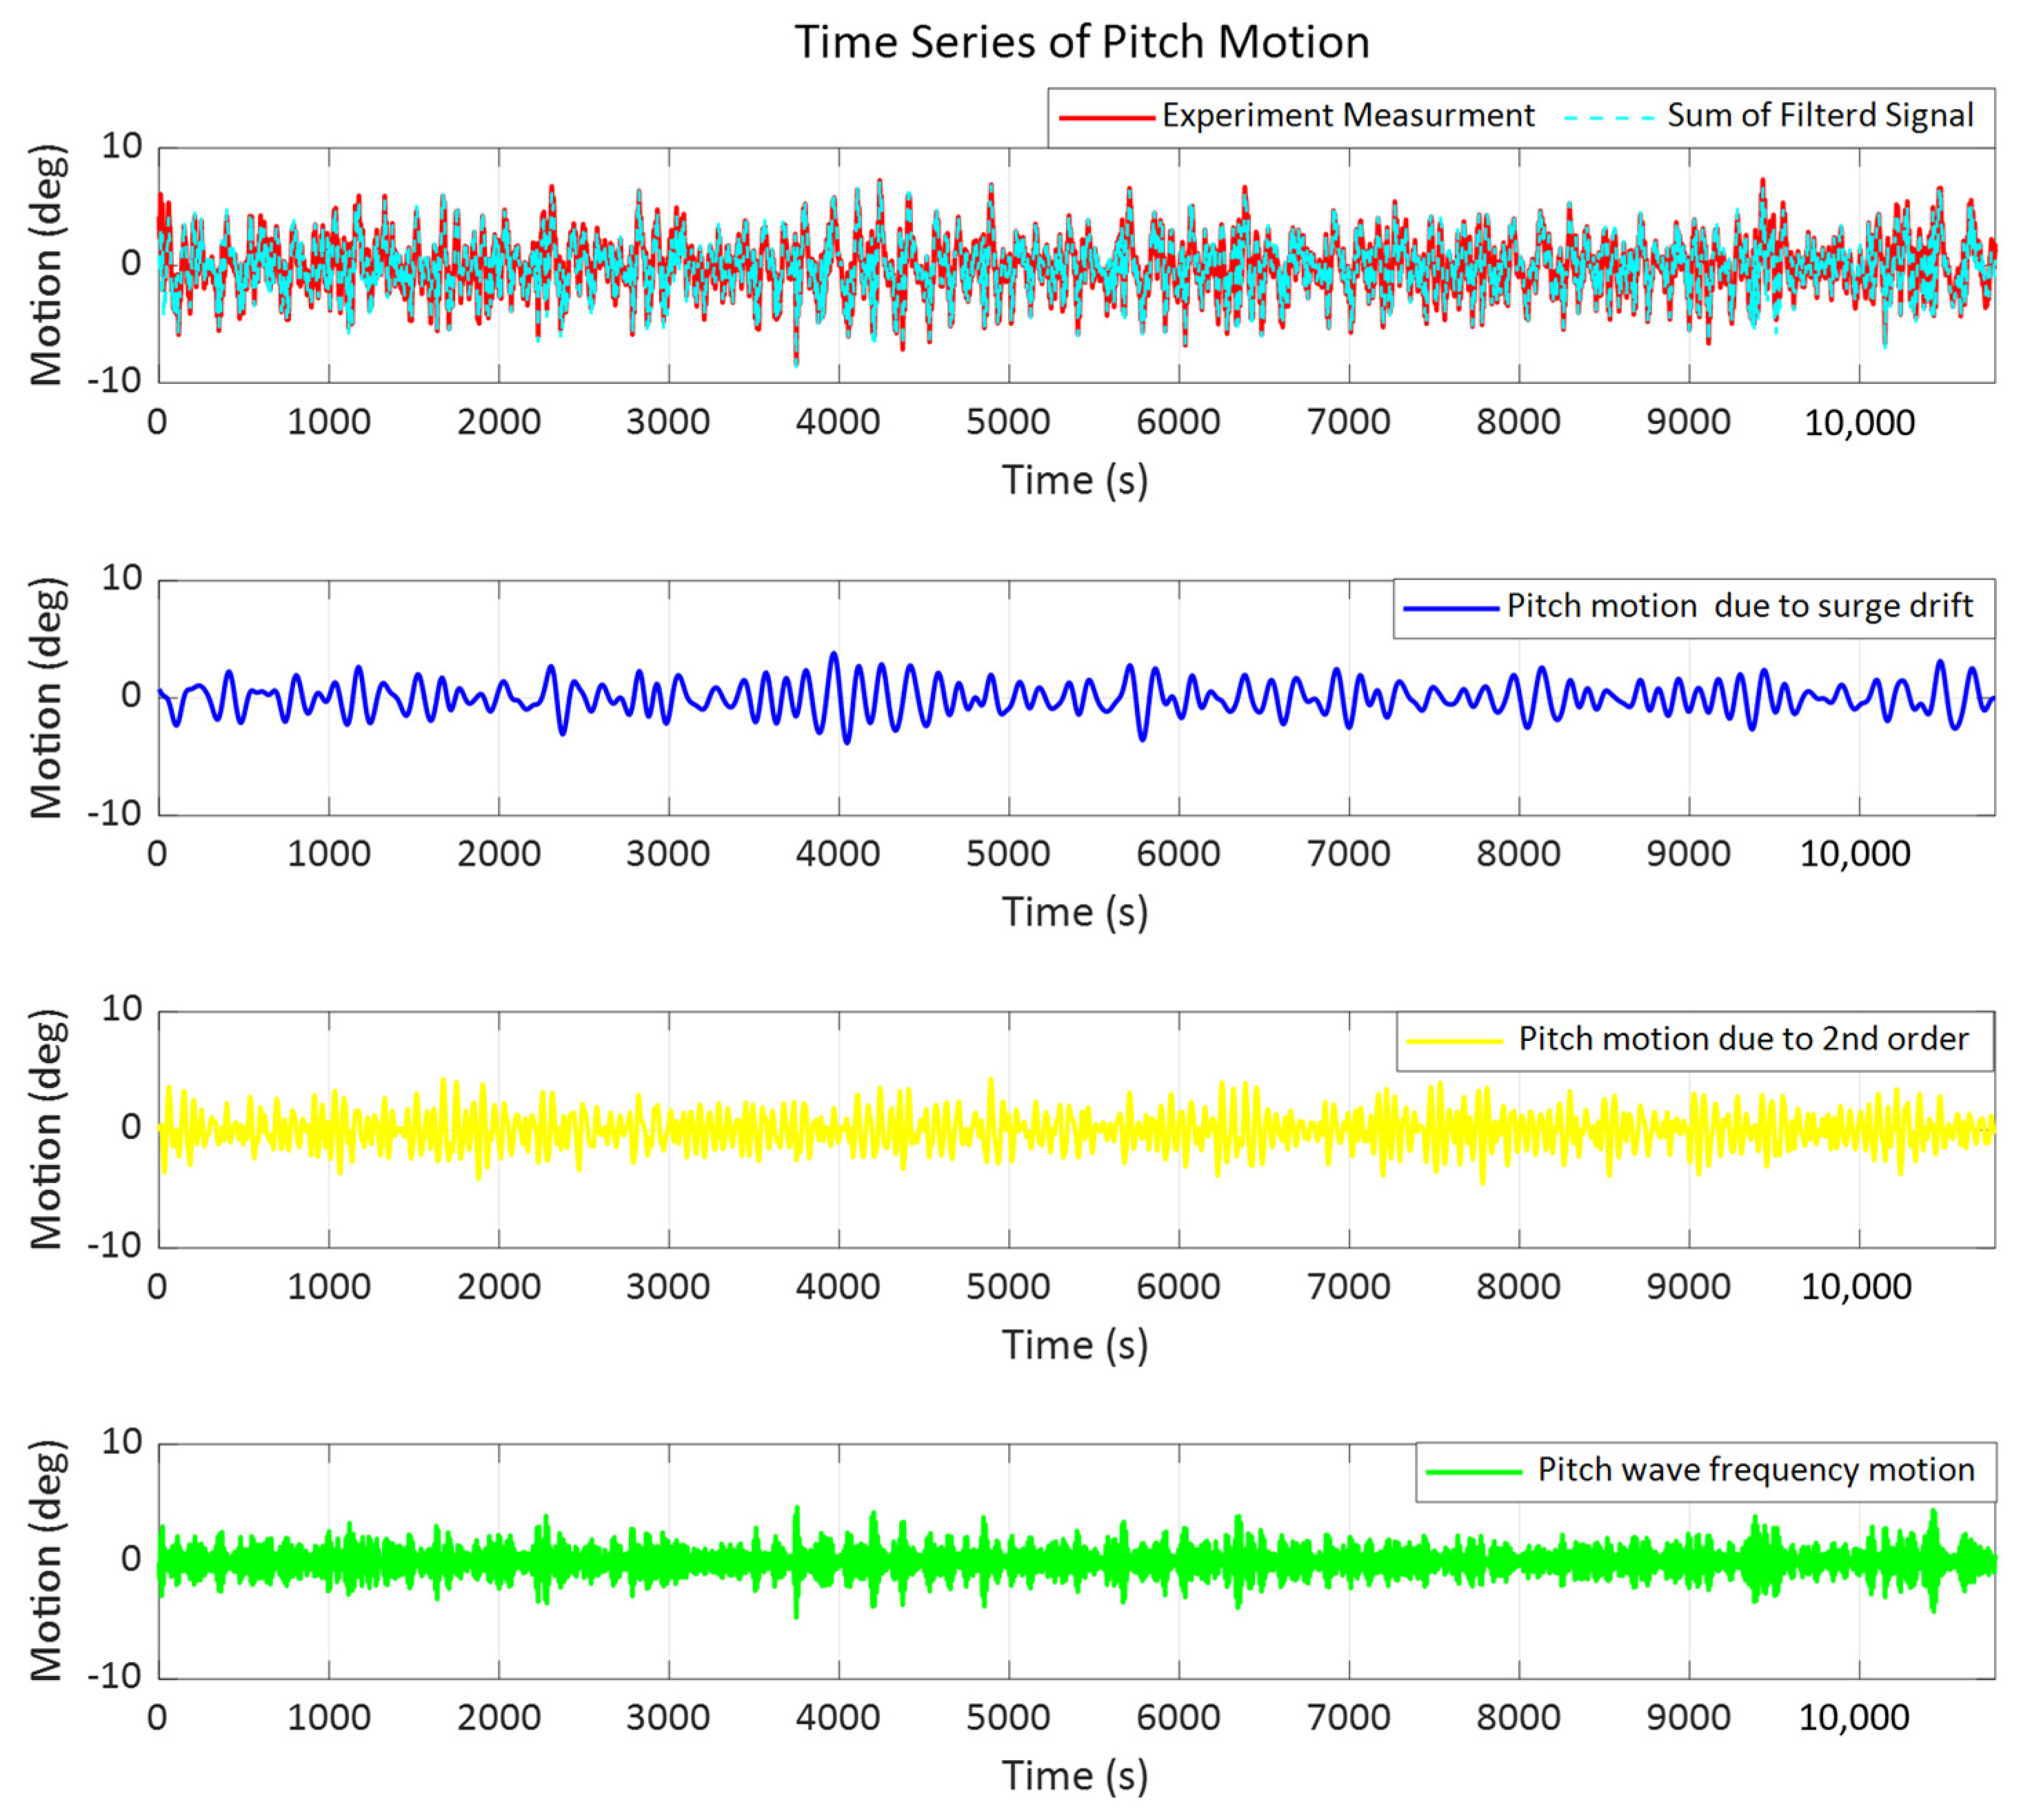
To comprehend the pitch motion characteristics of the K-Semi, which was the primary focus of this study, a filter was applied to the pitch time-series results obtained from the model test to separate the time series under each major periodic condition, consequent to which, the response spectrum was obtained. A bandpass filter was applied to the measurement results, resulting in three separate regions: the resonance period of the surge motion, the resonance period of the pitch motion of the K-semi, and the period of the incident wave. The original time series and spectrum were then reconstructed by summing each periodic component to ensure that no signal was lost due to the application of the filter.
Figure 26 shows the time series of the truncated mooring model test with the motion components separated for each periodic condition after application of the filter. The response spectrum results are shown in
Figure 27. These figures show that the pitch motion results of the model test exhibited three periodic condition components, as previously discussed.
Figure 28 presents a comparison between the results of the model test and numerical simulation for the surge, heave, and pitch motions. Previously, the numerical model was calibrated to show results similar to the time series of the decay test and the RAO of the regular wave test results. The numerical simulations showed a close resemblance to the results of the model test for the heave motion, whereas the results of the numerical simulation showed slight disagreement with the model test results for the surge and pitch motions. This is attributable to not accounting for the effect of the fluid drag component acting on the floating body, which increased the surge motion. Consequently, the smaller values obtained through the numerical results for the pitch motion, as compared to the model test, can be attributed to the diminished influence of the surge motion in the numerical simulation.
Figure 29 shows the response spectrum of the surge motion, indicating that the experiments and numerical simulations were similar in terms of the period over which the behavior occurred.
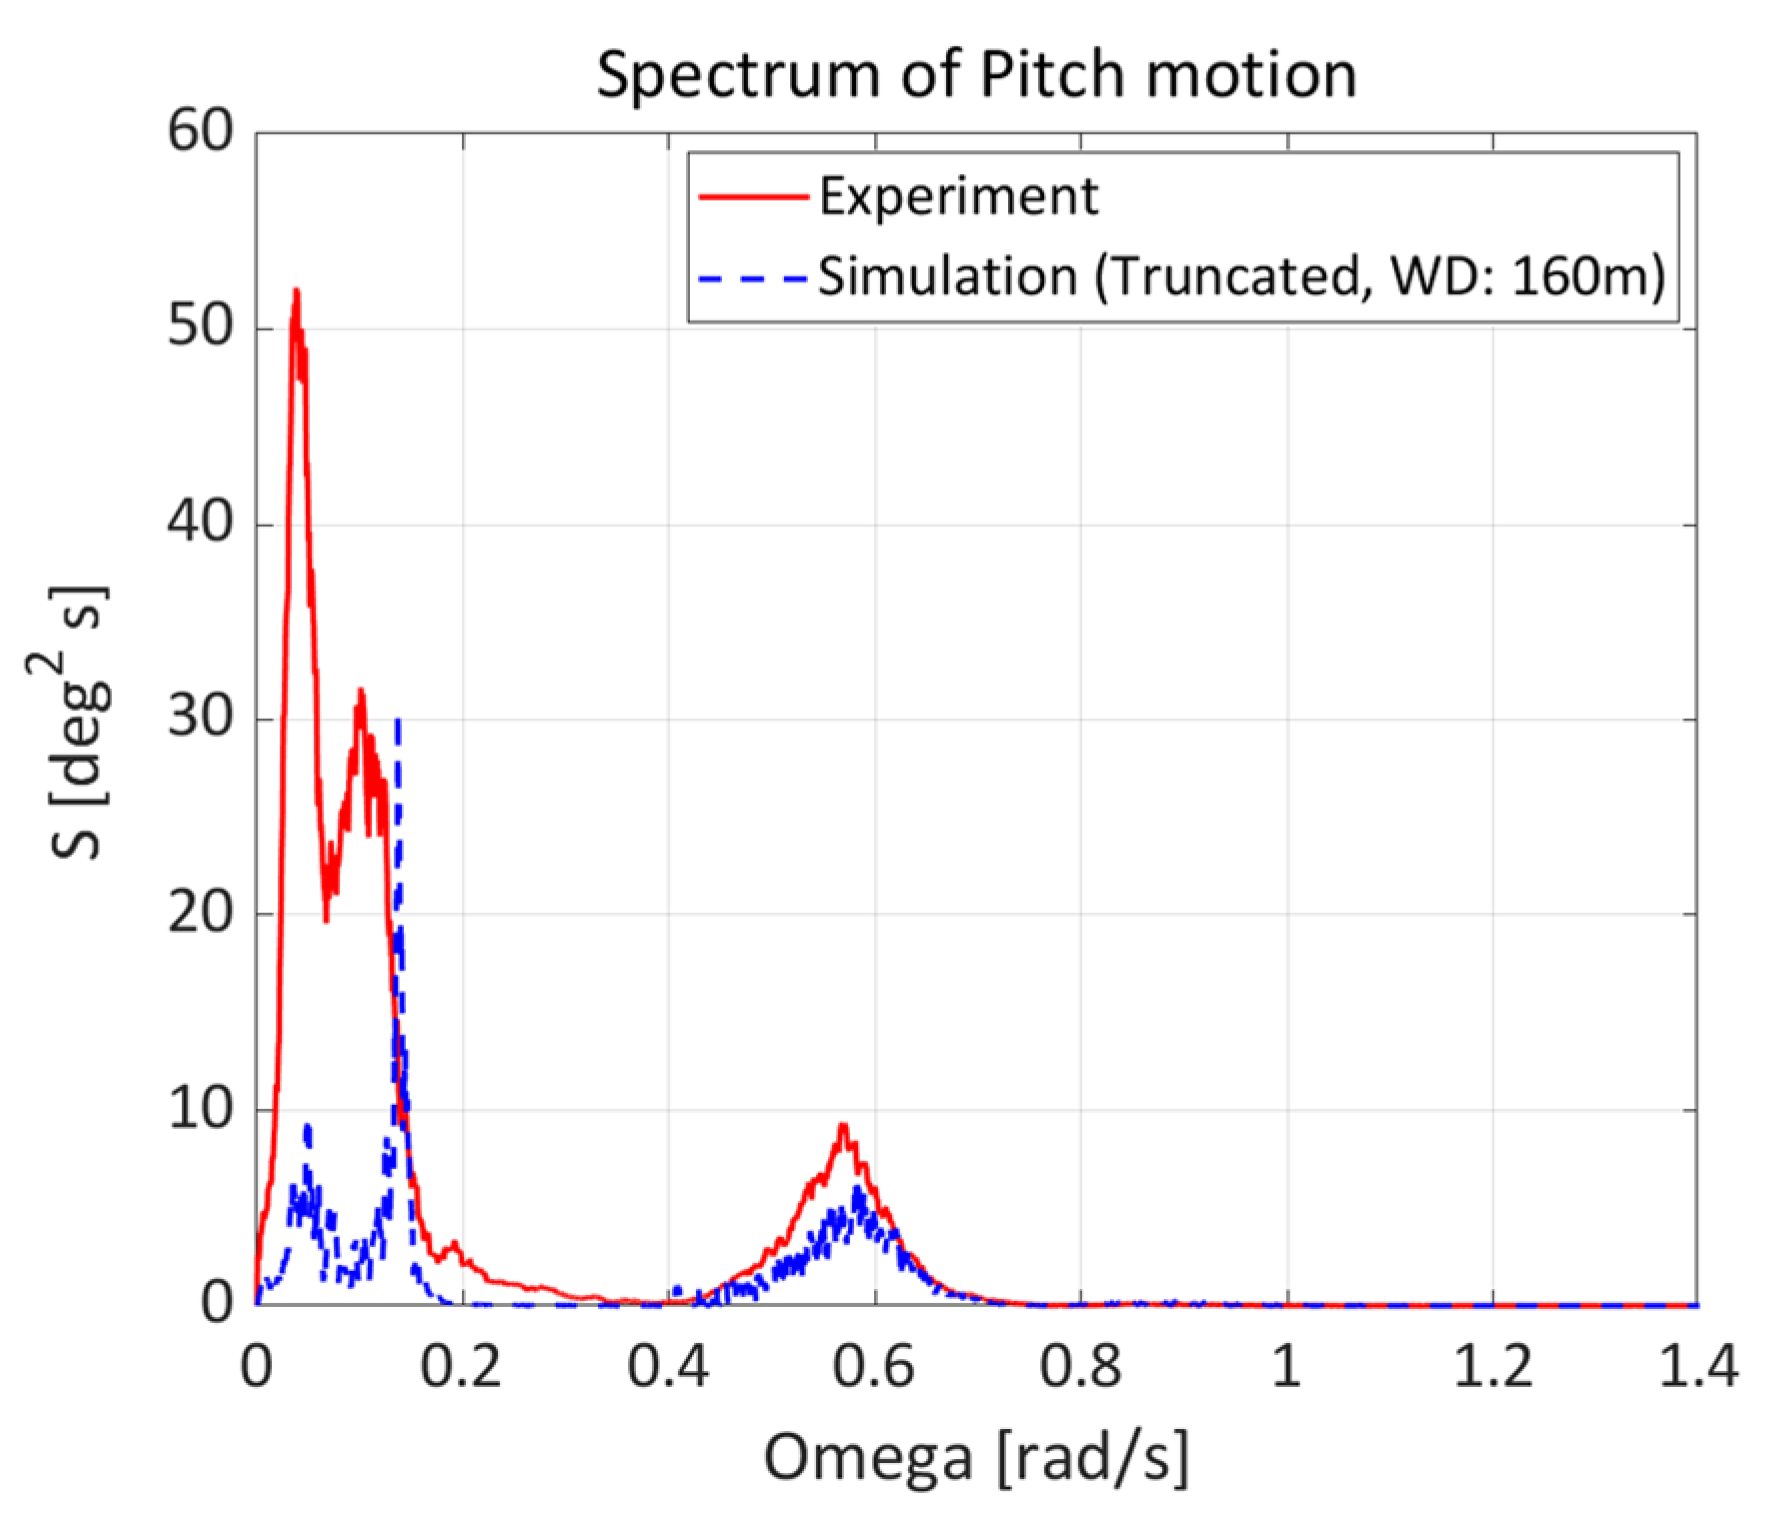
Figure 30 shows a comparison of the response spectra for the pitch motion. Three peaks were observed in the experimental and numerical simulations. Under the periodic condition of the incident wave, about 0.59 rad/s (10.64 s), a linear motion owing to the incident wave was observed, and a long periodic motion was observed at about 0.14 rad/s (about 45 s or more), which is the second-order motion region. These are the same as the response spectrum using QTF in the frequency domain of
Figure 19, which shows that the nonlinear motion due to nonlinear wave forces is significant in column structures such as K-Semi and is an important part of the performance evaluation of the motion response of the structure.
In addition, the lower frequency motion component compared to the second-order motion appears under the condition of 0.08 rad/s (more than 78.5 s), which corresponds to the natural period of the surge motion. In particular, the surge motion was large in the model test, which resulted in a large pitch motion. However, in the numerical analysis, as the surge motion was analyzed to be small, the effect on the pitch motion was also reduced, showing a relatively small result compared with the experiment. In the case of semi-submersible offshore structures such as K-Semi, it is necessary to investigate not only the position-keeping performance when the surge motion is large but also the excessive pitch motion associated with the surge motion and the relative wave height.
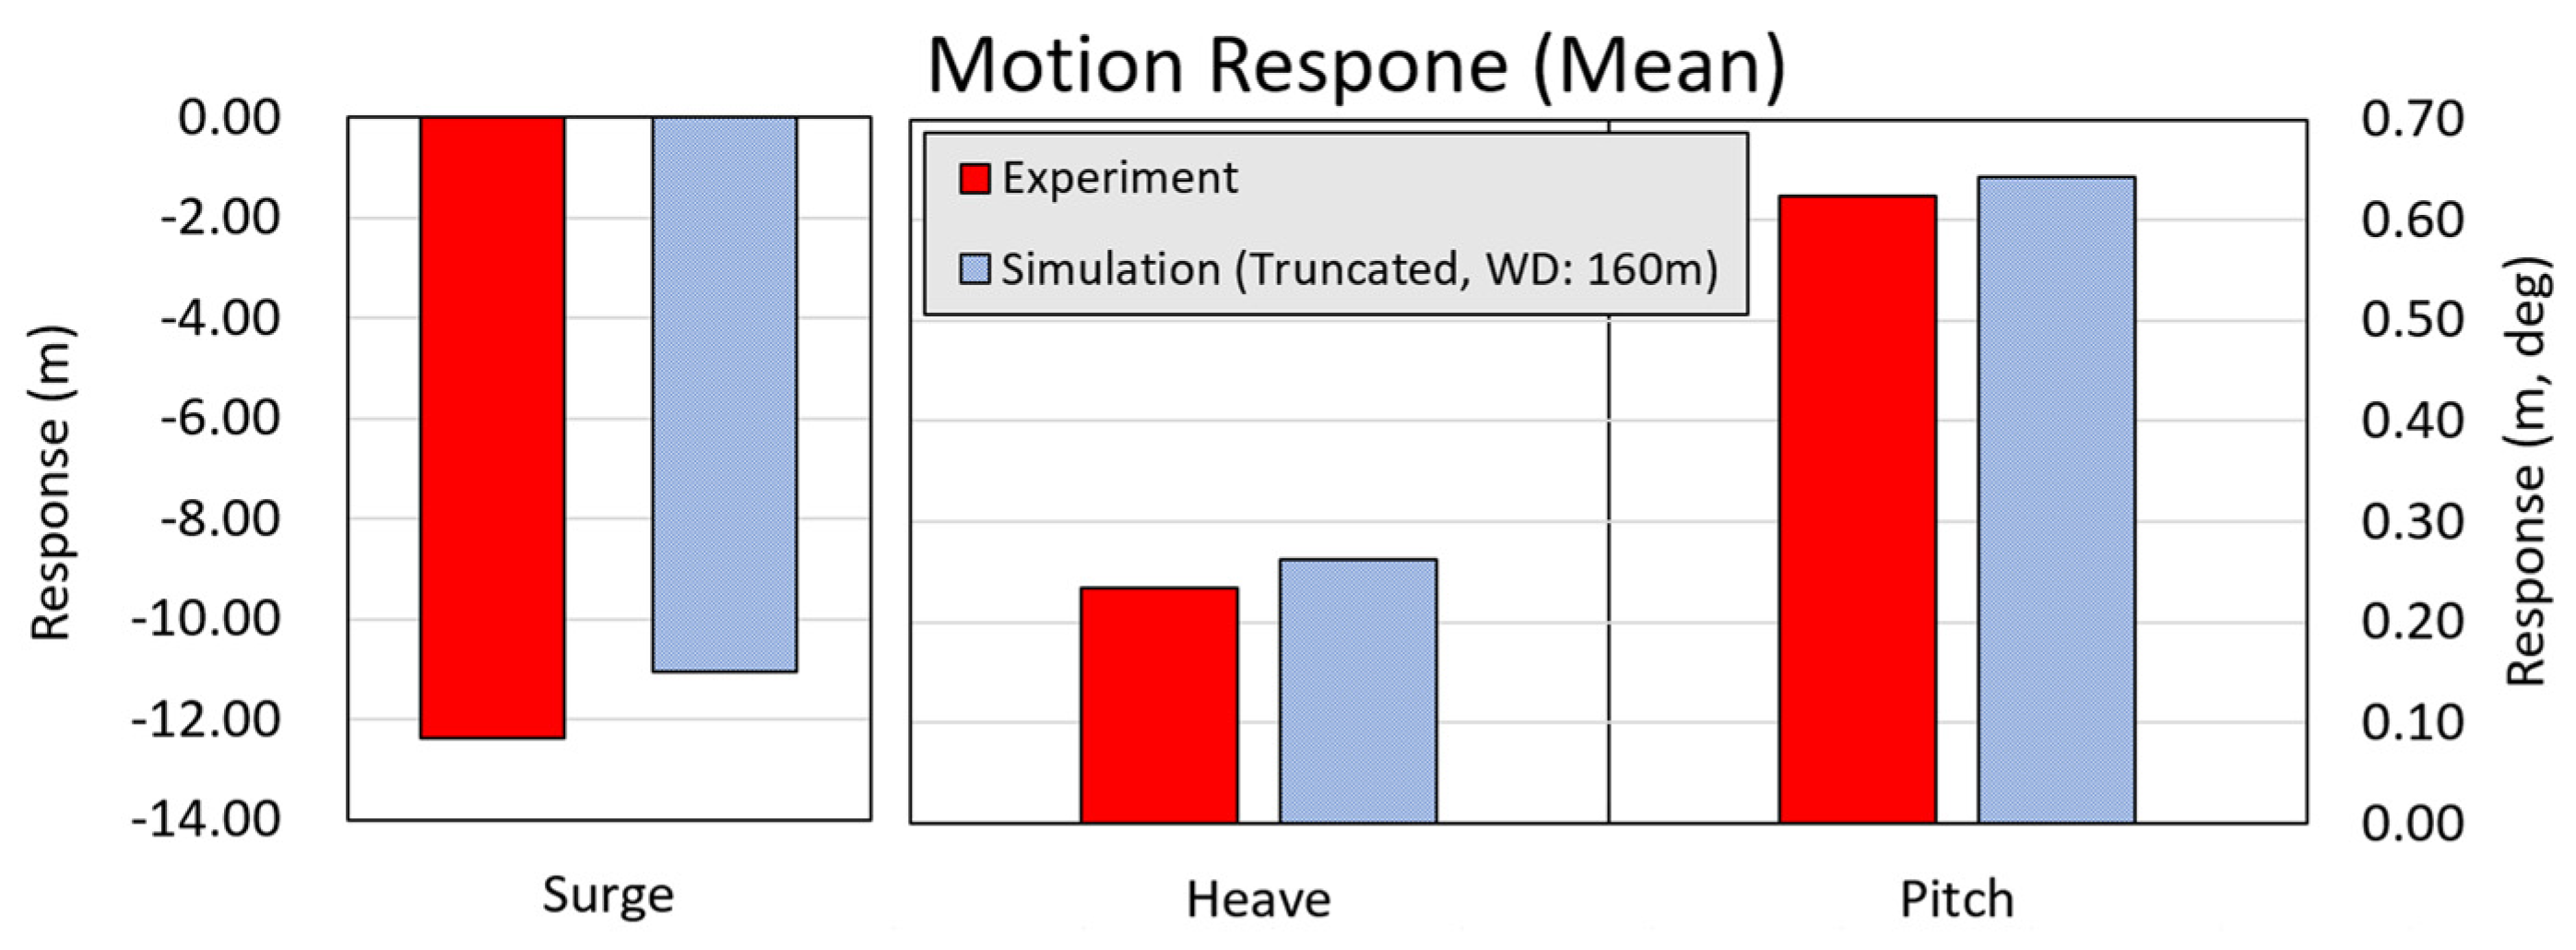
Figure 31 and
Figure 32 present the mean and standard deviations for each direction of motion. In the model test, surge motion showed a mean value of about −12.3 m, whereas smaller mean values of about −11.1 m resulted in the numerical simulations. However, the heave and pitch motions from the model test and simulation showed comparable results.
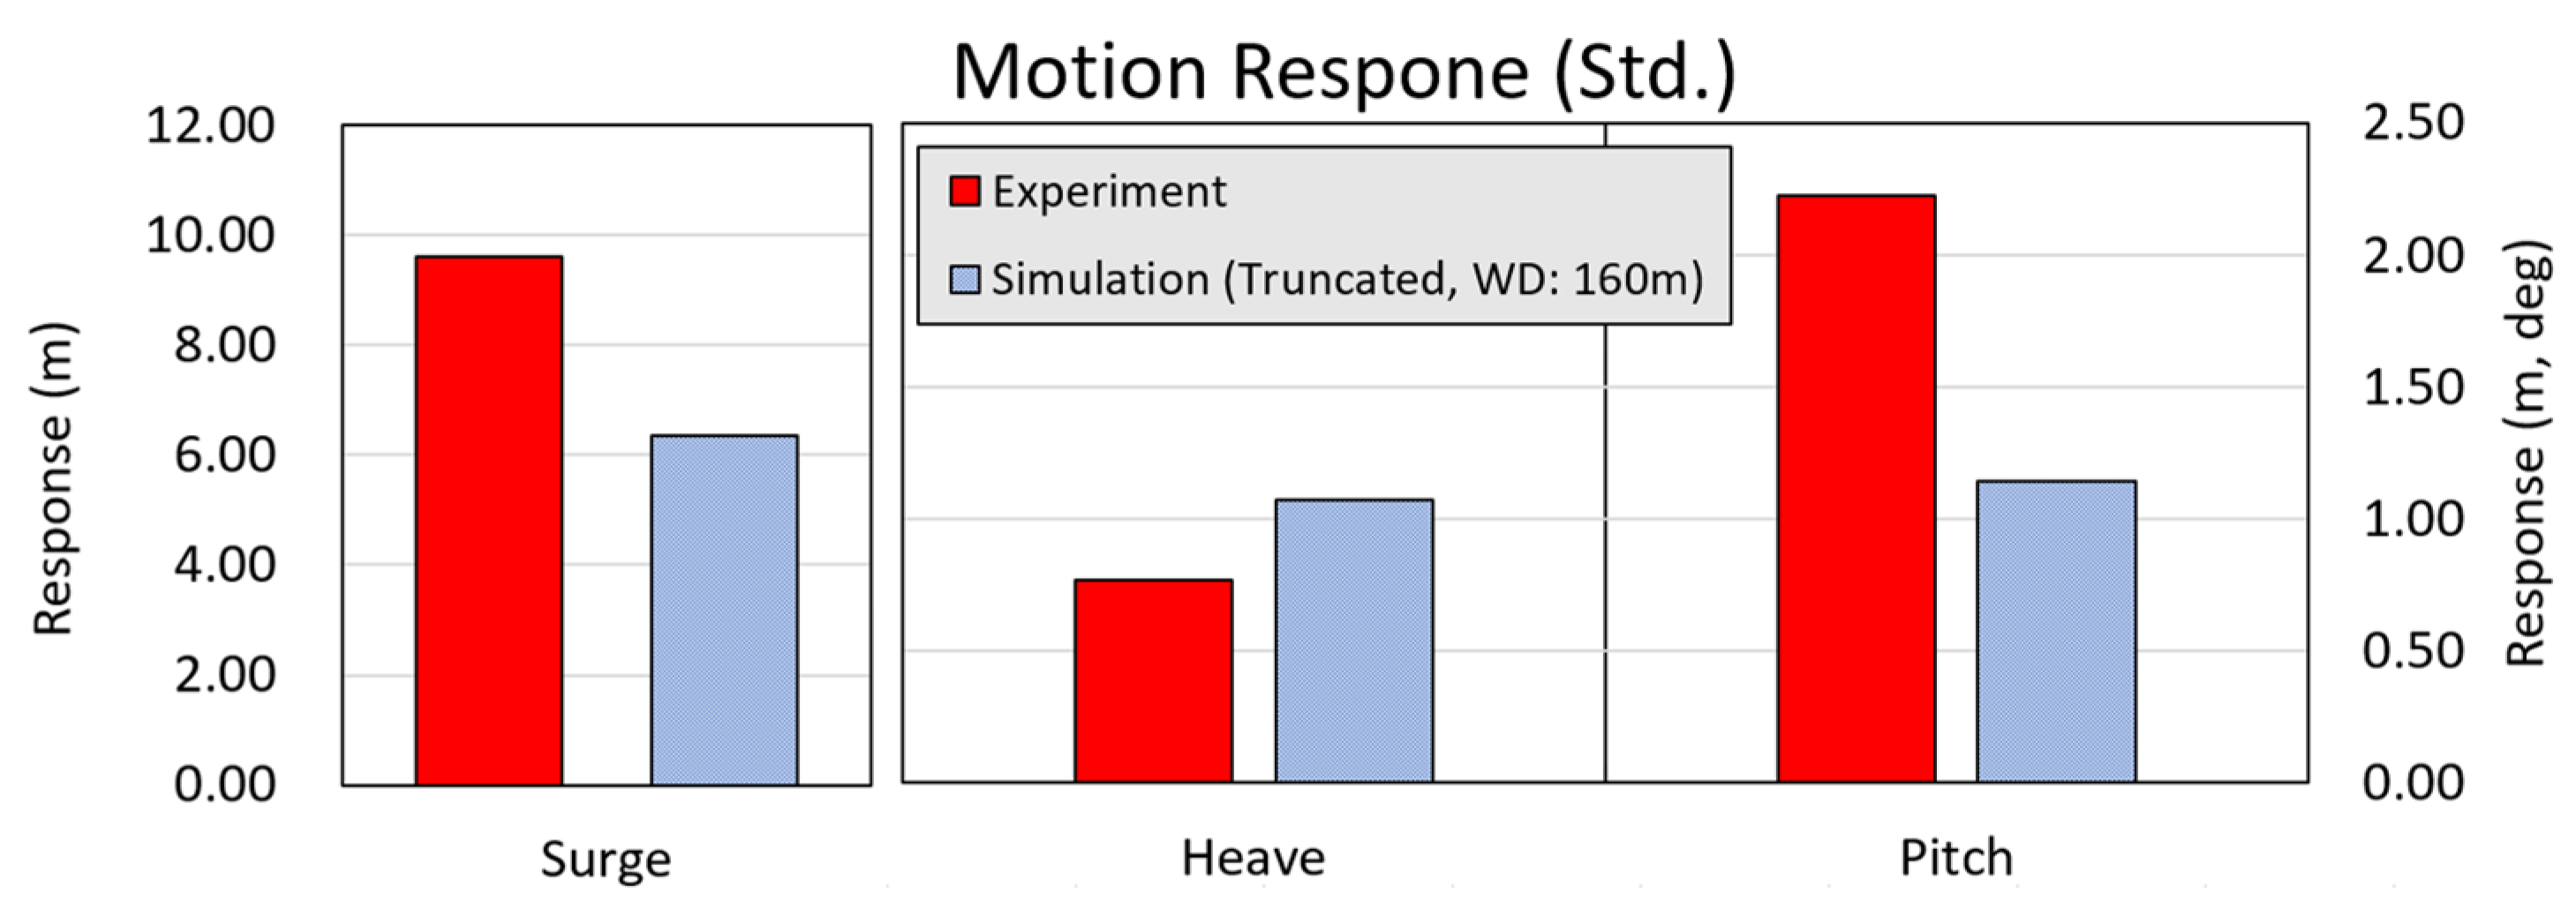
The standard deviation was utilized as a statistical parameter to indicate the motion characteristics and magnitude of the K-Semi, which is shown in
Figure 32. The surge motion had the largest value in the experiment, whereas the heave motion had comparable results in both the model test and the numerical simulation. For the pitch motion, the model experiment showed a result of approximately 2.2°, whereas the numerical simulation showed results of approximately 1.2° for the truncated mooring. Smaller results for the pitch motion may be attributed to improper evaluation of the effects of the fluid drag component of the floating body and mooring owing to the long-period surge motion in the simulation.
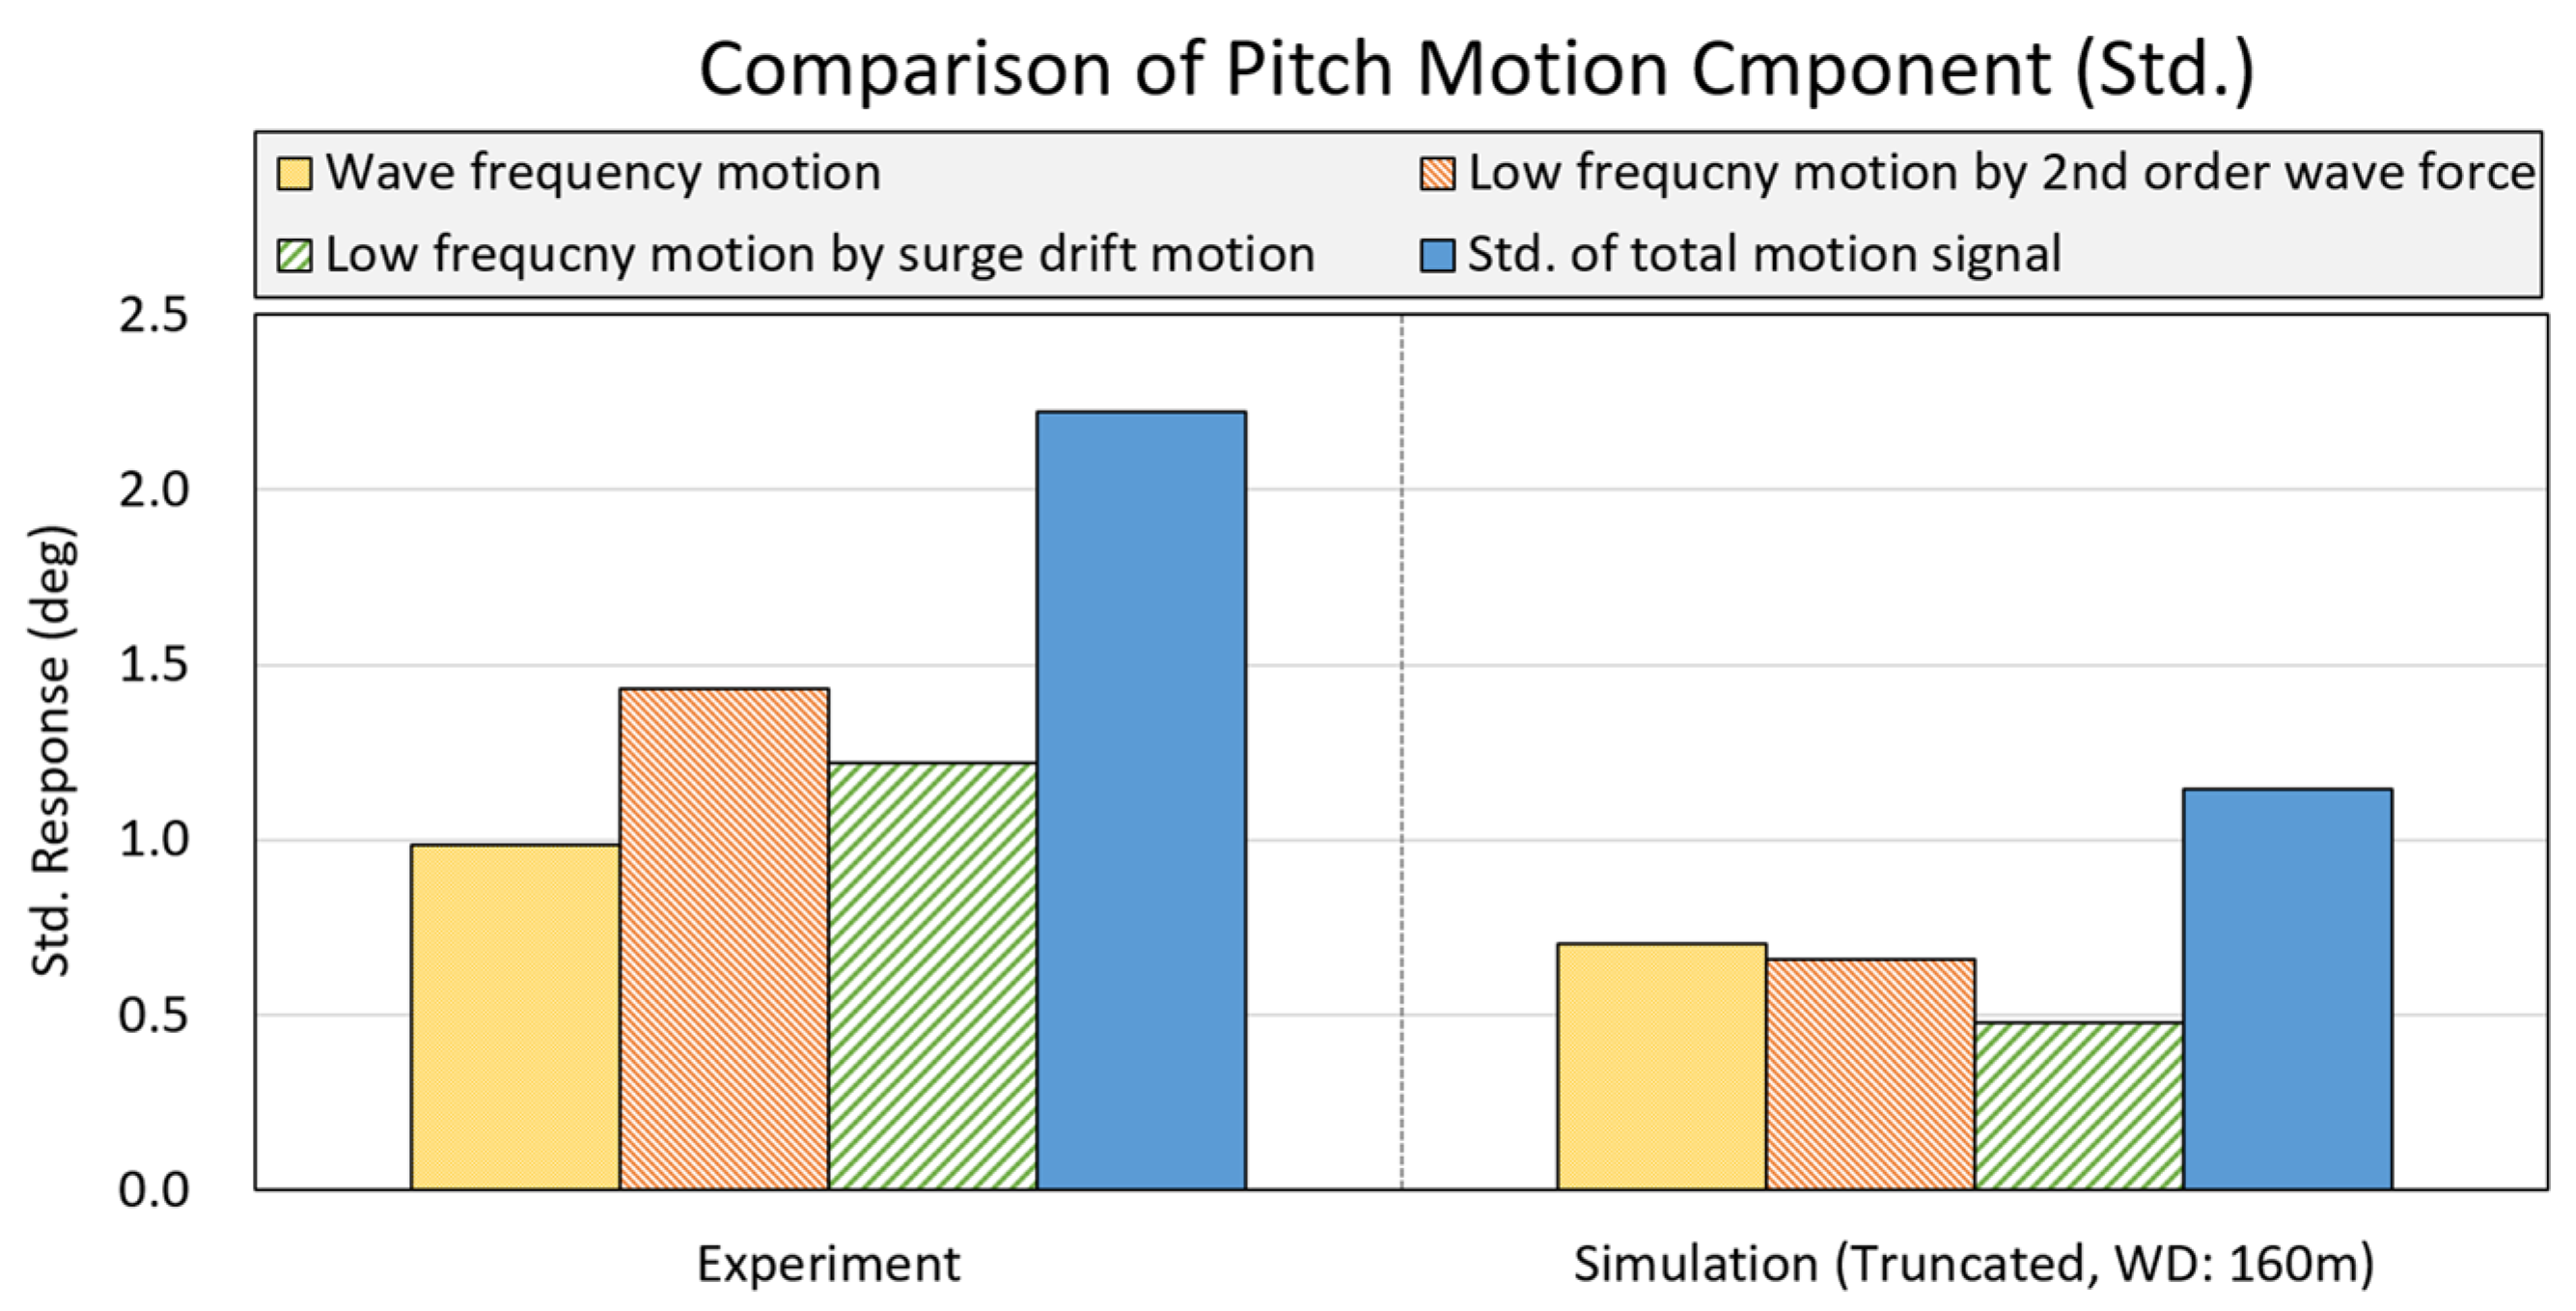
Figure 33 shows the standard deviation results of the model test and numerical simulation of the pitch motion divided into three main frequency components. As shown in
Figure 33, the pitch motion in the model test and simulation can be divided into three components: the wave component, pitch motion due to second-order wave forces, and low-frequency pitch motion component associated with the surge motion. The effects of the surge drift motion and second-order wave forces on the pitch were similarly large, followed by the wave frequency component in the model test. The wave frequency component was approximately 1.0°, the second-order pitch motion was approximately 1.4°, and the pitch motion owing to the surge motion was approximately 1.2°, indicating that each component contributed evenly to the overall response. In the numerical analysis, three different frequency components were found, similar to the model test. However, their magnitudes were smaller than those in the model test. In the numerical analysis, the magnitude of the wave frequency component was approximately 70% of that of the model test. Additionally, the low-frequency motion component was approximately 40% or less.
Although there are discrepancies between the model test and simulation results, it is confirmed that the results of the model test and simulation with the truncated mooring system are similar and show the three periodic components of the pitch motion due to the coupling phenomenon between the surge and pitch motion.
5. Conclusions
In this study, K-Semi, a KRISO standard offshore structure, was used as the target offshore structure to evaluate its motion characteristics with a truncated mooring system through a model test in the DOEB in Busan, Korea. The results were compared with the frequency domain and time domain numerical analysis.
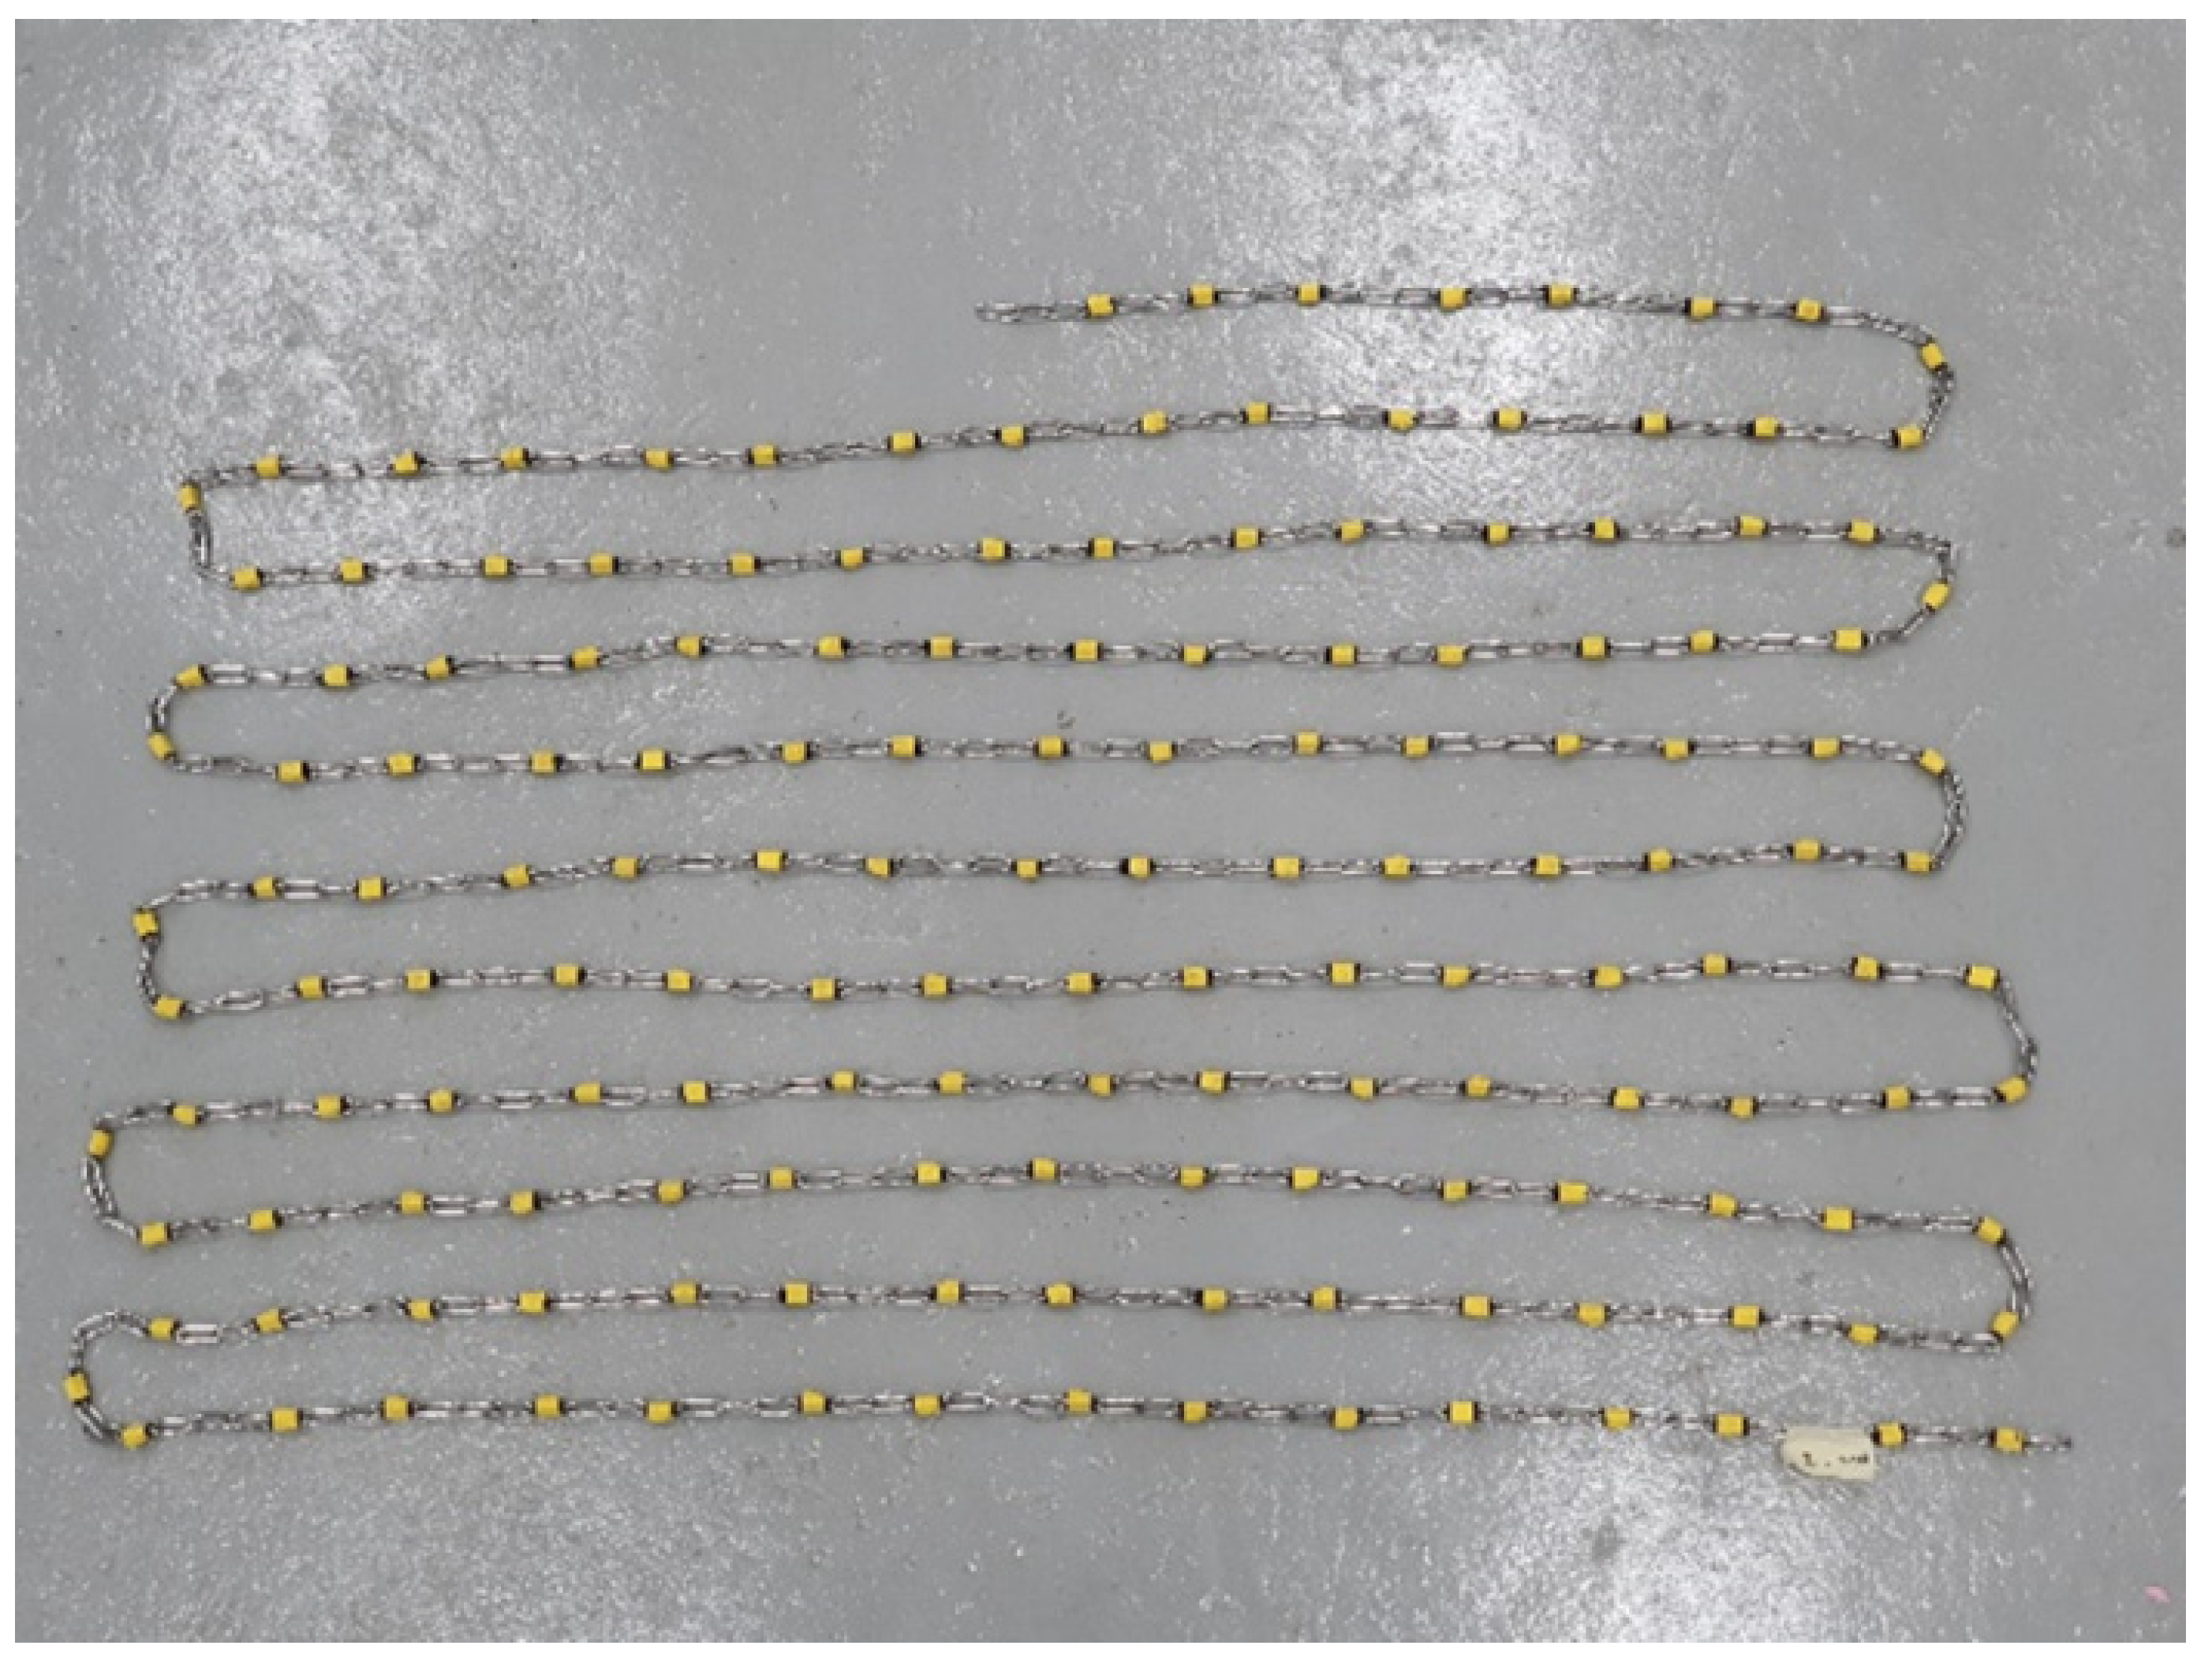
Model tests were conducted using a 1:50 scale model, and the truncated mooring system was redesigned to suit the environment of an offshore basin. The numerical model was calibrated to verify its accuracy based on the results of the free decay and regular wave model tests. In addition, the motion response of the K-Semi under irregular waves was evaluated based on the motion measurement and numerical simulation results to investigate the motion characteristics of the K-Semi, a type of column structure.
The spectral analysis of the motion signal measured using the model test showed that there were three peaks. The frequency component of the incident wave was approximately 0.59 rad/s (10.64 s), the second-order pitch motion was approximately 0.14 rad/s (more than approximately 45 s), and the frequency component lower than the second-order component was approximately 0.08 rad/s (more than about 78.5 s). It is observed that the significant low-frequency pitch motion associated with the surge drift motion is caused by the restoring moment as well as the difference in the restoring force of the front and rear ends of the mooring system connected to the K-Semi, as it experienced a large surge drift motion. The low-frequency pitch motion is influenced by the low-frequency surge motion because the pitch motion occurs significantly when the K-Semi shows a large surge motion, whereas the pitch motion at low frequencies is related to the frequency range of the surge motion.
The results of the numerical simulation were similar to those of the model test. Although the results of the model test and numerical simulation were comparable for the heave motion, the results of the numerical simulation were slightly lower for the surge and pitch motions. In particular, the numerical simulation results were smaller for surge motion. It is believed that the effect of the fluid drag component acting on the floating body was not included in the numerical simulation in this study, and it is expected that more accurate results would be obtained if it were included.
DNG-GL-OTG13 provides an efficient estimation method for wave impact and air gap assessment. DNV-GL-OTG13 takes into account the wave frequency upwell and low-frequency upwell components in evaluating the upwell phenomenon. It emphasizes the significance of considering the influence of the low-frequency motion component in these assessments. Pan et al. [
22] mention that for a pontoon-type structure such as a semi-submersible with a long natural period, these low-frequency components should be fully considered in the heave, roll and pitch motions.
The pitch motion characteristics of the K-Semi under the irregular wave condition in the head sea condition were investigated by model test and numerical analysis for a column-type structure with small restoring coefficients in the vertical direction. The study revealed the significant impact of the low-frequency component caused by the surge motion, in addition to the wave frequency upwell and the second-order low-frequency motion component arising from the second-order wave force. Hence, when estimating the relative wave height of a pontoon-like structure, such as the K-Semi, it is necessary to consider the influence of the low-frequency component due to the surge motion of the floating body with the mooring system, as well as the second-order component to derive a rigorous upwell result.


 ,
, 


