Abstract
Various measures have been taken to improve ship energy efficiency while decreasing CO2 emissions. In this work, the navigation environment between Wuhan and Shanghai in China has been classified based on an improved K-means algorithm in order to realize route division. A fuel consumption prediction model considering the navigation environment factors has been established. Consequently, speed optimization models with multiple different optimization objectives have been constructed and tested based on an actual case using an artificial fish swarm algorithm. Finally, sensitivity analysis has been carried out focusing on the navigation time, fuel price, charter rate, free carbon credits, and carbon tax rate. The results show that the total shipping cost and CO2 emissions could be reduced by 0.94% and 0.38%, respectively, after the optimization. Considering a carbon tax policy with a tax rate of roughly 1300 RMB/t, the optimization result (including the carbon tax cost) is close to the compromised solution of multi-objective optimization, and the corresponding carbon tax rate can provide a useful reference for policymakers.
1. Introduction
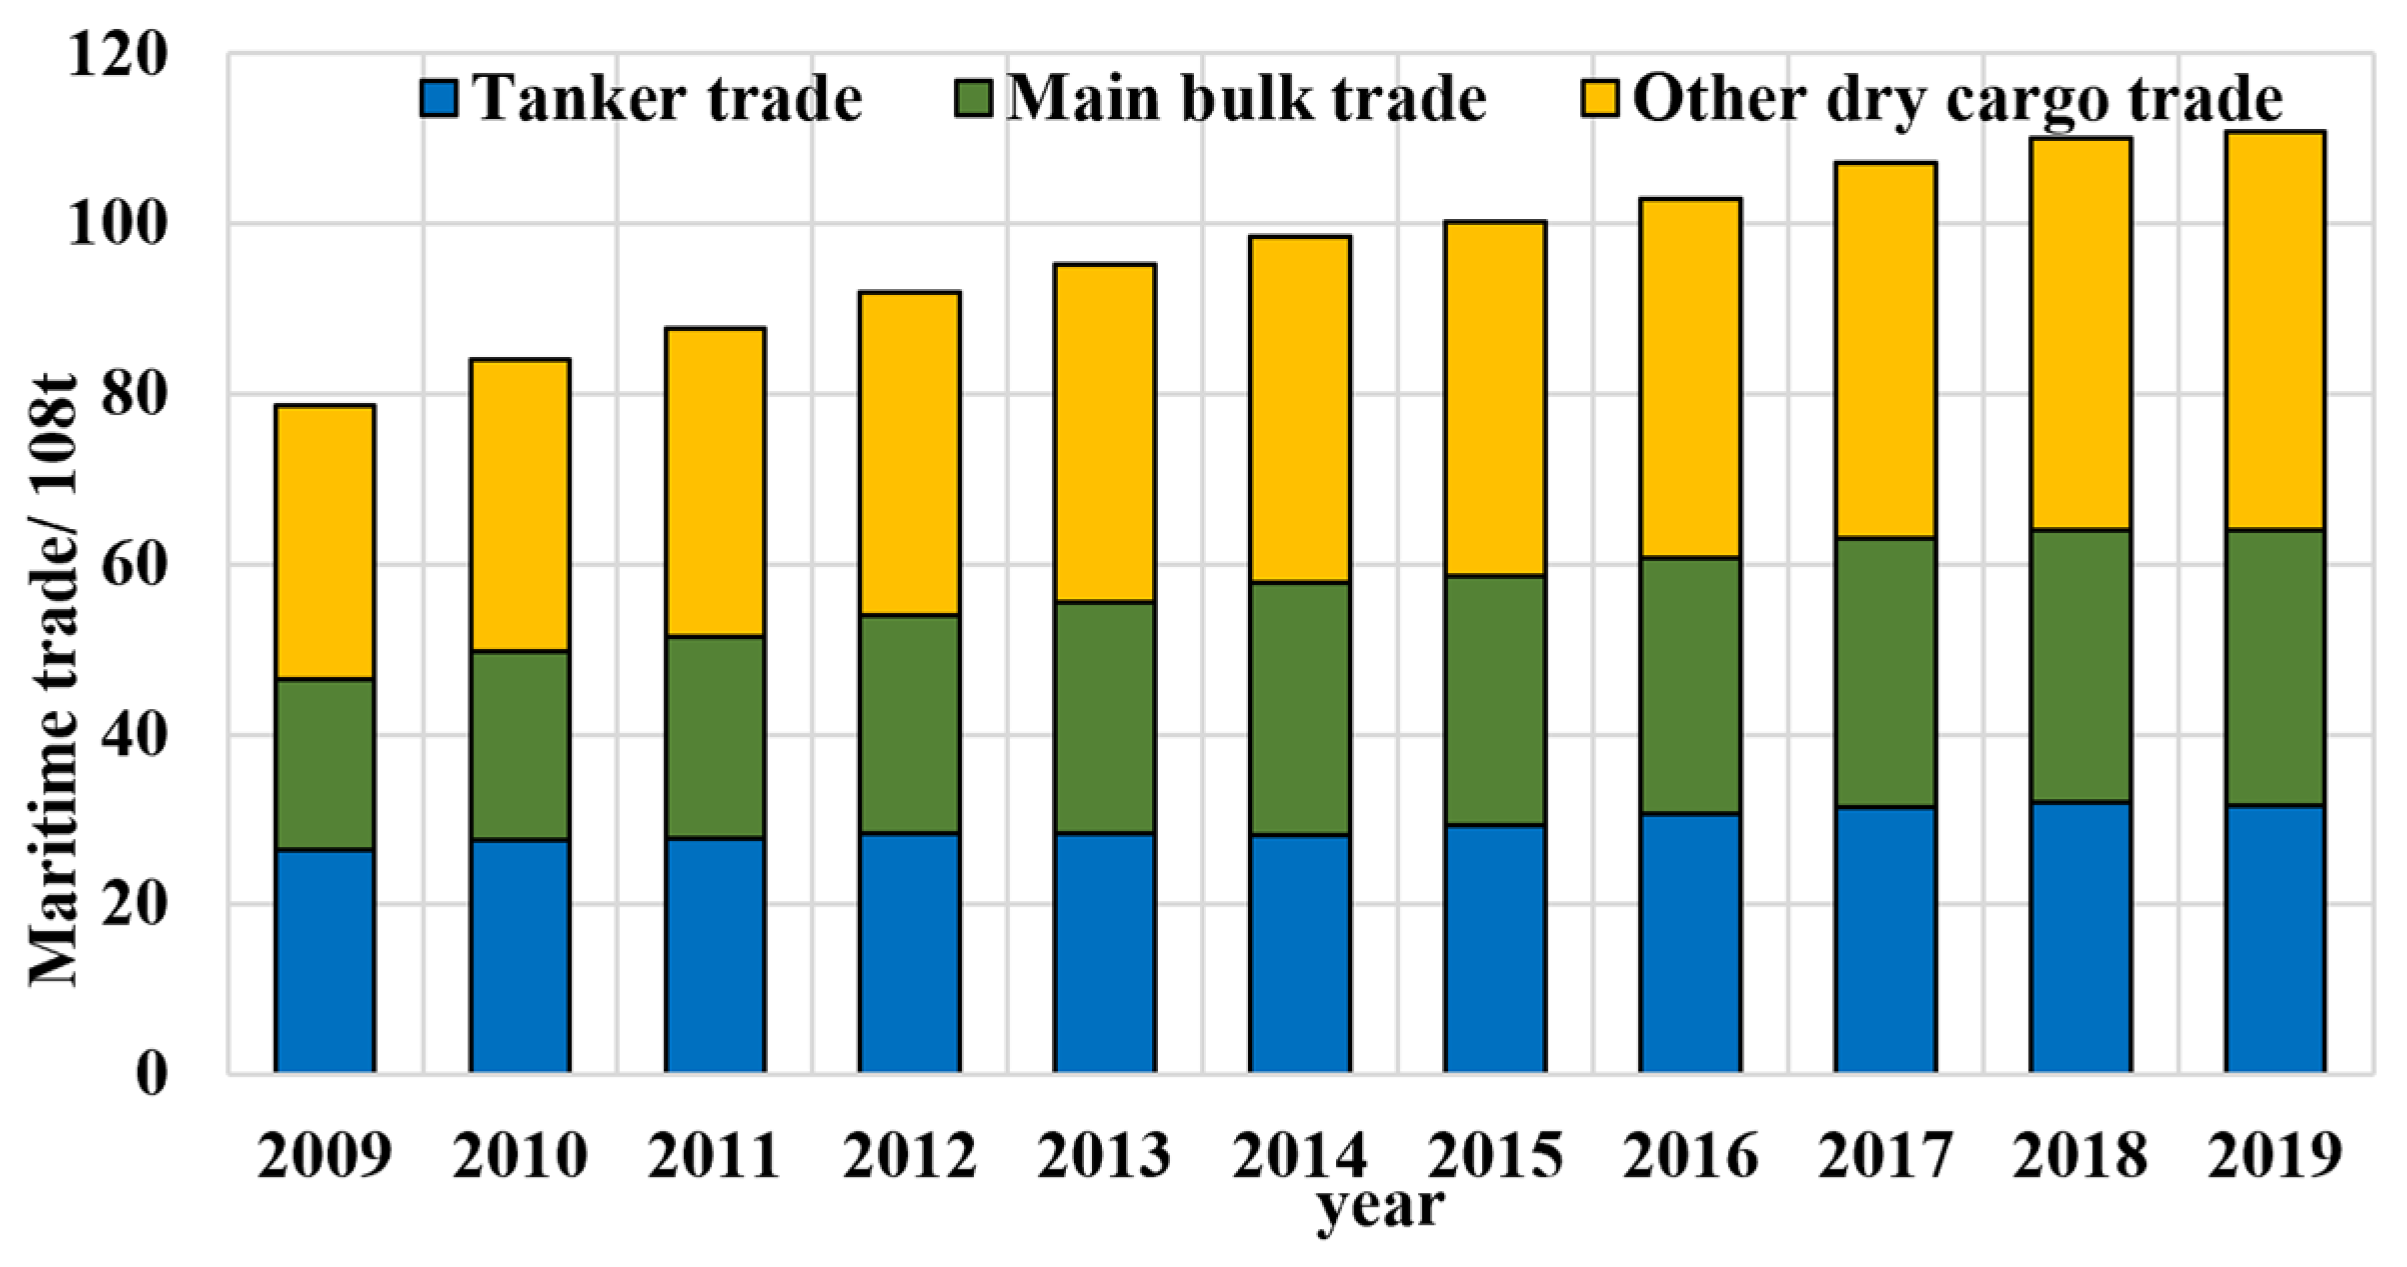
Since 2009, the global shipping trade has grown steadily (shown in Figure 1) [1], reaching 11.08 billion tons in 2019, which accounted for more than 80% of the world’s trade. Due to the coronavirus (COVID-19) pandemic, international maritime trade decreased by 4.1% in 2020, compared to 2019. Nevertheless, along with the recovery of the world’s economy, the world’s trade will continue to grow, and so will the CO2 generated via ship fuel consumption [2]. According to the fourth Greenhouse Gas (GHG) research report released by the International Maritime Organization (IMO), the GHG emissions of shipping companies keep rising despite the industry’s efforts to improve the efficiency of ships [3]. From 2012 to 2018, the carbon intensity of international shipping decreased by approximately 11%, whereas the total CO2 emissions increased by 9.3% from 962 million tons in 2012 to 1056 million tons in 2018. During the same period, the ratio of CO2 emissions from shipping over total global emissions increased from 2.76% to 2.89%. The research also shows that, considering the economic growth and the global trade demand, the CO2 emissions from shipping are expected to be 50% higher in 2050 than in 2018 if no measures are taken [4,5].
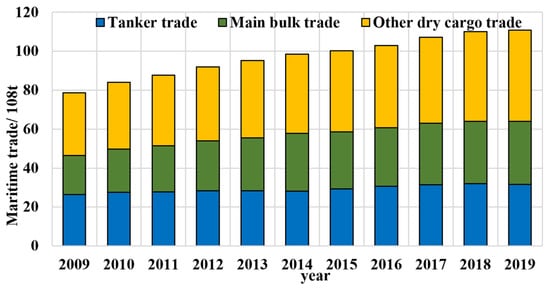
Figure 1.
Global shipping trade from 2009 to 2019.
The negative impacts of CO2 emissions from the shipping industry on the climate have generated widespread concern [6]. In order to mitigate the greenhouse effect and reduce CO2 emissions from shipping, in April 2018, the IMO adopted the initial GHG strategy in its 72nd session, aiming for GHG emissions to be reduced to less than 50% of 2008 emissions by 2050 [7]. However, according to the latest study, the shipping industry is far from the 2050 emissions reduction target set by the IMO. In order to assist ship-owners and shipping companies in reducing carbon emissions, the IMO has identified market-based measures as features of the 2050 mid-term emissions reduction plan, which will impel ship-owners and shipping companies to reduce carbon emissions by internalizing the cost of carbon emissions.
Various energy efficiency optimization methods have been studied and proposed to improve a ship’s energy efficiency and reduce a ship’s CO2 emissions (shown in Figure 2). Improved ship energy efficiency can be achieved by optimization in technology and/or optimization in operations management.

Figure 2.
Optimization methods for improving ship energy efficiency [8].
Methods for technological optimization include propeller redesign, hull antifouling measures, engine improvement, hull optimization, and the application of clean energy. Energy efficiency optimization methods based on operations management mainly include optimization measures of a ship’s speed, route, trim, and fleet deployment [9,10].
All of the aforementioned energy efficiency optimization methods can improve the ship’s energy efficiency and lower its fuel consumption to some extent. Since the power required to maintain speed is proportional to the cube of the speed, a ship’s energy efficiency can be greatly improved by a slight decrease in a ship’s speed [11]. For example, a 10% reduction in speed corresponds to a 27% reduction in fuel consumption [12]. According to relevant studies, reducing a ship’s speed by 2–3 knots from its design speed will greatly reduce fuel consumption and result in a lower operating cost [13]. Therefore, speed optimization is one of the most important optimization methods for the improvement of ship energy efficiency [14].
At present, the optimization objectives of most optimization models are reducing shipping costs and increasing profits, which are preferred by ship owners and shipping companies. Correspondingly, studies focus on the effects of a ship’s speed on shipping costs and profits. For example, Corbett et al. [15] constructed a speed optimization model that considered the fuel costs and the fixed charter operating costs, determined the optimal speed for a specific route, and discussed the relationship between fuel price and optimal speed. Psaraftis et al. [16] included fuel costs, charter costs, and cargo inventory costs in their optimization model, and considered the effects of a ship’s load on fuel consumption, which proved the speed for minimum emissions and the most economical speed are not necessarily the same. For fleet-scale speed optimization, Cepeda et al. proposed a discrete simulation model for a bulk carrier fleet, which focused on a ship’s fuel consumption and emissions, comparing their levels under three conditions: normal case, slow steaming, and ultra-slow steaming [17]. By taking the uncertainty and diverse influencing factors of fleet operating conditions into account, Wang et al. developed an upper-level optimization model for fleet operational decision-making and a lower-level dynamic optimization model for a fleet’s energy consumption [18].
Considering the uncertainty of port time (defined as the time reserved by the port for a ship’s service) and the frequency requirements of a liner’s schedule, Qi et al. designed a ship’s scheduling scheme for fixed routes and proposed a stochastic approximation algorithm to resolve the issue [19]. Wang et al. developed a chance-constrained planning model including stochastic fuel prices, to determine the optimal speeds for specific ship routes and the optimal fuel purchases at different ports, assuming the fuel prices at each port were distribution-free random variables [20]. Hou et al. developed a ship energy efficiency optimization model for ships navigating in icy areas by considering uncertain ice loads [21]. In the study, ice loads were described as random variables with specific probability distributions and the data mining of ice loads was implemented by wavelet decomposition. Uncertainty is an important feature in a ship’s operation. The navigation process of ships may be subject to great uncertainty due to uncertain congestion, loading and unloading times, fuel prices, and weather conditions.
In summary, researchers have conducted extensive studies on the optimizations of ships. Ship owners and shipping companies hope to reduce the operating cost as much as possible, while governments and maritime organizations expect to reduce ships’ carbon emissions. It is helpful to determine the optimal ship speeds for different optimization objectives while fully taking the effects of speed variation into account. The two objectives of reducing shipping costs and reducing CO2 emissions are in conflict. Therefore, it is necessary to find an optimal solution to simultaneously optimize both objectives.
Although the compromised solution of multi-objective optimization satisfies both objectives to the greatest extent, ship owners and shipping companies will still choose the optimal speed, which is associated with the lowest operating cost, to minimize costs. In order to reduce the carbon emissions of ships, the IMO may take some market-based mandatory measures to economically impel ship owners and shipping companies to pursue lower carbon emissions. Considering the potential implementation of a carbon tax policy in the future, it is necessary to conduct speed optimization studies that consider carbon emission costs and establish optimization models, including carbon emission costs, with the objective of minimizing total shipping costs [22,23]. Wang et al. developed a speed optimization model that took into account the costs of a carbon emission tax, demurrage, and delayed arrival [24]. They designed three different forms of carbon emission taxes in the model and analyzed the effects of different carbon emission taxes on the ship-owners’ profits and the ship’s carbon emissions. Kosmas et al. constructed an analytical model using the cobweb theorem and analyzed the impact of a carbon tax on a ship’s operating costs and emissions [25]. Meanwhile, they discussed how the additional costs resulting from a carbon tax would be distributed between ship owners, operators, and cargo owners. Lan et al. considered the influence of a carbon emission trading policy on ship operations [26]. Specifically, they developed speed optimization models under four different forms of carbon emission policies (no carbon emission limit, a carbon emission tax, a carbon emission cap and carbon emission trading), and analyzed and compared the effects of a carbon emission tax and carbon emission trading policy on a ship’s operating cost and carbon emissions. The results indicated that the implementation of a carbon emission tax policy can reduce a ship’s CO2 emissions to a greater extent and is mandatory, but it has a greater negative impact on the profits of shipping companies. By comparison, a carbon emission trading policy has a smaller impact on shipping companies’ profits and is more positive in the long run. Based on the consideration of a carbon emission cap and carbon emission tax, Xing et al. developed a mixed integer nonlinear programming model for a ship’s speed and fleet deployment and investigated the effects of different carbon emission caps and carbon tax rates on a fleet’s size and ship’s speed [27]. Ding et al. investigated the influence of fixed and progressive carbon tax schemes on the shipping costs on the North Sea Route as well as the Suez Canal Route, and the results showed that a progressive carbon tax policy was more acceptable to shipping companies [28].
The studies outlined above have identified the impact of carbon tax policies on the carbon emissions and operating costs of ships, these studies are of great significance to the shipping industry. The literature survey reveals that after determining the impact of carbon tax policy on ship carbon emissions and operating costs, further concrete analysis is needed to determine the appropriate carbon tax rate. It is necessary to calculate the optimization effect under different carbon tax rates and analyze the sensitivity of carbon tax rates and the introduction of carbon tax policies. Although single-objective optimization can improve the energy efficiency of ships, with continuous technological improvements, multi-objective optimization is also needed.
Considering the gaps in the existing research mentioned above, this study addressed the issue. By considering a carbon tax, how can we effectively optimize and improve the multi-objective ship energy efficiency level? We propose the following objectives:
- To establish the fuel consumption prediction model considering the influence of navigation environment on ship navigation resistance and analyze the influence of different navigation environment factors on ship navigation fuel consumption.
- To divide the navigation segments into different categories based on the characteristics of the navigation environment and establish optimization models based on different optimization objectives.
- To analyze the sensitivity of the carbon tax rate and the introduction of the carbon tax policy.
This paper is structured as follows. In part 1, the navigation environment was classified based on an improved K-means algorithm; a model for ship fuel consumption prediction considering the navigation environment was established; various ship speed optimization models with different optimization objectives were constructed. The effectiveness of the speed optimization method was verified through a case study in Section 2. A sensitivity analysis on multiple factors was performed in Section 3. Section 4 concluded the entire article.
2. Ship Speed Optimization Model
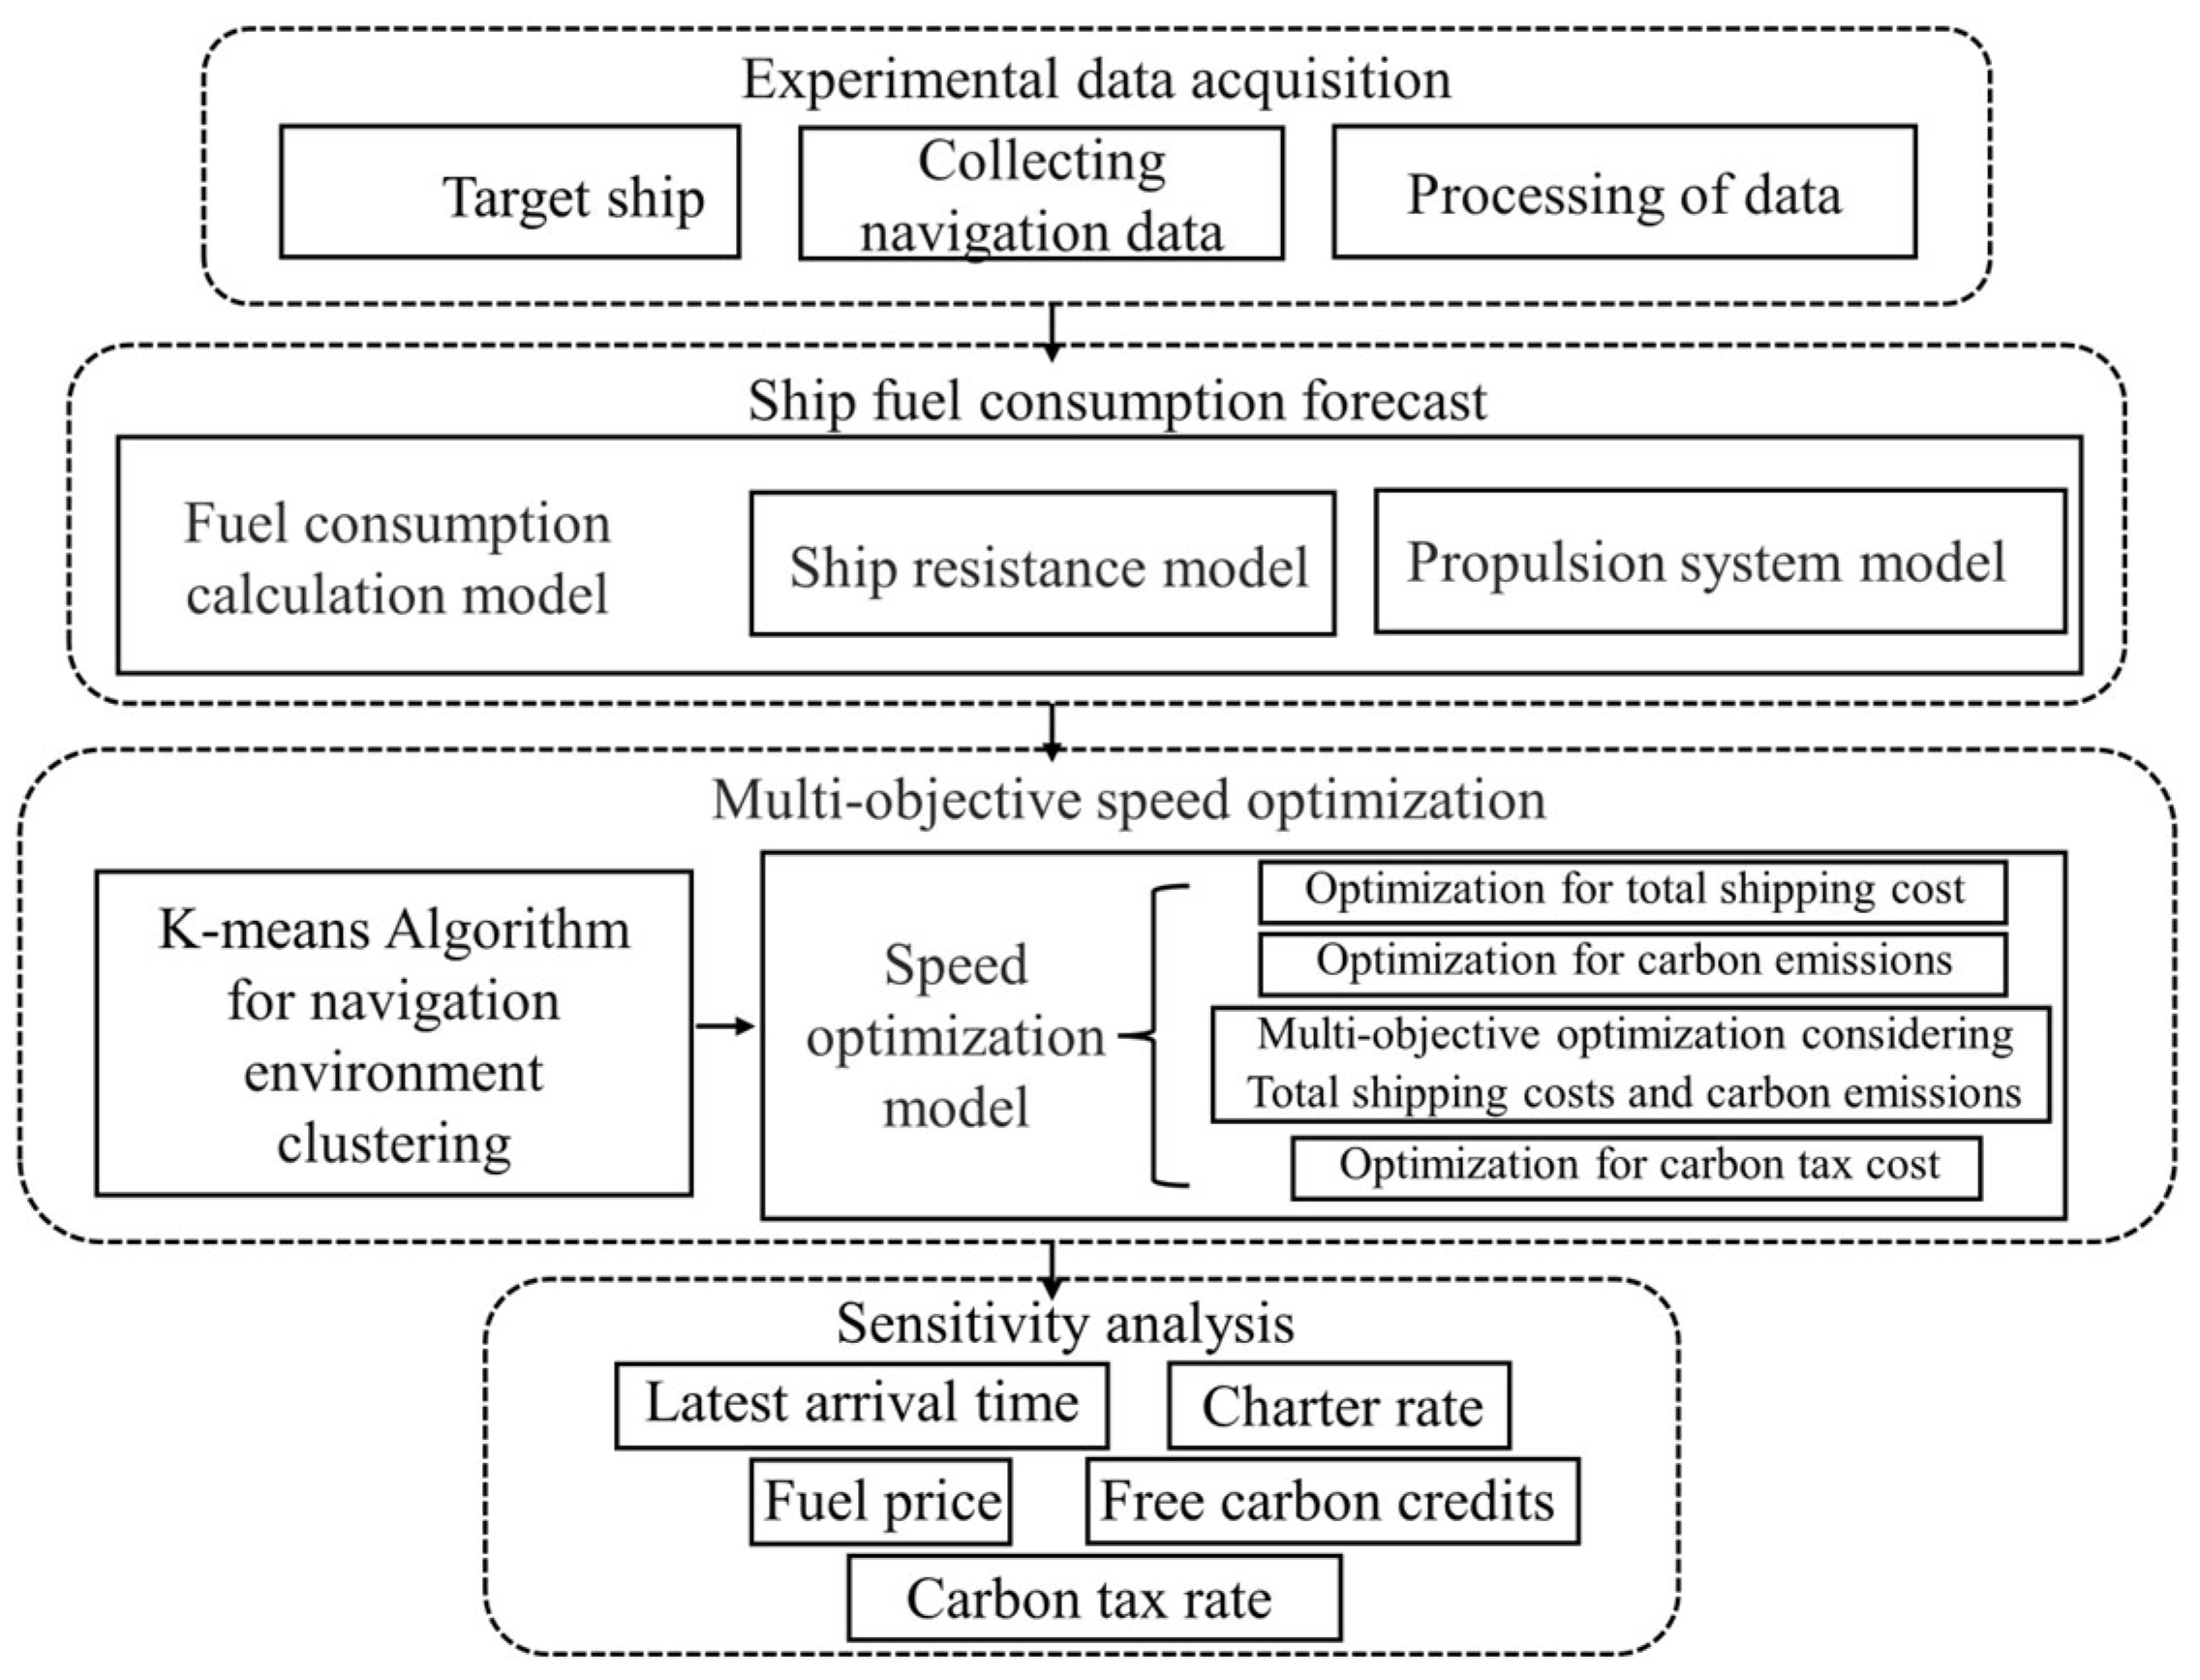
This section is divided into four parts, which are target ship, fuel consumption prediction model, K-means algorithm and speed optimization models, respectively. The flowchart for the entire Section 1 is shown in Figure 3.
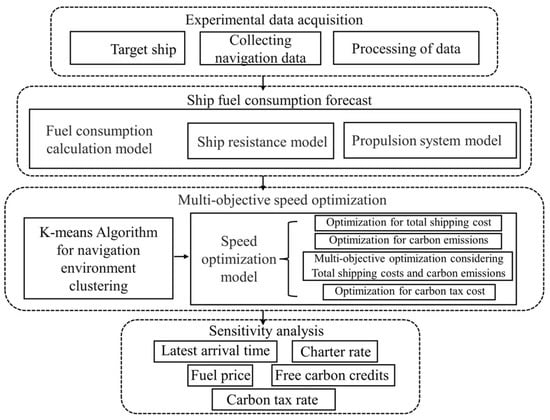
Figure 3.
Diagram of the entire research process.
2.1. Target Ship
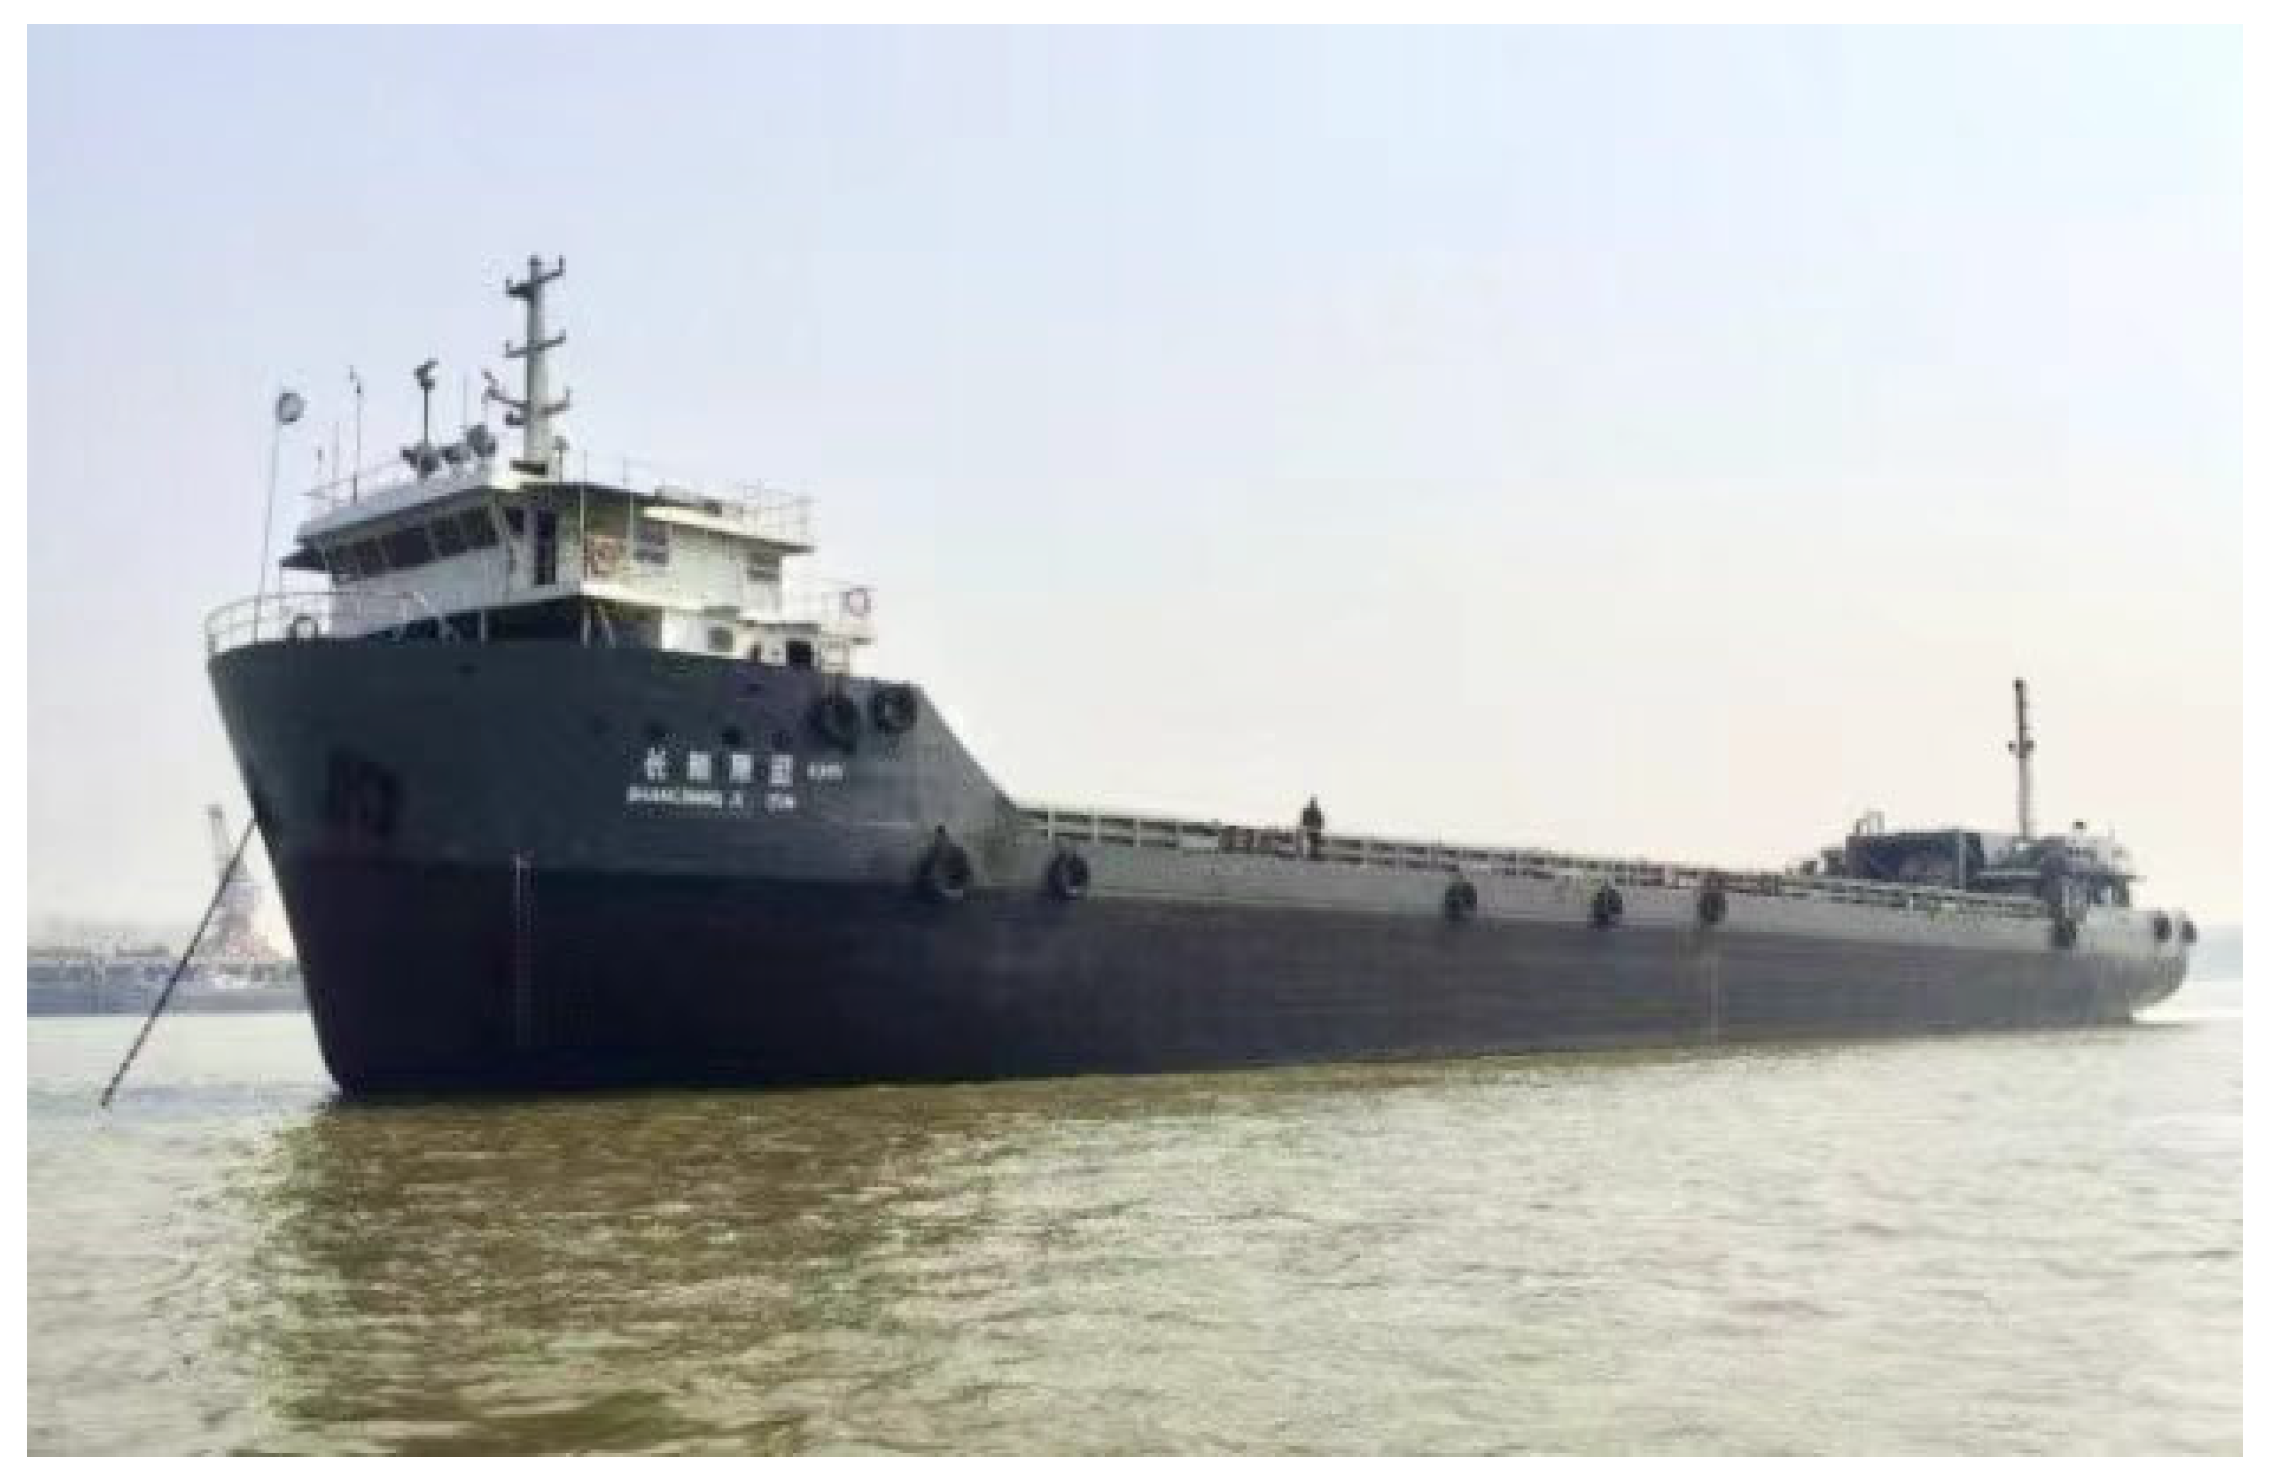
In this paper, a 7000-ton bulk carrier operating on the route between Wuhan and Shanghai was selected as the case. The ship is shown in Figure 4, with its specific parameters listed in Table 1.
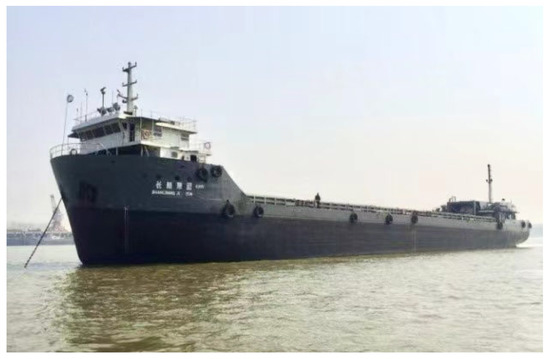
Figure 4.
The inland bulk carrier on the Yangtze river.

Table 1.
Parameters of the target ship.
2.2. Classification of the Navigation Environment Based Improved K-Means Algorithm
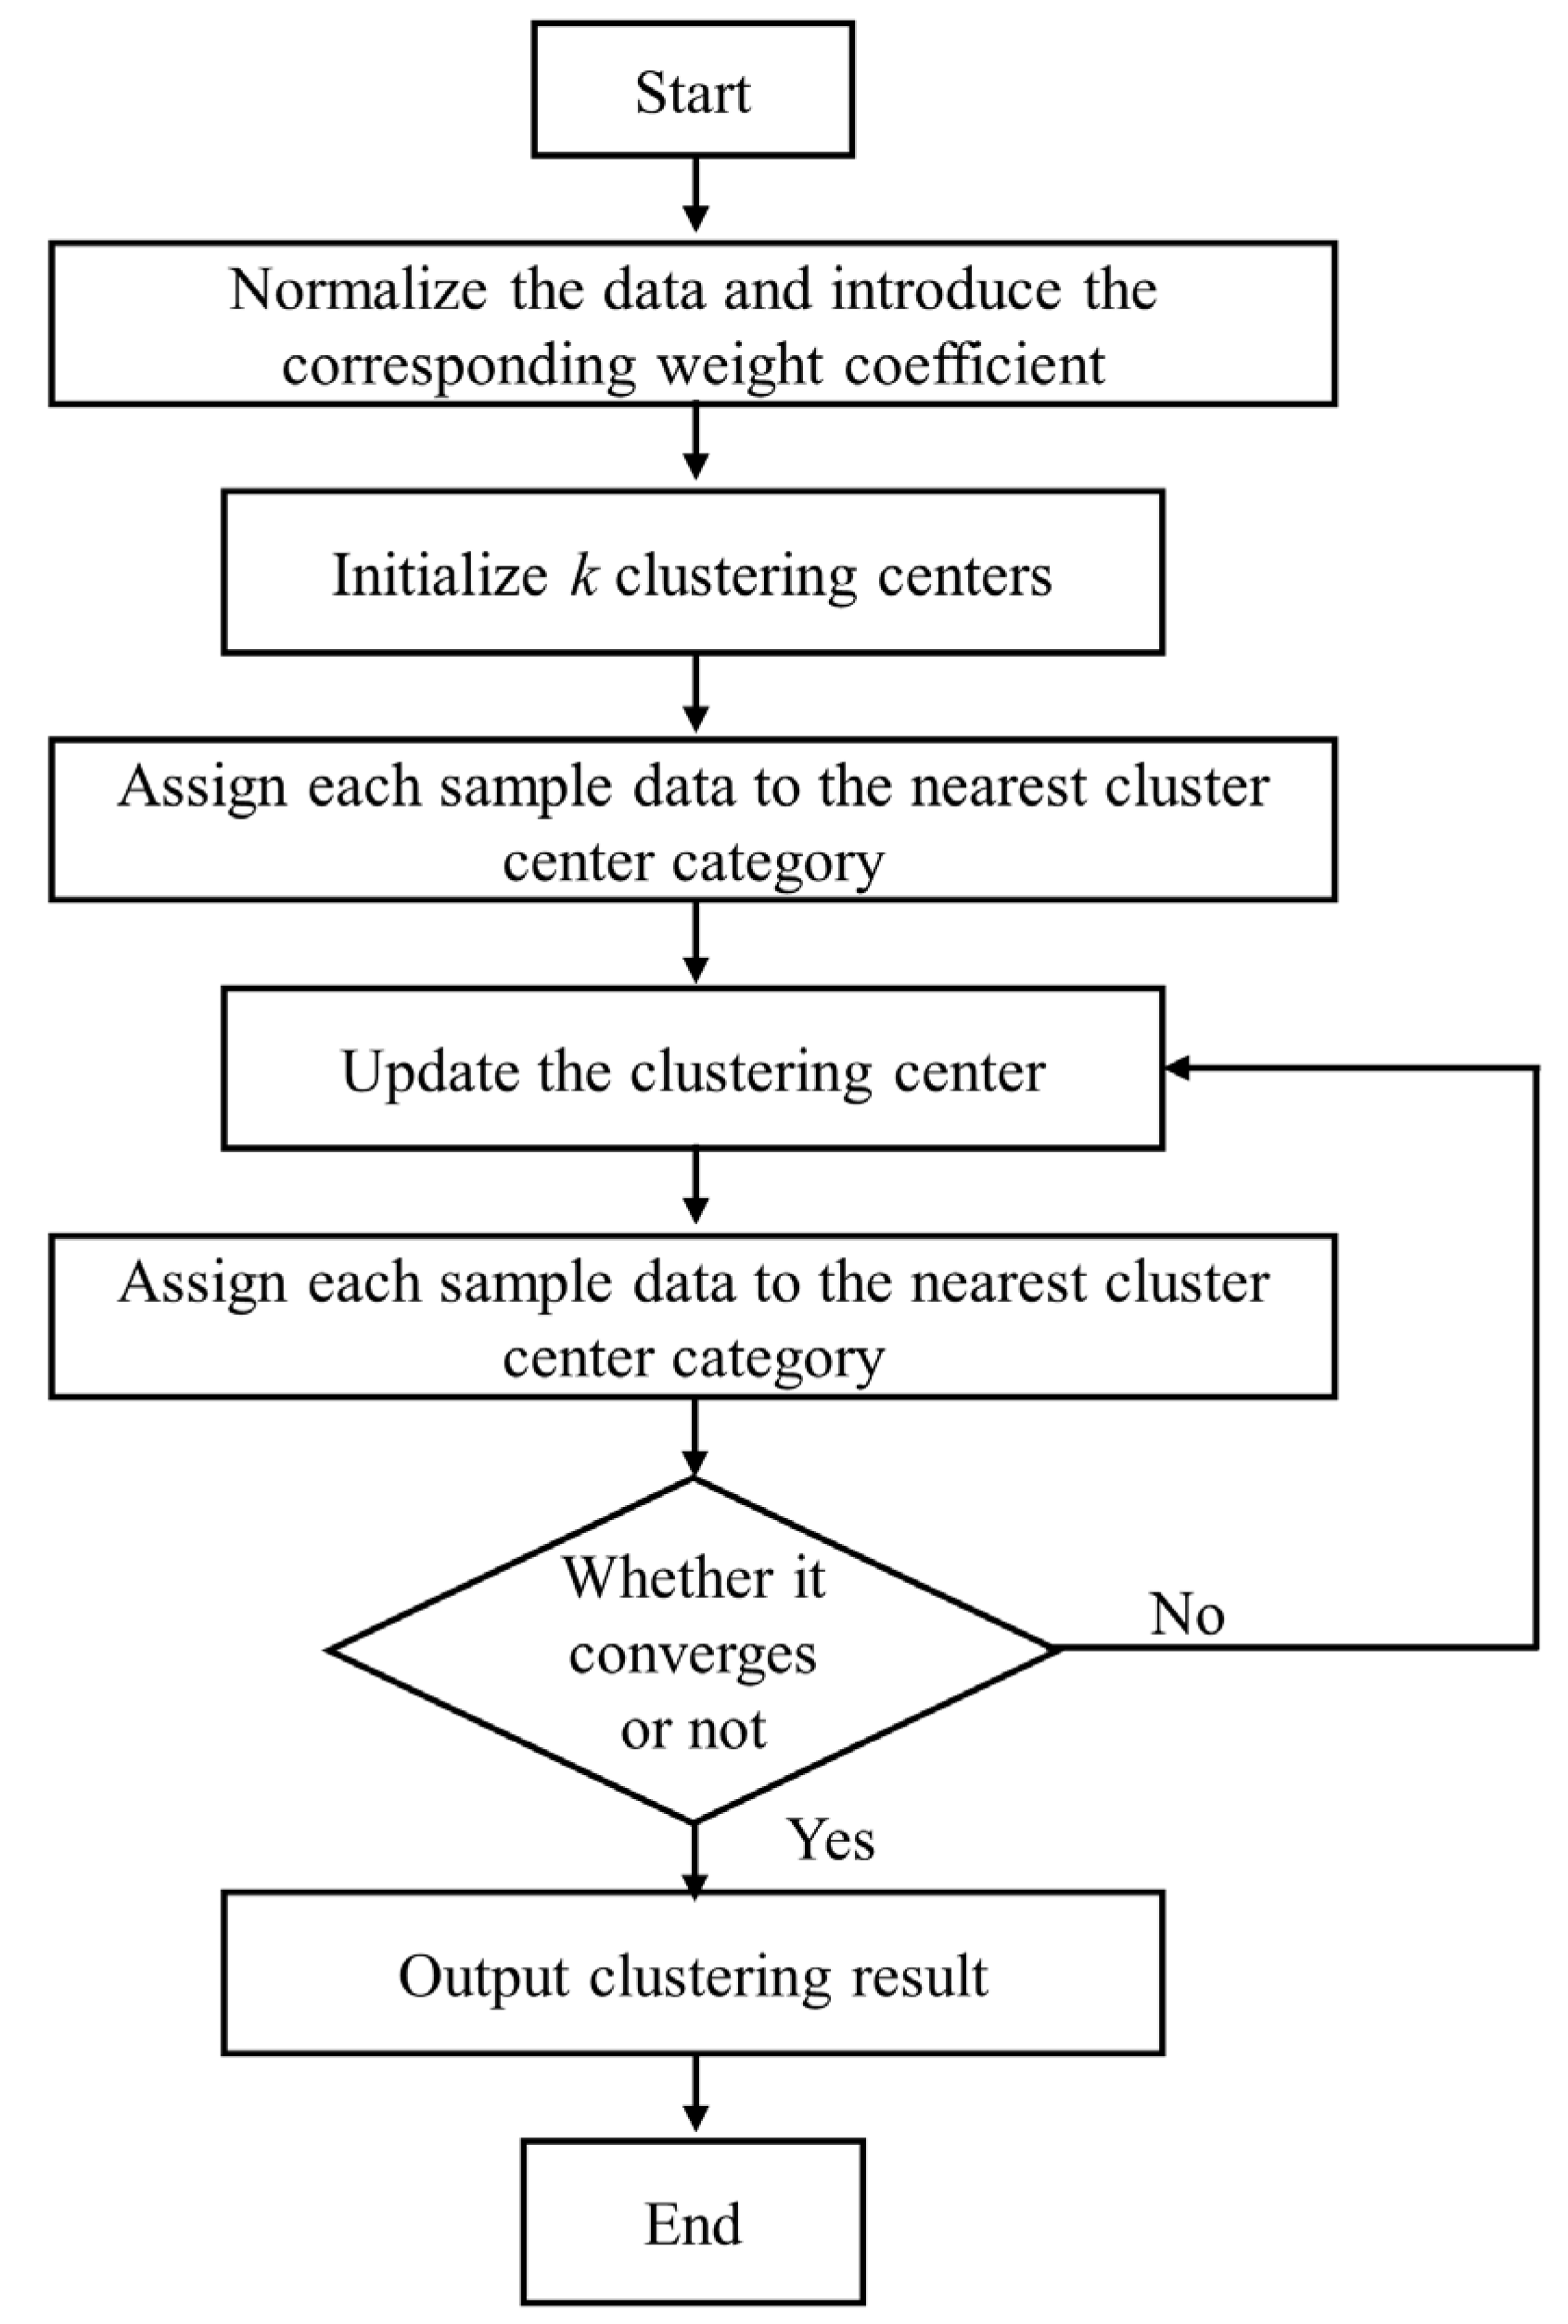
The conventional K-means clustering algorithm is a classical distance-based clustering algorithm that enables the clustering of data, but it has many drawbacks. For example, it does not consider the magnitudes of different parameters when calculating the distances from data samples to clustering centers, and thereby the influence of data of a smaller order of magnitude is likely to be neglected. In addition, the conventional K-means algorithm treats different parameters equivalently, which fails to reflect the varied influence of different navigation environment parameters on a ship’s fuel consumption. Therefore, in order to enhance the relevance of the effects of the same class of data on a ship’s fuel consumption after clustering, the navigation environment parameters are normalized first, followed by the introduction of weight coefficients reflecting the effects of different navigation environment parameters on fuel consumption [29]. A flowchart of the improved K-means clustering algorithm is shown in Figure 5.
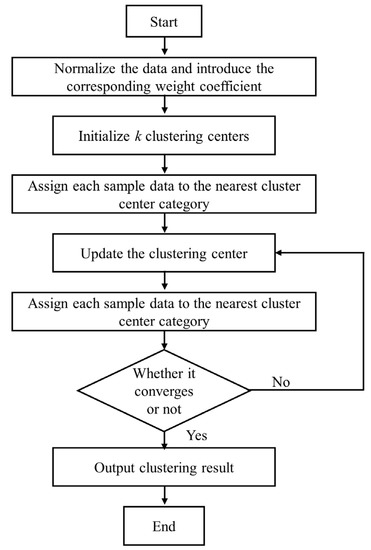
Figure 5.
Flowchart of the improved K-means algorithm.
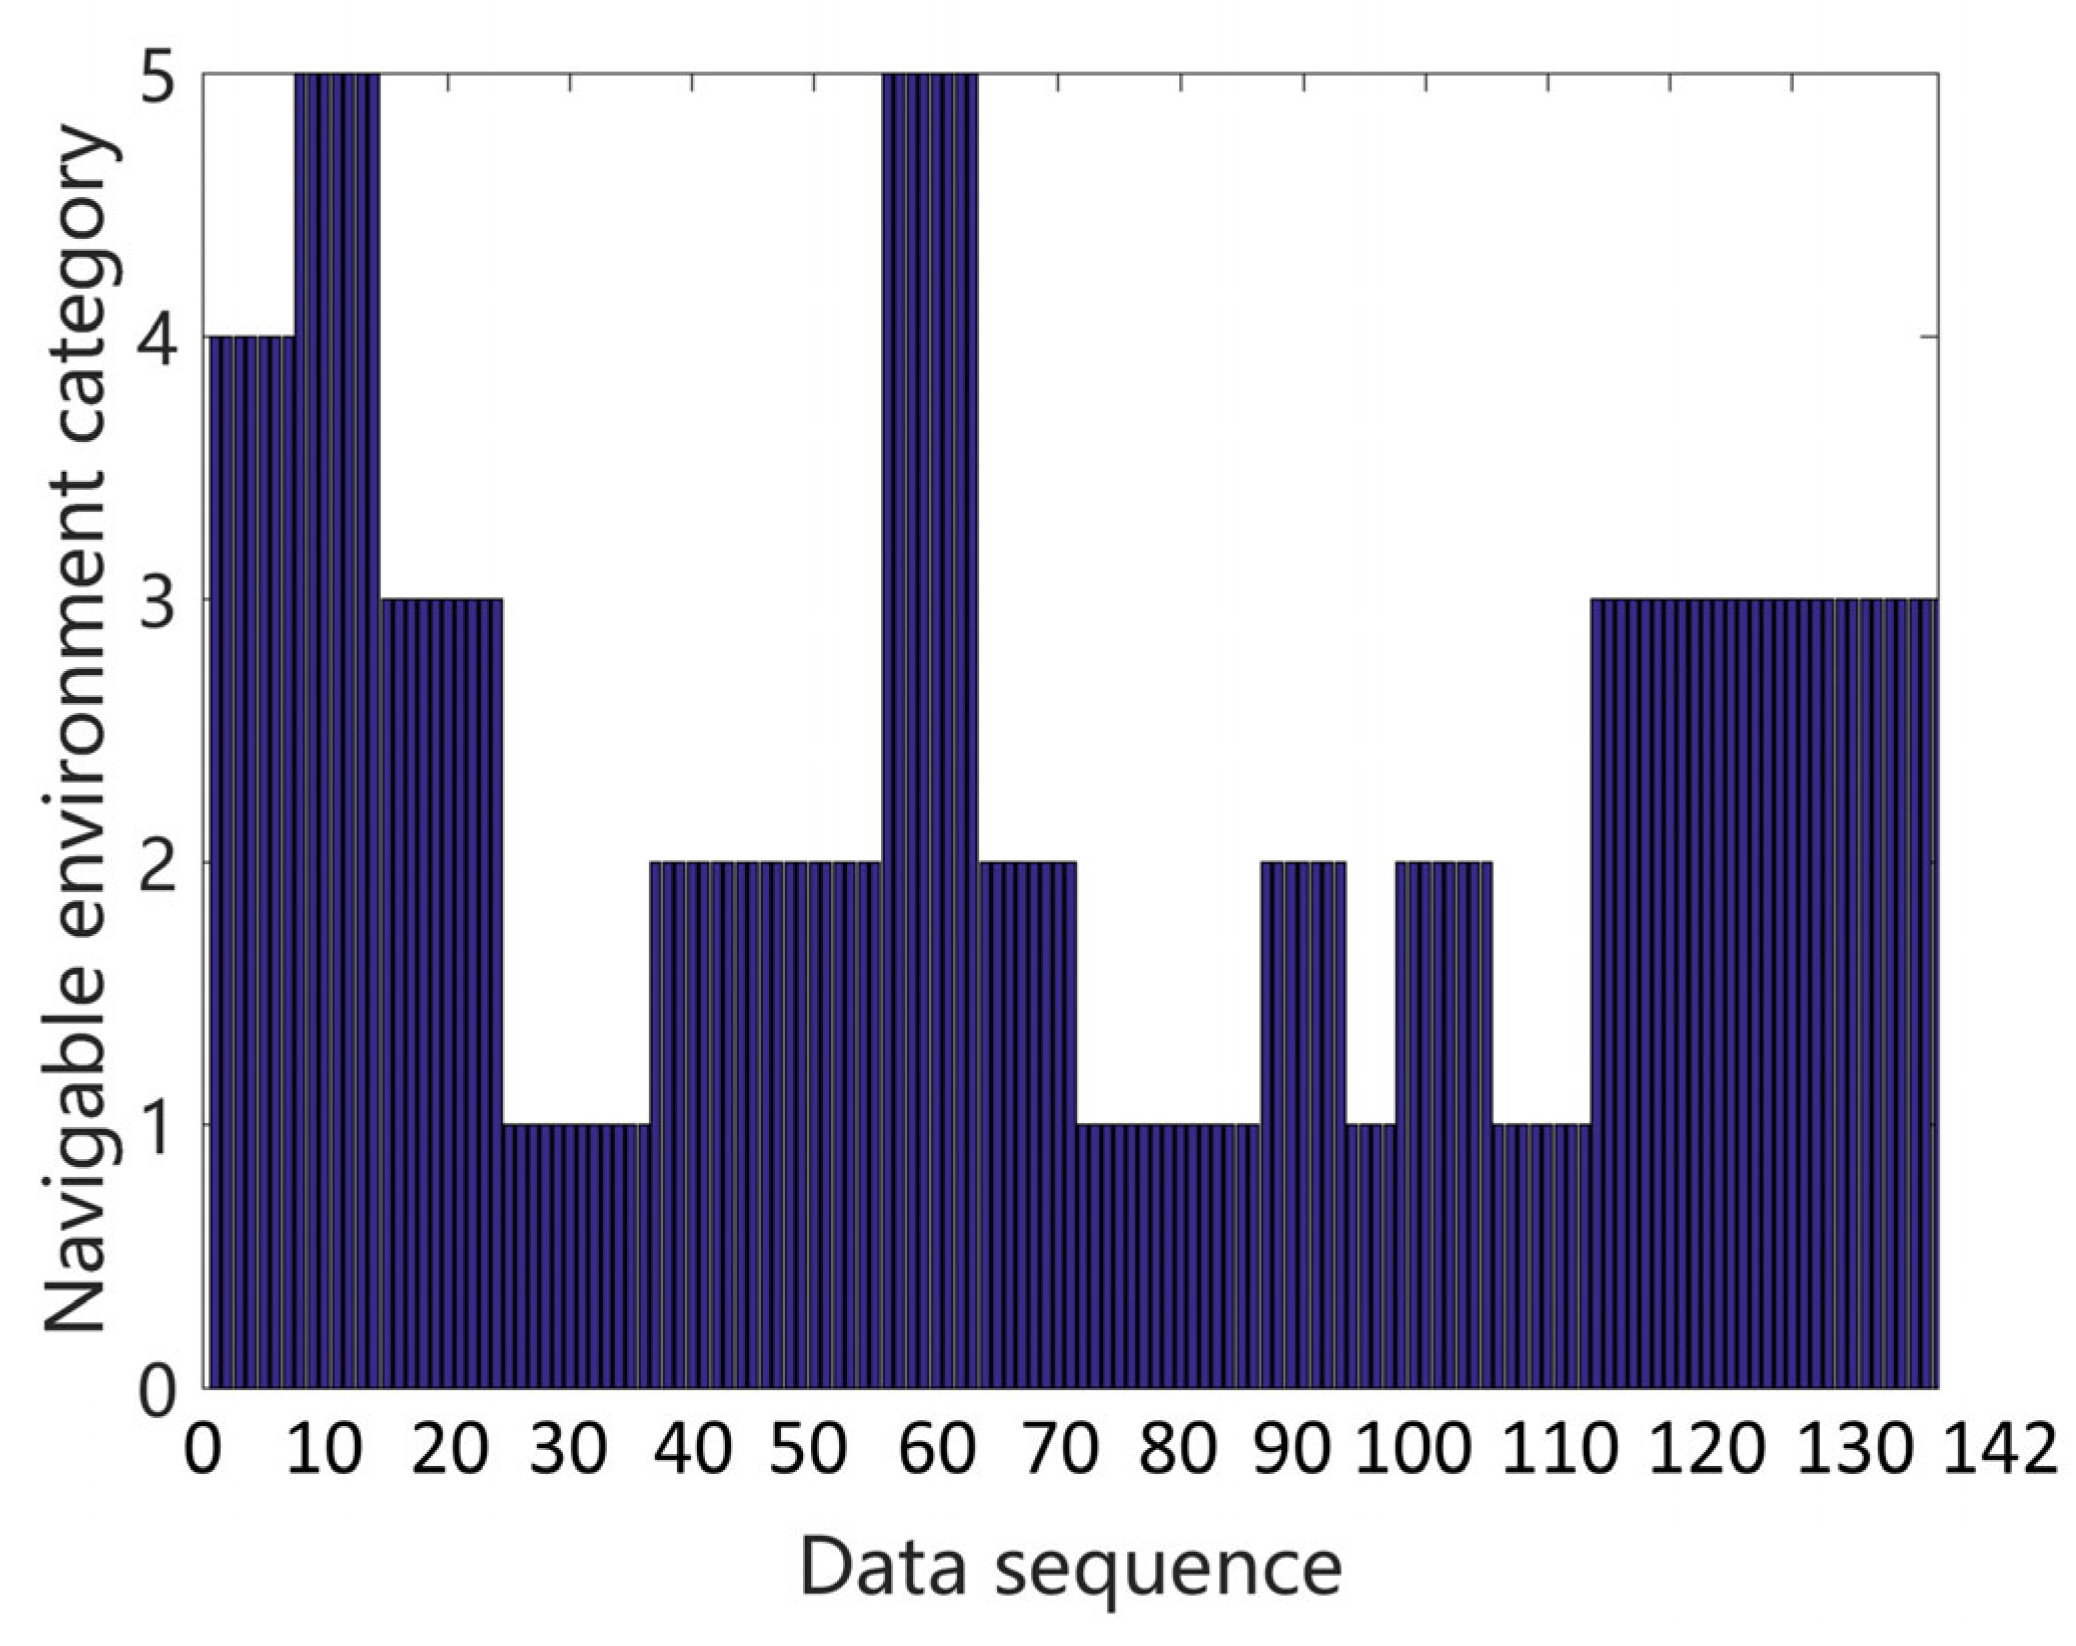
In the actual voyage, the time interval for navigation environment data collection is 1 s, and a total of about 550,000 adjacent data can be collected during one voyage. Since the rotation speed of the main engine does not change at the same frequency as the navigation environment during the voyage, in this study, the average navigation environment data values within every hour were applied instead, and the interval between two adjacent data sequences was 1 h. According to the influence degree of different navigation environmental data on the ship’s fuel consumption, the route was divided. The navigation environment was then clustered using the improved K-means algorithm, and the corresponding results are shown in Figure 6.
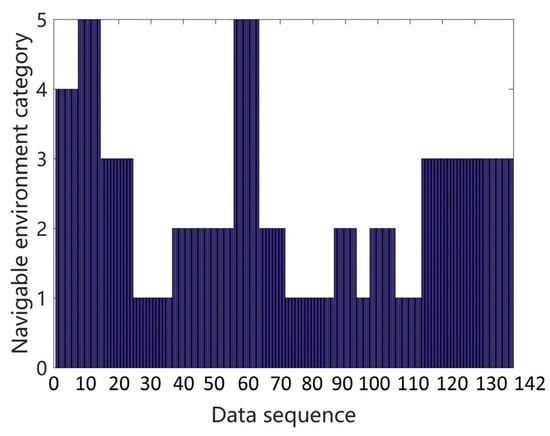
Figure 6.
Clustering results of the navigation environment.
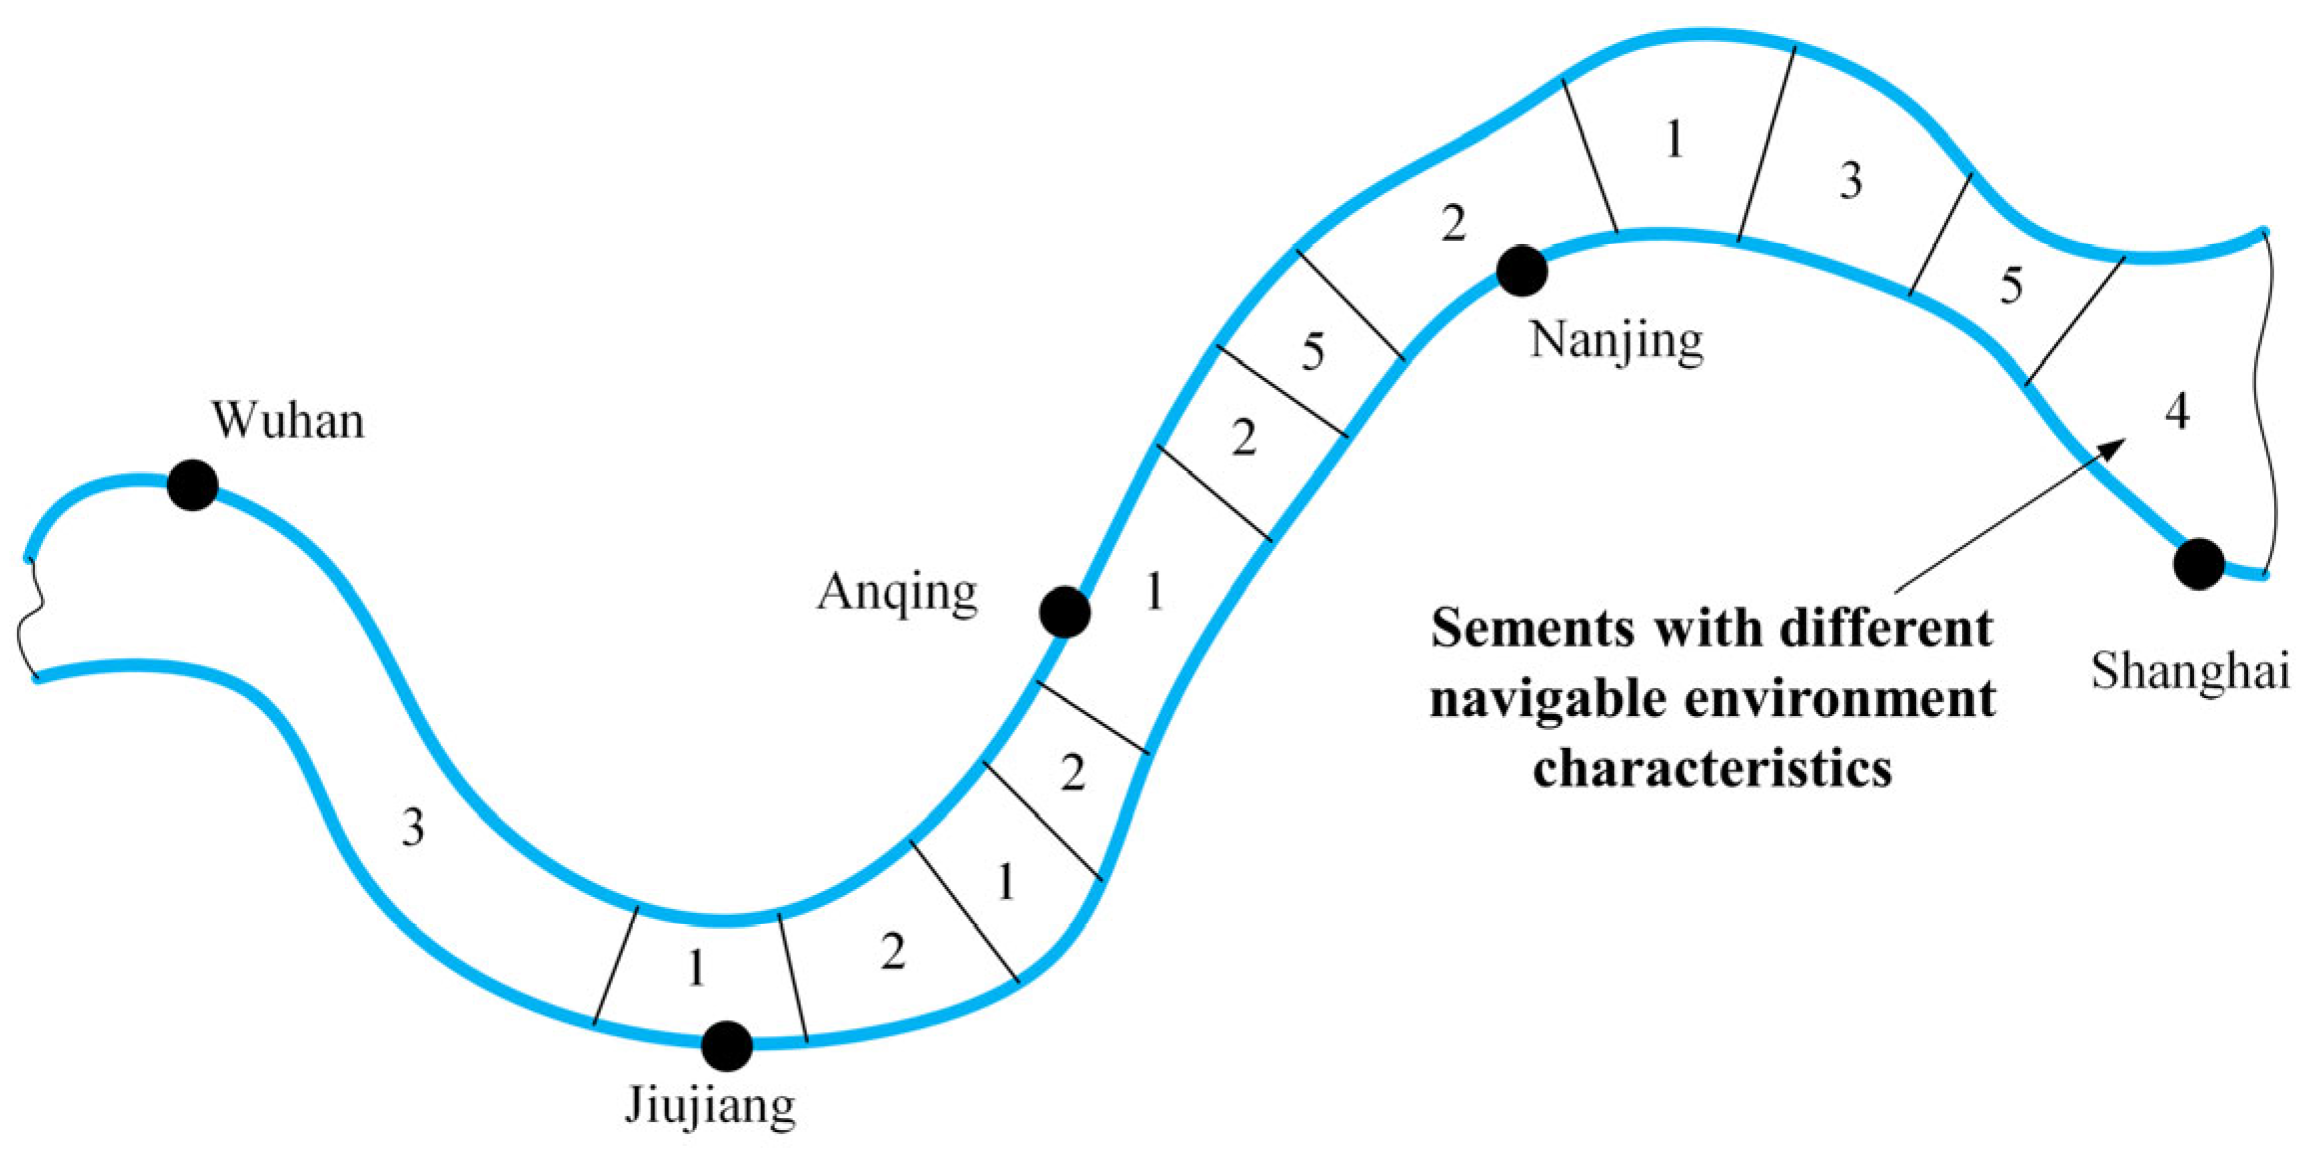
The detailed segmentation results of the Shanghai-Wuhan route are shown in Figure 7. The numbers 1, 2, 3, 4 and 5 marked on different segments in the figure represent the environmental categories.
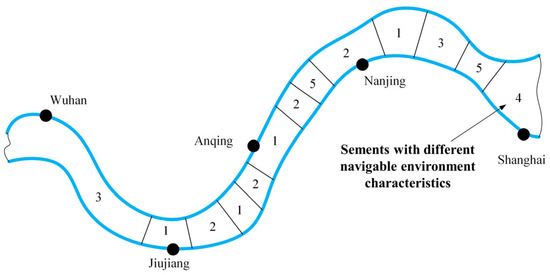
Figure 7.
Schematic diagram of the route division based on the navigation environment.
2.3. Fuel Consumption Prediction Model Considering Environmental Factors
In order to predict the fuel consumption of a ship navigating in different environments at a uniform speed, the navigating resistances in different navigation environments need to be calculated. A ship’s resistance can be divided into hydrostatic resistance and navigation environment resistance, and the latter comprises wind resistance, wave-induced resistance, and shallow water resistance.
According to the literature [30,31,32], ship hydrostatic resistance, wind resistance, wave-induced resistance, and shallow water resistance can be calculated, respectively, by the following equations.
where: Rt is the hydrostatic resistance, N. RF is the frictional resistance, N. 1 + k1 is the viscous resistance coefficient, RAPP is the appendage resistance, N. RW is the wave-making resistance, N. RB is the bulbous bow additional resistance, N. RTR is the tail-immersion additional resistance, N. RA is the related resistance of the model ship, N. Rwind is the wind resistance, N. Cwind is the wind resistance coefficient, ρair is the air density, kg/m3. AT is the frontal area of the ship at the waterline, m2. Vwind is the longitudinal relative wind speed along the ship’s motion direction, m/s. Rwave is the wave-induced resistance, N. Fr is the Froude number, h is the wave height, m. Lwl is the waterline length, m. ρ is the density of water, kg/m3. S is the ship’s wetted surface, m2. Vs is the ship’s speed through water, m/s. fs is the conversion factor and R is the ship’s total navigating resistance, N.
In order to keep a ship navigating steadily, the ship propulsion system needs to provide sufficient thrust to overcome resistance. When the propeller works at the stern, its suction effect causes an increased water velocity in the stern region. Correspondingly, the pressure distribution changes in the stern region, leading to an increase in the pressure resistance and frictional resistance of the ship. The relationship between the ship’s navigating resistance and the propeller thrust can be expressed by the following formula [33,34].
where ΔT is the thrust deduction, N. and t is the thrust deduction factor.
The thrust T and torque Q generated by the propeller can be calculated by the following equations [35].
where kt is the propeller thrust coefficient, kq is the propeller torque coefficient, n is the propeller rotation speed, r/min and DP is the propeller diameter, m.
The thrust coefficient kt and torque coefficient kq can be expressed by the open-water characteristic curve of the propeller. Referring to the open-water characteristic curve of the MAU-type propeller, the fitted empirical equations of the thrust coefficient kt and torque coefficient kq versus the advance coefficient J are as follows.
The ship’s main engine is the energy supply device for the propulsion system, which provides energy to the propeller via fuel consumption. According to the data collected from the target ship, the relationship between the fuel consumption of the ship’s main engine and the tail shaft power can be obtained by a polynomial fitting, which can be expressed as:
where f is the fuel consumption of the main engine per unit of time, and PB is the tail shaft power.
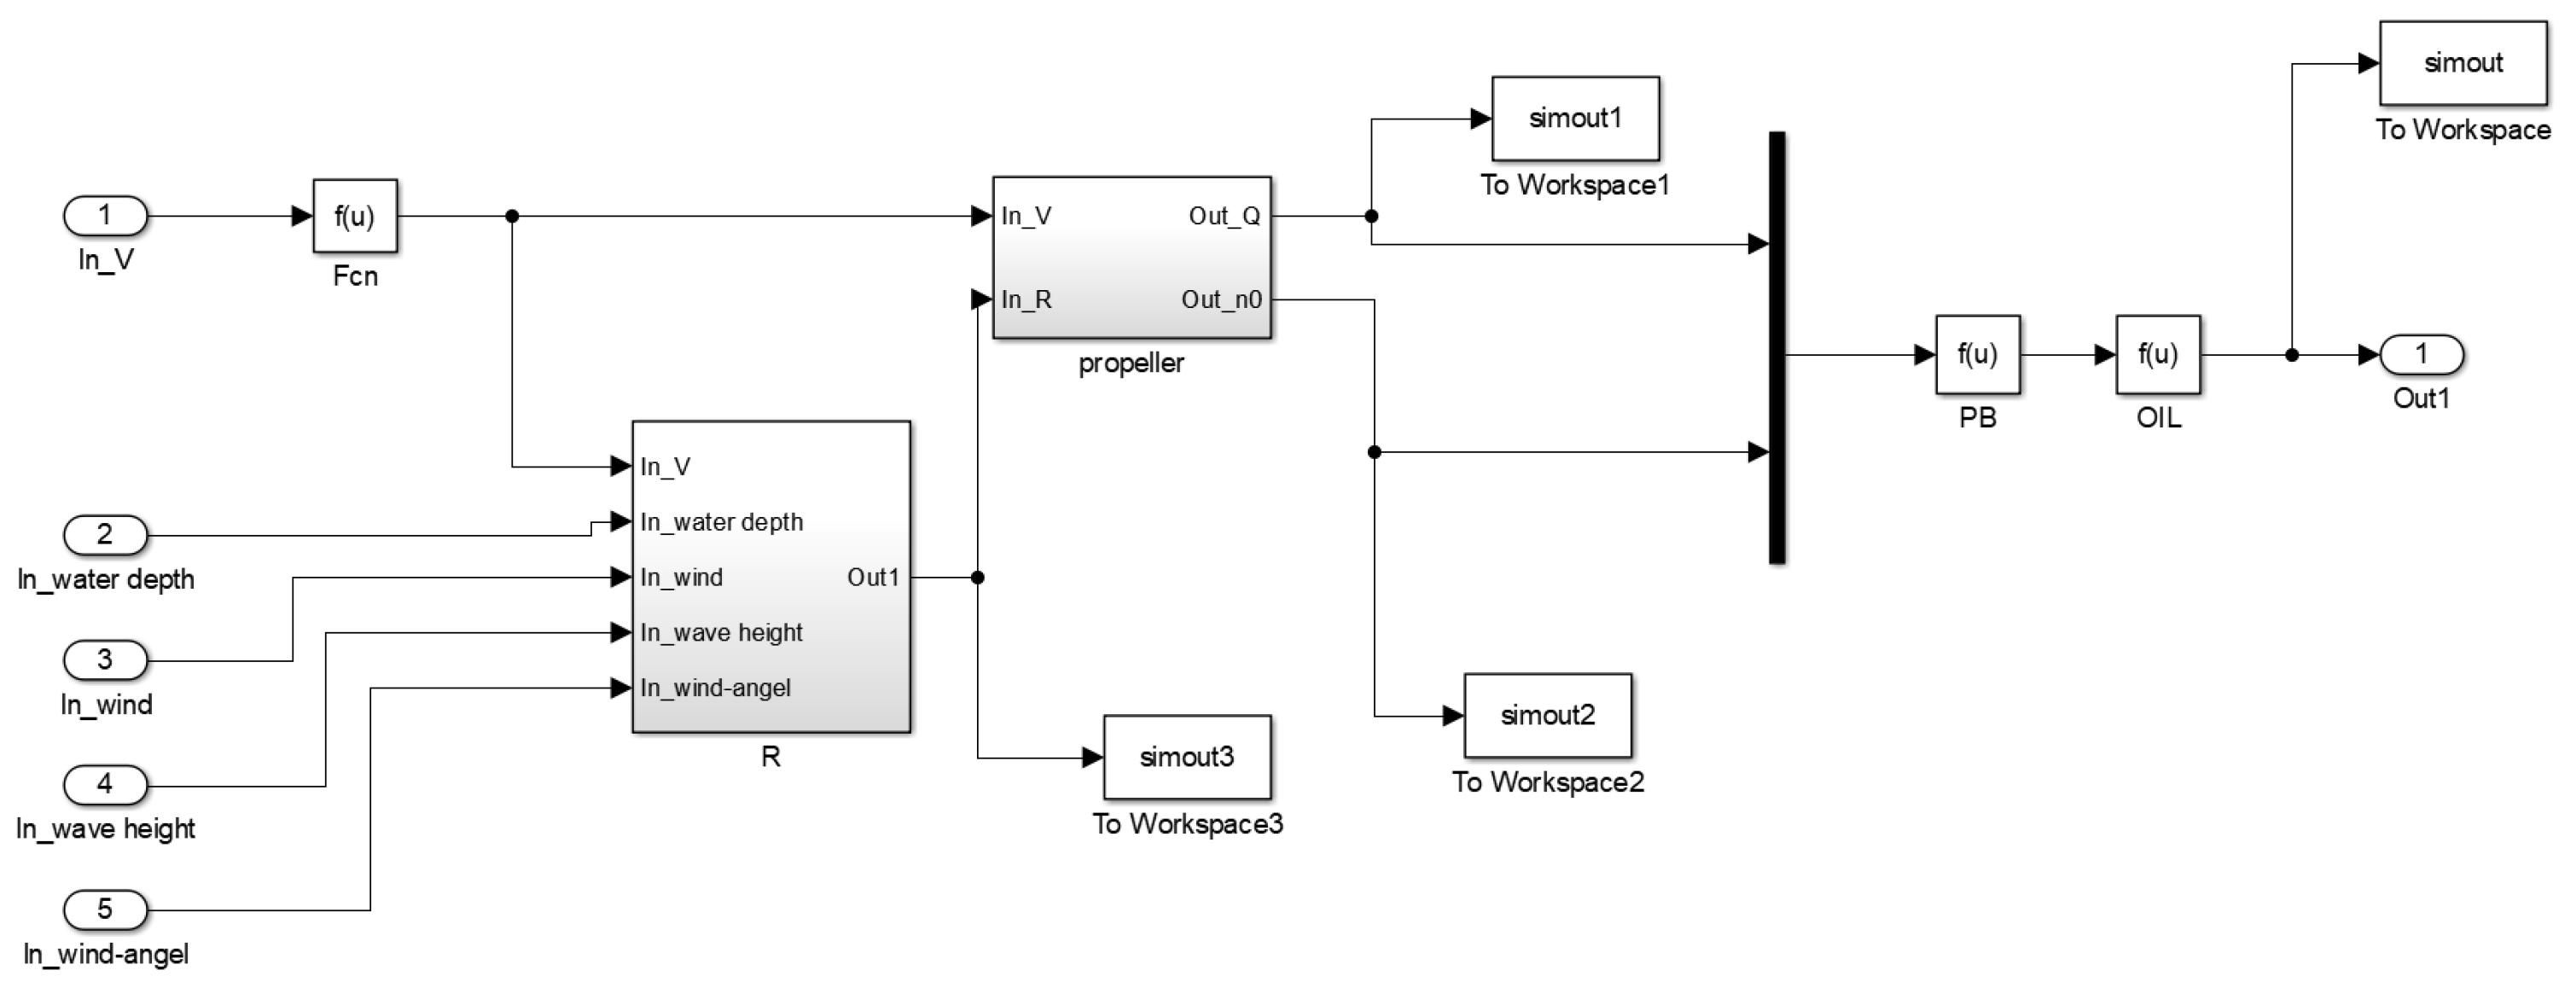
The fuel consumption prediction model of the target ship can be constructed based on (1)–(10), as shown in Figure 8.
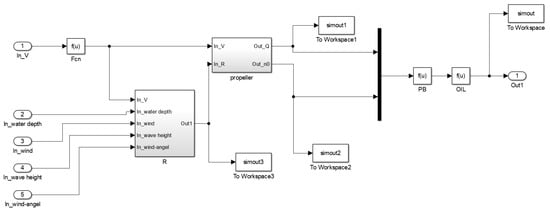
Figure 8.
Fuel consumption prediction model of the target ship.
In order to verify the accuracy of the fuel consumption prediction model, the prediction results were compared with the actual fuel consumption values measured. Since the fuel consumption prediction model assumed that a ship’s navigating resistance was equal to its effective thrust, the data collected during navigation at a uniform speed needed to be selected. In addition, it was necessary to select data acquired at various speeds. Based on the above principles, 100 real ship data sets were selected after data cleaning, and some of them are shown in Table 2.

Table 2.
Part of the verification data.
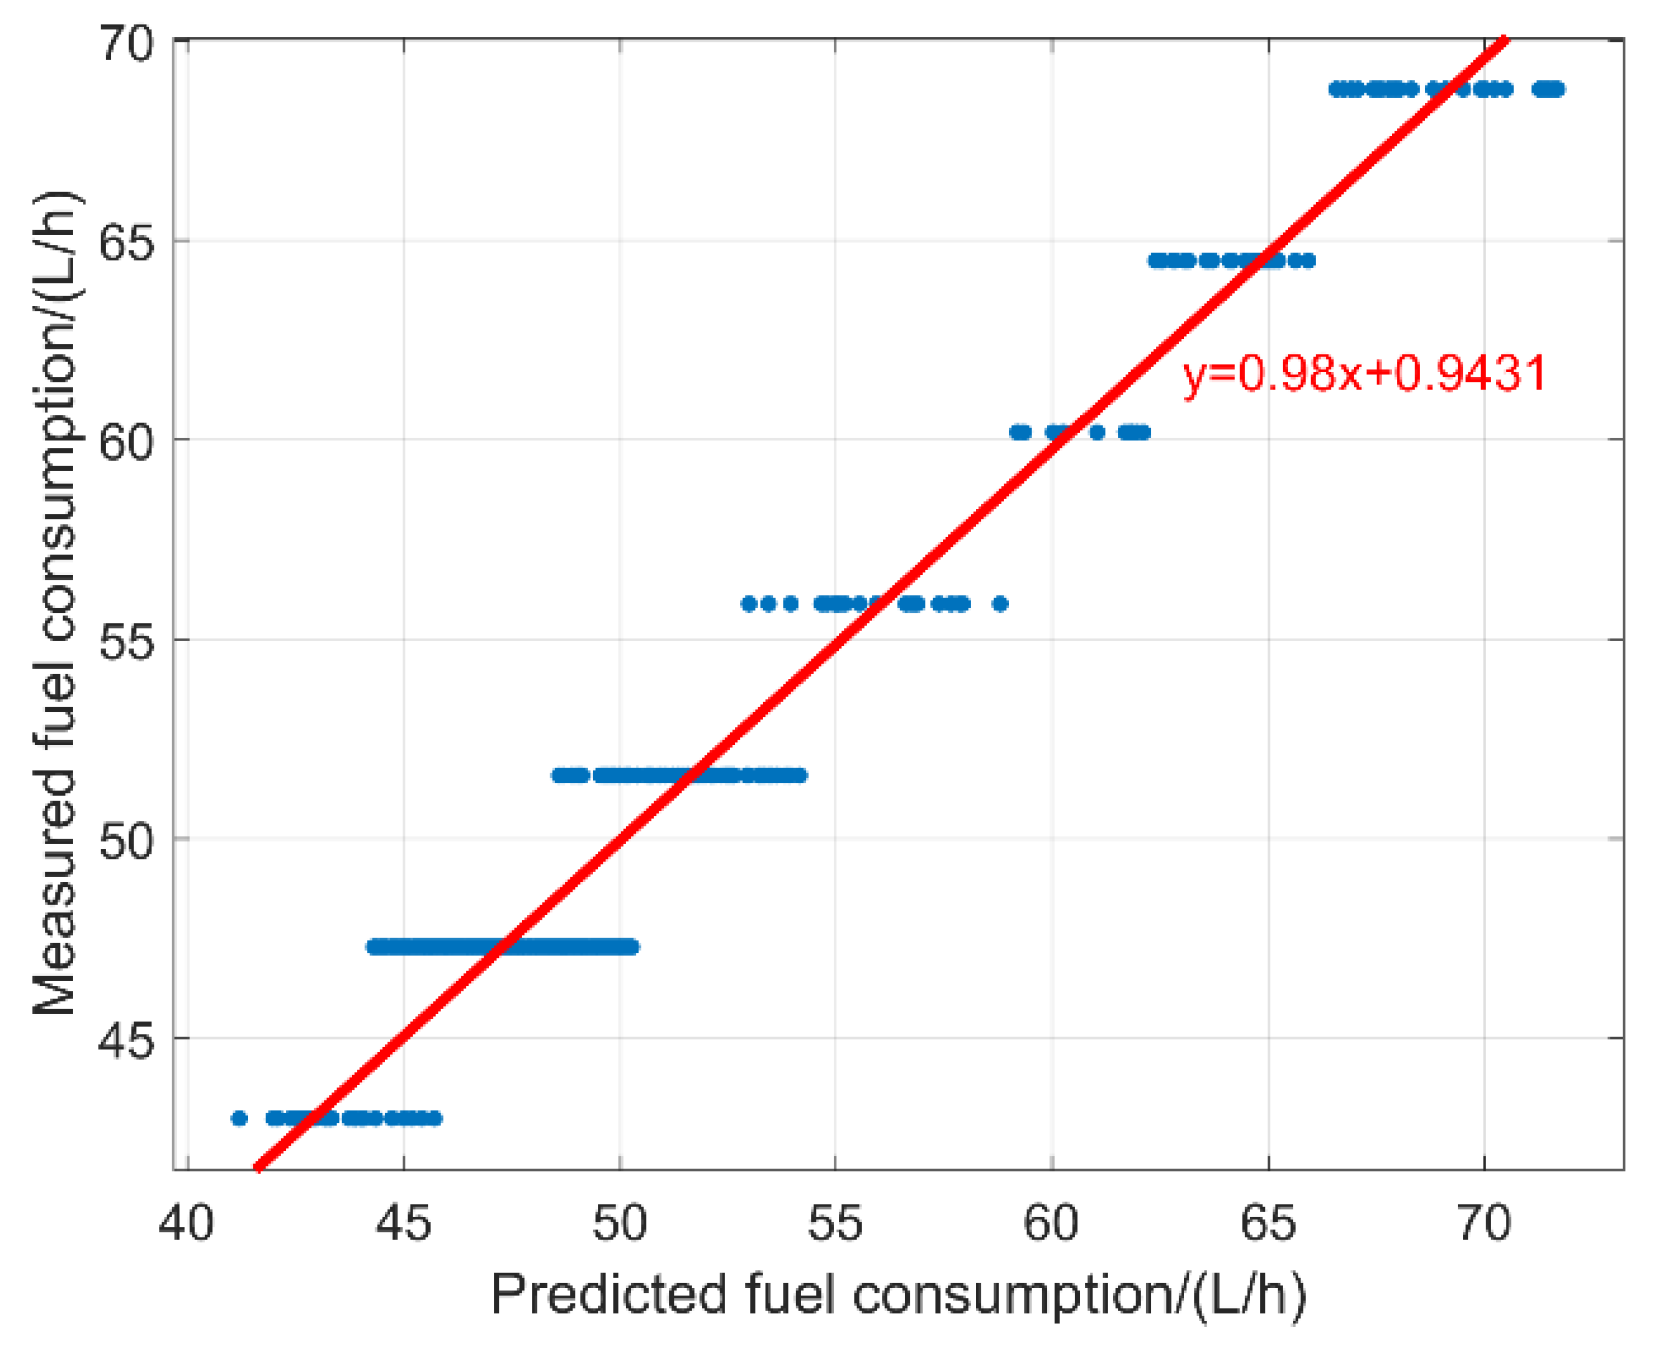
The speed through water, wind speed, water depth, wave height, and flow rate values among the selected real ship data were used as the input for the fuel consumption prediction model, and the output of the model, i.e., the predicted fuel consumption values were compared with the measured values and subjected to linearly fit the predicted and measured fuel consumption values, respectively, as shown in Figure 9.
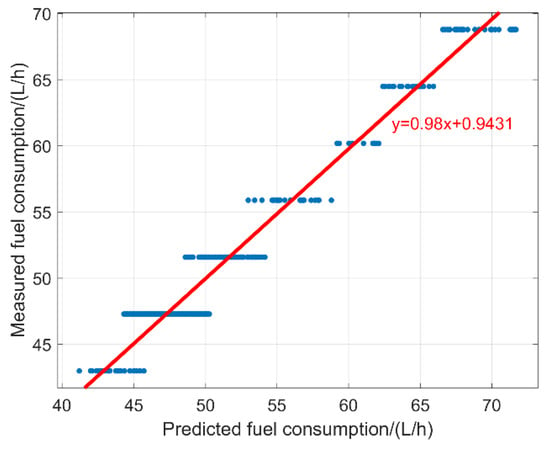
Figure 9.
Relationship between predicted and actual fuel consumption values (The blue line shows the relationship between the predicted value and the actual value, and the red line is the line to further fit the predicted value and the actual value).
The predicted results of the main engine’s fuel consumption were close to the actual values, with an R-squared value of 0.9087. The maximum error between the predicted and actual values of the main engine’s fuel consumption was 8.3%, with the average error being 5.8%. The verification results indicate that the model can accurately predict the ship’s fuel consumption in different navigation environments. The error was mainly caused by the fact that the theoretical method made some simplifications and assumptions for predicting the ship fuel consumption, thereby leading to the deviation of the predicted values from the measured values.
2.4. Speed Optimization Models with Multiple Different Optimization Objectives
2.4.1. Optimization Model for Minimizing the Total Shipping Cost
Since speed optimization was not required while the ship is in port, the total shipping cost for the entire voyage only took into account the fuel cost, the fixed operating cost, and the penalty for delayed arrival.
A ship’s fuel consumption during the voyage mainly comprises the main engine’s fuel consumption and the auxiliary engine’s fuel consumption. The fuel cost during the entire voyage can be expressed as:
where: Rs is the price of diesel fuel per unit weight, yuan/t. di is the distance of the voyage segment i, km. is the ship’s speed through the water in segment i, kn. is the water flow rate in segment i, kn. is the main engine’s fuel consumption function, L/h. is the marine generator’s fuel consumption per unit of time during the voyage, L/h. and ρ is the diesel fuel’s density, taken as 0.991 kg/L.
The fixed operating costs include the time charter cost and crew wages. The fixed operating costs are related to the navigation time of the entire voyage and can be expressed as:
where W is the crew wage per unit of time, yuan/month, and Te is the time charter cost per unit of time, yuan/month.
When ships fail to arrive at the designated port by the required time, it will cause schedule delays and a loss of the shipping company’s goodwill, and the cost of ship delays can be very high. Actually, shipping companies also quantify the losses caused by the delayed arrival of ships. The cost of ship delays can be expressed as follows.
where L is the delay penalty per unit of time, yuan/h. T is the actual time the ship arrives at port; h. and D is the latest time the ship is scheduled to arrive at port, h. is defined as follows.
Based on the above assumptions and analysis, a speed optimization model with the objective of minimizing the total shipping cost for the entire voyage can be established as follows.
where is the minimum safe speed of the ship, kn, and is the maximum safe speed of the ship, kn.
2.4.2. Optimization Model for Minimizing Carbon Emissions from Ships
The CO2 emissions from ships can be obtained by multiplying a ship’s fuel consumption by the CO2 emission factor. Since the penalty for delayed arrival is not included in the model for minimizing carbon emissions, a navigation time constraint was set additionally. According to the IMO’s CO2 emission factor of 3.11, which is used to calculate the Energy Efficiency Design Indicator for new ships, the CO2 emissions of the ship can be expressed as:
2.4.3. Multi-Objective Optimization Model Considering Total Shipping Costs and Carbon Emissions
There are multiple optimization objectives involved in a ship’s speed optimization studies. Ship-owners and shipping companies hope to reduce the operating cost as much as possible, while governments and organizations are expected to reduce the carbon emissions of ships. In the context of low oil prices, the speed associated with the lowest emission is usually slower than that with the lowest operating cost. Therefore, a ship navigating at the lowest emission speed will lead to a higher charter cost and thereby a higher operating cost. Consequently, there is a conflict between the optimization goals desired by shipping companies and government organizations, and an optimal solution needs to be identified that can optimize both goals to the greatest extent.
In order to build a multi-objective optimization model, the optimization objectives need to be normalized first to eliminate the effect of magnitude.
where and are the normalized total shipping cost and CO2 emission values, dimensionless. and are the minimum and maximum values of the total shipping cost, yuan. and are the minimum and maximum values of CO2 emissions, kg. is the value of the CO2 emissions corresponding to the lowest total shipping cost; kg. and is the total shipping cost corresponding to the lowest CO2 emissions, in yuan.
Through a non-negative weighted summation, the multiple-objective problem can be transformed into the following single-objective problem.
where and are the weights of each objective, which are usually judged and decided by decision-makers based on experience and expectations.
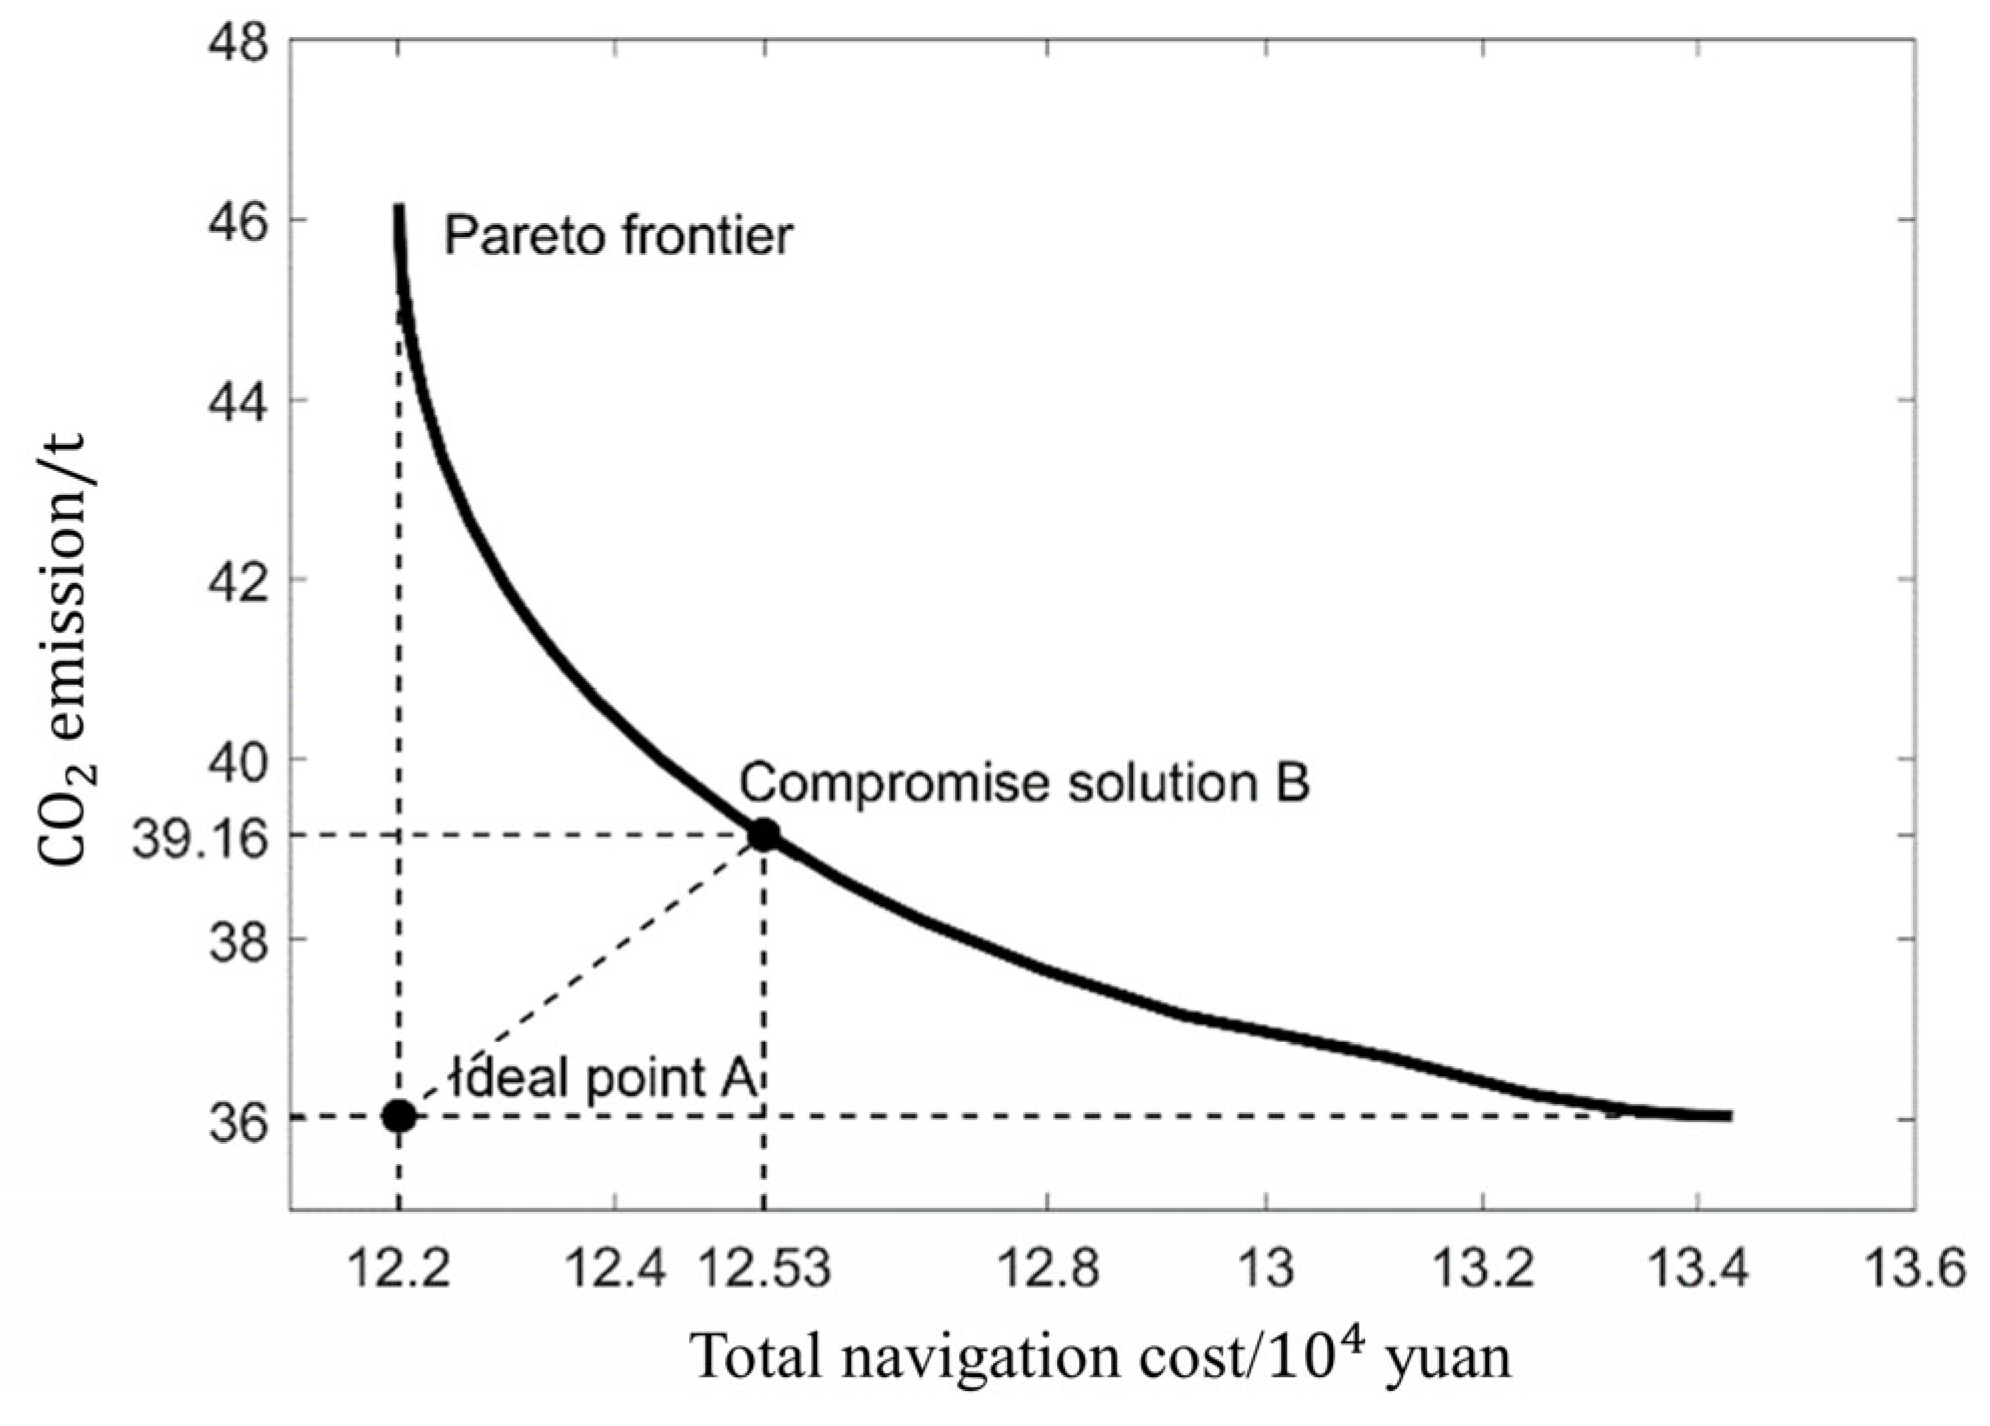
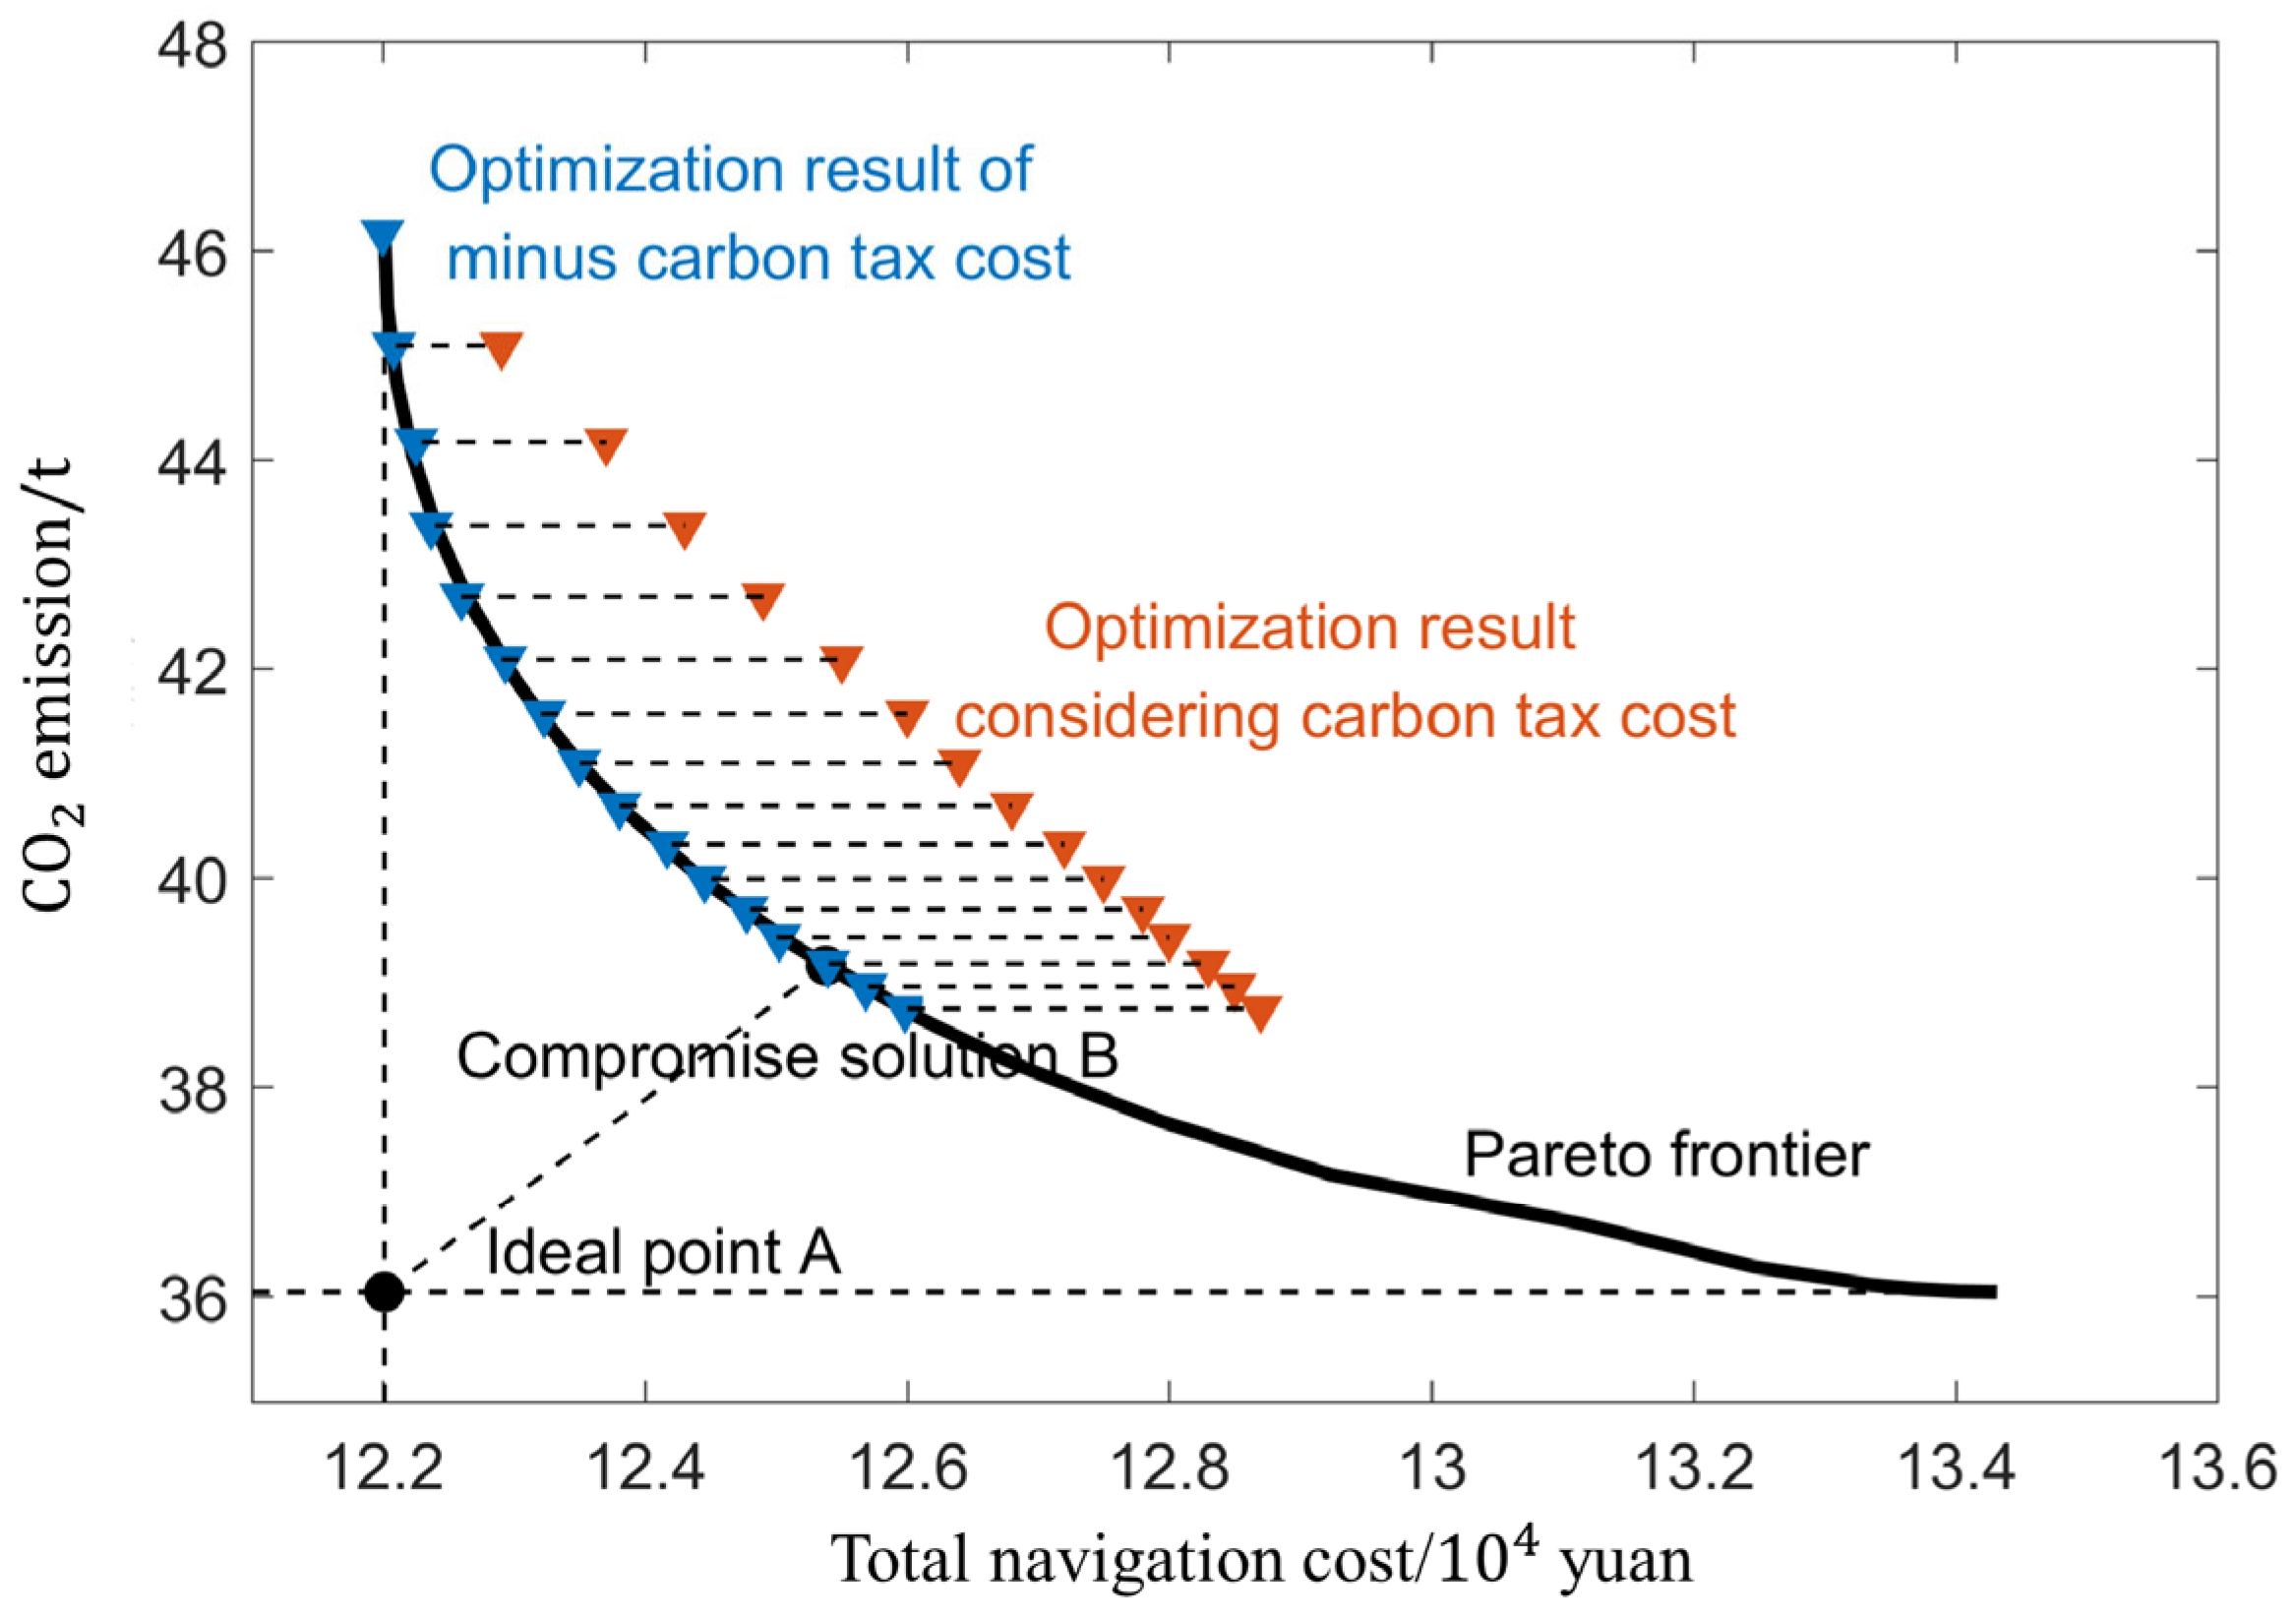
The multi-objective optimization model was modified by adjusting each objective weight, and the Pareto optimal solution set can be obtained under certain constraints, which were noted as [(,), (,), …, (,)]. Selecting a suitable solution from the Pareto optimal solution set as the compromised solution is the last step of multi-objective optimization. In this paper, the solution with the minimum distance to the ideal point A is selected from the Pareto optimal solution set as the compromised solution B. The ideal point A is the point where every objective is optimal and is denoted as (, ). The distance from a solution in the Pareto optimal solution set to the ideal point A can be expressed as:
where (, ) is the i-th non-inferior solution in the Pareto optimal solution set, I = 1, 2, …, n. The solution corresponding to the smallest d is the compromised solution.
2.4.4. Optimization Model Considering the Carbon Tax Cost
In this section, the carbon emission tax policy, which may be implemented for the shipping industry in the future, is taken into consideration. The model for minimizing the operating cost including the carbon tax cost is established. The carbon tax cost refers to the carbon tax fee levied on carbon emissions exceeding a certain threshold. Assuming that the tax-free allowance for CO2 emissions is Q for the entire voyage, the carbon tax fee to be paid is:
where δ is the carbon tax rate, yuan/t.
In summary, a speed optimization model with the objective of minimizing the operating cost for the entire voyage can be established as follows:
3. Case Study
3.1. Parameter Settings
According to the actual situation, the specific parameters of the optimization model, including the fuel price, marine generator fuel consumption, scheduled latest arrival time, demurrage, crew wages, charter cost, and safe speed constraints, were set as shown in Table 3.

Table 3.
Specific parameters.
Referring to the limits set by the European Union’s emission trading scheme for the aviation industry [31], the carbon emission cap is 95% of the average historic carbon emissions, of which 85% is the free carbon credits. Assuming that optimization is carried out aiming at the lowest shipping cost without considering the carbon tax, the carbon emissions corresponding to the optimized speed are regarded as the average historic carbon emissions, and the free carbon credits are the average historic carbon emissions × 95% × 85%. In addition, different countries impose a wide range of carbon tax rates, from less than €1 (RMB 8) per ton to a maximum of €140 (RMB 1119) per ton, on different industries. For example, the Norwegian government is considering implementing a carbon tax policy for the shipping industry. The carbon tax rate is set at 60 euros per ton (479 yuan per ton) to 120 euros per ton (959 yuan/t). Therefore, in this paper, the carbon tax rate was set as 500 yuan/t.
3.2. Speed Optimization Results
After the optimization model was established, a speed optimization was carried out using the artificial fish swarm algorithm. Based on multiple simulations, the parameters of the algorithm were set as follows: artificial fish swarm size m = 40, artificial fish movement step Step = 0.2, artificial fish visual field Visual = 0.5, number of attempts Trynumber = 50, and crowding factor ε = 0.5.
First, the models minimizing the total shipping cost (Equation (15)) and carbon emissions (Equation (16)) were solved using the artificial fish swarm algorithm to obtain the corresponding minimum values. Specifically, the minimum values of the total shipping cost and carbon emissions were determined to be 122,051 yuan and 35.93 t, respectively, and denoted as and . Meanwhile, the CO2 emission at the lowest total shipping cost was 46.04 t, denoted as , and the total shipping cost associated with the lowest carbon emissions was 134,261 yuan, denoted as . Subsequently, the multi-objective optimization model (Equation (19)) was subjected to an optimization solution and a Pareto optimal solution set was obtained. Eventually, the solution closest to the ideal point A was selected as the compromised solution from the Pareto optimal solution set (Figure 10).
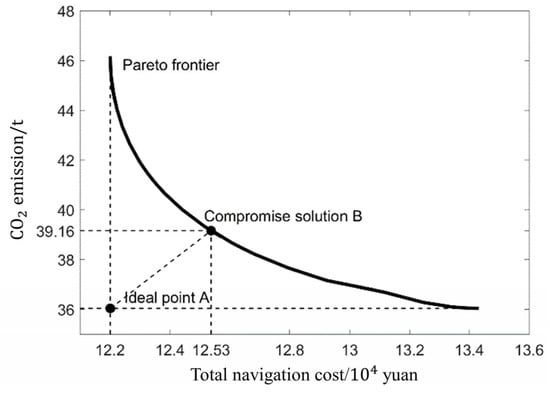
Figure 10.
Selection of the compromised solution from the Pareto frontier.
With minimizing the shipping cost as the objective, the determined values for CO2 emissions and free carbon credits were 46.04 t and 37.18 t, respectively. The optimization model with the lowest total shipping cost as the objective, which considered the carbon tax, was solved using the artificial fish swarm algorithm and the speed optimization results were obtained.
The measured values, including speed, total navigation time, costs, and CO2 emissions, for different segments, were compared with the speed optimization results obtained from the multiple-objective optimization model, as shown in Table 4.

Table 4.
Multi-objective optimization results.
3.3. Analysis of Optimization Results
As shown in Table 4, with minimizing the total shipping cost as the optimization objective, a ship navigating at the corresponding optimal speed resulted in a predicted total shipping cost of 122,015 yuan for the entire voyage, which was 4569 yuan (3.61% lower than the measured value). The associated navigation time was 109.68 h, which was 21.65 h (16.49% shorter compared with the measured value). A shorter navigation time indicated a higher ship speed. Although the fuel cost was higher due to the result of the increased average speed, the fixed operating cost was reduced to a larger extent, which ensured a lower total shipping cost. The purpose of a speed optimization study was to optimize a ship’s speed reasonably by fully considering the adverse effects of speed optimization, and thereby ensuring the optimization objective reaches the optimal value. With minimizing carbon emissions as the optimization objective, a ship navigating at the corresponding optimal speed was associated with a predicted CO2 emission value of 36.04 t for the entire voyage which was 3.27 t (8.32% lower than the measured value), and a predicted navigation time of 150.8 h which is 19.47 h (14.83% longer than the measured value). The increase in the navigation time implied a lower average speed, and the optimization results proved that lowering the speed properly reduced the ship’s CO2 emissions to a certain extent.
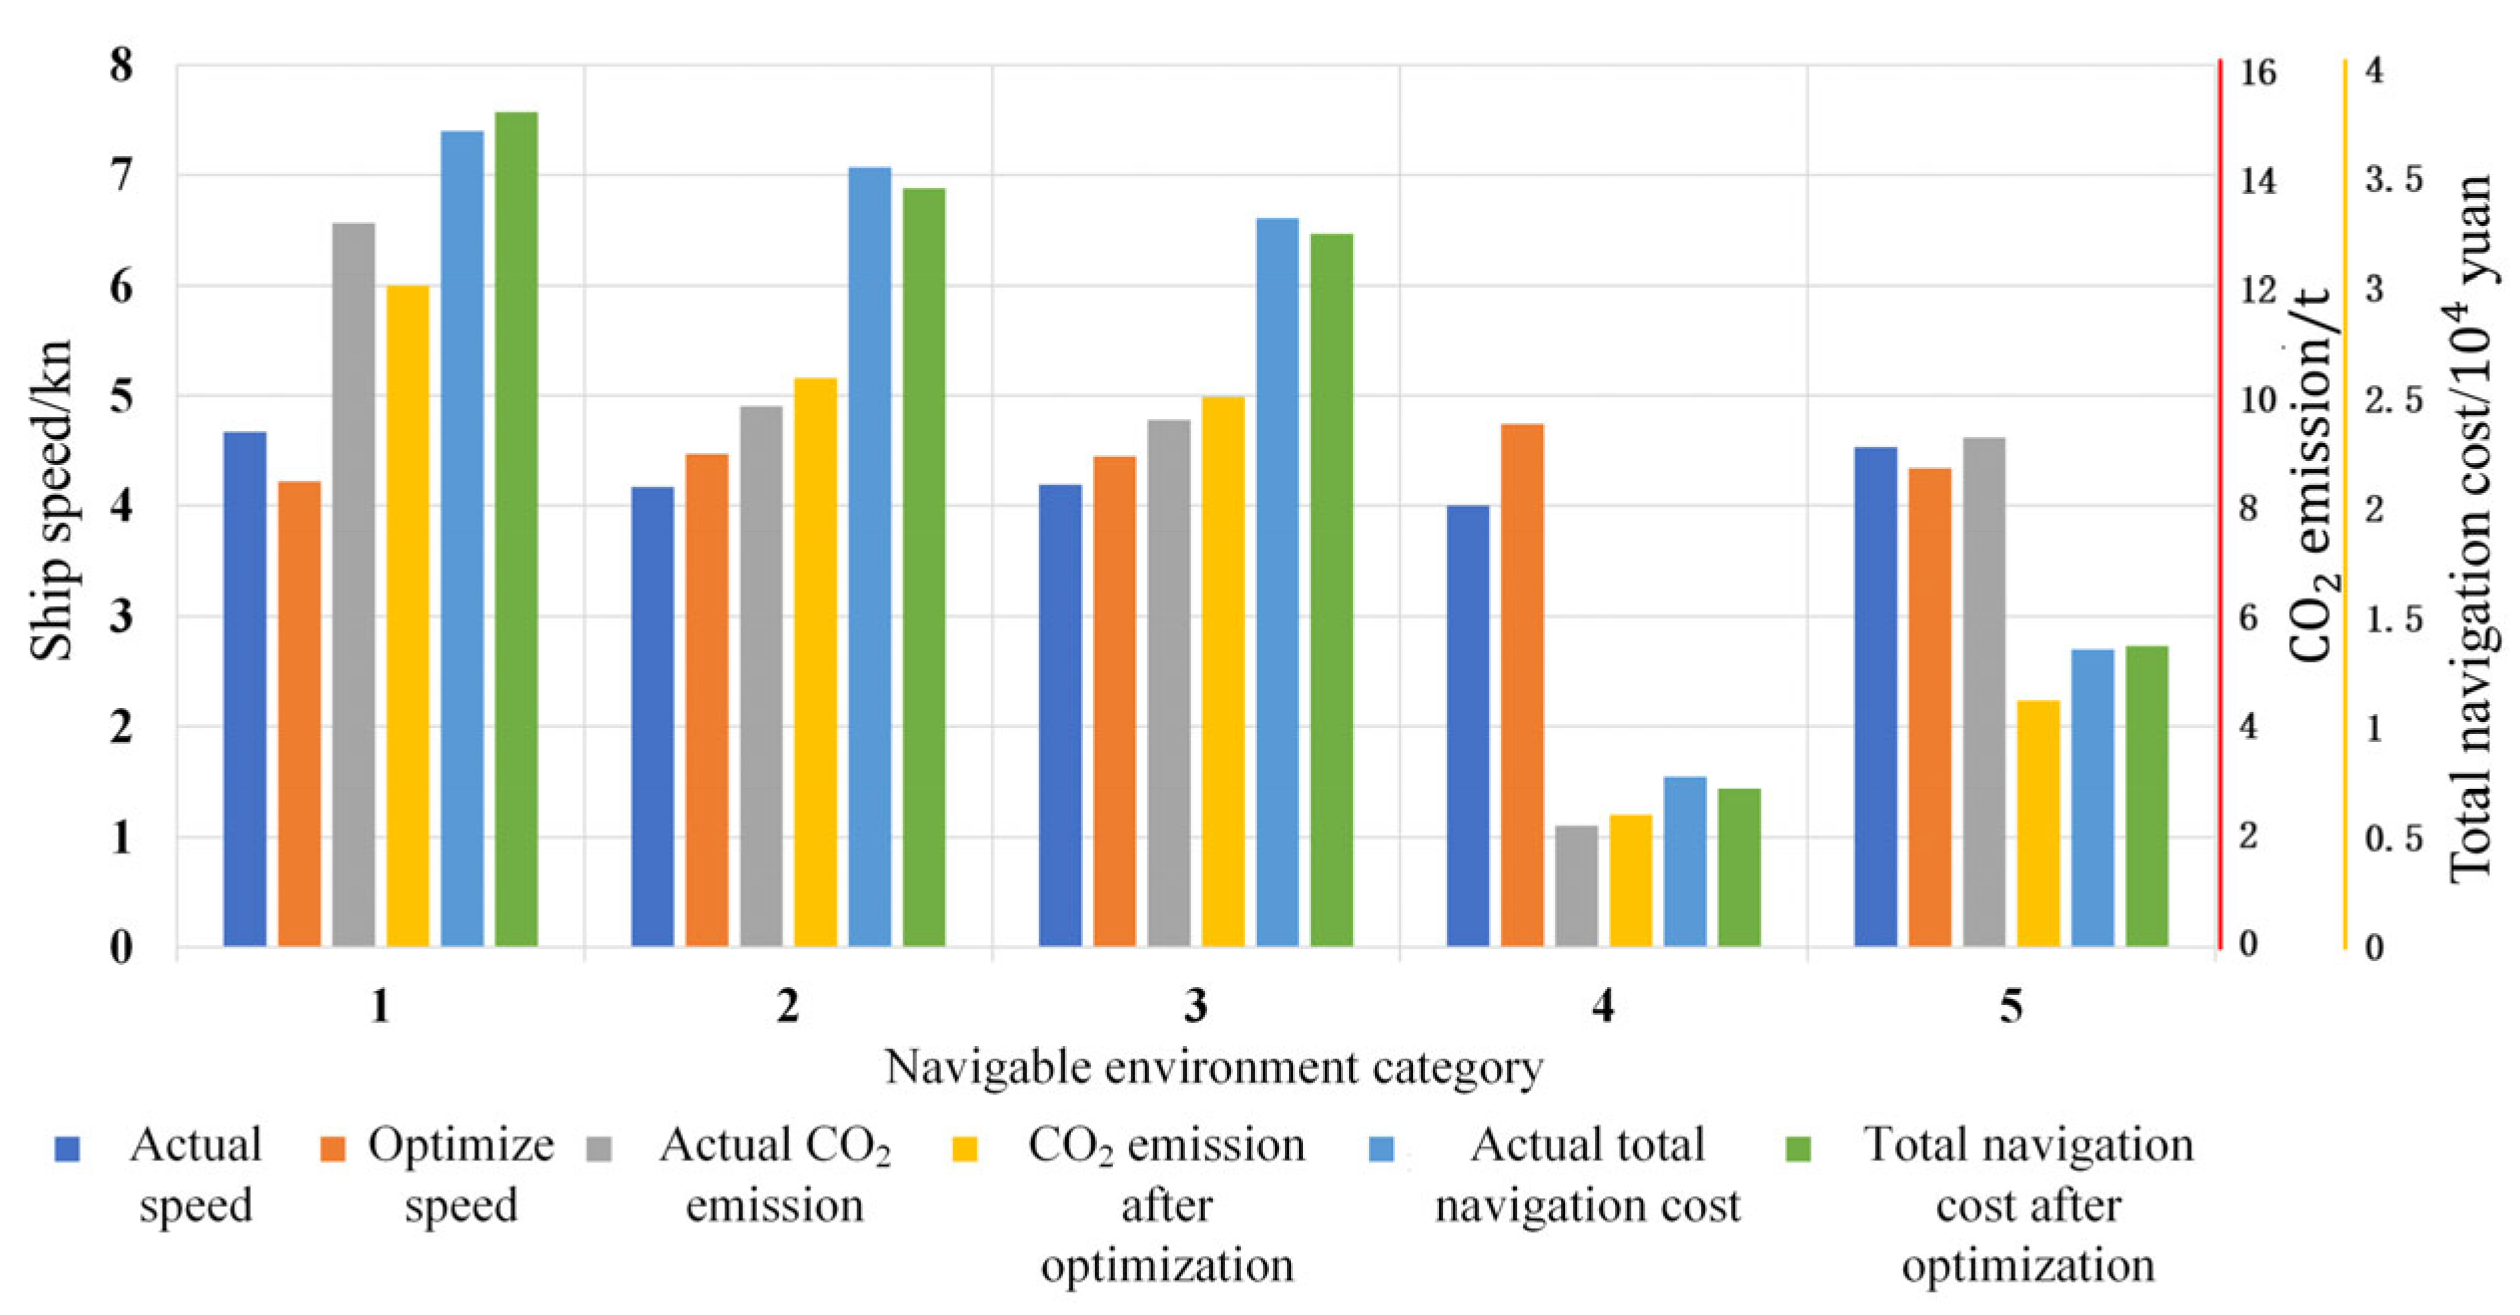
Figure 11 compares the multi-objective optimization results and measured values, including speed, fuel cost, and fixed operating cost for each segment. Combining Figure 11 and Table 4, it can be seen that compared to the measured values, the optimal speed and CO2 emissions decreased in environmental categories 1 and 5, accompanied by an increased total shipping cost. In environmental categories 2, 3 and 4, the optimal speed increased and the total sailing cost decreased, but with increased CO2 emissions. Overall, after optimization, the navigation time decreased by 1.69 h, corresponding to 188 yuan (0.39% decrease in fuel costs), 1007 yuan (1.28% reduction of the fixed operating cost), and a lowered total shipping cost of 1195 yuan or 0.94%, and reduced CO2 emissions of 0.15 t or 0.38%. The results indicate that the multi-objective optimization method was effective in factoring in the total shipping costs and carbon emissions. In addition, considering the differences in the navigation environment, the ship should speed up appropriately in some segments and slow down accordingly in others, provided that the constraints were satisfied. Therefore, optimizing a ship’s speed according to different navigation environments could lead to an increase in the total shipping costs and CO2 emissions in individual segments, but a reduction of both for the entire voyage, thereby ensuring the optimization objectives to reach the optimal values.
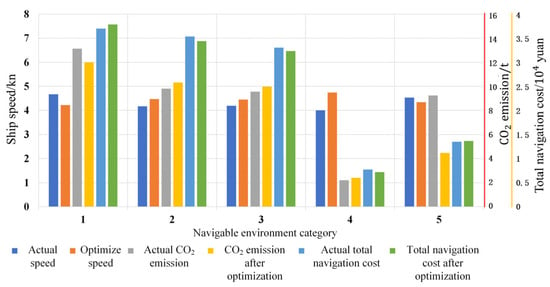
Figure 11.
Comparison of the actual values and the multi-objective optimization values.
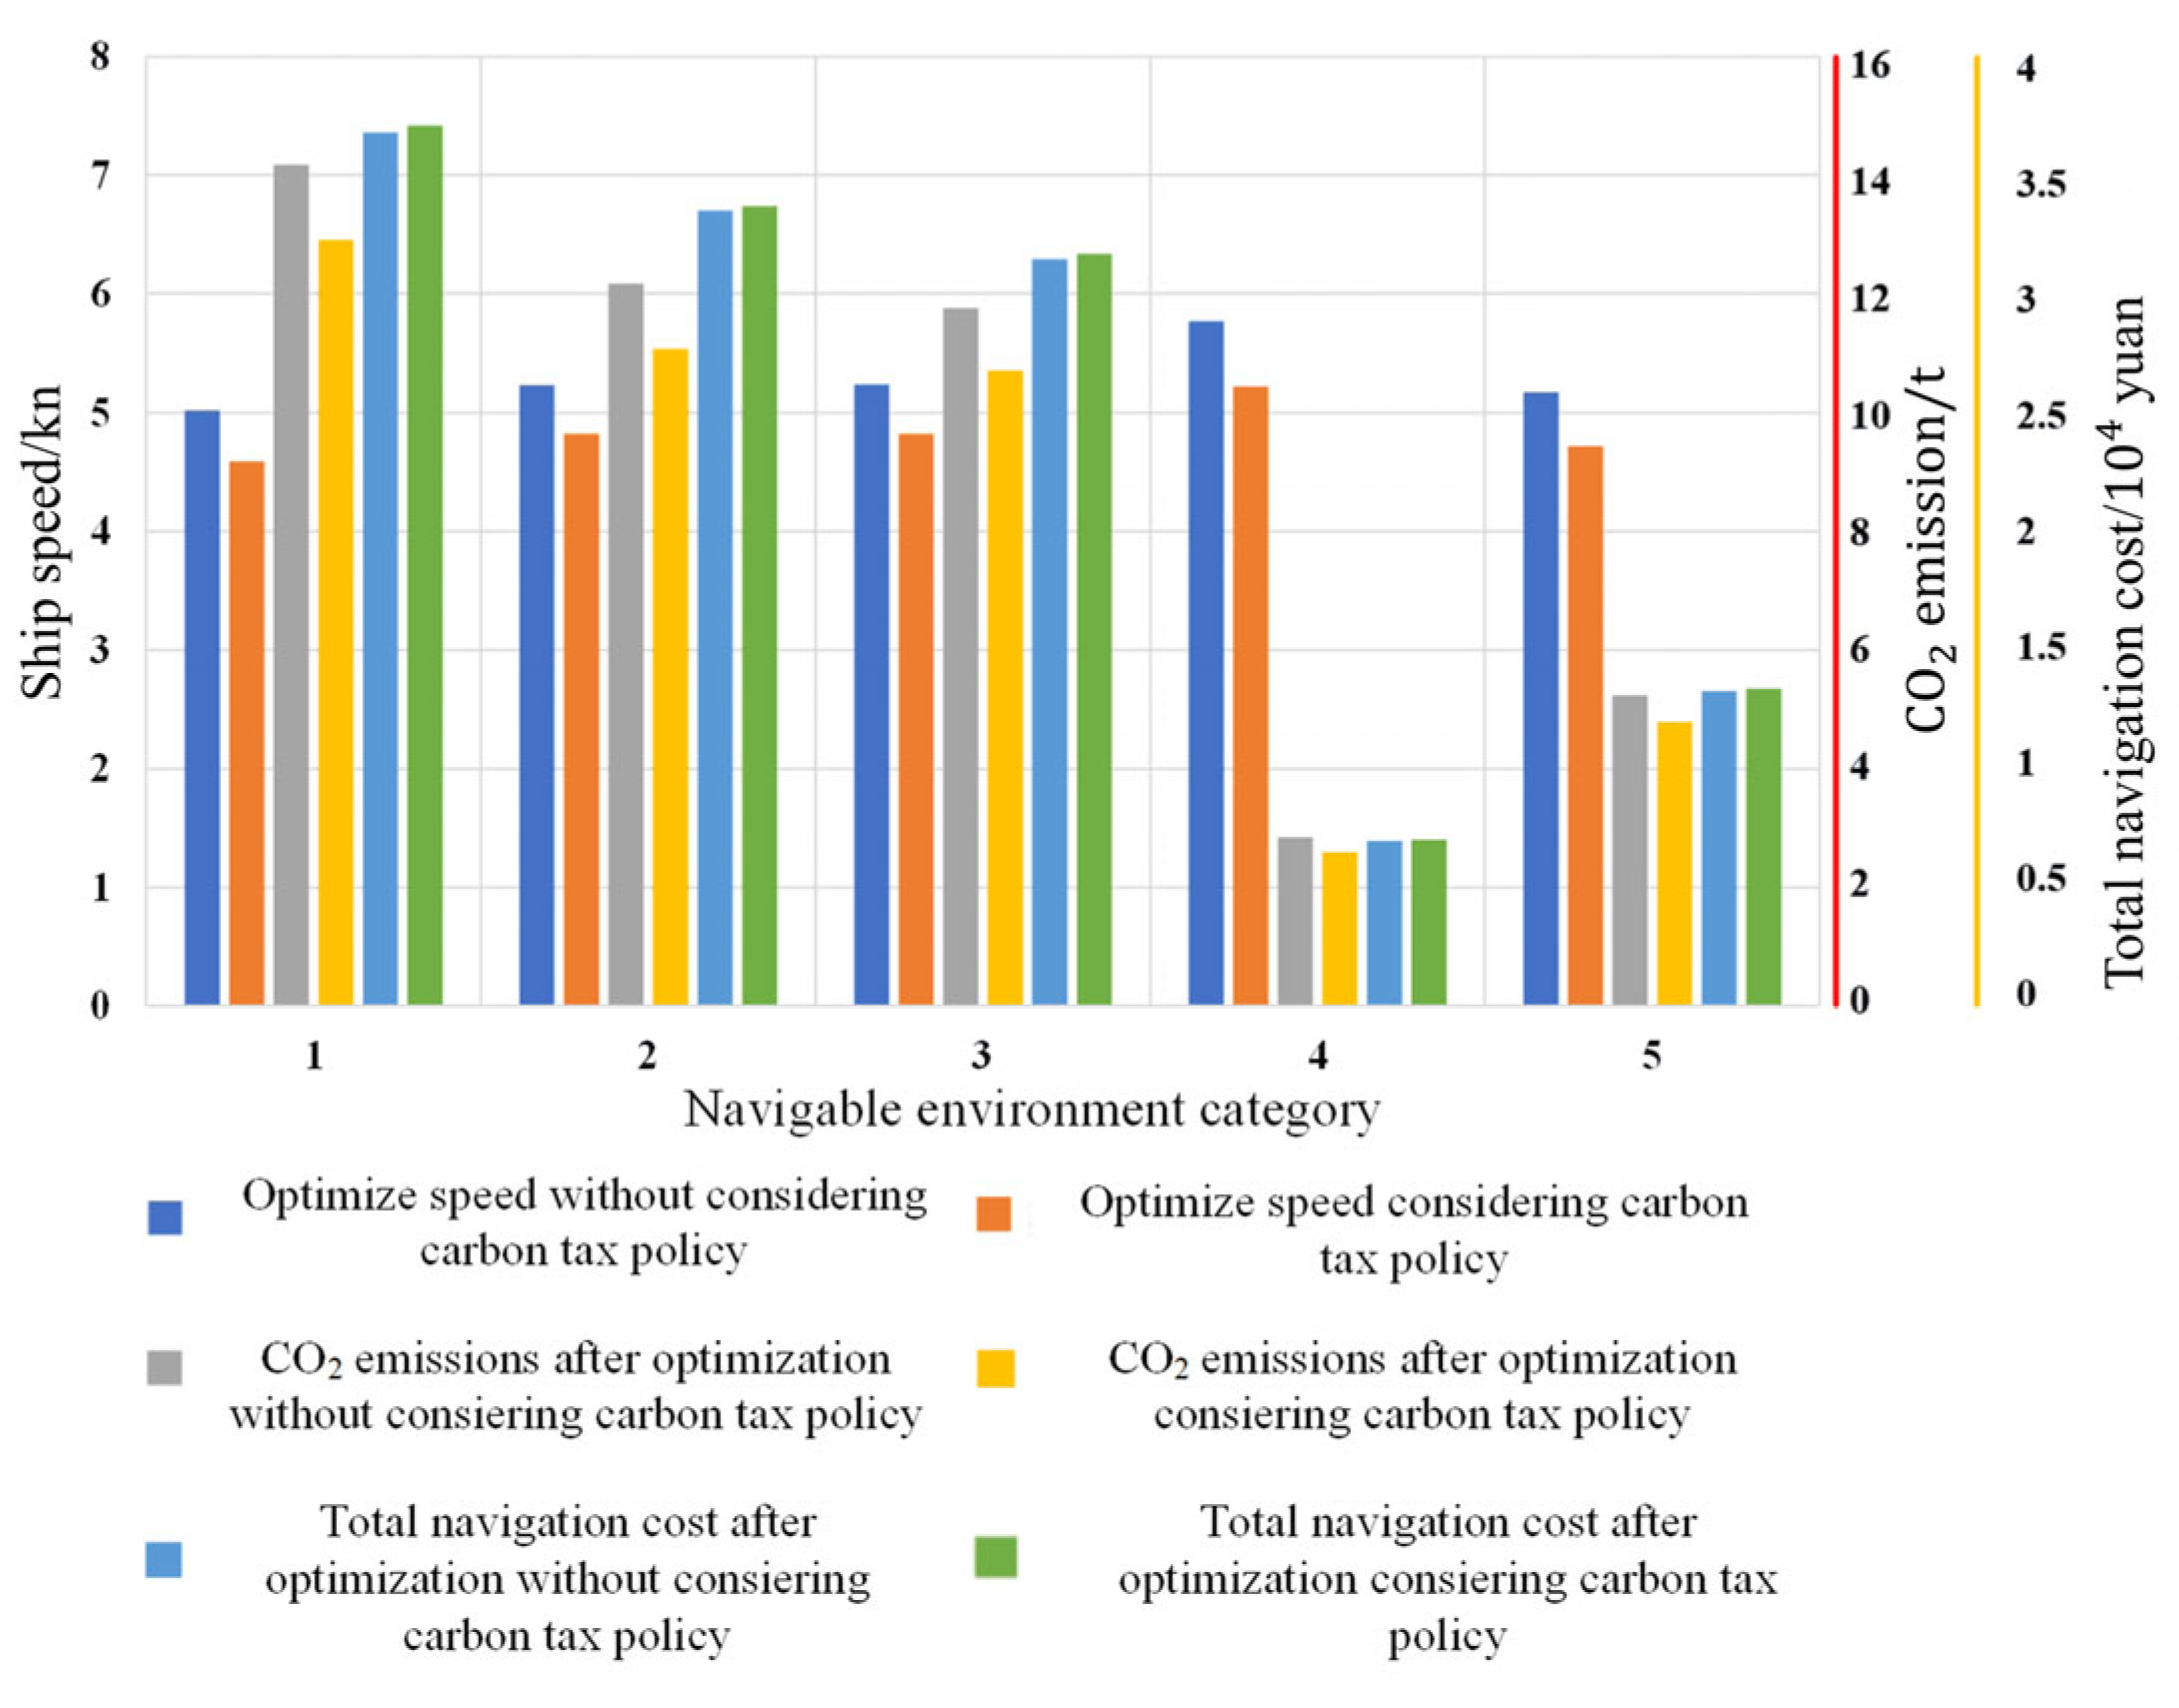
Figure 12 compares the optimization results for the lowest total shipping cost with and without considering the carbon tax cost, including speed, fuel cost, and fixed operating cost for each segment. By combining Table 4 and Figure 12, compared with the situation without a carbon tax policy, different degrees of reduction can be identified for the optimal speed in each segment when the carbon tax policy is considered. Meanwhile, when considering the carbon tax, CO2 emissions decreased by 4.08 t or 8.84%, while the total shipping cost increased by 1739 yuan or 1.43%, with 845 yuan being the additional carbon tax cost. The results suggested that applying a carbon tax would result in a significant reduction in a ship’s CO2 emissions, but a certain increase in a ship’s operating cost, which was mainly due to the additional carbon tax cost. In addition, although a lower ship speed was associated with a lower fuel cost, the accompanied longer operating time per voyage led to an increase in the fixed operating cost.
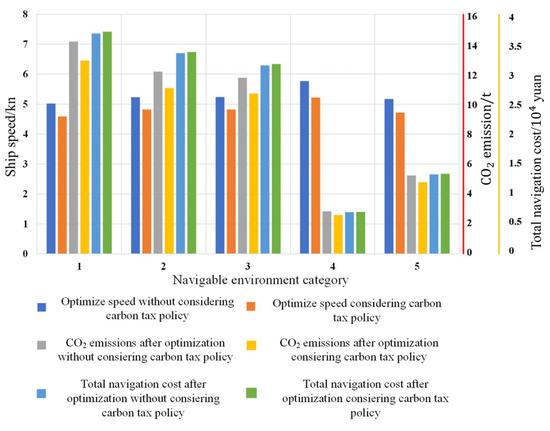
Figure 12.
Comparison of optimization values with and without considering the carbon tax.
4. Sensitivity Analysis
In this section, sensitivity analysis has been used to investigate the influence of factors such as navigation time, fuel price, charter rate, carbon credits, and carbon tax rate on the optimization results. Specifically, it was carried out by fixing parameters other than the factor being analyzed, solving the corresponding model for minimizing the shipping cost including a carbon tax cost, and analyzing the optimized ship speed, total shipping cost, CO2 emissions, delayed arrival penalty, and carbon tax cost.
4.1. Sensitivity Analysis on the Latest Arrival Time
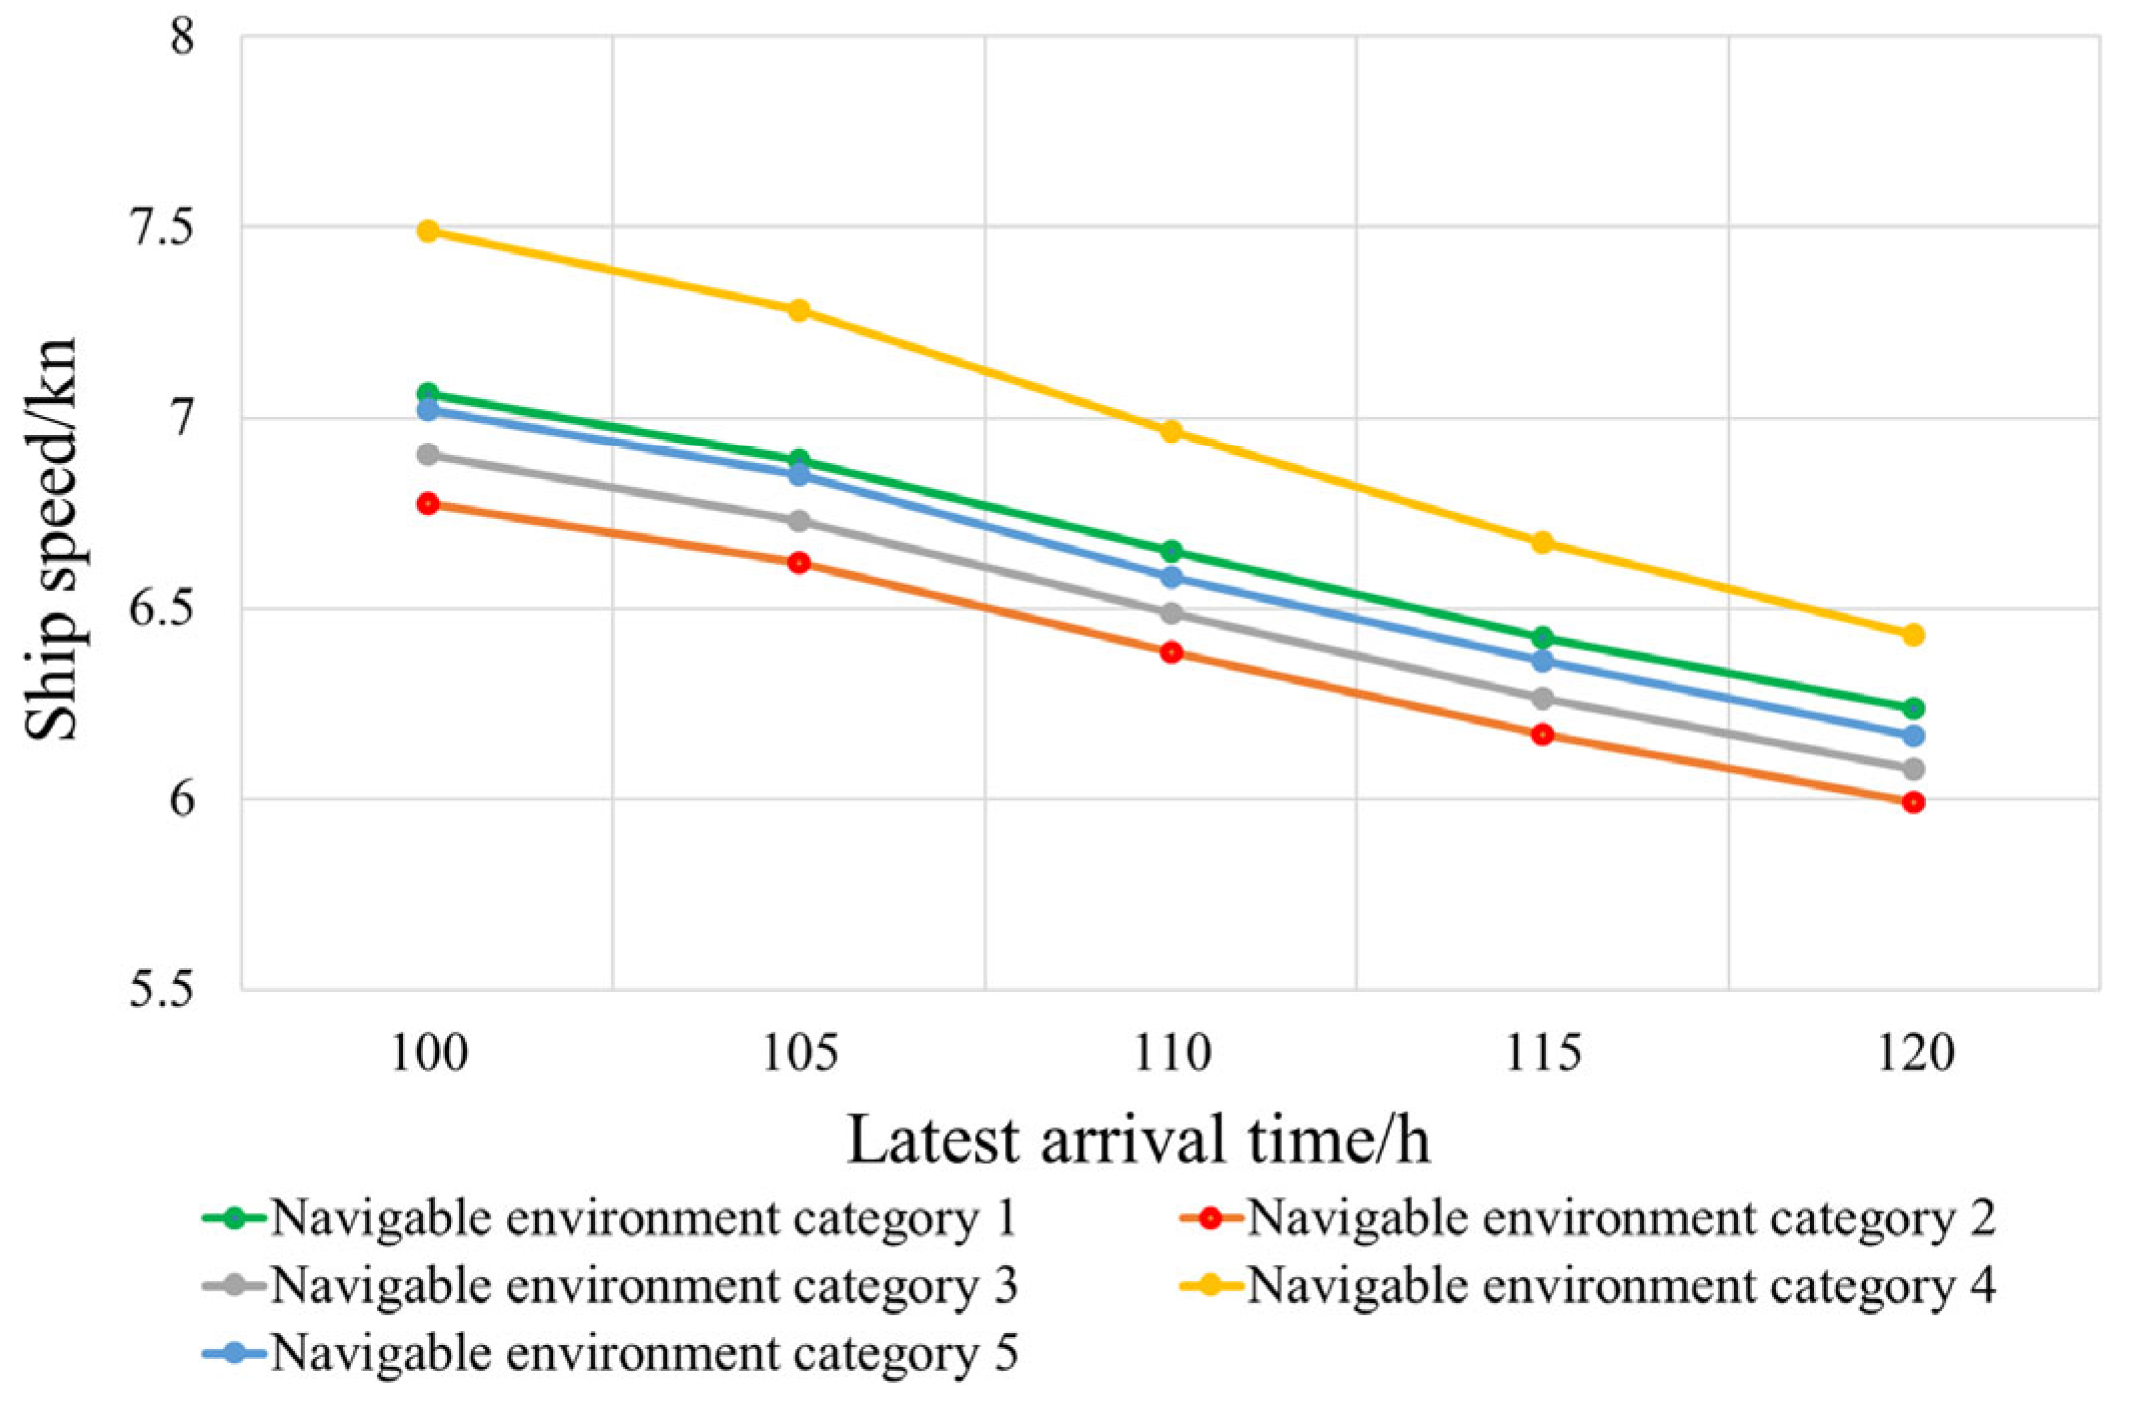
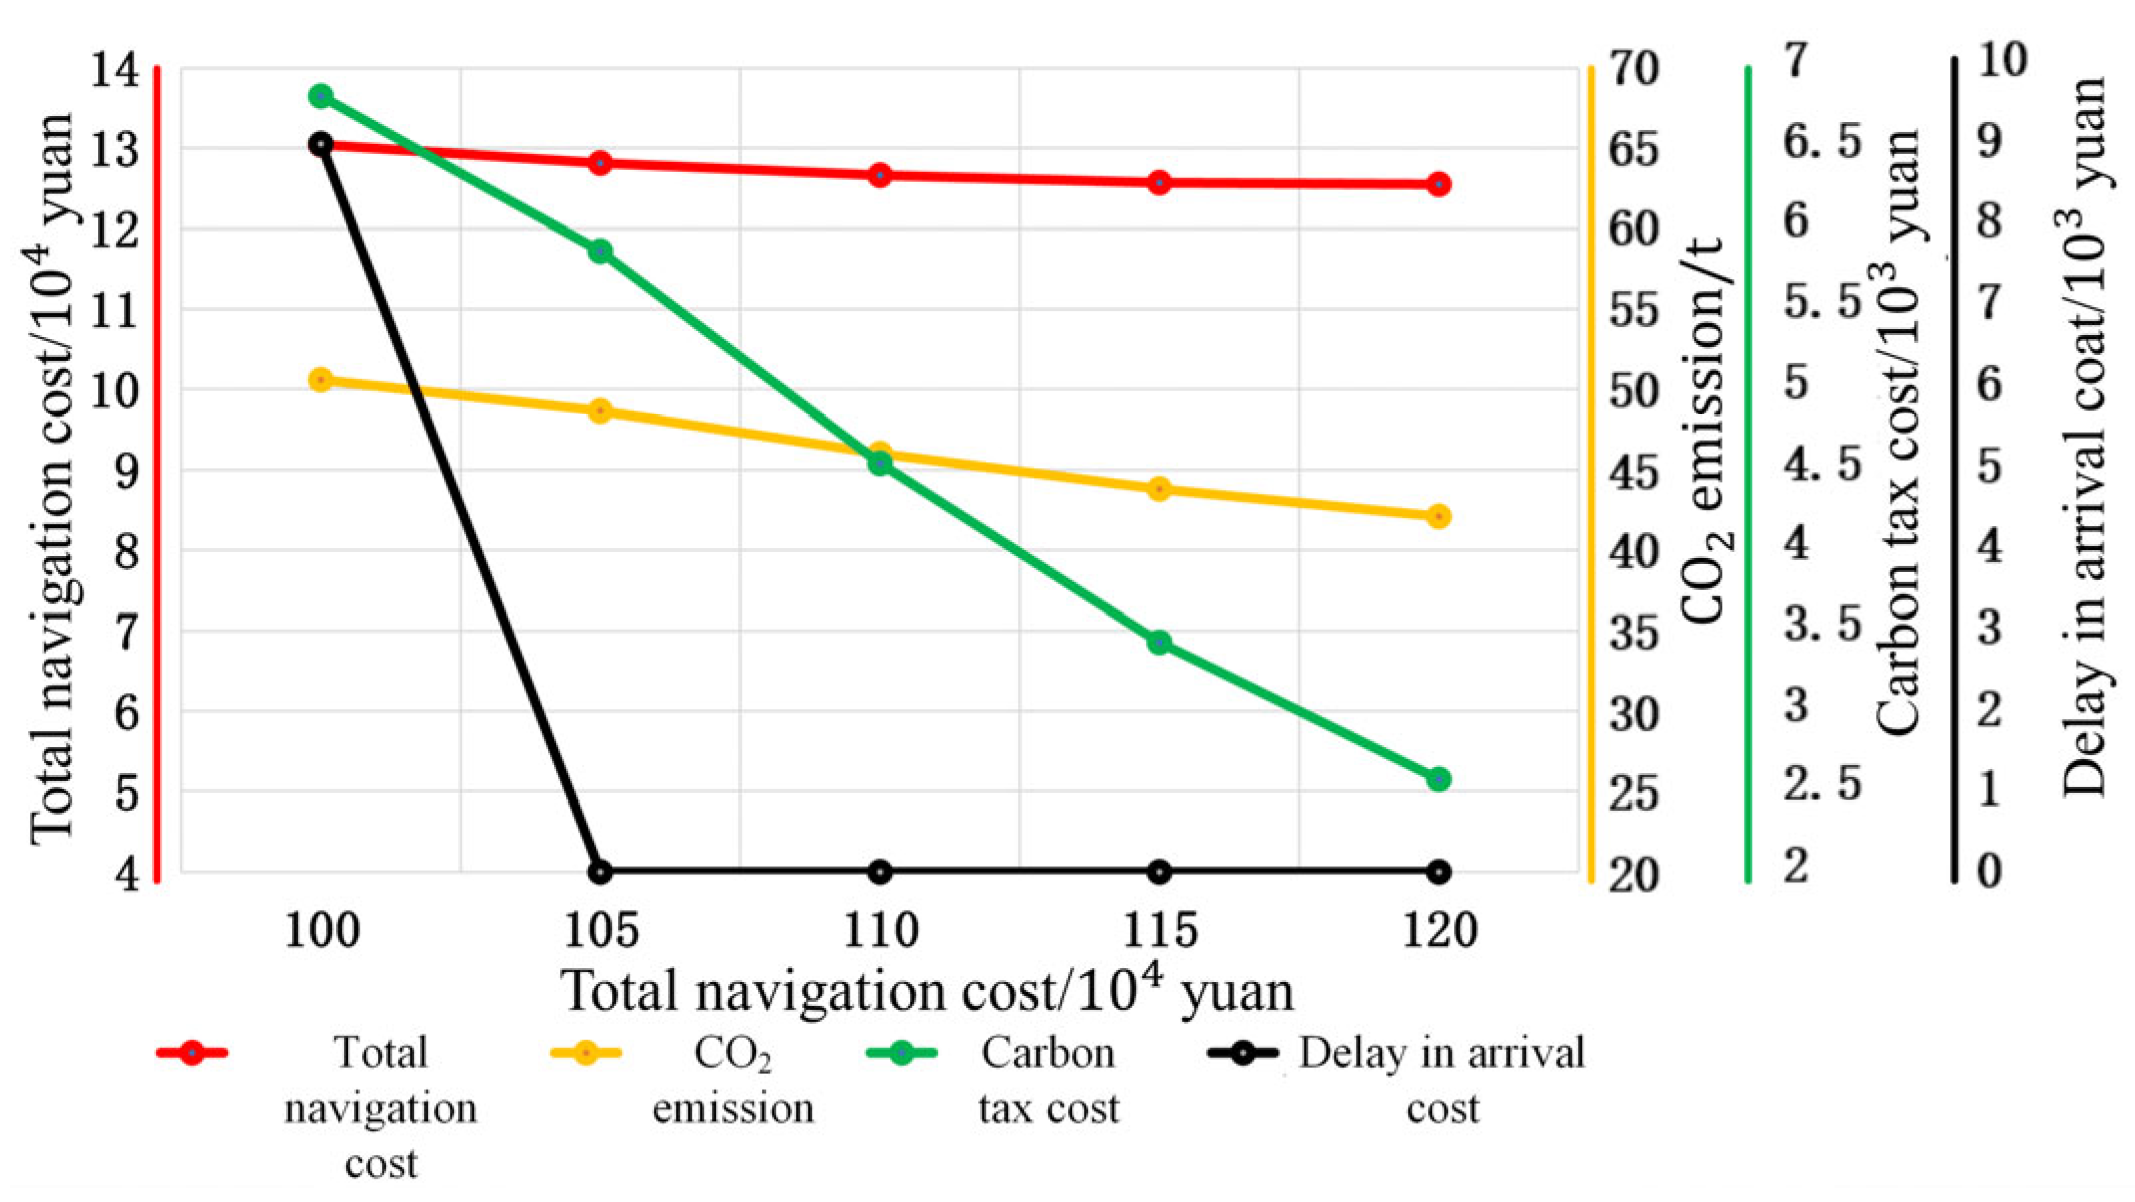
A requirement regarding the navigation time is one of the most important factors affecting a ship speed decision. In the case study, as the value of the latest arrival time was set relatively high, it did not make any constraint effect. In this section, it was set to 100–120 h, and a sensitivity analysis on the navigation time was carried out with 5 h as the change unit. Figure 13 shows the optimal speeds for different environmental categories under different latest arrival time constraints, and Figure 14 presents the total shipping costs, the CO2 emissions, the delayed arrival penalties, and the carbon tax costs with different latest arrival time constraints.
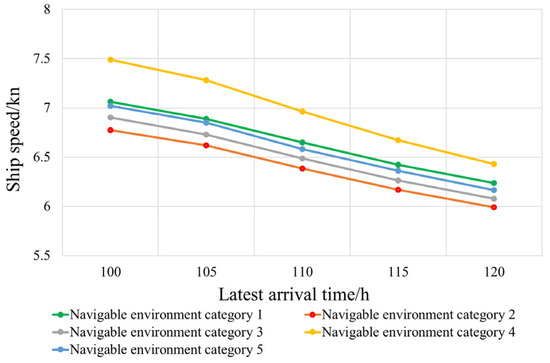
Figure 13.
Optimal speeds for different environmental categories under different latest arrival time constraints.
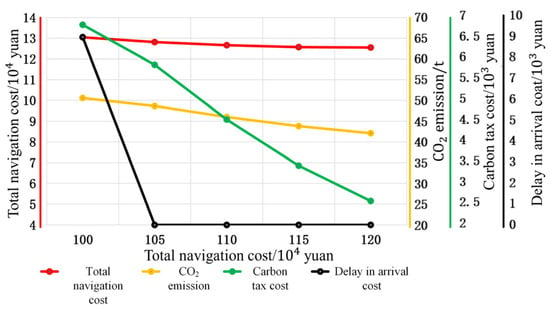
Figure 14.
Total shipping costs, CO2 emissions, carbon tax costs, and delayed arrival penalties with different latest arrival time constraints.
According to Figure 13, the optimal speed increased to some extent as the latest arrival time constraint became smaller, regardless of the navigation environment. However, the magnitude of the increase changed across different navigation environments. The increase in the shipping speed in the navigation environment category 4 was significantly larger than that in other navigation environment categories, which reflected the difference in navigation environments. As displayed in Figure 14, a smaller latest arrival time constraint resulted in increased total shipping costs, CO2 emissions, and carbon tax costs. Although a further increase in the speed in each segment would reduce the penalty for delayed arrival, both the fuel cost and carbon tax cost would increase to a larger extent. So, if there was a rigid requirement for ships to arrive at the port on time, the demurrage rate could increase appropriately. Therefore, setting a delayed arrival fee was able to effectively prevent ships from arriving at the port outside of the specified time interval.
4.2. Sensitivity Analysis on Fuel Price
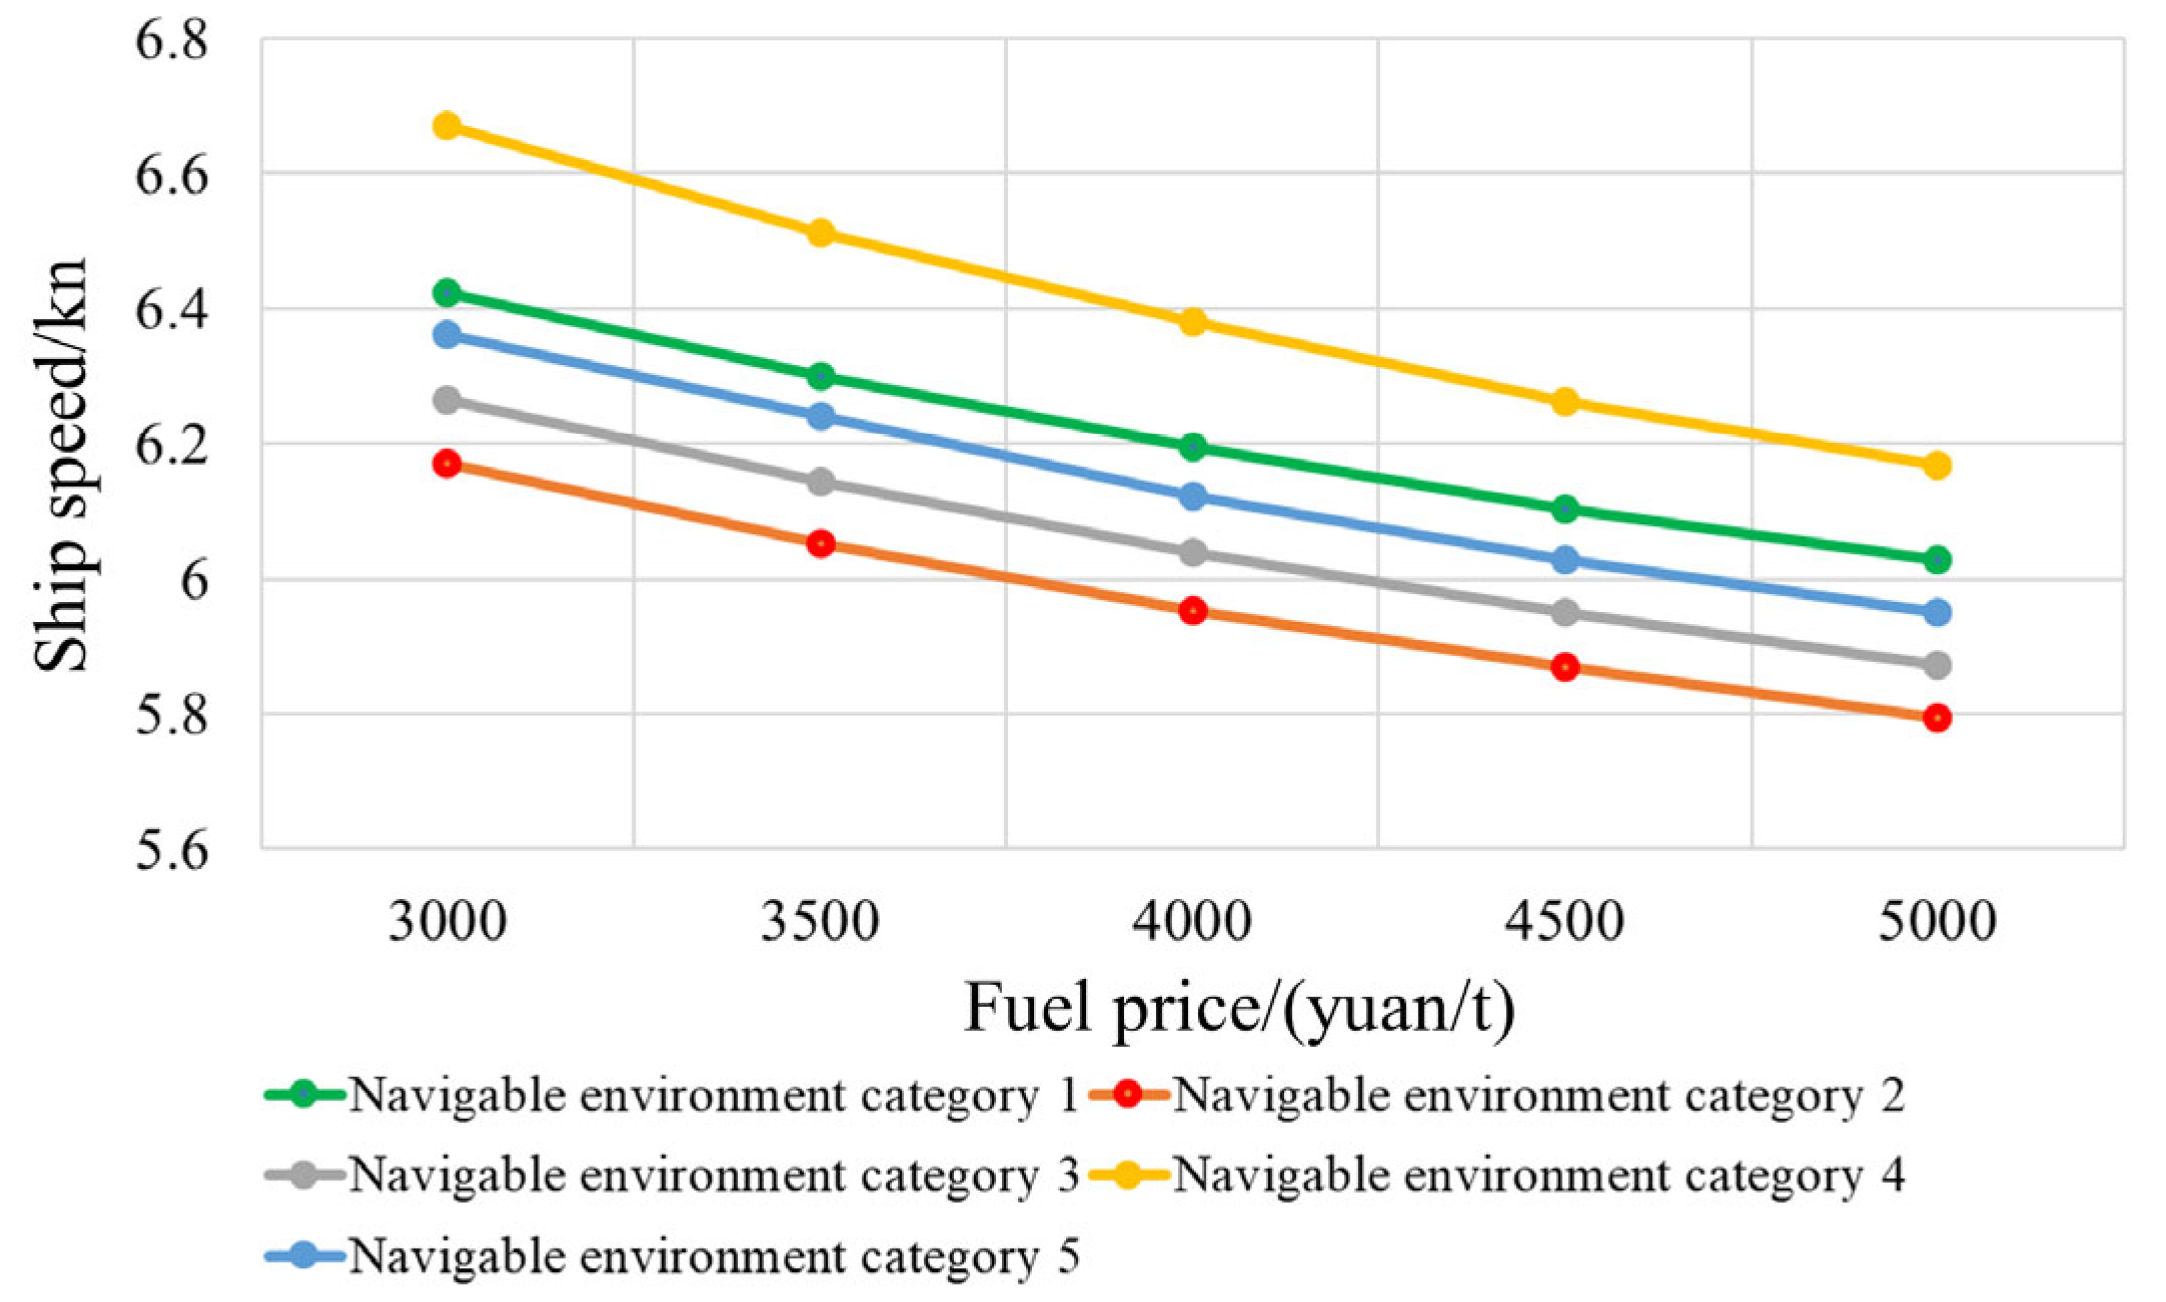
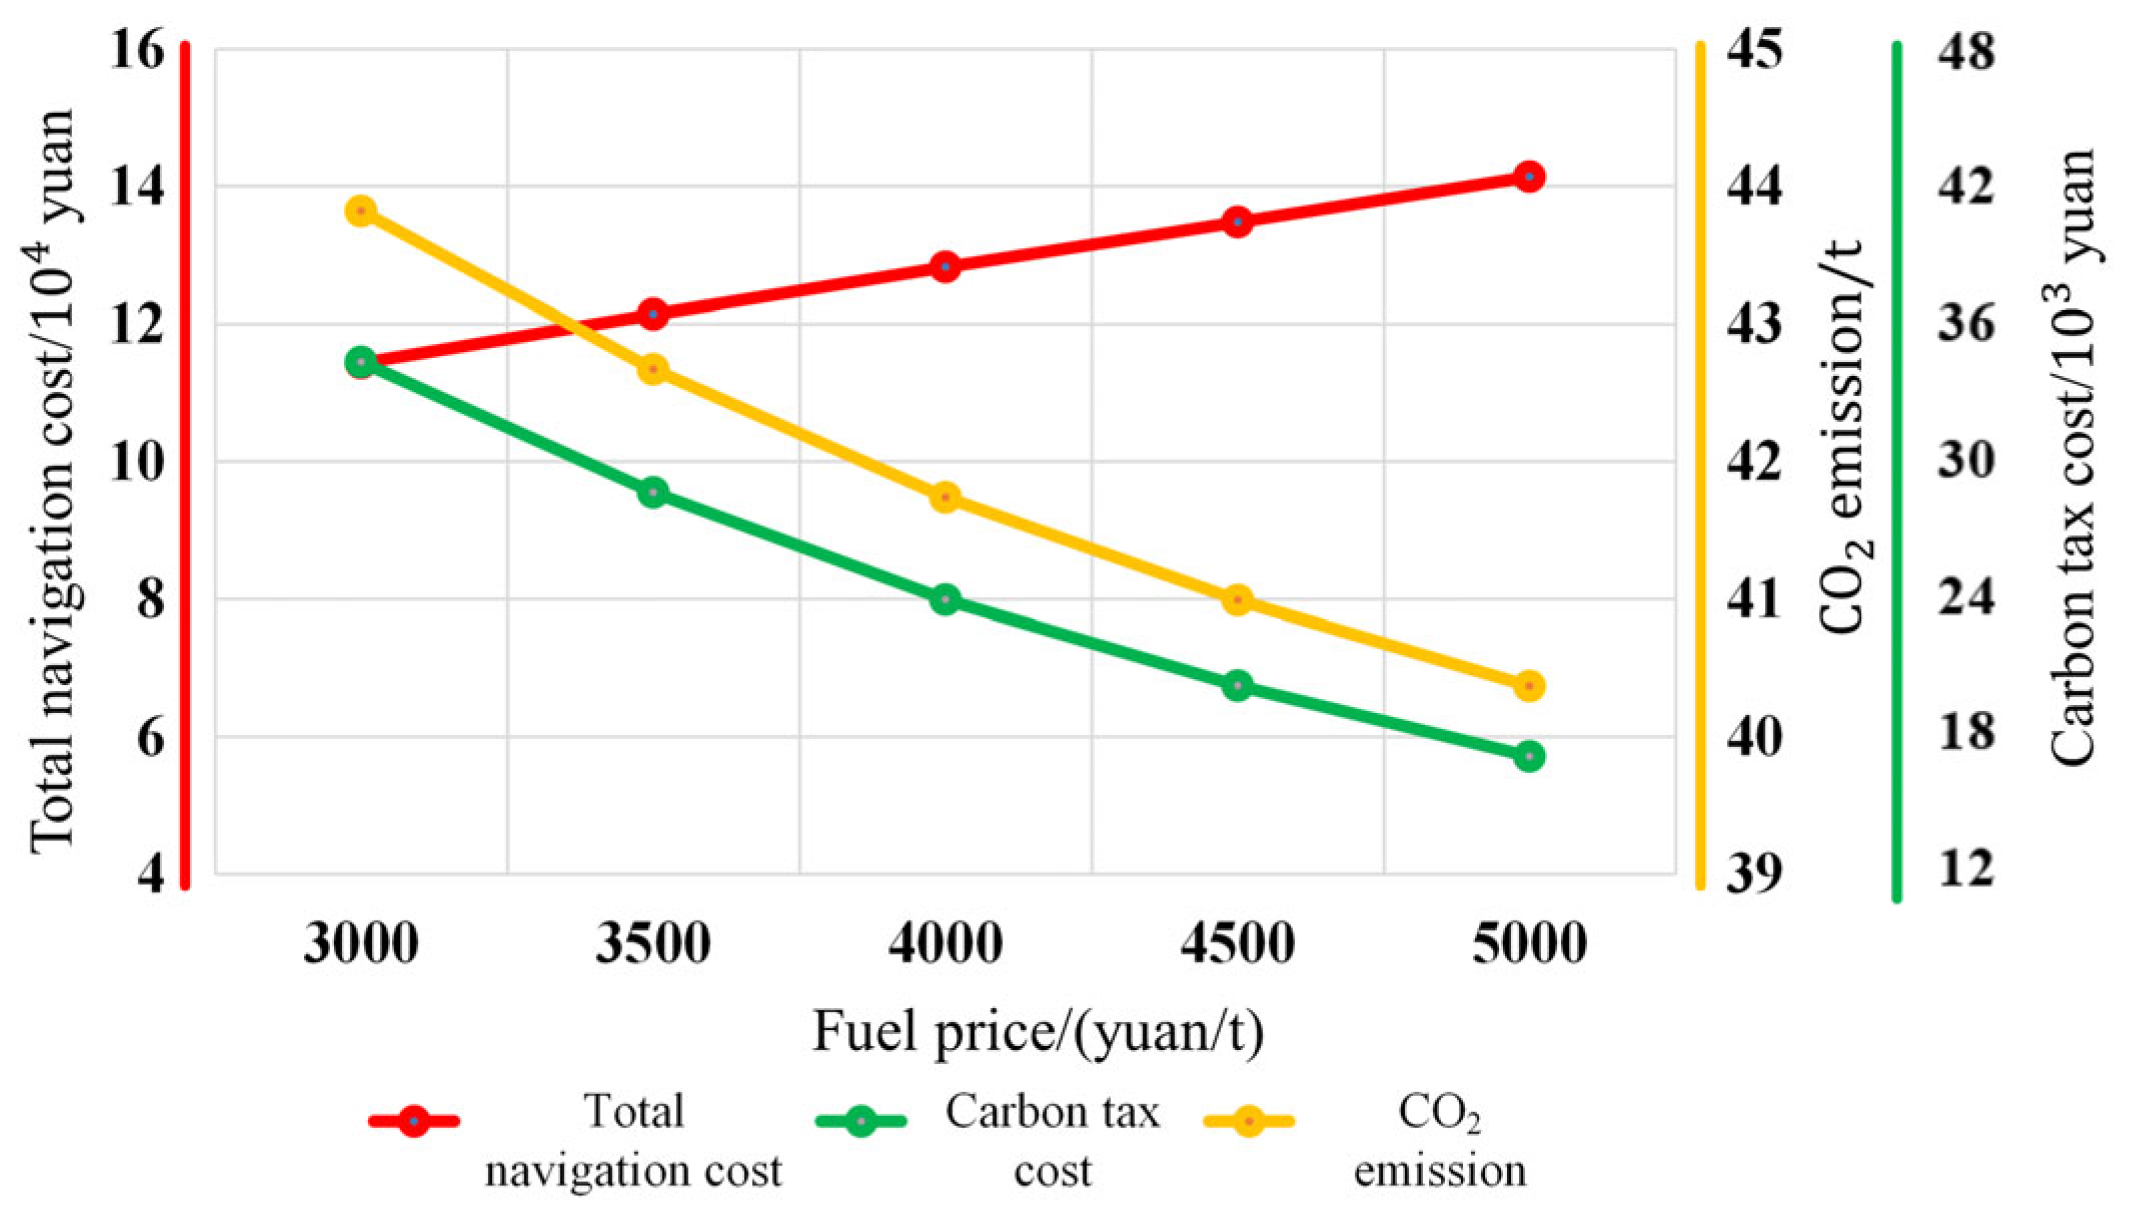
The fuel cost is one of the most important factors affecting the total shipping cost, and it depends on fuel consumption and fuel price. In this section, the fuel price was set as 3000–5000 yuan/t, and a sensitivity analysis was carried out on the fuel price with a change unit of 500 yuan/t. Figure 15 shows the optimal speeds for different environmental categories at different fuel prices; Figure 16 presents the total shipping costs, the CO2 emissions, and carbon tax costs at different fuel prices.
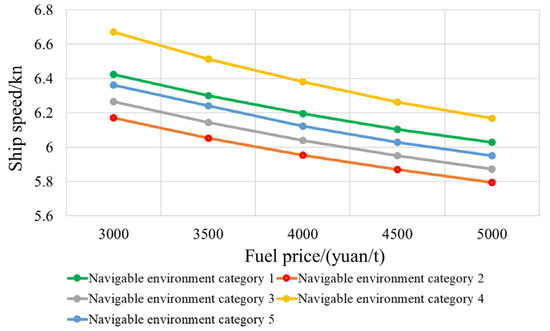
Figure 15.
Optimal speeds for different environmental categories at different fuel prices.
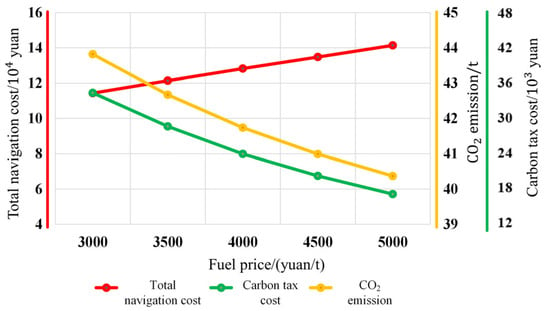
Figure 16.
Total shipping costs, carbon tax costs, and CO2 emissions at different fuel prices.
According to Figure 15 and Figure 16, with the increase in the fuel price, the optimal speed was lower for each type of navigation environment, accompanied by a higher total shipping cost, and reduced CO2 emissions and carbon tax cost. A higher fuel price would lead to an increasing ratio of fuel costs over the total shipping cost. In order to lower fuel costs, the optimized solution suggested reducing the average speed. When implementing a carbon tax policy, if the fuel price is low, governments and organizations need to increase the carbon tax rate appropriately in order to stimulate the willingness of ship-owners and shipping companies to reduce the ship’s CO2 emissions, thereby preventing the CO2 emission level from increasing. In the scenario of a relatively high fuel price, governments and organizations can lower the carbon tax rate appropriately to reduce the operating cost for ship owners and shipping companies. However, when faced with high fuel prices, ship owners and shipping companies will still need to choose to navigate at low speeds.
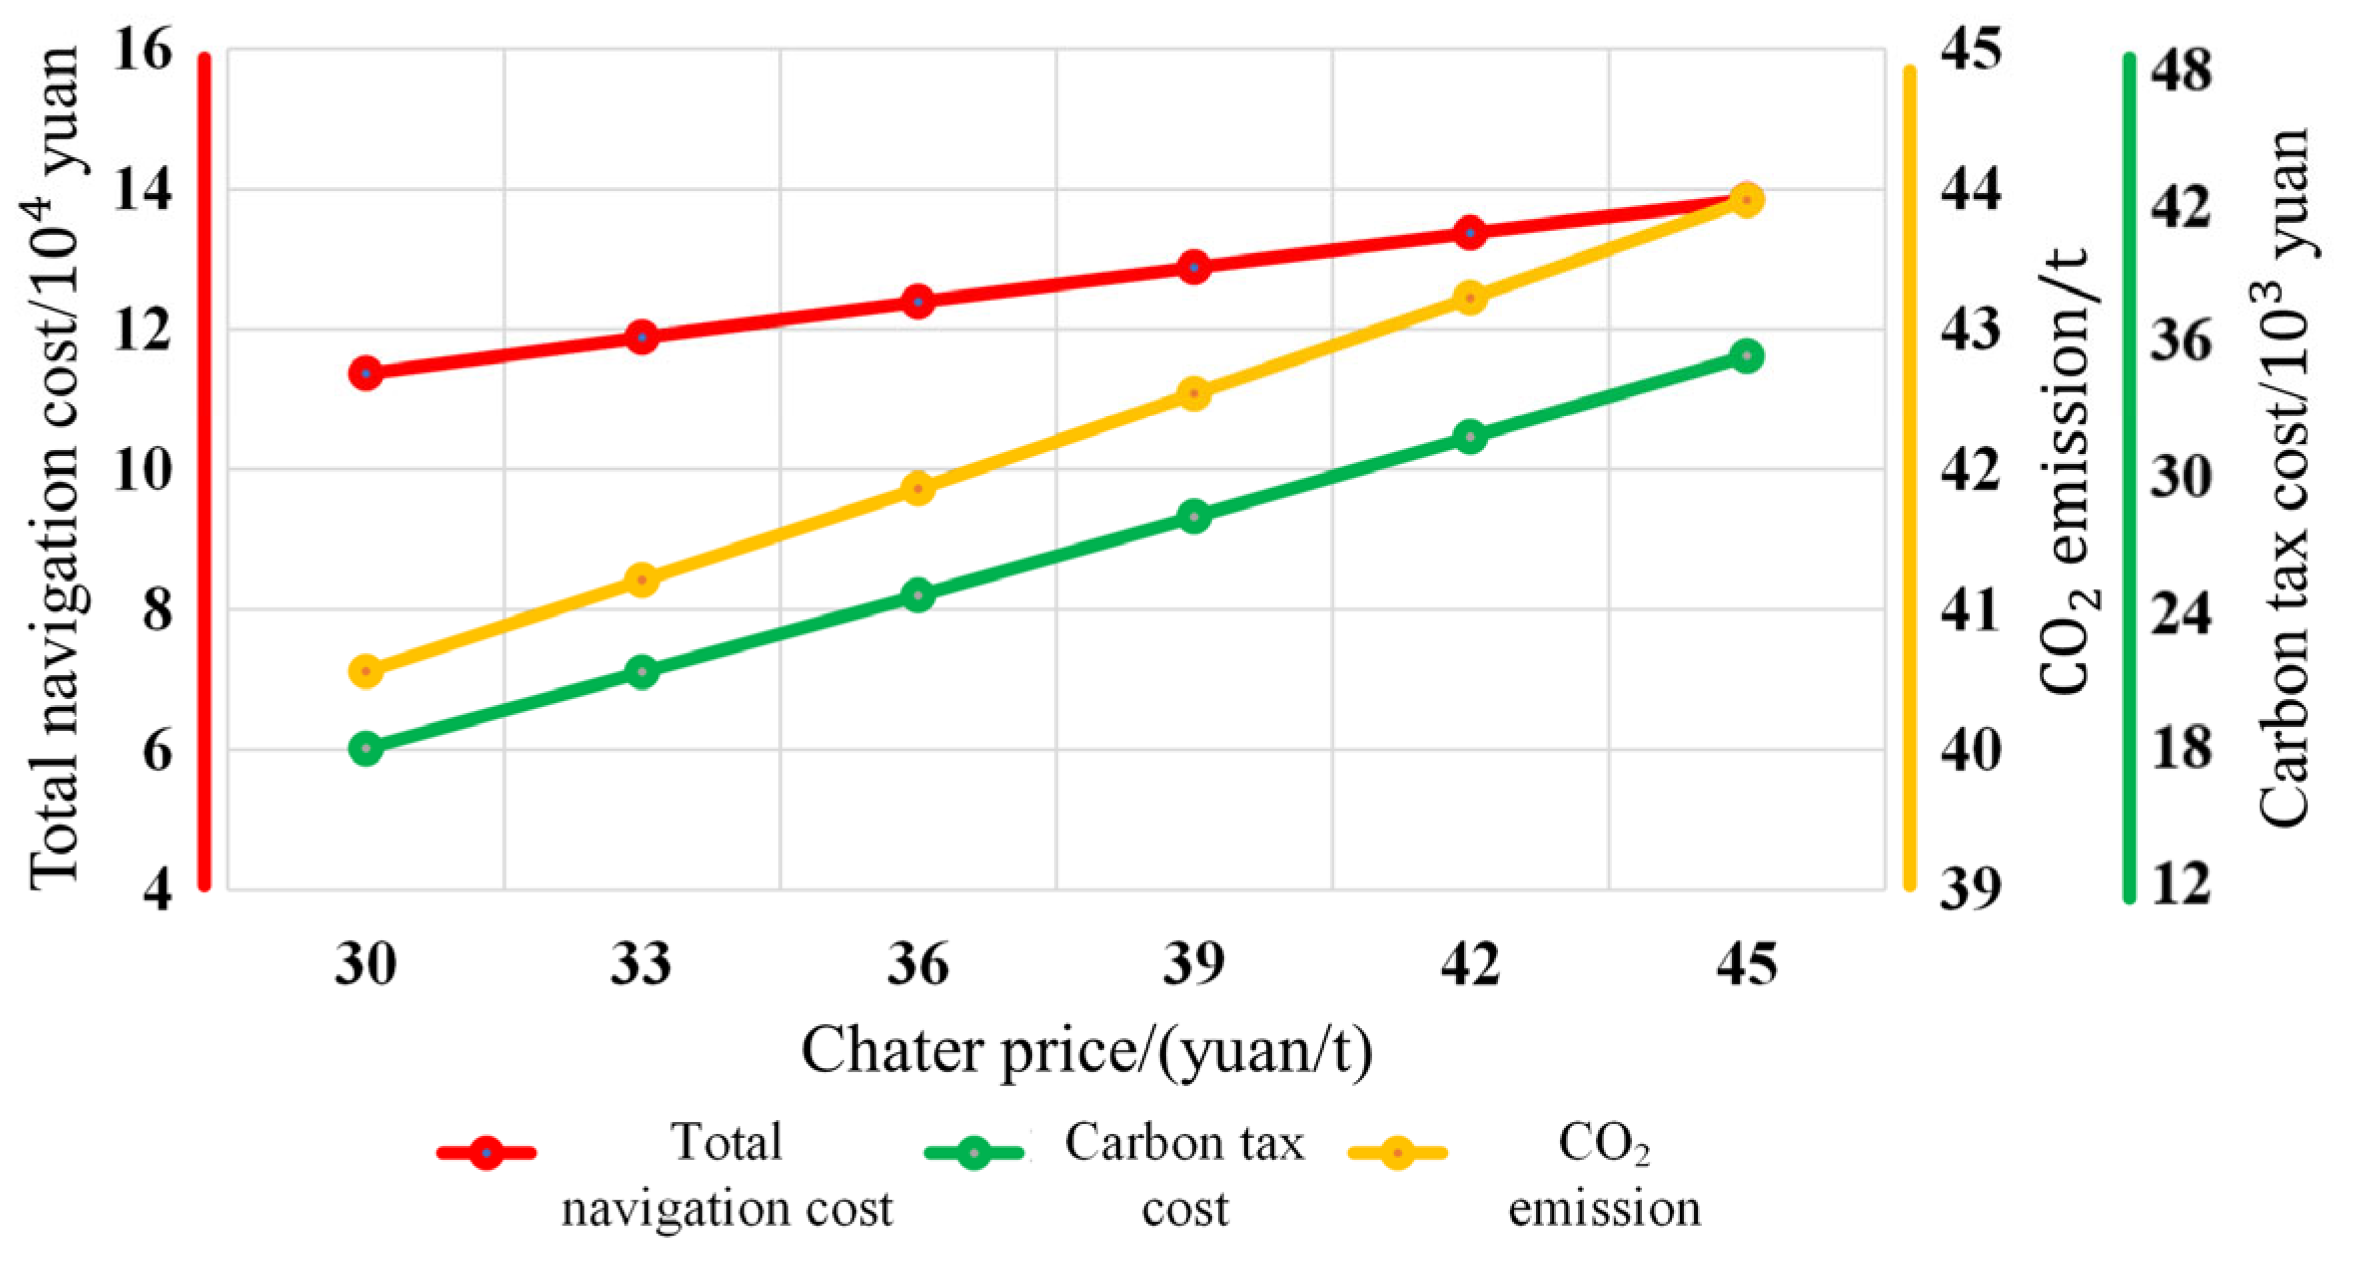
4.3. Sensitivity Analysis on the Charter Rate
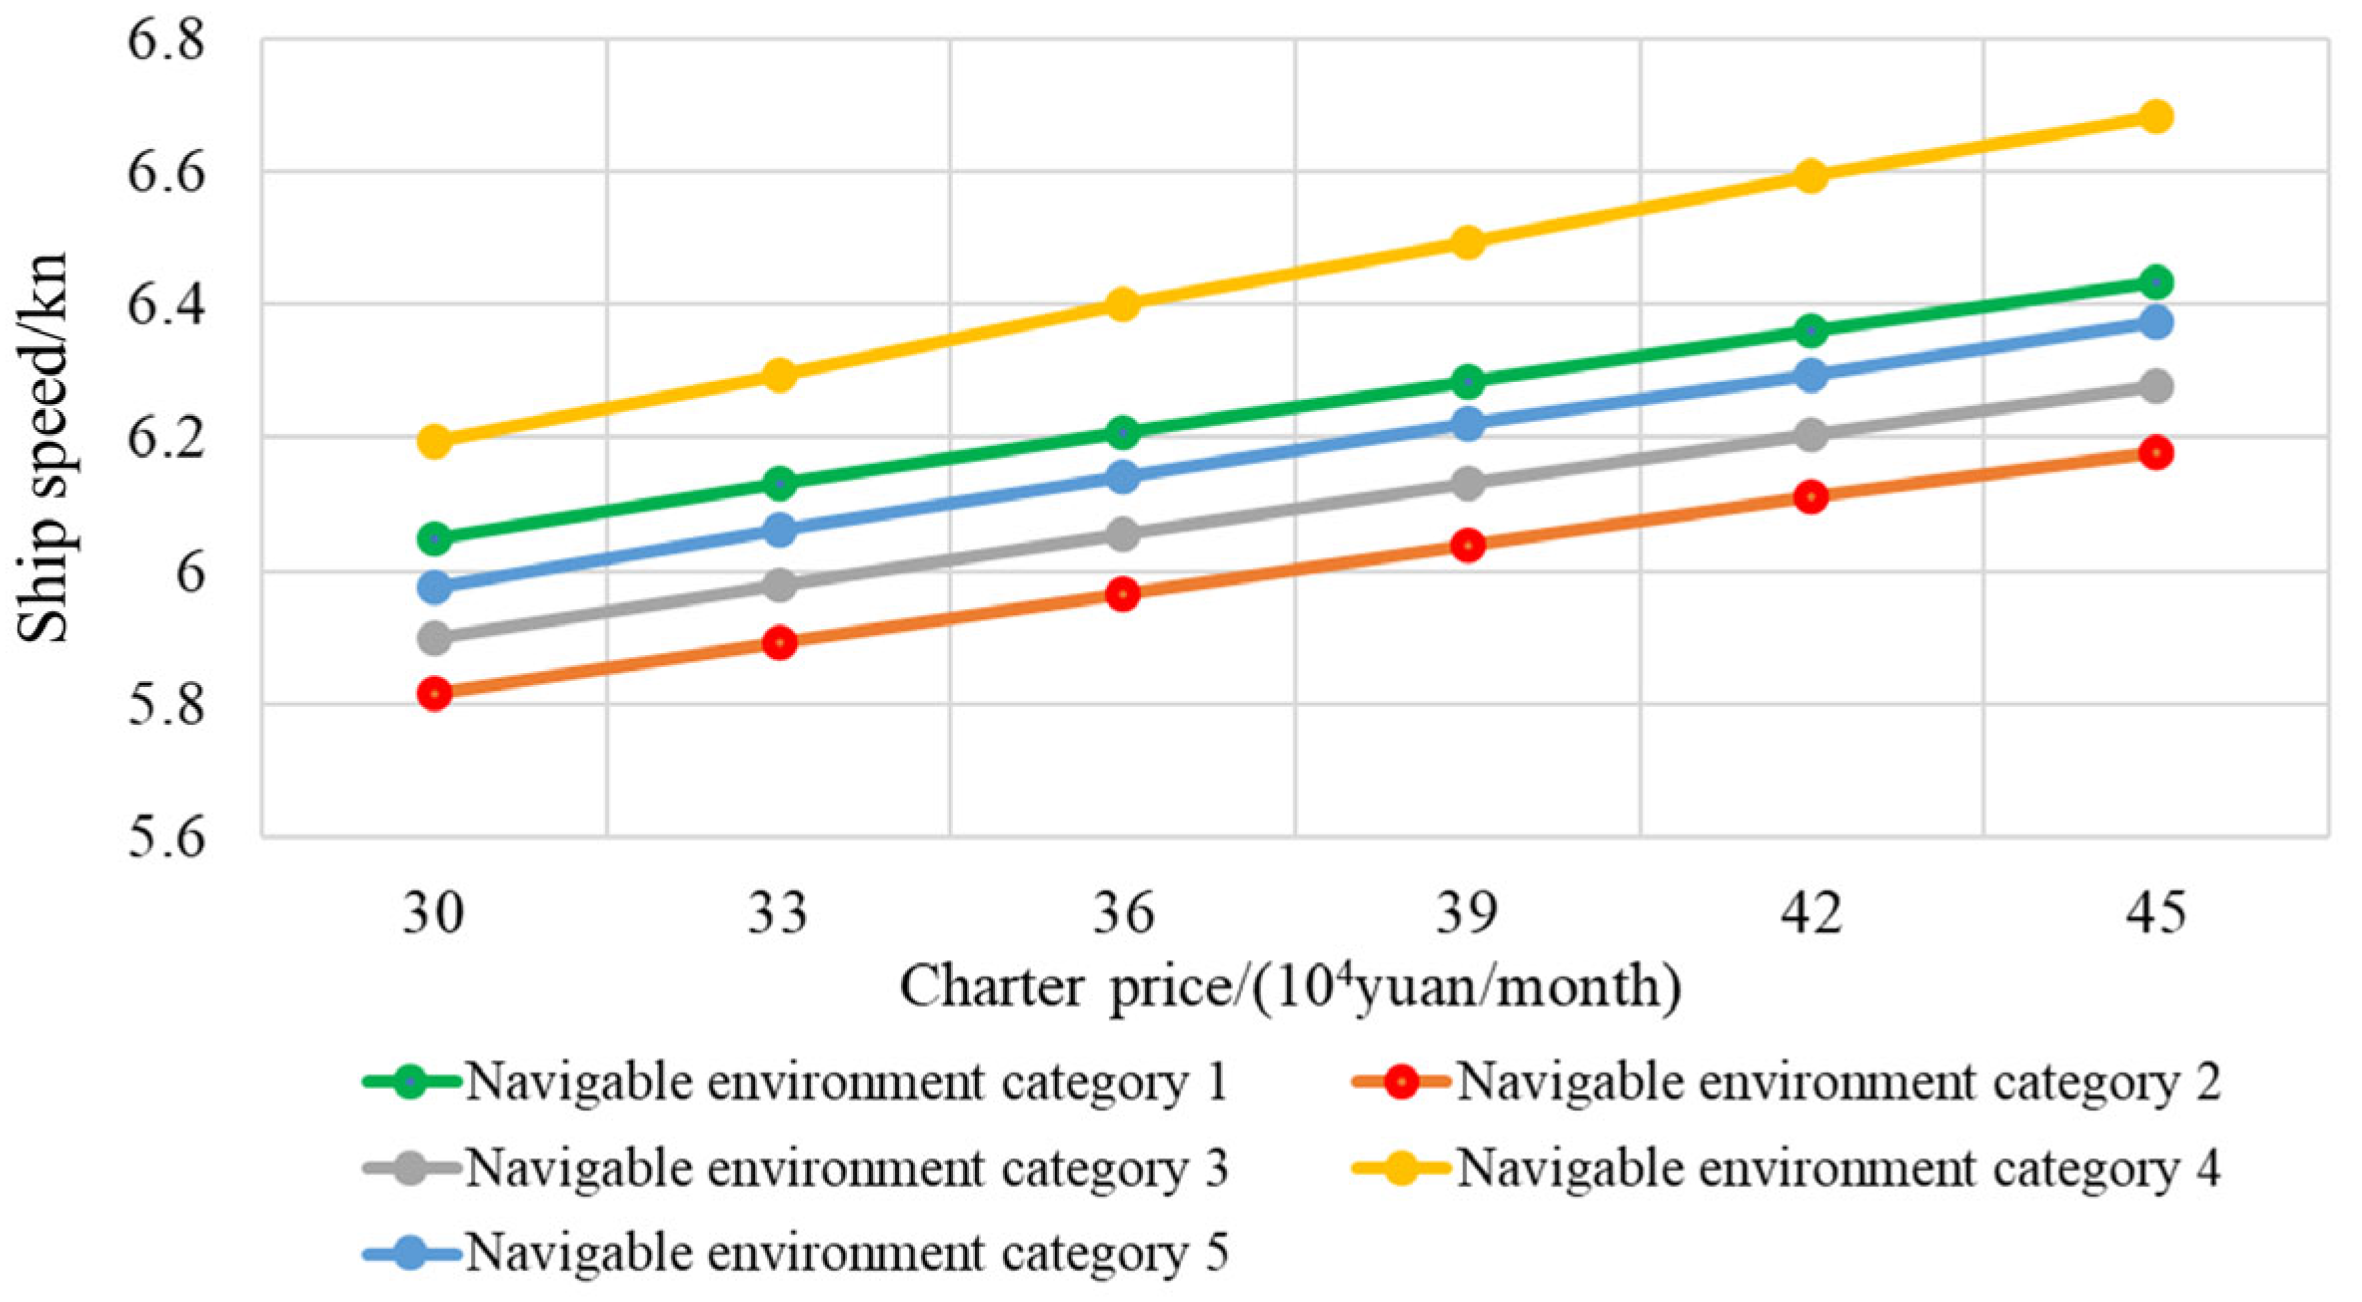
In addition to the fuel cost, the fixed operating cost is another important factor influencing the total shipping cost, and it depends on the navigation time, charter rate, and crew wages. In this section, the charter rate was set as 300,000–450,000 yuan/month, and a change unit of 30,000 yuan/month was applied for the sensitivity analysis. Figure 17 shows the optimal speeds for different environmental categories at different charter rates, and Figure 18 presents the total shipping costs, the CO2 emissions and the carbon tax costs at different charter rates.
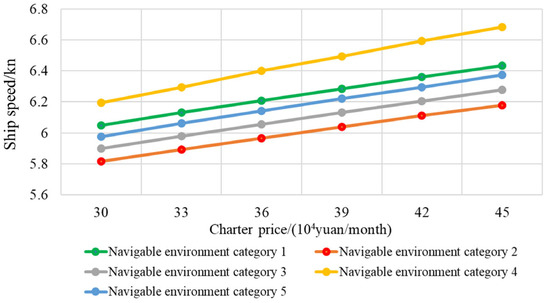
Figure 17.
Optimal speeds for different environmental categories at different charter rates.
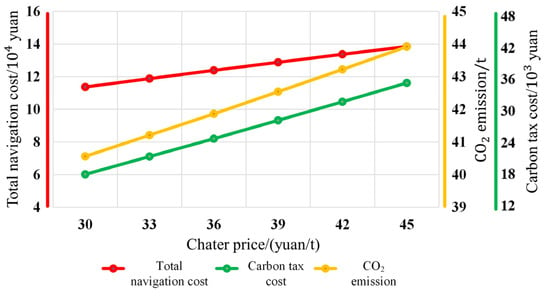
Figure 18.
Total shipping costs, carbon tax costs, and CO2 emissions at different charter rates.
As illustrated by Figure 17 and Figure 18, with the increase in the charter rate, the optimal speeds for different types of navigation environments increased, and so would the total shipping cost, CO2 emissions, and carbon tax cost. A higher charter rate resulted in a larger proportion of charter costs in the total shipping cost. In order to reduce the charter cost, the optimization scheme suggested elevating the average speed, which would lead to an increase in CO2 emissions and carbon tax costs. Therefore, when implementing a carbon tax policy, if the charter price is high, in order to prevent ships’ CO2 emissions from increasing, governments and organizations need to increase the carbon tax rate to stimulate the willingness of ship owners and shipping companies to reduce CO2 emissions, if the charter rate is low, governments and organizations can appropriately lower the carbon tax rate.
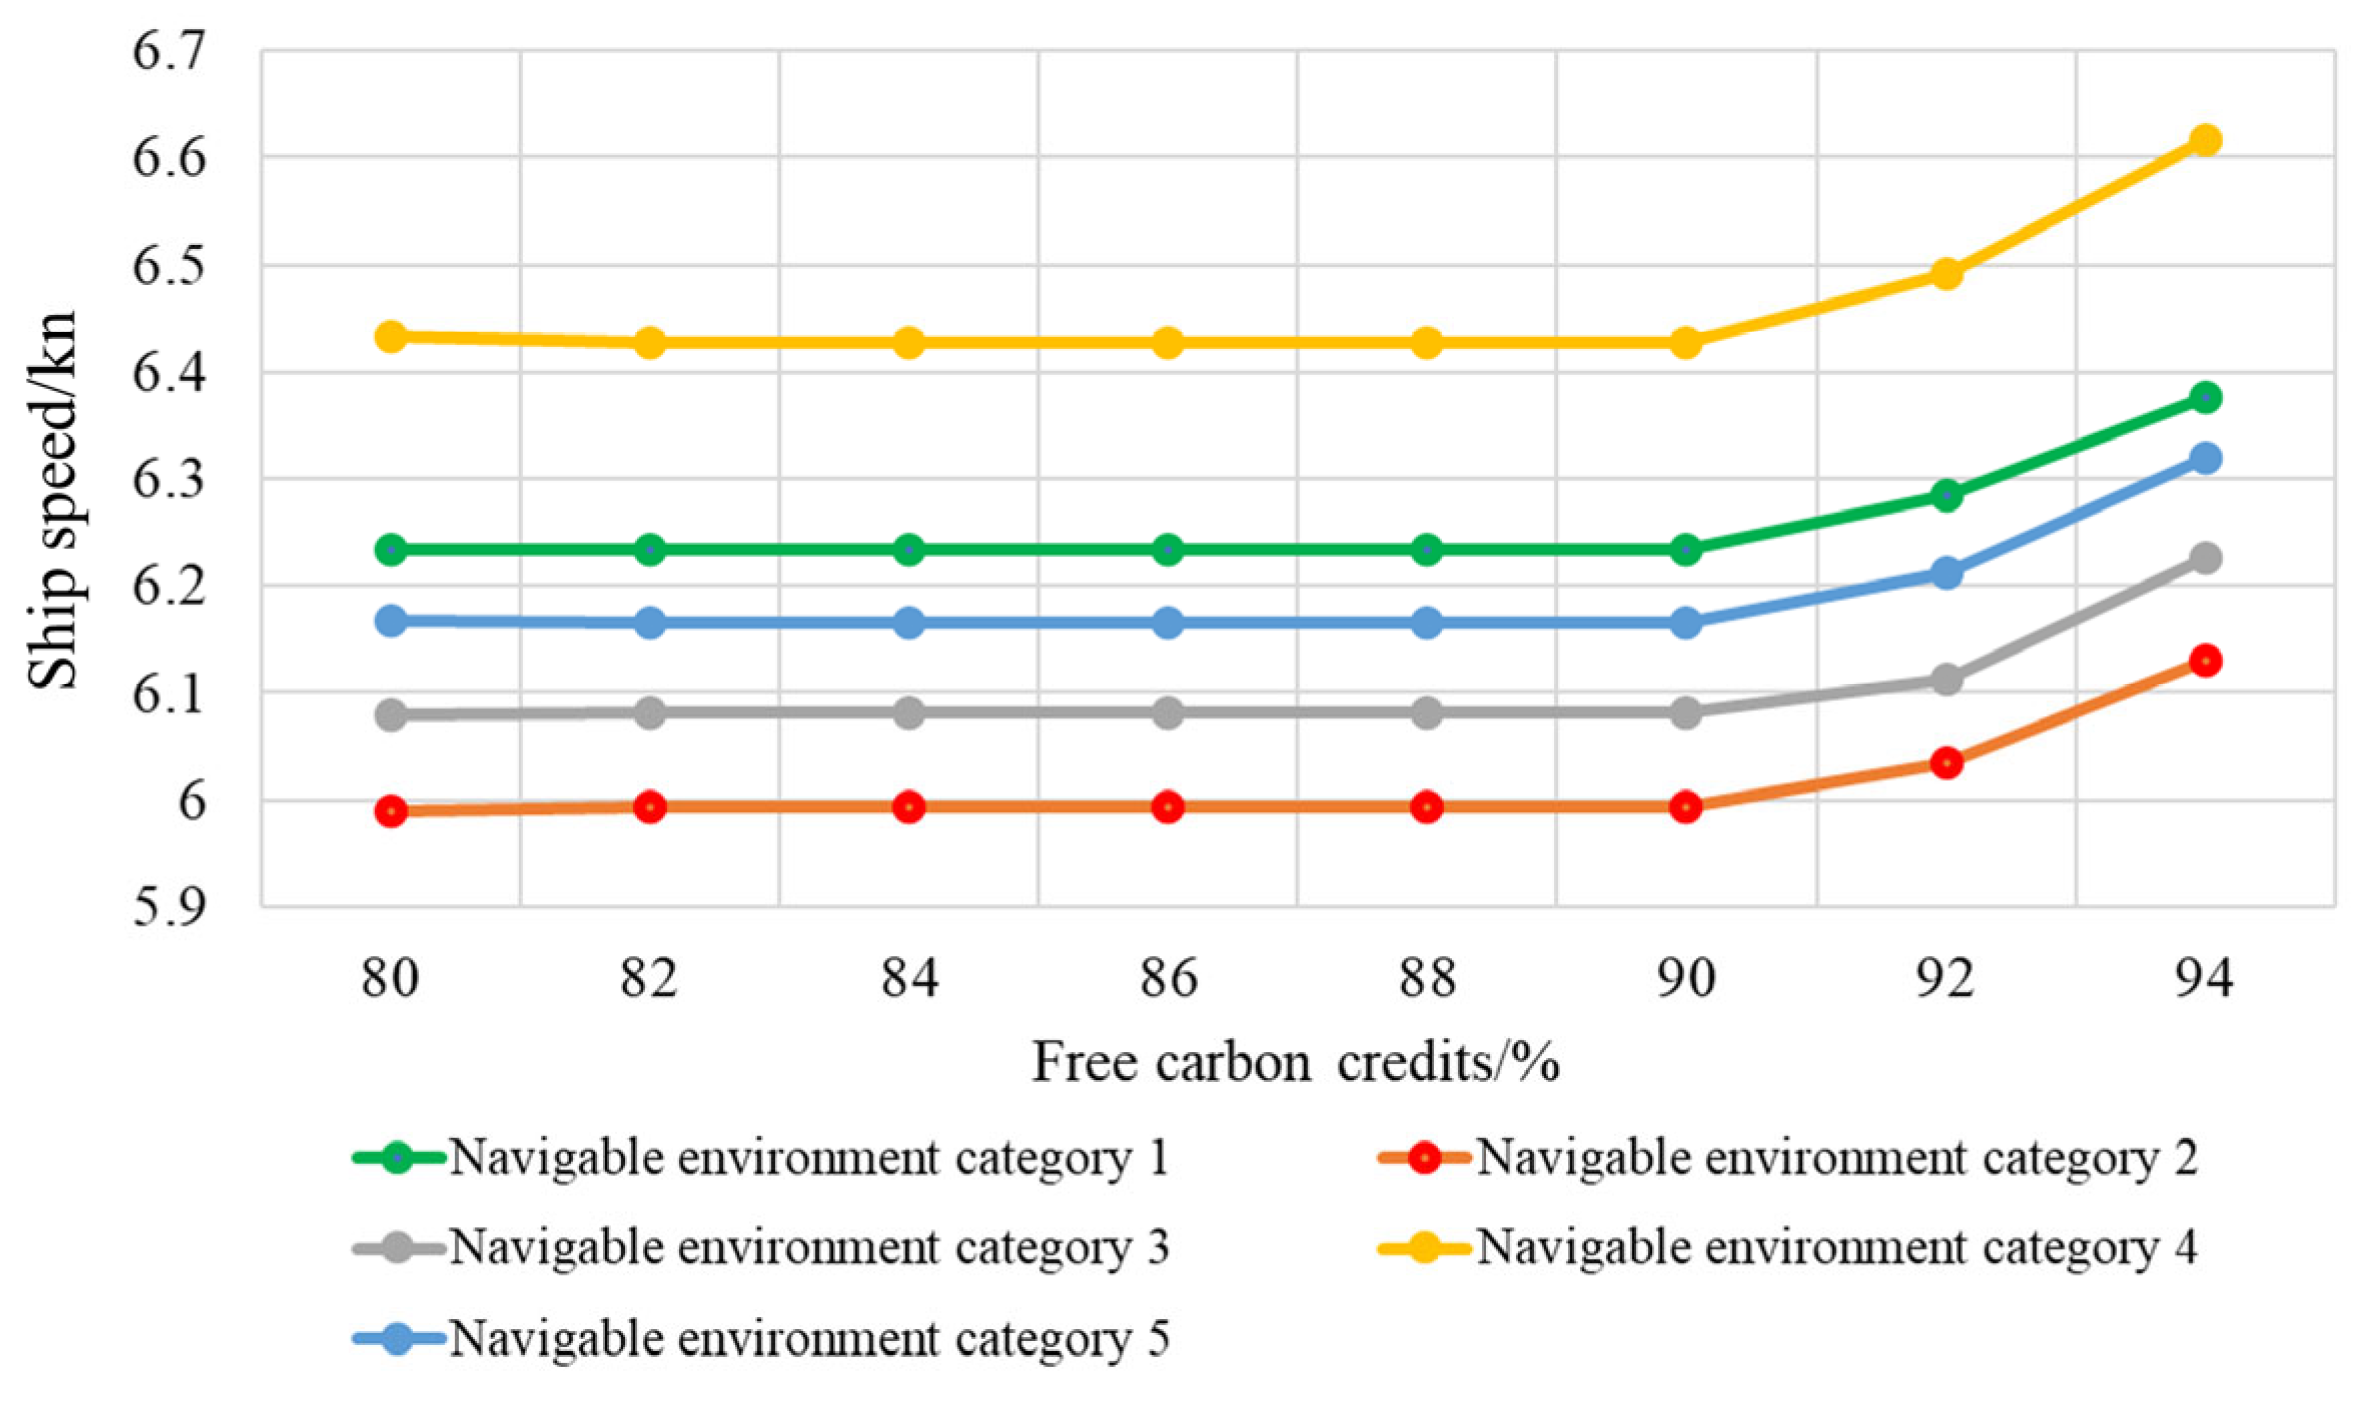
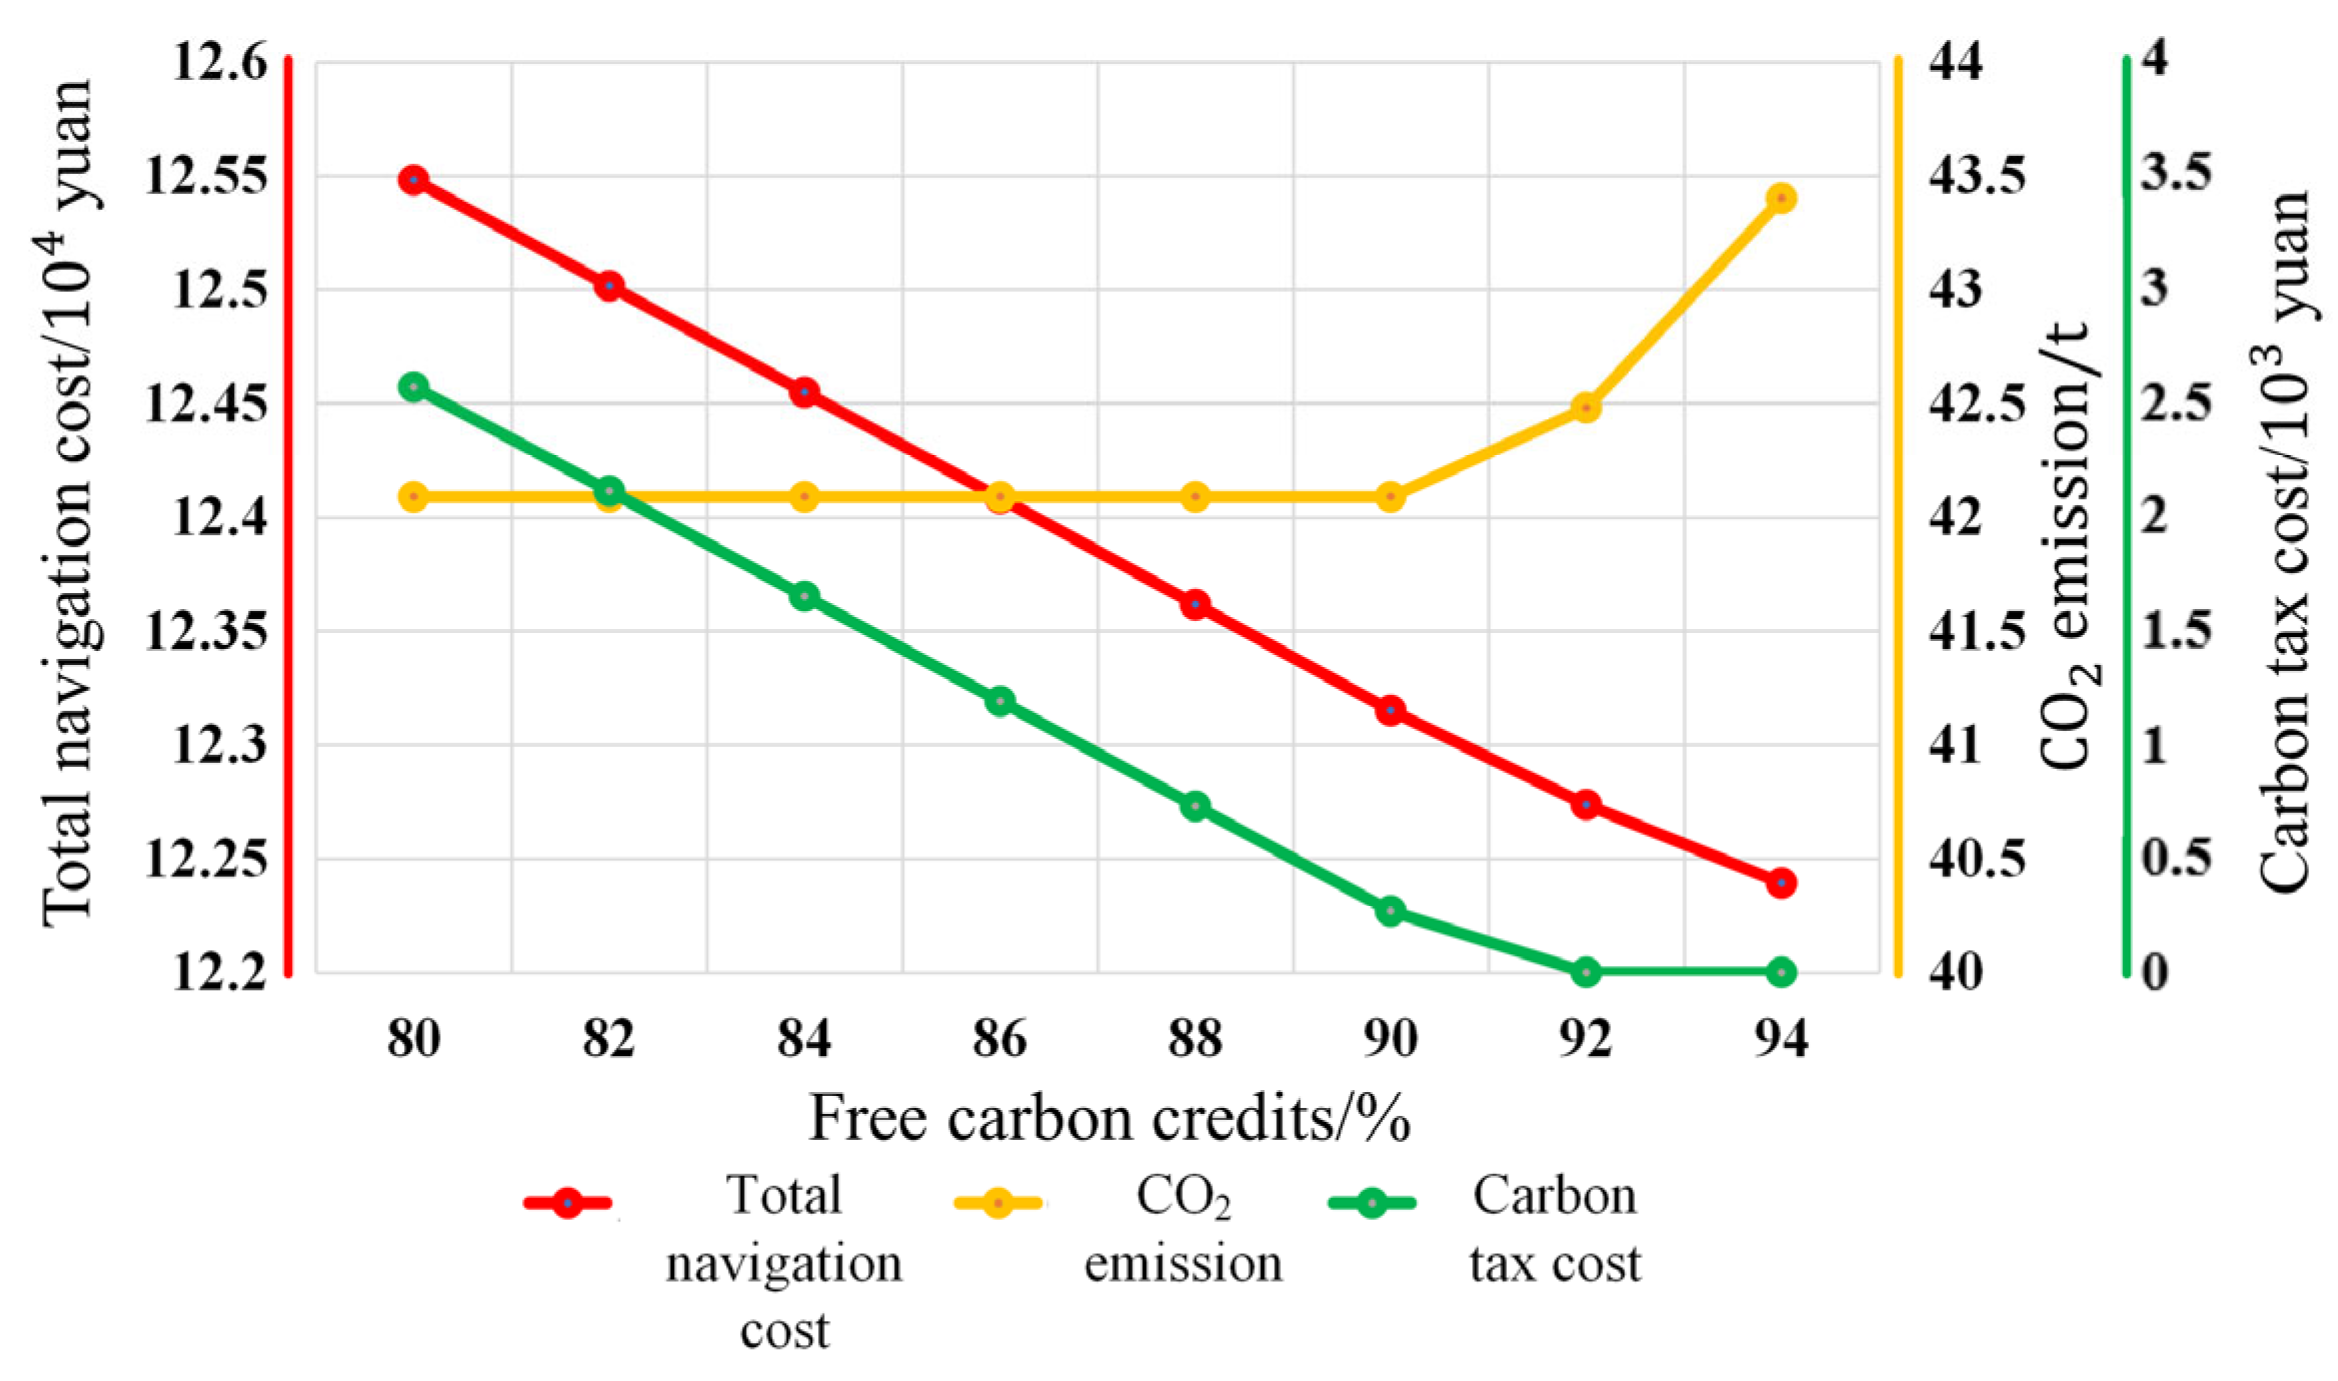
4.4. Sensitivity Analysis on Free Carbon Credits
Free carbon credits (i.e., the ship’s allowance) can be considered important factors affecting the carbon tax cost. In this section, the free carbon credits range was set as 80–94% of the average historical carbon emissions, and a change unit of 2% was applied for the sensitivity analysis. Figure 19 shows the optimal speed for each type of navigation environment under different free carbon credits, and Figure 20 presents the total shipping costs, CO2 emissions, and carbon tax costs under different free carbon credits.
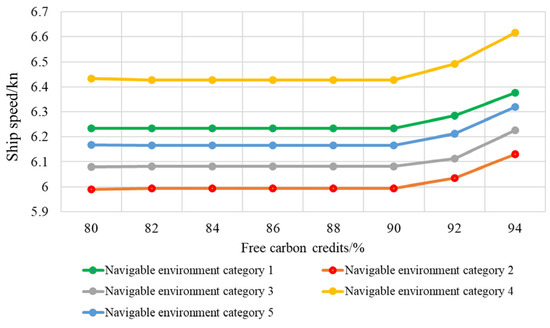
Figure 19.
Optimal speeds in different navigation environments under different free carbon credits.
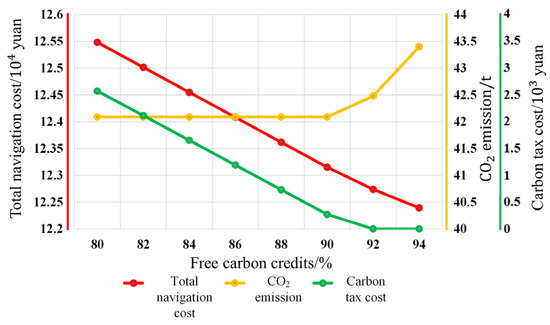
Figure 20.
Carbon tax costs under different free carbon credits.
According to Figure 19 and Figure 20, when the value of the credits was less than 90% of the average historical carbon emissions, the optimal speed and the CO2 emissions in each segment remained unchanged with the increase in free carbon credits while the carbon tax cost and total shipping cost were reduced. The decrease in total shipping costs was mainly due to the reduction in the carbon tax cost, whereas the fuel cost and fixed operating cost remained unchanged. When the value of the allowance was greater than 92% of the average historical carbon emissions, the carbon tax cost was reduced to 0. The reduction in total shipping costs was mainly caused by the reduction of the fixed operating cost. Policymakers should be cautious in setting the free carbon credits allowance when formulating a carbon tax policy. A free and low carbon credits allowance will increase the carbon tax costs to be paid by ship-owners and shipping companies, resulting in an increased total shipping cost. However, a free and high carbon credits allowance will lead to a weakened constraint of the policy on the ship’s CO2 emissions.
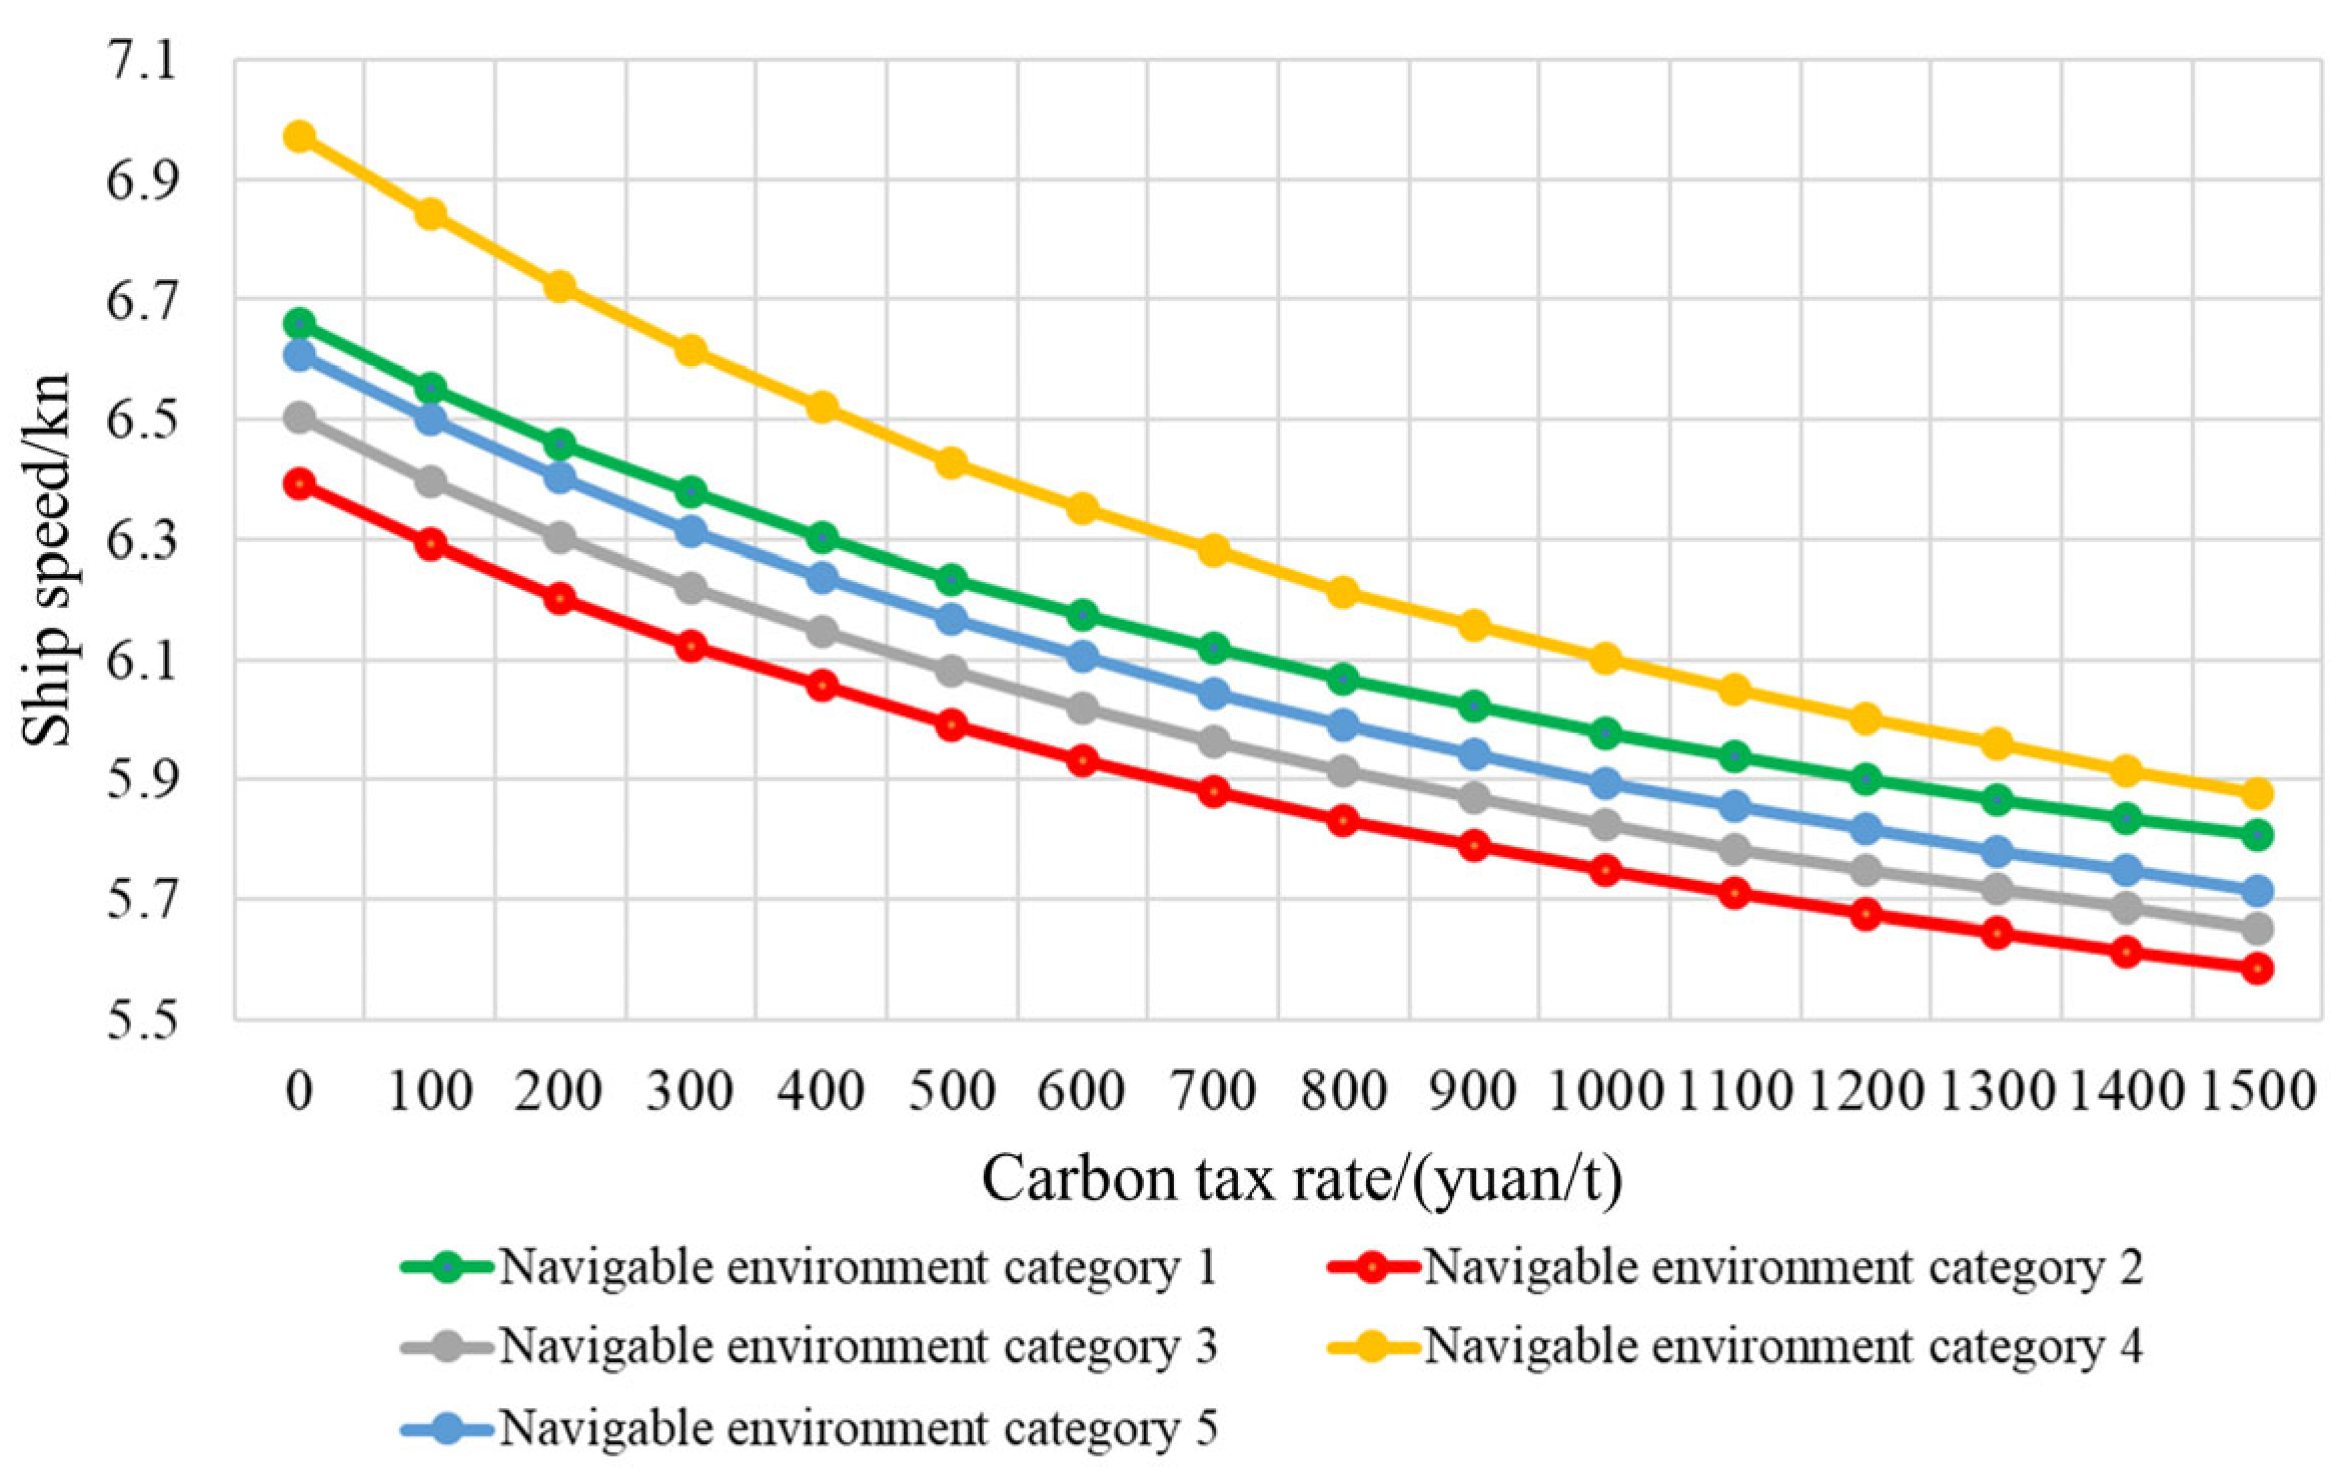
4.5. Sensitivity Analysis on the Carbon Tax Rate
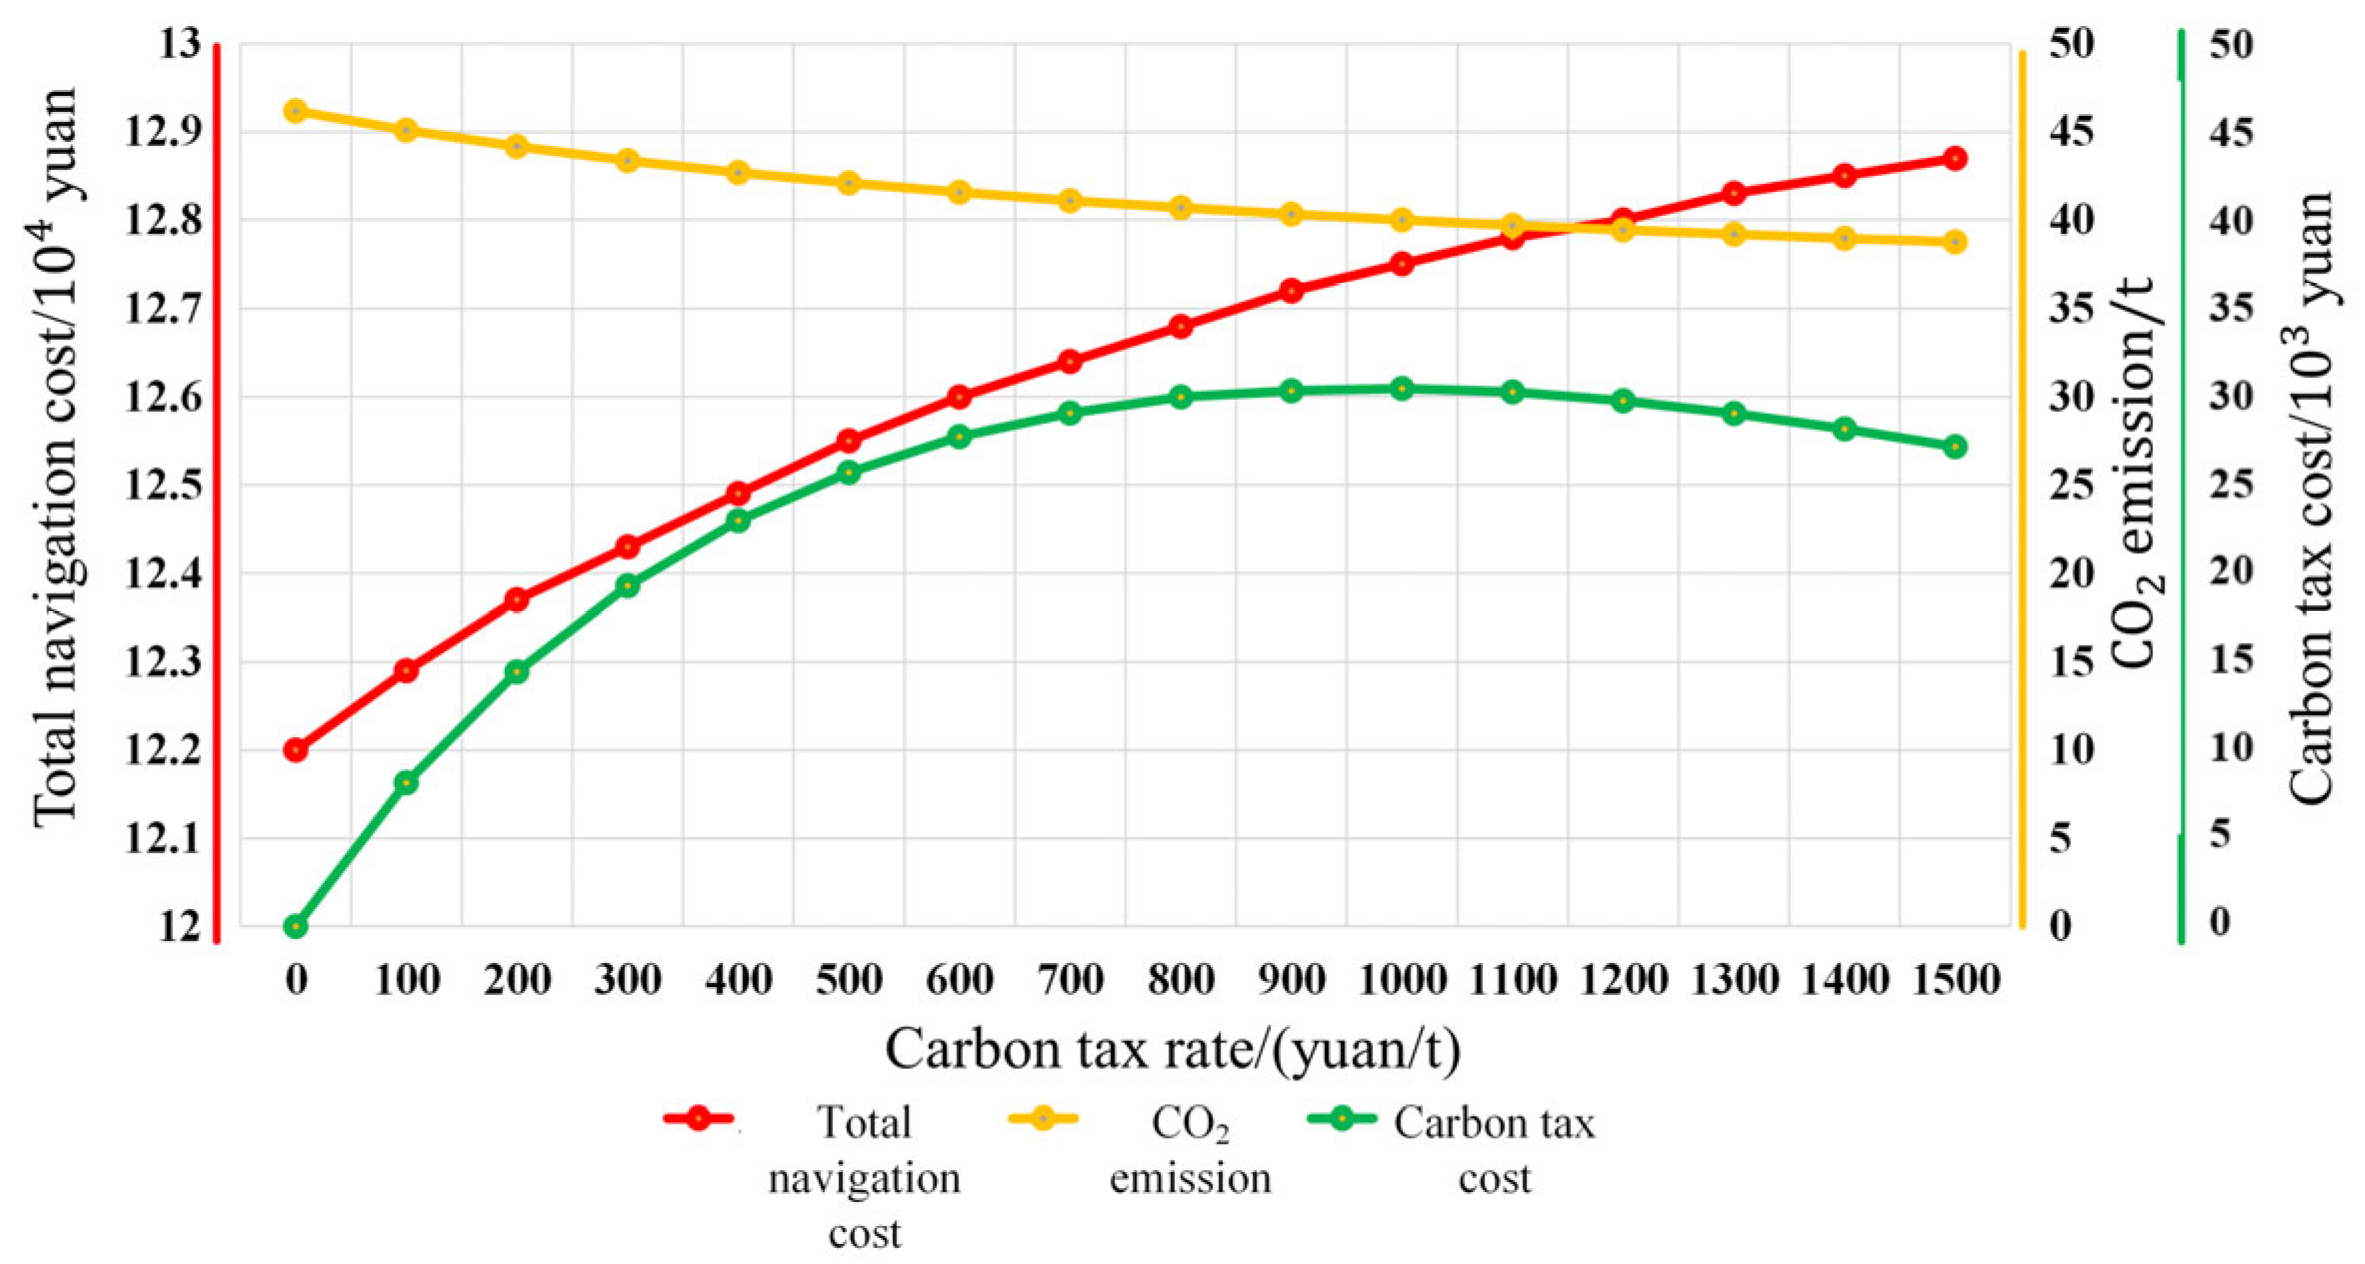
As well as free carbon credits, the carbon tax rate is another important factor affecting the carbon tax cost. In this section, the carbon tax rate was set as 0–1500 yuan/t, and a sensitivity analysis was conducted with a change unit of 100 yuan/t. Figure 21 displays the optimal speed for each navigation environment under different carbon tax rates, and Figure 22 shows the total shipping cost, the CO2 emissions, and the carbon tax cost under different carbon tax rates.
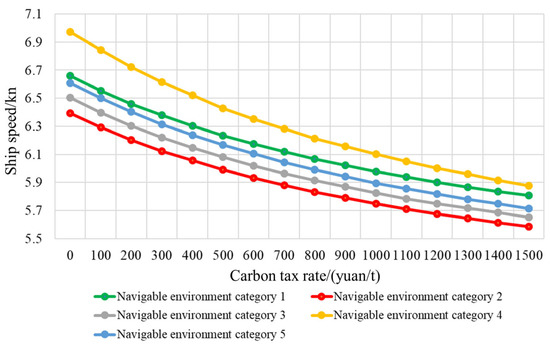
Figure 21.
Optimal speed for each navigation environment under different carbon tax rates.
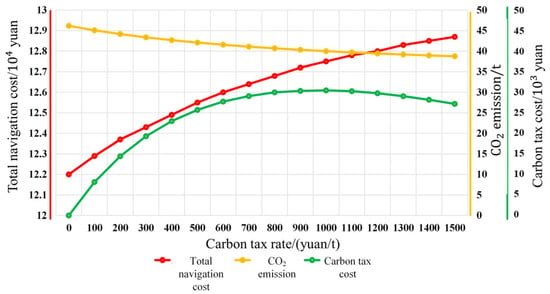
Figure 22.
Total shipping costs, CO2 emissions, and carbon tax costs under different carbon tax rates.
As suggested by Figure 21 and Figure 22, as the carbon tax rate increases, the optimal speed and CO2 emissions decreased with a gradually lowered declining speed, meanwhile, the total shipping cost increased with the rising slope becoming gradually gentler. The carbon tax cost increased with the carbon tax rate when the rate was set in the range of 0–1000 yuan/t. The carbon tax cost rose to the maximum of a carbon tax rate of 1000 yuan/t. When the carbon tax rate was in the range of 1000–1500 yuan/t, although the carbon tax rate was higher for CO2 emissions above the allowance, the optimized CO2 emissions decreased gradually, leading to a decrease in the carbon tax cost as the carbon tax rate rose. Therefore, it can be expected that as the carbon tax rate continues to rise, the carbon tax cost will drop slowly to 0, with CO2 emissions dropping to the level of the allowance.
Figure 23 compares the optimization results of CO2 emissions and total shipping costs, taking into consideration of the carbon tax cost and corresponding values in the Pareto optimal solution set. As shown in this figure, under different carbon tax rates, the optimized total shipping cost taking the carbon tax cost into consideration was higher than the total shipping cost corresponding to the solution in the Pareto optimal solution set with the same CO2 emissions. If the carbon tax cost is not included in the optimized total shipping cost, the optimization results under different carbon tax rates belong to the Pareto optimal solution set. The carbon tax rate can be similarly regarded as a weight of the carbon emission objective in the multi-objective optimization problem. Governments and organizations can assist ship-owners and shipping companies in reducing carbon emissions by applying carbon tax policies. By adjusting the carbon tax rate, they can change the priority that ship-owners and shipping companies attach to reducing carbon emissions. However, it is necessary to find some reasonable ways to return carbon tax revenue to ship-owners and shipping companies, e.g., using it to offset the normal taxes that ship-owners and shipping companies are required to pay, or subsidizing energy-saving and environment-friendly low-emission ships. Otherwise, it will only increase the operating pressure on ship owners and shipping companies. In addition, the optimization result obtained with a carbon tax rate of approximately 1300 yuan/t is close to the compromised solution of the multi-objective optimization, and this rate can provide a useful reference for policymakers when formulating carbon tax policies.
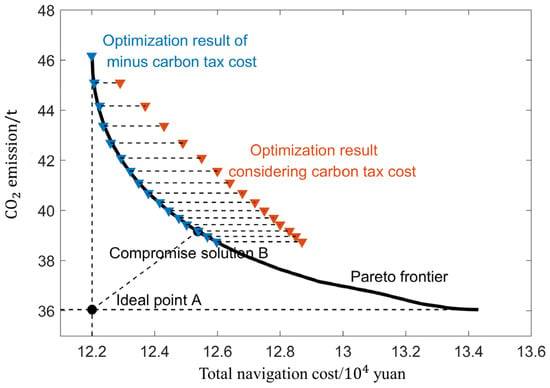
Figure 23.
Comparison of optimization results considering carbon tax rates and multi-objective optimization results.
5. Conclusions
In this paper, a 7000-ton bulk carrier operating on the Wuhan-Shanghai route has been selected as the research object, and a ship fuel consumption prediction model considering environmental factors has been established. The navigation environment has been classified based on an improved K-means clustering algorithm. Afterward, various speed optimization models with different optimization objectives, including the single-objective and the multi-objective, are established. Sensitivity analysis has been carried out with various factors. With the restriction conditions, optimizing the shipping speed under different navigable environments can lead to an increase in the optimal ship speed but can reduce the whole voyage. The sensitivity analysis on multiple factors can provide ship-owners and shipping companies with the optimal speed scheme, and also can be considered as a useful reference for policymakers to determine carbon tax rates.
In the future, in order to establish a foundation for speed optimization of new energy ships, it is important to conduct research on speed optimization, create a model for predicting their energy consumption, and take into account the conversion of their energy consumption into corresponding costs and emissions.
Author Contributions
Conceptualization, Y.Y.; Methodology, L.T.; Software, X.W.; Formal analysis, X.W. and R.Y.; Data curation, B.S.; visualization, X.W.; Project administration, Y.Y. All authors have read and agreed to the published version of the manuscript.
Funding
This work is Supported by National Key R&D Program of China (No: 2021YFB2601601).
Data Availability Statement
Not applicable.
Conflicts of Interest
The authors declare no conflict of interest.
References
- United Nations Conference on Trade and Development (UNCAD). Review of Maritime Transport 2020; United Nations Publication: New York, NY, USA; Geneva, Switzerland, 2020. [Google Scholar]
- Yang, L.; Chen, G.; Zhao, J.; Rytter, N.G.M. Ship Speed Optimization Considering Ocean Currents to Enhance Environmental Sustainability in Maritime Shipping. Sustainability 2020, 12, 3649. [Google Scholar] [CrossRef]
- Marine Environment Protection Committee. Prevention of Air Pollution from Ships (Fourth IMO GHG Study 2020-Final Report); Marine Environment Protection Committee: London, UK, 2020. [Google Scholar]
- Du, Y.; Meng, Q.; Wang, S.; Kuang, H. Two-phase optimal solutions for ship speed and trim optimization over a voyage using voyage report data. Transp. Res. Part B Methodol. 2019, 122, 88–114. [Google Scholar] [CrossRef]
- Huang, Z.; Shi, X.; Wu, J.; Hu, H.; Zhao, J. Optimal annual net income of a containership using CO2 reduction measures under a marine emissions trading scheme. Transp. Lett. 2014, 7, 24–34. [Google Scholar] [CrossRef]
- Li, X.; Sun, B.; Guo, C.; Du, W.; Li, Y. Speed optimization of a container ship on a given route considering voluntary speed loss and emissions. Appl. Ocean Res. 2019, 94, 101995. [Google Scholar] [CrossRef]
- Marine Environment Protection Committee. Report of the Marine Environment Protection Committee on Its Seventy-Second Session; Marine Environment Protection Committee: London, UK, 2018. [Google Scholar]
- Hou, Y.; Kang, K.; Liang, X. Vessel speed optimization for minimum EEOI in ice zone considering uncertainty. Ocean Eng. 2019, 188, 106240. [Google Scholar] [CrossRef]
- Yuan, Y.; Wang, K.; Yin, Q.; Yan, X. Review of Ship speed optimization. J. Traffic Transp. Eng. 2020, 20, 18–34. [Google Scholar]
- Yuan, Z.; Liu, J.; Zhang, Q.; Liu, Y.; Yuan, Y.; Li, Z. A Practical Estimation Method of Inland Ship Speed Under Complex and Changeful Navigation Environment. IEEE Access 2021, 9, 15643–15658. [Google Scholar] [CrossRef]
- Ronen, D. The effect of oil price on containership speed and fleet size. J. Oper. Res. Soc. 2011, 62, 211–216. [Google Scholar] [CrossRef]
- Faber, J.; Nelissen, D.; Hon, G.; Wang, H.; Tsimplis, M. Regulated Slow Steaming in Maritime Transport: An Assessment of Options, Costs and Benefits; Technical Report; CE Delft: Delft, The Netherlands, 2012. [Google Scholar]
- Chang, C.-C.; Chang, C.-H. Energy conservation for international dry bulk carriers via vessel speed reduction. Energy Policy 2013, 59, 710–715. [Google Scholar] [CrossRef]
- Kim, J.-G.; Kim, H.-J.; Lee, P.T.-W. Optimizing ship speed to minimize fuel consumption. Transp. Lett. 2014, 6, 109–117. [Google Scholar] [CrossRef]
- Corbett, J.J.; Wang, H.; Winebrake, J.J. The effectiveness and costs of speed reductions on emissions from international shipping. Transp. Res. Part D Transp. Environ. 2009, 14, 593–598. [Google Scholar] [CrossRef]
- Chang, C.-C.; Wang, C.-M. Evaluating the effects of speed reduce for shipping costs and CO2 emission. Transp. Res. Part D Transp. Environ. 2014, 31, 110–115. [Google Scholar] [CrossRef]
- Cepeda, M.A.; Assis, L.F.; Marujo, L.G.; Caprace, J.D. Effects of slow steaming strategies on a ship fleet. Mar. Syst. Ocean Technol. 2017, 12, 178–186. [Google Scholar] [CrossRef]
- Wang, K.; Li, J.; Yan, X.; Huang, L.; Jiang, X.; Yuan, Y.; Ma, R.; Negenborn, R.R. A novel bi-level distributed dynamic optimization method of ship fleets energy consumption. Ocean Eng. 2020, 197, 106802. [Google Scholar] [CrossRef]
- Qi, X.; Song, D.-P. Minimizing fuel emissions by optimizing vessel schedules in liner shipping with uncertain port times. Transp. Res. Part E Logist. Transp. Rev. 2012, 48, 863–880. [Google Scholar] [CrossRef]
- Wang, Y.; Meng, Q.; Kuang, H. Jointly optimizing ship sailing speed and bunker purchase in liner shipping with distribution-free stochastic bunker prices. Transp. Res. Part C Emerg. Technol. 2018, 89, 35–52. [Google Scholar] [CrossRef]
- Wang, C.; Chen, J. Strategies of refueling, sailing speed and ship deployment of containerships in the low-carbon background. Comput. Ind. Eng. 2017, 114, 142–150. [Google Scholar] [CrossRef]
- Xin, X.; Wang, X.; Tian, X.; Chen, Z.; Chen, K. Green scheduling model of shuttle tanker fleet considering carbon tax and variable speed factor. J. Clean. Prod. 2019, 234, 1134–1143. [Google Scholar] [CrossRef]
- Wang, C.; Xu, C. Sailing speed optimization in voyage chartering ship considering different carbon emissions taxation. Comput. Ind. Eng. 2015, 89, 108–115. [Google Scholar] [CrossRef]
- Kosmas, V.; Acciaro, M. Bunker levy schemes for greenhouse gas (GHG) emission reduction in international shipping. Transp. Res. Part D Transp. Environ. 2017, 57, 195–206. [Google Scholar] [CrossRef]
- Lan, X.; Zuo, X.; Tang, X. The impact of different carbon emission policies on liner shipping. J. Mar. Sci. 2020, 2020, 8956045. [Google Scholar] [CrossRef]
- Xing, Y.; Yang, H.; Ma, X.; Zhang, Y. Optimization of ship speed and fleet deployment under carbon emissions polocies for container shipping. Transport 2019, 34, 260–274. [Google Scholar] [CrossRef]
- Ding, W.; Wang, Y.; Dai, L.; Hu, H. Does a carbon tax affect the feasibility of Arctic shipping. Transp. Res. Part D Transp. Environ. 2020, 80, 102257. [Google Scholar] [CrossRef]
- Holtrop, J.; Menmen GG, J. An approximate power prediction method. Int. Shipbuild. Prog. 1982, 29, 166–170. [Google Scholar] [CrossRef]
- Hauke, J.; Kossowski, T. Comparison of values of pearson’s and spearman’s correlation coefficients on the same sets of data. Quaest. Geogr. 2011, 30, 87–93. [Google Scholar] [CrossRef]
- Fang, Z.; Zhao, B.; Zhu, R. Numerical Simulation of Ship Motion and Calculation of Added Resistance in Heading Waves. Shipbuild. China 2014, 2, 8–17. [Google Scholar]
- ITTC. Testing and extrapolation methods propulsion, performance propulsion test, propulsion committee of 23rd ITTC. In Proceedings of the International Towing Tank Conference, Venice, Italy, 8–14 September 2002. [Google Scholar]
- The European Parliament and The Council of the European Union. Directive 2008/101/EC of the European Parliament and of the Council. Off. J. Eur. Union 2008, 29, 213–231. [Google Scholar]
- Hou, J.; Sun, J.; Hofmann, H.F. Mitigating power fluctuations in electric ship propulsion with hybrid energy storage system: Design and analysis. IEEE J. Ocean Eng. 2017, 43, 93–107. [Google Scholar] [CrossRef]
- Zhao, F.; Yang, W.; Tan, W.W.; Yu, W.; Yang, J.; Chou, S.K. Power management of vessel propulsion system for thrust efficiency and emissions mitigation. Appl. Energy 2016, 161, 124–132. [Google Scholar] [CrossRef]
- Wang, K. Research on Ship Speed Optimization under Multiple Optimization Objectives. Master’s Thesis, Wuhan University of Technology, Wuhan, China, 2021. [Google Scholar]
Disclaimer/Publisher’s Note: The statements, opinions and data contained in all publications are solely those of the individual author(s) and contributor(s) and not of MDPI and/or the editor(s). MDPI and/or the editor(s) disclaim responsibility for any injury to people or property resulting from any ideas, methods, instructions or products referred to in the content. |
© 2023 by the authors. Licensee MDPI, Basel, Switzerland. This article is an open access article distributed under the terms and conditions of the Creative Commons Attribution (CC BY) license (https://creativecommons.org/licenses/by/4.0/).

