Article

Evaluation of Biological Reference Points of Two Important Fishery Resources in the East China Sea

College of Fisheries, Ocean University of China, Qingdao 266003, China
*
Author to whom correspondence should be addressed.
J. Mar. Sci. Eng. 2023, 11(1), 121; https://doi.org/10.3390/jmse11010121
Submission received: 27 November 2022 / Revised: 31 December 2022 / Accepted: 1 January 2023 / Published: 5 January 2023
(This article belongs to the Section Marine Ecology)

Abstract

:
Fishery resources play an important role in the national economy and ecological diversity in China; it is of great significance to evaluate and rationally exploit the fishery resources. Most fisheries off the coast of China are data-limited, as the complex assessment models are not suitable for its resource assessment. Therefore, data-limited models for fishery resources assessment in China are among the current research hotspots. In this paper, two new data-limited assessment models (Bayesian state–space implementation of the Schaefer production model (BSM) and Monte Carlo MSY estimation model (CMSY)) were used to evaluate the fishery resources of Scomber japonicus and Muraenesox cinereus in the East China Sea. The results showed that the estimated value of MSY of S. japonicus was 220 × 103 t to 240 × 103 t, the estimated value of F/FMSY was greater than one, and the estimated value of B/BMSY was very close to one, indicating that the fishery in the East China Sea had been overfished. The estimated value of MSY for the M. cinereus fishery in the East China Sea ranged from 140 × 103 t to 170 × 103 t. The estimated value of F/FMSY at the biological reference point was greater than one and the estimated value of B/BMSY was less than one, indicating that the fishery had been overfished and resources had declined. Both models can be used for data-limited fisheries offshore of China. To better understand the impact of uncertainty on fishery resource assessment, more research should be carried out on these two data-limited assessment models.

1. Introduction

Fishery resources are one of the important components of China’s natural resources and occupy an important position in China’s food security system. The rational exploitation and conservation of marine fishery resources are of great significance in maintaining biodiversity and promoting the sustainable development of China’s fisheries. After the reform and opening in the 1980s, China’s fishery industry experienced rapid development. However, after heavy exploitation in the recent decades, the fishery resources in China have entered a stage of decline [1]. The assessment of biological reference points of important fishery resources can provide a scientific basis for the sustainable development and utilization of fishery resources in China.
Due to the lack of historical data, the assessment of fishery resources is facing great difficulties [2]. The Fisheries Law of the People’s Republic of China puts forward the implementation of the fishing quota system, and the calculation of total allowable catch (TAC) is a necessary condition for the implementation of this output control system [3,4,5,6]. Due to the lack of sufficient data, the maximum sustainable yield (MSY) of most fishery resources in China cannot be accurately obtained, which is one of the important reasons why the TAC system is difficult to implement [5]. Therefore, it is particularly important to explore appropriate methods to estimate MSY and TAC for the Chinese fisheries.
The surplus production models (SPMs) are among the important models that evaluate fish population resources. They require simple data, which are time-series catch and fishing effort or catch per unit effort (CPUE) data. The structure of the model is simple, and the results are easy to understand; as a result, the SPMs have been widely used in fishery resource assessment [7,8]. SPMs have been further developed recently. For example, Froese et al. [8] developed a Monte Carlo MSY estimation model (CMSY) based on catch data, population resilience information, and assumptions about initial and final relative biomass. CMSY performs well in estimating population status in the short term and is particularly useful in developing countries where the time series of data is usually short [9]. The Bayesian state–space implementation of the Schaefer production model (BSM) can use time-series catch and fishing effort or CPUE to evaluate biomass, exploitation rate, and the resource status of the target population [10]. Fisheries data recorded in the China Fisheries Statistical Yearbook were used to run the above two methods for resource assessment.
Chen et al. [11] used SPM expert system (CLIMPROD) developed by the Food and Agriculture Organization of the United Nations (FAO) and evaluated the MSY of chub mackerel (Scomber japonicus) in the East China Sea. Yan et al. [12] used the length-structure VPA method to estimate the resources of the chub mackerel population in the western East China Sea and evaluated the corresponding MSY, utilization status, and exploitation potential. Li et al. [13] established an SPM based on the CPUE and average sea surface temperature (SST) of the spawning ground in February, which showed that the stock and sustainable yield of chub mackerel were controlled by the SST of the spawning ground and fishing effort. Ling et al. [14] analyzed the conger (Muraenesox cinereus) fishery resources in the East China Sea and concluded that the conger fishery still had potential for further exploitation. Zhou et al. [15] used the length-based cohort analysis (LCA) to evaluate the conger resource in the East China Sea and estimated the population biomass.
There are few studies in the literature that use CMSY and BSM to evaluate marine fishery resources in China. Ji et al. [9] used CMSY and BSM to evaluate the biological reference points of the hairtail fishery in the East China Sea, and the results showed that the hairtail fishery in the East China Sea was in a state of overfishing. Lu et al. [2] used CMSY and BSM and evaluated 16 exploited marine fish populations in China’s seas. There is no report on the resource assessment of conger fishery and chub mackerel fishery in the East China Sea by using CMSY and BSM. This study used the data-limited models of CMSY and BSM based on catch and effort data to evaluate the two important economic fisheries in the East China Sea, namely Muraenesox cinereus and Scomber japonicus, to estimate the biological reference points for their scientific management.

2. Materials and Methods

2.1. Data Source

The data of this study are mainly from the China Fisheries Statistical Yearbook [16]. The main contents of the survey in the China Fisheries Statistical Yearbook include fishery production, the fishery economy, and the income and expenditure of fishermen’s families. The annual report of the national fishery statistics uses various statistical methods such as comprehensive statistics, sample surveys, and key surveys to obtain statistical survey data. The data in this study are from the official statistical reporting system, which reported the fisheries statistics from the village level, to towns, counties, provinces, and to the central government. The China Fisheries Statistical Yearbook is published every year. The catch and fishing effort data of Muraenesox cinereus and Scomber japonicus fisheries in the East China Sea are from Zhejiang, Fujian, and Shanghai from 1979–2021. Because most of the fisheries in the East China Sea are mixed fishing operations, the fishing effort data used in this study is the total fishing effort data of the provinces around the East China Sea [17]. Catch per unit effort (CPUE) is calculated from catch divided by fishing effort. The catch (t) and CPUE (t/kW) of these two fisheries are shown in Figure 1.

2.2. Methods

CMSY is a Monte Carlo method to estimate the biological reference point MSY based on catch data, population resilience information, and population status at the beginning and end of the fishing time series. It is an improvement of the Catch-MSY method by Martell and Froese [18] with more reasonable estimations of population parameters. The model requires prior information about the environmental carrying capacity (k) and the intrinsic rate of population increase (r). The model randomly selects r–k pairs from the prior distribution of r and k, then filters the r–k pairs through the importance resampling system, and finally selects the most viable r–k pairs. CMSY can estimate the biological reference point MSY of the resource population, the rate of fishing mortality giving MSY (FMSY) and biomass giving MSY (BMSY), relative biomass size (B/BMSY), and relative resource exploitation rate (F/FMSY). CMSY can also cope with the fisheries at low resource levels (B < 0.25B0) [10].
The CMSY method needs to determine the prior distributions of r and k. In this study, the prior ranges of the intrinsic growth rate r of the two species are from Fishbase [19]. The classifications followed Froese et al. [20] (Table 1). The resilience levels of the East China Sea chub mackerel (mackerel_ECS) and conger (conger_ECS) are medium.
The prior ranges of the k value are related to the maximum catch (max (C)) and the upper and lower boundaries of the r value (rlow and rhigh). The upper and lower boundaries of the k values (klow and khigh) were calculated by using Formula (1) when the final relative biomass was low and Formula (2) when the final relative biomass was high [10].
k l o w = max ( C ) r h i g h , k h i g h = 4 max ( C ) r l o w
k l o w = 2 max ( C ) r h i g h , k h i g h = 12 max ( C ) r l o w
Froese et al. [20] recommended a classification of the relative biomass (B/k) prior values (Table 2). In this study, the initial and final relative biomasses were set according to the depletion status of the population, and the intermediate relative biomass was taken as the default value.
The BSM model has one more CPUE datapoint than the CMSY in terms of input data requirements [10]. The choice of the prior ranges of r and k in the BSM are the same as those in CMSY. The calculation of the prior range of the catchability coefficient (q) is related to CPUE and r. Formulas (3) and (4) calculate the prior range of q [10].
q l o w = 0.25 r p g m C P U E m e a n C m e a n
q h i g h = 0.5 r h i g h C P U E m e a n C m e a n
where qlow and qhigh are the lower and upper boundaries of the prior range of q, respectively; rpgm is the geometric mean of the prior range of r; rhigh is the upper limit of the prior range of r; CPUEmean is the average CPUE of the past 5 or 10 years; and Cmean is the average fishing yield of the same period. For populations with less prior biomass, the multiplier for qlow increases from 0.25 to 0.5, and the multiplier for qhigh increases from 0.5 to 1.0. For medium- and high-resilience populations, the average catch and CPUE of the past 5 years were applied; for low or very low resilience, the average catch and CPUE of the past 10 years were applied [20]. The calculation of k and q can be realized by the R code of Froese et al. [20]. The parameters calculated by CMSY and BSM can be used to estimate the biological reference points, namely MSY = rk/4, BMSY = 0.5k, FMSY = 0.5r [10].
Because the assumptions of the CMSY and BSM parameters are similar, the results of the two have strong comparability [18]. In most assessments, there is no significant difference between CMSY and BSM results, but BSM results are closer to the ‘true value’ as the model is evaluated, so BSM results may be more accurate than CMSY for management purposes. Therefore, in the process of fishery resource assessment, the results of BSM are usually used as a reference for resource assessment when the true value of the population is unknown [10].

2.3. Data Analysis

The data analysis of CMSY and BSM is implemented by the R (CMSY_2019_9f. R) code of Froese et al. [20] (download address: http://oceanrep.geomar.de/33076/ (accessed on 25 February 2022)). The settings of the two model parameters are shown in Table 3.

3. Results

Table 4 showed the results of CMSY and BSM’s evaluations of the population parameters and biological reference points of conger and chub mackerel populations in the East China Sea. The optimal r–k pairs of the two fish populations calculated by CMSY and BSM are shown in Figure 2. We studied both CMSY and BSM in this study, and we used mainly BSM results in our conclusion.

3.1. Mackerel_ECS

For the chub mackerel fishery in the East China Sea, the results of CMSY showed that the MSY was 240 × 103 t, the estimated value of F/FMSY was greater than one, and the estimated value of B/BMSY was less than one, indicating that the population was subjected to overfishing and that the population had been overfished (Table 4).
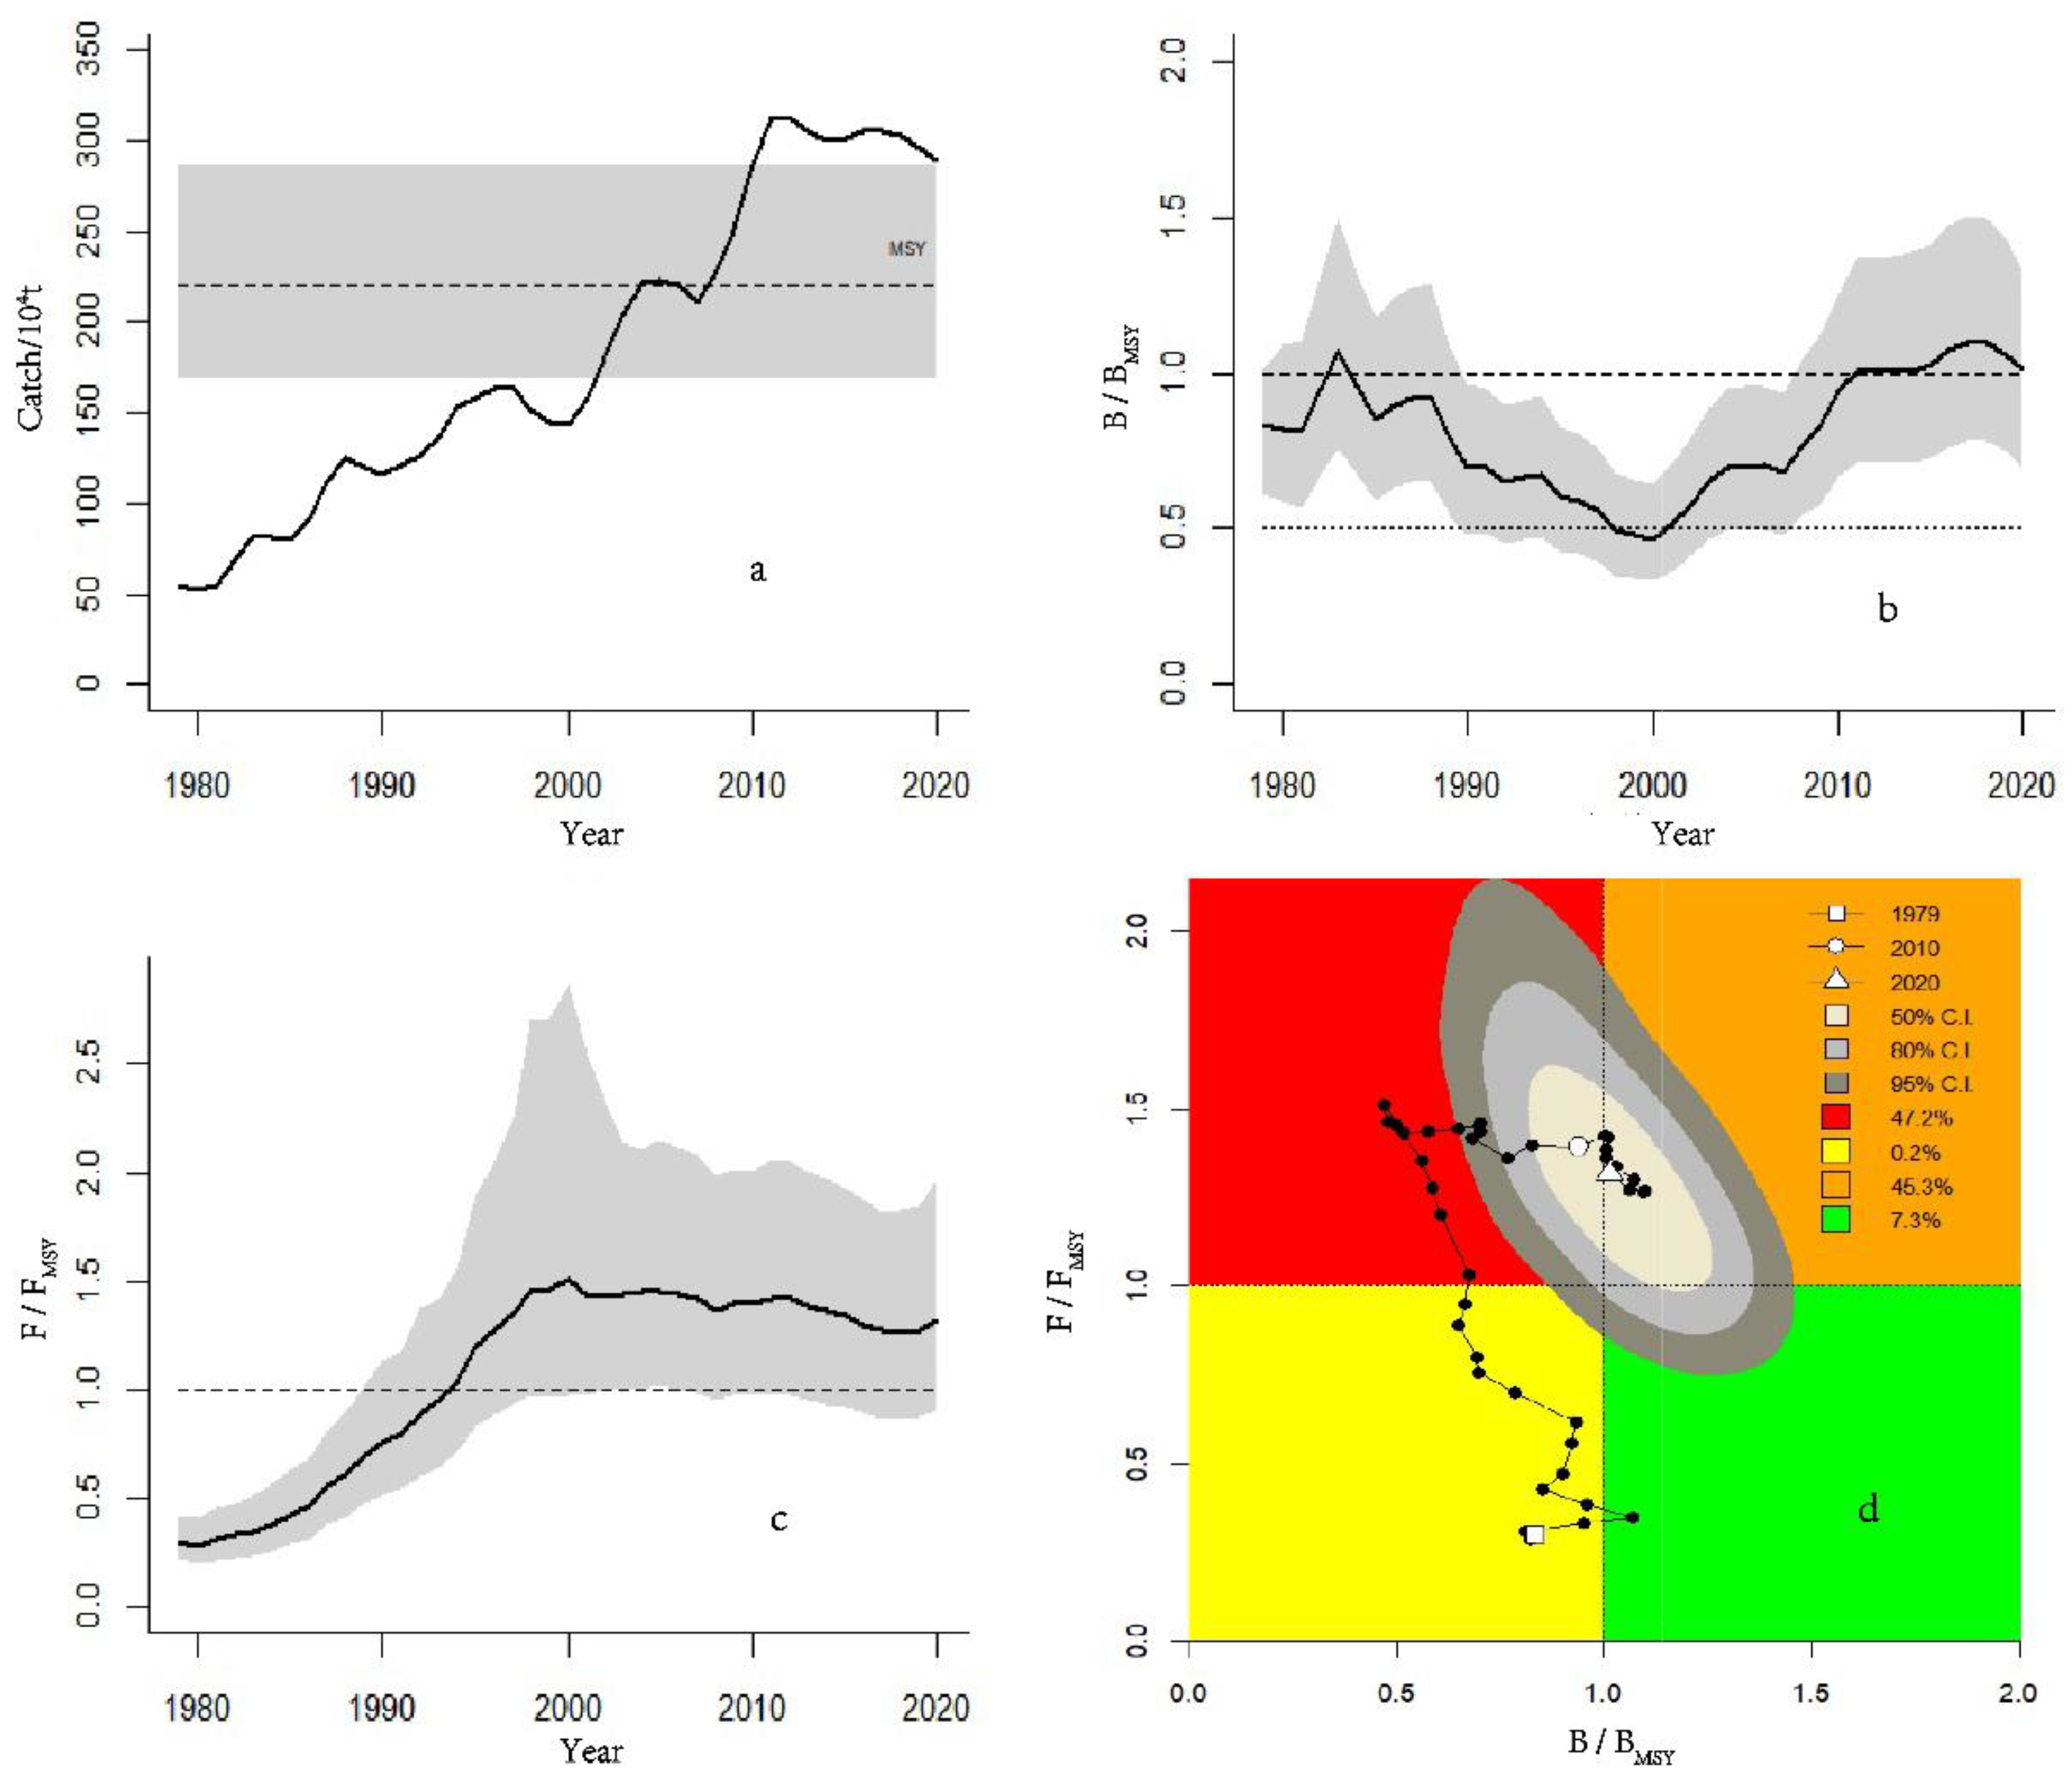
The assessment results of BSM for chub mackerel were close to those of CMSY. The BSM results showed that the estimated MSY was 220 × 103 t, the F/FMSY was very close to one, and the B/BMSY was greater than one (Table 4).
Figure 3 shows the BSM model results for chub mackerel. Fishing production had been on the rise since 1979. The F/FMSY had increased in 1979–2000 and had remained above one since 1993. The biomass of chub mackerel was between 0.5BMSY-BMSY for most of that time. After 1993, the fishing mortality was always greater than the FMSY, and the resources were always overfished and severely depleted.
Figure 3d is the Kobe diagram representing the population status. When the F/FMSY is greater than one, it indicates overfishing. When the B/BMSY is less than one, it indicates an overfished stock. The red is the “overfished” region, indicating overfishing and overfished, resulting in a low biomass level and being unable to produce the maximum sustainable yield (low biomass and high fishing mortality). The orange is the “overfishing” region, indicating a healthy population but high fishing, causing overfishing (both fishing mortality and biomass are high). Yellow is the “recovering” region, indicating that fishing pressure is low, and that the population is recovering from low biomass levels (both biomass and fishing mortality low). The green is a “sustainable” region, which means that the target area for resource management indicates a sustainable fishing pressure and a healthy population (low fishing mortality and high biomass). The ‘Banana’ area in the middle of the figure represents uncertainty. The pale yellow in the center of the ‘Banana’ graph represents 50%, the grey represents 80%, and the dark grey represents a 95% confidence level. The square in the bottom left represents the starting year, the circle represents the intermediate year, and the triangle represents the final year.
It can be seen from Figure 3d that in the initial years, the chub mackerel status was in the recovering state, but it did not move to the sustainable status as expected normally; due to continued high fishing pressure, it moved into overfished region and remained there. There were some signs of increased biomass in a few years (orange region) but again moved towards the overfished region. There is a 46.2% probability that the chub mackerel fishery will be in a state of decline due to being overfished, 45.3% probability that it will be in a state of decline due to excessive fishing pressure, 0.2% probability that it will be in a state of recovery from decline, and 7.3% probability that it will be in a healthy state of sustainability in 2020. In conclusion, the chub mackerel fishery is already being overfished and the resources have declined.

3.2. Conger_ECS

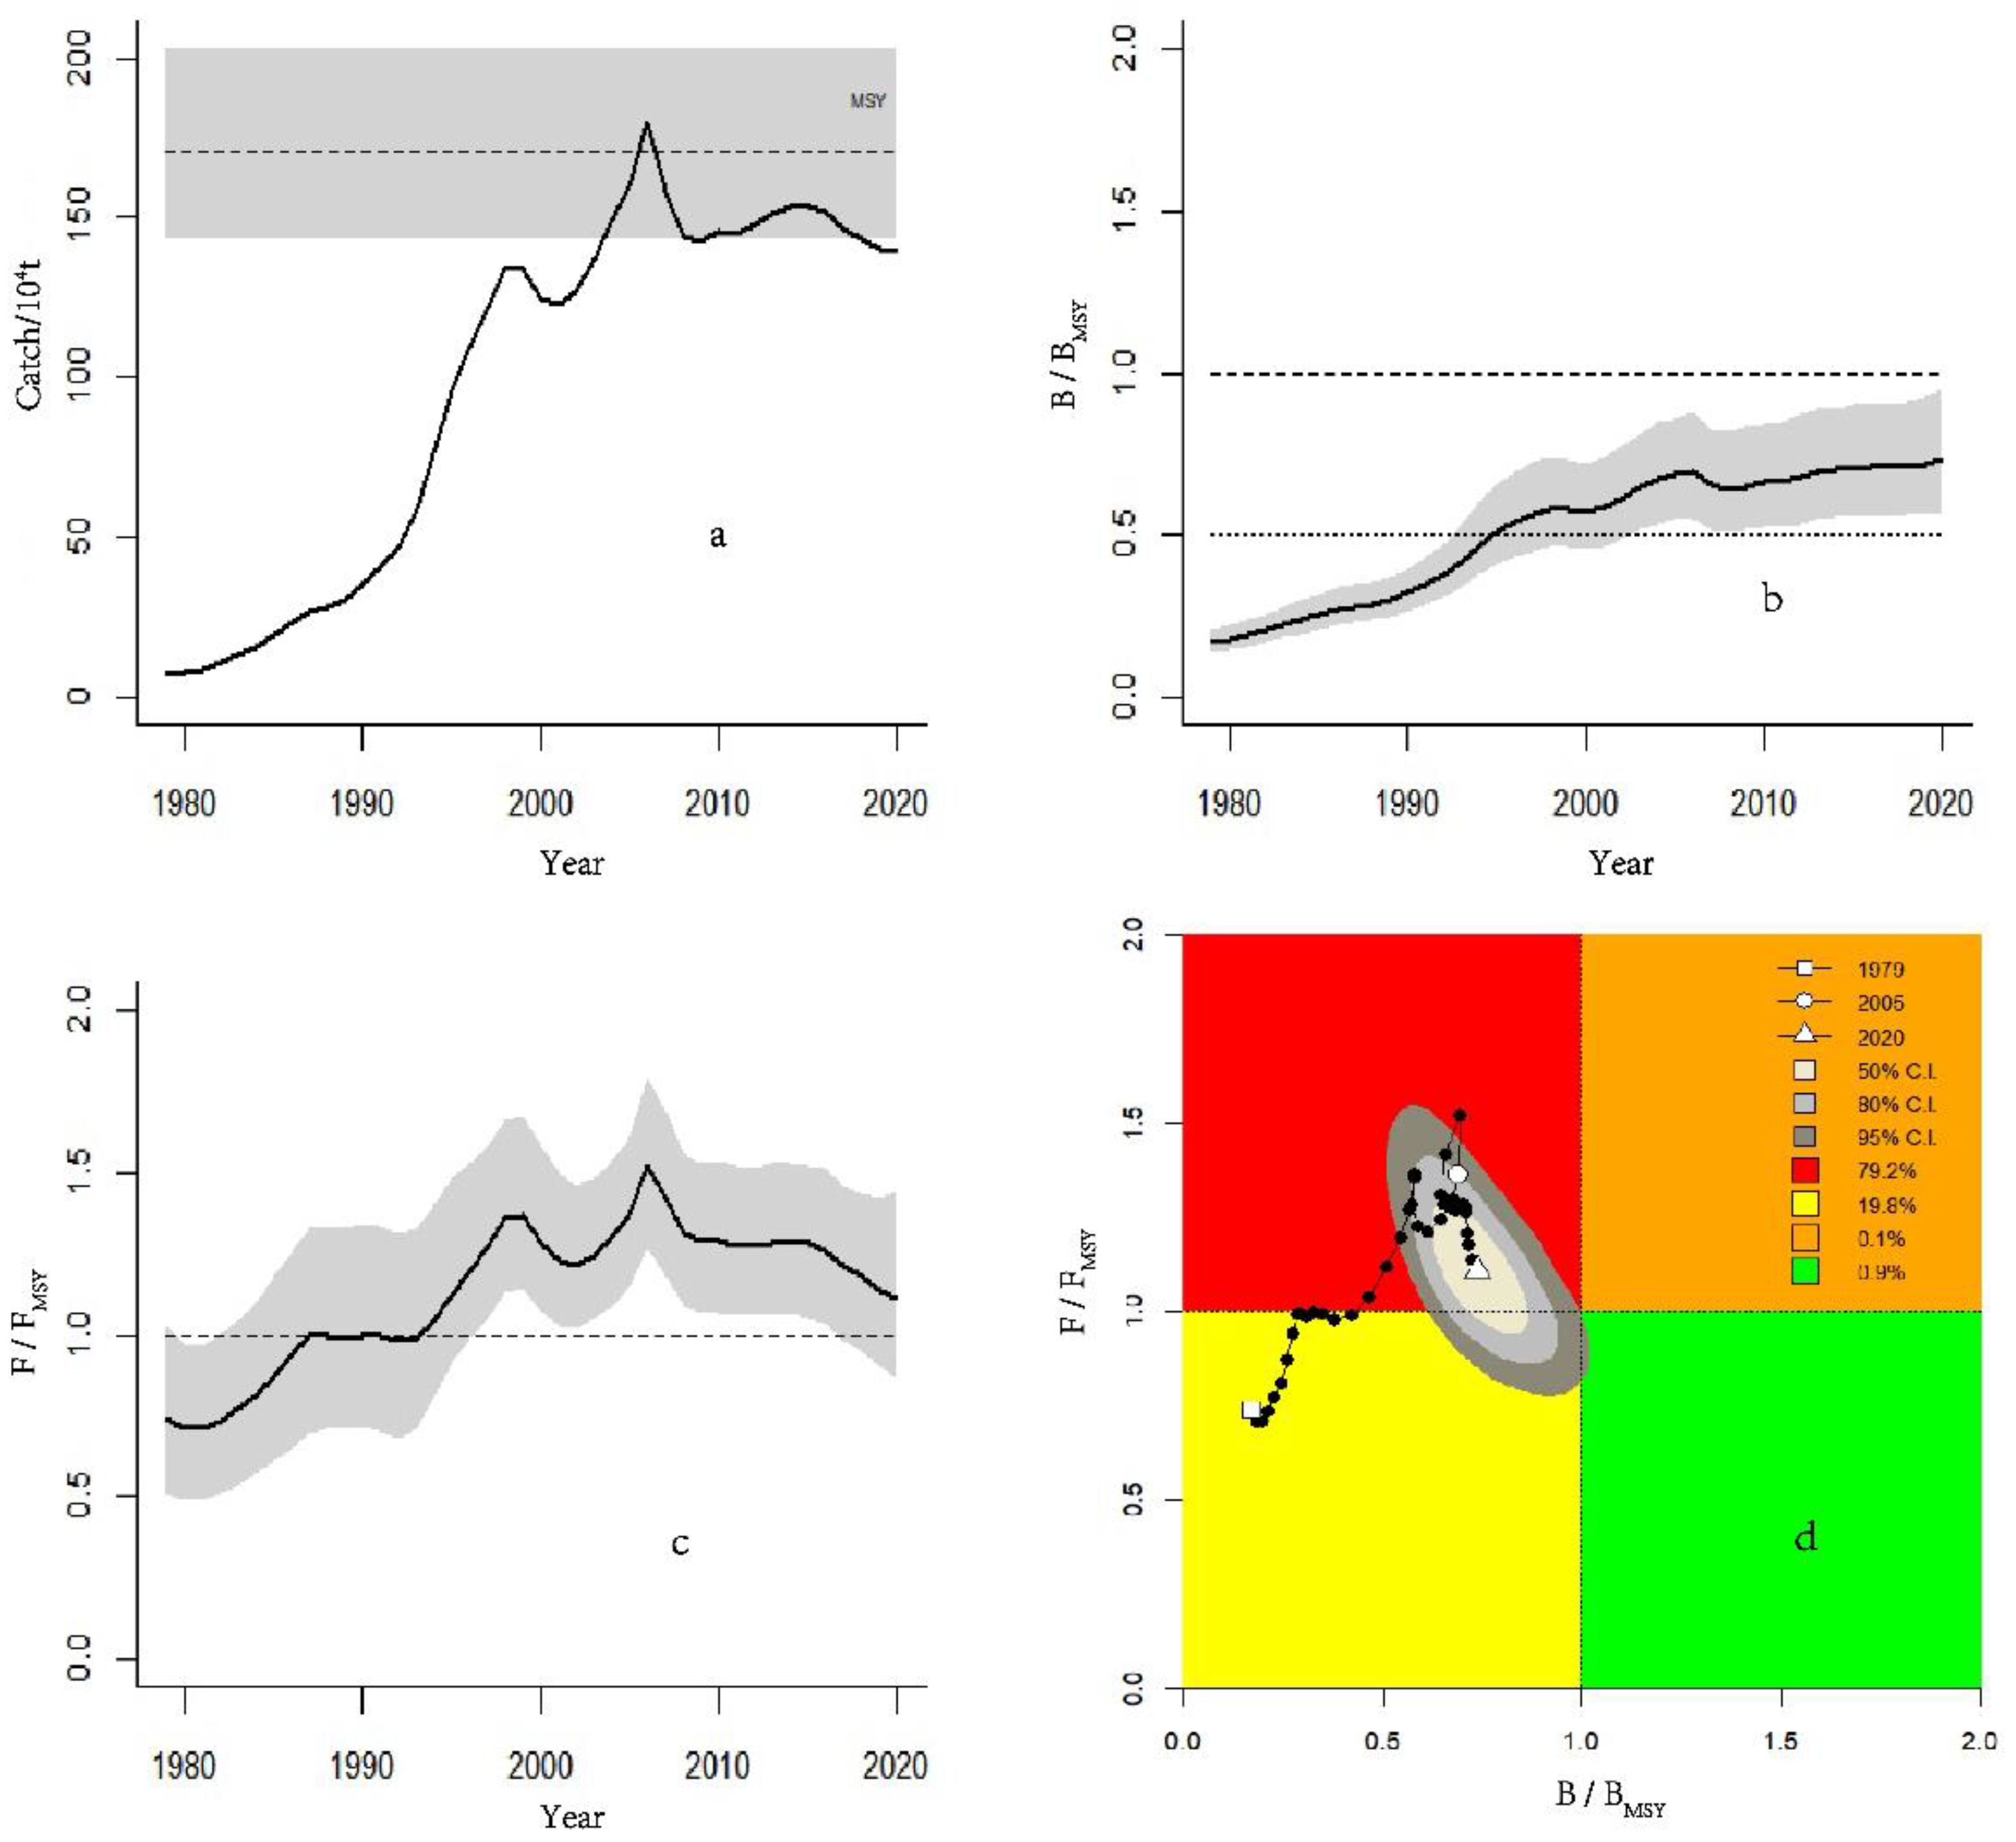
The population parameters and biological reference points of the conger fishery were evaluated by CMSY and BSM. The CMSY study showed that the estimated MSY was 140 × 103 t. The estimate for F/FMSY is greater than one and the estimate for B/BMSY is less than one, indicating that the population has been subjected to overfishing and the population is overfished. The assessment results of the BSM of the conger fishery showed that the estimated MSY was 170 × 103 t, the exploitation rate F/FMSY was greater than one and the relative biomass B/BMSY was less than one. (Table 4).
Figure 4 shows the assessment results of the conger fishery based on the BSM model. The exploitation rate F/FMSY had increased year by year since 1979 and had always been greater than one since 1988. The biomass of conger estimated by BSM was always less than BMSY, and it was between 0.5BMSY and BMSY after 1995, indicating that the resources were always overfished and seriously depleted. It can be seen from Figure 4d that the conger had experienced a gradual transition from population recovery to being overfished. In 2020, there is a 79.2% probability that the conger fishery will be in a state of resource decline due to overfishing, a 19.8% probability that the resource will decline due to excessive fishing pressure, a 0.1% probability that the resource will decline in the recovery period, and a 0.9% probability that the sustainable development will be in a healthy state. Both CMSY and BSM evaluated the conger fishery as overfishing and overfished.

4. Discussion

4.1. Models

Surplus production models are among the classical models of fishery resources assessment. They can be used to evaluate fishery resources only by time series of catch and fishing effort data [21]. This method can be used to evaluate fishery resources without population biology parameters, which is especially suitable for resource assessments of fisheries without age composition data, and the evaluation results are simple and easy to understand [7]. In 1935, Graham first used the logistic model to study the effects of World War I on bottom fisheries in the North Sea. He firstly proposed that when in equilibrium, i.e., when the catch exactly equals the surplus production of a fish population, the catch from the resources may be sustainable. Based on this logistic model, the MSY may be achieved when the population size is half the environmental carrying capacity. Based on the equilibrium surplus production models of Schaefer (1954, 1957), Fox (1970), and Pella–Tomlinson (1969), non-equilibrium surplus production models that do not rely on the equilibrium assumption had been developed, including process error models and observation error models. Polacheck et al. (1993) reported that the latter performs better. With the advances of mathematics and computer science, the surplus production models had been further developed, such as the CMSY model and the BSM model by Froese et al. [22]. These new models can use prior information such as the resilience of the population and the assumption of initial and final relative biomass to calculate the posterior distribution of fishery biological reference points. Fishery information can then be used more fully, and more outputs can be given, i.e., the probability distribution of output parameters rather than just a point estimate.
The working group of the Food and Agriculture Organization of the United Nations (FAO) have tested four data-limited models (modified panel regression model (mPRM), Catch-MSY model (CMSY), catch-only model–sampling importance resampling model (COM-SIR), and state–space catch-only model (SSCOM)). The working group evaluated the biases of the models by the proportional error (PE) and mean proportional error (MPE). The deviation and accuracy of the models were evaluated by population absolute proportional error (APE) and mean absolute proportional error (MAPE). According to the average value of PE or APE, the CMSY model performed best among the four models. CMSY also had the best performance when MPE and MAPE were used to evaluate performance. CMSY was the best performer when it comes to evaluating the effectiveness of complete time series and the last five years of time series. Although most models perform similarly, CMSY was more effective in assessing population status in a short time scale (5 years), probably because it uses more prior information distribution than other models, thus obtaining more information in a short time series. Therefore, CMSY may be more suitable for fisheries in developing countries because these countries have recently implemented data collection programs and can only obtain short time sequence data. The CMSY method may therefore be one of the best methods for conducting resource assessments of data-limited fish stocks [23].
The CMSY model only needs the catch data and prior information of parameters r and k, and it had good short-term estimation results, which may be more suitable for the fisheries with short time series data [10]. The BSM model has one more fishing effort datapoint than the CMSY model in terms of data requirements [10]. The CMSY and BSM models do not differ significantly in terms of parameter assumptions and uncertainty levels, so the assessment results of the two models are highly comparable. The parameter estimates of CMSY and BSM do not differ significantly in most cases, but the BSM model estimates are closer to the ‘true’ values in the model test results, so the results of the BSM model are often used as a benchmark for the CMSY model results when the true values are unknown when assessing actual fisheries resources [24]. The CMSY and BSM models are not suitable for fishery populations with low development levels and extremely low population resilience. Fortunately, the two fish species studied in this paper do not meet the above two conditions, so viable evaluation results were obtained in this study [25,26,27].

4.2. Status of Two Fishery Resources

The chub mackerel (Scomber japonicus) is a pelagic migratory fish that distributes mainly in the East China Sea and the Yellow Sea with high commercial values [28,29]. Because groundfish resources in China’s coastal waters had serious declines, pelagic fish stocks have attracted more attention recently [30]. The estimated MSY of the chub mackerel fishery in the East China Sea ranged from 220 × 103 t to 240 × 103 t. The estimated F/FMSY of both models was greater than one, indicating that the chub mackerel fishery in the East China Sea had been overfished. In terms of B/BMSY projection, the assessment of the CMSY model was less than one, indicating that the fishery of chub mackerel in the East China Sea had declined. Similarly, the assessment of the BSM model was very close to one. The B/BMSY of the population increased slowly after the fishing pressure was stable in 2000, and it was greater than one in 2010. However, the B/BMSY of the assessed population was between 0.5 and 1 for most of the studied period, indicating that high fishing mortality negatively affected the fish resources. Chub mackerels are an r-selection species and have a fast generation replacement speed. To adapt to the high fishing pressure, the population has undergone adaptive changes, e.g., early sexual maturity age, smaller sexual maturity length, and larger fecundity, and therefore, the resource gradually increased [31,32,33,34]. Despite this, necessary measures should still be taken to carry out scientific management, so as to restore the population and thus ensure its sustainable development.
The conger (Muraenesox cinereus) is a warm-water demersal fish that is widely distributed in the coastal areas of China with important economic values [35]. According to the data of the China Fishery Statistical Yearbook, in recent years, the yield of conger in the East China Sea was more than 300,000 tons, of which more than 80% were from the East China Sea [36]. The estimated MSY of the conger fishery ranged from 140 × 103 t to 170 × 103 t. The estimated values of the CMSY and BSM models for the F/FMSY were greater than one, and the estimated values of the B/BMSY were less than one. The evaluation results of the two models were not significantly different, which showed that the fishing intensity of the fishery is large, and the resources are declining. Although the yield of conger is high, there is a shortage of relevant fishery management technical specifications. For example, the length of conger juveniles is not stipulated in the “Implementation of the management regulations of the minimum length at first capture and the proportion of juveniles for hairtail and other 15 important fish species” issued by the Ministry of Agriculture and Rural Affairs in 2018 [37]. Therefore, we should further reduce fishing pressure and increase the minimum length at first capture so that the fishery resource may be restored.
At present, fisheries in China are mostly unselective without major target species, and bycatch of other species and young individuals is very serious. For example, trawling, gillnets, and traps capture more non-target species, especially for bottom trawls, which may wreak havoc in habitats critical for fish recruitment. Unselective fishery reduces the diversity of marine organisms and is very unfavorable to the sustainable development of the fishery. For example, chub mackerels are caught in a variety of fishing gear bycatch, which may lead to overfishing of the chub mackerel fishery. From the perspective of protection, target fisheries can minimize the impact on the diversity and reduce the damage to marine ecology. Therefore, reducing bycatch is of great significance to the sustainable development of fisheries. Policies about selective fisheries for China are highly anticipated [38].

5. Conclusions

Based on the data from the China Fisheries Statistical Yearbook from 1979 to 2021, this study evaluated two important fishery resources, chub mackerel and conger, in the East China Sea. The results show that the two fishery populations in the East China Sea are overfished, and the resources are declining. Therefore, the management strategies of these two fisheries should be more conservative. The biological reference points estimated in this study may provide a scientific basis for the management of chub mackerel and conger fisheries in the East China Sea. CMSY and BSM provide good estimates of population parameters and biological reference points for the two fisheries studied here and may also be applied to stock assessment and fisheries management for many other data-limited fisheries resources.

Author Contributions

F.Y.: conceptualization, data collection, methodology, data analysis, visualization, writing, editing, and reviewing; Q.L.: conceptualization, reviewing, and editing; X.C.: data collection, editing, and reviewing. All authors have read and agreed to the published version of the manuscript.

Funding

This work is supported by the basic research fund of Ocean University of China (201562020).

Institutional Review Board Statement

Not applicable.

Informed Consent Statement

Not applicable.

Data Availability Statement

The datasets generated during this study are available from the corresponding author on reasonable request.

Conflicts of Interest

The authors declare no conflict of interest.

References

  1. Liu, Z.; Sun, H.; Yue, D.; Geng, R.; Zhao, L.; Pan, P.; Cao, K. Research on China’s Maintance Policy for Marie Capture Fishery Resources in the New Era. J. Agric. Sci. Technol. 2018, 20, 1–8. [Google Scholar]
  2. Lu, Z.; Cui, L.; Pauly, D. Assessments of 16 Exploited Fish Stocks in Chinese Waters Using the CMSY and BSM Methods. Front. Mar. Sci. 2020, 7, 483993. [Google Scholar]
  3. Han, Y.; Rita, C.; Li, Y.R.; Ma, Z.J.; Wang, Y.N. Management of marine fishery share in the United States—And its enlightenment to China’s marine fishery management. World Agric. 2017, 3, 78–84. [Google Scholar]
  4. Zhang, K.; Liao, B.C.; Xu, Y.W.; Zhang, J.; Sun, M.; Qiu, Y.; Chen, Z. Assessment for allowable catch of fishery resources in the South China Sea based on statistical data. Haiyang Xuebao 2017, 39, 25–33. [Google Scholar]
  5. Zhao, L.H. Research on the Implementation of Fishing Quota System in China’s Marine Fisheries. Ph.D. Thesis, Shanghai Ocean University, Shanghai, China, 27 May 2020. [Google Scholar]
  6. Liu, Z.; Yuan, X.; Yang, L.; Yan, L.; Cheng, J. Stock assessment and management strategies for small yellow croaker in the East China Sea based on data-limited assessment models. J. Fish. Sci. China 2019, 26, 621–635. [Google Scholar]
  7. Zhan, B.Y. Fishery Stock Assessment; China Agricultural Press: Beijing, China, 1995. [Google Scholar]
  8. Haddon, M. Modeling and Quantitative Methods in Fisheries, 2nd ed.; Chapman & Hall/CRC Press: New York, NY, USA; London, UK, 2011; pp. 285–333. [Google Scholar]
  9. Ji, Y.; Liu, Q.; Liao, B.; Zhang, Q.; Han, Y.N. Estimating biological reference points for Largehead hairtail (Trichiurus lepturus) fishery in the Yellow Sea and Bohai Sea. Acta Oceanol. Sin. 2019, 38, 20–26. [Google Scholar] [CrossRef]
  10. Froese, R.; Demirel, N.; Coro, G.; Kleisner, K.M.; Winker, H. Estimating fisheries reference points from catch and resilience. Fish Fish. 2017, 18, 506–526. [Google Scholar] [CrossRef] [Green Version]
  11. Chen, W.Z.; Li, C.S.; Yu, L.F. Estimation of the maximum sustainable yield for chub mackerel and round scad in the East China Sea by the surplus production models fitting expert system. J. Fish. China 1997, 4, 404–408. [Google Scholar]
  12. Yan, L.P.; Li, J.S.; Ling, J.Z.; Ye, S.Z.; Zhang, H.L. Assessment on the biomass of Scomber japonicus resources in the western East China Sea by length-structure VPA. Prog. Fish. Sci. 2010, 31, 16–22. [Google Scholar]
  13. Li, G.; Zheng, X.Q.; Zhu, G.P.; Chen, X.J. Establishment of surplus production model for chub mackerel (Scomber japonicus) in the East China Sea and Yellow Sea based on the sea surface temperature. J. Shanghai Ocean. Univ. 2011, 20, 108–113. [Google Scholar]
  14. Ling, J.Z.; Li, S.F.; Yan, L.P. Analysis on the utilization of main fishery resources in the East China Sea. Mar. Fish. 2006, 2, 111–116. [Google Scholar]
  15. Zhou, Y.D.; Xu, H.X. Biomass Estimates of Muraenesox cinereus are Calculated by LCA in the East China Sea. J. Zhejiang Ocean. Univ. (Nat. Sci.) 2007, 4, 399–403. [Google Scholar]
  16. Bureau of Fisheries of the Ministry of Agriculture of the People’s Republic of China. China Fishery Statistical Yearbook; China Agriculture Press: Beijing, China, 1979–2021. [Google Scholar]
  17. Zhang, Q.Q.; Liu, Q. Assessing biological reference points for three important fishery resources in coastal water of China. Period. Ocean. Univ. China 2021, 51, 123–134. [Google Scholar]
  18. Steven Martell and Rainer Froese. A simple method for estimating MSY from catch and resilience. Fish Fish. 2013, 14, 504–514. [Google Scholar] [CrossRef]
  19. Froese, R.; Pauly, D. (Eds.) FishBase. World Wide Web Electronic Publication. Version (02/2022). Available online: www.fishbase.org (accessed on 31 December 2022).
  20. Froese, R.; Demirel, N.; Coro, G.; Winker, H. A Simple User Guide for CMSY+ and BSM (CMSY_2019_9f. R); Oceanrep: Kiel, Germany, 2019; pp. 1–16. [Google Scholar]
  21. Guan, W.J.; Tian, S.Q.; Zhu, J.F.; Chen, X.J. A review of fisheries stock assessment models. J. Fish. Sci. China 2013, 20, 1112–1120. [Google Scholar] [CrossRef]
  22. Zhang, S.; Wang, Y.; Wang, Y.; Liang, C.; Xian, W. Assessment of 11 Exploited Fish and Invertebrate Populations in the Japan Sea Using the CMSY and BSM Methods. Front. Mar. Sci. 2020, 7, 525363. [Google Scholar] [CrossRef]
  23. Rosenberg, A.A.; Fogarty, M.J.; Cooper, A.B.; Dickey-Collas, M.; Fulton, E.A.; Gutiérrez, N.L.; Hyde, K.J.; Kleisner, K.M.; Kristiansen, T.; Longo, C.; et al. Developing new approaches to global stock status assessment and fishery production potential of the seas. FAO Fish. Aquac. Circ. 2014, 1086, 1–190. [Google Scholar]
  24. Nisar, U.; Ali, R.; Mu, Y.; Sun, Y. Assessing Five Major Exploited Tuna Species in India (Eastern and Western Indian Ocean) Using the Monte Carlo Method (CMSY) and the Bayesian Schaefer Model (BSM). Sustainability 2021, 13, 8868. [Google Scholar] [CrossRef]
  25. Geng, P. A Study of Inter-Annual Changes in Growth, Mortality and Exploitation Rate of Representative Fish Stocks in Beibu Gulf. Ph.D. Thesis, Shanghai Ocean University, Shanghai, China, May 2019. [Google Scholar]
  26. Zeng, L.; Li, X.S.; Zhao, X.Y.; Li, F.; Jin, X.S. Fecundity and its variations of anchovy Engraulis japonicus in the central and southern Yellow Sea. J. Fish. Sci. China 2005, 12, 569–574. [Google Scholar]
  27. Zhang, K.; Zhang, J.; Xu, Y.; Sun, M.; Chen, Z.; Yuan, M. Application of a catch-based method for stock assessment of three important fisheries in the East China Sea. Acta Oceanol. Sin. 2018, 37, 102–109. [Google Scholar] [CrossRef]
  28. Li, Y.K.; Fang, X.N.; Yu, W.; Li, Y. Spatio-temporal distribution of chub mackerel Scomber japonicus in the East China Sea during 2005–2016 and its relationship with sea surface temperature. J. Shanghai Ocean. Univ. 2022, 31, 710–720. [Google Scholar]
  29. Wu, S.N.; Chen, X.J. Review on Stock Assessment and Management of Chub Mackerel (Scomber japonicus). Trans. Oceanol. Limnol. 2020, 1, 161–168. [Google Scholar]
  30. Li, Y.S.; Bai, S.L.; Pan, L.Z.; Guan, W.J.; Jiao, J.P. An Individual Model Based Simulation Study on Impact of Water Temperature Fluctuation on Recruitment of Chub mackerel (Scomber japonicus) in the East China Sea. Trans. Oceanol. Limnol. 2018, 6, 118–124. [Google Scholar]
  31. Zhou, H.L.; Yan, L.P.; Zhang, H.; Li, J.S. Age and growth characteristics of chub mackerel (Scomber japonicus) reproductive stock in the central East China Sea. J. Fish. Sci. China 2022, 29, 608–617. [Google Scholar]
  32. Guan, W.J.; Ma, X.L. Assessment of the status of Scomber japonicus resources in the East China Sea and Yellow Sea using a Bayesian biomass dynamic model. J. Shanghai Ocean. Univ. 2022, 31, 749–760. [Google Scholar]
  33. Li, Y.S.; Xing, Y.N.; Pan, L.Z.; Zhang, Y.; Yu, W. Research progress on life history and model application of chub mackerel Scomber japonicus: A review. J. Dalian Ocean. Univ. 2021, 36, 694–705. [Google Scholar]
  34. Zhou, H.L.; Li, J.S.; Yan, L.P. Research progress on biological characteristics of reproductive stocks and population ecology of Scomber japonicus. Mar. Fish. 2021, 43, 751–760. [Google Scholar]
  35. Zhang, Y.Z.; Zhu, W.B.; Li, P.F. Seasonal and Growth Variation of Feeding Habit of Conger Eel (Muraenesox cinereus) in East China Sea. J. Zhejiang Ocean. Univ. (Nat. Sci.) 2010, 29, 237–245. [Google Scholar]
  36. Li, Q.; Zhang, C.; Ye, Z.J.; Tian, Y.J.; Liu, Y.; Li, J.C. A comparative study on growth and mortality of Muraenesox cinereus and M. bagio in East China Sea and Yellow Sea. Period. Ocean. Univ. China 2019, 49 (Suppl. II), 46–52. [Google Scholar]
  37. Mo, Q.L.; Hu, S.S.; Xie, J.J.; Luo, J.H.; Feng, B. Stock assessment of Muraenesox cinereus in the northern South China Sea. Fish. Inf. Strategy 2022, 37, 27–33. [Google Scholar]
  38. Sun, M.; Li, Y.; Chen, Y. Unveiling unselective fishing in China: A nationwide meta-analysis of multispecies fisheries. Fish Fish. 2022, 24, 142–158. [Google Scholar] [CrossRef]
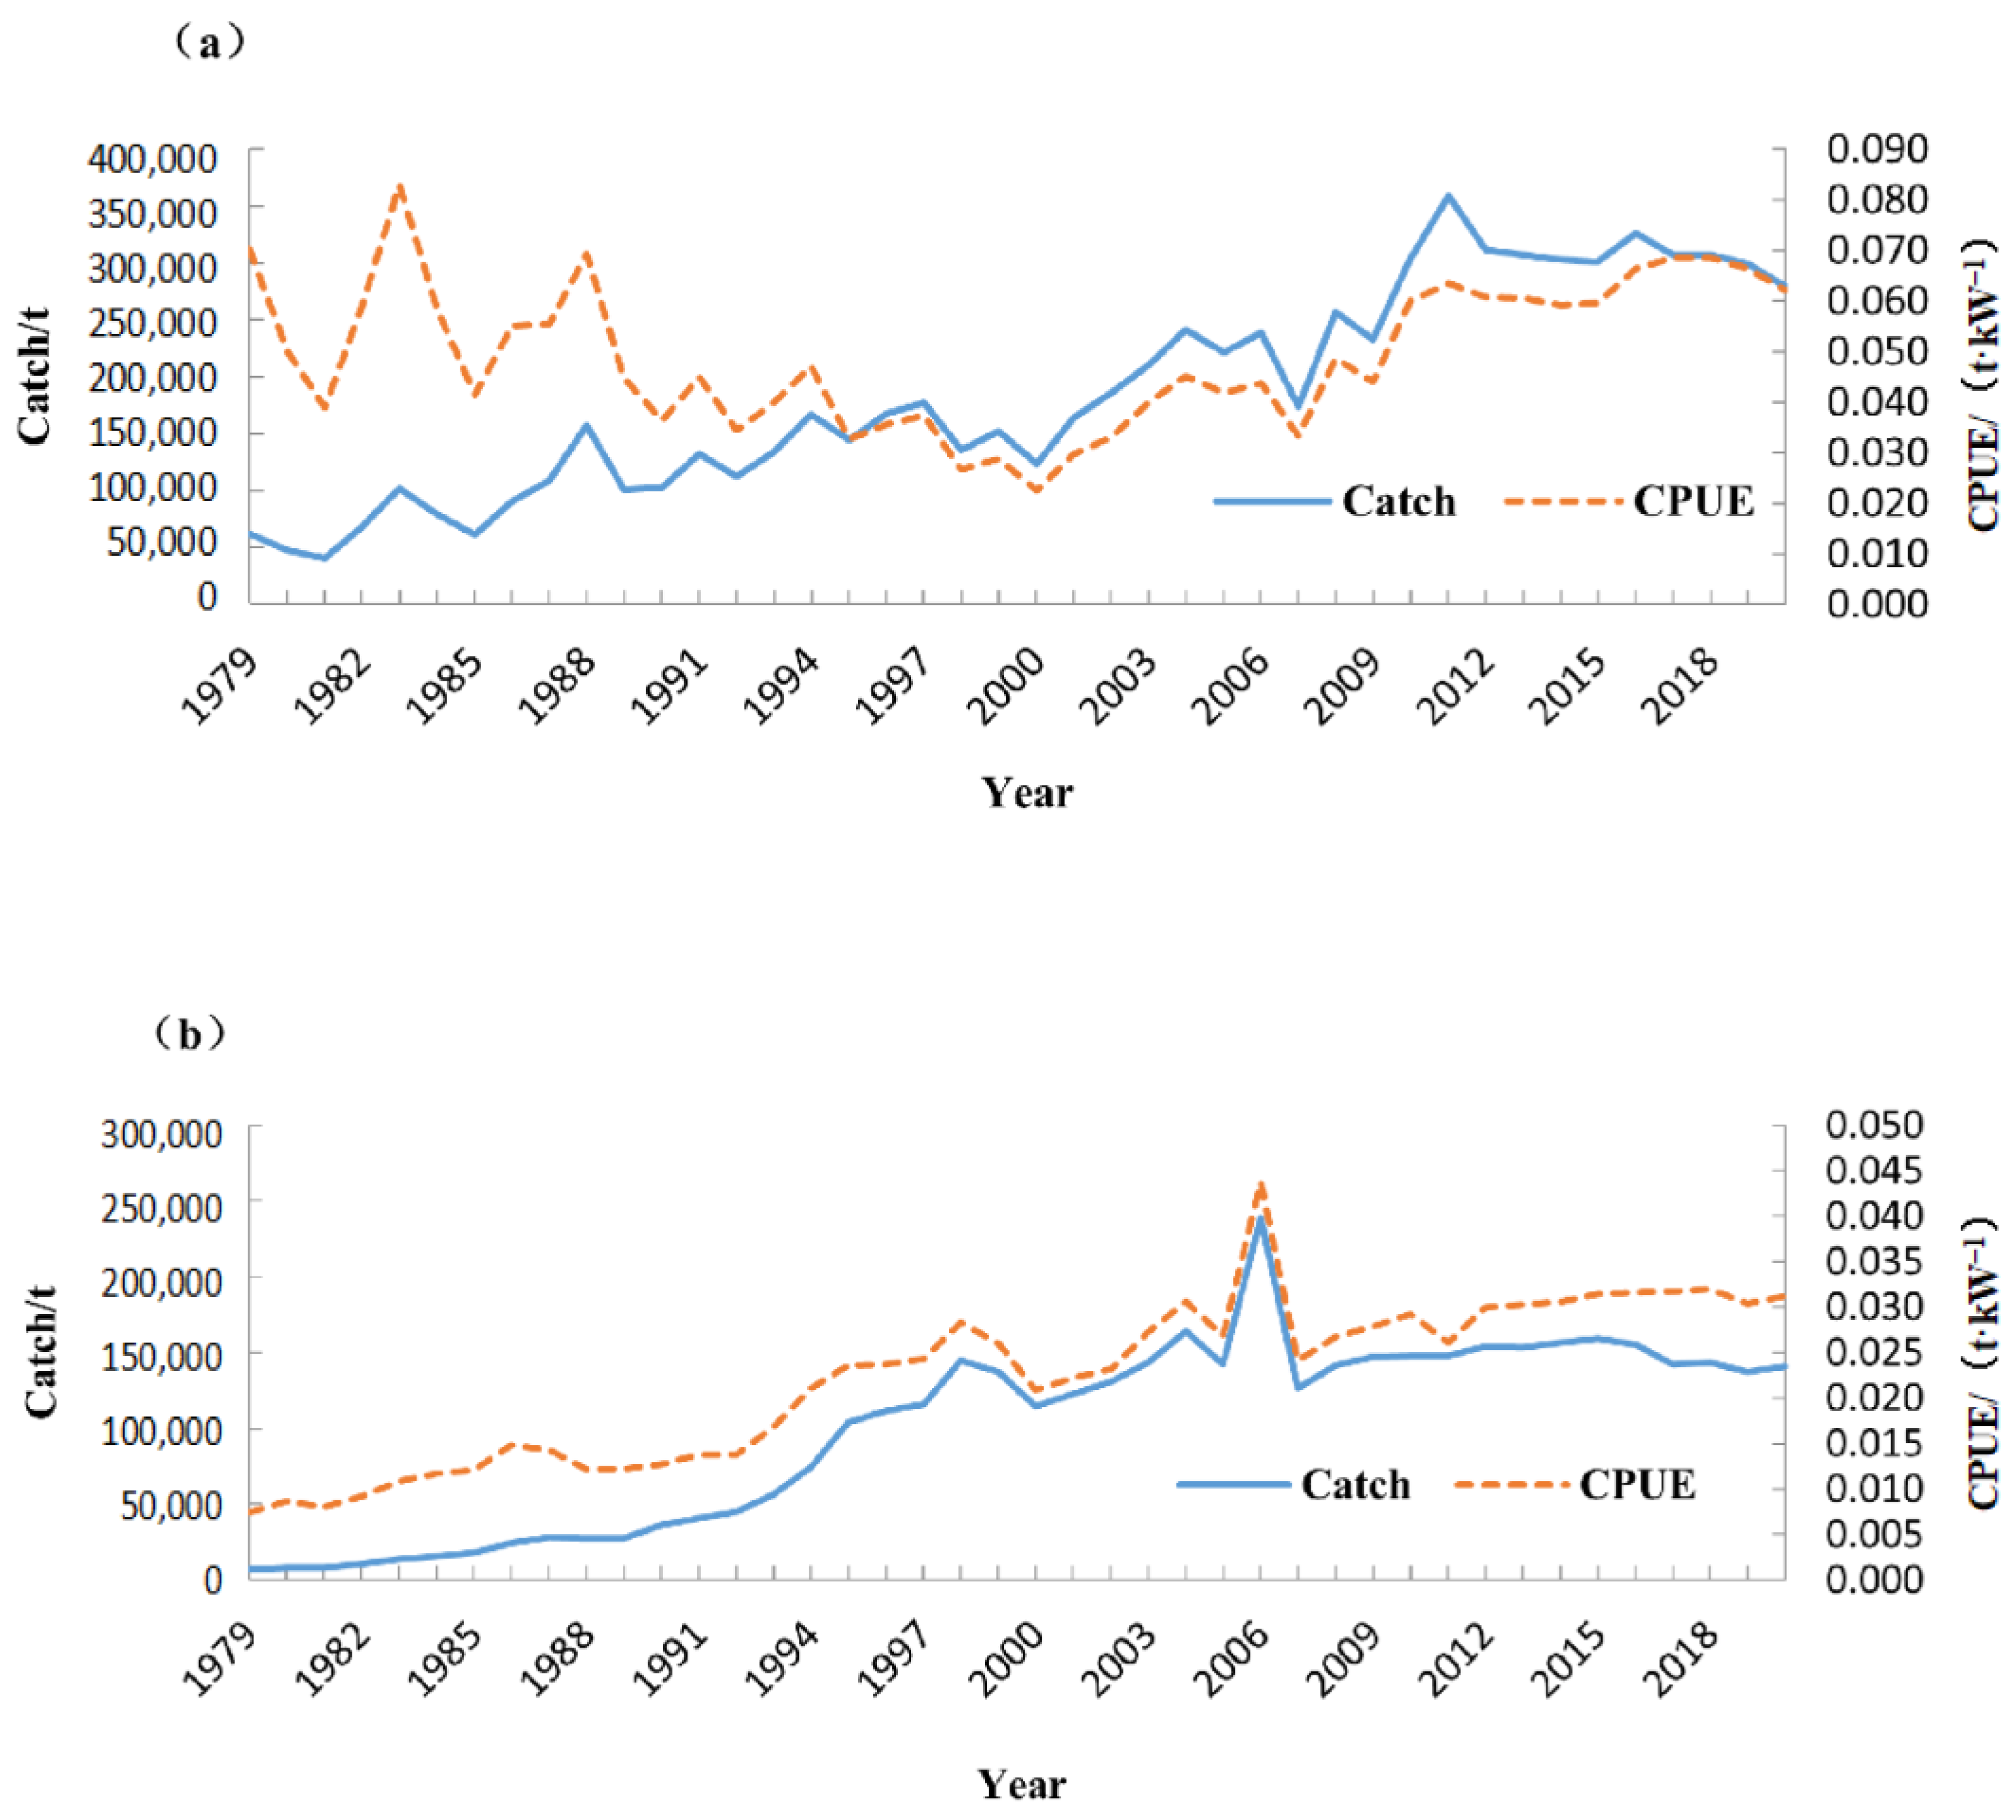
Figure 1. Statistics of catch and CPUE for the Mackerel_ECS (a) and Conger_ECS (b).
Jmse 11 00121 g001
Figure 2. Viable r–k pairs for Mackerel_ECS (a) and Conger_ECS (b) from CMSY and BSM. The grey area is the r–k pair that satisfies CMSY, and the blue cross is used to mark the best r–k pair of CMSY and its 95% confidence interval. The black region is the r–k pair satisfying the BSM, and the best r–k pair and its 95% confidence interval are marked by the red cross.
Jmse 11 00121 g002
Figure 3. Results of stock assessment for Mackerel_ECS from BSM where (a) is the production, the horizontal broken line is the estimated value of MSY, and the grey region is the 95% confidence interval; (b) is the relative total biomass (B/BMSY), the broken line of level 1 is the maximum sustainable biomass BMSY giving MSY, the dotted line of level 0.5 is 0.5BMSY, and the grey area is uncertainty; (c) is relative fishing pressure (F/FMSY); and (d) is a Kobe plot between relative population biomass (B/BMSY) and relative exploitation rate (F/FMSY). The shaded areas are 50%, 80% and 95% confidence intervals (C.I.).
Jmse 11 00121 g003
Figure 4. Results of stock assessment for Conger_ECS from BSM where (a) is the production, the horizontal broken line is the estimated value of MSY, and the grey region is the 95% confidence interval; (b) is the relative total biomass (B/BMSY), the broken line of level 1 is the maximum sustainable biomass BMSY giving MSY, the dotted line of level 0.5 is 0.5BMSY, and the grey area is uncertainty; (c) is relative fishing pressure (F/FMSY); and (d) is a Kobe plot between relative population biomass (B/BMSY) and relative exploitation rate (F/FMSY). The shaded areas are 50%, 80% and 95% confidence intervals (C.I.).
Jmse 11 00121 g004
Table 1. Classification of prior ranges for resilience parameter r.
ResiliencePrior r-Range
High0.6–1.5
Medium0.2–0.8
Low0.05–0.5
Very low0.015–0.1
Table 2. Prior relative biomass (B/k) range.
Depletion Status of the StockB/k
Very strong depletion0.01–0.2
Strong depletion0.01–0.4
Medium depletion0.2–0.6
Low depletion0.4–0.8
Nearly unexploited0.75–1.0
Table 3. Input values of models.
MethodsInput ValuesMackerel_ECSConger_ECS
CMSY
and
BSM
r/a−10.2~0.80.2~0.8
Initial B/k0.01~0.40.01~0.4
Intermediate B/k0.2~0.6
(2010)
0.2~0.6
(2005)
Final B/k0.2~0.60.2~0.6
Table 4. Estimates of intrinsic growth rate, environmental carrying capacity, maximum sustainable yield, relative exploitation rate, and population biomass of the two fisheries (with 95% confidence intervals in brackets).
FisheriesMethodsr (1/Year)k/103tMSY/103tF/FMSYB/BMSY
Mackerel_ECSCMSY0.499 (0.293~0.850)2020
(1330~3050)
240
(200~310)
1.800 (1.015~2.708)0.617 (0.410~1.095)
BSM0.286 (0.183~0.446)3080
(2030~4660)
220
(170~290)
1.320
(0.912~1.97)
1.010 (0.698~1.330)
Conger_ECSCMSY0.524 (0.329~0.835)1090
(740~1610)
140
(120~170)
1.289
(0.842~2.34)
0.765 (0.422~1.173)
BSM0.376 (0.270~0.523)1810
(1310~2510)
170
(140~200)
1.110 (0.863~1.440)0.736 (0.567~0.950)
Disclaimer/Publisher’s Note: The statements, opinions and data contained in all publications are solely those of the individual author(s) and contributor(s) and not of MDPI and/or the editor(s). MDPI and/or the editor(s) disclaim responsibility for any injury to people or property resulting from any ideas, methods, instructions or products referred to in the content.