Article

Simulated Short- and Long-Term Deformation in Coastal Karst Caves

1
The Guangdong Branch Office, Beijing Municipal Engineering Design Research Institute, Guangzhou 510725, China
2
School of Civil Engineering, Sun Yat-Sen University, Zhuhai 519082, China
3
Guangdong Engineering Research Centre for Major Infrastructures Safety, Sun Yat-Sen University, Guangzhou 510275, China
4
Research Center for Geotechnical Engineering and Information Technology, Sun Yat-Sen University, Guangzhou 510275, China
*
Authors to whom correspondence should be addressed.
These authors contributed equally to this work.
J. Mar. Sci. Eng. 2022, 10(9), 1315; https://doi.org/10.3390/jmse10091315
Submission received: 20 July 2022 / Revised: 9 September 2022 / Accepted: 14 September 2022 / Published: 17 September 2022
(This article belongs to the Section Coastal Engineering)

Abstract

:
The self-balanced pressure arch theory is an important basis for excavation support in karst caves, but it is difficult to quantify the empirical theory in coastal areas. In addition, the rheological effects of karst strata could pose a hazard to engineering. Therefore, this study investigated the rheological mechanism under the self-balanced pressure arch effect, and we proposed a mesoscopic unit rheological model for clay minerals in a water-rich environment. With the discrete element method (DEM), we realized the numerical modeling of the rheological model. Then, the proposed model is validated by a case study of foundation excavation in the coastal karst area of China. The mesoscopic mechanical characteristics of caves considering the influence of pressure arch are analyzed. The results show that the self-balance of the caverns mainly lies in the mesoscopic mineral strength and local stress. With the rheological controlled model, the final predicted convergent deformation of the foundation has an error of less than 10% compared with the field monitoring data. In this study, we can quantitively describe the self-balance effect of the pressure arch surrounding the caves and reveal the rheological mechanism. The proposed model can be applied to similar engineering with careful calibration and provide safety guidance.

1. Introduction

Coastal caves are pervasive in karst regions, which pose a potential threat to geotechnical engineering (e.g., rock mass collapse and creep deformation) [1,2]. The long-term water–mineral interaction surrounding the caves may induce the dislocation and disintegration [3,4] of clay minerals in the rock mass, which may bring hazards to engineering [5,6]. The self-balance pressure arch theory suggests that the surrounding rock can form a self-stabilizing pressure arch, but the mesoscopic mechanical mechanism is not yet clear, and it is difficult to explain the rheological deformation of the caves under the arch pressure effect with conventional analytical methods.
Sinkholes under coastal karst areas have attracted lots of attention for being potential causes of sudden overburden collapse and also for a long-term continuous subsidence [1,2]. To date, plenty of work has been carried out to explain sinkhole development in coastal areas, which highlighted the role of subrosion, both from mechanical and chemical behavior [7,8,9,10,11]. When the sinkholes have formed, the engineering activities are highly affected by the short-term and long-term stability of karst caves. The self-balanced pressure arch theory is an important basis for underground engineering design and excavation support [12,13], and extensive research has shown that the pressure arch theory can provide prediction and guidance for collapse in tunnels, mines and shallow buried caves [14,15,16,17]. For instance, Al-Halbouni et al. [1] adopting the DEM to model geomechanical behavior surrounding a single void space, revealing the bridge-shaped overburden accompanied with the maximum shearing stress arch; their further research indicated that a stable compression arch could be established in karstic depressions [18]. In terms of engineering practice, Carranza-Torres et al. examined the support pressure and safety coefficient of circular openings by presenting a closed-form solution [19,20]. These studies have shown that pressure arches are important to the self-balance of the rock mass.
Sinkhole stabilization is dependent both on the short-term and long-term behavior. The strength of material and state of compression arch are relevant to the short-term collapse of sinkholes, while the creep process of material is relevant to long-term deformation. Note that, different from inland caves, soft marine deposits such as clays and soft rocks are primarily distributed in the south-east coastal region of China [21,22], which have higher water content showing high compressibility and low strength. The excess pore water pressure of soft marine clays dissipated slowly, causing low bearing capacity and long-term large settlement [21,22,23].
To evaluate the engineering stability in coastal karts areas, the abovementioned two factors need to be tackled.
Research on long-term deforming mechanisms in cavern areas is widely carried out, and the theoretical and field studies have indicated that the disintegration and dislocation of clay minerals induced by water are significant [3,4]. The mesoscopic deterioration could accumulate to macroscopic deformation [24]. For example, the case study of water-bearing caves showed that there is a non-linear damage effect in the surrounding rock [25]. In addition, the caves’ deforming effect on the rock mass’s settlement has been investigated by combining field monitoring data with numerical analysis [26,27]. Related numerical simulation studies have also been carried out extensively to investigate the effects of caverns on engineering carriers under different engineering conditions, revealing that engineering disturbance and hydraulic action cause geohazards [28,29,30]. The clay minerals in karst areas [31,32] are water sensitive, and are prone to experience long-term rheological deformation. Therefore, the erosion–creep–collapse mechanism of caves in the karst area is proposed [33]; the deformation of rocks in the karst area can be described by Burger’s model in terms of its decay and deceleration creep phases [34].
However, there is little research on both evaluating the short-term and long-term stability, so it is difficult to provide a practical guide to the engineering in coastal karst areas. We are dedicated to evaluating the short-term collapse and long-term creep behavior of coastal caves. In fact, from a mesomineral scale, we can quantitatively estimate the stability of a self-balanced pressure arch. In this paper, we proposed a mesoscopic unit rheological model to control the caves’ long-term deformation, and mineral bonds’ capability is adopted to analyze the stability of pressure arch. The model is numerically applied through the discrete element method (DEM). The validation is completed by a case study of foundation excavation in the coastal karst area of China. The model can be used for geotechnical deformation analysis in coastal cavern areas and can be easily extended for different engineering conditions.

2. Contents and Methods

2.1. Numerical Modeling of Short-Term and Long-Term Deformation Surrounding Caves

In terms of the modeling cave, the continuum mechanics methods were adopted to define a single sinkhole in an elastic or elastoplastic half space, which is typically used to assess the safety of a singular cave [35,36]. However, according to the field detection, there are always tens of caves in the karst area, and they are also in multi-scale [37,38]. These continuum-based approaches have difficulties in dealing with the voids’ collapse and grains’ damage.
DEM modeling is nowadays increasingly used in geoscience numerical simulation of discontinuous or large deformation problems [39]. Considering its advantages in simulating rock or soil masses as an assembly of discrete grains, we adopt this method for simultaneously taking short-term and long-term deformation into account. The short-term collapse of sinkholes can be evaluated from the material strength, which is controlled by the grains’ bonding strength [39]. The long-term time-dependent deformation can be assessed with creep models between grains [40]. Therefore, we used Particle Flow Code (PFC), a common numerical simulation software, to implement the numerical analysis.

2.2. The Mesoscopic Controlling Mechanism of Self-Balance Pressure Arches of Caves

The pressure arch theory suggests that a stable equilibrium stress arch will support the caves after excavation. Figure 1 illustrates the mechanical patterns in the rock mass with or without caves. The stresses in an ordinary homogeneous stratum are transferred uniformly and show a similar pattern to the boundary stresses.
By contrast, the stresses around the cavern’s strata form a pressure arch to reach a new balance. The concentrated forces around the cave are higher than those in a homogeneous stratum, and local damage could occur if the strength limit of the geotechnical body is exceeded.
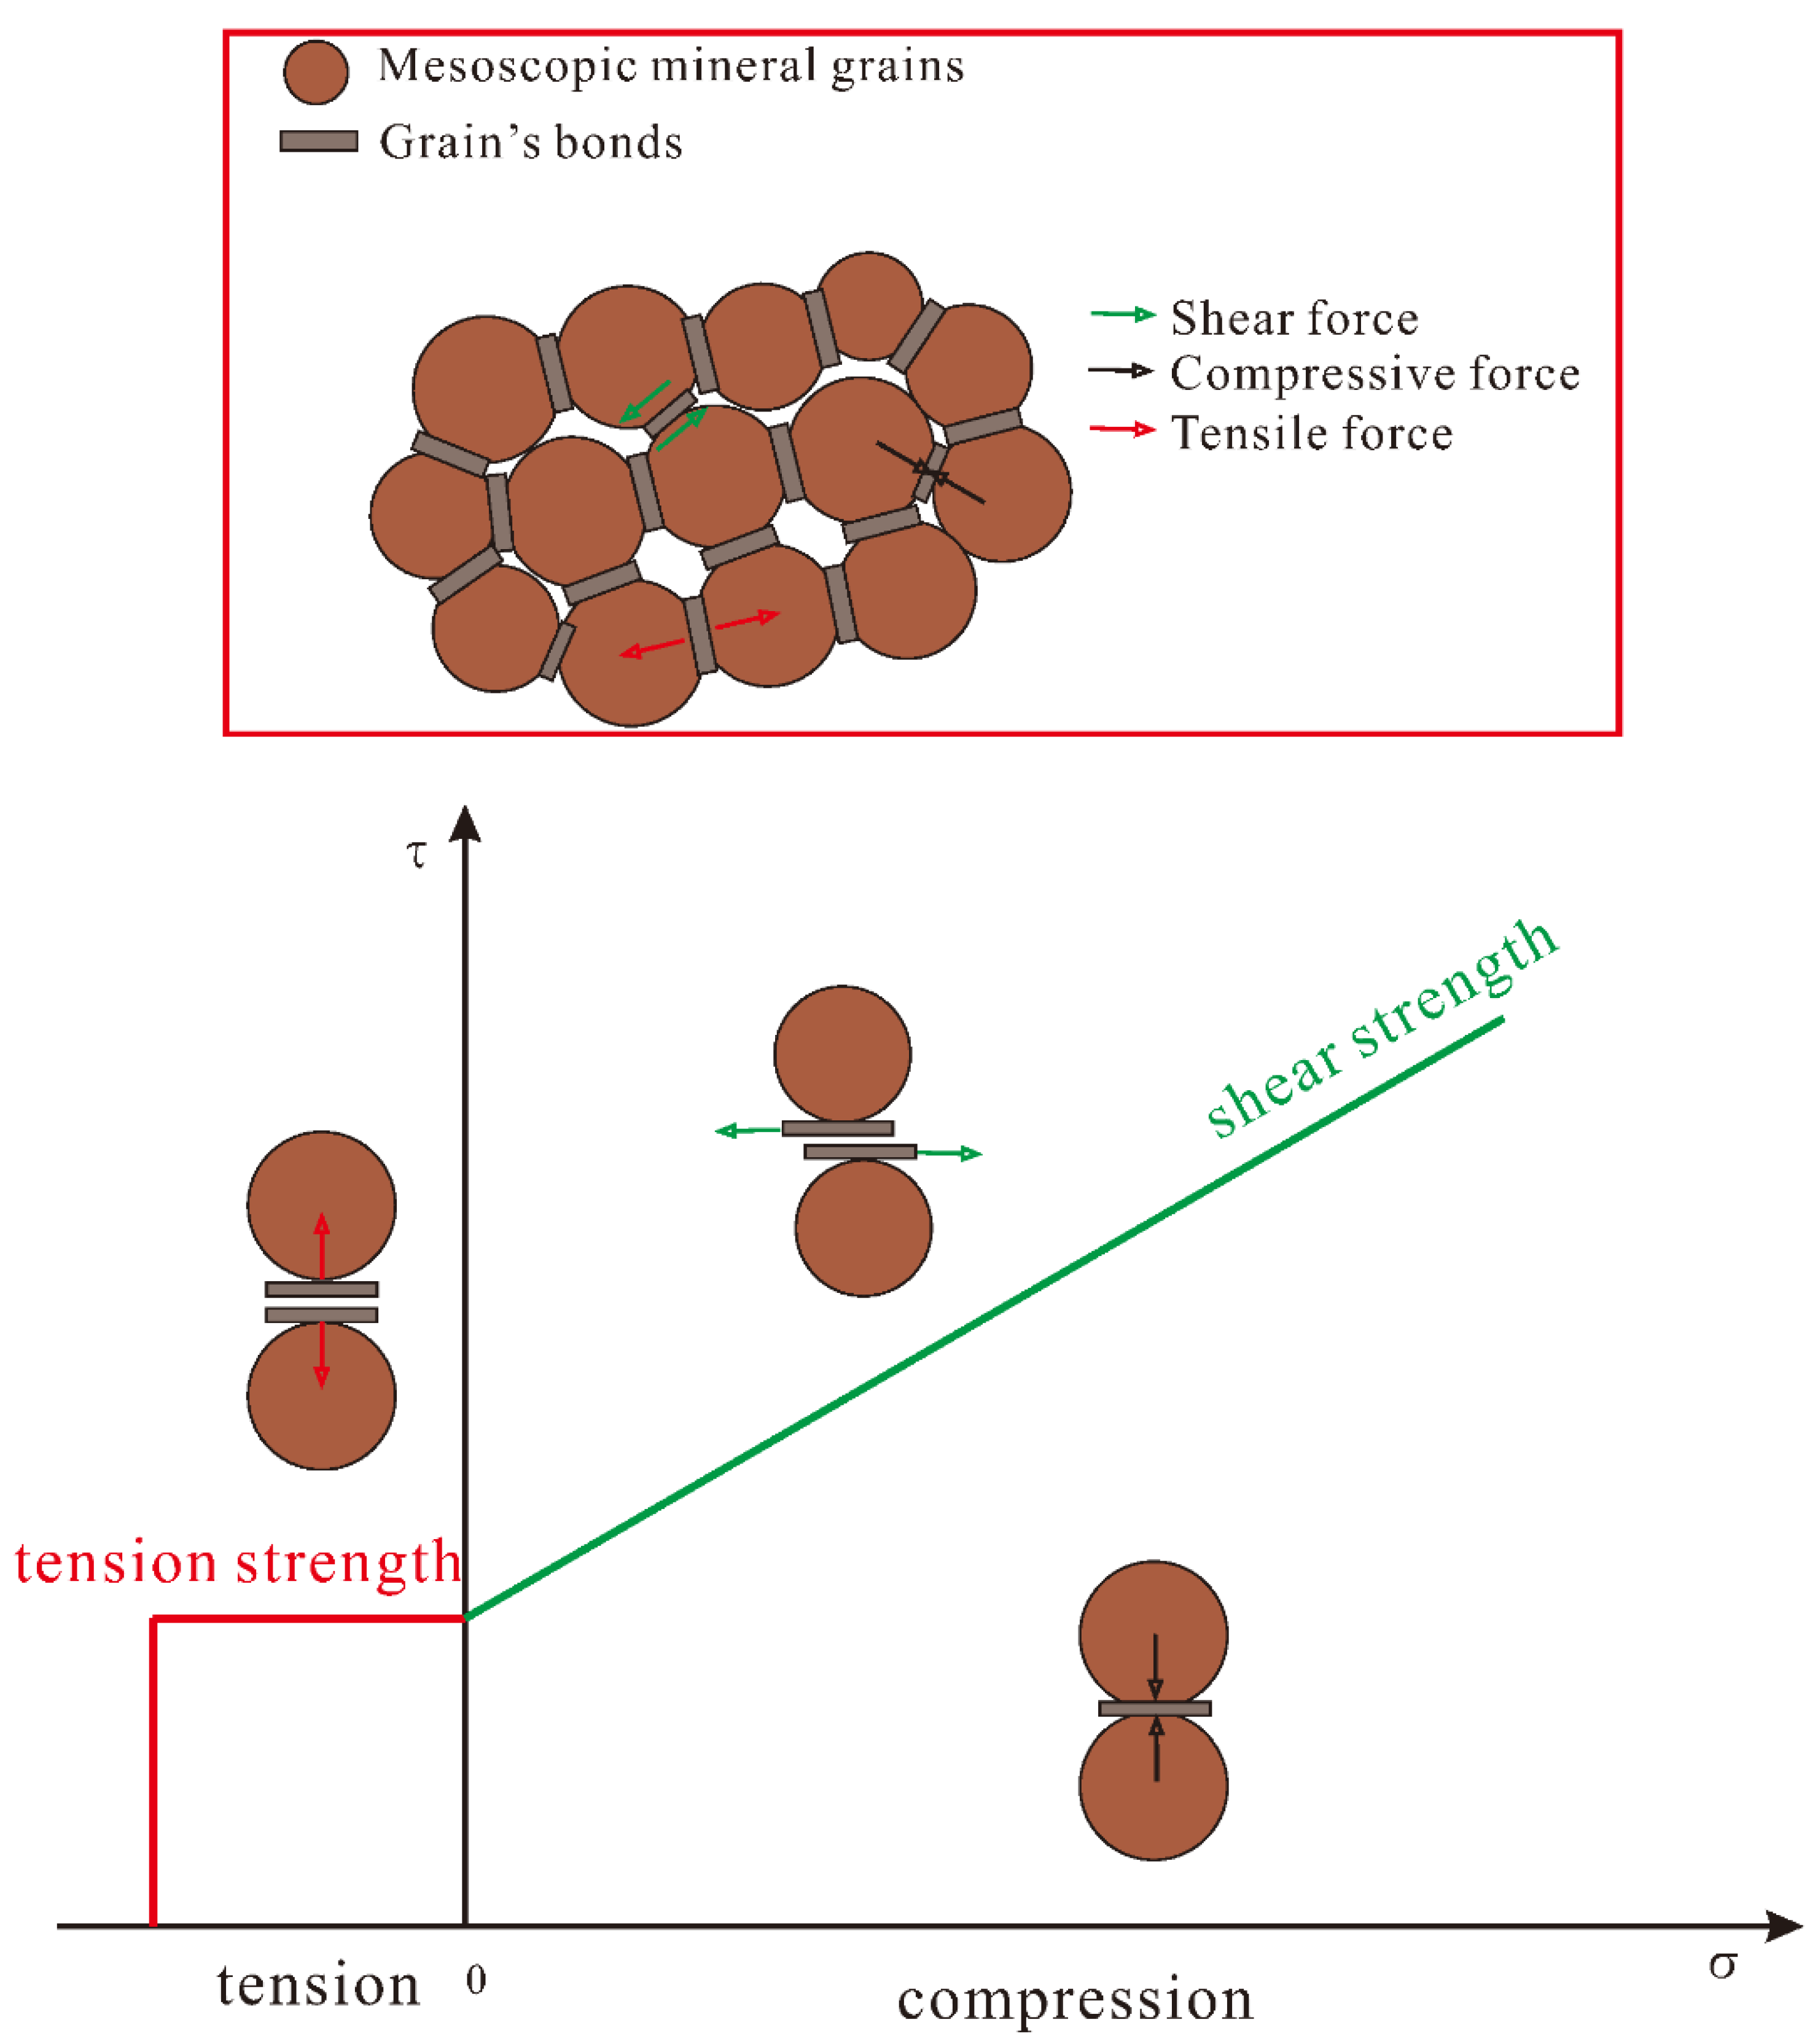
This local damage can be explained at the mineral scale, where the cave stratum consists of mineral grains and bonds. Bonds make the rock mass resistant to compressive, tensile and shear stresses on a mesoscopic scale. Figure 2 illustrates different localized forces, where shear, tensile and compressive stresses may be concentrated under disturbance due to the anisotropic and non-homogeneous arrangement of the grains. It is generally accepted that rock bonds are susceptible to damage under shear or tension while they are stable under compression. Then, the strength criterion for the mineral bonds can be represented by a strength curve in Figure 2, with damage occurring when the bond is stressed above the shear or tensile ultimate strength. The accumulation of mesodamage can result in visible damage. Therefore, the self-balance pressure arch is stable when the local microscopic forces are within the bond strength.
Suppose the caves are in a shallow depth. In that case, the surrounding rock is bearing a minor pressure from the overlying geotechnical body, so the existence of the pressure arch makes the actual excavation process more stable. However, many studies in engineering practice have shown the existence of long-term rheological effects in the cavern area, so it is difficult to consider the stability of the rock mass purely from the pressure arch. This paper will further analyze the rheological mechanism of the geotechnical rock and soil mass around the cavern.

2.3. Time-Dependent Deformation under Pressure Arches

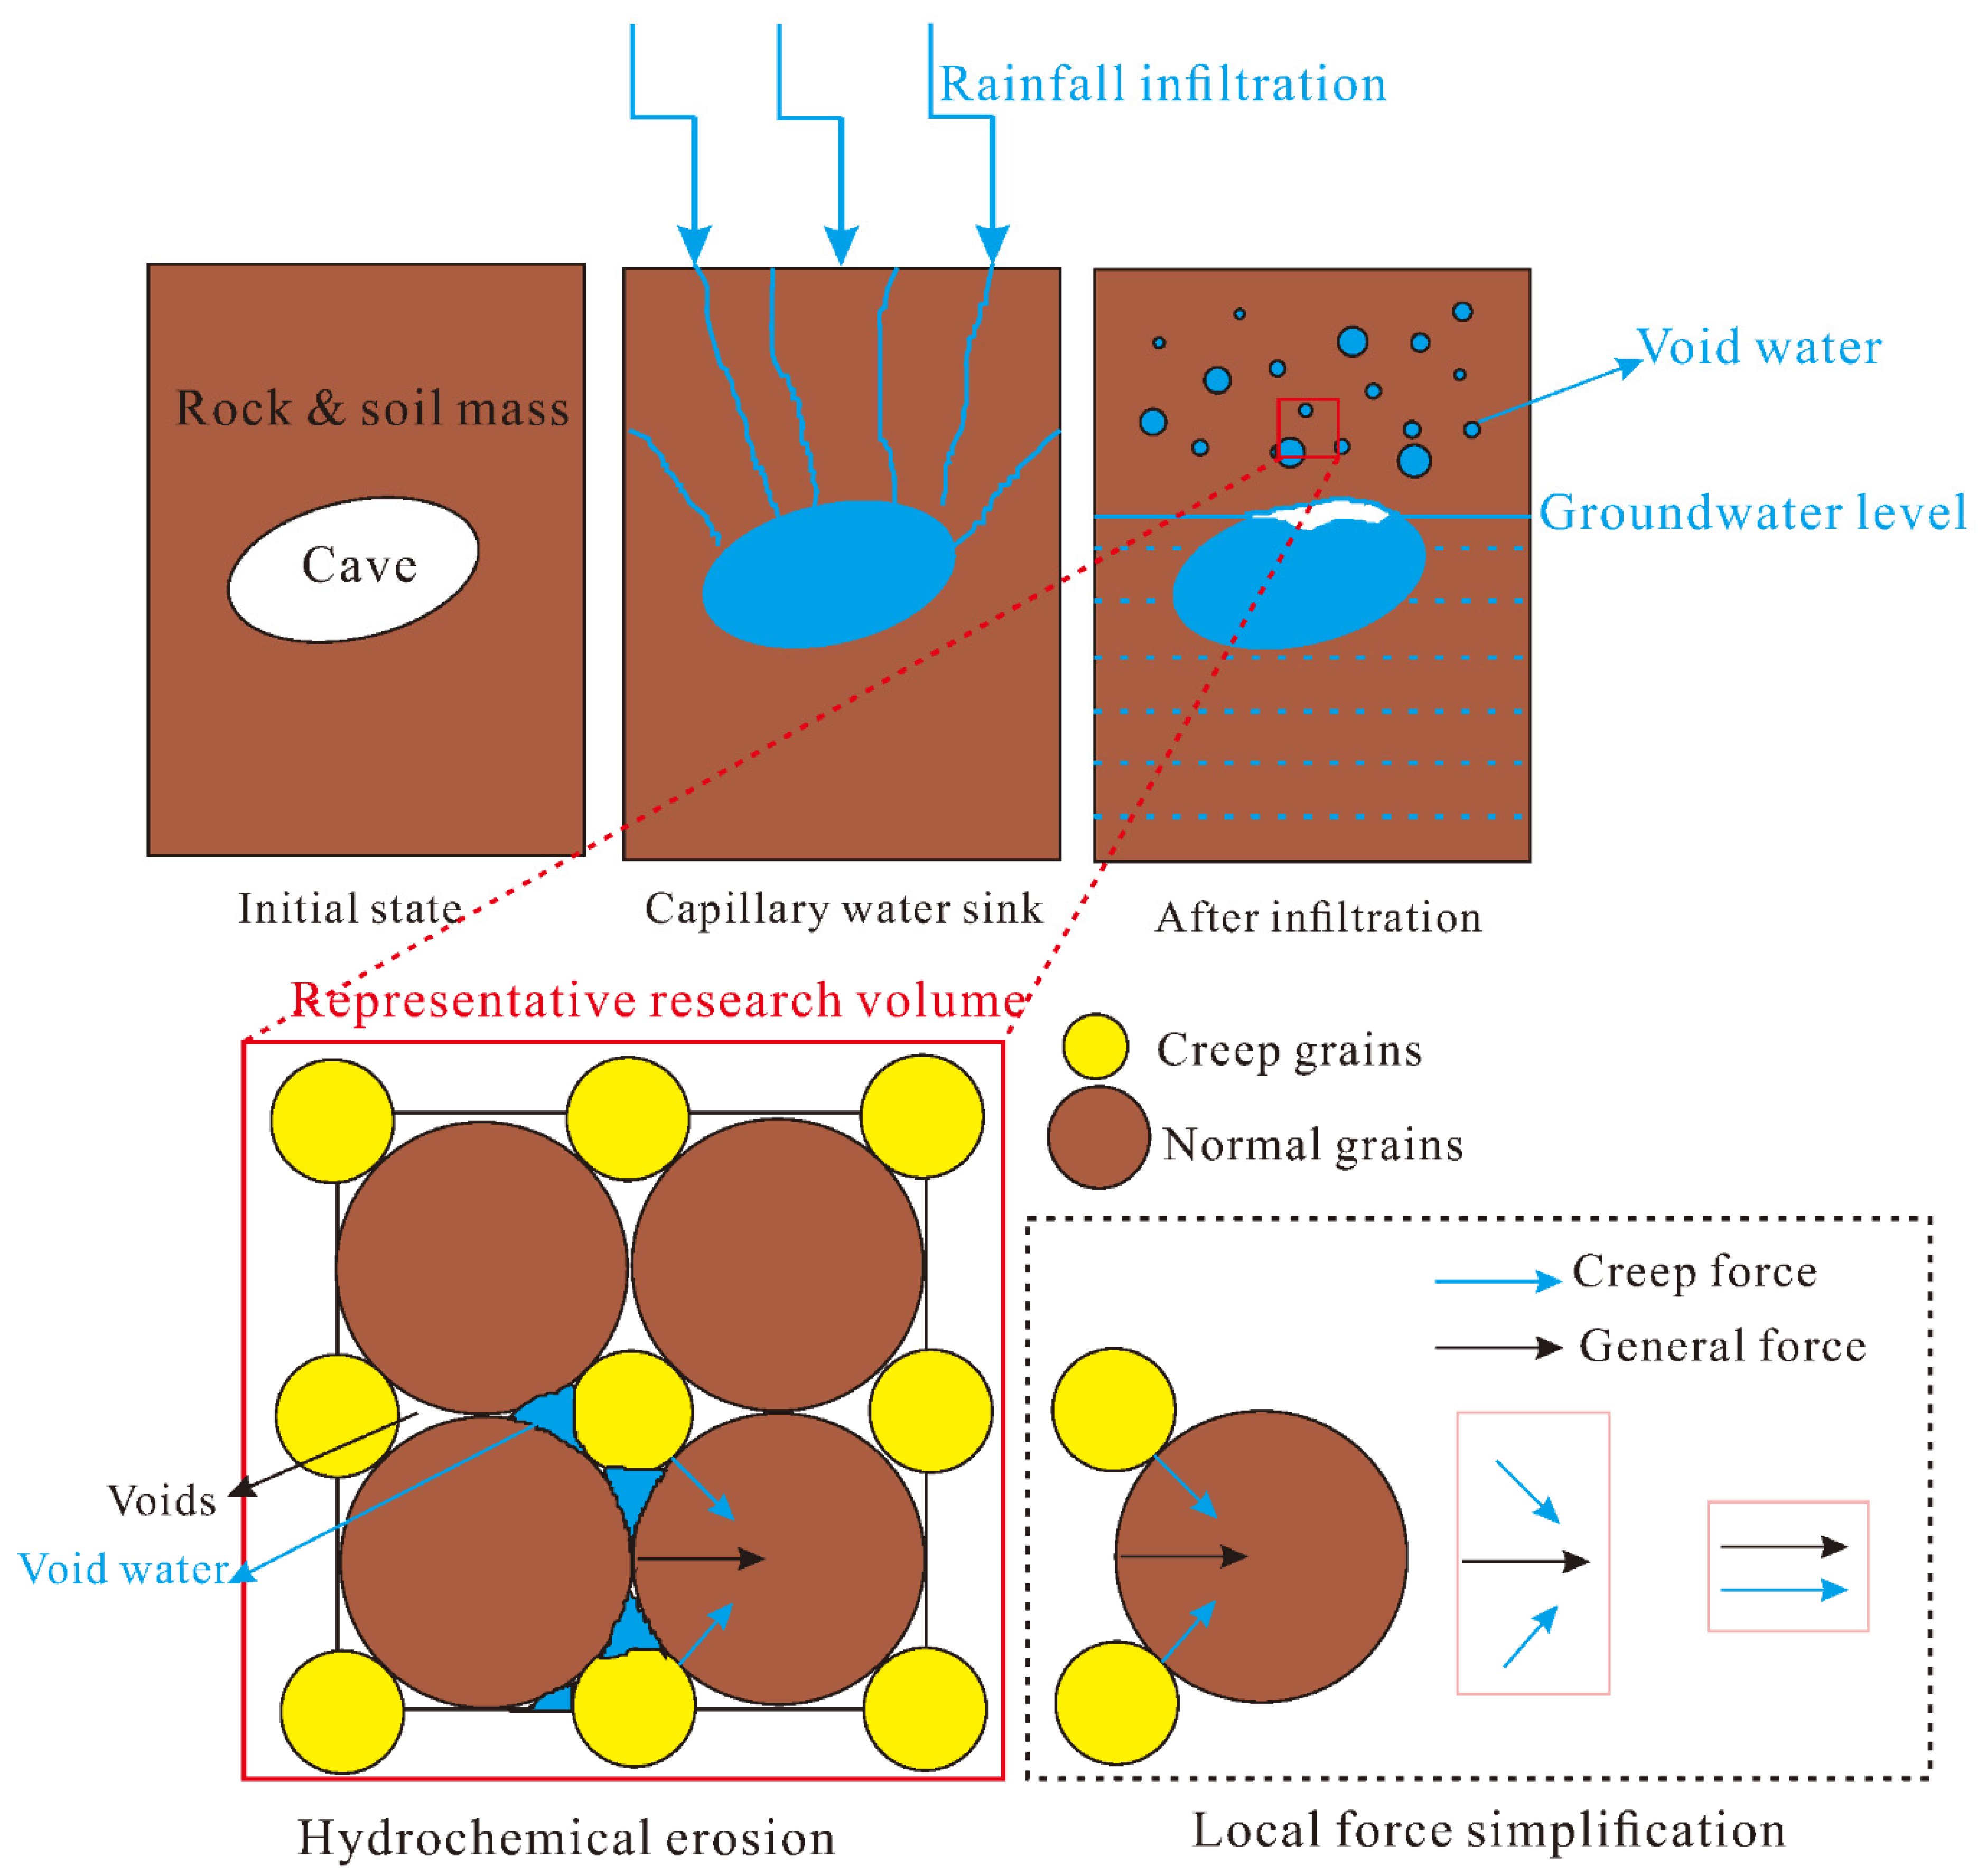
The pressure arches cause a stress concentration around the cavern. Meanwhile, the rainfall and groundwater influence the cavern area through rainfall inflowing and long-term infiltration of groundwater. Figure 3 shows the water enrichment process in the cavern stratum of karst area. The initial rainfall sinks into the cavern through joints and retains some capillary water. The unit grain model shown in Figure 3 can be adopted to analyze the mesoscale rheological mechanisms of the rock and soil in the karst region, which consists of rock/soil skeletal particles, clay minerals, pores and pore water [41,42]. In the modeling process, we divide the grains into normal and creep grains. The creep grains are counterparts to the clay minerals that provide time-dependent deformation (see Figure 3). The difference between the weathered soil and the rock mass is the strength of the bond between the skeletal particles.
We conducted a force decomposition as a local force analysis, with the forces between skeletal grains represented by ordinary forces and those between clay mineral contacts represented by creep forces. In local porewater-rich environments, the clay mineral could dislocate and disintegrate [3,4]. This deformation leads to stress readjustment, and damage to non-clay minerals could occur when the local stress exceeds the bonding capacity. When the abovementioned mesoscopic evolution cycles extensively, rheological deformation at the macroscopic level can be monitored.
Based on the rheological mechanisms, this study adopted a relevant mathematical model [40], which refers to the traditional creep element models. We reflect the physical characteristics of rheology through different functional elastic and viscous elements.
Typically, the time-dependent mechanical behavior of rock or soils could result in a macroscopic hazard, where one can observe a gradual deforming of engineering material. Creep is considered as one of the common time-dependent behaviors. We can separate the creep process into three single stages (e.g., attenuation creep, stable creep, accelerated creep) [24], where the convergence value of attenuation creep is critical to the deformation control of engineering. Considering the good behavior of Burger’s model in the first two stages (attenuation creep, stable creep) of creep, we adopted it in the long-term deformation simulation [40]. Burger’s model combines the characteristics of the Kelvin and Maxwell model [43,44]. Figure 4 shows the major components of Burger’s model. The details are shown in Table 1, and the specific formula derivation is presented by Maheshwari [43].
The linear elastic model is used to model the normal force between skeleton grains. Figure 5 shows the creep-modified model for simulating the viscoelasticity deformation of the rock mass surrounding the caves. The E 3 is the linear elastic modulus of the linear elastic model. We have conducted a detailed model derivation process in a previous study. For easier understanding, we present the mathematical explanation herein.
The governing equations of Burger’s model can be described as
σ + α 1 σ ˙ + α 2 σ ¨ = β 1 ε ˙ + β 2 ε ¨
where
α 1 = η 1 + η 2 E 1 + η 2 E 2 ,
α 2 = η 1 η 2 E 1 E 2 ,
β 1 = η 2 ,
β 2 = η 1 η 2 E 1 .
For a parallel connection, as shown in Figure 5, the strain ( ε c ) and stress ( σ c ) of the creep-modified model become
ε c = ε = ε 3 ,
σ c = σ 3 + σ ,
σ 3 = E 3 ε 3 ,
where ε 3 and σ 3 are the strain and stress of the linear model. By combining Equations (1)–(4), the coupled model can be derived,
σ c + α 1 σ c ˙ + α 2 σ c ¨ = E 3 ε 3 + β 1 + α 1 E 3 ε 3 ˙ + β 2 + α 2 E 3 ε 3 ¨ .
At initial phase ( t = 0, σ = σ 0 ), Equation (5) becomes
ε c ¨ + β 1 + α 1 E 3 β 2 + α 2 E 3 ε 3 ˙ + E 3 β 2 + α 2 E 3 ε c σ 0 β 2 + α 2 E 3 = 0 .
In addition, the initial conditions of strain, stress and creep rate can be described as
ε c = σ E 1 = σ 3 E 3 ,
σ 0 = σ 3 + σ ,
ε c = σ 0 E 1 + E 3 ,
ε c ˙ = σ η 1 + σ η 2 = η 1 + η 2 E 1 σ 0 E 1 + E 3 η 1 η 2 .
Equation (5) can be rewritten as
ε c ¨ + A ε c ˙ + B ε c = C
where A, B and C are parameters related to the properties of the rock mass. By solving the second-order non-homogeneous linear Equation (9), the roots of the eigenequation (i.e., λ 1 and λ 2 ) can be obtained,
λ 1 , 2 = A ± A 2 4 B 2 = η 1 + η 2 E 1 E 3 E 1 + E 3 η 1 η 2 + E 1 η 1 ± [ η 1 + η 2 E 1 E 3 E 1 + E 3 η 1 η 2 ] 2 4 E 1 E 2 E 3 η 1 η 2 E 1 + E 3 2 .
Then, the deformation ( ε c ) can be obtained,
ε c = C 1 e λ 1 t + C 2 e λ 2 t + σ 0 E 3 .
The coefficients of C 1 and C 2 in Equation (11) can be calculated when substituting Equations (6)–(8) into (9), and we obtain
C 1 = η 1 + η 2 E 1 E 3 σ 0 + λ 2 E 1 η 1 η 2 σ 0 λ 1 λ 2 E 1 + E 3 η 1 η 2 E 3 ,
C 2 = η 1 + η 2 E 1 E 3 σ 0 + λ 1 E 1 η 1 η 2 σ 0 λ 2 λ 1 E 1 + E 3 η 1 η 2 E 3 .

2.4. The Discrete Element Analysis Method for Rheological Mechanisms under the Pressure Arches

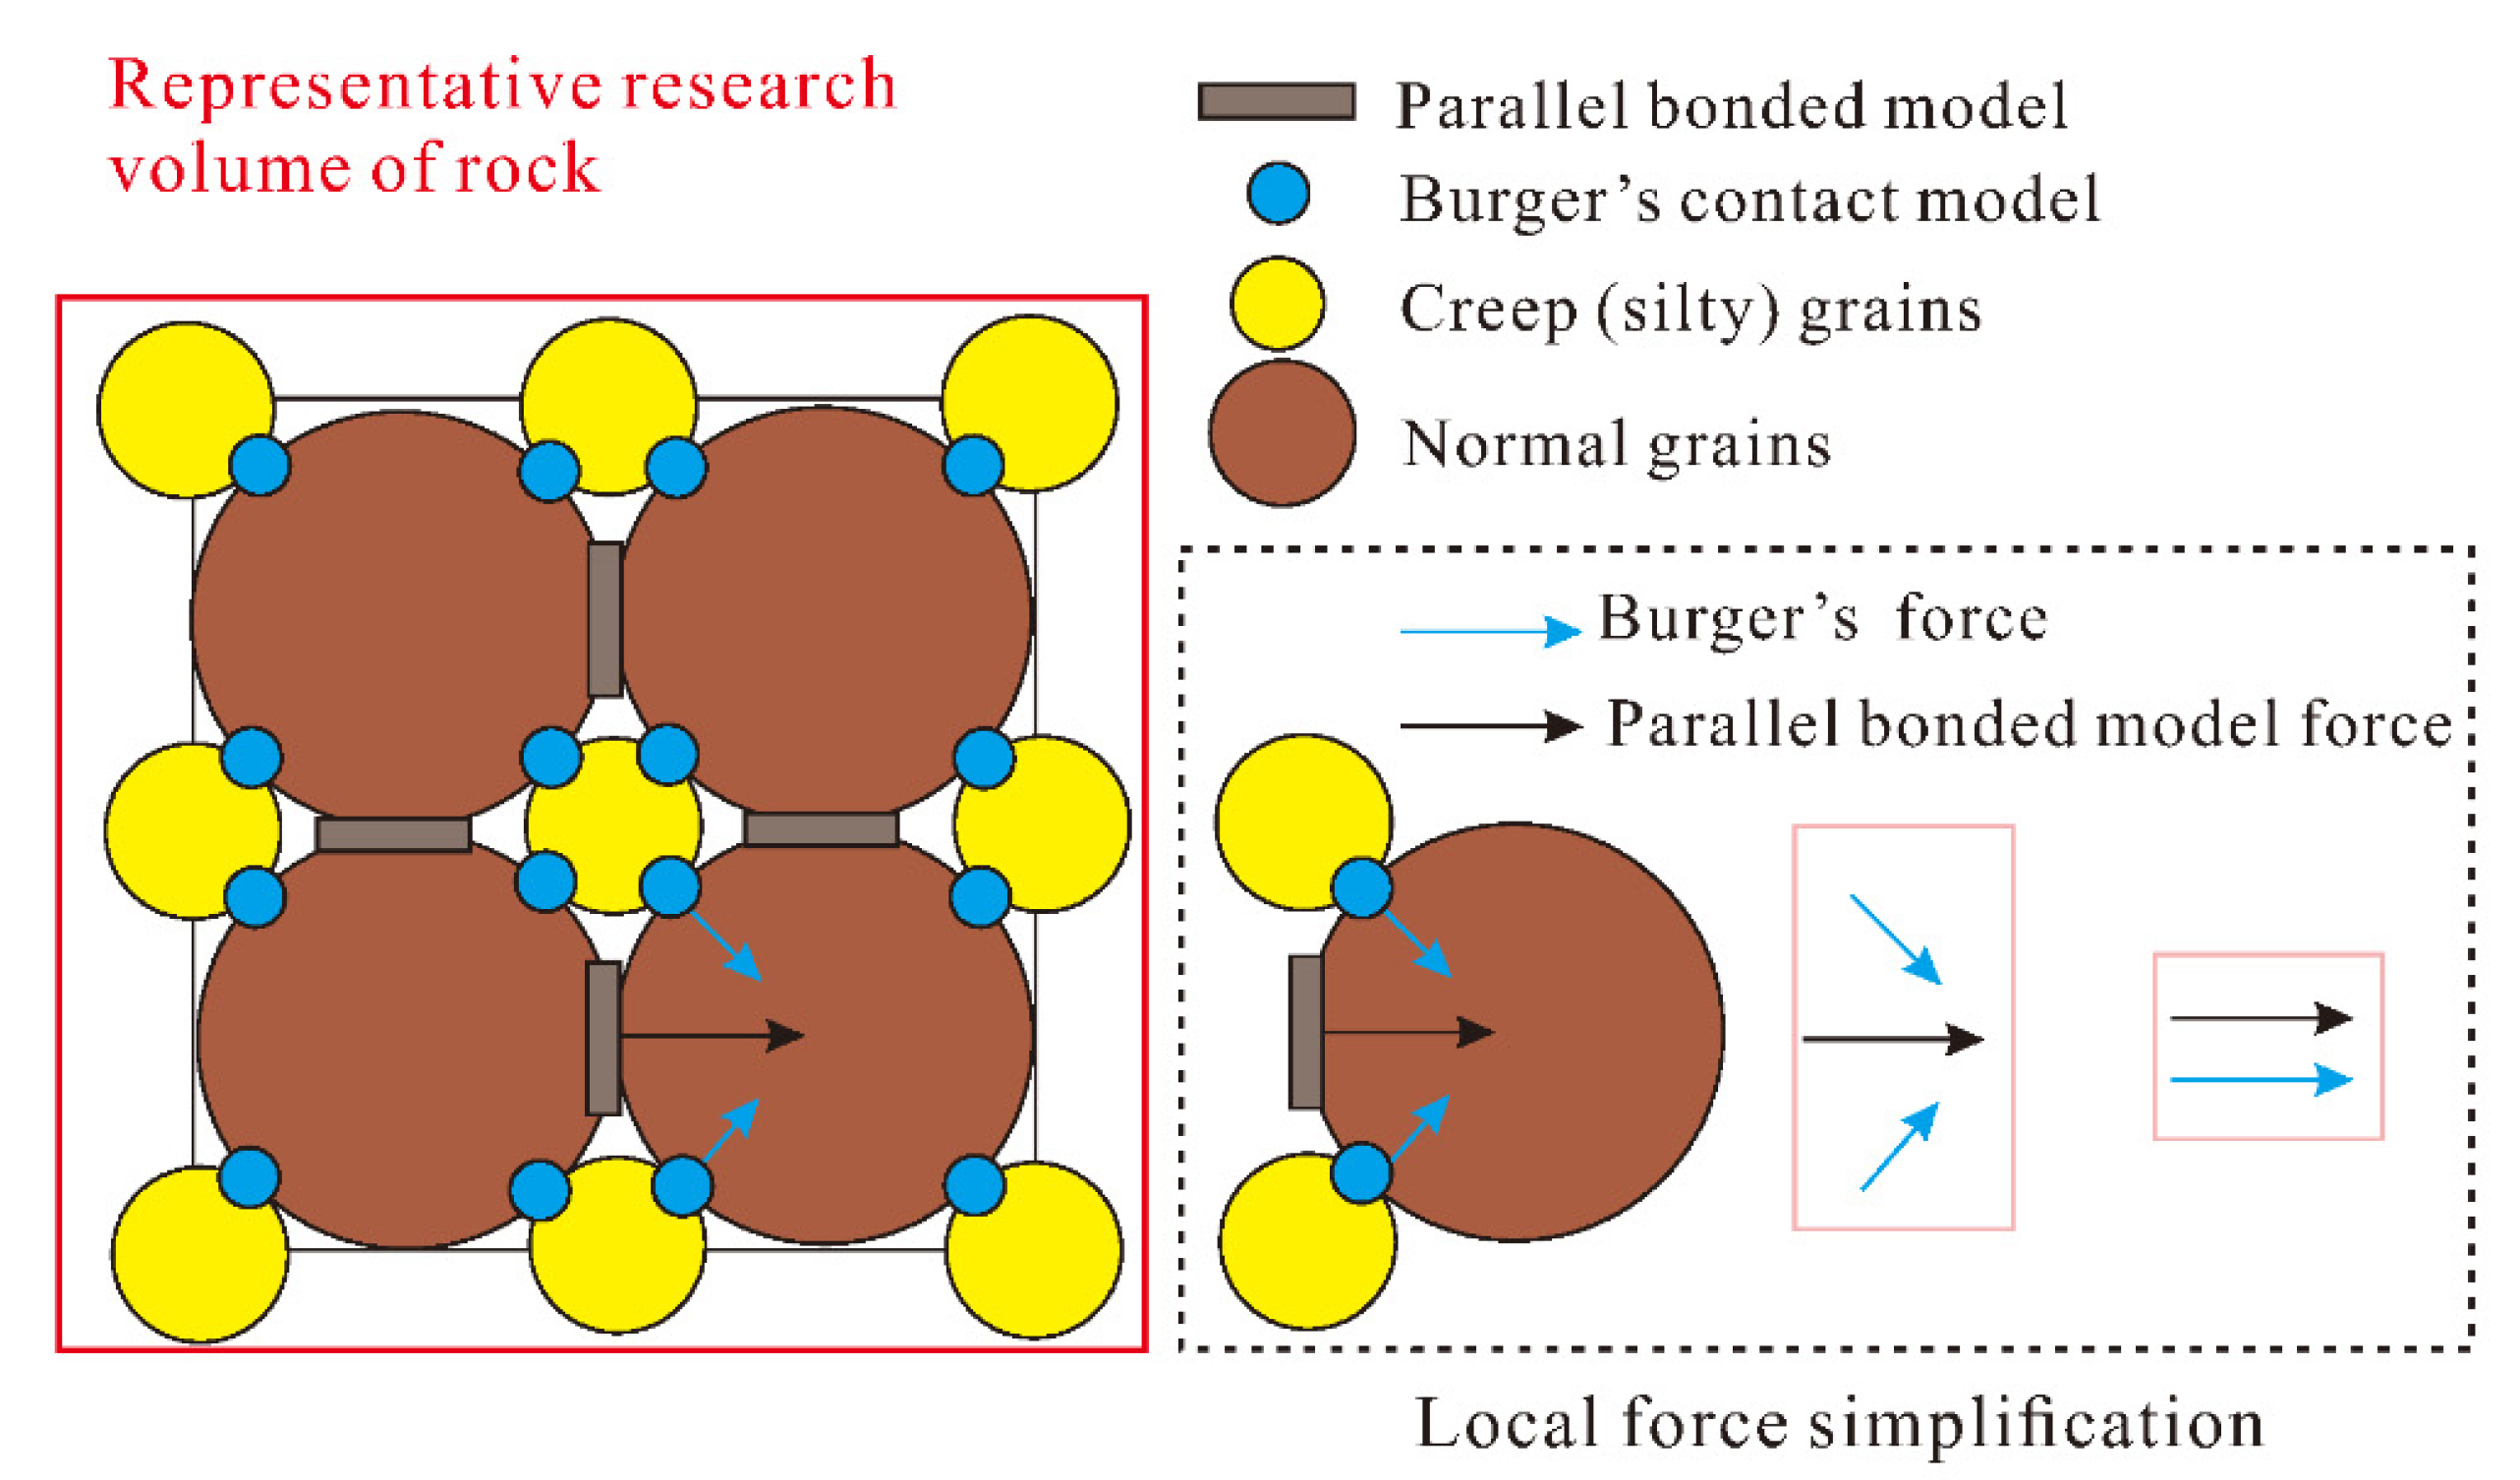
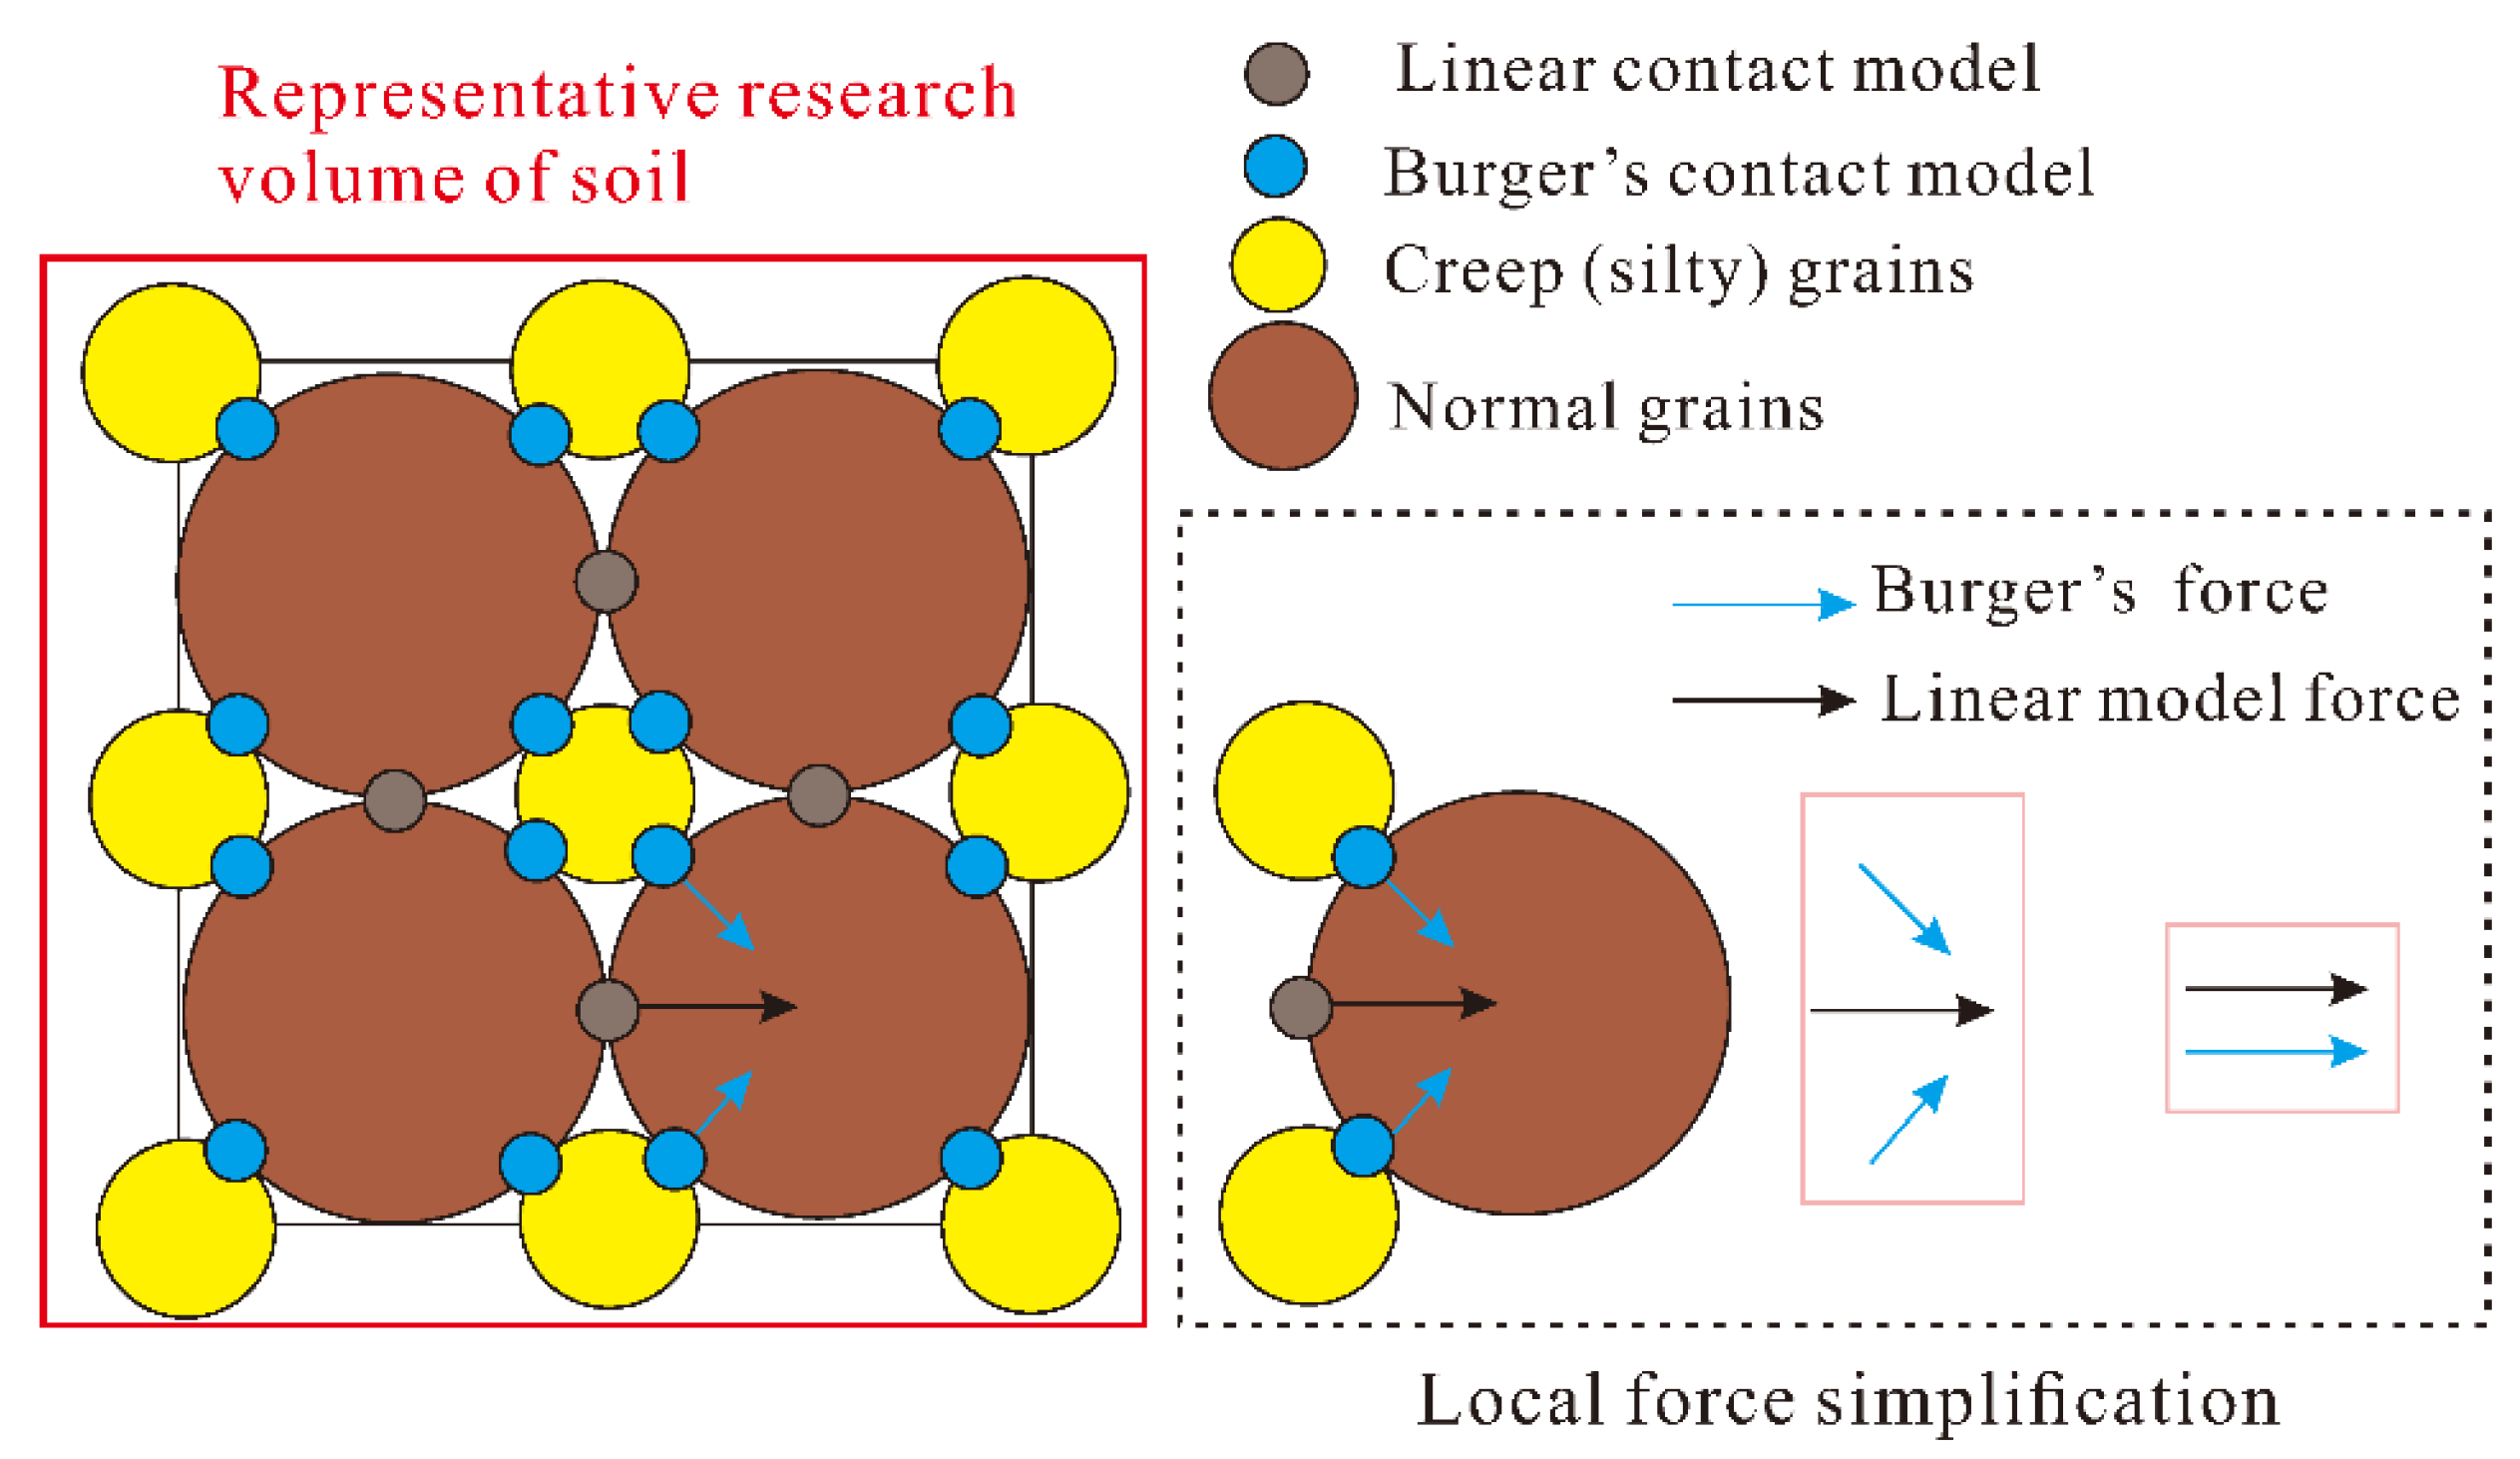
From a mesoscale perspective, we can easy conduct the stability analysis for the self-balance arches and the erosion process of groundwater. The discrete element method (DEM) is a simulation method based on discrete mineral units, which is applicable to the research of this paper. Different simulation scenarios are used for the rock and the soil, where the common parallel bonded model (PBM) and Burger’s model are used for the rock [40] (see Figure 6) and the PBM is replaced by a linear elastic contact model for the soil [45] (see Figure 7). Both the PBM and the linear elastic contact model can be considered linear elastic and applied to the models presented above.
The parallel bonded model (PBM) [40] is used for modeling bonding failure of rock grains based on the bonding parameters, i.e., shear strength σ c , tensile strength τ c , normal stiffness k n , tangential stiffness k s and bonding radius R . That is,
Δ F n = k n A Δ U n ,   Δ F s = k s A Δ U s ,
Δ M n = k s J Δ θ n ,   Δ M s = k n I Δ θ s ,
where F n and F s are the normal and tangential forces, respectively. M n and M s are the normal and tangential moments, respectively. U n , U s ,   θ n , θ s are the relative displacements and rotation angles in the normal and tangential directions, respectively. A , I , J are the area, moment of inertia and polar moment of the bonds section, respectively, which can be described as
A = π R 2 ,
I = 1 4 π R 4 ,
J = 1 2 π R 4 .
The maximum tensile stress and shear stress on the grain surface can be calculated using the following equations:
σ = F n A + M s R I ,
τ = F s A + M n R J .
Mesoscopic damage of bonds occurs when σ σ c or τ τ c as shown in Figure 2. The values of σ c and τ c determine the mechanical capacity of cementation, which is calibrated according to the peak strength of the rock sample.
In the DEM, the mechanical model is composed of the granular unit and the contact model. We show the representative unit in Figure 6, where the brown particles are skeletal grains; the yellow particles are clay minerals; the blue contact is the Burger’s model and the gray rectangular bond is the PBM. The loading analysis of a group of particles is presented in Figure 6. The creep force and the PBM contact force act on the skeletal particles’ surface in the normal direction, and a parallel force pattern is obtained after vector processing. This force pattern is exactly the force pattern of the rheological element model described above.
For soils in the karst region, the rheological process is similar. The difference is that the bonding force in soils is very weak compared to rocks, so the linear elastic contact model is used in this paper instead of the PBM in rocks (see Figure 7), which results in a rheological model for soils.

3. Results and Discussion

3.1. Case Study

3.1.1. Overview of the Selected Case Study

The selected engineering case is a foundation in the coastal karst area of southeast China. The foundation field is in a subtropical coastal area with a maritime subtropical monsoon climate, characterized by warm and rainy conditions, abundant light and long summers. The site is a typical karst landscape, and the strata host many caves and are rich in groundwater. Figure 8 illustrates the excavation of the foundation pit. The stratum in the area consists of fill, medium to coarse sand, clay and limestone. The limestone stratum is rich in cavities. Note that the locations and structures of sinkholes were determined by borehole detection and ultrasonic detection. The model is a 2D case study, and the caves are approximated using the geological longitudinal section profiles, which are provided by the Beijing Municipal Engineering Design and Research Institute Co.

3.1.2. Excavation Deformation Monitoring Data

The red dashed line in Figure 8 indicates the boundary pattern of the excavated pit. The deformation monitoring was conducted after excavation. The displacements were monitored by a Leica TS09 total station, a SOKKIA SDL1X level and a GT560 readout. In total, 63 vertical displacements were monitored at the top of the slope, and the monitoring data for selected sections are listed in Figure 9 in this paper. The settlement displacements underwent a period of near uniform accumulation followed by a convergence phase.

3.1.3. Rock and Soil Parameters and the DEM Model

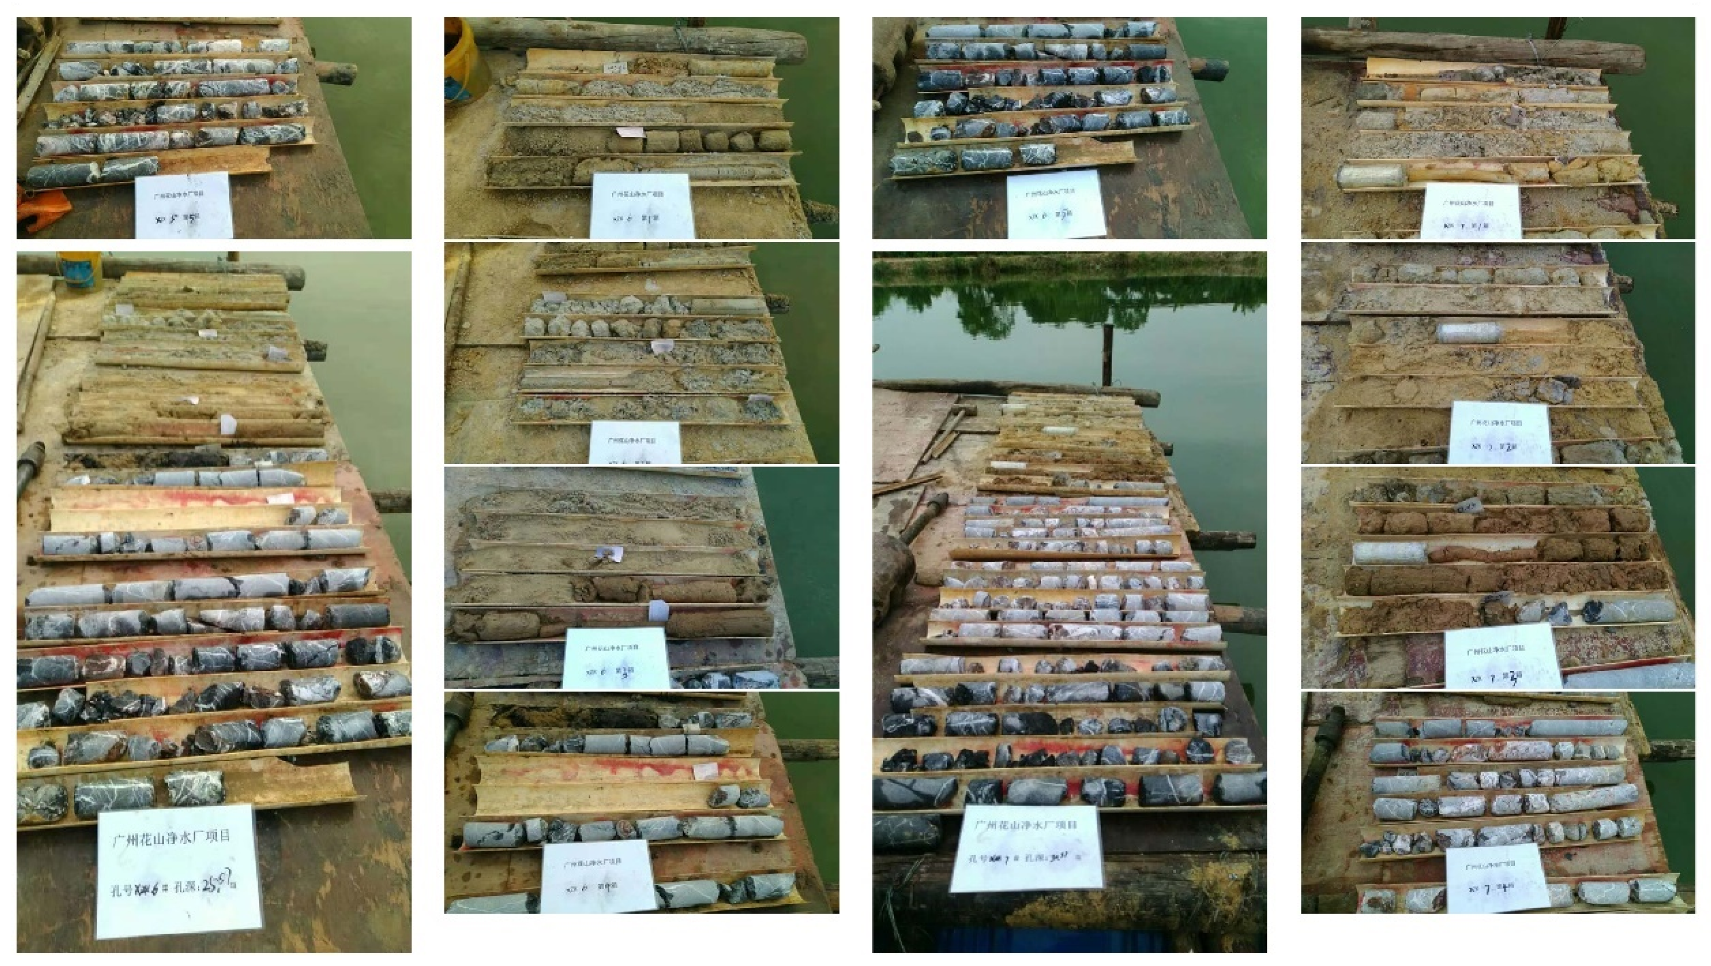
Extensive exploration work was carried out at the engineering investigation site. Figure 10 shows the collected borehole samples with a sampling interval of 2.0 m, and the testing process has included in situ testing and indoor testing. Standard penetration tests with a spacing of 2.0 m for general clay, sand and chalk layers were conducted; static probing or cross-plate shear tests were added for thick layers of soft soils. Indoor tests were carried out on the rocks in 52 sets of compressive tests, and the test procedure was carried out according to ISRM standards. The geotechnical parameters obtained are shown in Table 2 and Table 3.
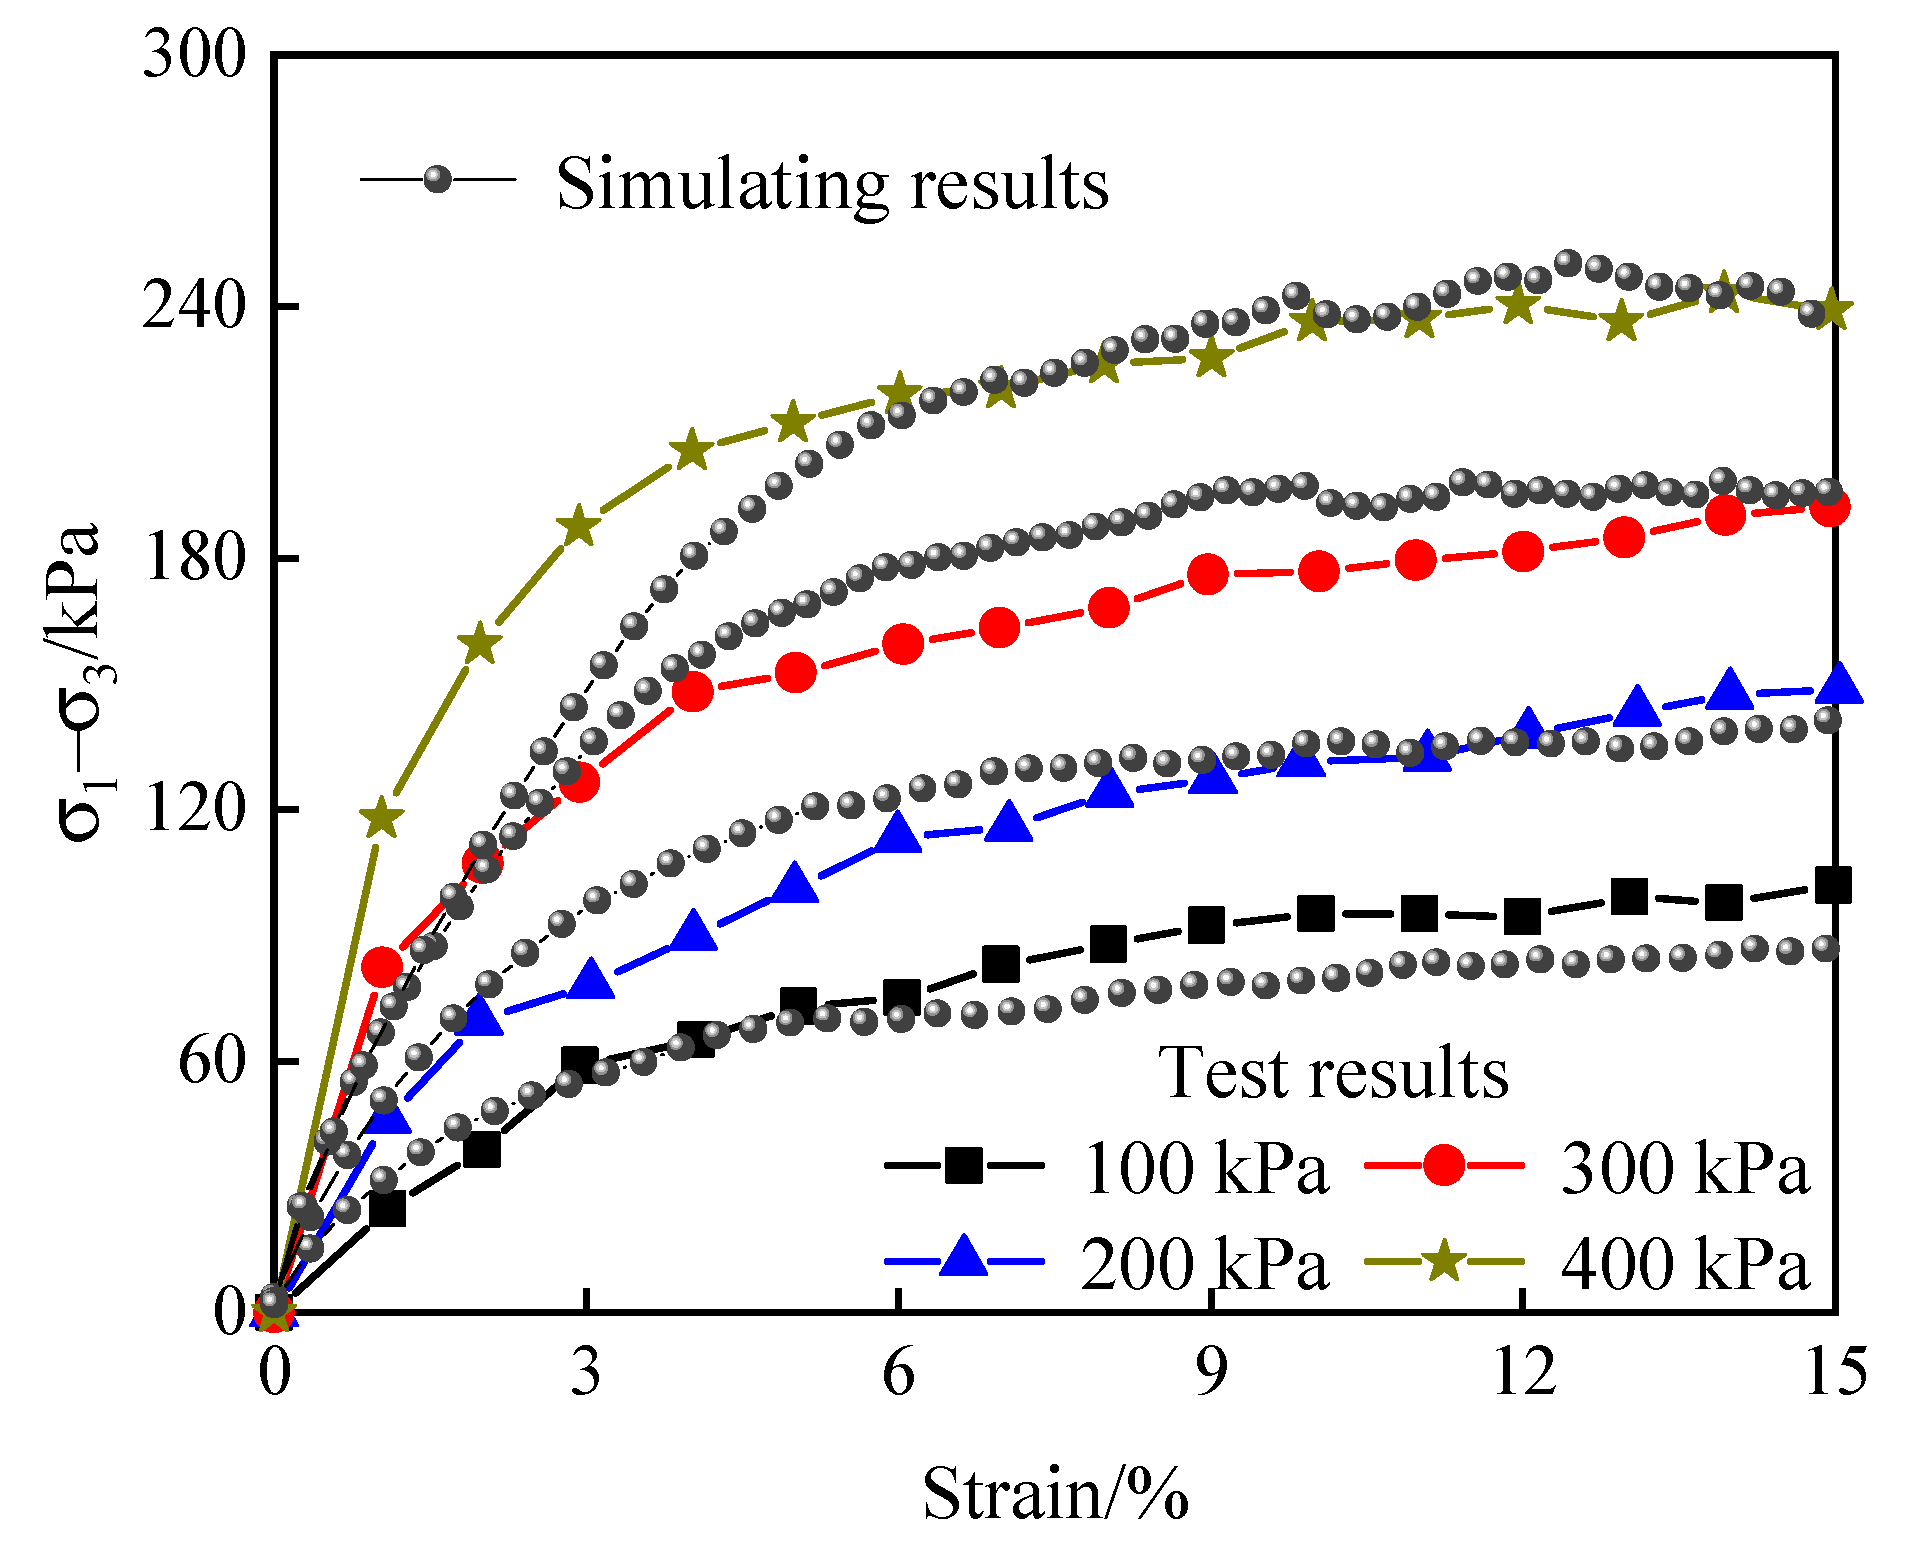
Some triaxial drained compression tests were carried out to calibrate soils’ mesoscopic parameters, and the testing equipment adopted for this research is the TSZ10 Automated Triaxial Instrument. It is an automatic servo compression instrument. The maximum vertical and horizontal stresses applied to the specimen were 3000 kPa and 1500 kPa, respectively. The vertical force was captured by a rigid load cell, and the error was limited within 0.2 N. The lateral stresses were measured by pressure transducers. In addition, the axial strain was captured by the upper and lower transducers with an accuracy of 0.0005%. The testing procedures complied with the details from Lo Presti and Pallara et al. [46]. The prepared samples were adopted from layers “filled soil” and “silty clay”, which were consolidated to 100, 200, 300 and 400 kPa. The axial stress increased with a strain rate of 0.01%/min, and the confining pressure increased to keep the lateral displacement constant. The loading force was applied when the pore pressure had dissipated, and the test was halted when the axial strain rose to 15%. The stress–strain curves from triaxial drained compressions are presented in Figure 11 and Figure 12.
The DEM parameters’ calibration is essential to the modeling results. In this paper, we have calibrated the properties of modulus, strength and viscosity coefficients.
Before the calibration, we have to explain the general parameters’ selection process. According to Figure 8, the boundary of foundation is 127 m × 40 m. As there is no severe deformation, we select 150 m × 50 m as the model boundary to improve the calculating efficiency. The grains’ size could affect both the deformation and calculating efficiency according to the results published by Al-Halbouni et al. [1,18]. Based on the relevant studies, in a general case, when the ratio of model length to grain size is greater than 68 [47] or the number of grains is larger than 15,000 in a 3D model [48], the accuracy and efficiency would be reasonable. In this paper, the number of grains is 27,863 after excavation, and the ratio of model length to grain size is greater than 400, which falls within the requirement. Then, the density of soils “filled soil”, “medium coarse sand” and “silty clay” are assigned as 1850 kg/m3, 2000 kg/m3 and 2000 kg/m3, respectively, according to Table 2. The damping coefficient in the DEM modeling process plays a role in controlling calculating stability, so we select this value as 0.5 according to a general searching of relevant studies [40,49]. The ratio of normal to shear stiffness effects the Poisson ratio of the material, which is not so important in this modeling scenario, and we select this as a general value of 1.2.
The abovementioned calibration is relevant to general parameters. Herein, we will explain the specific mesoparameters’ calibration process of soils and rocks in the modeling process. First, according to the obtained stress–strain curves in Figure 11 and Figure 12, we need to consider the calibration with a “trial and error” process. The practical procedure can be described as follows:
(1)
Select models’ modulus, friction angle, tensile and cohesion strength according to the experience.
(2)
Alter the modulus based on stress–strain curves or rock strength.
(3)
Alter the tensile and cohesion strength according to rock strength.
(4)
Change the friction angle according to soils’ ultimate stress in the stress–strain curves.
(5)
Repeat (2)~(4) to obtain a reasonable result.
Note that, due to different properties between rock and soil, we select the PBM for rock and the linear model for soil. For rock material, we calibrate the parameters according to procedures (1), (2), (3) and (5), and we use (1), (2), (4) and (5) to calibrate the soils’ parameters.
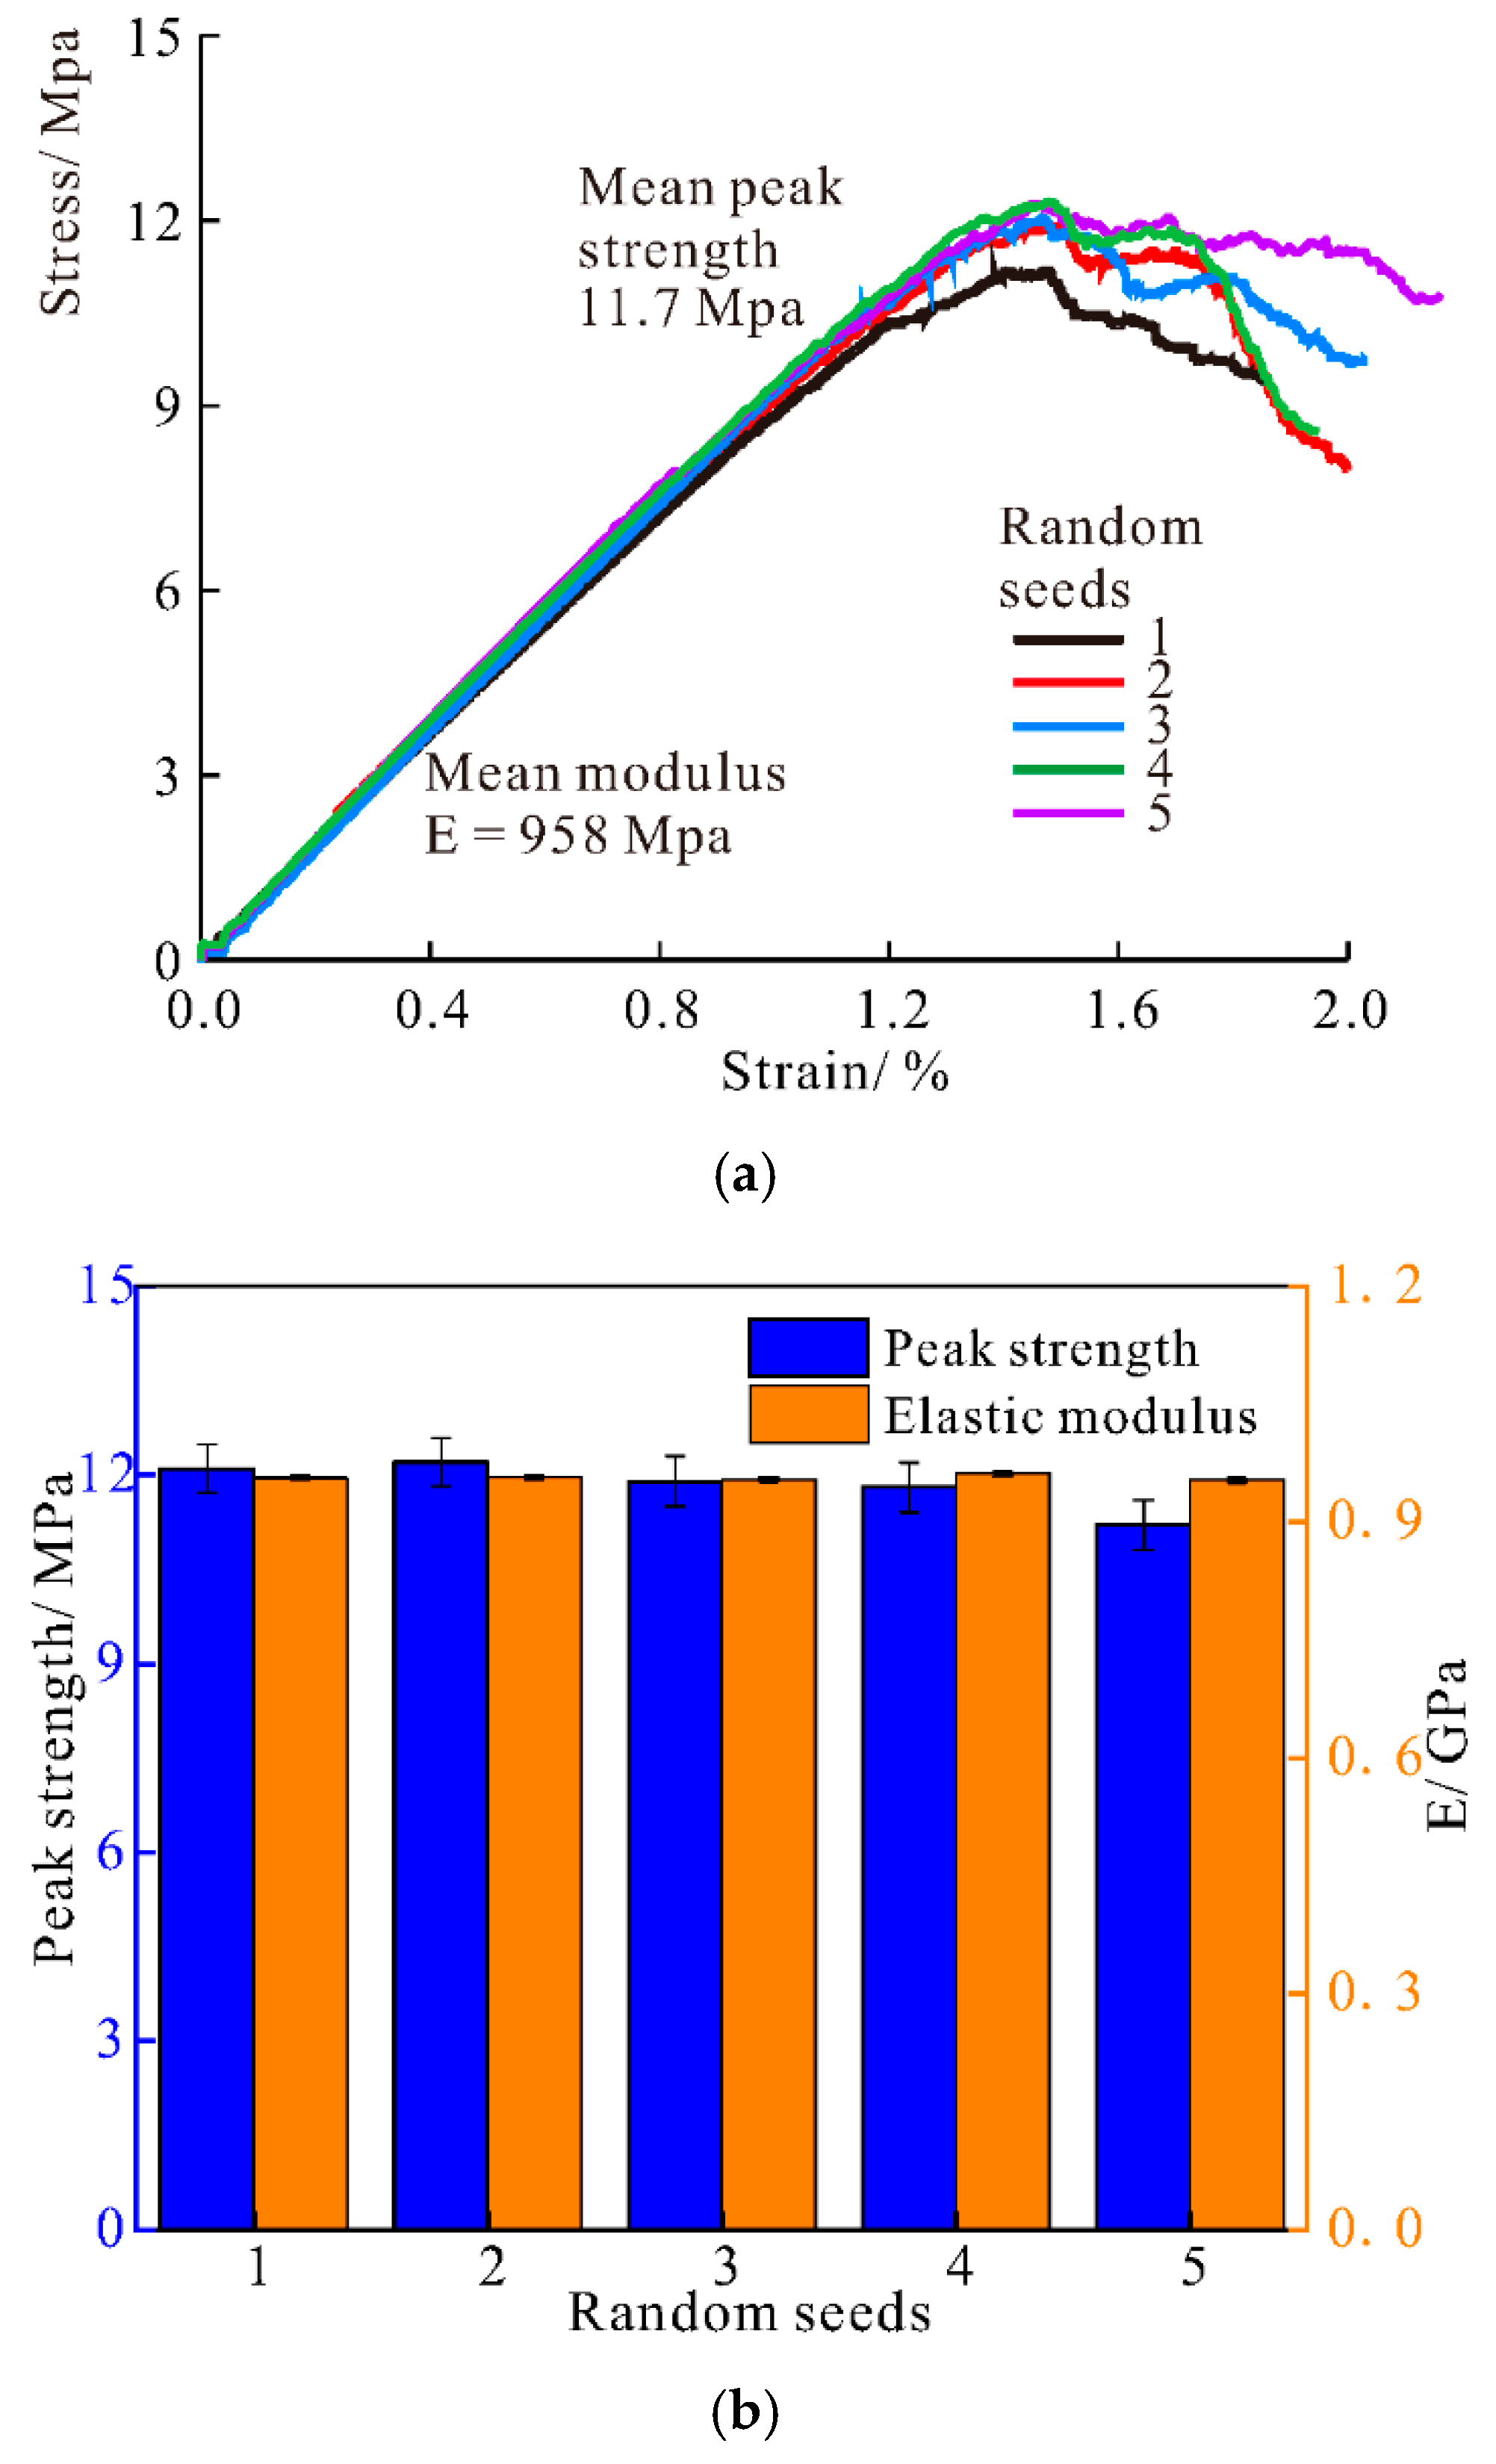
In the calibrating process of rock material, because of the shallow depth, we only need to consider the modulus and strength, and the confinement is neglected. However, the soil is calibrated using the linear model, which is much more sensitive to the confinement, so we conducted the overall calibration to soil. The calibration results of soil are presented in Figure 11 and Figure 12, where we can find a reasonable stress–strain curve restoration. Additionally, the calibration result of rock with PBM is presented in Figure 13.
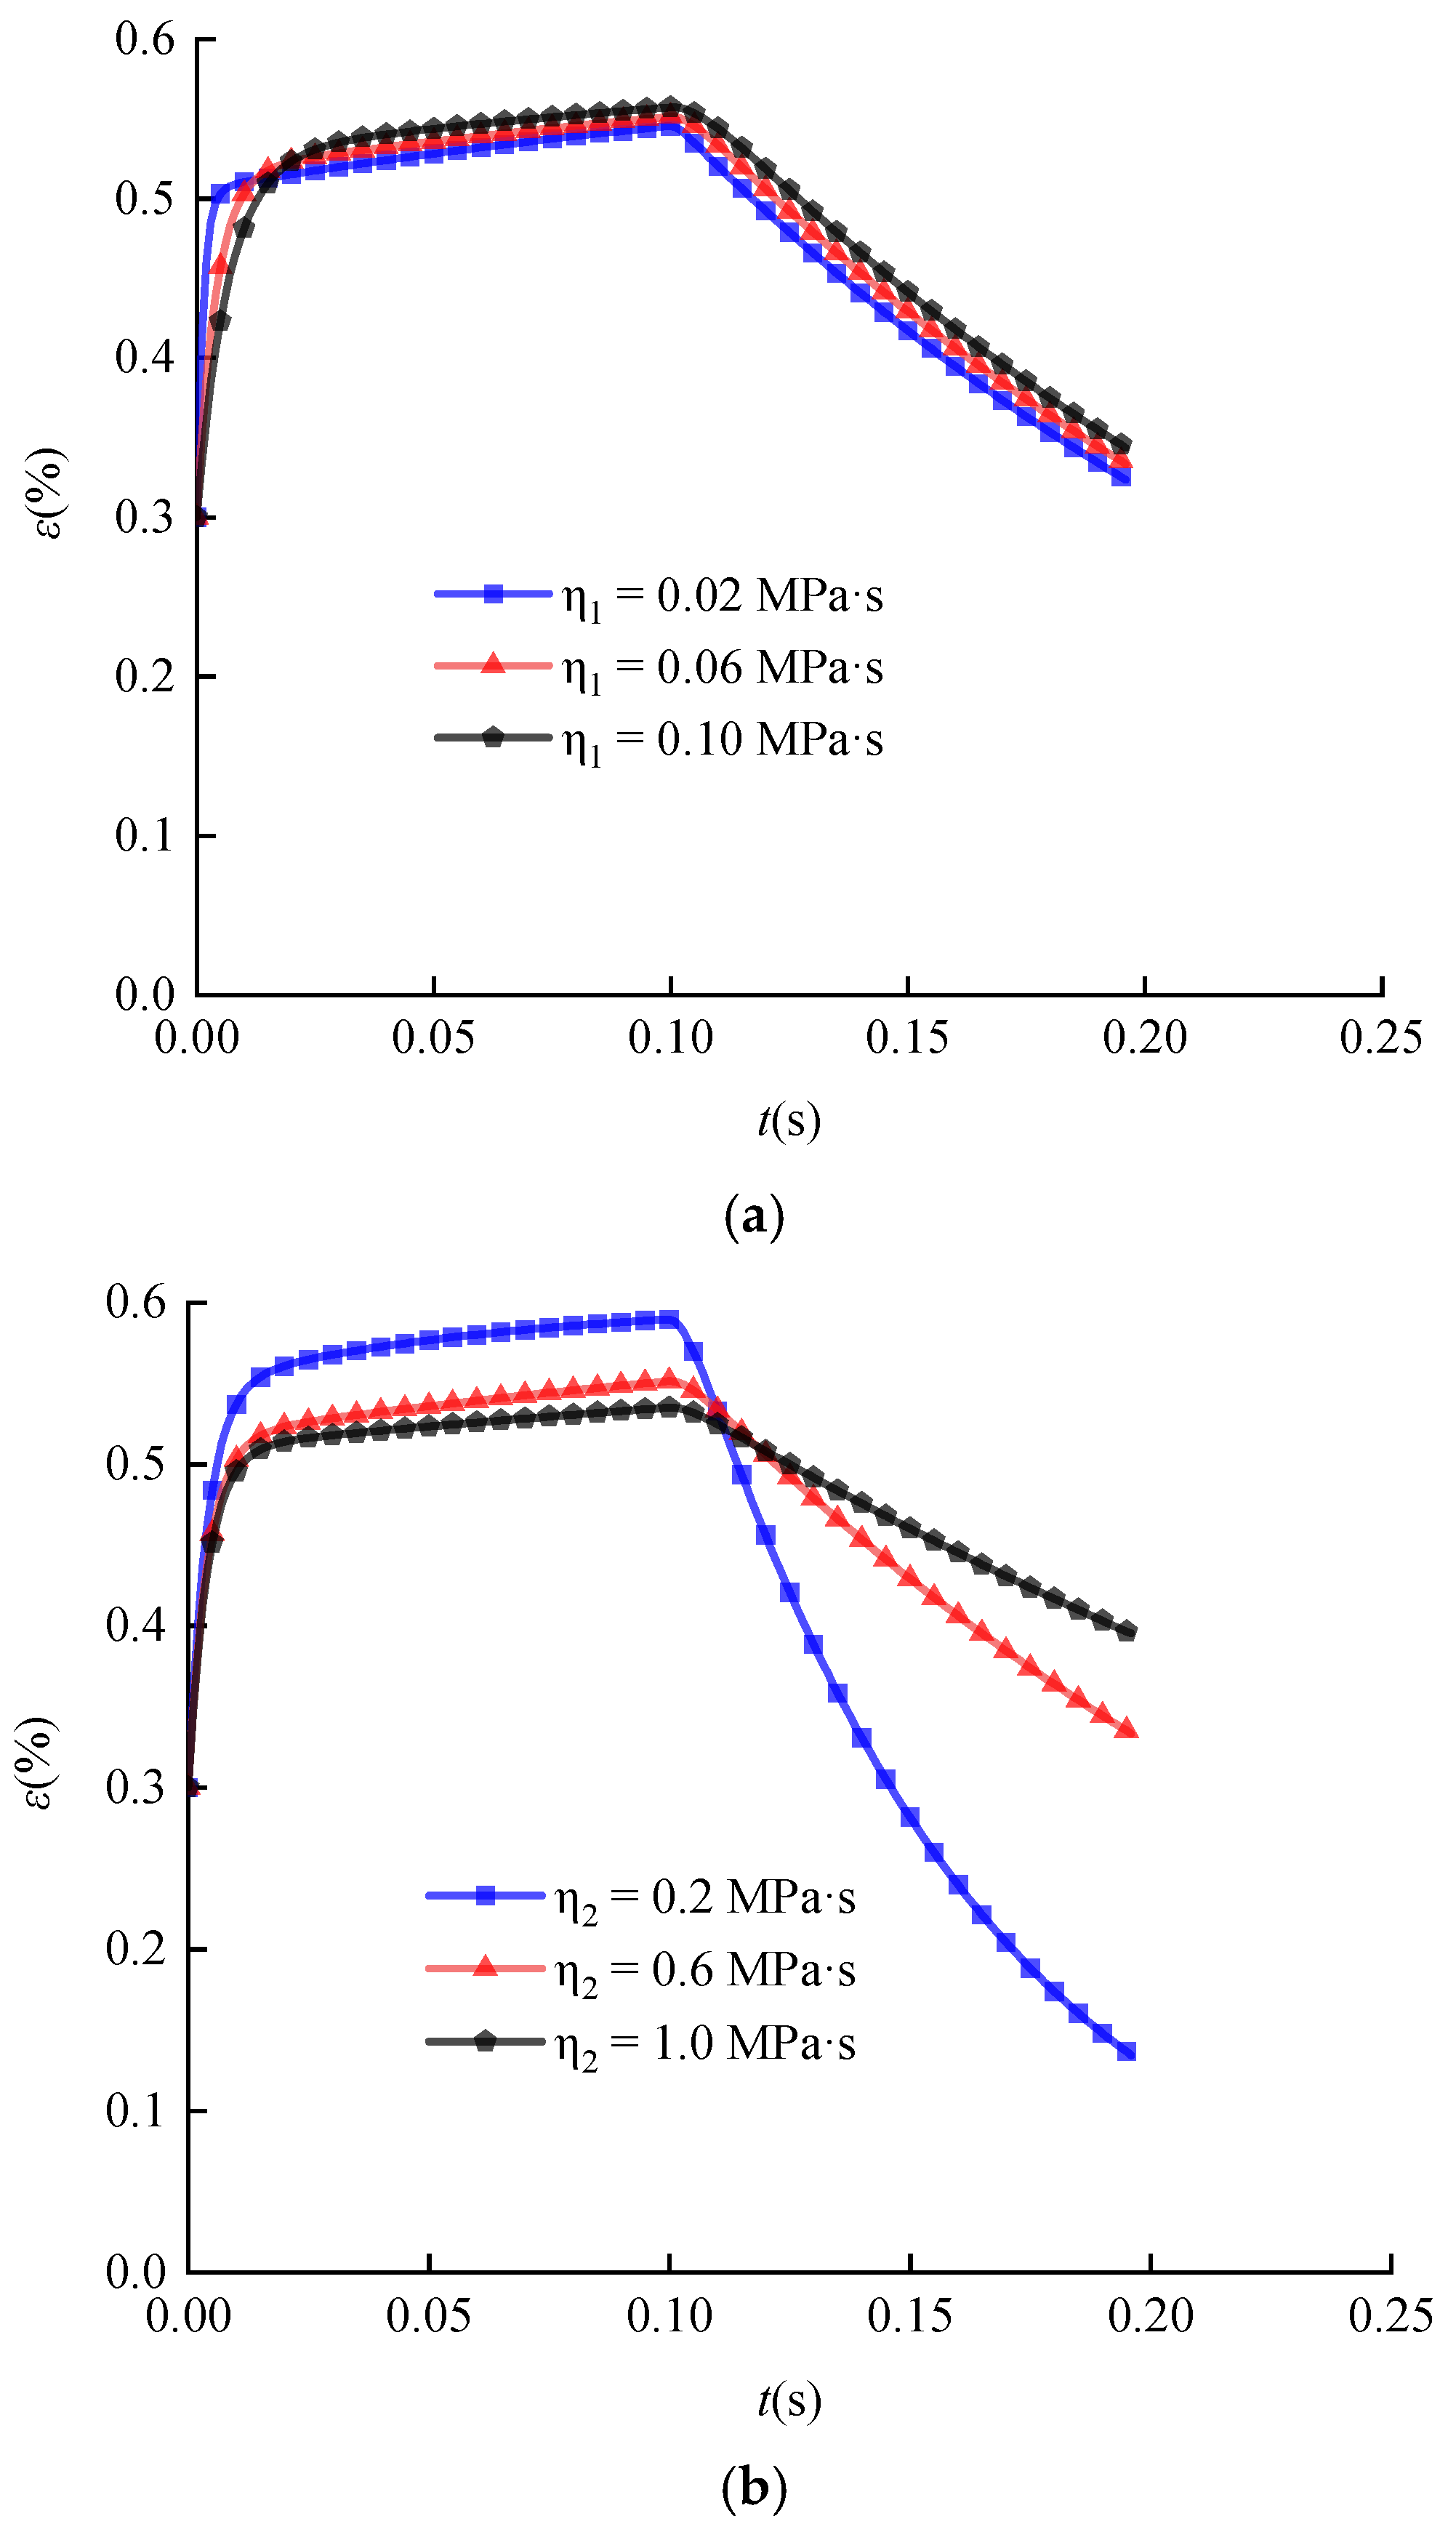
Considering the time-dependent evaluation of sinkholes, we have adopted Burger’s model to simulate the creep process. In Section 2.2, we have explained the coupling mechanism, and the qualitatively equivalent model in Figure 5 formed a new solution for this paper. The time-dependent calibration process is dependent on Equation (13), where five parameters, E 1 , E 2 , E 3 , η 1 and η 2 , determine the results. As the modulus parameters E 1 , E 2 and E 3 are also relevant to the abovementioned calibration, we keep them constant in the time-dependent calibration process, and the viscosity coefficients η 1 and η 2 are considered here. The effects of changing E 1 , E 2 and E 3 are presented in the Discussion. According to Equation (13), we can obtain the numerical mechanical curves by assigning some specific parameters (see Figure 14). It can be found from Figure 14 that the time-dependent behavior of material using Burger’s model is sensitive to parameter η 2 , while the influence of parameter η 1 is negligible. Therefore, we can conduct a similar “trial and error” repeating process to obtain a reasonable modeling result. Some deforming curves of the foundation using different values of η 2 are presented in the Discussion.
The calibrated parameters’ results are listed in Table 4.
The DEM model was established based on the geological parameters. Figure 15 shows the initial state of the model, where we adopted the PBM coupled with Burger’s model to simulate the limestone, and for the soil stratum, we used the linear contact model coupled with Burger’s model. Three stress measurement points are arranged in the model (see Figure 15). Note that all the sinkholes in this paper are modeled by deleting grains, and the excavation of foundation was conducted when the calculating system was balanced. The detailed 2D geological longitudinal section profile is provided by the Beijing Municipal Engineering Design and Research Institute Co. We designed the numerical model strictly according to the primitive geological profile, and the positions and shapes of caves in this area are captured by intensive boreholes and ultrasonic detecting results. The ground probing method is not the focus of this study, so we give the final geological profile directly herein.

3.2. The Mesoscopic Mechanical Characteristics under the Self-Balanced Pressure Arch

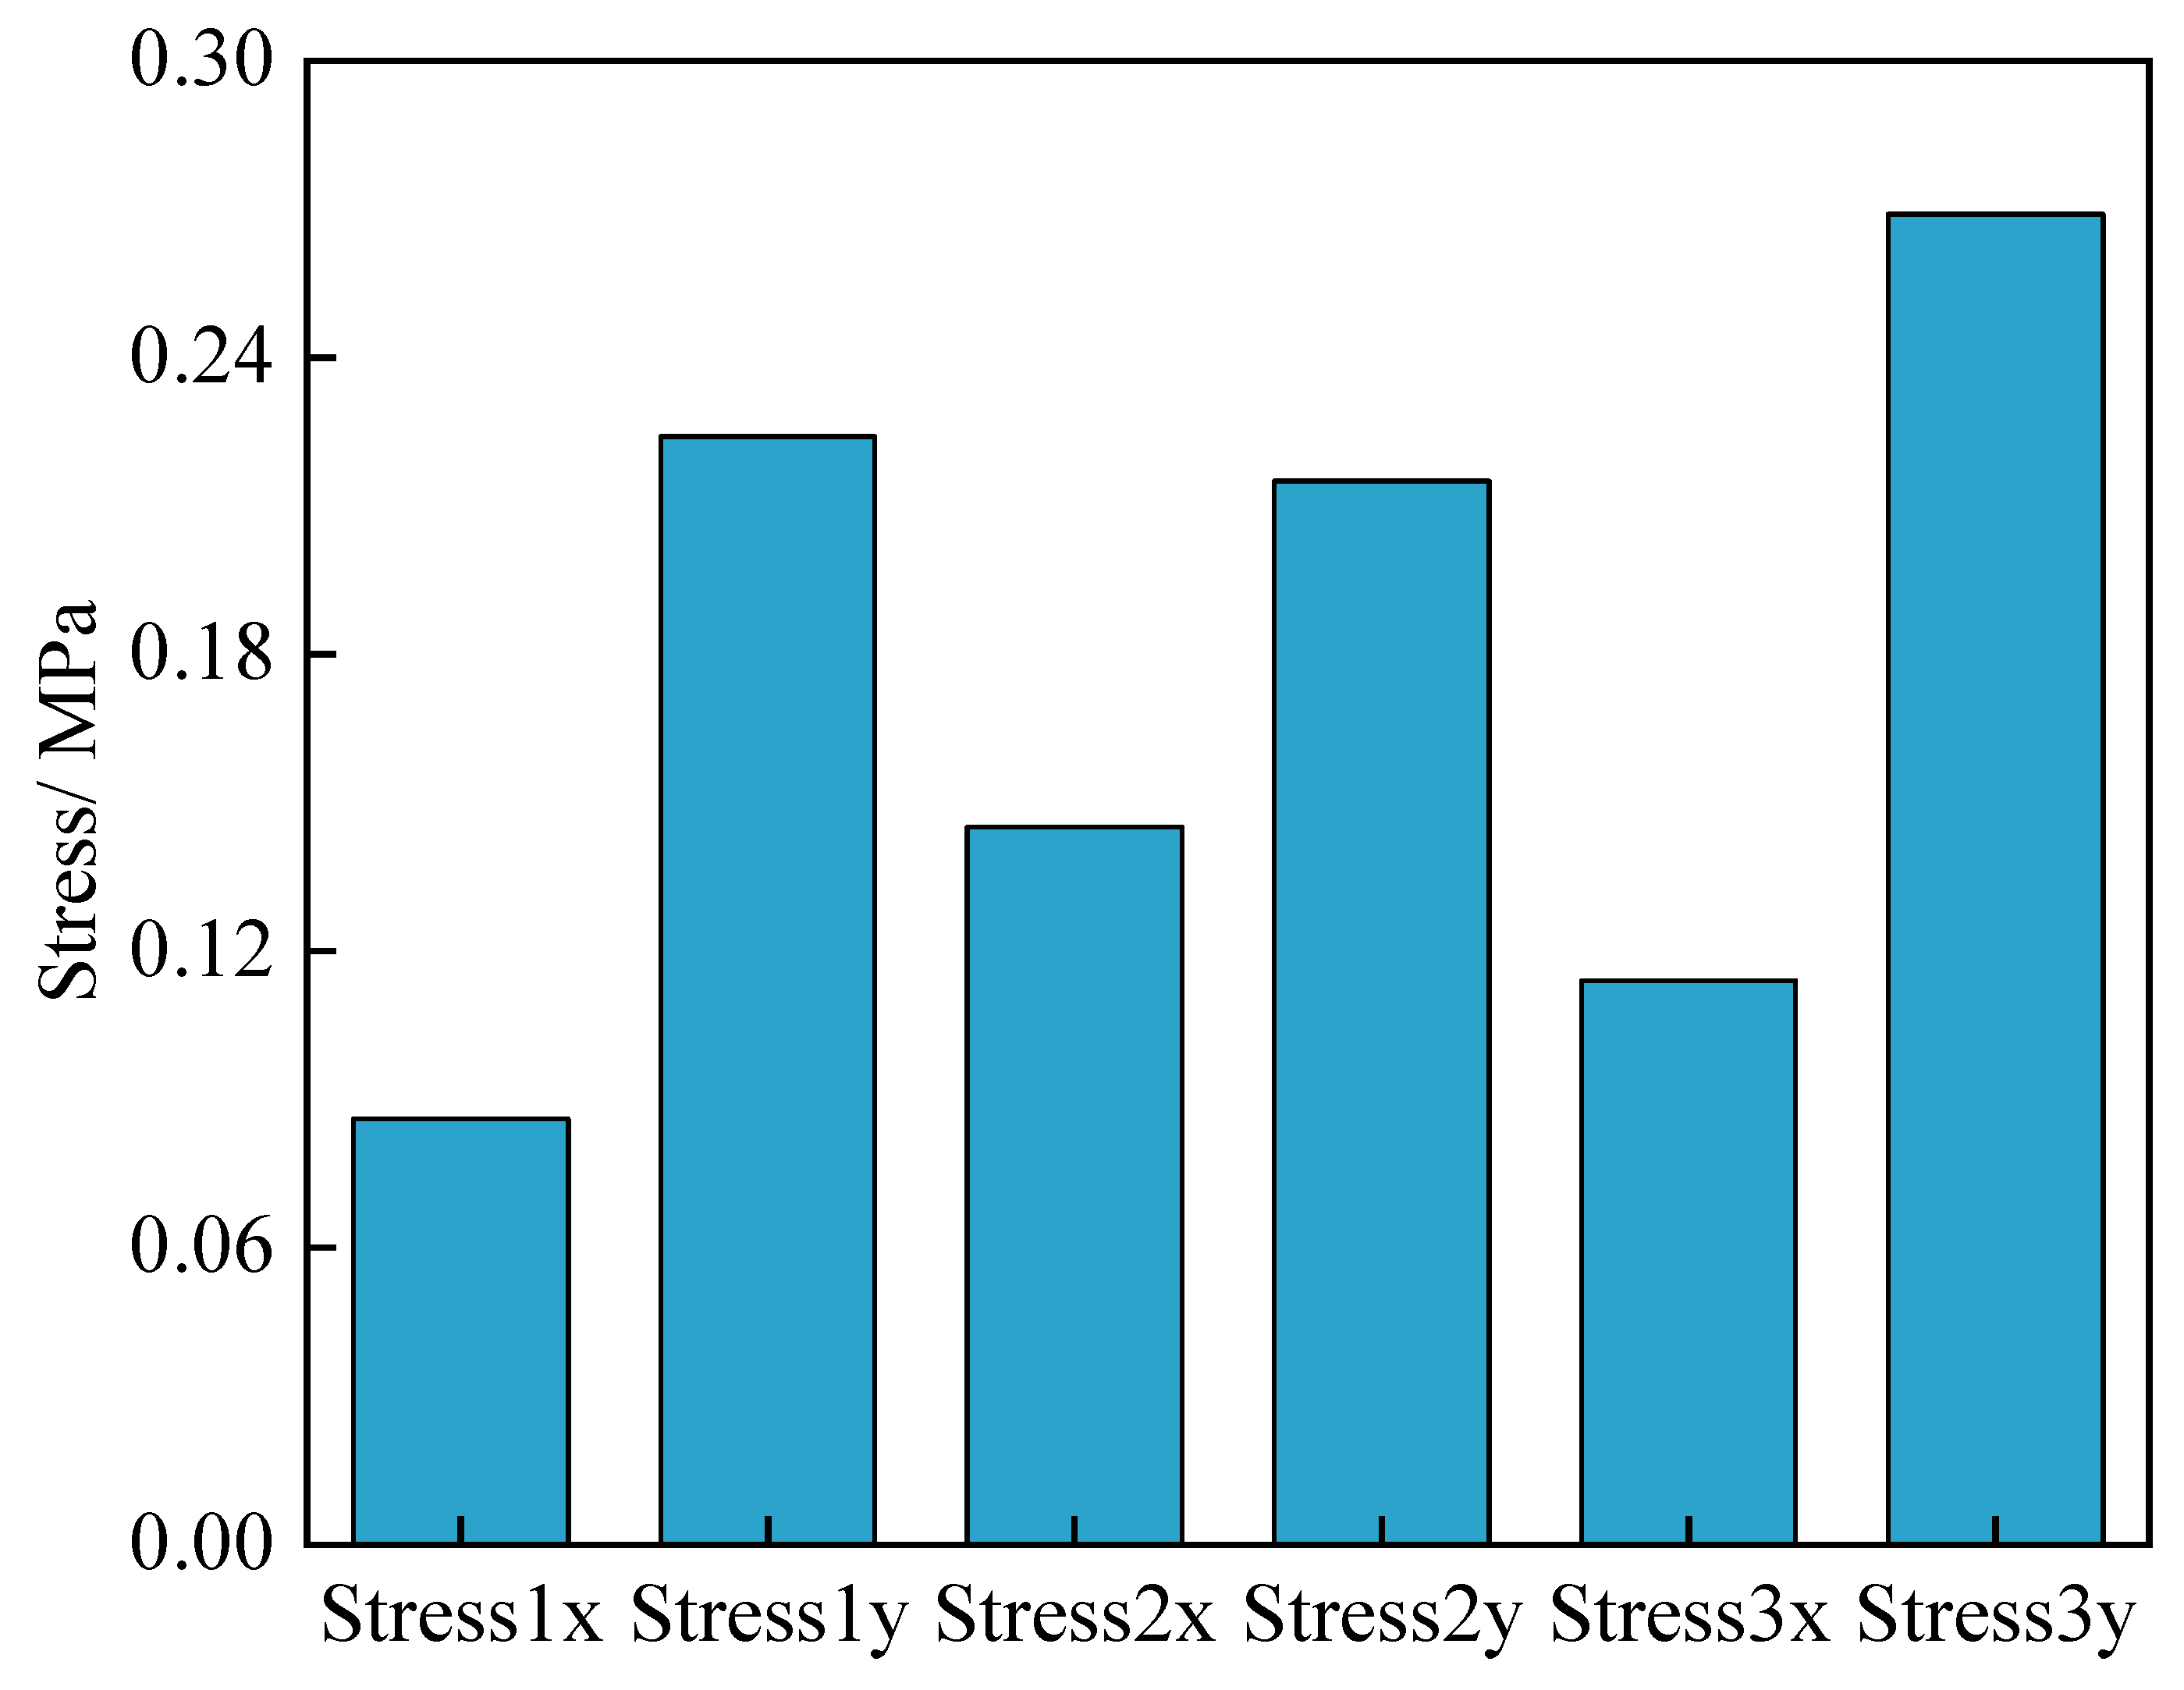
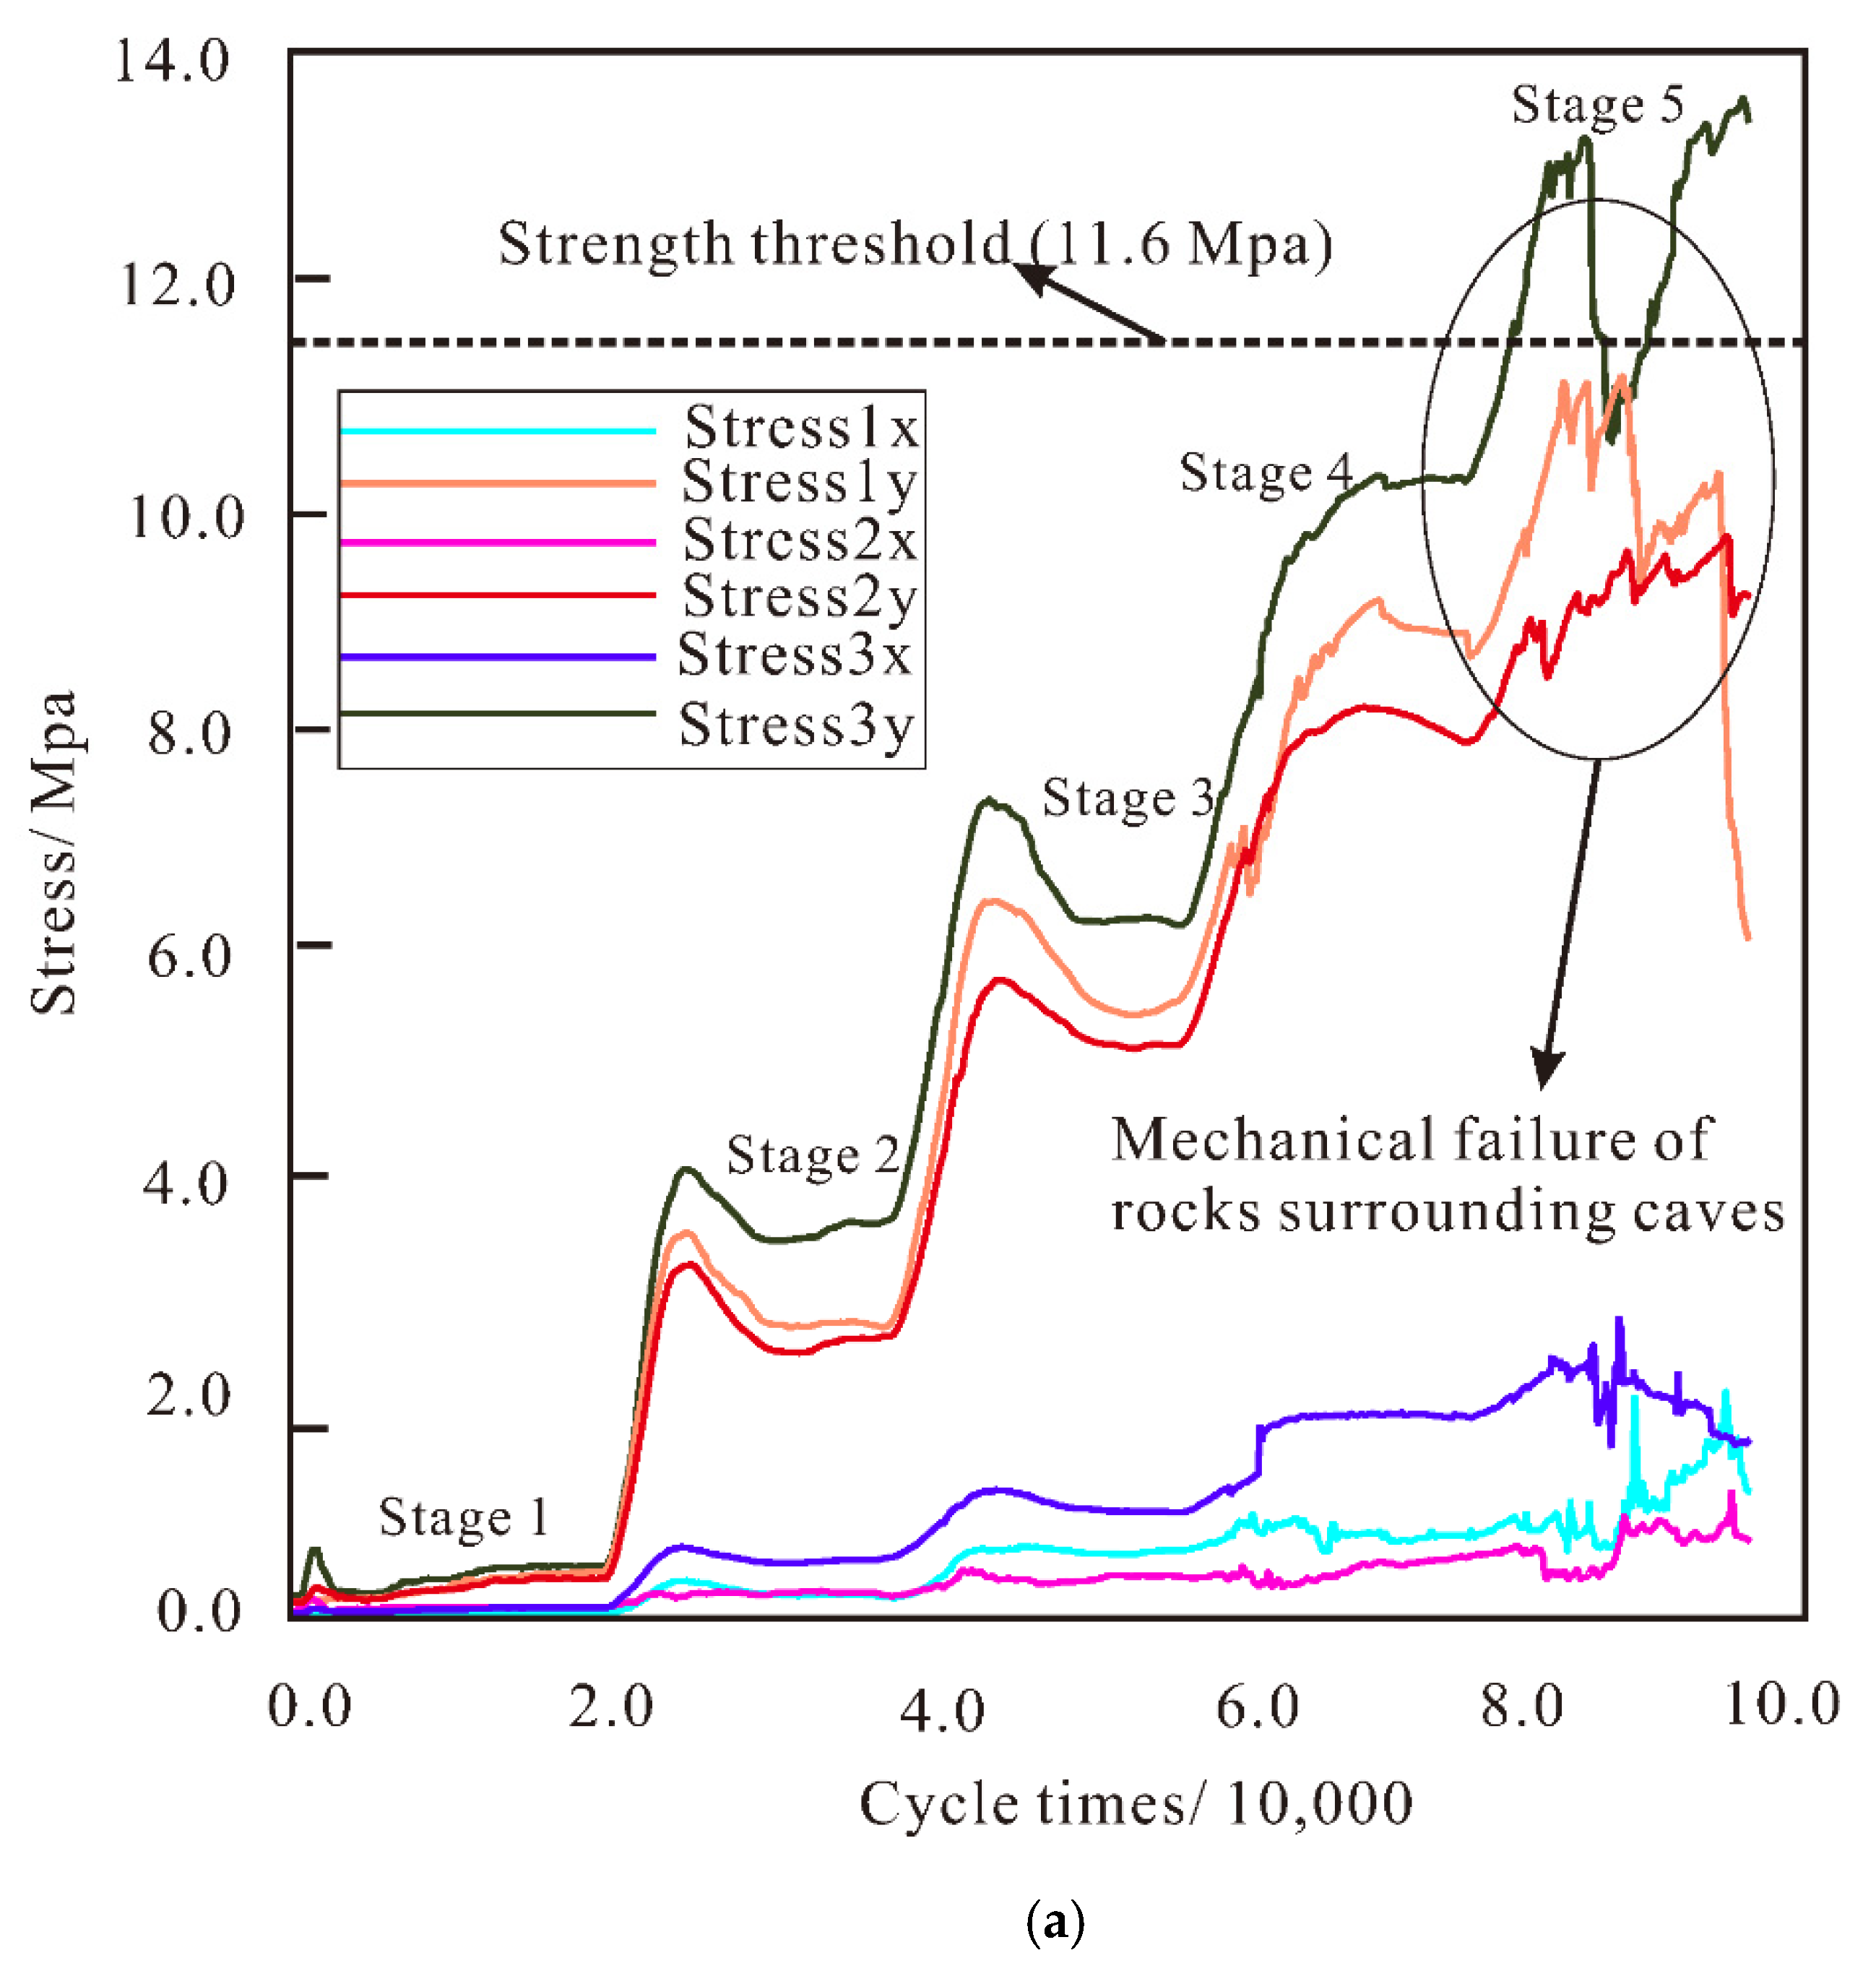
The pressure arches cause local stress concentrations, and this force may cause mesoscopic damage. Based on the stress measurement circle in Figure 15, the convergent stress values are presented in Figure 16. Note that the “Stress X” and “Stress Y” represent the horizontal and vertical stress, respectively. These stresses were obtained using the measurement circle in PFC. The strength of the cavern limestone stratum in this paper is 11.6 MPa, while the monitored stresses are all less than 0.3 MPa (well below the strength of mineral bonds), so the self-balanced arches in this case study remain stable.
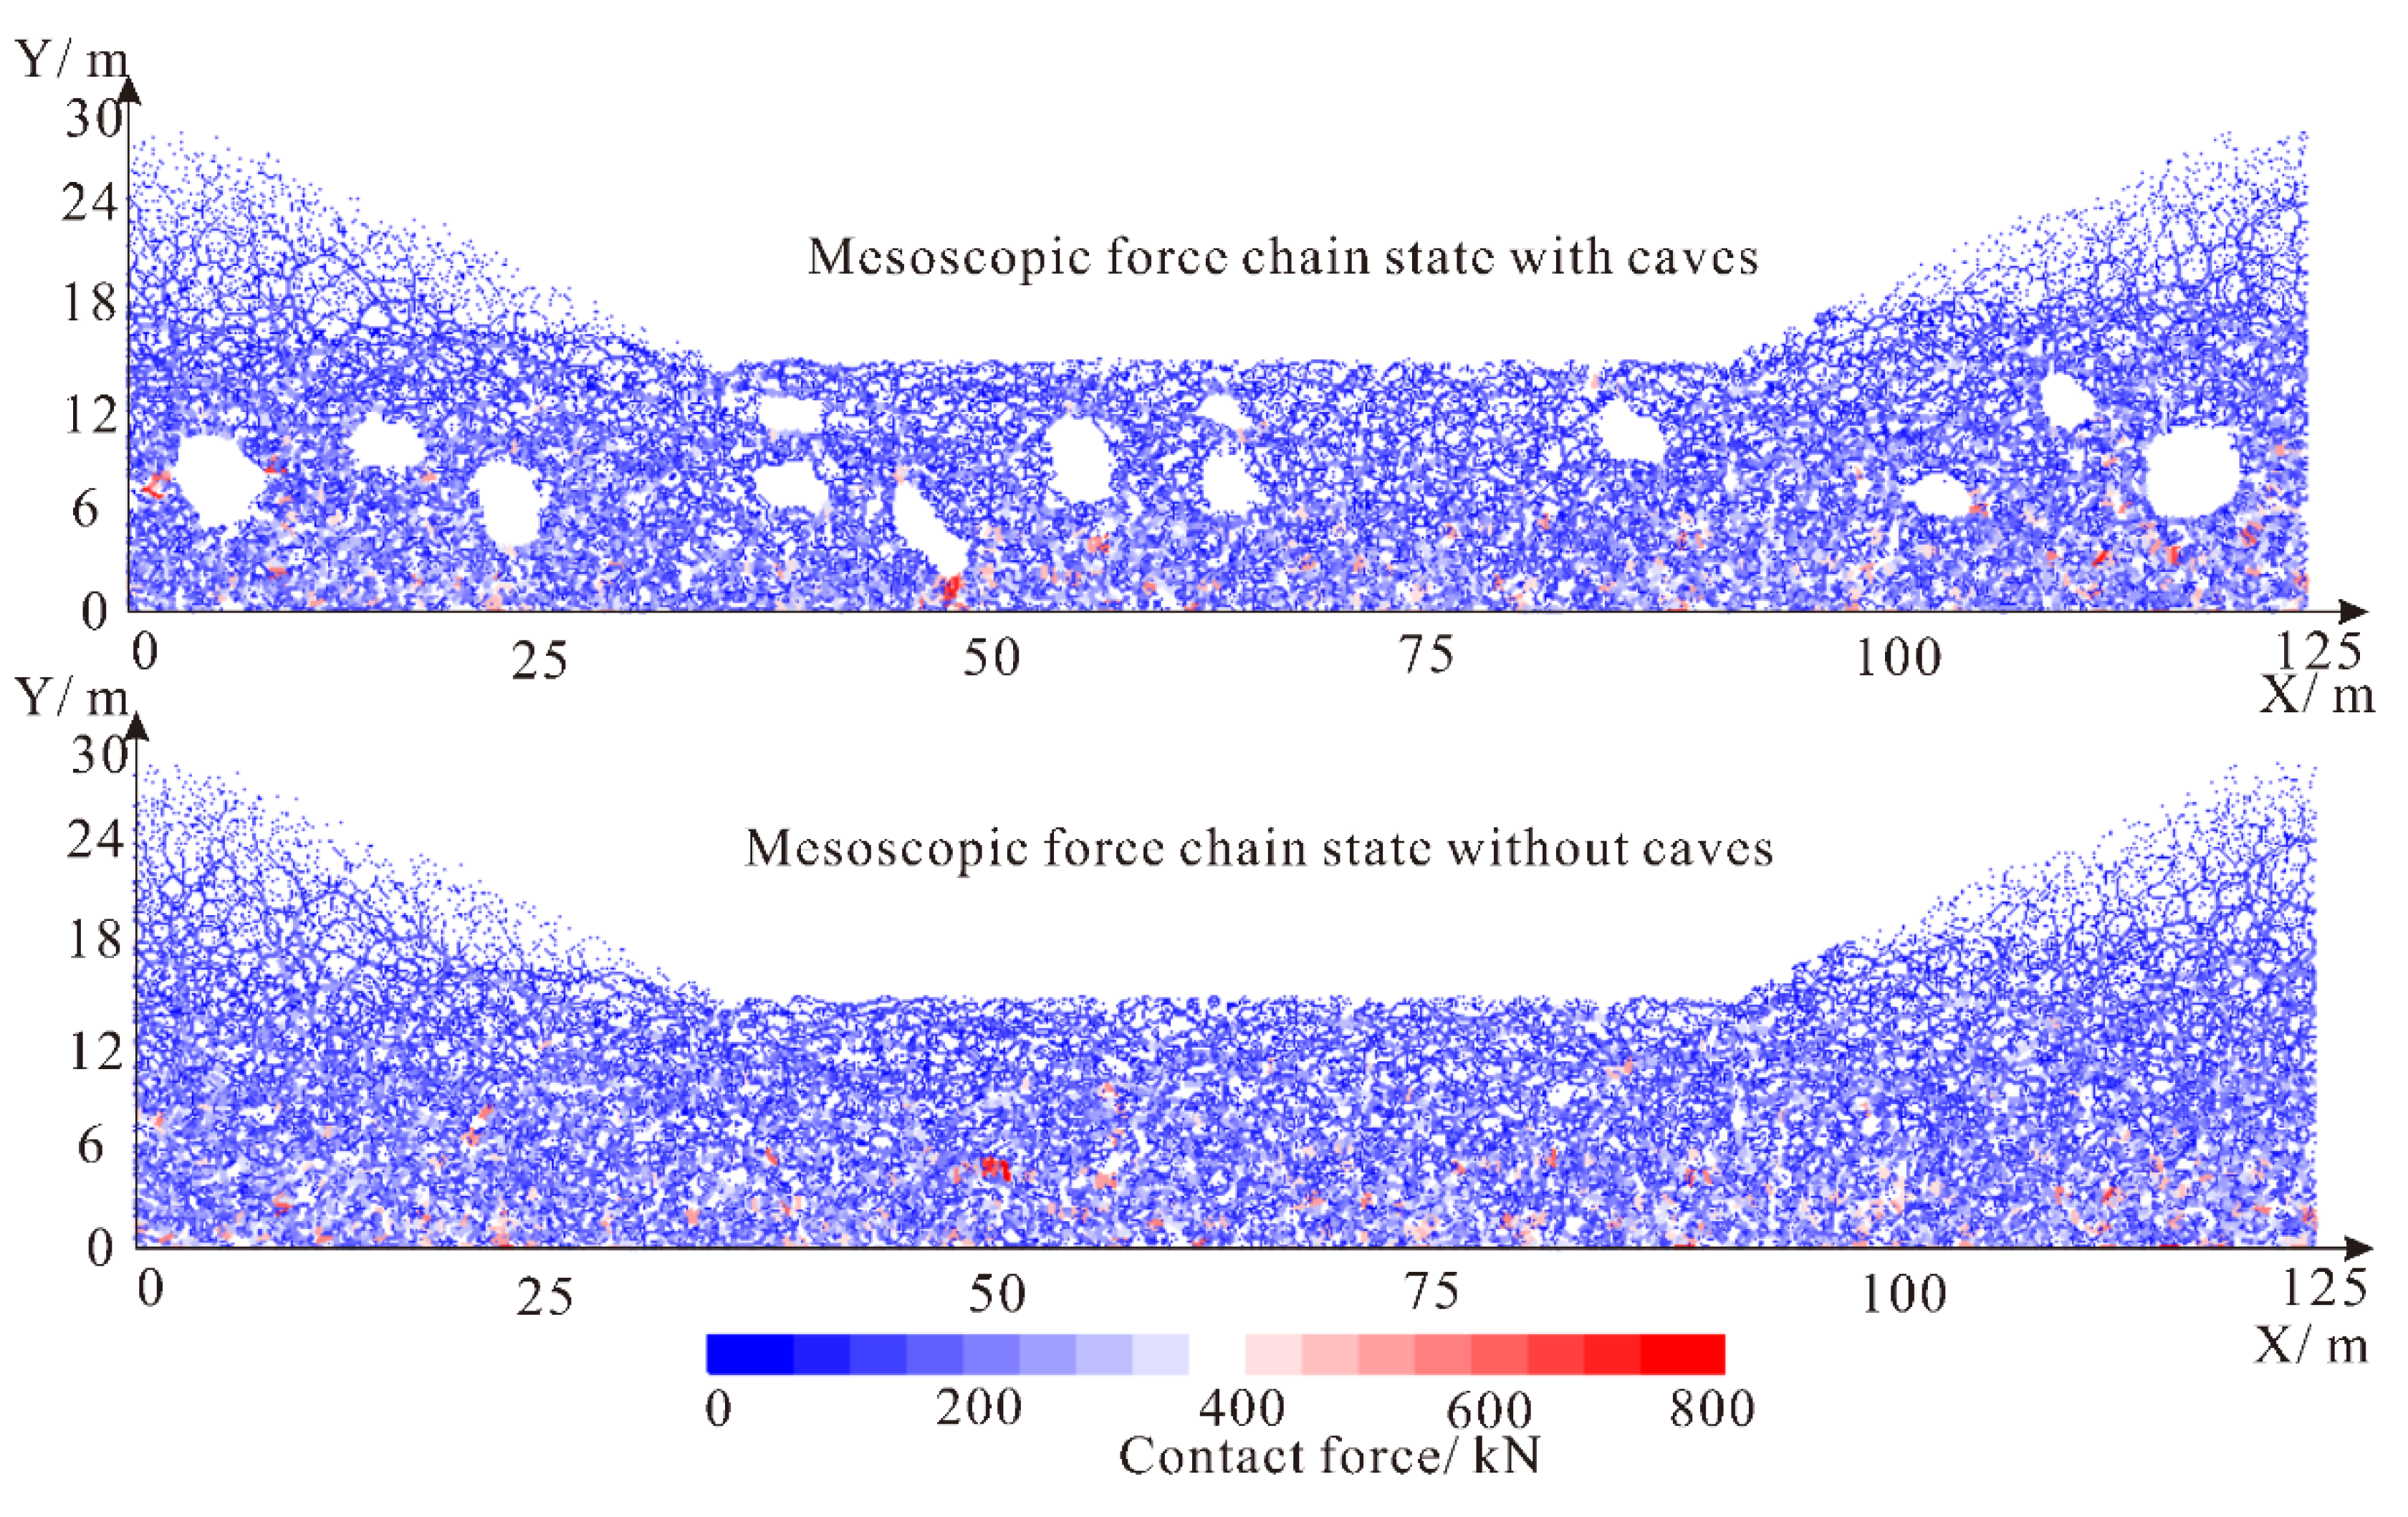
To study the effect of cavities, we compared the grains’ contact force chains after excavation (see Figure 17). Without caves, the force chains of the rock mass are spread throughout the whole stratum, and there is no obvious directionality showing a uniformly distributed characteristic. When the cavity is present, the stresses around the rock are adjusted, with vertical concentrations at two sides and lateral concentrations at the top and bottom forming a pressure arch. In addition, the ratio and magnitude of tensile stresses increased under the influence of the caves, which could cause local damage.
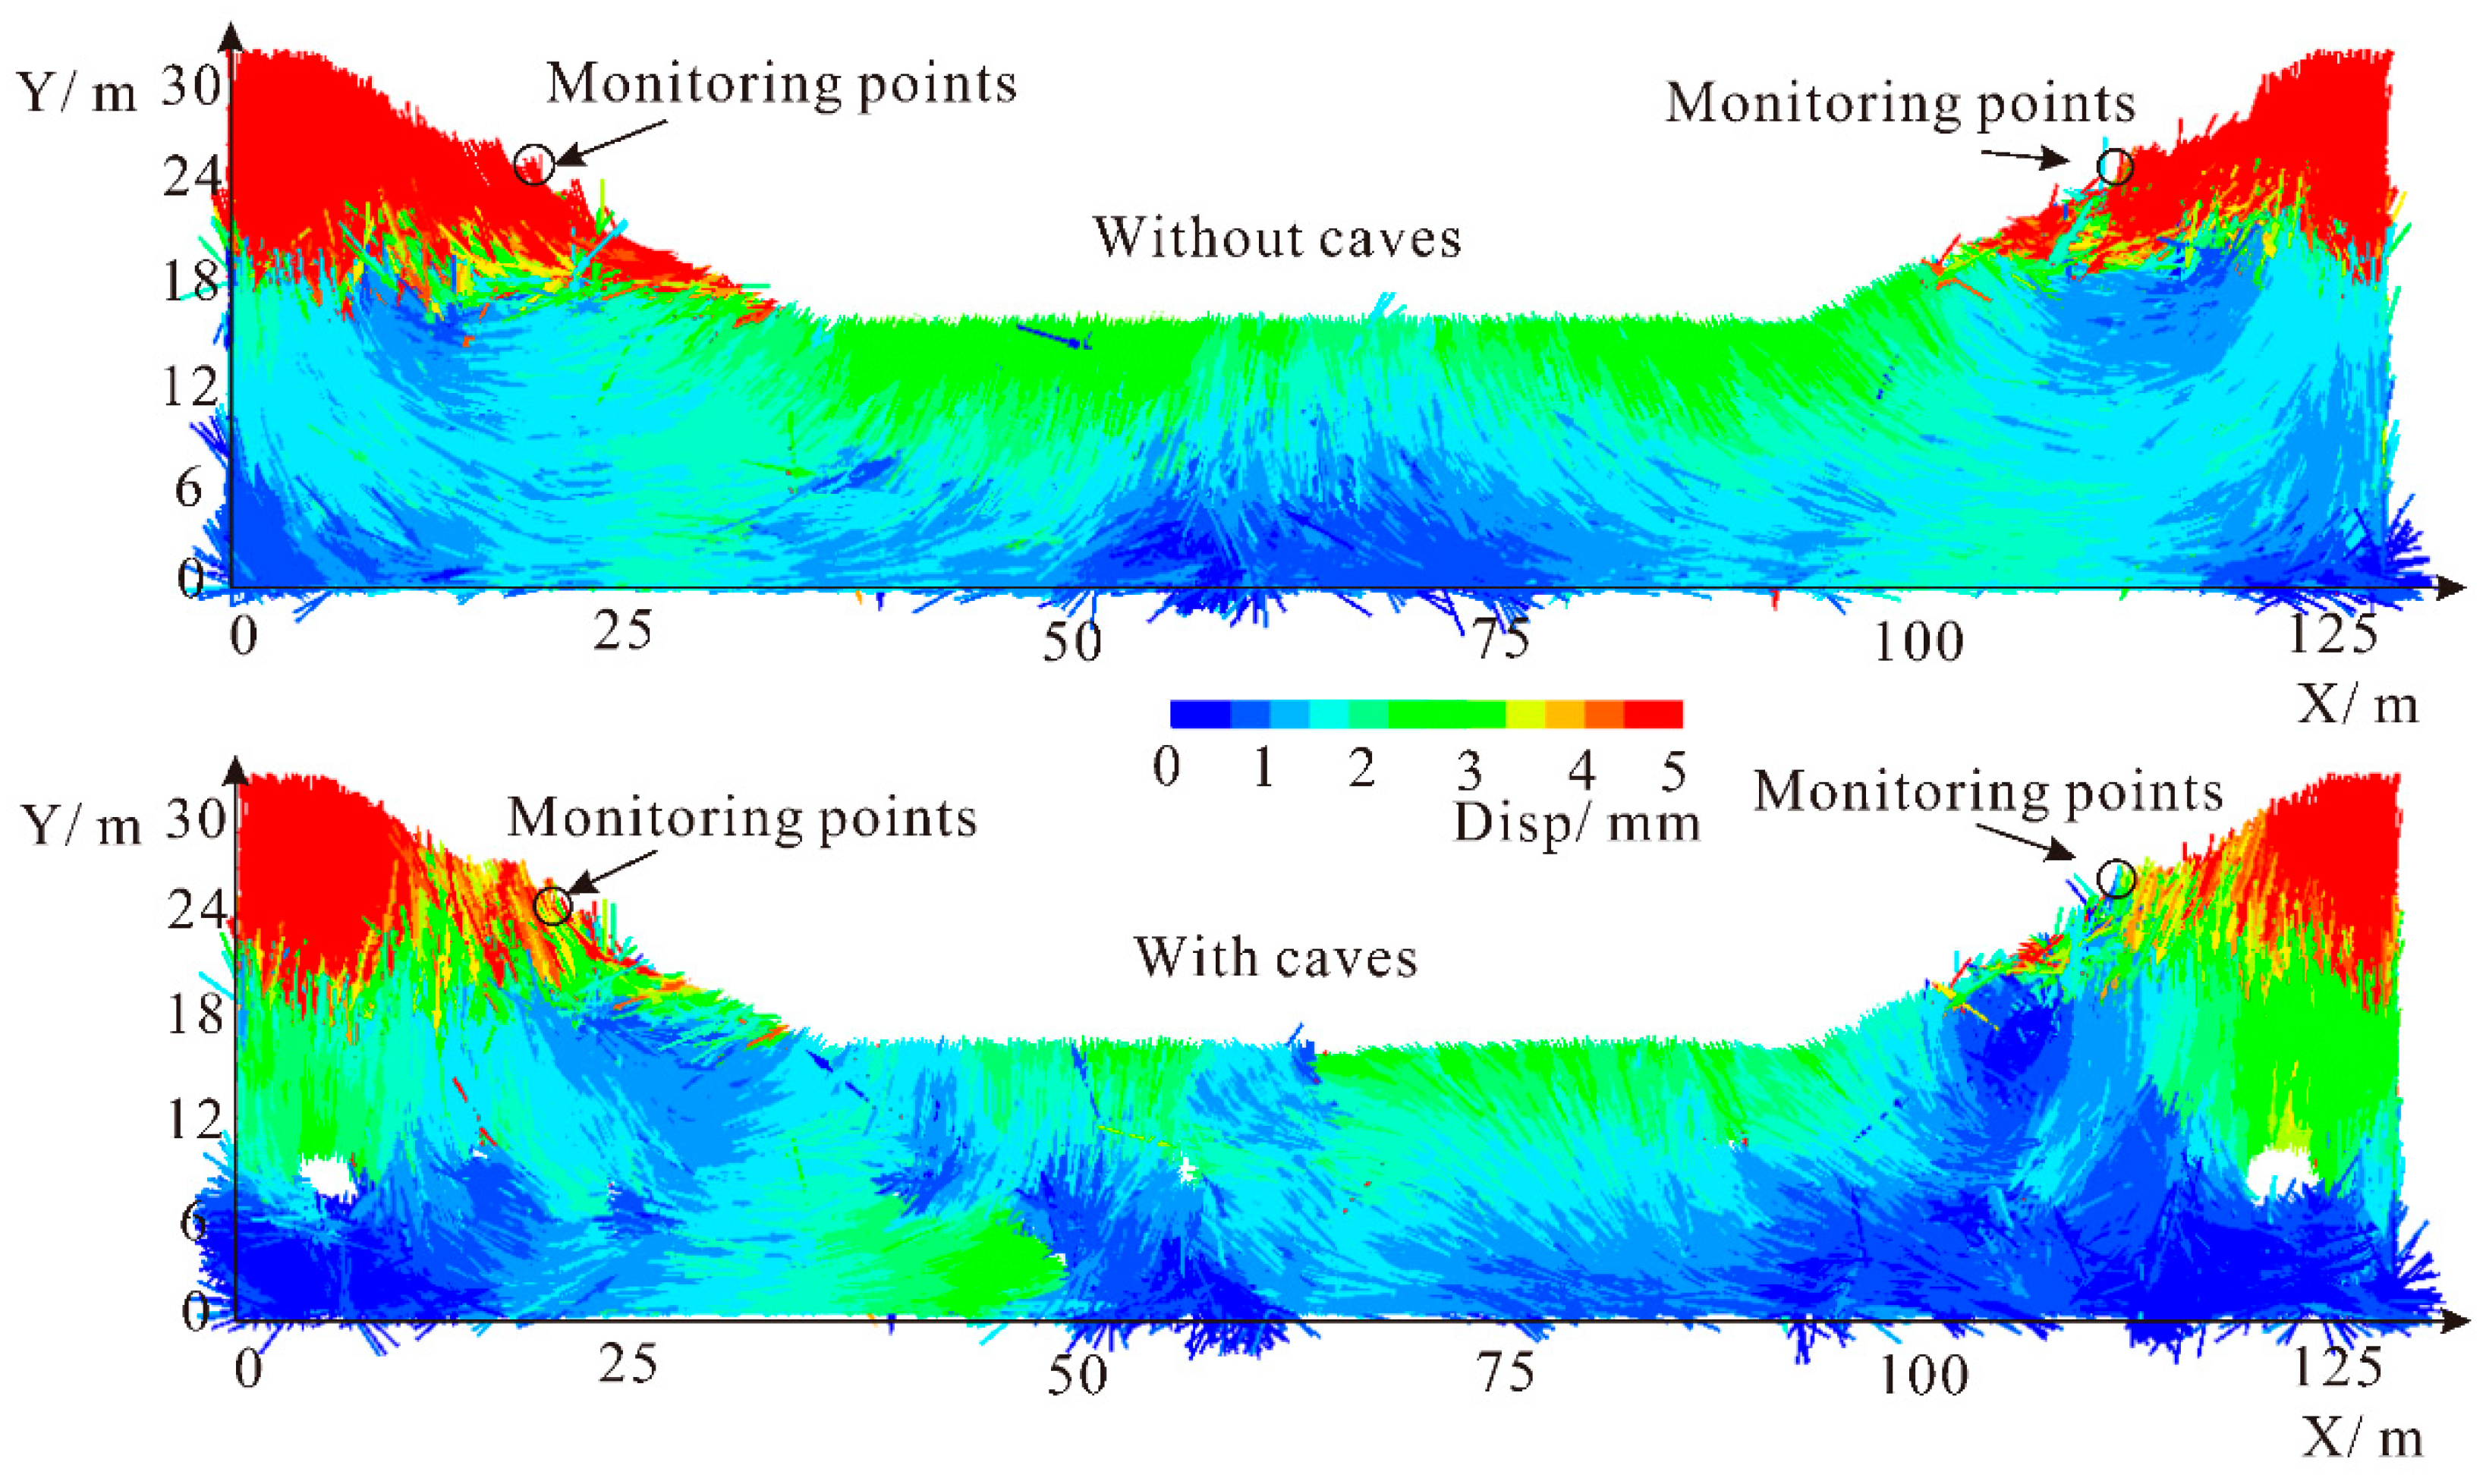
Additionally, we compared the deformation patterns in Figure 18. The top part of Figure 18 shows the grains displacement without caves. It can be observed that there is an overall flow tendency for the mineral grains, with a downward directional displacement of the soil particles on both sides and an upward directional displacement in the middle of the foundation. After considering the cavern, the overall displacement trend does not change, but the stress arch affects the local displacement vector around the caves.

3.3. The Displacement Results Considering Rheological Deforming

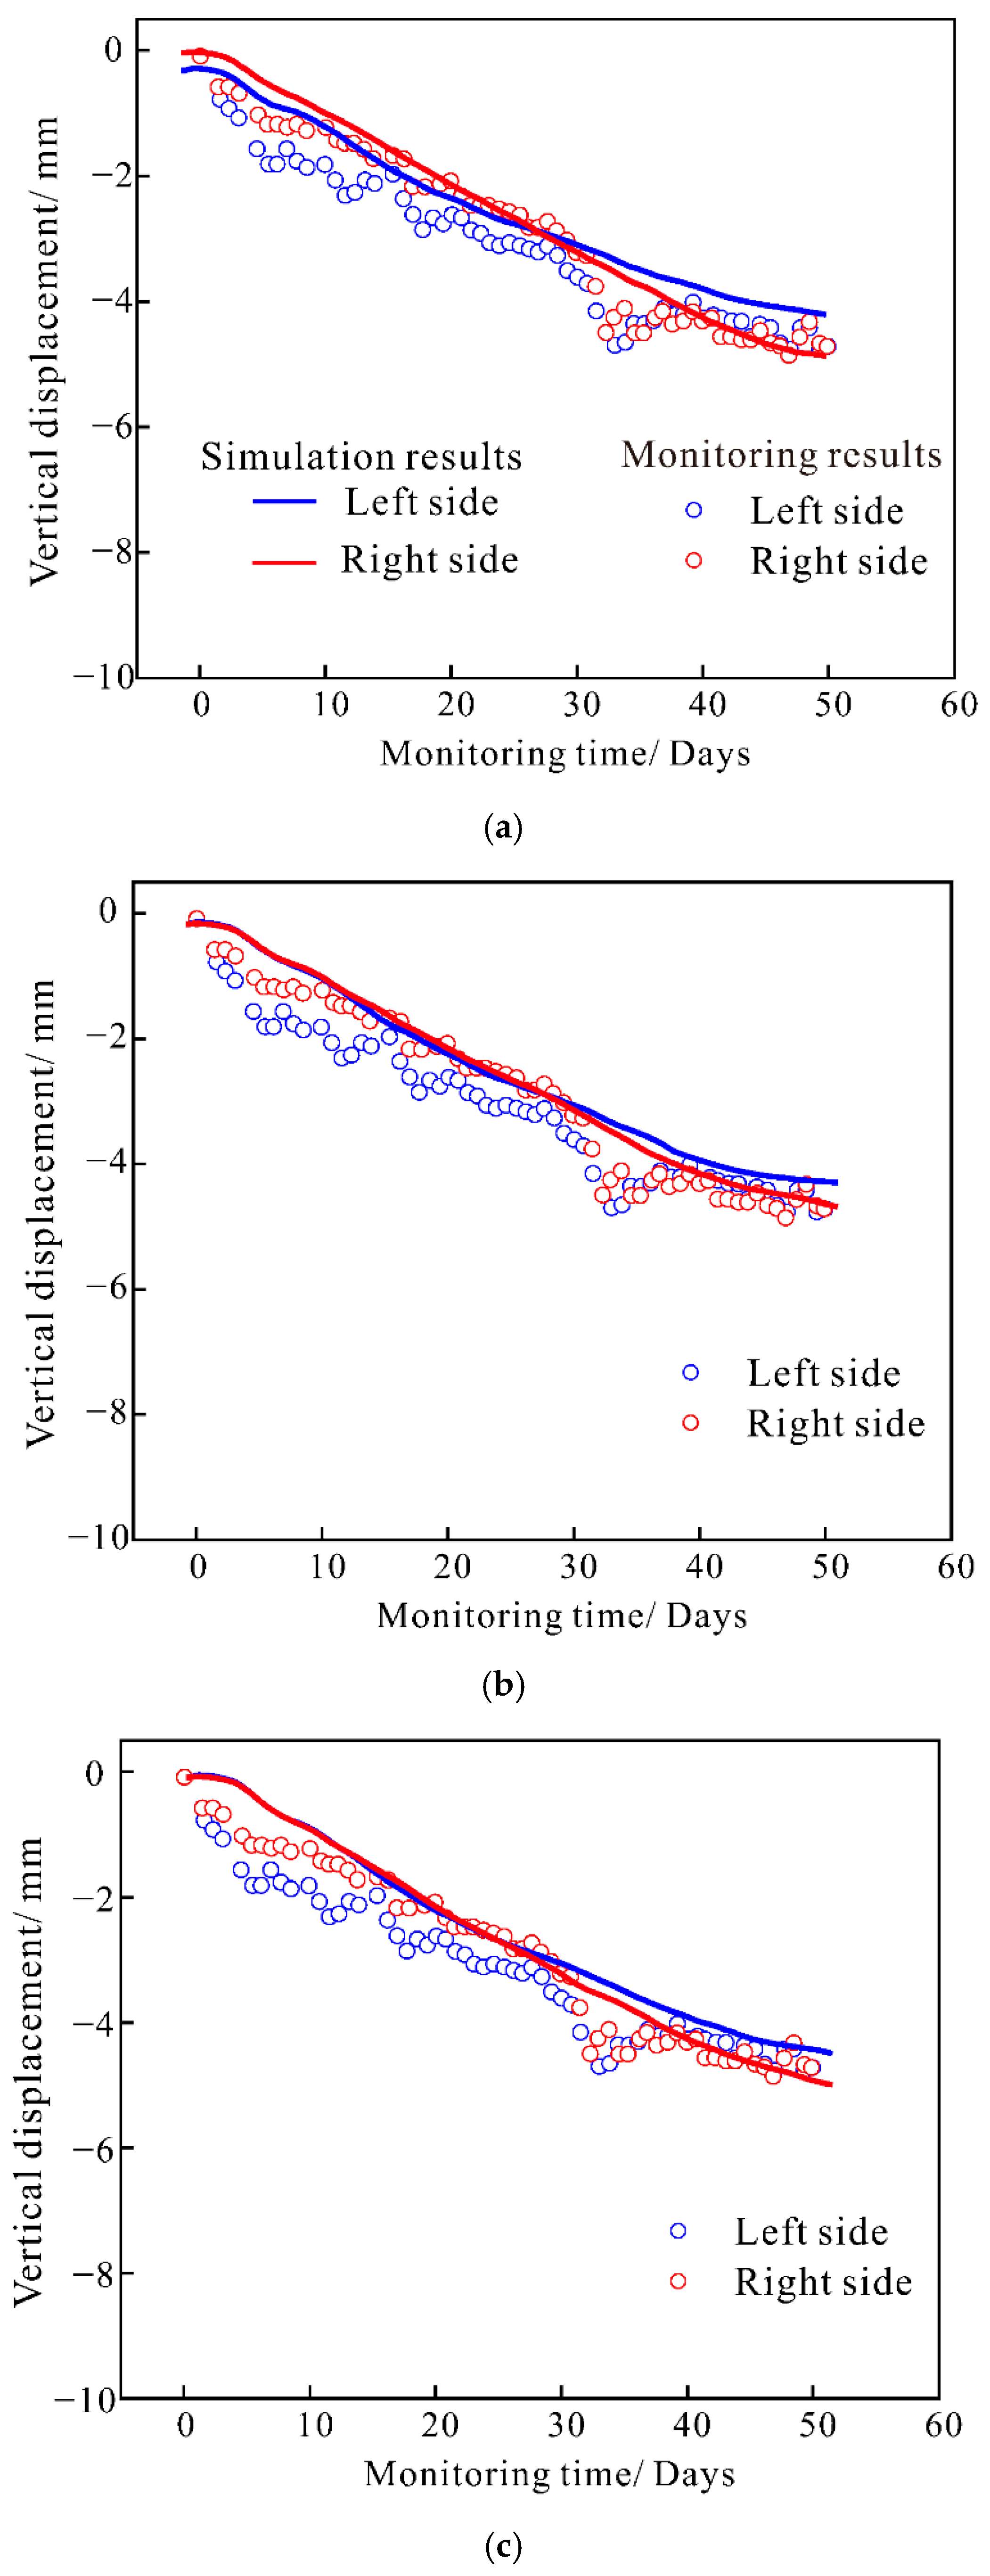
We obtained the time-dependent curve of the slope by numerical calculation. Figure 19 compares the simulation predictions with the monitoring results. Considering the heterogeneous distribution of grains, we repeated the modeling process with three different random seeds. In the simulation result, we can find a linear dropping of curves before the convergence stage, which coincides well with the field-monitored data. The final convergence displacement is 4.2 mm for the left side and 5.0 mm for the right side, which are within 10% error. The sudden increase in deformation in both observed time-series at about day 30 was not captured in the modeling. When the excessive pore pressure of marine soft deposits has completely dissipated, the time-dependent behavior turns into “elastic rebounding”, which is an opposite process of “creep”. We can find these declining lines in Figure 14, which represents the “elastic rebounding” process and is not considered in the models herein.

3.4. Discussion for Short-Term Stability under Different Overlying Loadings

The scenario in this paper is a foundation excavation in a coastal karst area. The long-term and short-term damage are governed by different mechanisms. To evaluate the stability of foundation in karst areas, it is necessary to further discuss these factors.
In the selected case study, the rock mass can maintain stability due to the shallow burial depth. To further quantify the stability of the pressure arch, a heavy structure was placed above the foundation, and the mass was continuously increased from 700 t to 41,250 t (see Figure 20). Each weight was counted as a new phase, and the stresses were also monitored. Figure 20a presents the stress values during the weight increase process, and the mesoscopic damage is counted in Figure 20b.
The strength of the limestone in this paper is 11.6 MPa. The vertical stress near the measurement circle gradually increases to 13 MPa during the rising of load, while the horizontal stress increases slowly and remains within 2 MPa. We can find that the stress exceeds the macroscopic strength of the rock from stage 4 to stage 5, causing a mechanical failure. In Figure 20b, there is no mesoscale damage before stage 3; a small amount of mesoscopic damage begins to sprout at stage 3; then, significant damage accumulation can be detected near the caves at stage 4, and large-scale damage development appears at stage 5, at which point the self-balanced pressure arch effect is destroyed. These high-frequency oscillations in stress curves at stage 5 indicate the mechanical failure of material.
It can be found from Figure 20 that the sinkholes would collapse if the overburden weight exceeded the ultimate strength of material. Therefore, if the strength of material decreases, the probability of sinkhole collapse rises, which is the same as the conclusions obtained by Al-Halbouni et al. [1,18].

3.5. Discussion for Caves’ Influence on Deformation under Different Rock Strengths

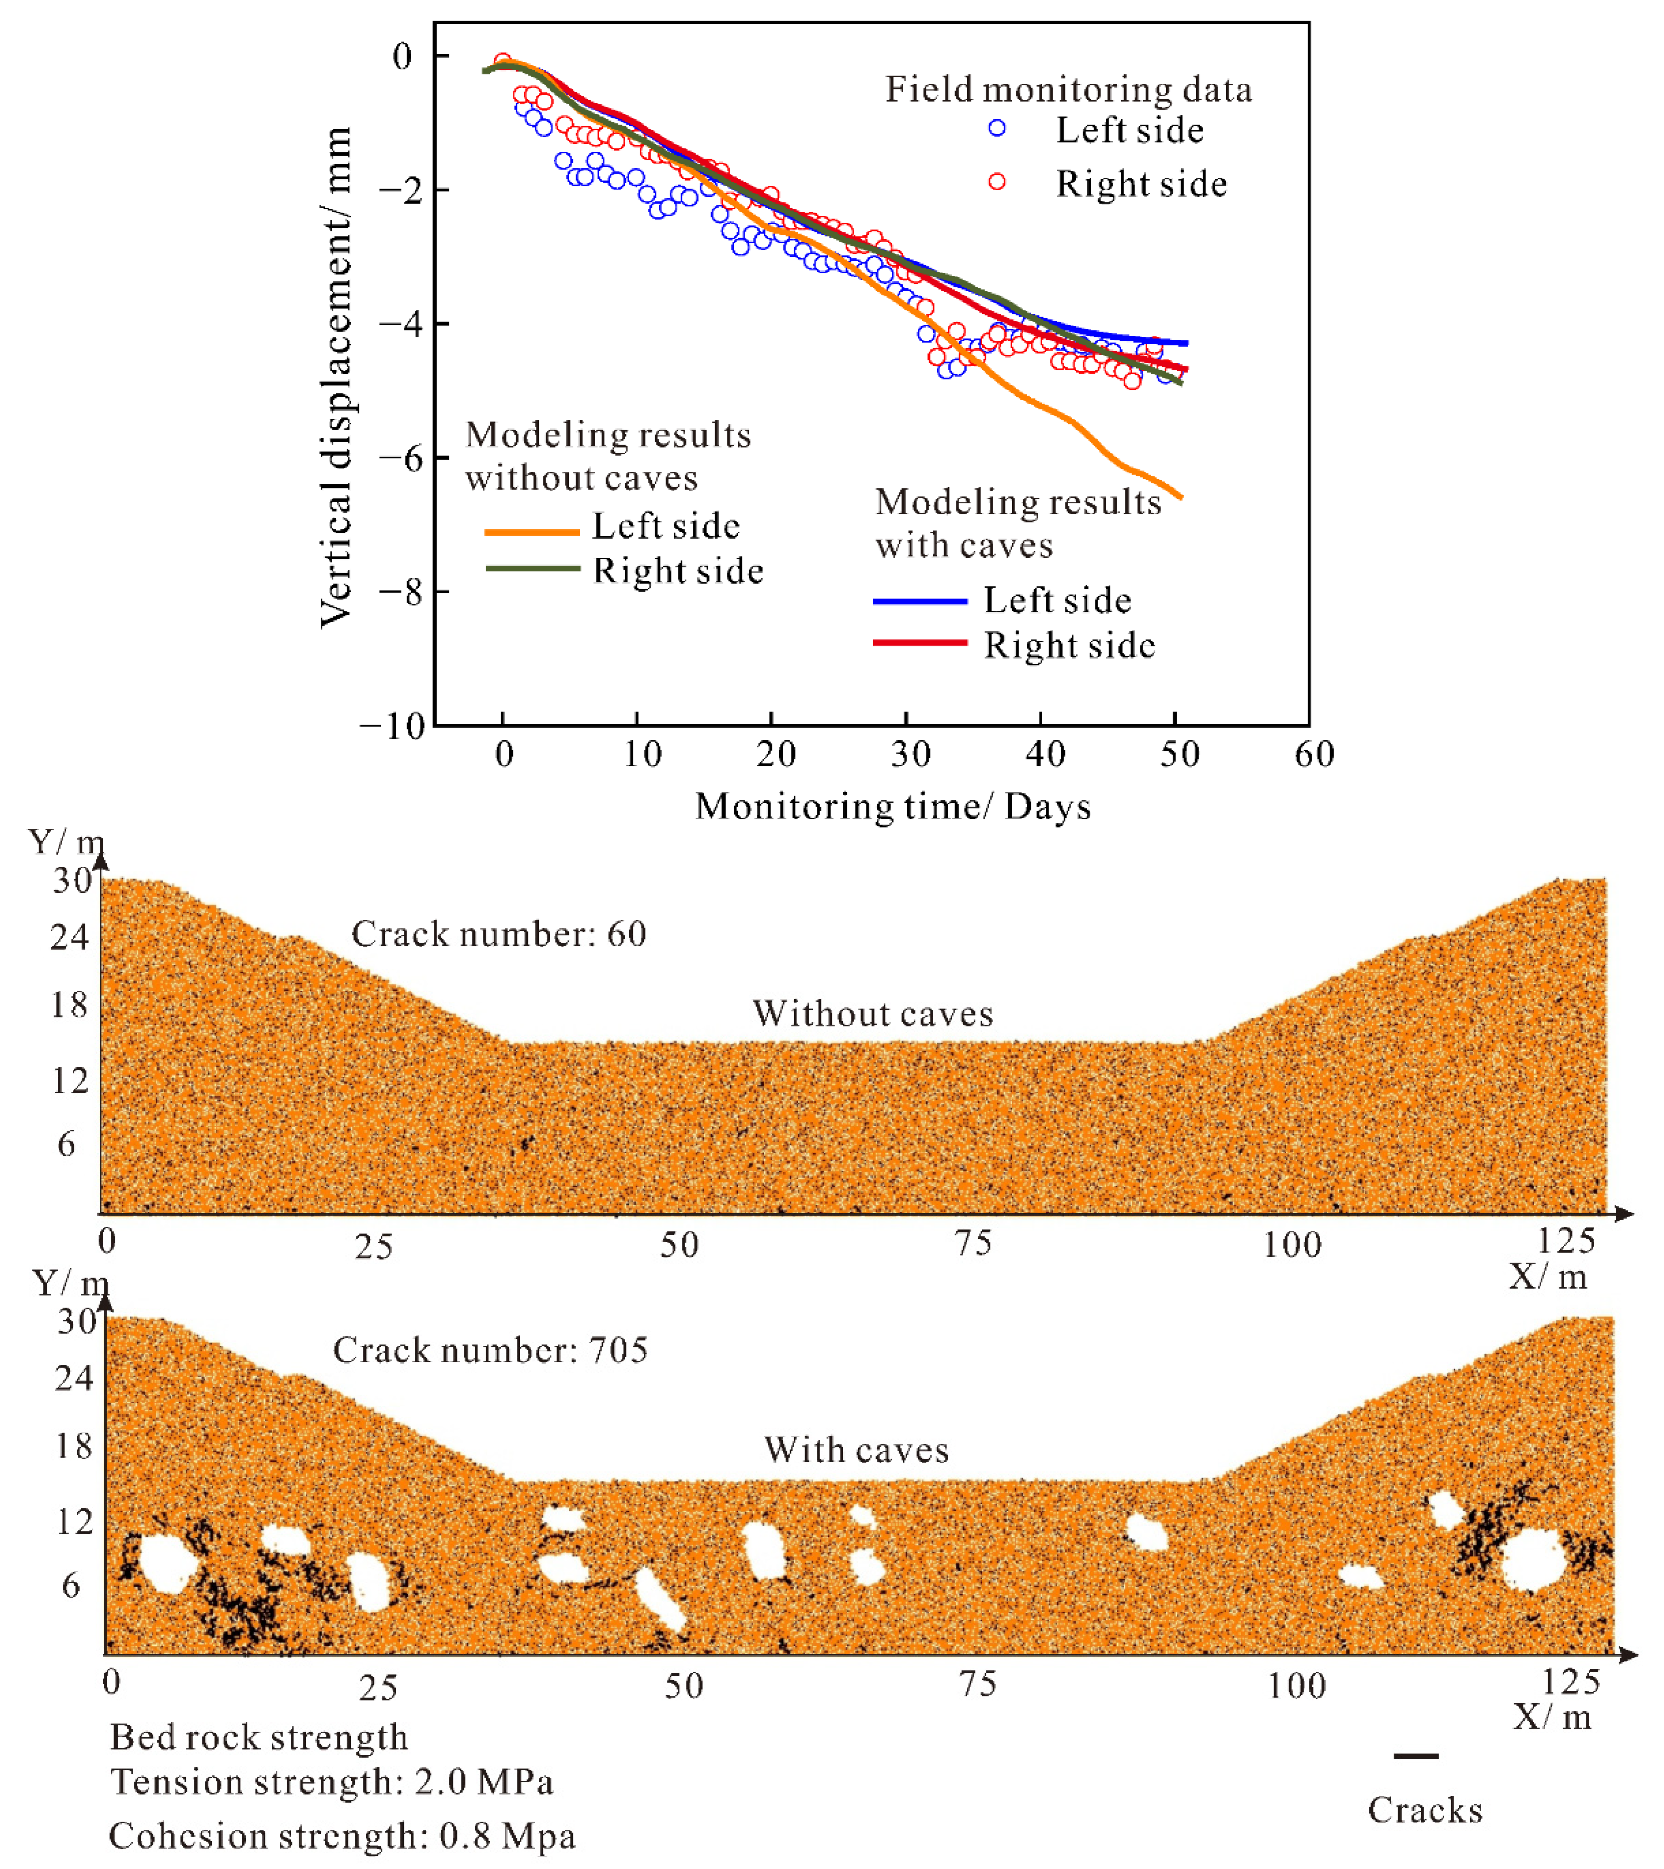
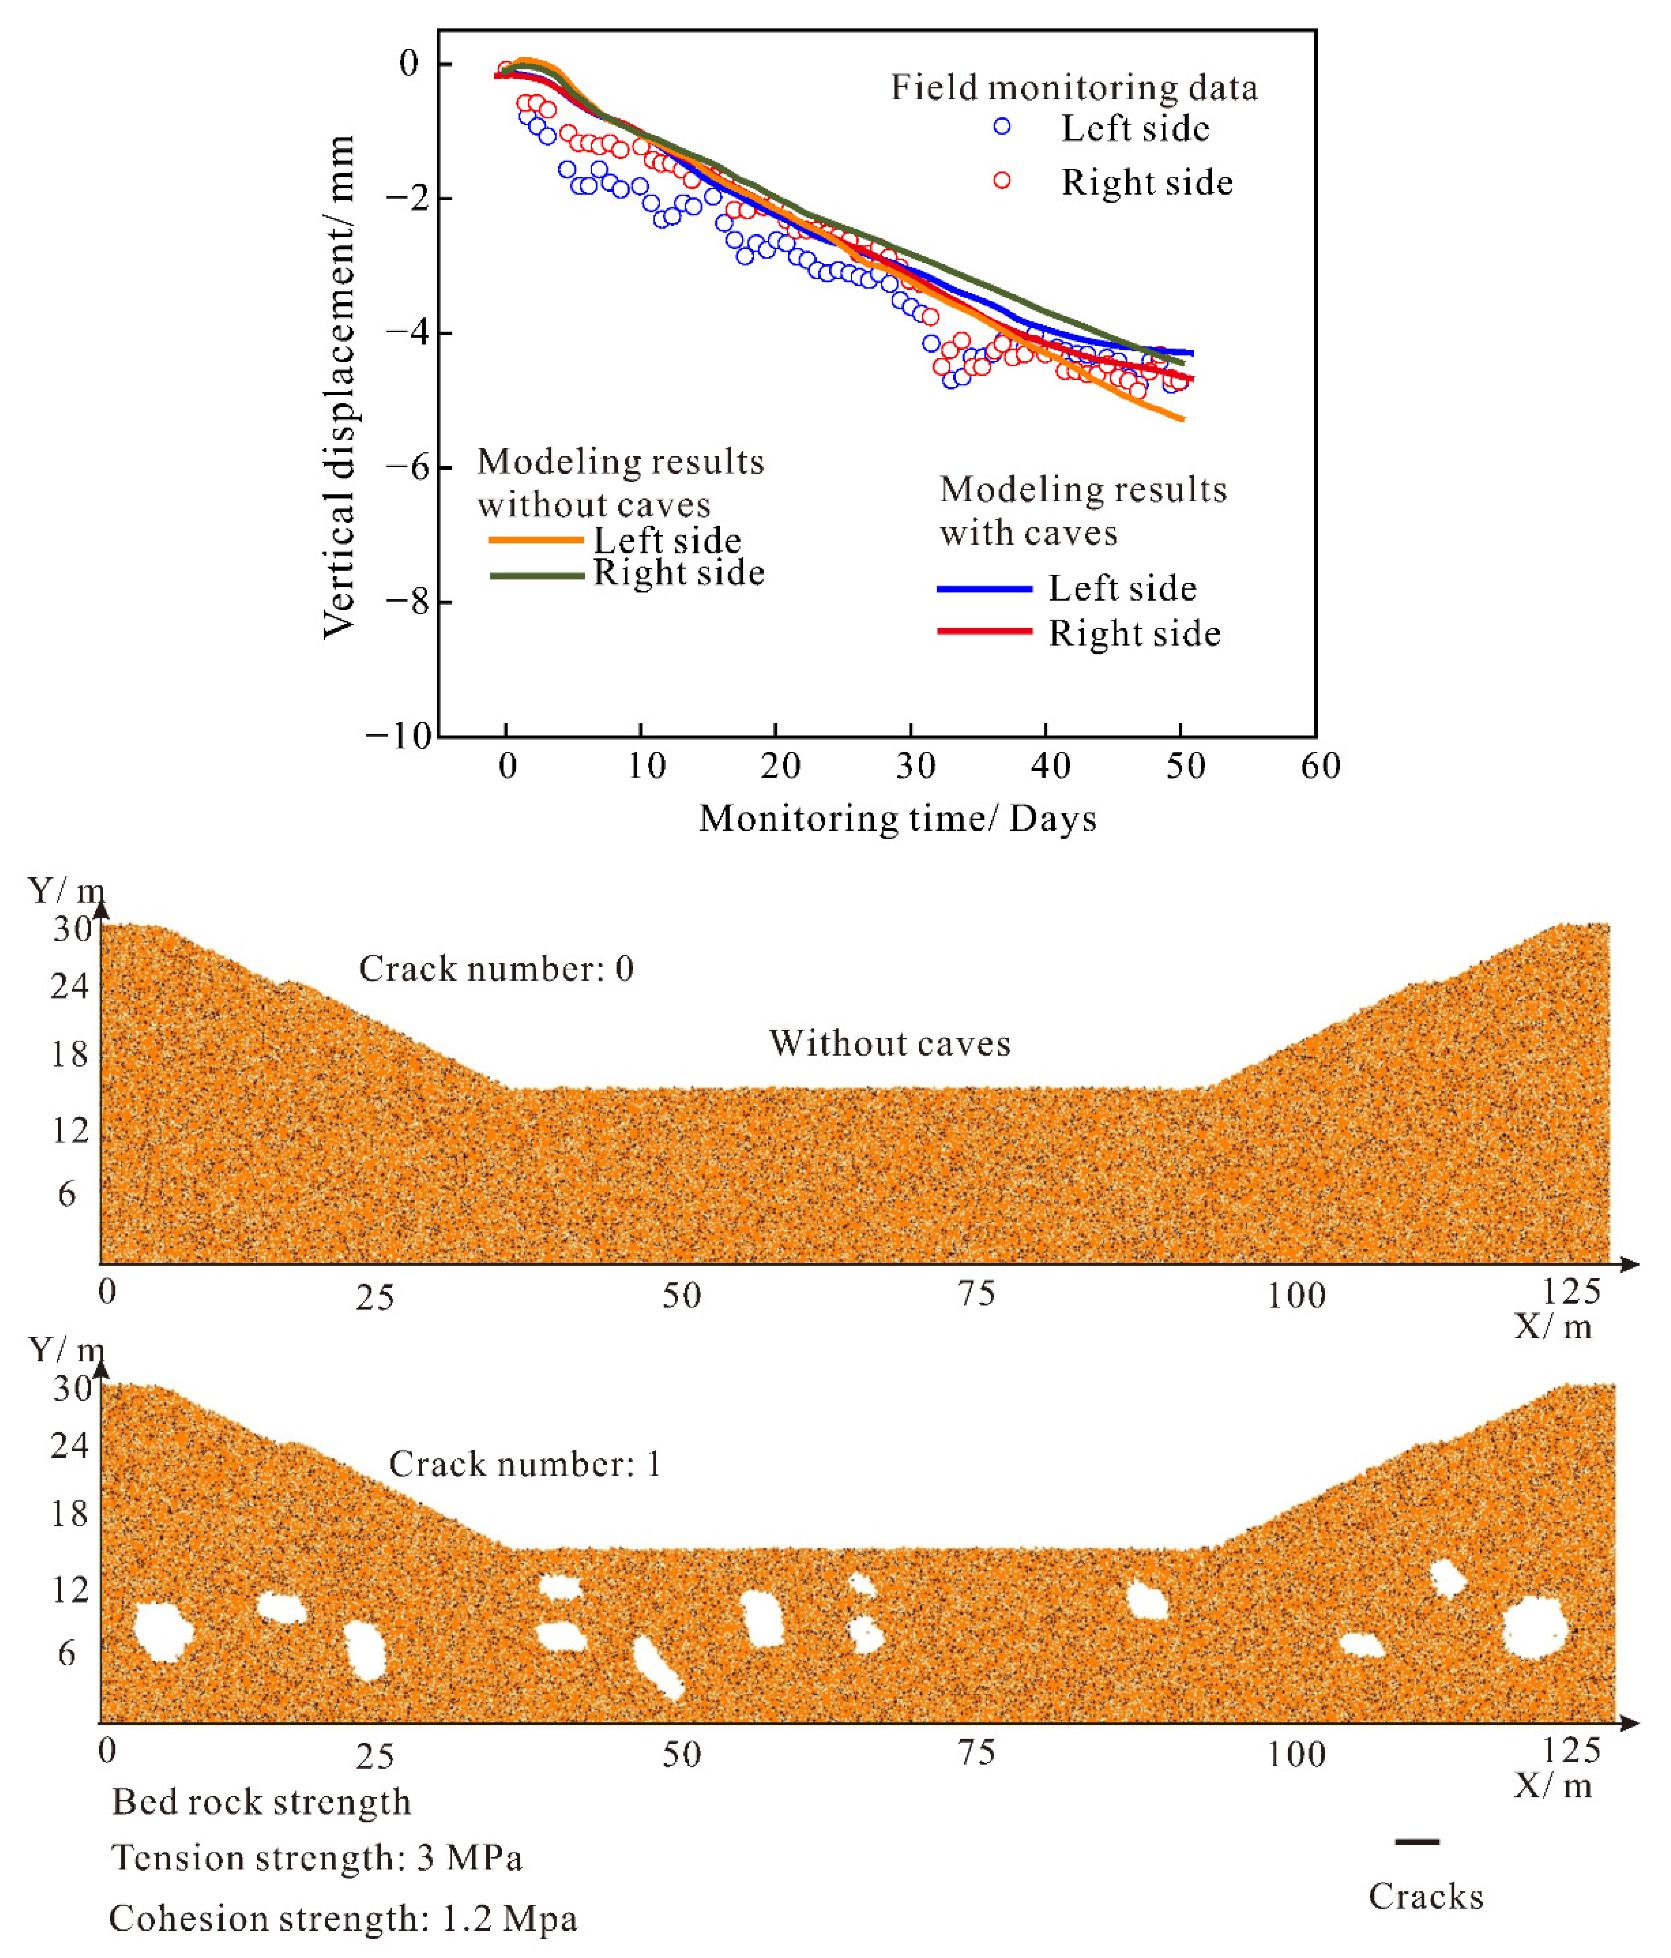
There is a minor influence of caves on the final settlement of foundation, but it does not mean that the caves are negligible. In this paper, the selected case bedrock has a relatively high saturated strength up to 10 MPa. To discuss the effect caused by the caves, we conducted another three modelings with much lower strength parameters of rocks. In our primitive study, the rock strength is around 12 MPa, and the calibrated parameters of cohesion strength and tension strength are 30 MPa and 11 MPa, respectively. The capacity of rock is high enough to resist a sudden collapse. In this section, the cohesion and tension strength reduced to values under 3 MPa, with 0.4 MPa and 1 MPa in Figure 21, 0.8 MPa and 2.0 MPa in Figure 22 and 1.2 MPa and 3.0 MPa in Figure 23. We can find from these figures that the caved modeling condition shows a larger deformation in the long-term behavior, which is the most obvious in Figure 21. In addition, Figure 21 illustrates a severe collapsing of caves. However, with the strength increasing to 3.0 MPa in Figure 23, the number of cracks and the deformation caused by the caves declined a lot.

3.6. Discussion for the Long-term Deformation under Different Viscosity Coefficients and Elasticity Modulus

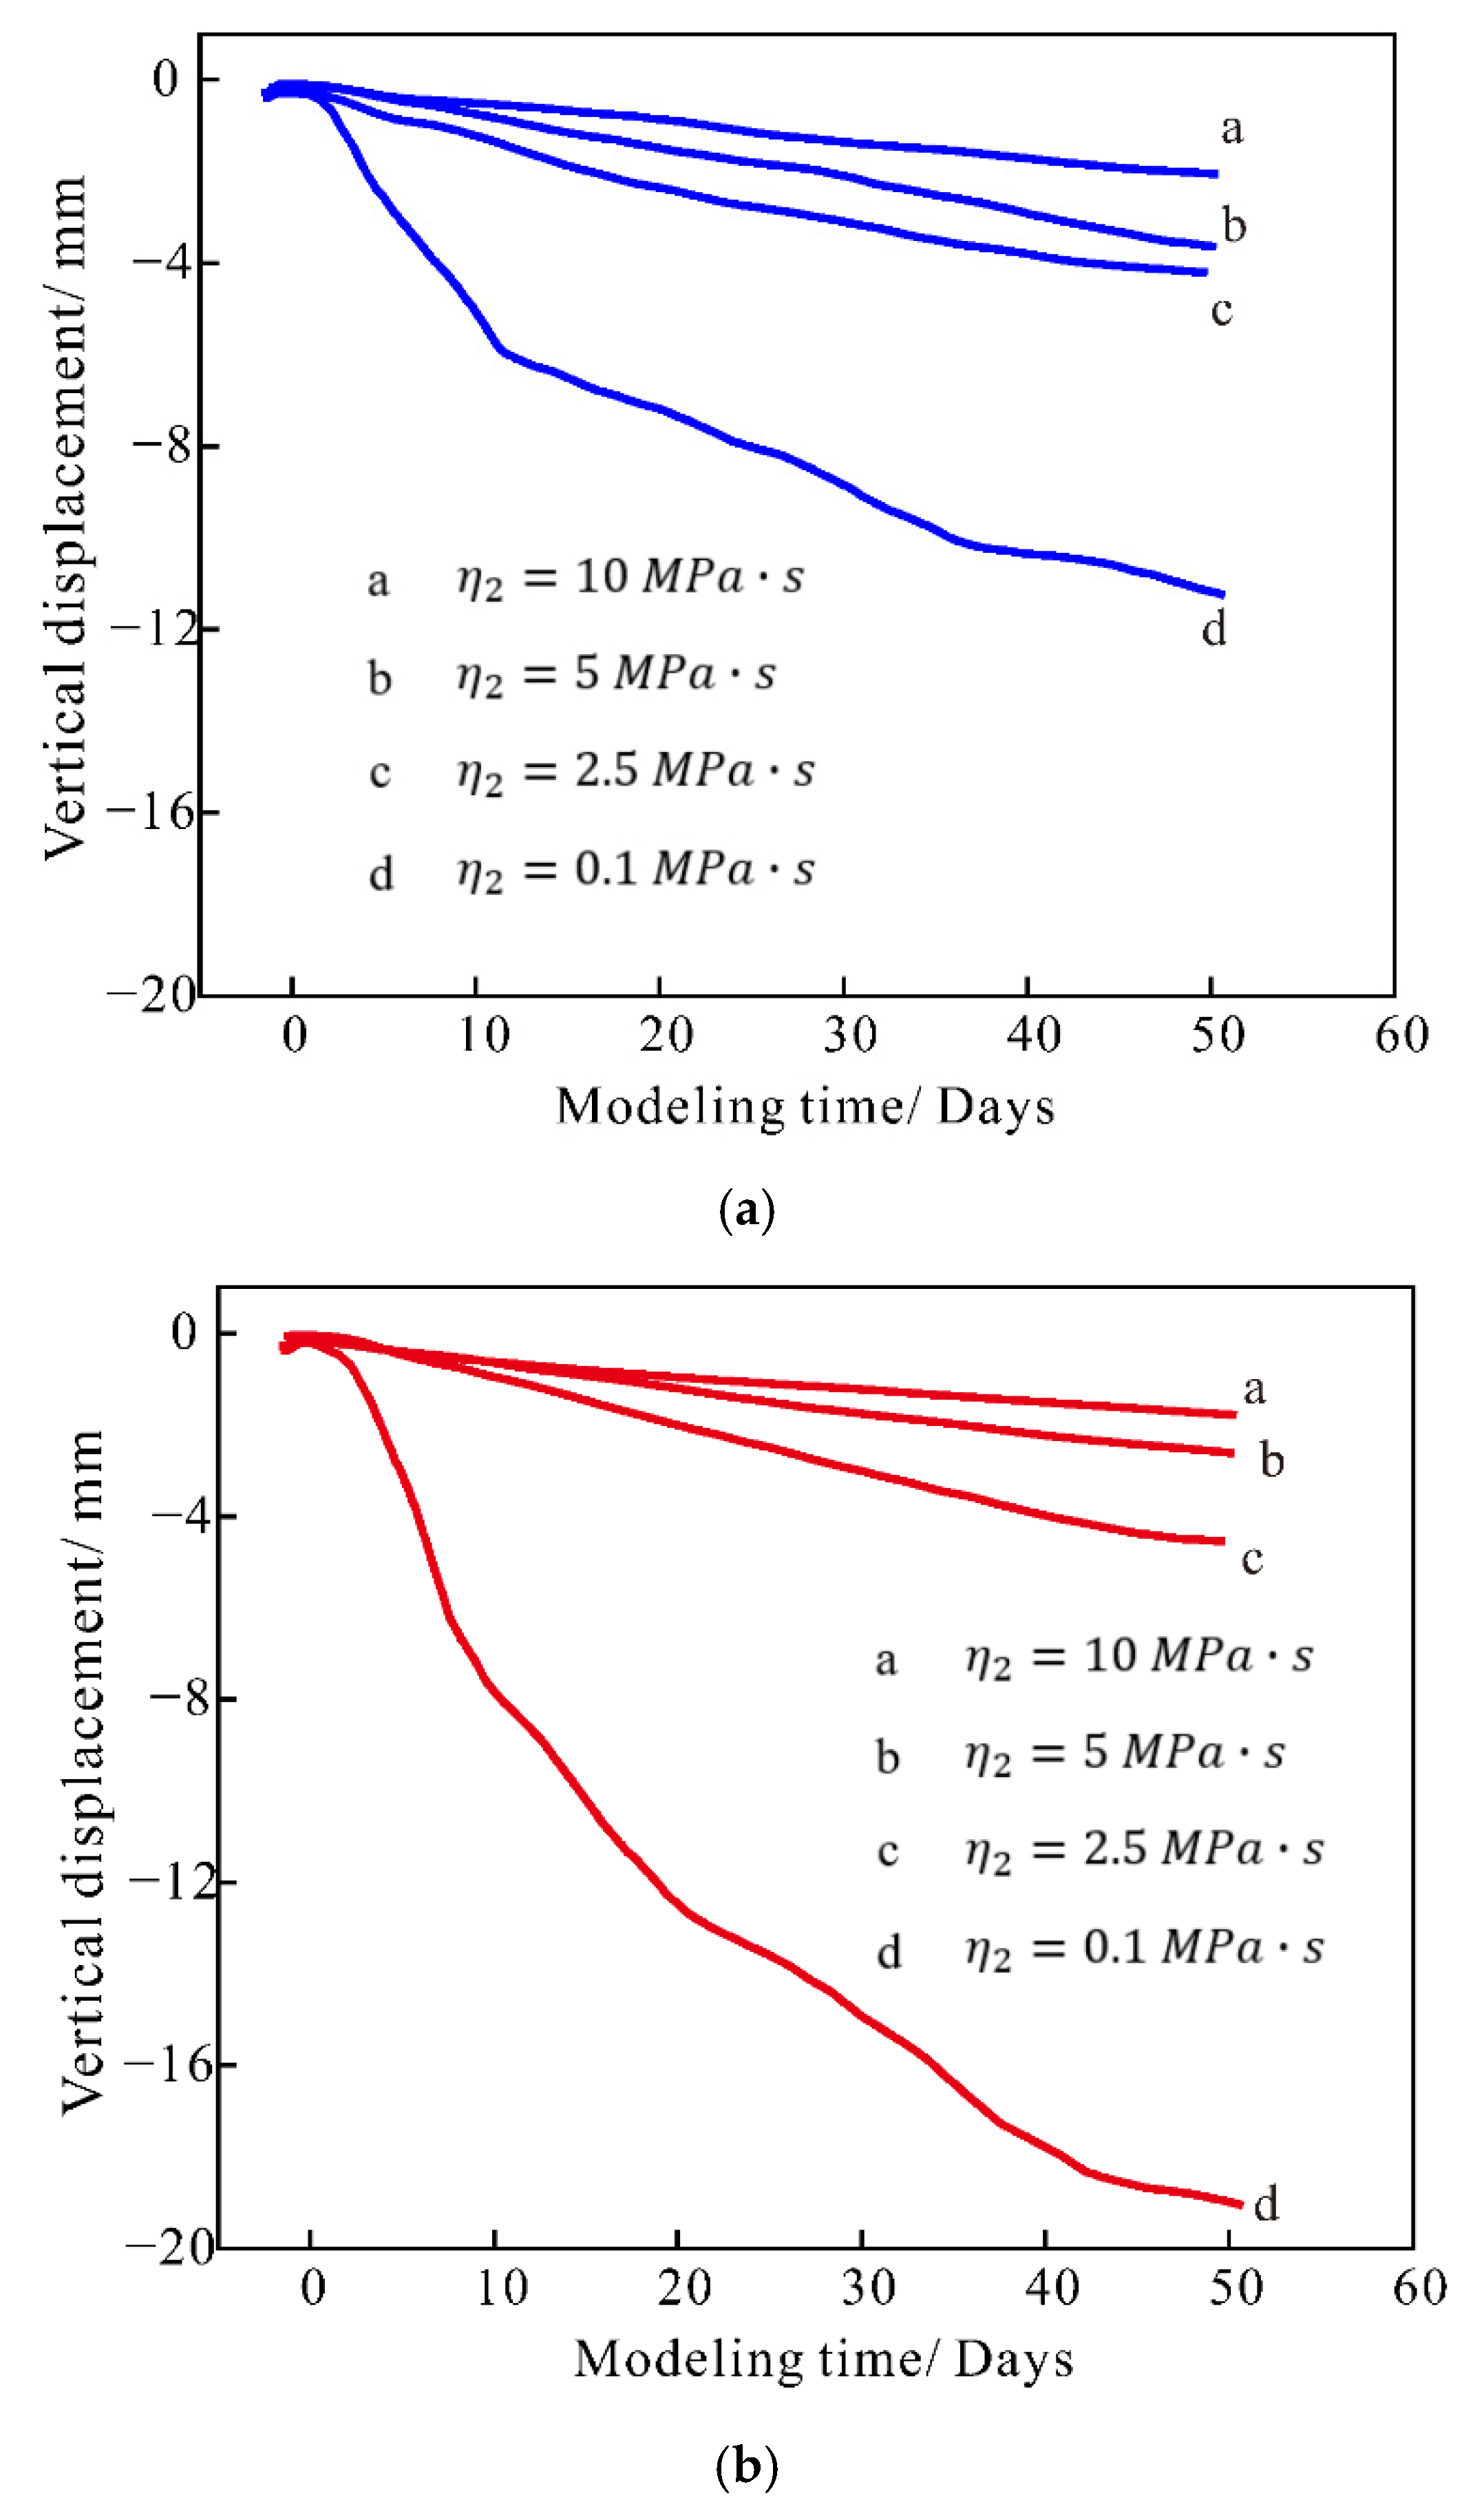
In Section 3.1.3, we describe the parameters’ calibration, and we found that the viscosity coefficient of η 2 is important to the final time-dependent evaluation. The well-calibrated results are obtained, and we present the different results when changing η 2 in Figure 24. It can be found that a smaller value of η 2 can cause a higher value of final time-dependent deformation. The final value used in this case study is 2.5 MPa·s. The viscosity value obtained is just for modeling in DEM calculation.
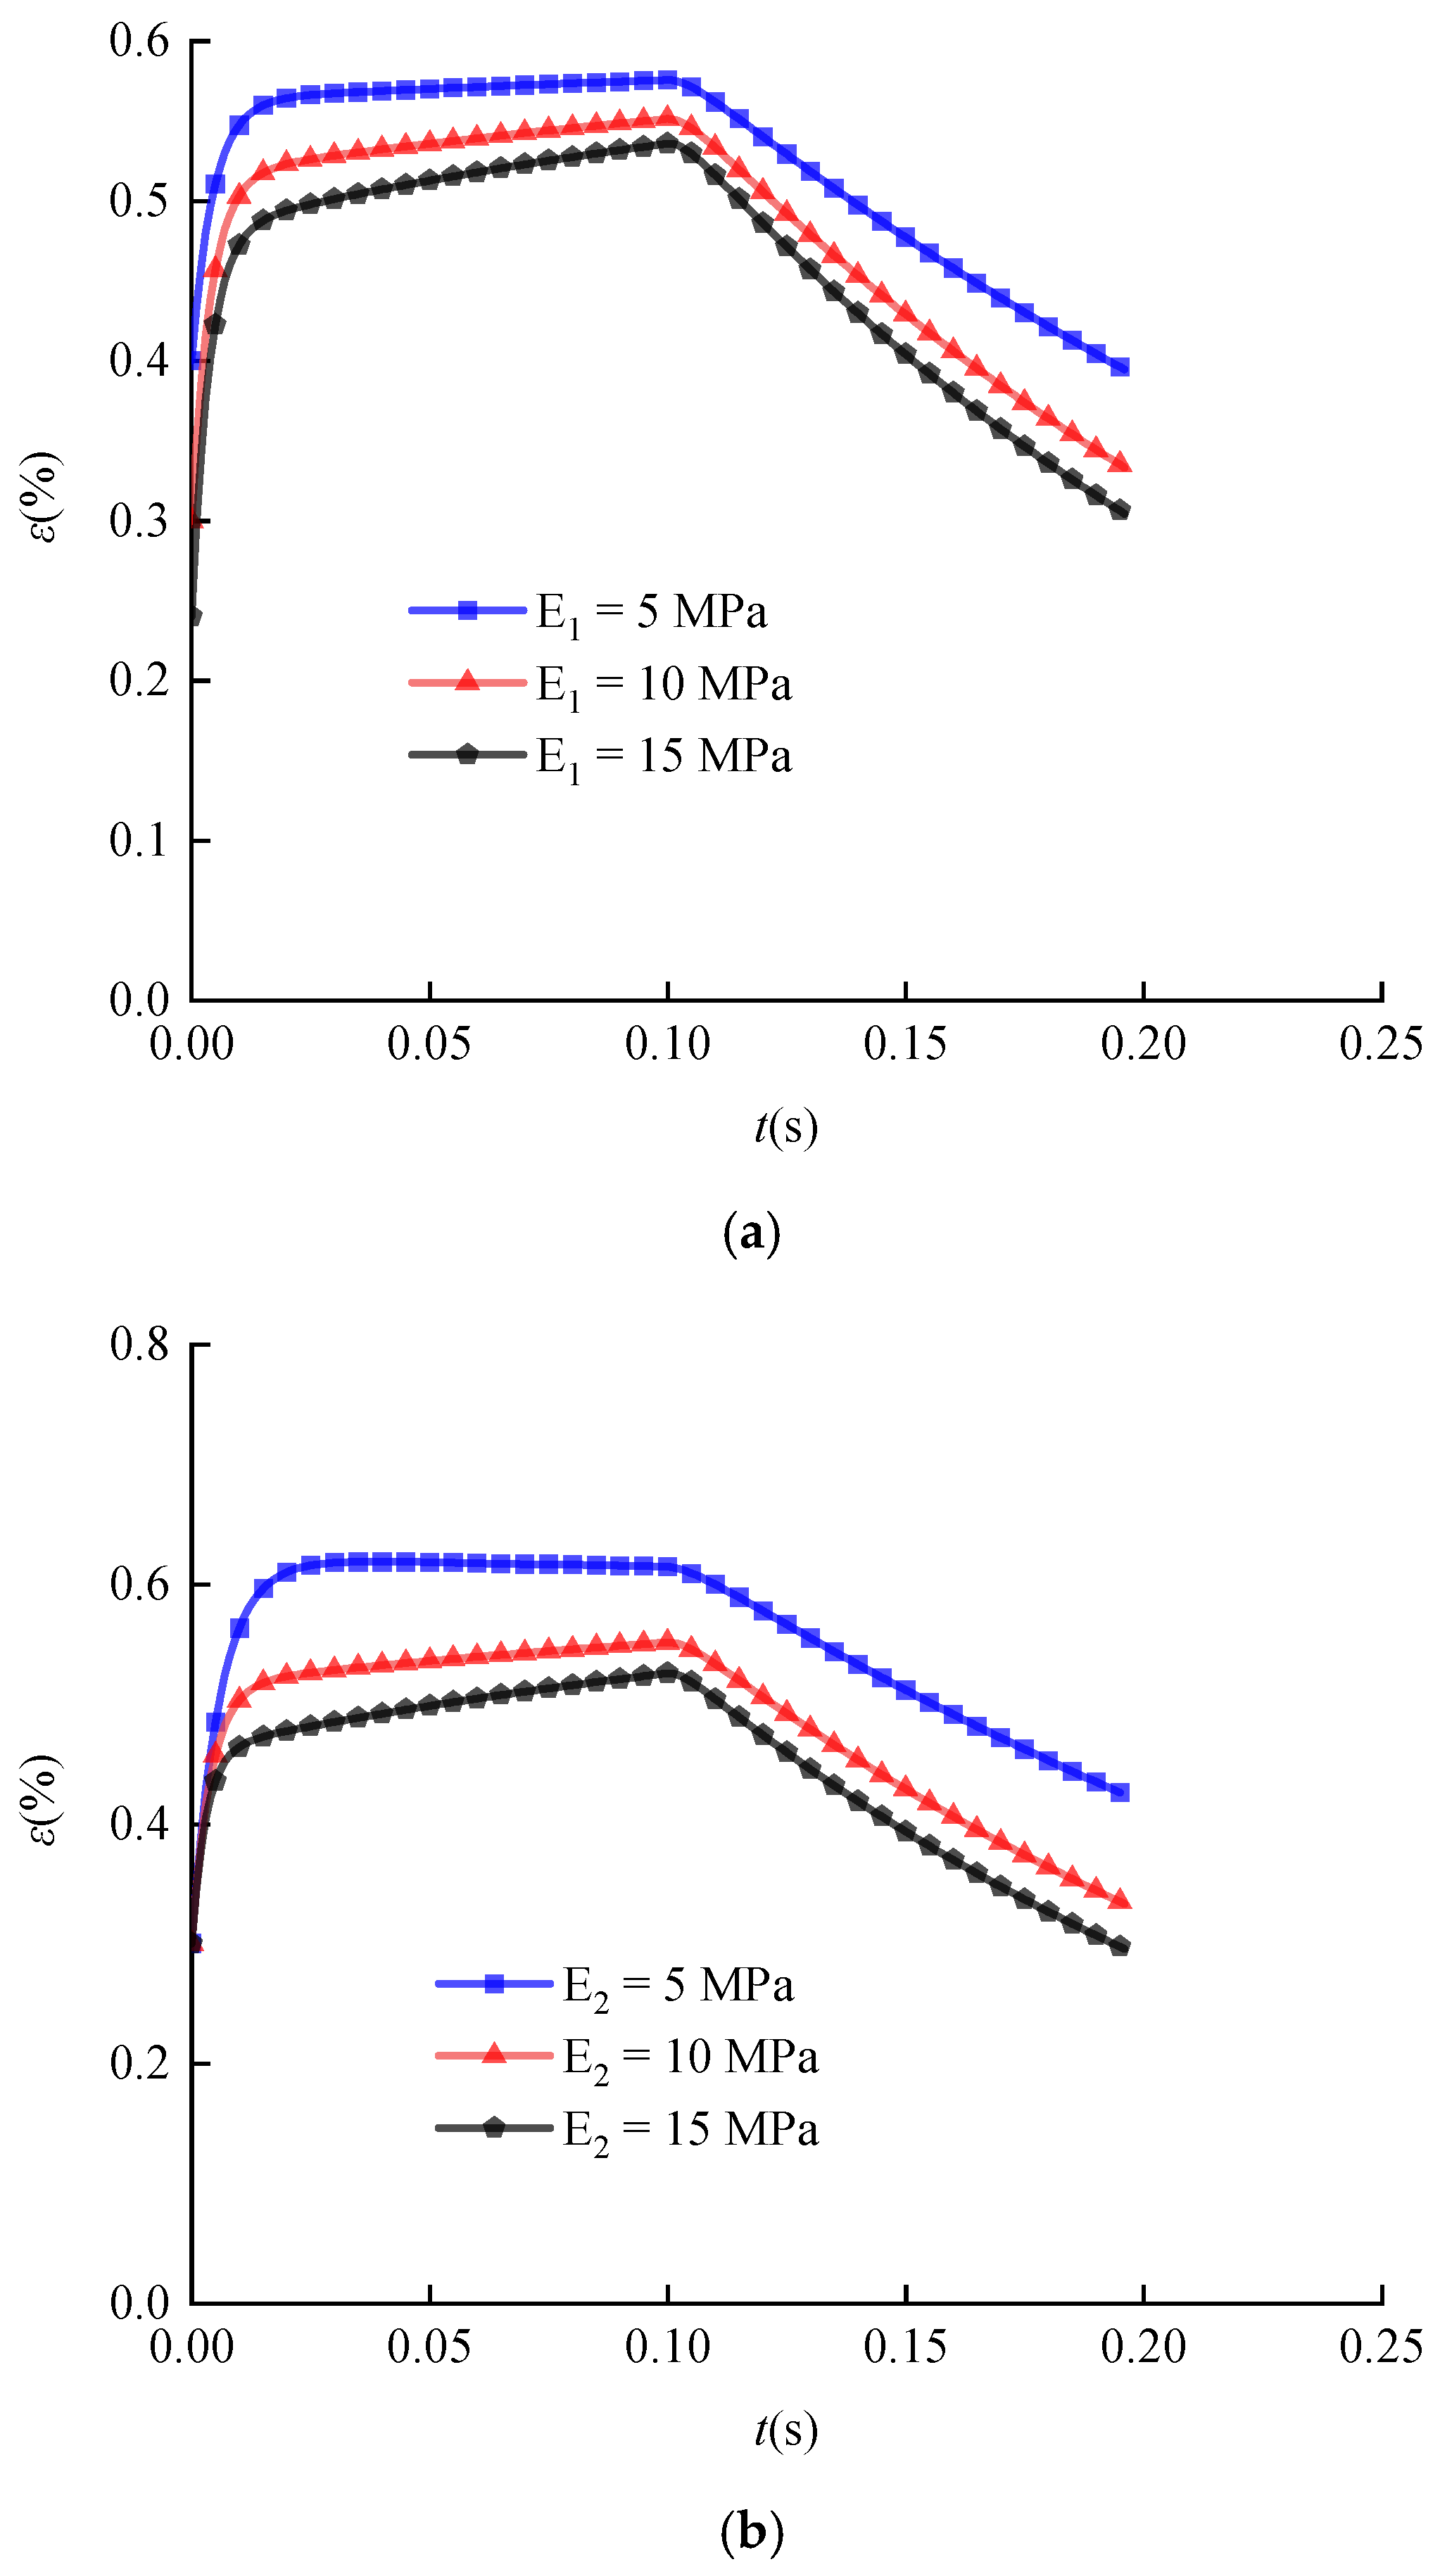
In Burger’s model, there are also elasticity elements with elasticity modulus of E 1 and E 2 . In the calibration process, we first determined the modulus and kept them constant when calibrating the time-dependent behavior. In this part, we conducted the numerical calculation based on Equation (13), and the time-dependent responses to different moduli are presented in Figure 25. We can find that the overall curves fell with the increase in both elasticity moduli E 1 and E 2 .

4. Conclusions

  • This paper presented a DEM-based method to evaluate the short-term and long-term stability of coastal karst caves. The long-term settlements of sinkholes are mainly dependent on viscosity, and the short-term collapsing only appears in weak bedrocks, which causes a much larger final deformation.
  • The local stress concentration surrounding caves brings potential risk to the local zones. If the bedrock has a relatively high strength, the presence of caves has little influence on the final modeling. In this study, when the value of rock strength reduced by 90%, the short-term and long-term behaviors of sinkholes were affected extensively.
  • The modeling proposed in this paper can predict long-term deformation after foundation pit excavation, and the prediction error is less than 10%. The modeling process can be calibrated from geological borehole data and applied to other geotechnical engineering practices in coastal karst areas.

Author Contributions

Conceptualization, C.L. and C.Z.; methodology, C.X.; software, C.X.; validation, C.Z., Z.L. and C.Z.; formal analysis, Z.L.; investigation, C.X and H.Z.; resources, C.X.; data curation, Z.L.; writing—original draft preparation, C.X.; writing—review and editing, Z.L.; visualization, C.X.; supervision, C.Z.; project administration, C.Z.; funding acquisition, C.Z. All authors have read and agreed to the published version of the manuscript.

Funding

This research was funded by the National Key R&D Program of China (Grant Number: 41977230); the Science and Technology Planning Project of Guangdong Province, China (Grant Numbers: 2015B090925016, 2016B010124007).

Institutional Review Board Statement

Not applicable.

Informed Consent Statement

Not applicable.

Data Availability Statement

All relevant data are within the manuscript.

Conflicts of Interest

The authors declare no conflict of interest.

References

  1. Al-Halbouni, D.; Holohan, E.P.; Taheri, A.; Schoepfer, M.P.J.; Emam, S.; Dahm, T. Geomechanical modelling of sinkhole development using distinct elements: Model verification for a single void space and application to the Dead Sea area. Solid Earth 2018, 9, 1341–1373. [Google Scholar] [CrossRef]
  2. Gutierrez, F.; Parise, M.; De Waele, J.; Jourde, H. A review on natural and human-induced geohazards and impacts in karst. Earth-Sci. Rev. 2014, 138, 61–88. [Google Scholar] [CrossRef]
  3. Liu, Z.; Liang, J.; Zhu, S.; Tan, J. Stability analysis of soil cave foundation in karst area. Hydrogeol. Eng. Geol. 2003, 30, 24–28. [Google Scholar]
  4. Huang, F.; Zhang, M.; Jiang, Z. Collapse mode of rock mass induced by a concealed karst cave above a deep cavity. J. Cent. South Univ. 2019, 26, 1747–1754. [Google Scholar] [CrossRef]
  5. Jiang, C.; Liu, L.; Wu, J.-P. A new method determining safe thickness of karst cave roof under pile tip. J. Cent. South Univ. 2014, 21, 1190–1196. [Google Scholar] [CrossRef]
  6. Liu, Z.; Liang, J.; Zhu, S.; Zhang, G. Stability analysis of rock foundation with cave in karst area. Chin. J. Geotech. Eng. 2003, 25, 629–633. [Google Scholar]
  7. Wadas, S.H.; Polom, U.; Krawczyk, C.M. High-resolution shear-wave seismic reflection as a tool to image near-surface subrosion structures—A case study in Bad Frankenhausen, Germany. Solid Earth 2016, 7, 1491–1508. [Google Scholar] [CrossRef]
  8. Arkin, Y.; Gilat, A. Dead Sea sinkholes—An ever-developing hazard. Environ. Geol. 2000, 39, 711–722. [Google Scholar] [CrossRef]
  9. Polom, U.; Alrshdan, H.; Al-Halbouni, D.; Holohan, E.P.; Dahm, T.; Sawarieh, A.; Atallah, M.Y.; Krawczyk, C.M. Shear wave reflection seismic yields subsurface dissolution and subrosion patterns: Application to the Ghor Al-Haditha sinkhole site, Dead Sea, Jordan. Solid Earth 2018, 9, 1079–1098. [Google Scholar] [CrossRef]
  10. Taqieddin, S.A.; Abderahman, N.S.; Atallah, M. Sinkhole hazards along the eastern Dead Sea shoreline area, Jordan: A geological and geotechnical consideration. Environ. Geol. 2000, 39, 1237–1253. [Google Scholar] [CrossRef]
  11. Yechieli, Y.; Abelson, M.; Bein, A.; Crouvi, O.; Shtivelman, V. Sinkhole “swarms” along the Dead Sea coast: Reflection of disturbance of lake and adjacent groundwater systems. Geol. Soc. Am. Bull. 2006, 118, 1075–1087. [Google Scholar] [CrossRef]
  12. Zheng, Y.; Qiu, C. On the Limitations of Protodyakonov’s Pressure Arch Theory. Mod. Tunn. Technol. 2016, 53, 1–8. [Google Scholar]
  13. Wang, Y.; Jing, H.; Zhang, Q.; Luo, N.; Yin, X. Prediction of Collapse Scope of Deep-Buried Tunnels Using Pressure Arch Theory. Math. Probl. Eng. 2016, 2016, 2628174. [Google Scholar] [CrossRef] [Green Version]
  14. Chen, C.-N.; Huang, W.-Y.; Tseng, C.-T. Stress redistribution and ground arch development during tunneling. Tunn. Undergr. Space Technol. 2011, 26, 228–235. [Google Scholar] [CrossRef]
  15. Li, L.C.; Tang, C.A.; Zhao, X.D.; Cai, M. Block caving-induced strata movement and associated surface subsidence: A numerical study based on a demonstration model. Bull. Eng. Geol. Environ. 2014, 73, 1165–1182. [Google Scholar] [CrossRef]
  16. Wang, S.R.; Wu, X.G.; Zhao, Y.H.; Hagan, P.; Cao, C. Evolution Characteristics of Composite Pressure-Arch in Thin Bedrock of Overlying Strata During Shallow Coal Mining. Int. J. Appl. Mech. 2019, 11, 1950030. [Google Scholar] [CrossRef]
  17. Zhou, P.; Jiang, Y.; Zhou, F.; Li, J.; Lin, M.; Lin, J.; Wang, Z. Study on pressure arch effect of xigeda strata tunnel based on experiment and discrete element simulation. Bull. Eng. Geol. Environ. 2022, 81, 199. [Google Scholar] [CrossRef]
  18. Al-Halbouni, D.; Holohan, E.P.; Taheri, A.; Watson, R.A.; Polom, U.; Schopfer, M.P.J.; Emam, S.; Dahm, T. Distinct element geomechanical modelling of the formation of sinkhole clusters within large-scale karstic depressions. Solid Earth 2019, 10, 1219–1241. [Google Scholar] [CrossRef]
  19. Carranza-Torres, C.; Reich, T. Analytical and numerical study of the stability of shallow underground circular openings in cohesive ground. Eng. Geol. 2017, 226, 70–92. [Google Scholar] [CrossRef]
  20. Carranza-Torres, C.; Fosnacht, D.; Hudak, G. Geomechanical analysis of the stability conditions of shallow cavities for Compressed Air Energy Storage (CAES) applications. Geomech. Geophys. Geo-Energy Geo-Resour. 2017, 3, 131–174. [Google Scholar] [CrossRef]
  21. Ding, J.; Wan, X.; Hong, Z.; Wang, J.; Mou, C. Excess Pore Water Pressure Induced by Installation of Precast Piles in Soft Clay. Int. J. Geomech. 2021, 21, 05021002. [Google Scholar] [CrossRef]
  22. Liu, Z.; He, X.; Fan, J.; Zhou, C. Study on the Softening Mechanism and Control of Red-Bed Soft Rock under Seawater Conditions. J. Mar. Sci. Eng. 2019, 7, 235. [Google Scholar] [CrossRef]
  23. Guo, L.; Jin, H.X.; Wang, J.; Shi, L. Undrained monotonic shear behavior of marine soft clay after long-term cyclic loading. Mar. Georesour. Geotechnol. 2020, 38, 854–866. [Google Scholar] [CrossRef]
  24. Liu, Z.; Zhou, C.; Li, B.; Zhang, L.; Liang, Y. Effects of grain dissolution-diffusion sliding and hydro-mechanical interaction on the creep deformation of soft rocks. Acta Geotech. 2020, 15, 1219–1229. [Google Scholar] [CrossRef]
  25. Zhang, R. Catastrophe analysis of deep tunnel above water-filled caves. J. Cent. South Univ. 2019, 26, 1820–1829. [Google Scholar] [CrossRef]
  26. Ren, F.; Zhang, D.; Cao, J.; Yu, M.; Li, S. Study on the Rock Mass Caving and Surface Subsidence Mechanism Based on an In Situ Geological Investigation and Numerical Analysis. Math. Probl. Eng. 2018, 2018, 6054145. [Google Scholar] [CrossRef]
  27. Guo, L.; Wang, S.; Sun, L.; Kang, Z.; Zhao, C. Numerical Simulation and Experimental Studies of Karst Caves Collapse Mechanism in Fractured-Vuggy Reservoirs. Geofluids 2020, 2020, 8817104. [Google Scholar] [CrossRef]
  28. Zhang, J.; Fang, C.; Zhu, J. Finite element phase analysis of karst-roof stability under pile foundation. J. Eng. Geol. 2014, 22, 78–85. [Google Scholar]
  29. Hu, Q.-g.; Zhang, K.-n.; Yang, J.-s. Finite element analysis of ultimate bearing capacity of strip footing above Karst cave. J. Cent. South Univ. (Sci. Technol.) 2005, 36, 694–697. [Google Scholar]
  30. Yang, J.; Zhang, J.; Zhang, Q.; Zhang, J. Finite element analysis of ultimate bearing capacity of circular footing above karst cave. Chin. J. Rock Mech. Eng. 2005, 24, 296–301. [Google Scholar]
  31. Slee, A.; McIntosh, P.D.; Woodward, C.; Wang, N.; Gadd, P. A rapid sediment pulse induced by glacial melting during the MIS 8/7e transition buried well-developed karst in the Railton Valley, Tasmania, Australia. Boreas 2022, 51, 185–200. [Google Scholar] [CrossRef]
  32. Hart, E.A. Dating and interpretation of recent clastic sediments in an urban cave. J. Cave Karst Stud. 2021, 83, 20–28. [Google Scholar] [CrossRef]
  33. Wang, J.; Zou, B.; Liu, Y.; Tang, Y.; Zhang, X.; Yang, P. Erosion-creep-collapse mechanism of underground soil loss for the karst rocky desertification in Chenqi village, Puding county, Guizhou, China. Environ. Earth Sci. 2014, 72, 2751–2764. [Google Scholar] [CrossRef]
  34. Yang, P.; Tang, Y.-Q.; Zhou, N.-Q.; Wang, J.-X.; She, T.-Y.; Zhang, X.-H. Characteristics of red clay creep in karst caves and loss leakage of soil in the karst rocky desertification area of Puding County, Guizhou, China. Environ. Earth Sci. 2011, 63, 543–549. [Google Scholar] [CrossRef]
  35. Salmi, E.F.; Nazem, M.; Giacomini, A. A Numerical Investigation of Sinkhole Subsidence Development over Shallow Excavations in Tectonised Weak Rocks: The Dolaei Tunnel’s Excavation Case. Geotech. Geol. Eng. 2017, 35, 1685–1716. [Google Scholar] [CrossRef]
  36. Fazio, N.L.; Perrotti, M.; Lollino, P.; Parise, M.; Vattano, M.; Madonia, G.; Di Maggio, C. A three-dimensional back-analysis of the collapse of an underground cavity in soft rocks. Eng. Geol. 2017, 228, 301–311. [Google Scholar] [CrossRef]
  37. Ezersky, M.G.; Legchenko, A.; Eppelbaum, L.; Al-Zoubi, A. Overview of the geophysical studies in the Dead Sea coastal area related to evaporite karst and recent sinkhole development. Int. J. Speleol. 2017, 46, 277–302. [Google Scholar] [CrossRef]
  38. Al-Halbouni, D.; Holohan, E.P.; Saberi, L.; Alrshdan, H.; Sawarieh, A.; Closson, D.; Walter, T.R.; Dahm, T. Sinkholes, subsidence and subrosion on the eastern shore of the Dead Sea as revealed by a close-range photogrammetric survey. Geomorphology 2017, 285, 305–324. [Google Scholar] [CrossRef]
  39. Potyondy, D.O.; Cundall, P.A. A bonded-particle model for rock. Int. J. Rock Mech. Min. Sci. 2004, 41, 1329–1364. [Google Scholar] [CrossRef]
  40. Xia, C.; Liu, Z.; Zhou, C. Burger’s Bonded Model for Distinct Element Simulation of the Multi-Factor Full Creep Process of Soft Rock. J. Mar. Sci. Eng. 2021, 9, 945. [Google Scholar] [CrossRef]
  41. Li, B.; Wong, R.C.K. Quantifying structural states of soft mudrocks. J. Geophys. Res. -Solid Earth 2016, 121, 3324–3347. [Google Scholar] [CrossRef]
  42. Pinyol, N.M.; Vaunat, J.; Alonso, E.E. A constitutive model for soft clayey rocks that includes weathering effects. Geotechnique 2007, 57, 137–151. [Google Scholar] [CrossRef]
  43. Maheshwari, P. Analysis of deformation of linear viscoelastic two layered laminated rocks. Int. J. Rock Mech. Min. Sci. 2021, 141, 104681. [Google Scholar] [CrossRef]
  44. Fahimifar, A.; Tehrani, F.M.; Hedayat, A.; Vakilzadeh, A. Analytical solution for the excavation of circular tunnels in a visco-elastic Burger’s material under hydrostatic stress field. Tunn. Undergr. Space Technol. 2010, 25, 297–304. [Google Scholar] [CrossRef]
  45. Cundall, P.A.; Strack, O.D.L. A discrete numerical model for granular assemblies. Geotechnique 1979, 29, 47–65. [Google Scholar] [CrossRef]
  46. Lo Presti, D.C.F.; Pallara, O.; Cavallaro, A.; Jamiolkowski, M. Influence of reconsolidation techniques and strain rate on the stiffness of undisturbed clays from triaxial tests. Geotech. Test. J. 1999, 22, 211–225. [Google Scholar]
  47. Cheng, Y.; Wong, L.N.Y. A study on mechanical properties and fracturing behavior of Carrara marble with the flat-jointed model. Int. J. Numer. Anal. Methods Geomech. 2020, 44, 803–822. [Google Scholar] [CrossRef]
  48. Li, B.; Guo, L.; Zhang, F.-S. Macro-micro investigation of granular materials in torsional shear test. J. Cent. South Univ. 2014, 21, 2950–2961. [Google Scholar] [CrossRef]
  49. Lin, C.; Xia, C.; Liu, Z.; Zhou, C. A Comprehensive Correlation Study of Structured Soils in Coastal Area of South China about Structural Characteristics. J. Mar. Sci. Eng. 2022, 10, 508. [Google Scholar] [CrossRef]
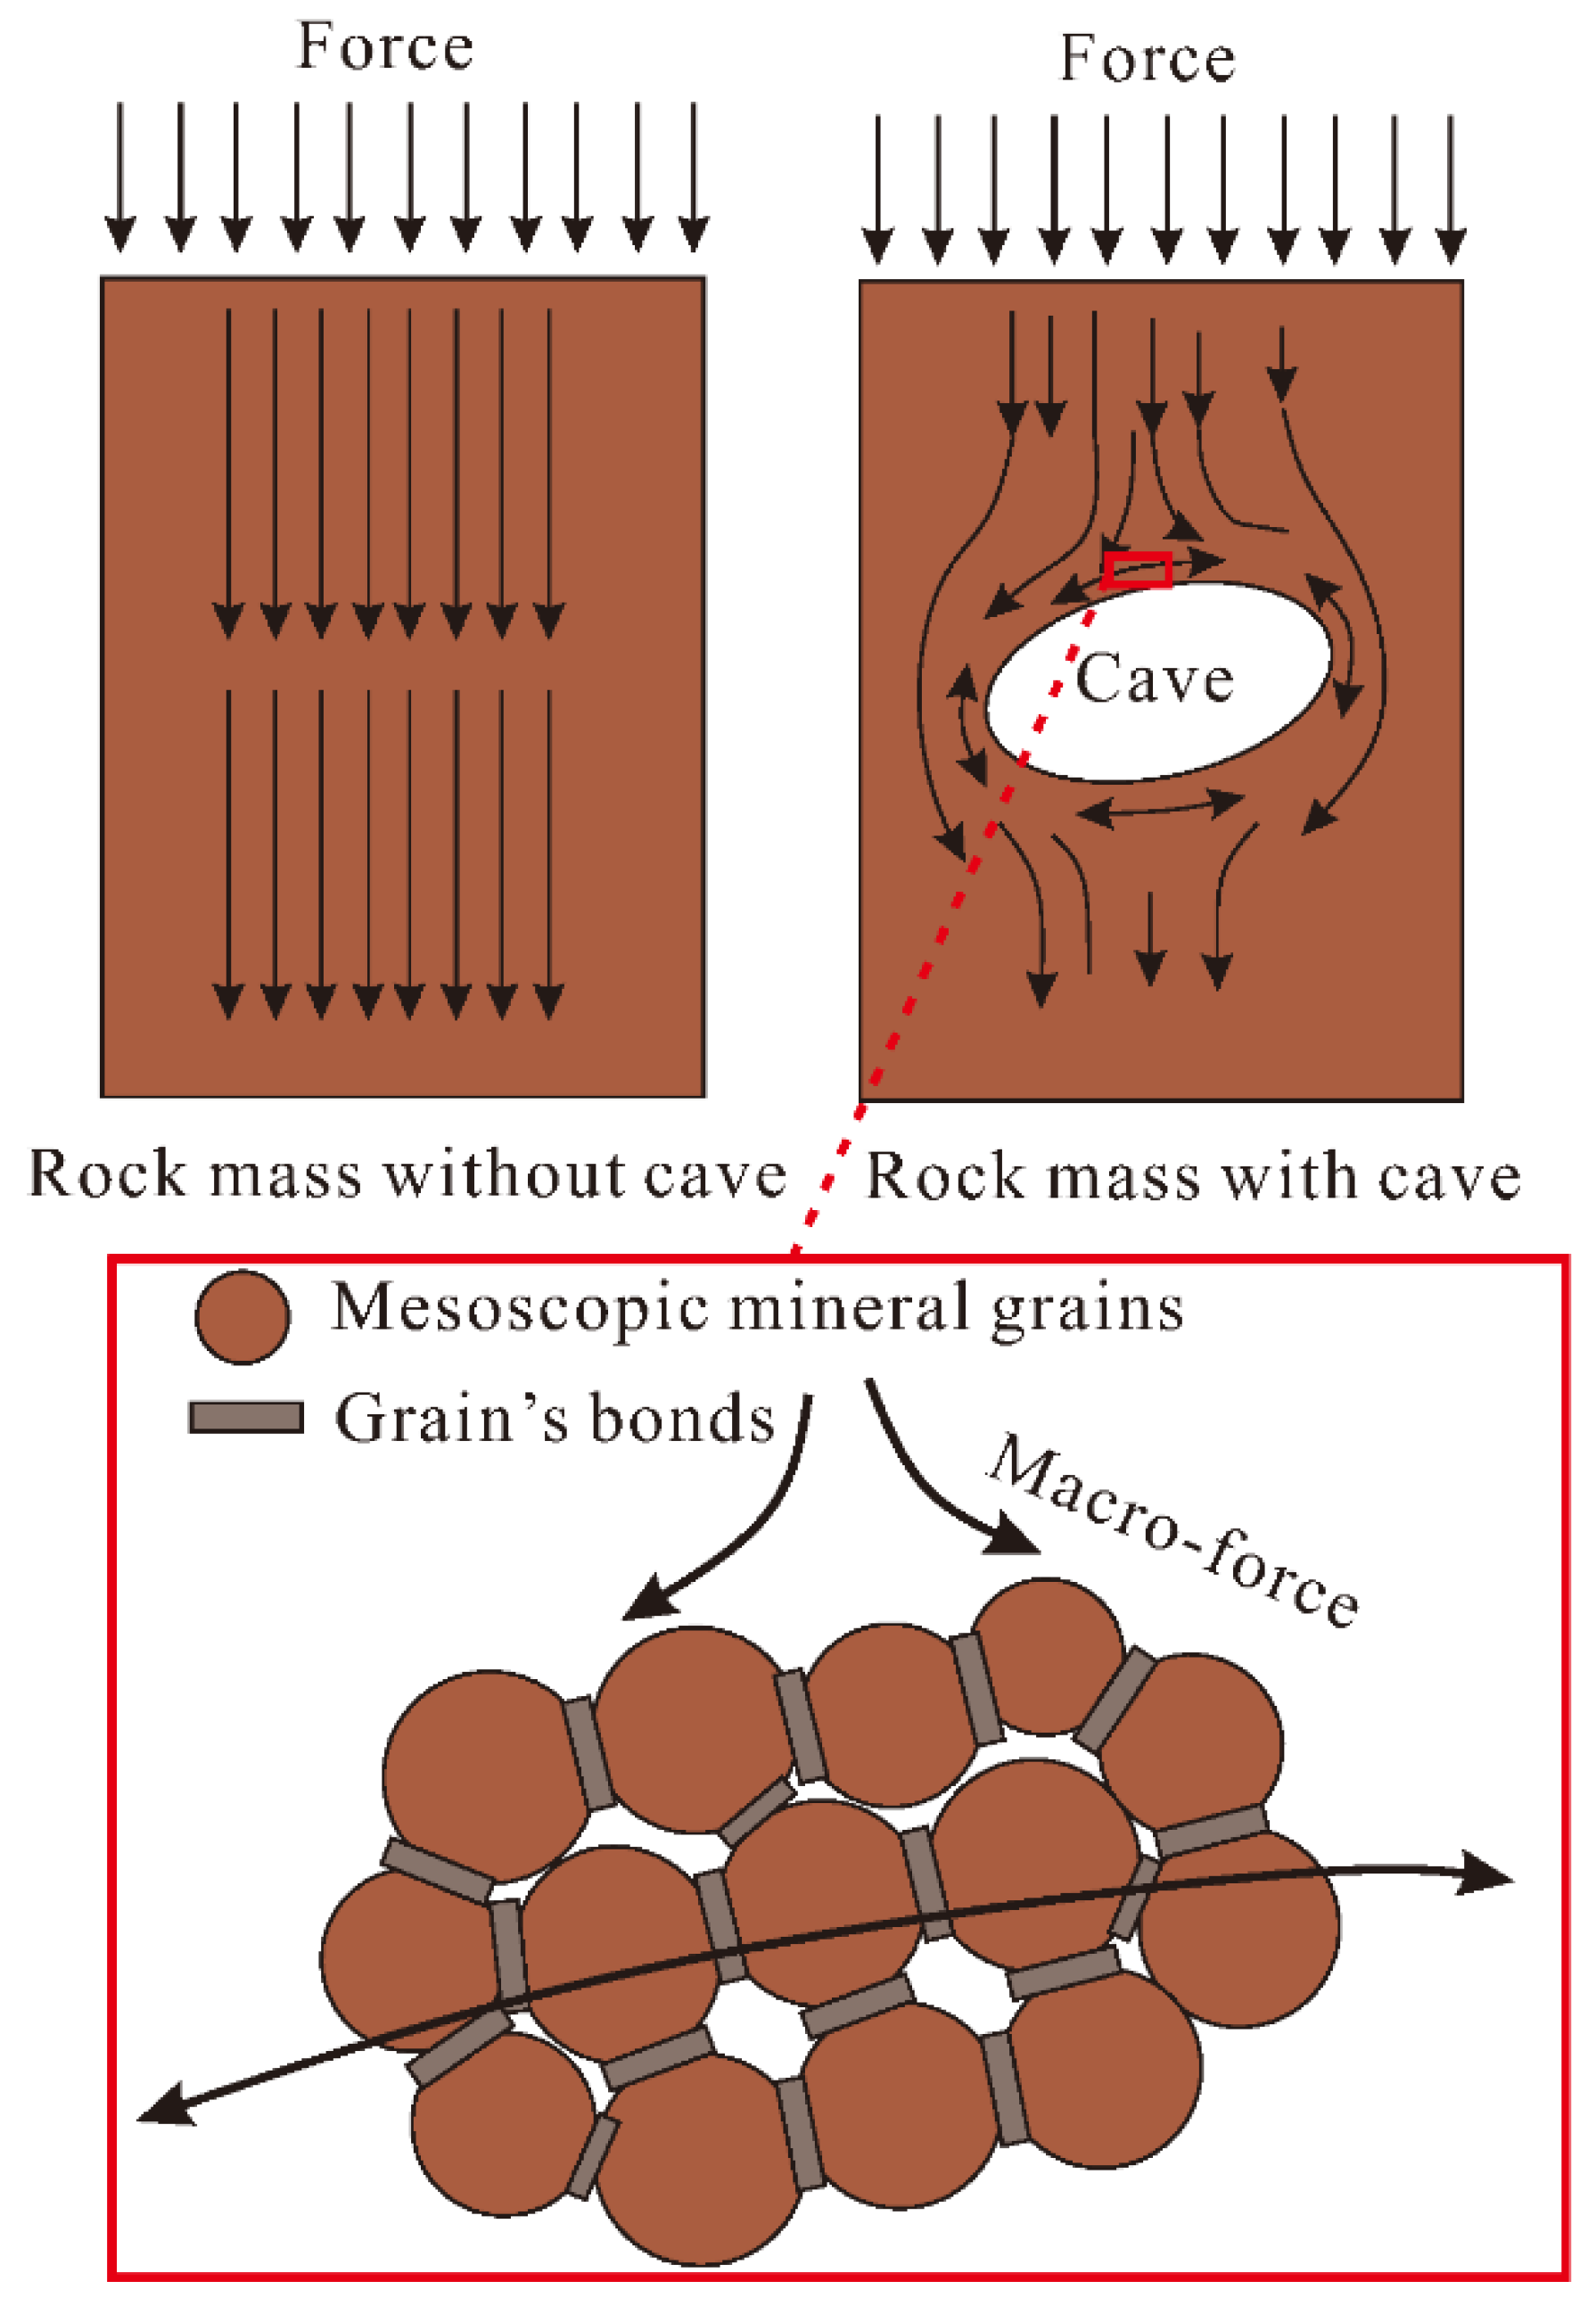
Figure 1. Different force patterns with or without caves.
Jmse 10 01315 g001
Figure 2. Mesoscopic force patterns and the corresponded strength curve.
Jmse 10 01315 g002
Figure 3. The creep mechanism in coastal karst cavern areas.
Jmse 10 01315 g003
Figure 4. Burger’s creep model.
Jmse 10 01315 g004
Figure 5. Diagram of the creep-modified model.
Jmse 10 01315 g005
Figure 6. Schematic diagram of a numerical scheme for the simulation of rock rheology in a karst area.
Jmse 10 01315 g006
Figure 7. Schematic diagram of a numerical scheme for the simulation of soil rheology in a karst area.
Jmse 10 01315 g007
Figure 8. Geological information surrounding the foundation pit.
Jmse 10 01315 g008
Figure 9. Vertical displacement monitoring data at the top of the slope.
Jmse 10 01315 g009
Figure 10. On-site borehole sample collection.
Jmse 10 01315 g010
Figure 11. Stress–strain curves of “filled soil”.
Jmse 10 01315 g011
Figure 12. Stress–strain curves of “silty clay”.
Jmse 10 01315 g012
Figure 13. The calibration result of the stress–strain curve shows strength (a) and Young’s modulus (b).
Jmse 10 01315 g013
Figure 14. The numerical time-dependent response after altering viscosity coefficients (a) η 1 ; (b) η 2 .
Jmse 10 01315 g014
Figure 15. The DEM model of the foundation stratum.
Jmse 10 01315 g015
Figure 16. The stress values in measuring points “1”, “2” and “3”.
Jmse 10 01315 g016
Figure 17. Contact force chain characteristics with or without caves (lines in these figures reveal the force state of material; the direction and width of lines represent the force direction and magnitude, respectively).
Jmse 10 01315 g017
Figure 18. The grain displacement vector arrows with or without caves.
Jmse 10 01315 g018
Figure 19. Predicted and monitored vertical displacement of the slope using different random seeds: (a) random seed 1; (b) random seed 2; (c) random seed 3.
Jmse 10 01315 g019
Figure 20. The stress and mesoscopic damage in different overlying loads: (a) stress–time series; (b) mesoscopic damage and grains’ velocities.
Jmse 10 01315 g020aJmse 10 01315 g020b
Figure 21. Comparison on the foundation between caved or not caved condition, the settlement lines compare the long-term deformation, and the grains’ figures compare the collapsing condition and also the quantitively counted crack number; in this case, the tension strength and cohesion strength are 1.0 MPa and 0.4 MPa.
Jmse 10 01315 g021
Figure 22. Comparison on the foundation between caved or not caved condition, the settlement lines compare the long-term deformation, and the grains’ figures compare the collapsing condition and also the quantitively counted crack number; in this case, the tension strength and cohesion strength are 2.0 MPa and 0.8 MPa.
Jmse 10 01315 g022
Figure 23. Comparison on the foundation between caved or not caved condition, the settlement lines compare the long-term deformation, and the grains’ figures compare the collapsing condition and also the quantitively counted crack number; in this case, the tension strength and cohesion strength are 3.0 MPa and 1.2 MPa.
Jmse 10 01315 g023
Figure 24. The time-dependent behavior of modeling using different viscosity coefficients: (a) monitoring point at left side; (b) monitoring point at right side.
Jmse 10 01315 g024
Figure 25. The numerical time-dependent response after altering elastic modulus: (a) E 1 ; (b) E 2 .
Jmse 10 01315 g025
Table 1. Governing equations of Maxwell model, Kelvin model and Burger’s model.
Type of ModelGoverning EquationCreep Equation
Maxwell model σ = E 1 ε k + η 1 ε k ˙ ε = σ 0 E 1 1 exp E 1 η 1 t
Kelvin model ε M ˙ = σ ˙ E 2 + σ η 2 ε M = 1 η 2 σ 0 t + σ 0 E 2
Burger’s model σ ¨ + E 2 η 1 + E 2 η 2 + E 1 η 1 σ ˙ + E 1 η 1 E 2 η 2 σ = E 0 ε ¨ + E 1 E 2 η 1 ε ˙ ε = σ 0 E 2 + σ η 2 t + σ 0 E 1 1 e E 1 η 1 t
Table 2. Soil parameters of the foundation.
Soil TypesUnit Weight (kN/m3)Modulus (MPa)Friction Angle (°)Cohesion (kPa)
Filled soil18.54.0012.04.0
Medium coarse sand204.0012.04.0
Clay207.0018.020.0
Table 3. Rock parameters of the foundation.
Rock TypesUniaxial Strength (MPa)Saturated Strength (MPa)Modulus (MPa)Unit Weight (kN/m3)
Limestone251295626
Table 4. Mechanical and physical properties used in mesoscopic-scale analysis.
Parameters Used in DEM Elastic AnalysisValue
PBM tensile strength (MPa)30
PBM cohesion strength (MPa)11
PBM modulus (GPa)0.6
PBM friction angle (°)20
Linear elastic modulus of “filled soil” and “coarse sand” (MPa)2
Friction angle of “filled soil” and “coarse sand” (°)20
Linear elastic modulus of “silty clay” (MPa)2.5
Friction angle of “silty clay” (°)30
Ratio of normal to shear stiffness1.2
Particle friction coefficient0.57
Density of particles (kg/m3)1850~2500
Mean particle radius (mm)0.42
Damping coefficient0.5
Parameters used in DEM time-dependent analysis
Kelvin viscosity coefficient (106)1
Maxwell viscosity coefficient (106)2.5
Kelvin modulus of rock (GPa)0.6
Kelvin modulus of “filled soil” and “coarse sand” (MPa)2
Maxwell modulus of rock (GPa)0.6
Maxwell modulus of “silty clay” (MPa)2
Publisher’s Note: MDPI stays neutral with regard to jurisdictional claims in published maps and institutional affiliations.