Article

Effect of Hydrate Microscopic Distribution on Acoustic Characteristics during Hydrate Dissociation: An Insight from Combined Acoustic-CT Detection Study

1
Key Laboratory of Gas Hydrate, Ministry of Natural Resources, Qingdao Institute of Marine Geology, Qingdao 266237, China
2
Laboratory for Marine Mineral Resources, Qingdao National Laboratory for Marine Science and Technology, Qingdao 266237, China
3
Qingdao Geo-Engineering Surveying Institute (Qingdao Geological Exploration and Development Bureau), Qingdao 266100, China
4
Key Laboratory of Geological Safety of Coastal Urban Underground Space, Ministry of Natural Resources, Qingdao 266100, China
*
Authors to whom correspondence should be addressed.
J. Mar. Sci. Eng. 2022, 10(8), 1089; https://doi.org/10.3390/jmse10081089
Submission received: 7 June 2022 / Revised: 6 August 2022 / Accepted: 7 August 2022 / Published: 9 August 2022

Abstract

:
Geophysical detection techniques are important methods in marine gas hydrate exploration and monitoring, because the small-scale distribution of hydrates has a large impact on the wave velocity. The acoustic response characteristics of hydrate micro-distributions have strong significance for monitoring the hydrate dissociation process. In this paper, experiments simulating the hydrate dissociation process were carried out in a self-developed experimental device combining X-ray computed tomography (X-CT) scanning and ultrasonic detection, which allowed the acoustic wave characteristics and X-CT scanning results to be simultaneously obtained during the hydrate dissociation process. This study found that the hydrate dissociation stage is divided into three stages. The hydrate begins to dissociate at spots where it comes into touch with sand particles early in the dissociation process. The main factor affecting the acoustic wave velocity of hydrates in this stage is changes in the microscopic distribution of hydrate. In the middle stage, a large amount of hydrate decomposes, and the main factor affecting the acoustic wave velocity of hydrate in this stage is the change in hydrate content. In the later stage of hydrate dissociation, the hydrate distribution pattern consists mainly of the pore-filling type, and the hydrate micro-distribution at this stage is the main factor affecting the acoustic wave velocity. This study will be of great significance for understanding the microscopic control mechanism of hydrate reservoir geophysical exploration.

1. Introduction

Compared with the conventional oil and gas resources, natural gas hydrates are characterized by wide distribution, large scale and shallow buried depth, and are considered as an important potential energy source for the 21st century [1,2]. In the process of gas hydrate production, the relationship between hydrates, sediments, and pore fluids is highly important. It not only affects the further decomposition and production of gas hydrates, but also affects the hydrate reservoir stability and sand production problems involved in fluid flow during hydrate production [3,4,5,6]. Most importantly, the state in which hydrates occur is often directly reflected in the geophysical monitoring data of the reservoir.
The exploration and development of marine gas hydrate resources is difficult and requires a high degree of environmental protection, so it is necessary to carry out large-scale dynamic monitoring of hydrate reservoirs. No relevant technical system has been established either at home or abroad for such monitoring of natural gas hydrate reservoirs. However, large-scale monitoring of reservoirs is essential in the process of hydrate development [7]. In 2013, Japan achieved the world’s first successful pilot test of marine gas hydrate production. During the production process, the decomposition performance of submarine gas hydrate and its impact on the surrounding environment were closely monitored [8]. In 2017, China conducted the first trial production of natural gas hydrate in the South China Sea and achieved success. The reservoir and surrounding environment were also monitored during the production process [9]. At present, test production of hydrate around the world mainly uses the depressurization method, which reduces the originally stable pressure of the seabed, thereby disrupting the accumulation conditions for natural gas hydrate, so that the hydrate begins to decompose. This decomposition process involves an important and critical progression, from the initial steady state of hydrate to the process of decomposing and stripping sediments. This critical point is highly significant for the stability of hydrate reservoirs, and sand production problems involved in fluid flow during hydrate production. Previous research studies have not conducted in-depth research or discussion of this issue due to limitations in the experimental technology, which prevents the direct observation and geophysical monitoring of the hydrate decomposition process at the same time.
Geophysical detection techniques are still an important means of marine gas hydrate exploration and monitoring [10,11,12,13,14]. Acoustic detection is a particularly effective means of gas hydrate detection, which can effectively identify the state of hydrate decomposition and separation from sediments. Compared with acoustic detection, other detection methods have certain limitations. For example, in mechanical property testing, it is possible for changes in mechanical properties to be more sensitive to the destruction of the deposition system. For resistivity detection, changes in hydrate saturation have a strong influence on the resistivity of the sedimentary medium, so the changes in resistivity mostly reflect variations in hydrate resources. Natural gas hydrates have larger elastic wave parameters than pore fluids, and hydrate-bearing sediments generally have higher P- and S-wave velocities [15]. Many studies targeting the acoustic characteristics of hydrate-bearing sediments have been carried out, and a rich series of data has been obtained, of which the research carried out by the United States Geological Survey [16,17], the University of Southampton [18,19,20,21], the Georgia Institute of Technology [22], and the Qingdao Institute of Marine Geology [23,24,25,26] are especially prominent.
There are three classical hydrate microdistribution types proposed by Eeker [27]: the pore filling, particle contact, and cementation modes. On the basis of Eeker, Jiang et al. [28] changed the three main forms of the hydrate in the pore space in the model to the pore-filling type, framework/particle-supported type, and cemented type. Theoretical model inference and direct observation are the mainstays of research on microscopic distribution patterns in hydrate (X-ray computed tomography technology, etc.). Priest et al. [20], Waite et al. [15], and Sultaniya et al. [21] all used a combination of experimentation and theory to deduce the microscopic distribution patterns of hydrates. Using X-ray computed tomography (X-CT) technology, researchers can see the microscopic distribution of hydrates in the sediment pore space. Several researchers have used X-CT technology to see the microscopic distribution of hydrates, and have had good findings [29,30,31,32,33,34,35,36]. Li et al. [37,38] used the sediments taken from the Shenhu Sea area of the South China Sea as a medium to conduct hydrate formation experiments and used X-CT technology to observe the hydrate formation process online. Lei et al. [39,40,41] conducted a series of studies with X-CT technology to determine the pore habit of methane hydrate and its evolution in the sediment matrix.
In hydrate-bearing sediments, the relationship between the components will affect the acoustic characteristics, and the microscopic distribution of hydrates can be studied by analyzing the acoustic properties [42,43]. Sahoo et al. observed changes in geophysical properties and hydrate morphology separately during methane hydrate growth in sand. They observed ultrasonic P- and S-wave velocities as well as electrical resistivity while conducting X-ray synchrotron time-lapse 4D imaging of methane hydrate evolution in sand [44]. In our previous study, we investigated the effect of microscopic distributions on the acoustic response characteristics during hydrate dissociation by observing the elastic wave velocity and hydrate saturation during hydrate dissociation using X-CT imaging. However, we conducted the experiments in a different experimental setup [26], where acoustic detection and microscopic observation of hydrates were carried out separately, in which simultaneous detection and observation of the same sediment could not be performed. During the hydrate dissociation process, the hydrate distribution state has a significant impact on the reservoir and its acoustic response. In this study, a new acoustic device combined with CT scanning was used to realize the joint monitoring of reservoir acoustic properties and CT imaging in different stages of hydrate decomposition, and the response relationship between hydrate dissociation state and acoustic properties was analyzed and obtained. Combined with the previous understanding of the microscopic distribution and acoustic characteristics of hydrate, we can further obtain the decomposition process and microscopic distribution characteristics of hydrate in sediments, naturally. Therefore, this study uses a new experimental technique that combines ultrasonic detection technology and X-CT technology synchronously, to conduct ultrasonic detection experiments at the same time as X-CT scanning. The acoustic velocity is detected in real time, and the direct X-CT scanning results are observed. The acoustic response mechanism of hydrate dissociation is analyzed in the context of rock physics theory. The results will have great significance for geophysical monitoring and evaluating resources for hydrate development.

2. Materials and Methods

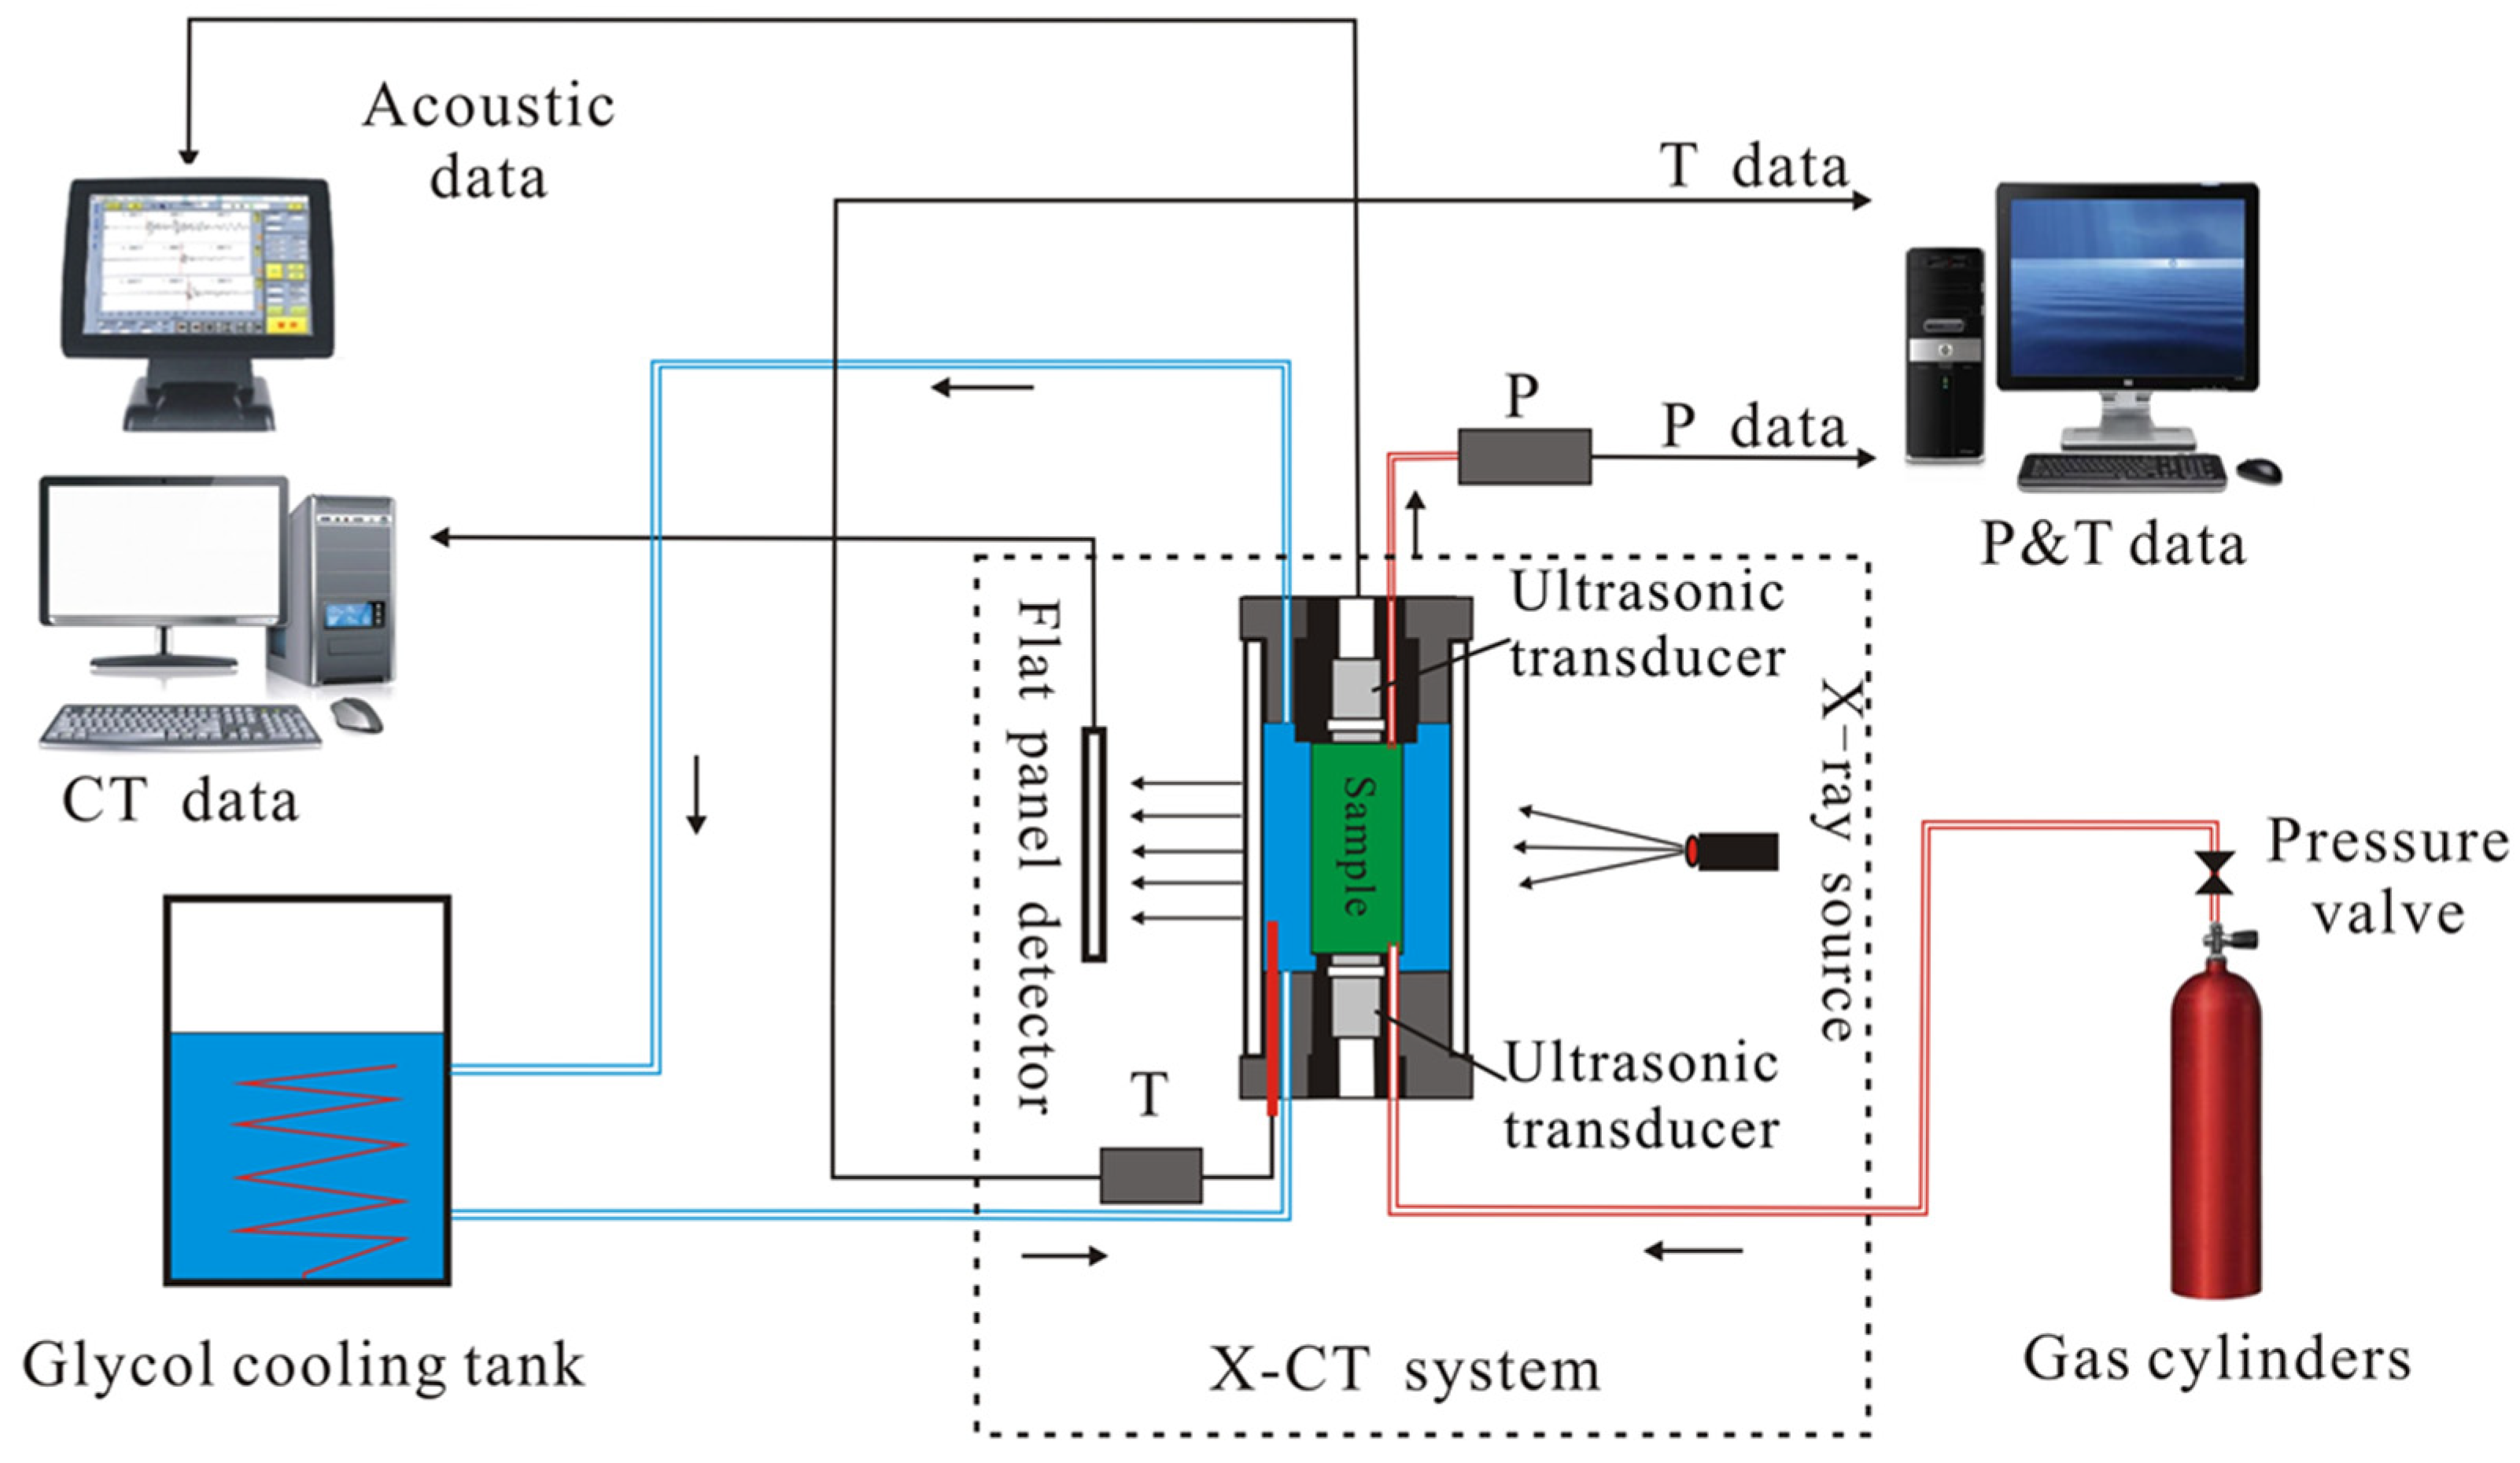
2.1. Experimental Device and Materials

The experimental setup used for hydrate simulations includes a gas supply system, a refrigeration system, a high-pressure reaction chamber for X-CT scanning, an X-CT system, and a data acquisition system (Figure 1). The data acquisition system includes pressure and temperature data, CT data, and acoustic data acquisition. The high-pressure reaction chamber used for X-CT scanning meets the requirements for X-ray penetration. The diameter of the sample chamber is 25 mm and the height is 50 mm. The barrel is made of PEEK plastic, which has high strength and is lightweight, and allows good penetration of X-rays. At the same time, circumferential winding of carbon fiber is used for reinforcement, which completely prevents accidental damage to the plastic materials and greatly improves the safety of the experimental equipment. The high-pressure gas from a methane gas cylinder can be set to the pressure required by the experiment through a pressure-reducing valve. The gas enters from the lower end of the sample chamber, enters the bottom of the sample after passing through a filter, passes through the sample, then passes through the filter at the upper part of the sample. The upper air hole can measure pressure or discharge. The pore pressure is designed to be 15 MPa, with a pressure sensor accuracy of 0.1 FS. The pressure range is 0–20 MPa (accuracy is ±0.1 MPa). The experimental device cools the sample in the sample chamber by circulating low-temperature liquid, which circulates in the space between the outer cylinder and the inner cylinder to provide the sample with the low-temperature environment required for hydrate formation. The temperature sensor is located in the lower part of the low-temperature circulation chamber, the temperature range is −10–50 °C, which has an accuracy of ±0.1 °C. An ultrasonic transducer is installed at both ends of the sample, with a probe size of ф 15 × 20 mm. The main frequency of the ultrasonic transducer is 200 kHz. The acoustic data acquisition system uses the HS-CS4EL ultrasonic tester developed by the Xiangtan Tianhong Electronics Research Institute. The X-ray CT scanner is a Phoenix v|tome|xs, GE Sensing and Inspection Technologies. The X-ray source has two X-ray tubes, one 180 kV X-ray tube, and one 240 kV X-ray tube, and the scanner also has a 16-bit digital flat panel detector. with a nano-focus X-ray source and a 16-bit digital flat panel detector [37,38].
Sand with a particle size of 500 μm to 600 μm was employed as the deposition medium in this experiment, and the solution is 3.5% NaCl, while the gas used in the experiment is pure methane gas, with a purity of 99.99%.

2.2. Experimental Methods and Procedures

Based on the size of the experimental sample, the X-CT scan operated at a voltage of 120 kV, a current of 100 µA, and a detector exposure time of 333 ms. For a more detailed description of the X-CT experimental system, X-CT image acquisition, X-CT image analysis, and the components and boundary identification, readers can refer to references [37,38].
The 3D resolution of the X-CT scanning image was 40 µm and 30 µm; each time the sample was scanned, two scans were performed, the first to scan the entire sample (image resolution of 40 μm), and the second to enlarge the sample to the upper limit size (image resolution of 30 μm) according to the size of the experimental instrument. In this study, the CT image method was used to calculate the hydrate saturation, which is the ratio of the hydrate volume to the total pore volume occupied by hydrate, NaCl solution, and methane gas.
The wave velocity in the sample was obtained by measuring the length of the experimental sample and the propagation time of the wave. The position of the ultrasonic transducer is fixed prior to the experiment in order to calculate the length of the sample between the probes. The arrival time of the first wave from the sample during the experiment was measured by an ultrasonic tester.
The experimental steps of this study are as follows:
  • Measure 25 mL (sample volume) of the experiment sand with a graduated cylinder, and mix 3.5% NaCl solution (80% saturated water content) with the sand;
  • Install the bottom ultrasonic transducer and encapsulation end cap on the experiment sample cavity, place the mixture of sand and NaCl solution into the reaction cavity, and then install the top ultrasonic transducer and encapsulation end cap into the experiment sample cavity on the body;
  • Evacuate the reaction chamber to remove the air inside;
  • Open the temperature and pressure data acquisition software, and flow methane gas into the reaction chamber to reach the specified pressure;
  • Lower the temperature of the refrigeration system and begin to form hydrates;
  • Begin the hydrate decomposition process, and use a step-wise heating method to decompose the hydrate;
  • After each temperature increase, perform two X-CT scans after the experimental system becomes stable;
  • Ultrasonic data acquisition is carried out during the hydrate decomposition experiment, and ultrasonic data acquisition must be carried out synchronously during X-CT scanning until hydrate decomposition is complete;
  • Hydrate decomposition is considered complete when the pressure no longer changes after the experimental system is raised to a higher temperature.

3. Results

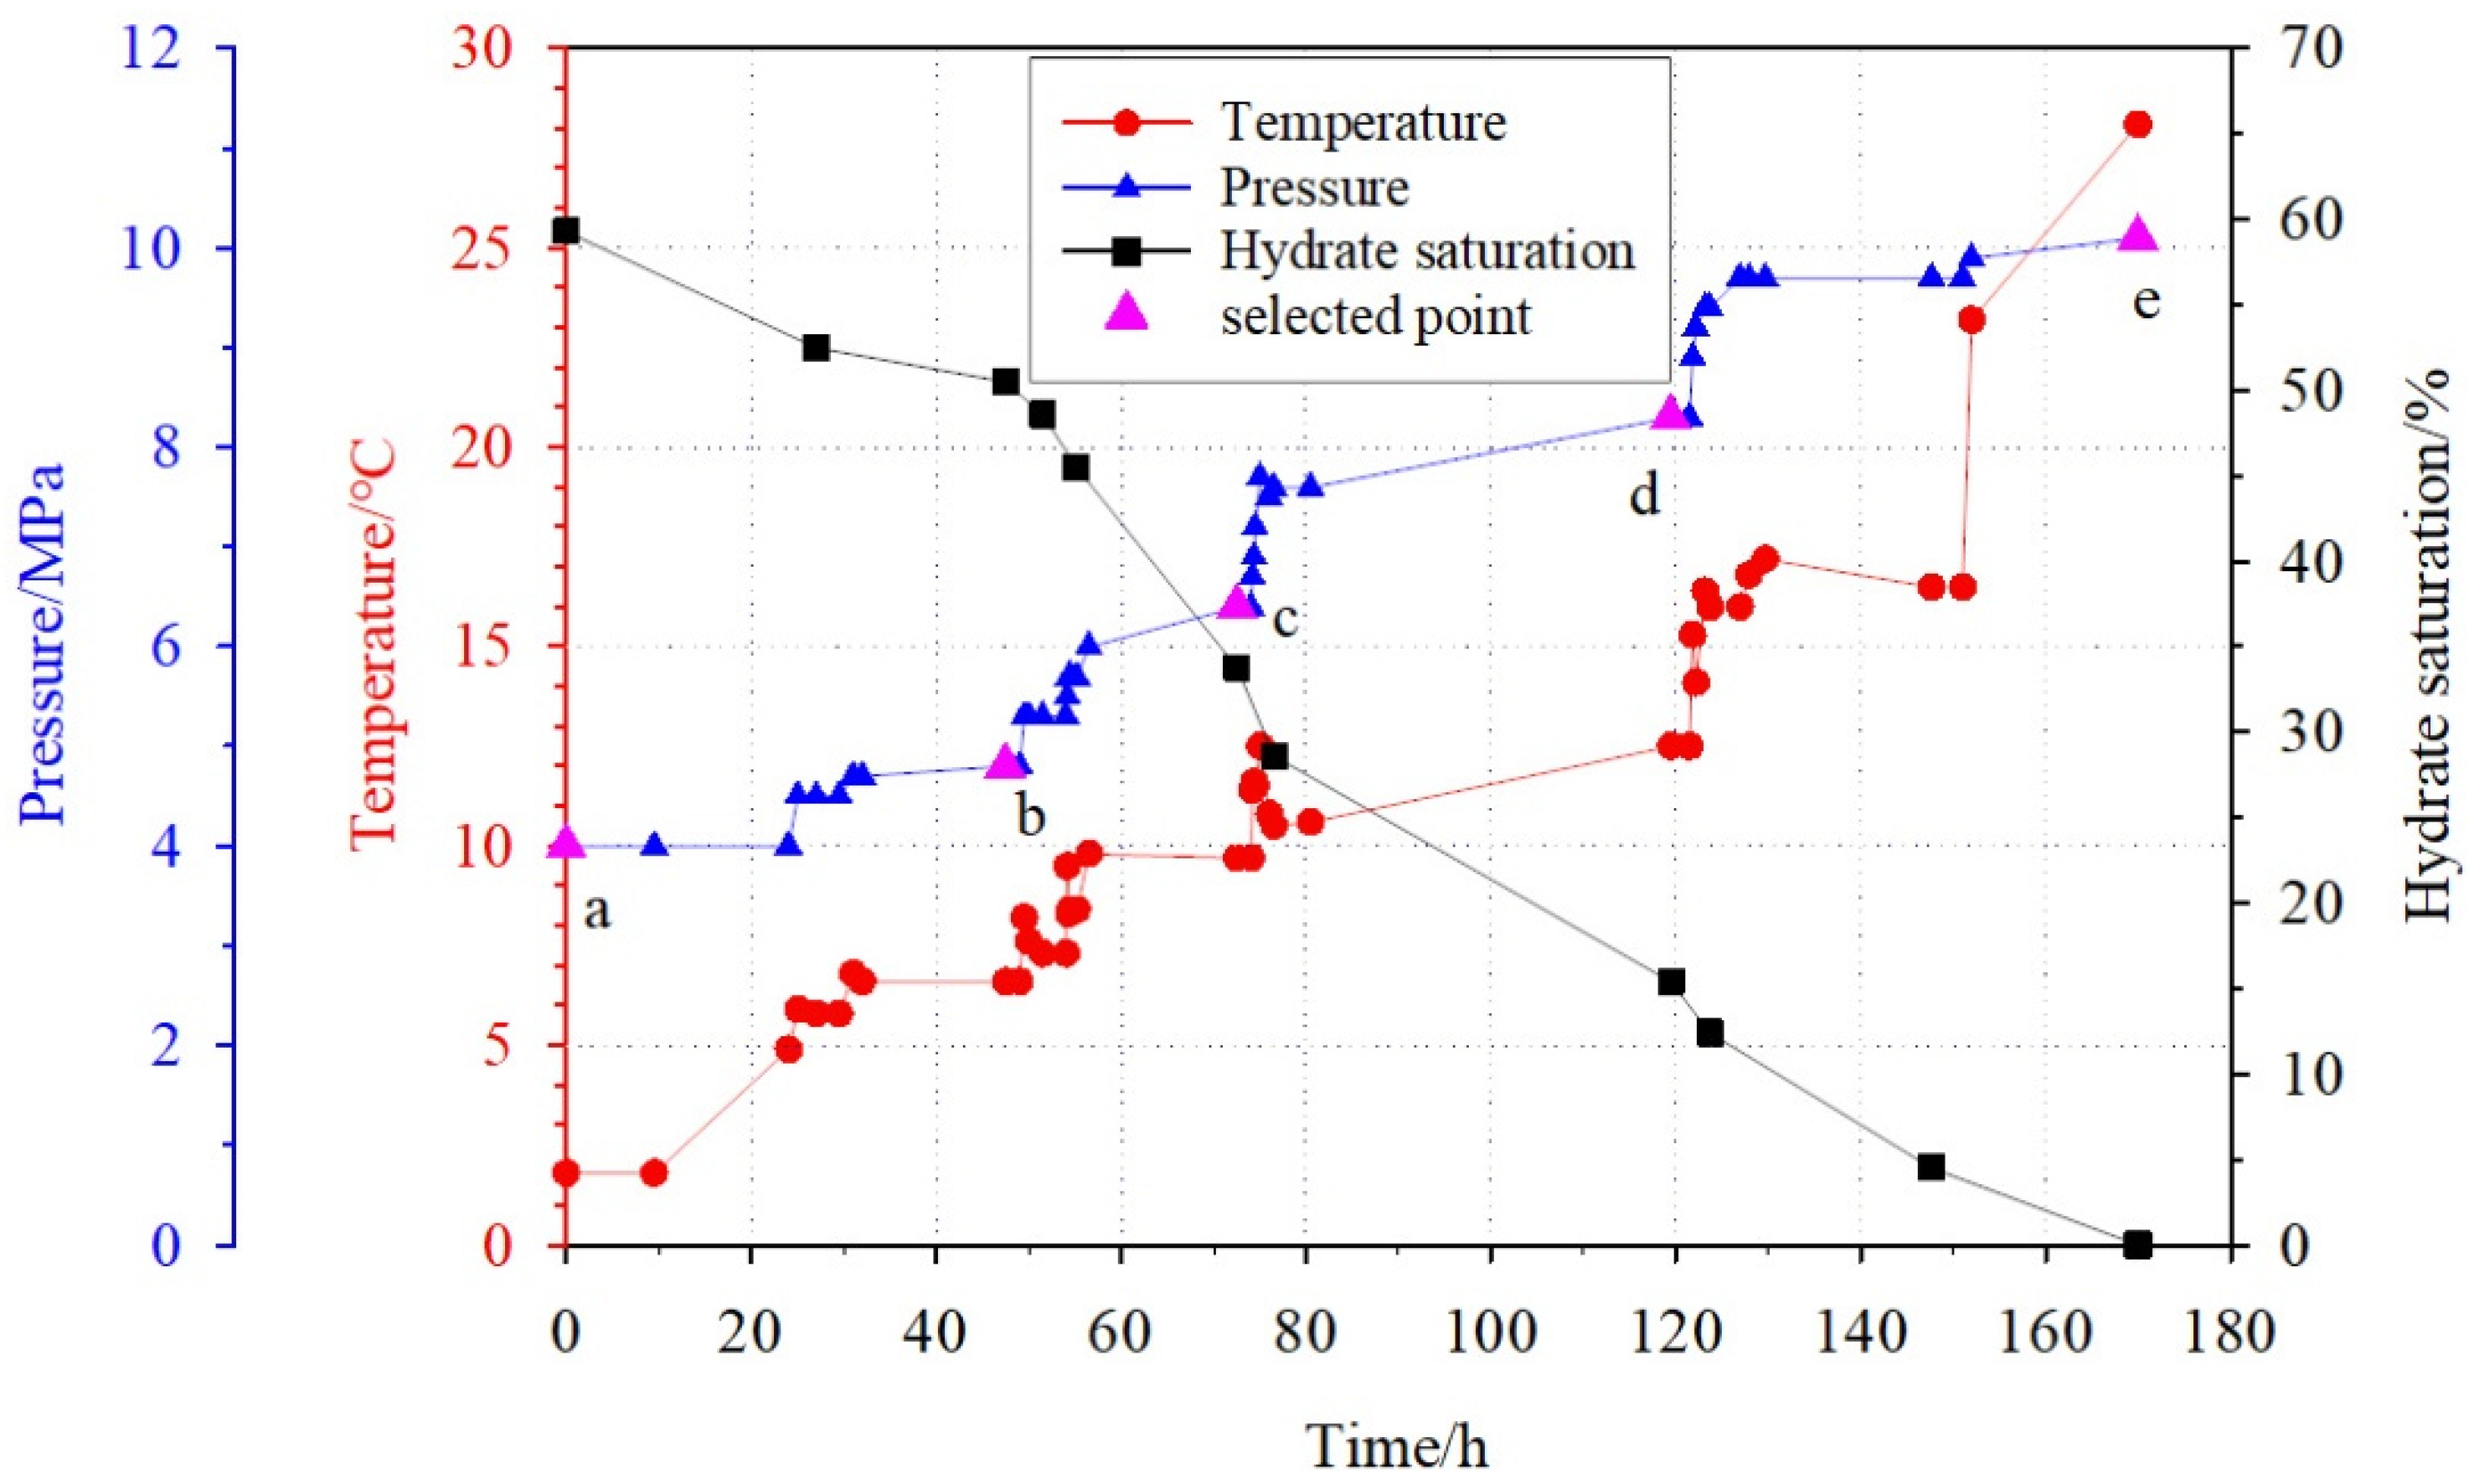
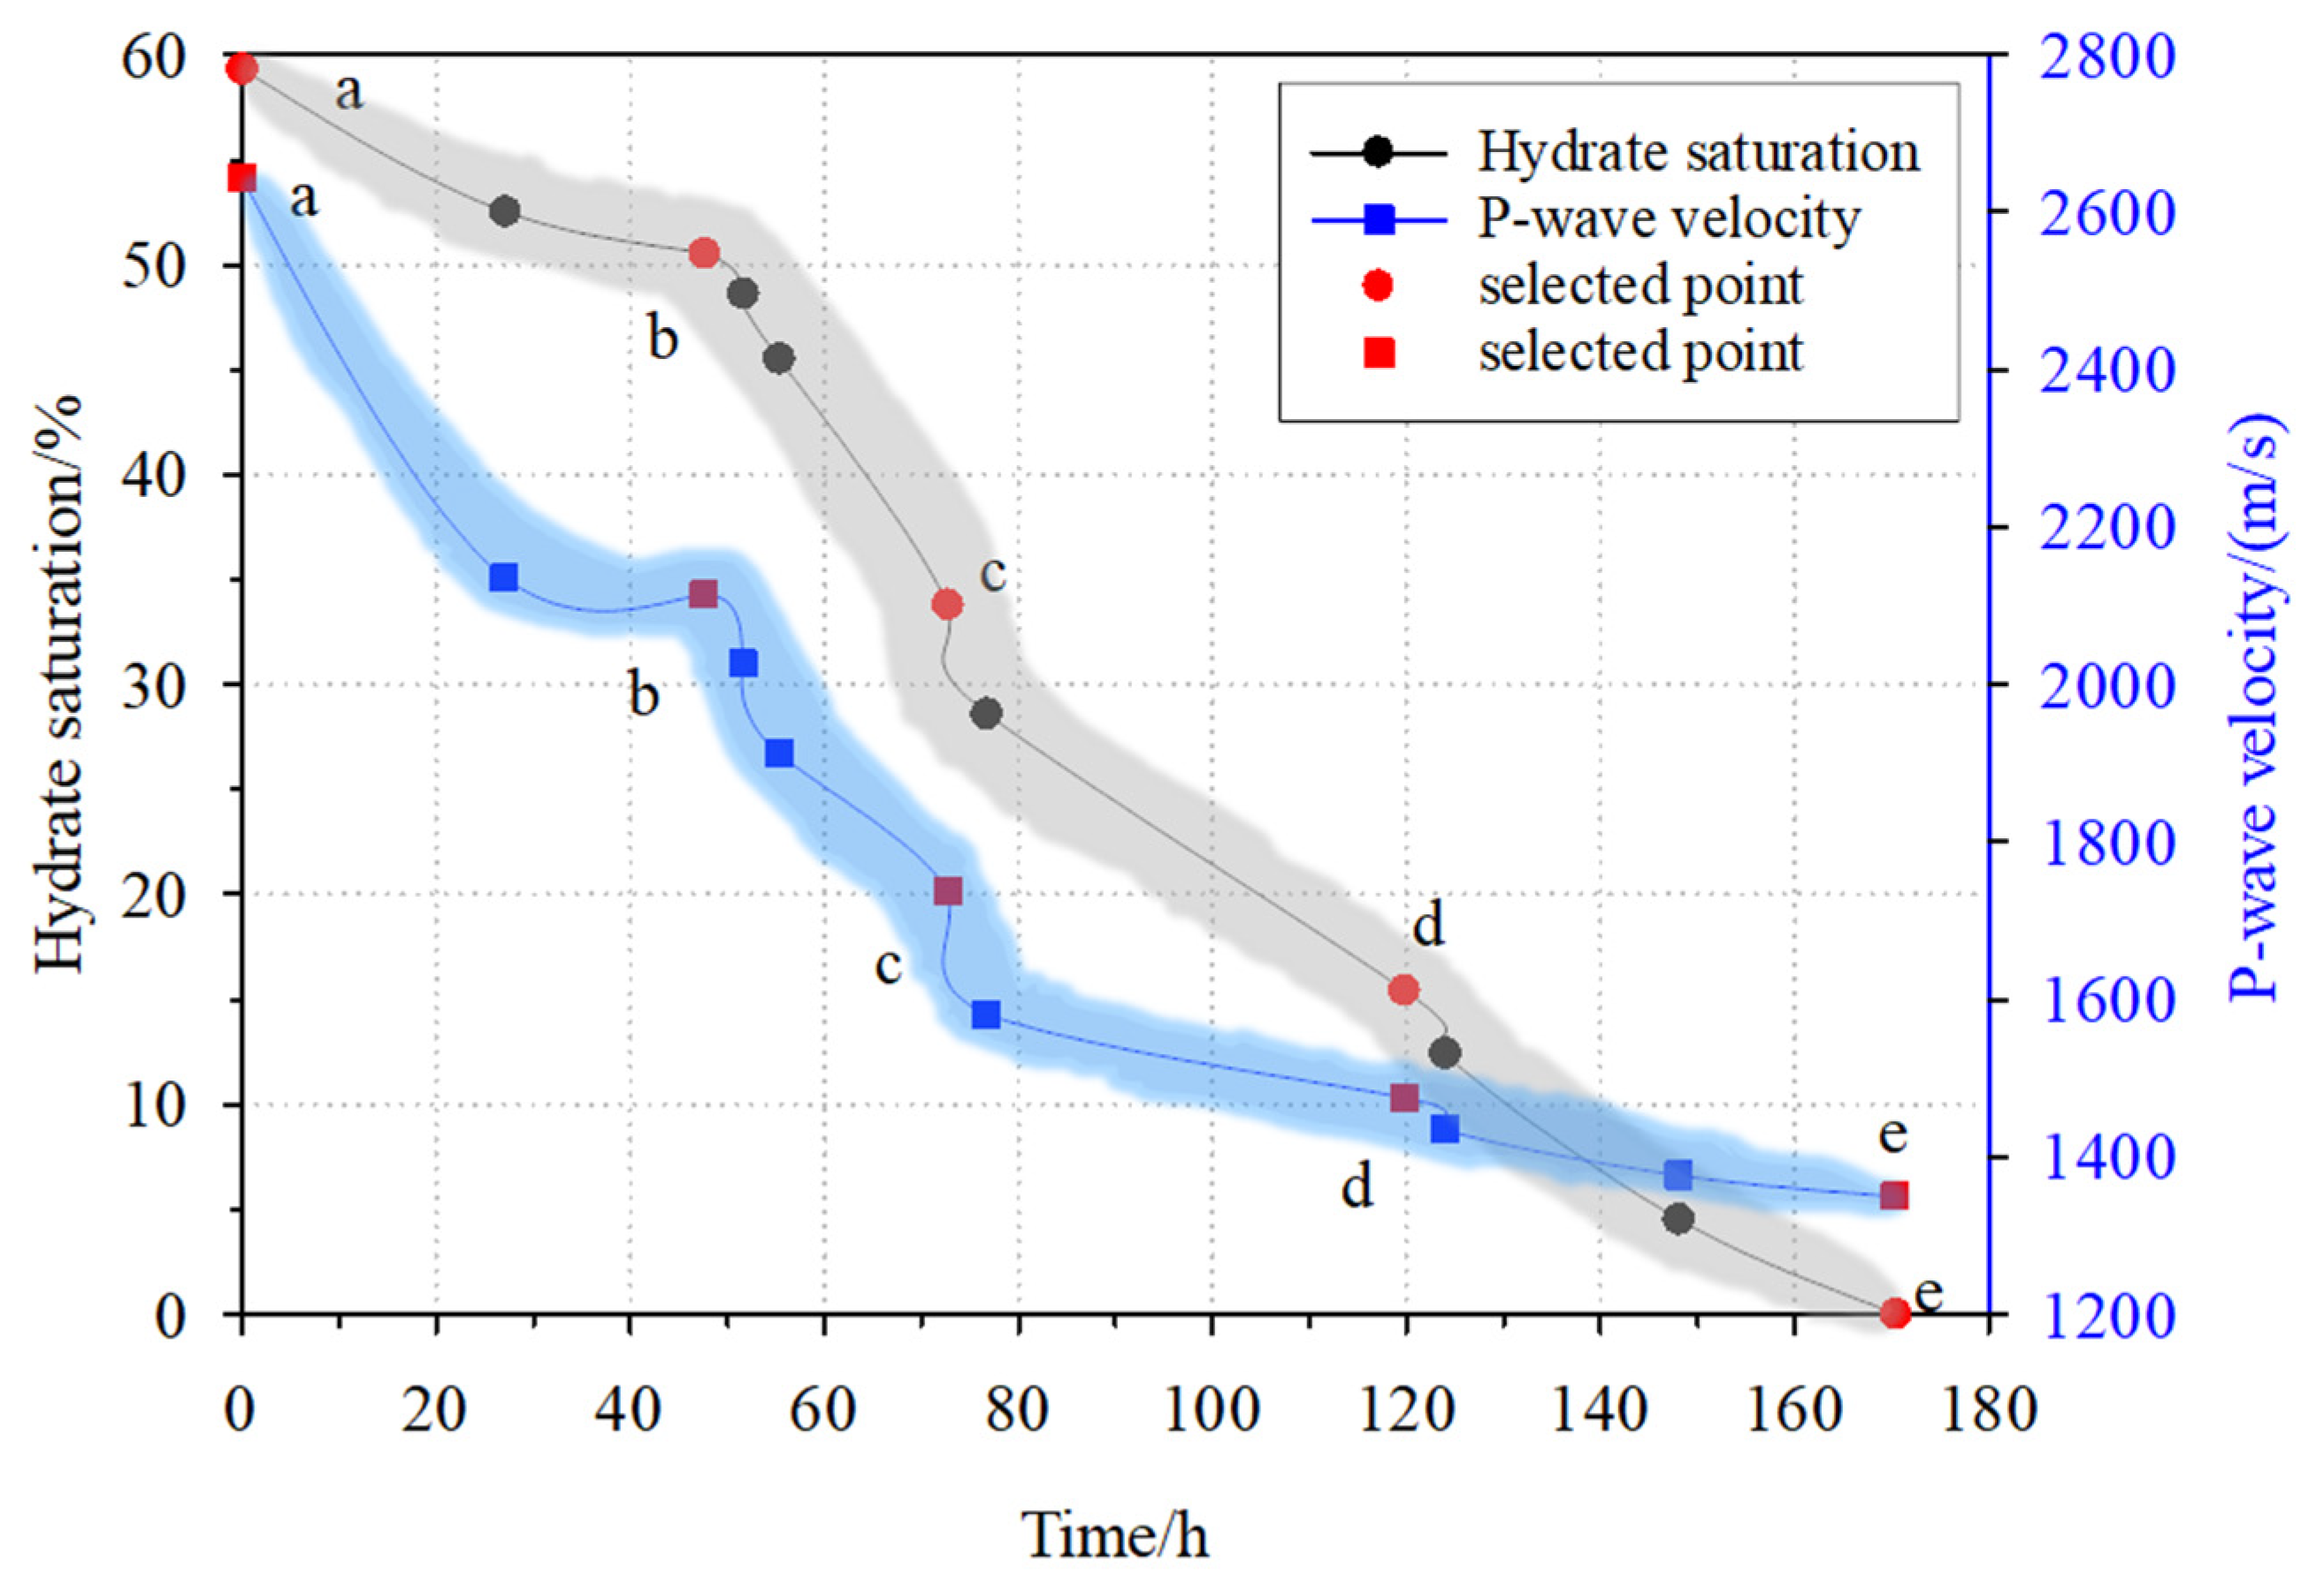
3.1. Hydrate Dissociation Process

The hydrate decomposition process is achieved by increasing the temperature of the refrigeration system. The temperature of the refrigerant is increased in a step-wise manner, with the refrigerant raised by 2 °C at regular intervals. After the hydrate decomposition is completed at this stage, the pressure remains unchanged. When the temperature is reached, the refrigeration cycling liquid is raised again by 2 °C, and the temperature is raised approximately every 24 h until the hydrate decomposition process ends. The pressure, temperature, hydrate saturation, and wave velocity measured during the experiment are shown in Table 1 and Table 2. A study by Ye and Liu [45] indicates that wave velocity changes little with the change in pressure and temperature. The changes in acoustic wave velocity during experiments mainly resulted from the hydrate dissociation. The temperatures shown in the table are the actual temperature changes of the sediment during hydrate decomposition. As shown in Figure 2, during the hydrate decomposition process, the pressure gradually increased in a step-like manner, and the change in temperature closely reflected the hydrate decomposition process. There were several anomalous temperature points during the hydrate decomposition process. The hydrate decomposition process is an endothermic process, so within the trend of overall temperature increase, anomalous temperature drops occur at certain points. As shown in Figure 2, at 25–30 h, 54–55 h, 75–80 h, and 123–126 h, the temperature of the sediment exhibited a small decrease with each temperature increase.
As the temperature increases, the hydrate gradually decomposes, the pressure in the high-pressure reaction chamber gradually increases, and the hydrate saturation gradually decreases (Figure 2). During the process of hydrate decomposition, the saturation decreases in a step-wise manner. It can be seen from Figure 2 that the decomposition of hydrate in this study is divided into three stages. From 0 to 50 h, the hydrate saturation decreases slowly. At 50–70 h, the rate of decrease in hydrate saturation was significantly larger than that in the previous stage, showing a trend of rapid decline. At 70–170 h, the rate of decreasing in hydrate saturation became smaller, but is still larger than that in the first stage. The five points a, b, c, d, and e marked in Figure 2 are representative points at each stage that were selected based on the changes in parameters in the hydrate decomposition process, which is convenient for later analysis.

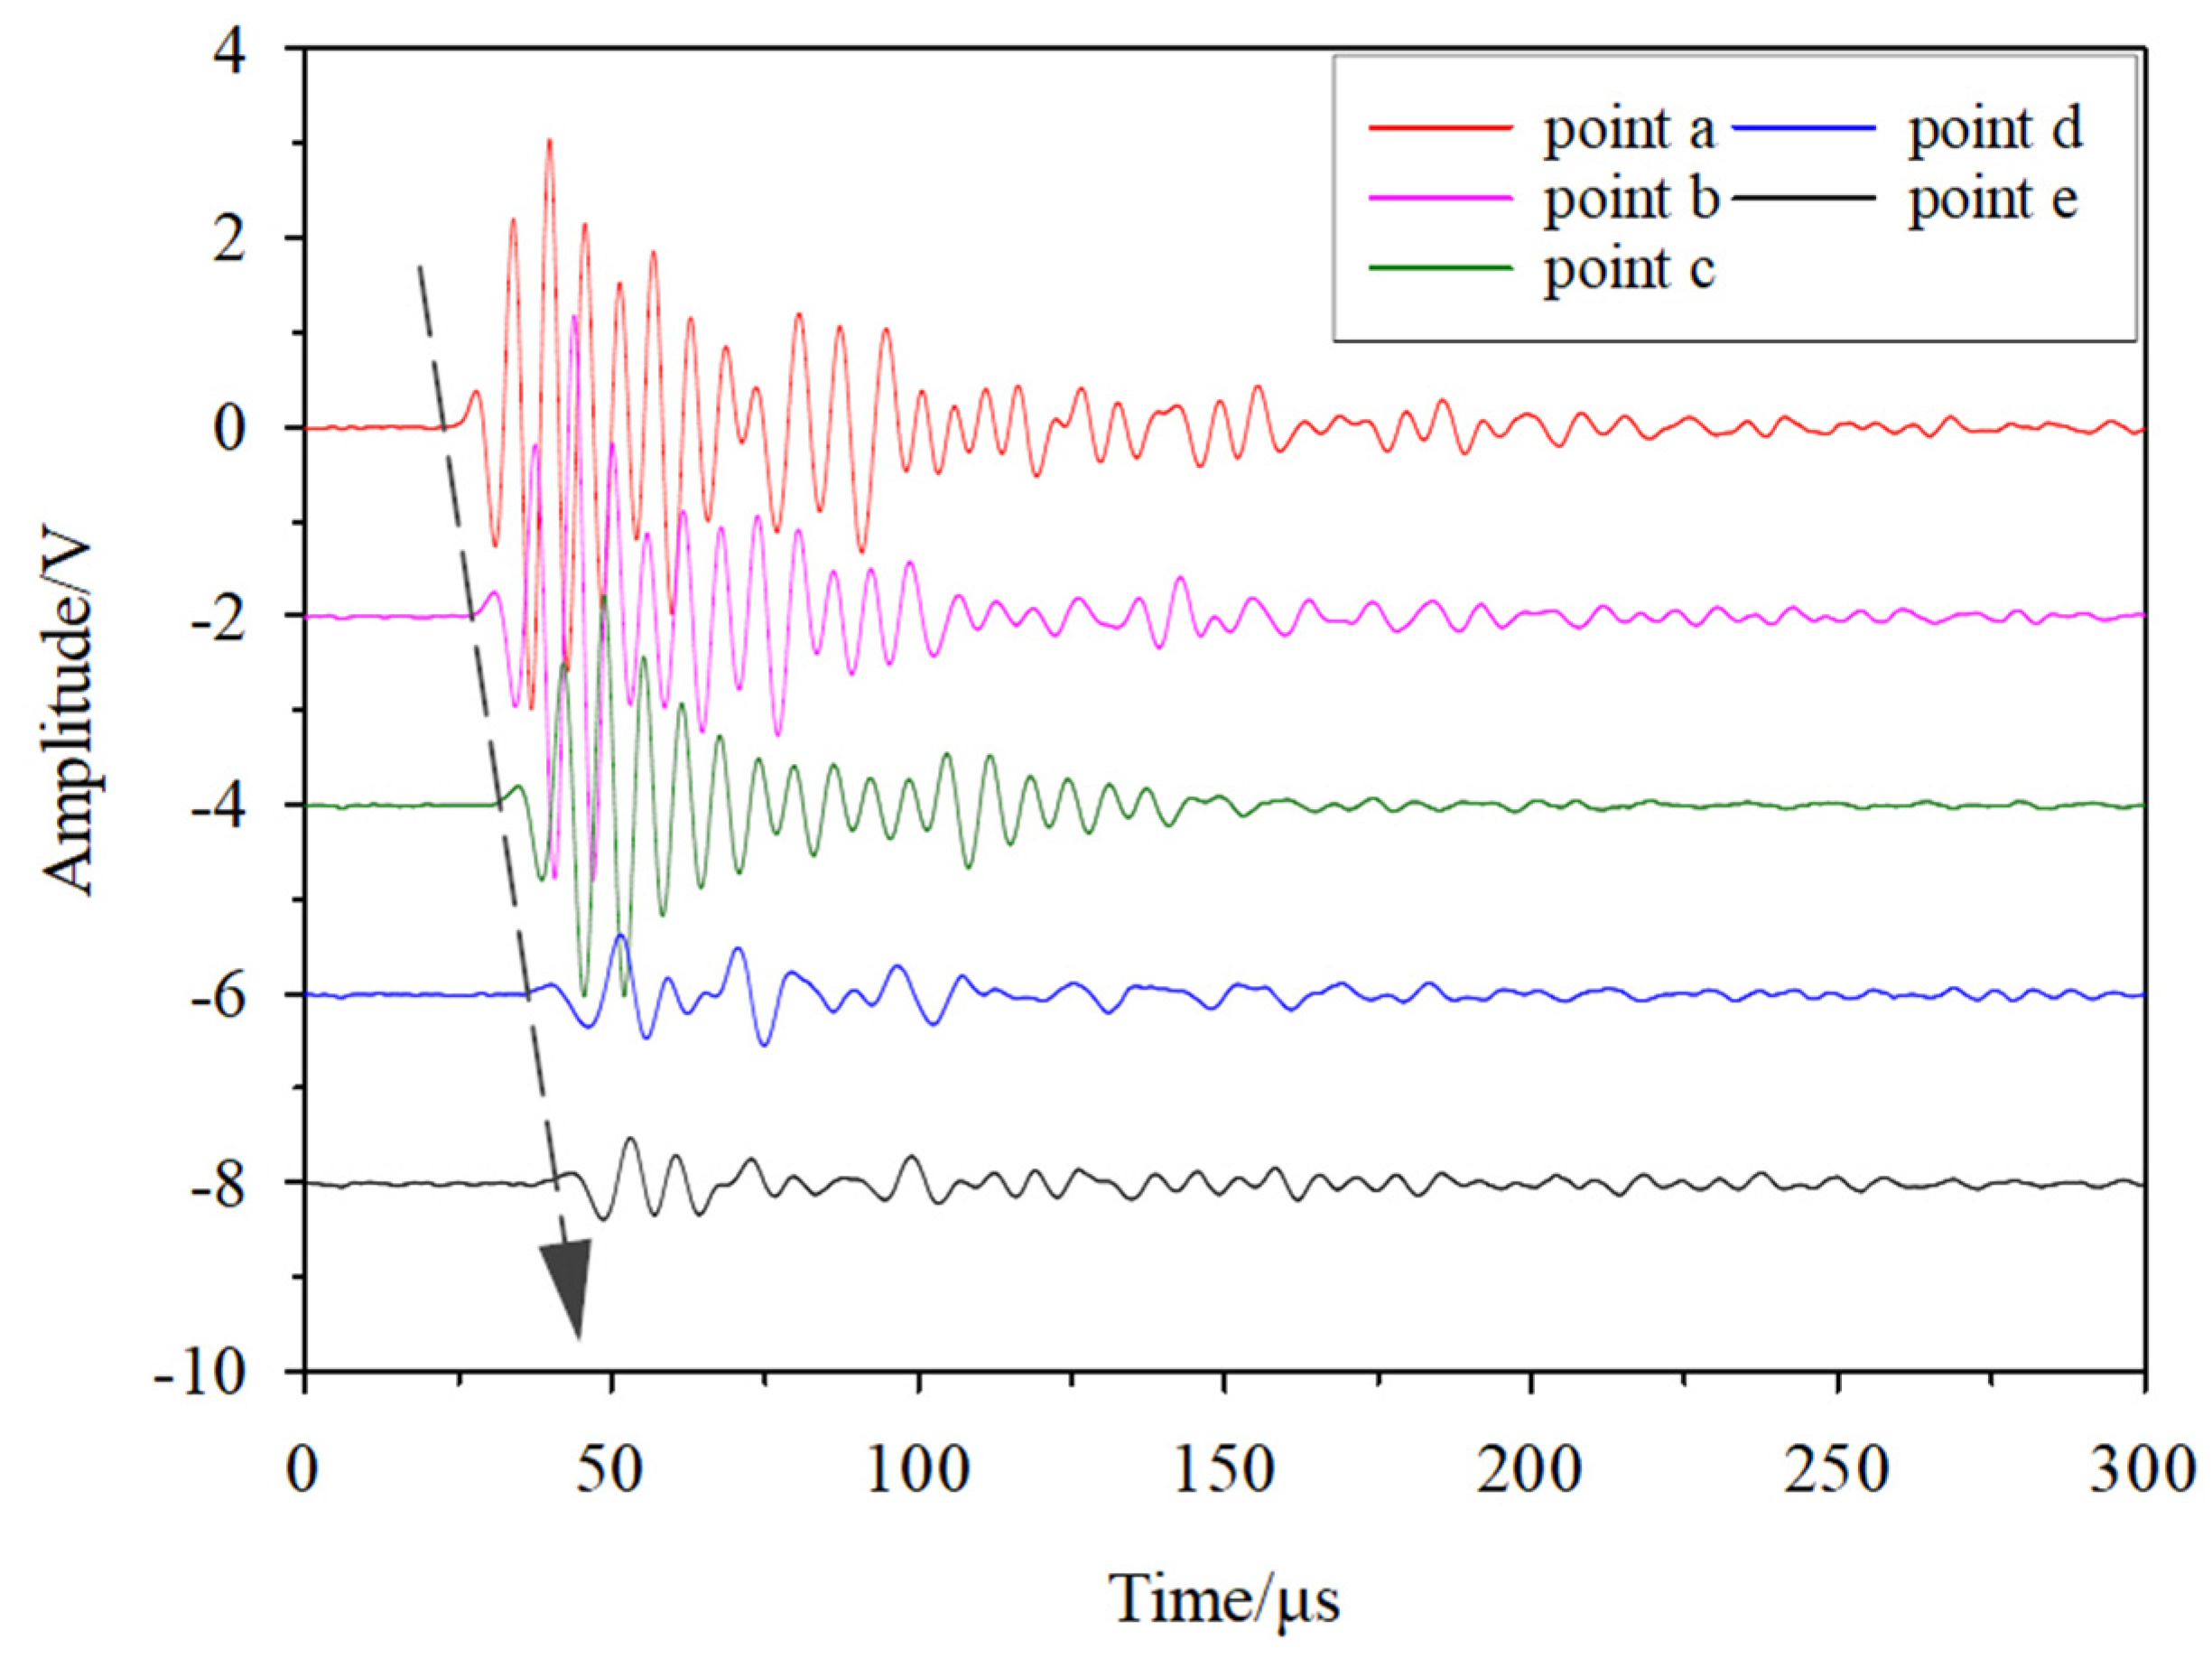
3.2. Variations in Wave Velocity during the Hydrate Dissociation Process

As the hydrate decomposed, the hydrate saturation gradually decreased from 59.3% to 0, and the P-wave velocity gradually decreased from 2642.0 m/s to 1348.6 m/s. The P-wave is a pressure wave, which belongs to a kind of longitudinal wave, and the vibration direction of the medium is parallel to the propagation direction of the wave energy during transmission. As shown in Figure 3, the changes in wave velocity during hydrate decomposition are also divided into three stages. The first stage is 0–50 h. At the beginning of hydrate decomposition, the wave velocity decreases rapidly, and at the end of the first stage, the change in wave velocity is small (Figure 3). In the second stage, at 50–70 h, the wave velocity displayed a significant drop. As shown in Figure 3, a relatively large drop in the wave velocity appeared over a short period of time. Then, in the third stage at 70–170 h, although the hydrate decomposition time is longer, the wave velocity changes less. In order to more intuitively depict the changes in the wave characteristics, the characteristics of the waveform for the selected points are shown in Figure 4. It can be clearly seen that with progressive decomposition of the hydrate, the arrival time of the first wave gradually increases, indicating that the wave velocity of the hydrate-bearing sediment decreases gradually. In addition, it can also be clearly seen that at points d and e in the final stage of hydrate decomposition, the acoustic wave amplitude displays significantly smaller features compared with the previous stages of the decomposition process.

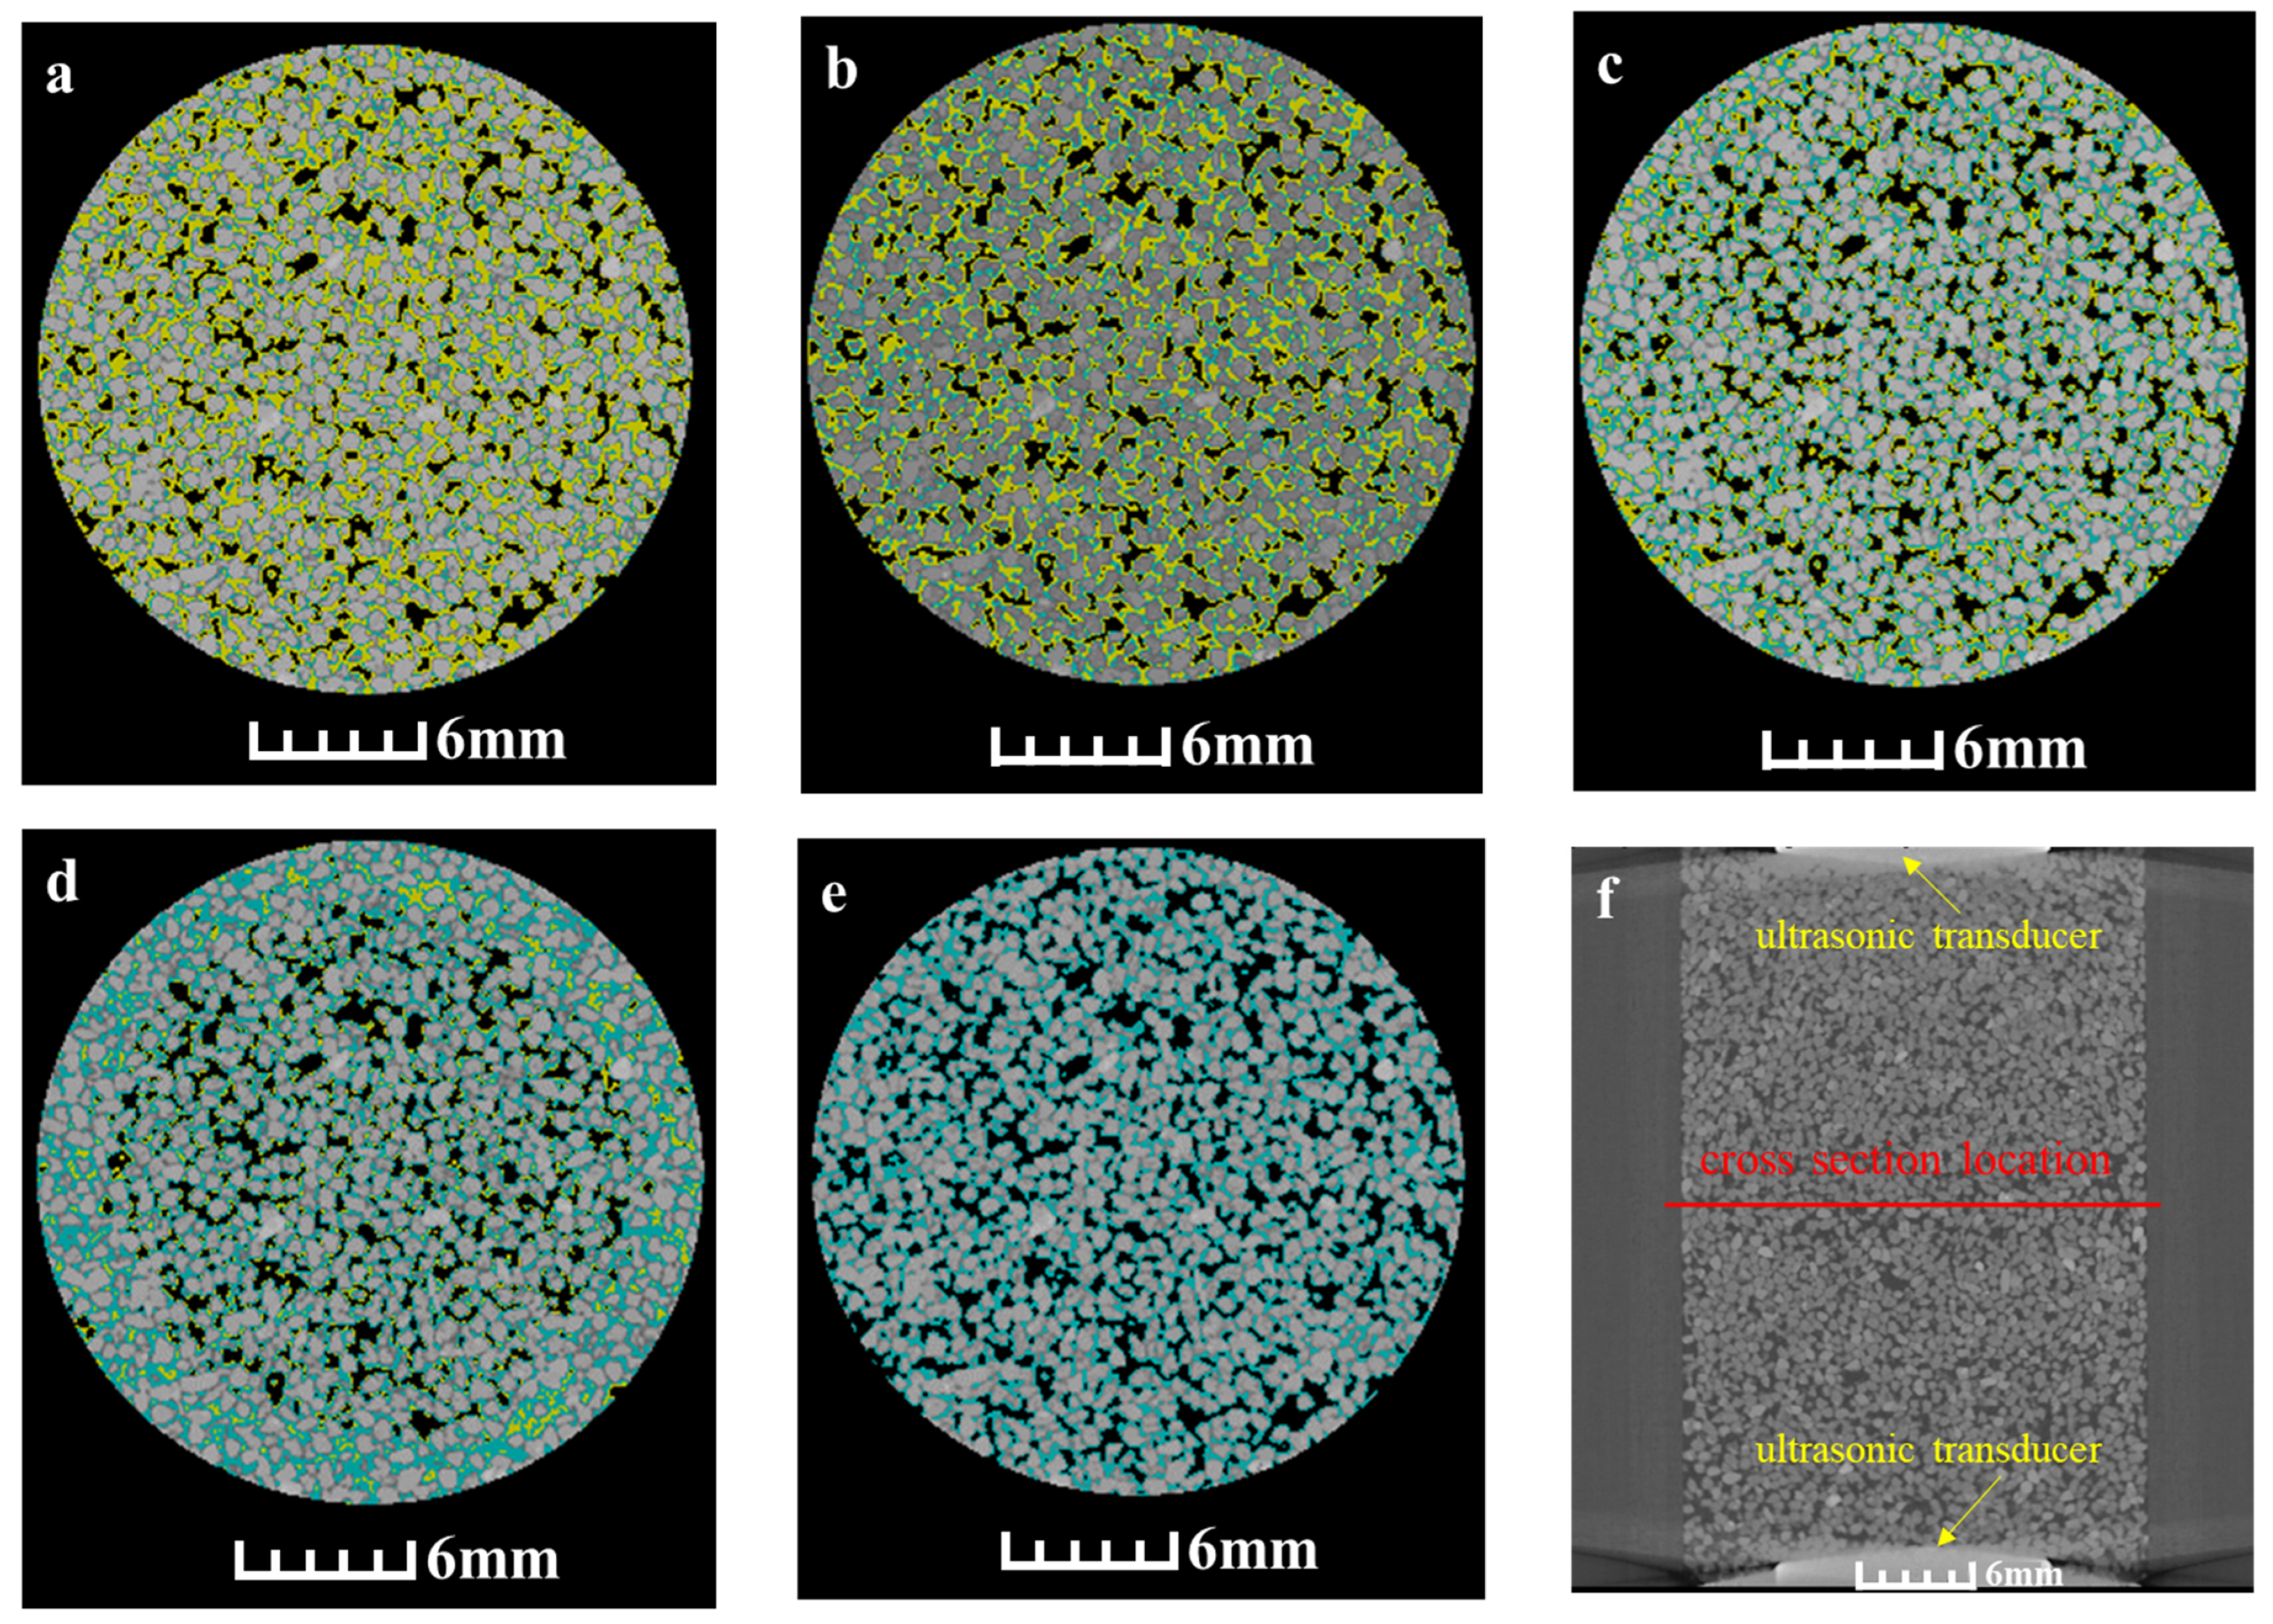
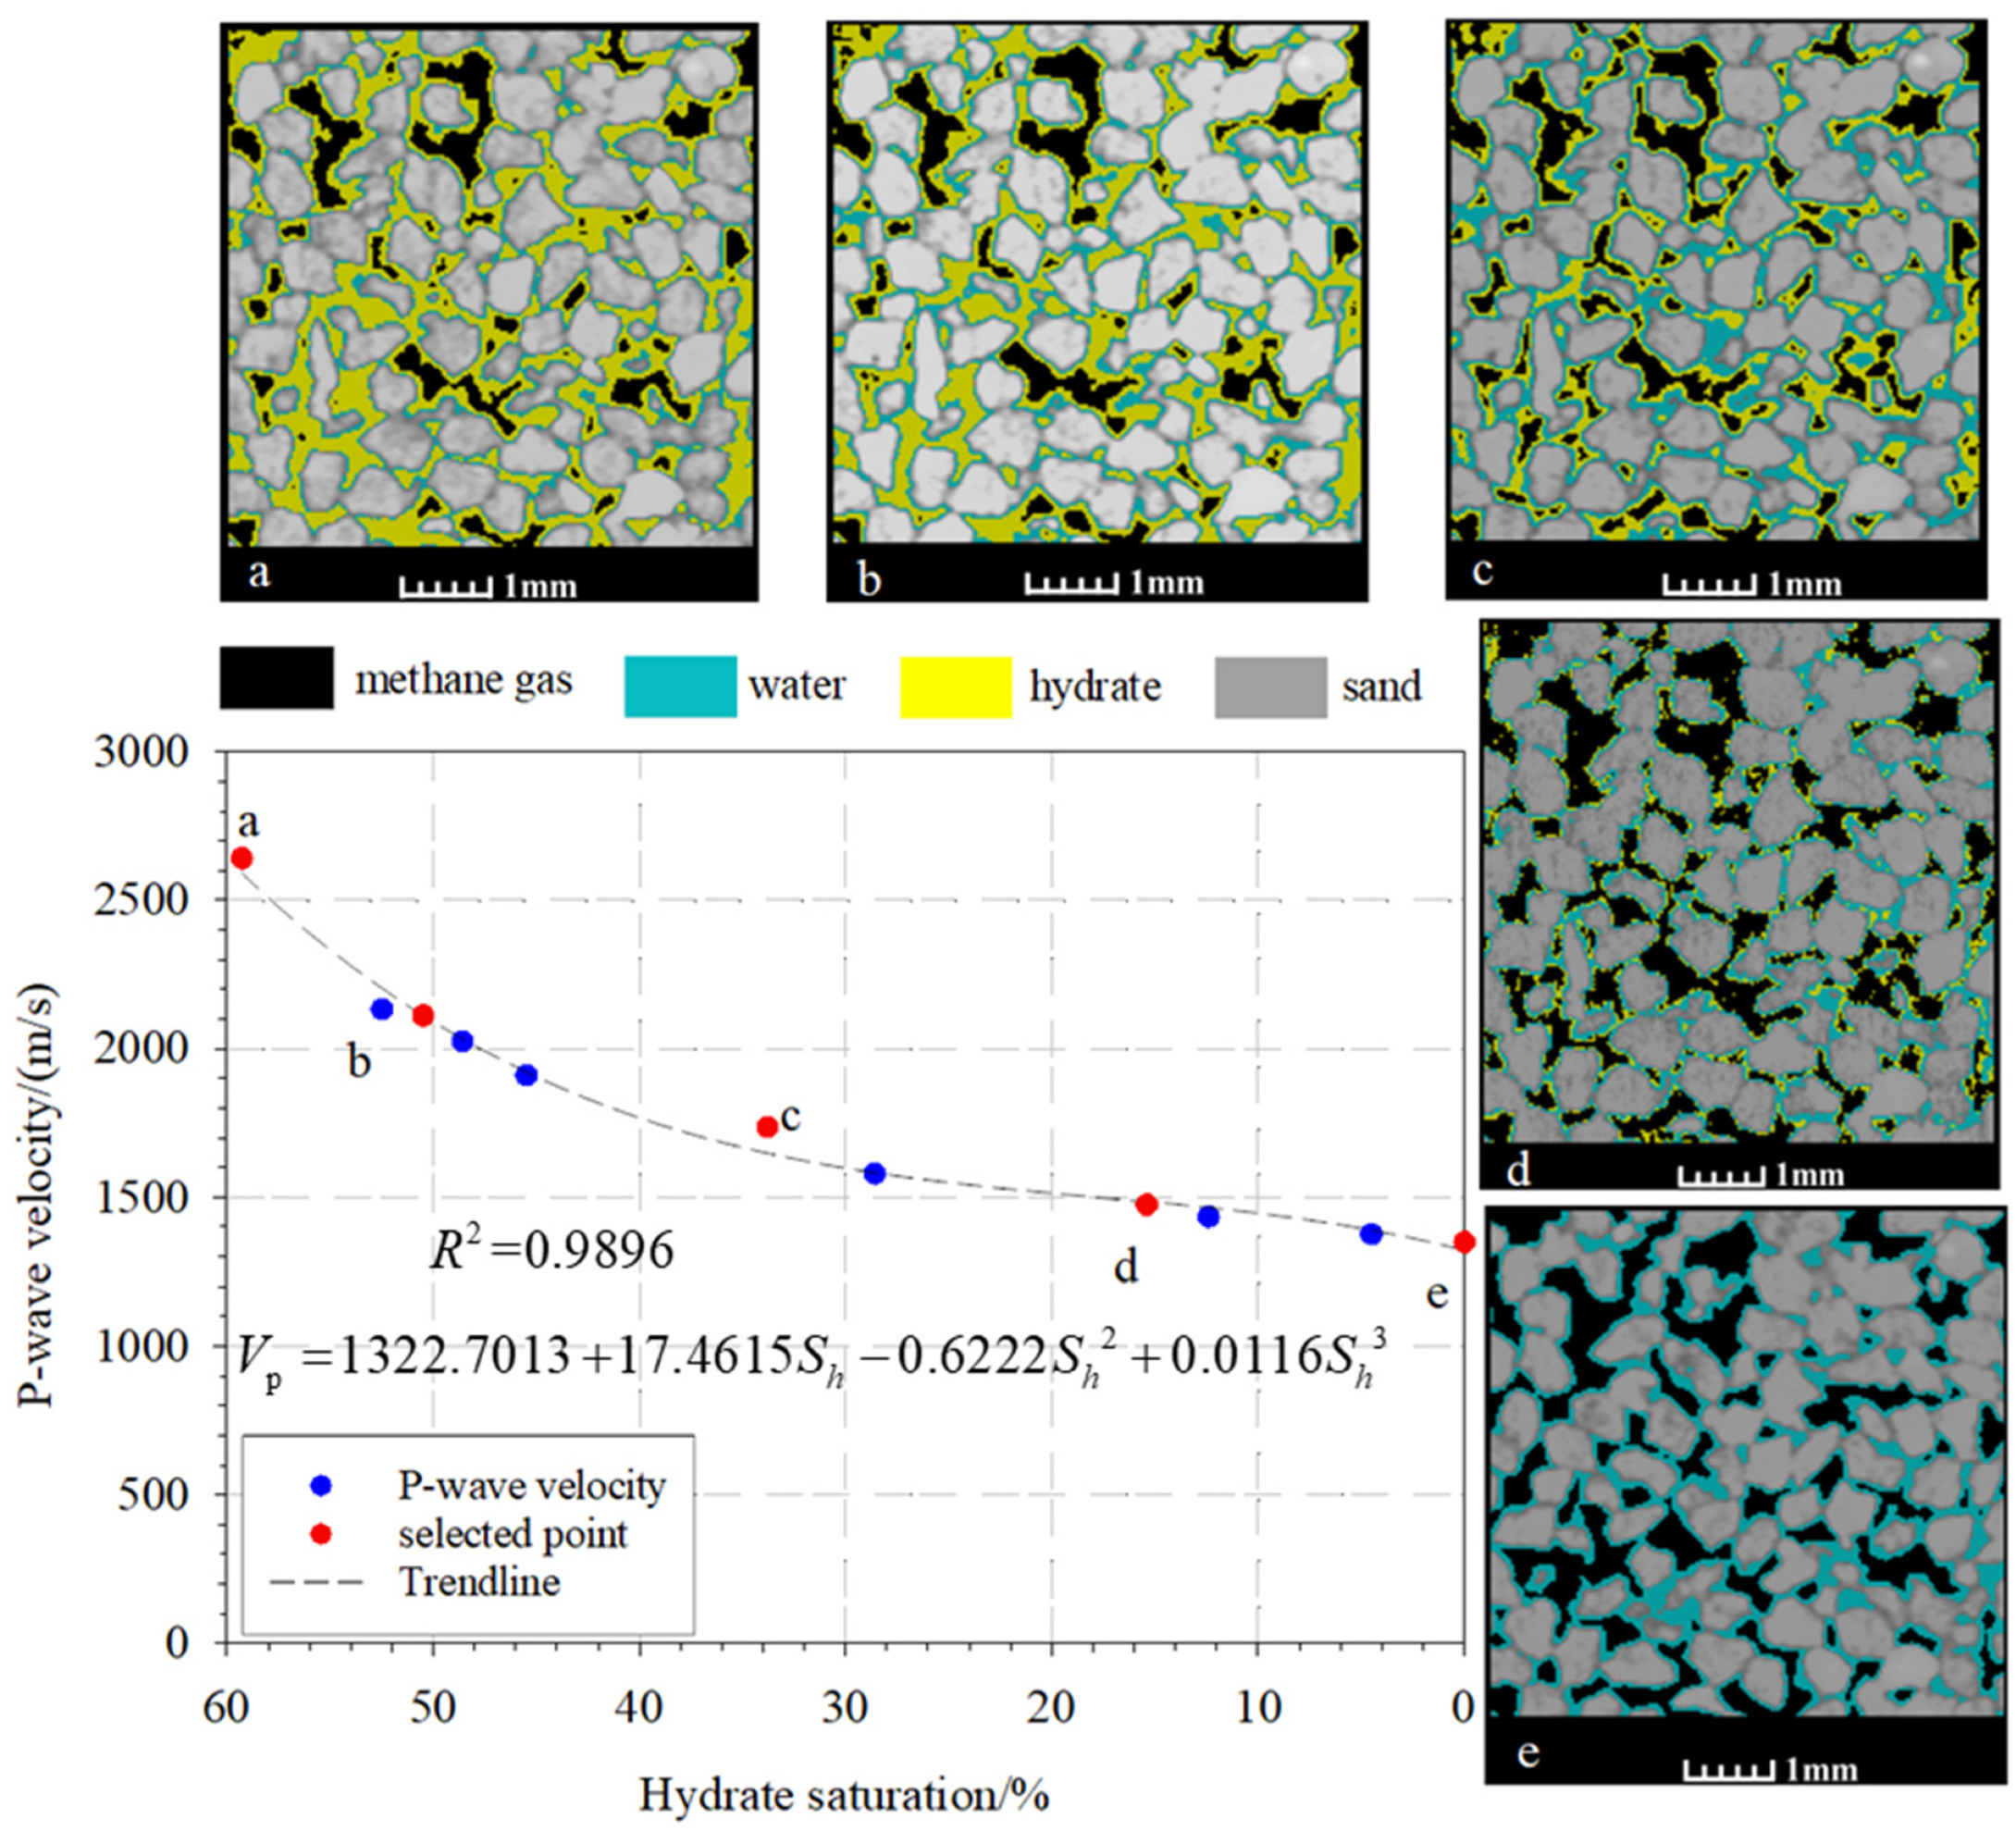
3.3. Microscopic Distribution of Hydrate during the Dissociation Process

X-CT scan images of the selected points a–e are presented in Figure 5. Figure 5f shows an overall schematic diagram of the sample during scanning. At the upper and lower ends are ultrasonic transducers for detecting acoustic properties. Figure 5a–e shows a schematic diagram of a cross-section of the test sample. As shown in Figure 5f, the resolution of the scanned image is 40 μm. From a to e, the hydrate content gradually decreased, and the methane gas and water content gradually increased. In the initial stage of hydrate decomposition, that is, from stage a to b, the amount of hydrate decomposition is small, and the distribution of methane gas, water, and hydrate is relatively uniform. In the middle stage of hydrate decomposition, that is, from stage b to c, the amount of hydrate decomposition is relatively large, the hydrate content decreases from 50.5% to 33.8%, the methane gas content changes from 19.4% to 25.1%, and the water content changes from 30.1% to 41.1%. Although the contents of methane gas, water, and hydrate vary greatly at this stage, their distribution is still relatively uniform. In the late stage of hydrate decomposition, that is, from stage c to d, hydrate continues to decompose, but the spatial distribution of each component can be seen to have changed. The gas generated by decomposition is mainly concentrated in the middle area, while water and hydrate are pushed toward the peripheral area of the reactor body, and gas was rarely observed around the edges of the high-pressure reaction chamber (Figure 5d). After the hydrate is completely decomposed, the gas generated by the decomposition becomes dispersed and equalized throughout the sediment, and the gas and water in the reactor are again uniformly distributed (Figure 5e).

4. Discussion

4.1. Effect of Hydrate Saturation on Acoustic Velocity

As mentioned above, the hydrate decomposition process is divided into three stages: namely the initial a–b stage, the middle b–c stage, and the late c–e stage (Figure 6). It can be clearly seen that in the early stage of hydrate decomposition, changes in hydrate saturation are small, but the P-wave velocity decreases greatly. In the later stage of hydrate decomposition, the hydrate saturation changed significantly, but the P-wave velocity decreased only slightly. The acoustic velocity of hydrate-bearing sediments is therefore not only related to the hydrate content, but also to the microscopic spatial distribution of hydrates.
Changes in P-wave velocity with hydrate saturation during hydrate decomposition are shown in Figure 7. It can be seen that the change in wave velocity with hydrate saturation is not linear. During the process of decreasing hydrate saturation, the overall acoustic wave velocity displayed two stages of change. In the a–c stages, the acoustic wave velocity of the hydrate-bearing sediments decreased more rapidly, showing a larger rate of change. In stages c–e, the change in wave velocity is small, and the overall trend of change is slow. According to the data obtained from the experiment, the P-wave velocity combined with the hydrate saturation can be fit by a functional equation as follows:
V p = 1322.7013 + 17.4615 S h 0.6222 S h 2 + 0.0116 S h 3
Here, Vp represents the longitudinal wave velocity, Sh represents the hydrate saturation, and the correlation coefficient of the equation is R2 = 0.9896.

4.2. Influence of the Microscopic Hydrate Distribution on Acoustic Velocity during Hydrate Dissociation

As mentioned above, the microscopic distribution of hydrate has a strong influence on the acoustic velocity. Therefore, in order to better analyze the microscopic distribution state during the process of hydrate decomposition, we selected a part of various blocks from the results with a scanning resolution of 30 μm for closer analysis. We chose a cube with dimensions of 180 × 180 × 180 pixel3 as our RVE. The size of the cube is 6000 µm × 6000 µm × 6000 µm (200 × 30 µm). Figure 7 shows a high-resolution cross-sectional view of the hydrate distribution at the five feature points, a–e. In the initial stage of hydrate decomposition, from a to b, the hydrate first begins to decompose at places in contact with the sand particles, which is consistent with the conclusion obtained by Sultaniya et al. [21]. At this stage, the hydrate saturation changed slightly, but the wave velocity decreased greatly (Figure 6). This demonstrates that the hydrate initially exists mainly in particle-contact mode at the beginning, which contributes to the entire sedimentary framework and strengthens the acoustic wave response characteristics. When the connections between hydrate and sediment particles begin to break down, although the changes in hydrate content are small, it has a significant impact on the overall sediment structure. At the same time, because the structure of the entire sediment body is still strong and the gas content is not large at this stage, the amplitude of the acoustic wave does not change much (Figure 4). In the middle stage of hydrate decomposition, from stages b–c, the hydrates become largely decomposed, and the hydrates can be clearly seen to change from particle-contact mode to the pore-filling mode, where they mainly occur in the mixed fluid composed of methane gas and NaCl solution. The main factor affecting the acoustic velocity of hydrate at this stage is the changes in hydrate content. In the later stage of hydrate decomposition, from stages c–e, the hydrate gradually decomposes, and the hydrate content changes, but the change in the wave velocity is small, indicating that the type of microscopic distribution of hydrate at this stage is the main factor affecting the wave velocity of hydrate. That is, in the pore-filling mode, the contribution of hydrate to the entire sediment framework is small and has little effect on the acoustic velocity of the entire body of hydrate-bearing sediment. At the same time, methane gas is released from hydrate dissociation as the hydrate saturation decreases, and the increase in gas in the enclosed space leads to a decrease in amplitude.

5. Conclusions

In this paper, experiments to simulate the hydrate decomposition process were carried out using a self-developed experimental device combining X-CT scanning and acoustic detection. Acoustic wave characteristics and X-CT scanning results were simultaneously obtained during the hydrate decomposition process to capture not only the macroscopic acoustic wave characteristics of hydrates, but also microscopic images of the hydrate distribution. The main findings of this study are:
The hydrate decomposition process is divided into three stages. In the initial stage, the hydrate saturation changes slightly, from 59.3% to 50.5%, but the wave velocity decreases greatly, from 2642.0 m/s to 2113.0 m/s. The middle stage is where the hydrate saturation decreases the most, from 50.5% to 33.8%, and also exhibits a large change in acoustic wave velocity, from 2113.0 m/s to 1736.9 m/s. In the final stage of decomposition, the hydrate saturation changes gradually, from 33.8% to 0, and the wave velocity changes slightly, from 1736.9 m/s to 1348.6 m/s.
In the initial stage of the decomposition process, the amount of decomposed hydrate is small, but it generates a large change in the acoustic wave velocity, indicating that the microscopic distribution of hydrate has a strong influence on the acoustic wave characteristics of hydrate-bearing reservoirs. According to the acoustic detection and X-CT scanning results during the hydrate decomposition process, the results we have obtained correspond to the early stage of hydrate decomposition, where hydrate first begins to decompose at places in contact with sand particles, and the hydrate is decomposed with the sediment particles. As the contact breaks down, the main factor affecting the hydrate acoustic wave velocity at this stage is the change in the type of hydrate micro-distribution. In the middle stage of hydrate decomposition, a large amount of hydrate is decomposed, and the main factor affecting the acoustic wave velocity of hydrate in this stage is the change in hydrate content. In the later stage of hydrate decomposition, the hydrate distribution pattern is mainly the pore-filling type, and the hydrate micro-distribution pattern at this stage is the main factor affecting the hydrate acoustic wave velocity.
The influence of the hydrate micro-distribution on the acoustic properties obtained in this study is helpful for us to analyze the hydrate occurrence state of the hydrate decomposition stage. When we monitor the hydrate reservoir during the production process by means of geophysical monitoring, the obtained acoustic information can discern the decomposition state of the hydrate, which is helpful for us to predict the next stage of the production process.

Author Contributions

Research design, Q.B., Q.M. and G.H.; methodology, Q.B. and C.L. (Chengfeng Li); experiments, J.Z., Z.W. and W.Z.; data analysis, Q.B., T.X., J.K. and C.L. (Chengfeng Li); writing—original draft preparation, Q.B.; writing—review and editing, T.X., Q.M. and G.H.; supervision, C.L. (Changling Liu); project administration, C.L. (Changling Liu). All authors have read and agreed to the published version of the manuscript.

Funding

This research was supported financially by the Shandong Provincial Natural Science Foundation (No. ZR2019BD051), the National Natural Science Foundation of China (No. 41906067), the Marine S&T Fund of Shandong Province for Pilot National Laboratory for Marine Science and Technology (Qingdao) (No.2021QNLM020002), China Postdoctoral Science Foundation (Grant No. 2018M632634), Shandong Province Postdoctoral Innovation Project (201902050) and also funded by Marine Geological Survey Program (DD20221704).

Institutional Review Board Statement

Not applicable.

Informed Consent Statement

Not applicable.

Data Availability Statement

The data that support the findings of this paper are available upon request.

Conflicts of Interest

The authors declare no conflict of interest.

References

  1. Chong, Z.R.; Yang, S.H.B.; Babu, P.; Linga, P.; Li, X.S. Review of natural gas hydrates as an energy resource: Prospects and challenges. Appl. Energy 2016, 162, 1633–1652. [Google Scholar] [CrossRef]
  2. Yin, Z.Y.; Linga, P. Methane hydrates: A future clean energy resource. Chin. J. Chem. Eng. 2019, 27, 36–46. [Google Scholar] [CrossRef]
  3. Dong, L.; Wan, Y.Z.; Li, Y.L.; Liao, H.L.; Liu, C.L.; Wu, N.Y.; Leonenko, Y. 3D numerical simulation on drilling fluid invasion into natural gas hydrate reservoirs. Energy 2022, 241, 122932. [Google Scholar] [CrossRef]
  4. Wan, Y.Z.; Wu, N.Y.; Chen, Q.; Li, W.T.; Hu, G.W.; Huang, L.; Ouyang, W.P. Coupled thermal-hydrodynamic-mechanical-chemical numerical simulation for gas production from hydrate-bearing sediments based on hybrid finite volume and finite element method. Comput. Geotech. 2022, 145, 104692. [Google Scholar] [CrossRef]
  5. Li, Y.L.; Wu, N.Y.; Gao, D.L.; Chen, Q.; Liu, C.L.; Yang, D.Y.; Jin, Y.R.; Ning, F.L.; Tan, M.J.; Hu, G.W. Optimization and Analysis of Gravel Packing Parameters in Horizontal Wells for Natural Gas Hydrate Production. Energy 2020, 219, 119585. [Google Scholar] [CrossRef]
  6. Li, Y.L.; Wu, N.Y.; Ning, F.L.; Gao, D.L.; Hao, X.L.; Chen, Q.; Liu, C.L.; Sun, J.Y. Hydrate induced clogging of sand-control screen and its implication on hydrate production operation. Energy 2020, 206, 118030. [Google Scholar] [CrossRef]
  7. He, T.; Lu, H.L.; Lin, J.Q.; Dong, Y.F.; He, J. Geophysical techniques of reservoir monitoring for marine gas hydrate exploitation. Earth Sci. Front. 2017, 24, 368–382. [Google Scholar]
  8. Luo, C.X. Japan’s Methane Hydrate Development Today and Advances. Sino-Glob. Energy 2013, 18, 30–37. [Google Scholar]
  9. Li, J.F.; Ye, J.L.; Qin, X.W.; Qiu, H.J.; Wu, N.Y.; Lu, H.L.; Xie, W.W.; Lu, J.A.; Peng, F.; Xu, Z.Q.; et al. The first offshore natural gas hydrate production test in South China Sea. China Geol. 2018, 1, 5–16. [Google Scholar] [CrossRef]
  10. Liu, J.W.; Li, X.S. Recent Advances on Natural Gas Hydrate Exploration and Development in the South China Sea. Energy Fuels 2021, 35, 7528–7552. [Google Scholar] [CrossRef]
  11. Li, Y.L.; Liu, L.L.; Jin, Y.R.; Wu, N.Y. Characterization and development of natural gas hydrate in marine clayey-silt reservoirs: A review and discussion. Adv. Geo-Energy Res. 2021, 5, 75–86. [Google Scholar] [CrossRef]
  12. Li, Y.L.; Sun, H.L.; Meng, Q.G.; Liu, C.L.; Chen, Q.; Xing, L.C. 2-D electrical resistivity tomography assessment of hydrate formation in sandy sediments. Nat. Gas Ind. B 2020, 7, 278–284. [Google Scholar] [CrossRef]
  13. Cai, J.C.; Xia, Y.X.; Xu, S.; Tian, H.T. Advances in multiphase seepage characteristics of natural gas hydrate sediments. Chin. J. Theor. Appl. Mech. 2019, 52, 208–223. [Google Scholar]
  14. Cai, J.C.; Wei, W.; Hu, X.Y.; Wood, D.A. Electrical conductivity models in saturated porous media: A review. Earth-Sci. Rev. 2017, 171, 419–433. [Google Scholar] [CrossRef]
  15. Waite, W.F.; Santamarina, J.C.; Cortes, D.D.; Dugan, B.; Espinoza, D.N.; Germaine, J.; Jang, J.; Jung, J.W.; Kneafsey, T.J.; Shin, H.; et al. Physical properties of hydrate-bearing sediments. Rev. Geophys. 2009, 47, 465–484. [Google Scholar] [CrossRef]
  16. Winters, W.J.; Pecher, I.A.; Waite, W.F.; Mason, D.H. Physical properties and rock physics models of sediment containing natural and laboratory-formed methane gas hydrate. Am. Mineral. 2004, 89, 1221–1227. [Google Scholar] [CrossRef]
  17. Winters, W.J.; Waite, W.F.; Mason, D.H.; Gilbert, L.Y.; Pecher, I.A. Methane gas hydrate effect on sediment acoustic and strength properties. J. Pet. Sci. Eng. 2007, 56, 127–135. [Google Scholar] [CrossRef] [Green Version]
  18. Priest, J.A.; Best, A.I.; Clayton, C.R.I. Attenuation of seismic waves in methane gas hydrate-bearing sand. Geophys. J. Int. 2006, 164, 149–159. [Google Scholar] [CrossRef] [Green Version]
  19. Priest, J.A.; Best, A.; Clayton, C. A laboratory investigation into the seismic velocities of methane gas hydrate-bearing sand. J. Geophys. Res. 2005, 110, B04102. [Google Scholar] [CrossRef]
  20. Priest, J.A.; Rees, E.V.L.; Clayton, C.R.I. Influence of gas hydrate morphology on the seismic velocities of sands. J. Geophys. Res. Solid Earth 2009, 114, B11205. [Google Scholar] [CrossRef] [Green Version]
  21. Sultaniya, A.K.; Priest, J.A.; Clayton, C.R.I. Measurements of the changing wave velocities of sand during the formation and dissociation of disseminated methane hydrate. J. Geophys. Res. Solid Earth 2015, 120, 778–789. [Google Scholar] [CrossRef]
  22. Yun, T.S.; Narsilio, G.A.; Santamarina, J.C.; Ruppel, C. Instrumented pressure testing chamber for characterizing sediment cores recovered at in situ hydrostatic pressure. Mar. Geol. 2006, 229, 285–293. [Google Scholar] [CrossRef]
  23. Hu, G.W.; Ye, Y.G.; Zhang, J.; Liu, C.L.; Diao, S.B.; Wang, J.S. Acoustic properties of gas hydrate-bearing consolidated sediments and experimental testing of elastic velocity models. J. Geophys. Res. 2010, 115, B02102. [Google Scholar] [CrossRef]
  24. Bu, Q.T.; Hu, G.W.; Ye, Y.G.; Liu, C.L.; Li, C.F.; Best, A.I.; Wang, J.S. The elastic wave velocity response of methane gas hydrate formation in vertical gas migration systems. J. Geophys. Eng. 2017, 14, 555–569. [Google Scholar] [CrossRef] [Green Version]
  25. Bu, Q.T.; Hu, G.W.; Ye, Y.G.; Liu, C.L.; Li, C.F.; Wang, J.S. Experimental study on 2-d acoustic characteristics and hydrate distribution in sand. Geophys. J. Int. 2017, 211, 990–1004. [Google Scholar] [CrossRef]
  26. Bu, Q.T.; Hu, G.W.; Liu, C.L.; Xing, T.J.; Li, C.F.; Meng, Q.G. Acoustic characteristics and microscopic distribution prediction during hydrate dissociation in sediments from the South China Sea. J. Nat. Gas Sci. Eng. 2019, 65, 135–144. [Google Scholar] [CrossRef]
  27. Ecker, C. Seismic Characterization of Methane Hydrate Structures; Stanford University: Santa Clara County, CA, USA, 2001. [Google Scholar]
  28. Jiang, M.J.; Zhu, F.Y.; Liu, F.; Utili, S. A bond contact model for methane hydrate-bearing sediments with interparticle cementation. Int. J. Numer. Anal. Methods Geomech. 2014, 38, 1823–1854. [Google Scholar] [CrossRef]
  29. Yang, L.; Falenty, A.; Chaouachi, M.; Haberthür, D.; Kuhs, W.F. Synchrotron X-ray computed microtomography study on gas hydrate decomposition in a sedimentary matrix. Geochem. Geophys. Geosystems 2016, 17, 3717–3732. [Google Scholar] [CrossRef] [Green Version]
  30. Chaouachi, M.; Falenty, A.; Sell, K.; Enzmann, F.; Kersten, M.; Haberth€ur, D.; Kuhs, W.F. Microstructural evolution of gas hydrates in sedimentary matrices observed with synchrotron X-ray computed tomographic microscopy. Geochem. Geophys. Geosystems 2015, 16, 1711–1722. [Google Scholar] [CrossRef] [Green Version]
  31. Le, T.X.; Bornert, M.; Aimedieu, P.; Chabot, B.; King, A.; Tang, A.M. An experimental investigation on methane hydrate morphologies and pore habits in sandy sediment using synchrotron X-ray computed tomography. Mar. Pet. Geol. 2020, 122, 104646. [Google Scholar] [CrossRef]
  32. Han, G.; Kwon, T.H.; Lee, J.Y.; Kneafsey, T.J. Depressurization-induced fines migration in sediments containing methane hydrate: X-ray computed tomography imaging experiments. J. Geophys. Res. Solid Earth 2018, 123, 2539–2558. [Google Scholar] [CrossRef]
  33. Li, Y.H.; Song, X.G.; Wu, P.; Sun, X.; Song, Y.C. Consolidation deformation of hydrate-bearing sediments: A pore-scale computed tomography investigation. J. Nat. Gas Sci. Eng. 2021, 95, 104184. [Google Scholar] [CrossRef]
  34. Zhao, Y.S.; Zhao, J.Z.; Shi, D.X.; Feng, Z.C.; Liang, W.G.; Yang, D. Micro-ct analysis of structural characteristics of natural gas hydrate in porous media during decomposition. J. Nat. Gas Sci. Eng. 2016, 31, 139–148. [Google Scholar] [CrossRef]
  35. Li, C.F.; Liu, L.L.; Sun, J.Y.; Zhang, Y.C.; Hu, G.W.; Liu, C.L. Finite element analysis of micro-seepage in hydrate-bearing quartz sands based on digital cores. Mar. Geol. Front. 2020, 36, 68–72. [Google Scholar]
  36. Zhang, Y.C.; Liu, C.L.; Wu, N.Y.; Liu, L.L.; Hao, X.L.; Meng, Q.G.; Li, C.F.; Sun, J.Y.; Wang, D.G. Advances in the pore-structure characteristics and microscopic seepage numerical simulation of the hydrate-bearing sediments. Mar. Geol. Front. 2020, 36, 23–33. [Google Scholar]
  37. Li, C.F.; Hu, G.W.; Zhang, W.; Ye, Y.G.; Liu, C.L.; Li, Q.; Sun, J.Y. Influence of foraminifera on formation and occurrence characteristics of natural gas hydrates in fine-grained sediments from shen hu area, South China Sea. Sci. China Earth Sci. 2016, 59, 2223–2230. [Google Scholar] [CrossRef]
  38. Li, C.F.; Liu, C.L.; Hu, G.W.; Sun, J.Y.; Hao, X.L.; Liu, L.L.; Meng, Q.G. Investigation on the multiparameter of hydrate—Bearing sands using nano—Focus X-ray computed tomography. J. Geophys. Res. Solid Earth 2019, 124, 2286–2296. [Google Scholar] [CrossRef]
  39. Lei, L.; Seol, Y.; Myshakin, E.M. Methane hydrate film thickening in porous media. Geophys. Res. Lett. 2019, 46, 11091–11099. [Google Scholar] [CrossRef]
  40. Lei, L.; Seol, Y.; Choi, J.H.; Kneafsey, T.J. Pore habit of methane hydrate and its evolution in sediment matrix—Laboratory visualization with phase-contrast micro-ct. Mar. Pet. Geol. 2019, 104, 451–467. [Google Scholar] [CrossRef] [Green Version]
  41. Lei, L.; Seol, Y. High-saturation gas hydrate reservoirs—A pore scale investigation of their formation from free gas and dissociation in sediments. J. Geophys. Res. Solid Earth 2019, 124, 12430–12444. [Google Scholar] [CrossRef]
  42. Dvorkin, J.; Prasad, M.; Sakai, A.; Lavoie, D. Elasticity of marine sediments: Rock physics modeling. Geophys. Res. Lett. 1999, 26, 1781–1784. [Google Scholar] [CrossRef]
  43. Helgerud, M.B.; Dvorkin, J.; Nur, A.; Sakai, A.; Collett, T. Elastic-wave velocity in marine sediments with gas hydrate: Effective medium modeling. Geophys. Res. Lett. 1999, 26, 2021–2024. [Google Scholar] [CrossRef]
  44. Sahoo, S.K.; Madhusudhan, B.N.; Marín-Moreno, H.; North, L.J.; Ahmed, S.; Falcon-Suarez, I.H.; Minshull, T.A.; Best, A.I. Laboratory insights into the effect of sediment-hosted methane hydrate morphology on elastic wave velocity from time-lapse 4-D synchrotron X-ray computed tomography. Geochem. Geophys. Geosystems 2018, 19, 4502–4521. [Google Scholar] [CrossRef] [Green Version]
  45. Ye, Y.G.; Liu, C.L. (Eds.) Natural Gas Hydrates: Experimental Techniques and Their Applications, Springer Geophysics; Springer: Berlin/Heidelberg, Germany, 2013. [Google Scholar]
Figure 1. Schematic configuration of the experimental device. T represents Temperature sensor, P represents Pressure sensor.
Jmse 10 01089 g001
Figure 2. Variations in pressure, temperature, and hydrate saturation (Sh) during hydrate dissociation.
Jmse 10 01089 g002
Figure 3. Variation in P-wave velocity during hydrate dissociation.
Jmse 10 01089 g003
Figure 4. Variation characteristics of acoustic waveforms at selected points during hydrate dissociation.
Jmse 10 01089 g004
Figure 5. X-CT images of a sample cross-section during hydrate dissociation. Where (ae) represent different dissociation stages, corresponding to the points in Figure 2, Figure 3 and Figure 4. (f) represents an overall schematic of a sample scan. Yellow represents methane hydrate, blue represents NaCl solution, light gray represents sand, and black represents methane gas.
Jmse 10 01089 g005
Figure 6. Variation in hydrate saturation and wave velocity during hydrate dissociation. a–e represent different dissociation stages, corresponding to the points in Figure 2, Figure 3 and Figure 4.
Jmse 10 01089 g006
Figure 7. Changes in the microscopic spatial distribution and acoustic characteristics during hydrate dissociation. a–e represent different dissociation stages, corresponding to the points in Figure 2, Figure 3, Figure 4, Figure 5 and Figure 6.
Jmse 10 01089 g007
Table 1. Pressure and temperature variations during the hydrate dissociation process.
Time/h 1Pressure/MPa 2Temperature/°C 3
04.01.8
9.54.01.8
244.04.9
254.55.9
274.55.8
29.54.55.8
314.76.8
324.76.6
47.54.86.6
494.86.6
49.55.38.2
505.37.6
51.55.37.3
545.37.3
54.175.59.5
54.345.78.3
54.55.78.4
55.165.78.4
56.56.09.8
72.56.49.7
746.49.7
74.176.711.4
74.346.911.6
74.57.211.5
757.712.5
767.510.8
76.57.610.5
80.57.610.6
119.58.312.5
121.58.312.5
121.848.915.3
122.189.214.1
123.189.416.4
123.689.416.0
126.939.716.0
127.939.716.8
129.689.717.2
147.689.716.5
1519.716.5
1529.923.2
17010.128.1
1 Time is the time taken for hydrate dissociation. 2 Pressure is the real-time pressure in the sample chamber. 3 Temperature is the experimental temperature in samples.
Table 2. Variations in pressure, temperature, hydrate saturation (Sh), and wave velocity during hydrate dissociation (selected data).
Time/h 1Pressure/MPa 2Temperature/°C 3Hydrate Saturation/% 4Wave Velocity/(m/s) 5
04.01.859.32642.0
274.55.852.52134.5
47.54.86.650.52113.0
51.55.37.348.62026.3
55.165.78.445.51911.1
72.56.49.733.81736.9
76.57.610.528.61580.4
119.58.312.515.41474.4
123.689.416.012.41434.2
147.689.716.54.51375.5
17010.128.101348.6
1 Time is the time taken for hydrate dissociation. 2 Pressure is the real-time pressure in the sample chamber. 3 Temperature is the experimental temperature in samples. 4 Hydrate saturation is calculated by CT image calculation method. 5 Wave velocity is the P-wave velocity measured by the ultrasonic analyzing equipment.
Publisher’s Note: MDPI stays neutral with regard to jurisdictional claims in published maps and institutional affiliations.

