Article

The Thermal Effect of Submarine Mud Volcano Fluid and Its Influence on the Occurrence of Gas Hydrates

1
School of Marine Sciences, Sun Yat-Sen University, Zhuhai 519000, China
2
Southern Marine Science and Engineering Guangdong Laboratory (Zhuhai), Zhuhai 519000, China
3
Sanya Institute of South China Sea Geology, Guangzhou Marine Geological Survey, China Geological Survey, Sanya 572025, China
4
Gas Hydrate Engineering and Technology Center, China Geological Survey, Ministry of Natural Resources, Guangzhou 510075, China
5
Department of Mathematics, Texas A&M University-Kingsville, Kingsville, TX 78363, USA
6
Department of Geology and Geophysics, Texas A&M University, College Station, TX 77843, USA
*
Author to whom correspondence should be addressed.
J. Mar. Sci. Eng. 2022, 10(6), 832; https://doi.org/10.3390/jmse10060832
Submission received: 3 May 2022 / Revised: 6 June 2022 / Accepted: 16 June 2022 / Published: 19 June 2022

Abstract

:
Mud volcanoes and other fluid seepage pathways usually transport sufficient gas for the formation of gas reservoirs and are beneficial to the accumulation of gas hydrate. On the other hand, the fluid thermal effects of mud volcanoes can constrain the occurrence of gas hydrates. Current field measurements indicate that fluid thermal anomalies impact the distribution of gas hydrates associated with mud volcanoes. However, due to the lack of quantitative analysis of the mud volcano fluid flow and thermal evolution, it is difficult to effectively reveal the occurrence of gas hydrates in mud volcano development areas and estimate their resource potential. This study took the Håkon Mosby Mud Volcano (HMMV) in the southwestern Barents Sea as the research object and comprehensively used seismic, well logging, drilling and heat flow survey data, combining the principles and methods of fluid dynamics and thermodynamics to study the fluid flow and heat transfer of a mud volcanic pathway. The space framework of the mud volcanic fluid temperature field thermal structure was established, the influence of the HMMV fluid thermal effect on gas hydrate occurrence was analyzed and the distribution and resource potential of gas hydrates in mud volcano development areas were revealed from the perspective of thermodynamics. This study provides a thermodynamic theoretical basis for gas hydrate accumulation research, exploration and exploitation under a fluid seepage tectonic environment.

1. Introduction

Mud volcanoes refer to the seabed protrusion terrains that can spray mud, gas and fluid, which are formed by over-pressurized fluid flowing from the deep strata in muddy sediments to the seafloor. Mud volcanoes are widely developed in geological sites with strong tectonic activity and high sedimentation rates, such as convergent continental margins, foreland basins and strike-slip tectonic belts [1].
As an efficient fluid conduit, submarine mud volcanoes may provide sufficient hydrocarbon-rich fluids to the shallow depth of gas hydrate stability zone (GHSZ), where gas hydrates precipitate and accumulate. Gas hydrates associated with mud volcanoes usually form cluster-type deposits, which are characterized by high saturation. Milkov estimated that the amount of methane resources in gas hydrates accumulated in submarine mud volcanoes ranges from 1010~1012 m3 at standard temperature and pressure [2]. In addition, gas venting is usually observed at the seafloor from mud volcanoes. Therefore, gas hydrates associated with mud volcanoes may become important targets for gas production in gas hydrate systems in the future and may play an important role in carbon cycling. Moreover, mud volcanoes are an important indicator for the presence of gas hydrates [3], which have been recovered near mud diapiric structures during field drillings in the Caspian Sea, the Black Sea, the Mediterranean Sea, offshore near Barbados, Nigeria and in the Gulf of Mexico [2,4].
On the other hand, the geothermal fluid from a deep depth can increase the temperature within and close to mud volcanoes. The increased temperature can push the base of the GHSZ toward seafloor, resulting in a “plumping” bottom-simulating reflector (BSR, indicator of the base of the GHSZ, i.e., BGHSZ) near the mud volcanoes or even the disappearance of GHSZ in the center of mud volcanoes [5]. Global gas hydrate drilling results indicate that no gas hydrates were encountered at the SH5 site above the mud diapir in the Shenhu area of the Pearl River Mouth Basin in the northern South China Sea [6]. Furthermore, gas hydrates were not found at some sites in the center of the k2 Mud Volcano of the Lake Baikal and the Håkon Mosby Mud Volcano (HMMV) of the SW Barents Sea. However, gas hydrates were found at sites farther away from the mud volcanic vents [7,8]. In addition, gas hydrates are generally distributed in an annulus around a mud volcano.
The influence of the upwelling warm fluid on the temperature distribution within the sediments is key to controlling the occurrence and distribution of gas hydrates in a mud volcano development zone. Vogt et al. conducted heat flow surveys and sediment sampling on the HMMV [9]. They showed that although the heat flow in this region was abnormally high, gas hydrates were discovered in the sediments near the seafloor. Eldholm et al. discussed the geothermal field at the edge of the Barents Sea continental shelf and emphasized that heat flow was highest in the HMMV continental slope area due to mud volcanism [10]. Kaul et al. presented the heat flow map of HMMV and indicated that the temperature was as high as 26 °C in a mud volcanic vent near the seafloor [11]. de Beer et al. emphasized the effect of upwelling warm fluid in causing heat flow anomalies [12]. The accumulation of gas hydrates at HMMV were found to be controlled by the ascending warm fluids and distributed around the mud volcano structure in an annulus [8,13,14]. However, these understandings are at the stage of qualitative description and speculation of conceptual models. Their lack of quantitative analysis and research on the thermodynamic of mud volcano fluids and its impact on gas hydrate accumulation, make it difficult to effectively reveal gas hydrate occurrence and calculate the potential amount of hydrate-bound carbon in mud volcano development areas.
In this study, we quantitatively investigate the temperature distribution within and near mud volcanoes by numerical simulations that couple fluid flow with heat transport. We apply the model to the HMMV in the Barents Sea and investigate how the upwelling warm fluid impacts gas hydrate occurrence and distribution. These results have significant implications on the gas hydrate resource evaluation, exploration and exploitation associated with submarine mud volcanoes.

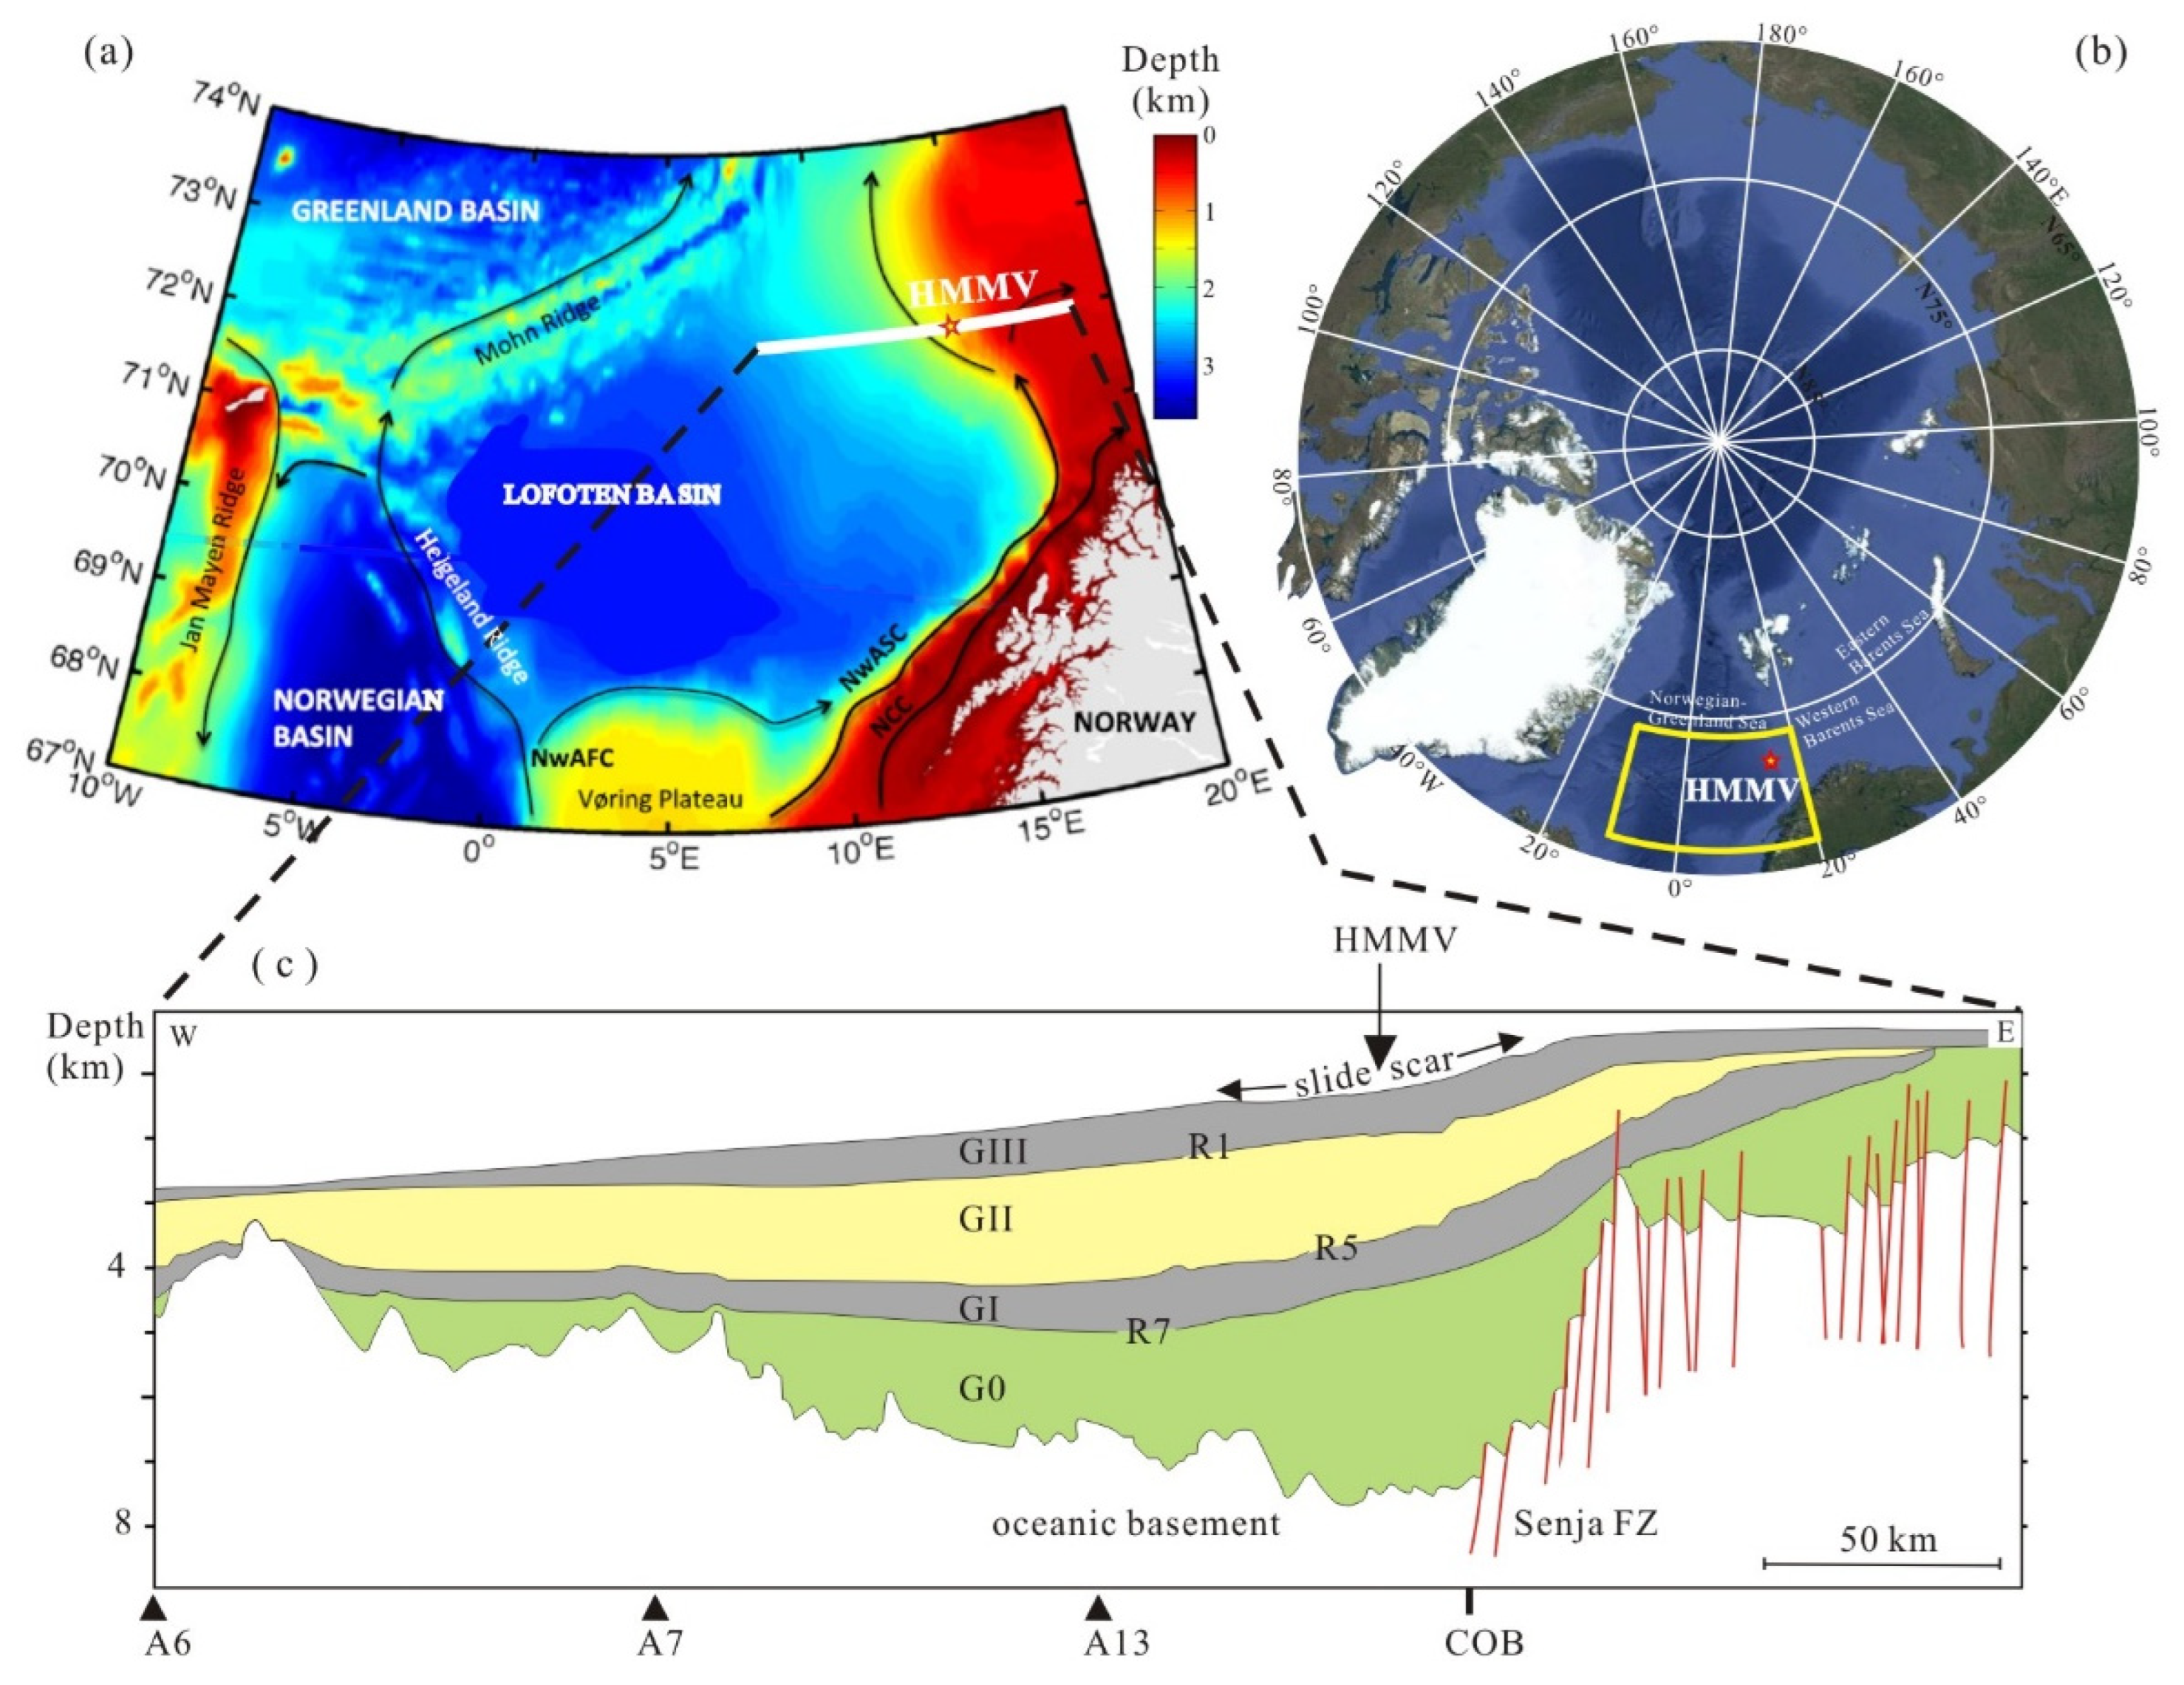
2. Geological Setting

The Barents Sea is the largest marginal sea in the Arctic Ocean (Figure 1a,b). It borders the Baltic continent to South and the Norwegian-Greenland Sea to the West [15,16,17]. The SW Barents Sea is south of the Bjørnøya, and it developed a large number of petroliferous sedimentary basins that are strike-slip, separating the Eocene–Early Oligocene oceanic crust in the Lofoten Basin from the Barents Sea continental crust [18,19,20]. The geological tectonic evolution of this area is as follows: Early Devonian–Caledonian orogeny formed the metamorphic basement. The late Paleozoic–Mesozoic was a period of tectonic extension. During this period, several rift activities formed many NE-trending half-graben basins, resulting in structural inversion in the Loppa and Stappen uplift areas [21,22]. During the Triassic to Early Jurassic period, tectonic activity was less, and weak and regional subsidence occurred in the east. The tectonic framework was finalized in the Middle Jurassic to Paleogene, during which the rifting was revived again and further strengthened. The tectonic evolution of the whole rifting period was relatively complex with the tectonic inversion and folding reaching their peak during the Eocene to Oligocene [23,24,25,26]. The Neogene–Pleistocene was a tectonic denudation period, during which the whole Barents shelf was uplifted and eroded, and the upper regional unconformity (URU) was formed during the Late Pliocene to Pleistocene [27]. The complex tectonic evolution in the SW Barents Sea region has resulted in its unique tectonic development pattern: the interlaced development of basins, tectonic uplands and fault systems.
The lower part of the URU interface in the Barents Sea is the pre-glacial sedimentation. The upper part has the glacial sedimentary to marine sedimentary environments [29]. The age of the interface between the pre-glacial and glacial sedimentation is 2.3 Ma [30,31]. This results in a sedimentation rate near the mud volcano as high as 1.35 m per 1000 years in the last 2.3 Ma. The sedimentary layers in the basin are very thick, the sedimentation rate is high, and the tectonic evolution is complex [32]. A large scale of diapiric seepage structures has developed throughout the Barents Sea, especially in the Tromsø Basin [31]. There is abundant organic matter in this area, which provides sufficient hydrocarbon source materials. In addition, there are widely-developed seepage pathways that can efficiently transport the deeply generated hydrocarbon to shallow depths.
The HMMV (72°00.25′ N, 14°43.50′ E) is located on a slide scar of the Bear Island sedimentary fan in the SW Barents Sea. It is on the continental slope between Norway and Svalbard and has a water depth of approximately 1250 m [28,32]. Håkon Mosby is a mud volcano with a nearly cylindric structure in the seismic profile and a circular structure at the seafloor [28]. The diameter of the conduit is approximately 1 km [11,33,34]. This mud volcano is still active today. Mud, fluid and gas are observed to be actively emitted from the seafloor [29,35]. The formation of HMMV coincides with the formation of submarine landslides during the Late Pleistocene. HMMV is located near the depositional center of Bjørnøya fan [36,37]. There are more than 6 km of Cenozoic sediments below the mud volcano, consisting of 3.2 km of pre-glacial sediments, biosiliceous mud and 3.1 km of glacial sediments and sandy mudstone [10]. The pre-glacial sediment has a higher porosity and lower density compared with the overlying glacial sediment. This results in sediment instability and density inversion. After the tectonic event that formed the submarine landslides, the equilibrium state of the pre-glacial sedimentary layers was disturbed, and the pre-glacial sediments invaded the glacial sediments along the tectonic weak zones and formed the HMMV.

3. Data and Methods

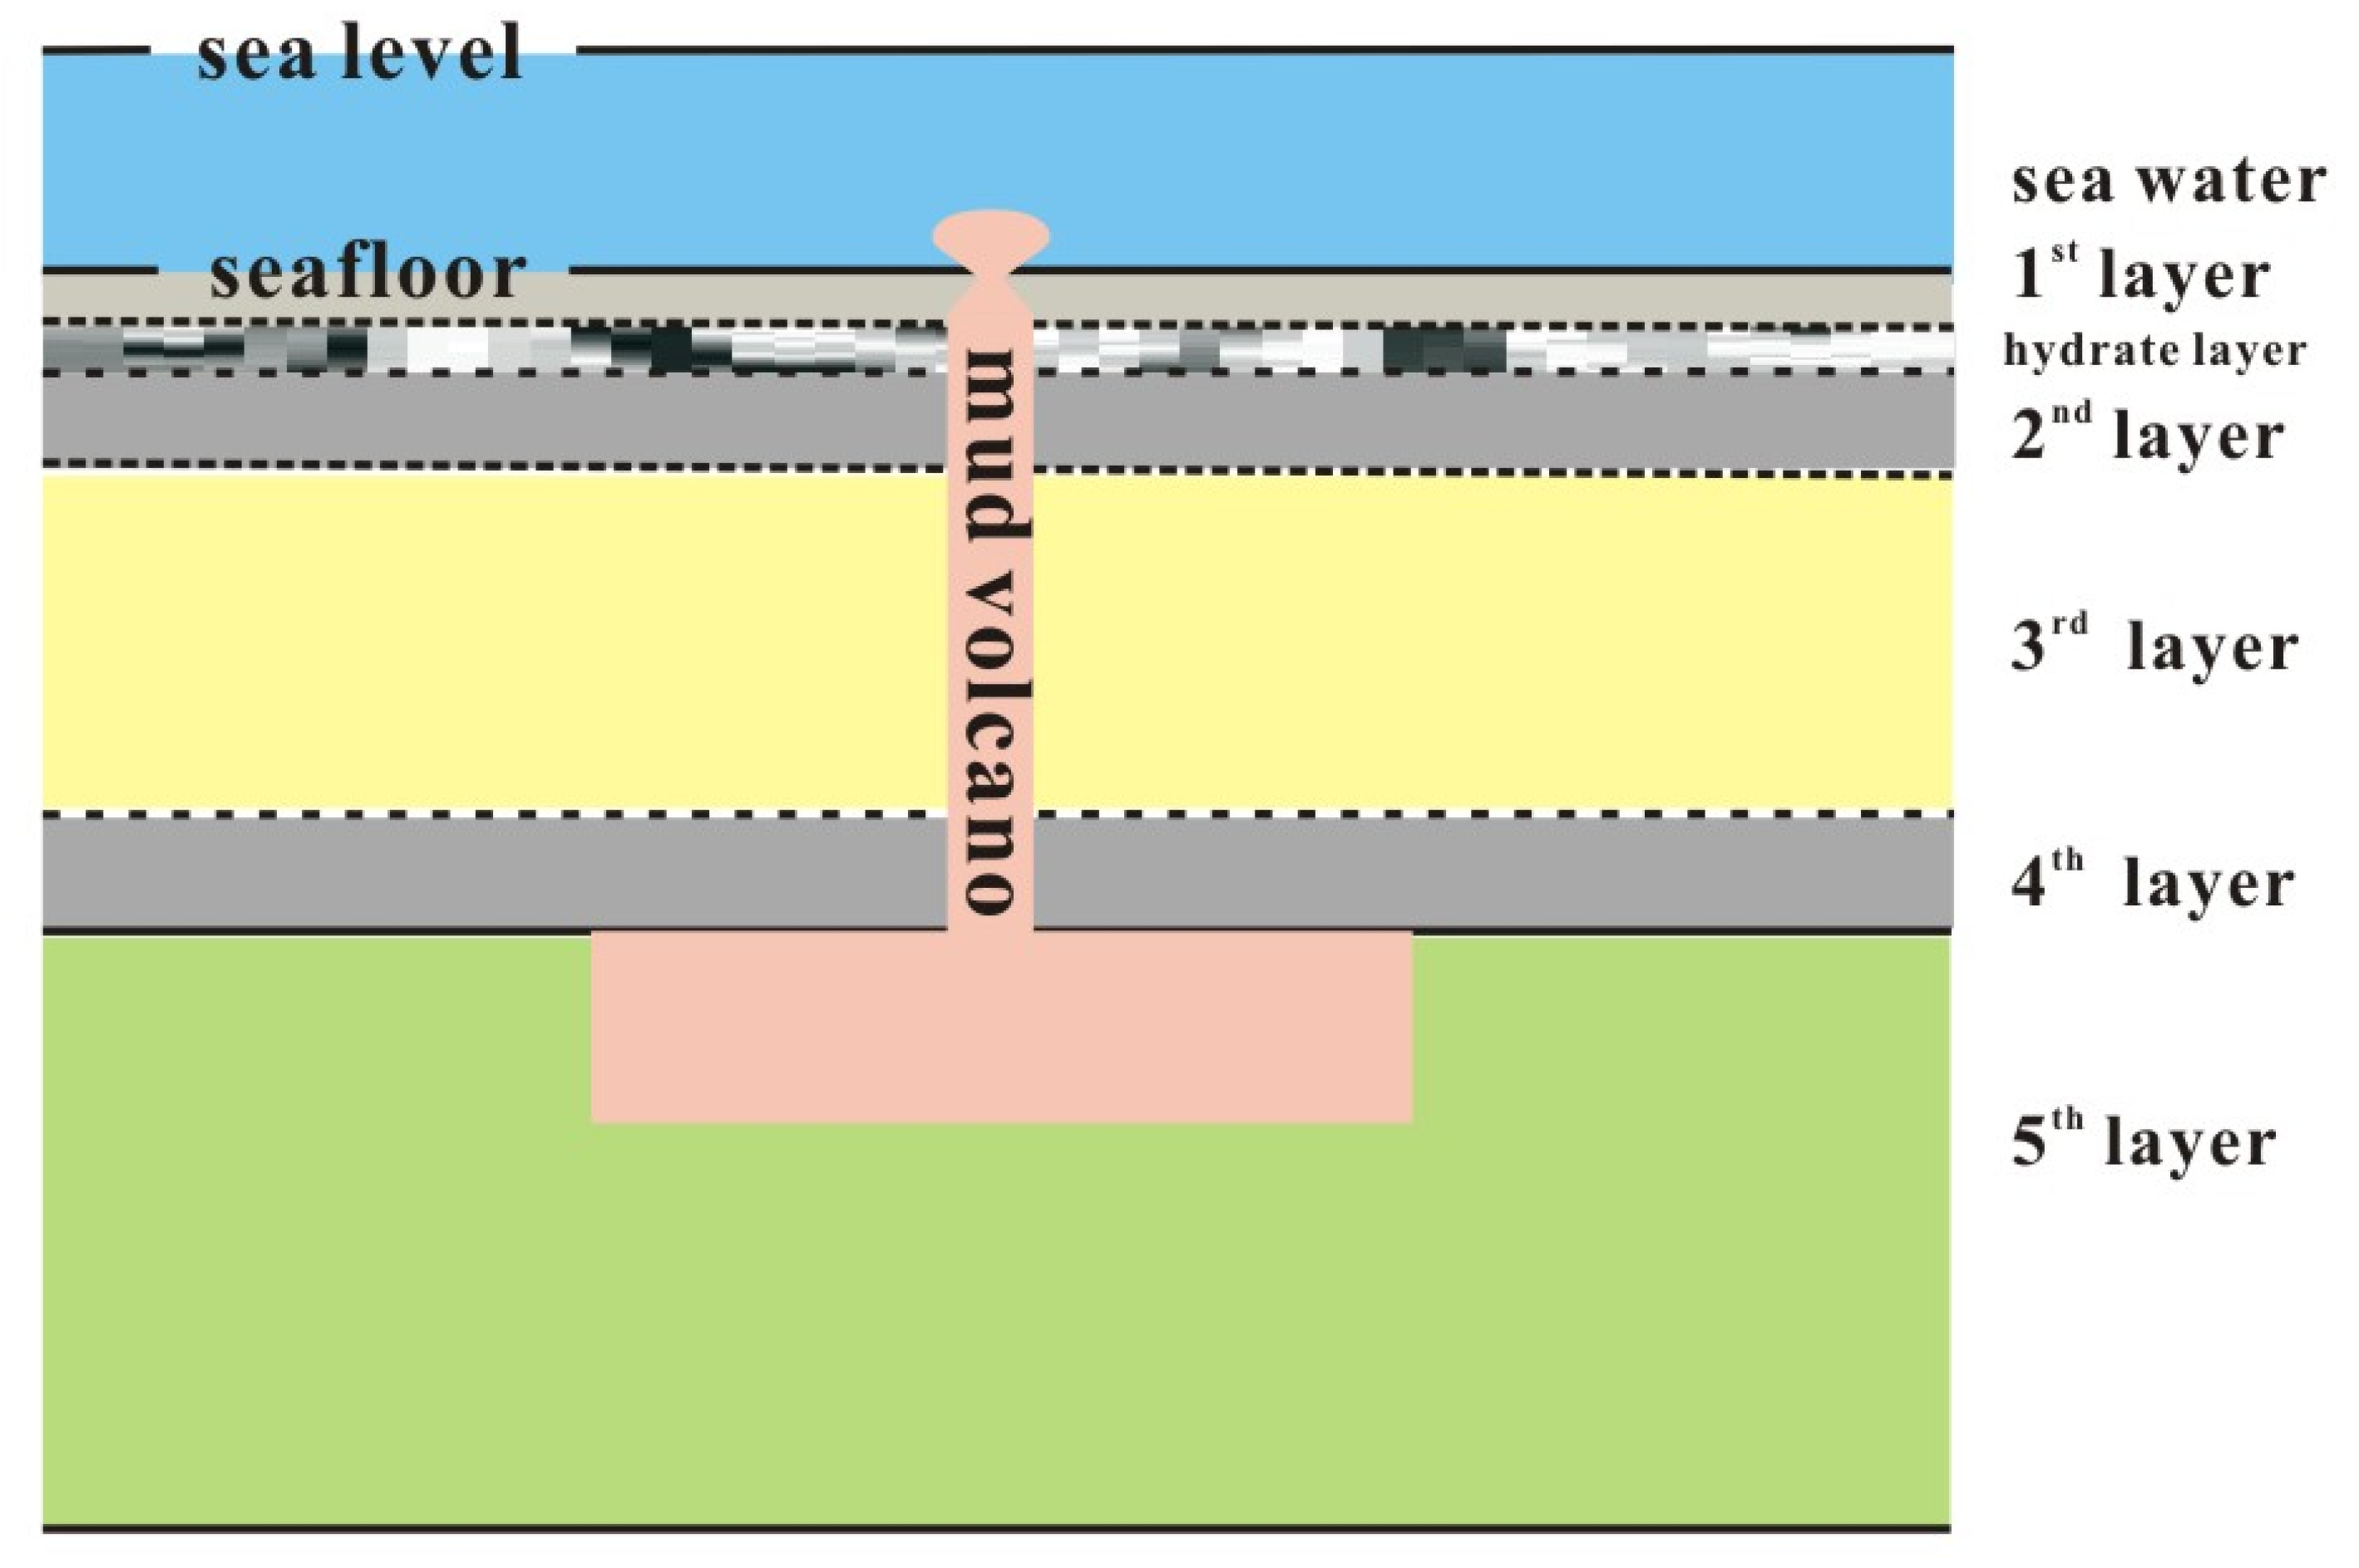
3.1. Characterization of HMMV Using Seismic, Well Logging, Drilling and Heat Flow Data

The multi-channel seismic data show that HMMV is located near the ocean–continent transition zone in the SW Barents Sea [28]. The transition zone responds well in magnetic and gravitational anomaly fields. Furthermore, a series of stepped faults developed in the ocean–continent transition zone [10,28,30,38]. Hjelstuen et al. divided the underlying sediments in the HMMV area into pre-glacial and glacial units [28]. The deformation of HMMV can be traced back to the basement of the glacial sediments, with a depth approximately 3.1 km (Figure 1c).
Submarine heat flow surveys and gas hydrate drilling have been conducted in the HMMV area [8,11,12,15,37]. The high seafloor temperature revealed that the HMMV is still active, and the regional background geothermal gradient is 0.06 °C/m [10]. Dickens and Quinby-Hunt proposed the methane hydrate phase boundary as follows [39]:
1 T = 3.79 × 10 3 2.83 × 10 4 l o g p
where T is temperature [K] and p is pressure [MPa]. With the water depth of HMMV being 1250 m and salinity of 33.5‰, we use Equation (1) to calculate the maximum temperature of gas hydrate occurrence at the BGHSZ, which equals 13.20 °C and is located at 220 mbsf (meters below the seafloor) (Equation (1)) [32]. The top of the gas hydrate occurrence zone is closely related to the base of the sulfate–methane transition zone. In the sulfate–methane transition zone, methane is preferentially consumed during sulfate reduction and no gas hydrate forms. Based on the geochemical measurement of sulfate radicals in the HMMV, the top of the gas hydrate occurrence zone is at approximately 140 mbsf [15]. Gas hydrate possibly occurs from 140 to 220 mbsf.
We built a geological model of the HMMV in the southwestern Barents Sea based on the geochemical and geological data, including the seismic, well logging, drilling and heat flow survey data, seen in Figure 2. The geometry of the mud volcano is cylindrical, the overpressurized gas-rich fluid was initially stored in the fifth layer. By establishing the geological model, the influence of heat transfer from mud volcano fluids on the gas hydrate occurrence zone was analyzed and the gas hydrate distribution around the mud volcano was revealed. According to the heat flow survey, the thermodynamic boundary conditions of the mathematical model were determined. The physical parameters of each layer of the mud volcano geological model are shown in Table 1.

3.2. Håkon Mosby Mud Volcanic Fluid Thermodynamic Simulation Method

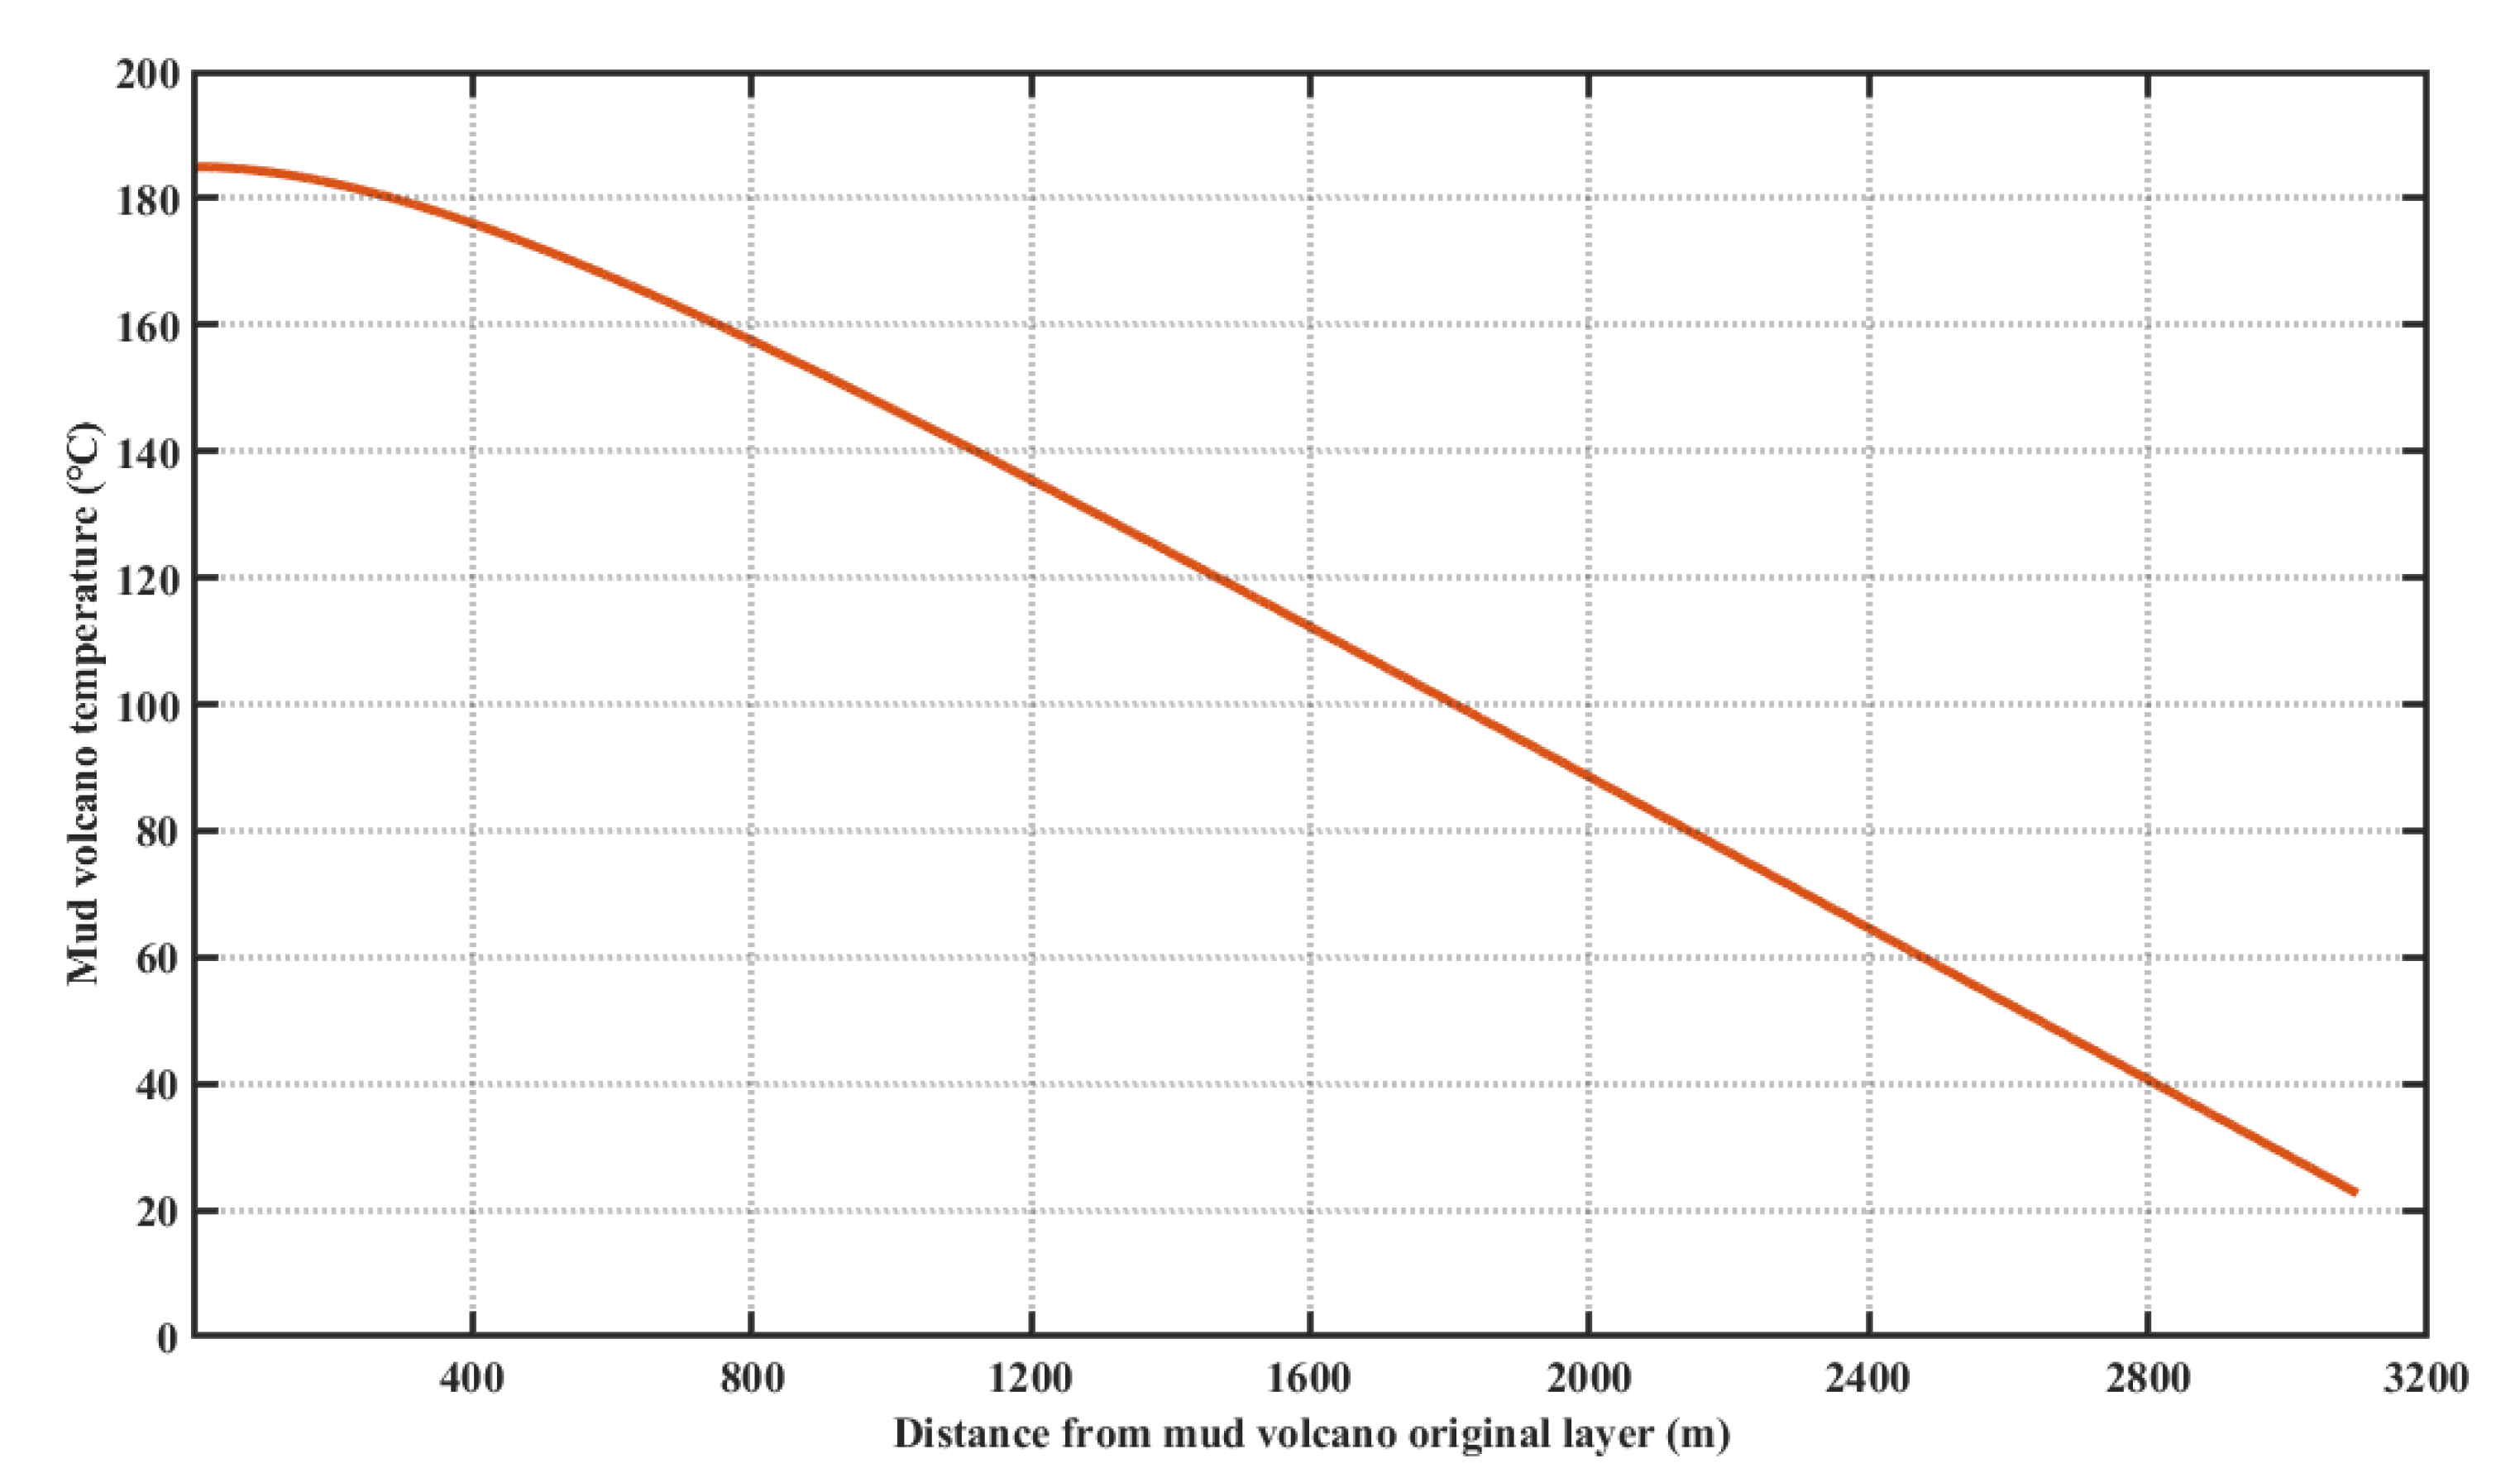
3.2.1. Temperature Variation of the Thermal Fluid at Different Depths in the Mud Volcanic Conduit

As mud volcano fluid flows upwards, its temperature changes are affected by its heat exchange and the temperature of surrounding rock layers. In this section, we will quantitatively characterize the vertical temperature distribution within the mud volcano conduit as the mud fluid flows.
We assume that the fluid flow within the mud volcanic conduit is at a steady state and fully developed flow, we neglect changes in kinetic and potential energy, dissipation and axial conduction. The temperature TW on the lateral surface of the mud volcanic conduit decreases with the increase of the distance from the initial eruption point of the mud volcano, largely controlled by the geothermal temperature. The initial temperature T0 of the mud volcanic thermal fluid is equal to the temperature on the lateral surface of the mud volcanic channel where the fluid flow originates. Under the action of fluid pressure, the mud volcanic thermal fluid flows upwards for a distance ∆z (Figure 3).
Since the temperature Tw on the lateral surface of the channel is lower than the mud volcanic thermal fluid temperature, the mud volcanic thermal fluid temperature T ( z ) continuously decreases in such a way that the change of temperature, T , is proportional to the temperature difference between the flowing fluid and the lateral surface and the distance from mud volcano original layer.
T = T ( z 1 + z ) T ( z 1 )
T = β ( T ( z ) T w ( z ) ) z
where β > 0, which is a constant to be determined. As z approaches zero as its limit, Equation (3) becomes the following differential equation,
d T dz = β ( T ( z ) T w ( z ) ) .
Equation (4) is a first-order linear inhomogeneous ordinary differential equation (ODE). The solution of the responding homogenous ODE,
d T dz = β T ( z )
is the following:
T ( z ) = T 1 e β z
where T 1 is a constant. Note that Equation (5) is the heat convection equation, when the lateral surface temperature of the conduit does not change with depth, the solution of Equation (5) can be written in a standard form [40]:
T e ( z ) = T s + ( T 0 T s ) e x p ( p h mc z ) .
Comparing Equation (6) with Equation (7), we obtain the constant β   as the following:
β = p h m c
Now we let T 1 be a function of the distance z to find the solution of the inhomogeneous ODE Equation (4), so that
T ( z ) = T 1 ( z ) e β z
Substituting Equation (9) into Equation (4), we obtain
d T 1 dz = β T w ( z ) e β z
Its solution is:
T 1 ( z ) = β 0 z T w ( z ) e β z   d z
The temperature T w ( z ) on the lateral surface of the mud volcanic conduit controlled by the geothermal gradient g, can be expressed as Equation (12),
T w ( z ) = T 0 gz
Substituting Equation (12) into the Equation (11), the Equation (9) can then be solved with the following solution,
T 1 = T 1 ( 0 ) + T 0 e β z gze β z + g β e β z
T ( z ) = T 1 ( 0 ) e β z + T w ( z ) + g β
When z = 0 , T ( 0 ) = T 1 ( 0 ) + T w ( 0 ) + g β , as T ( 0 ) = T w ( 0 ) , So T 1 ( 0 ) = g β , Equation (14) becomes Equation (15),
T ( z ) = T w ( z ) + g β ( 1 e β z )
Equation (15) can be written explicitly as follows, for the temperature variation of the thermal fluid at different depth in the mud volcanic conduit. The temperature T (0) of the mud volcanic fluid at the original layer (layer 5, z = 0) is 185 °C [10]. Combined with the velocity of the upward fluid measured by the pore water geochemical data of mud volcanoes in hot spots of the world, including HMMV, the shallow velocity of mud volcanoes ranges from 1.27 × 10⁻⁹ m/s to 1.90 × 10⁻⁷ m/s. In order to simplify the model, we selected 4.76 × 10⁻⁹ m/s as the velocity of the upward flow, which is assumed to remain constant in the calculation [11,15,41]. Other parameters for vertical temperature calculation within mud volcano conduit are listed in Table 2.
T ( z ) = ( T 0 gz ) + g β ( 1 e β z )

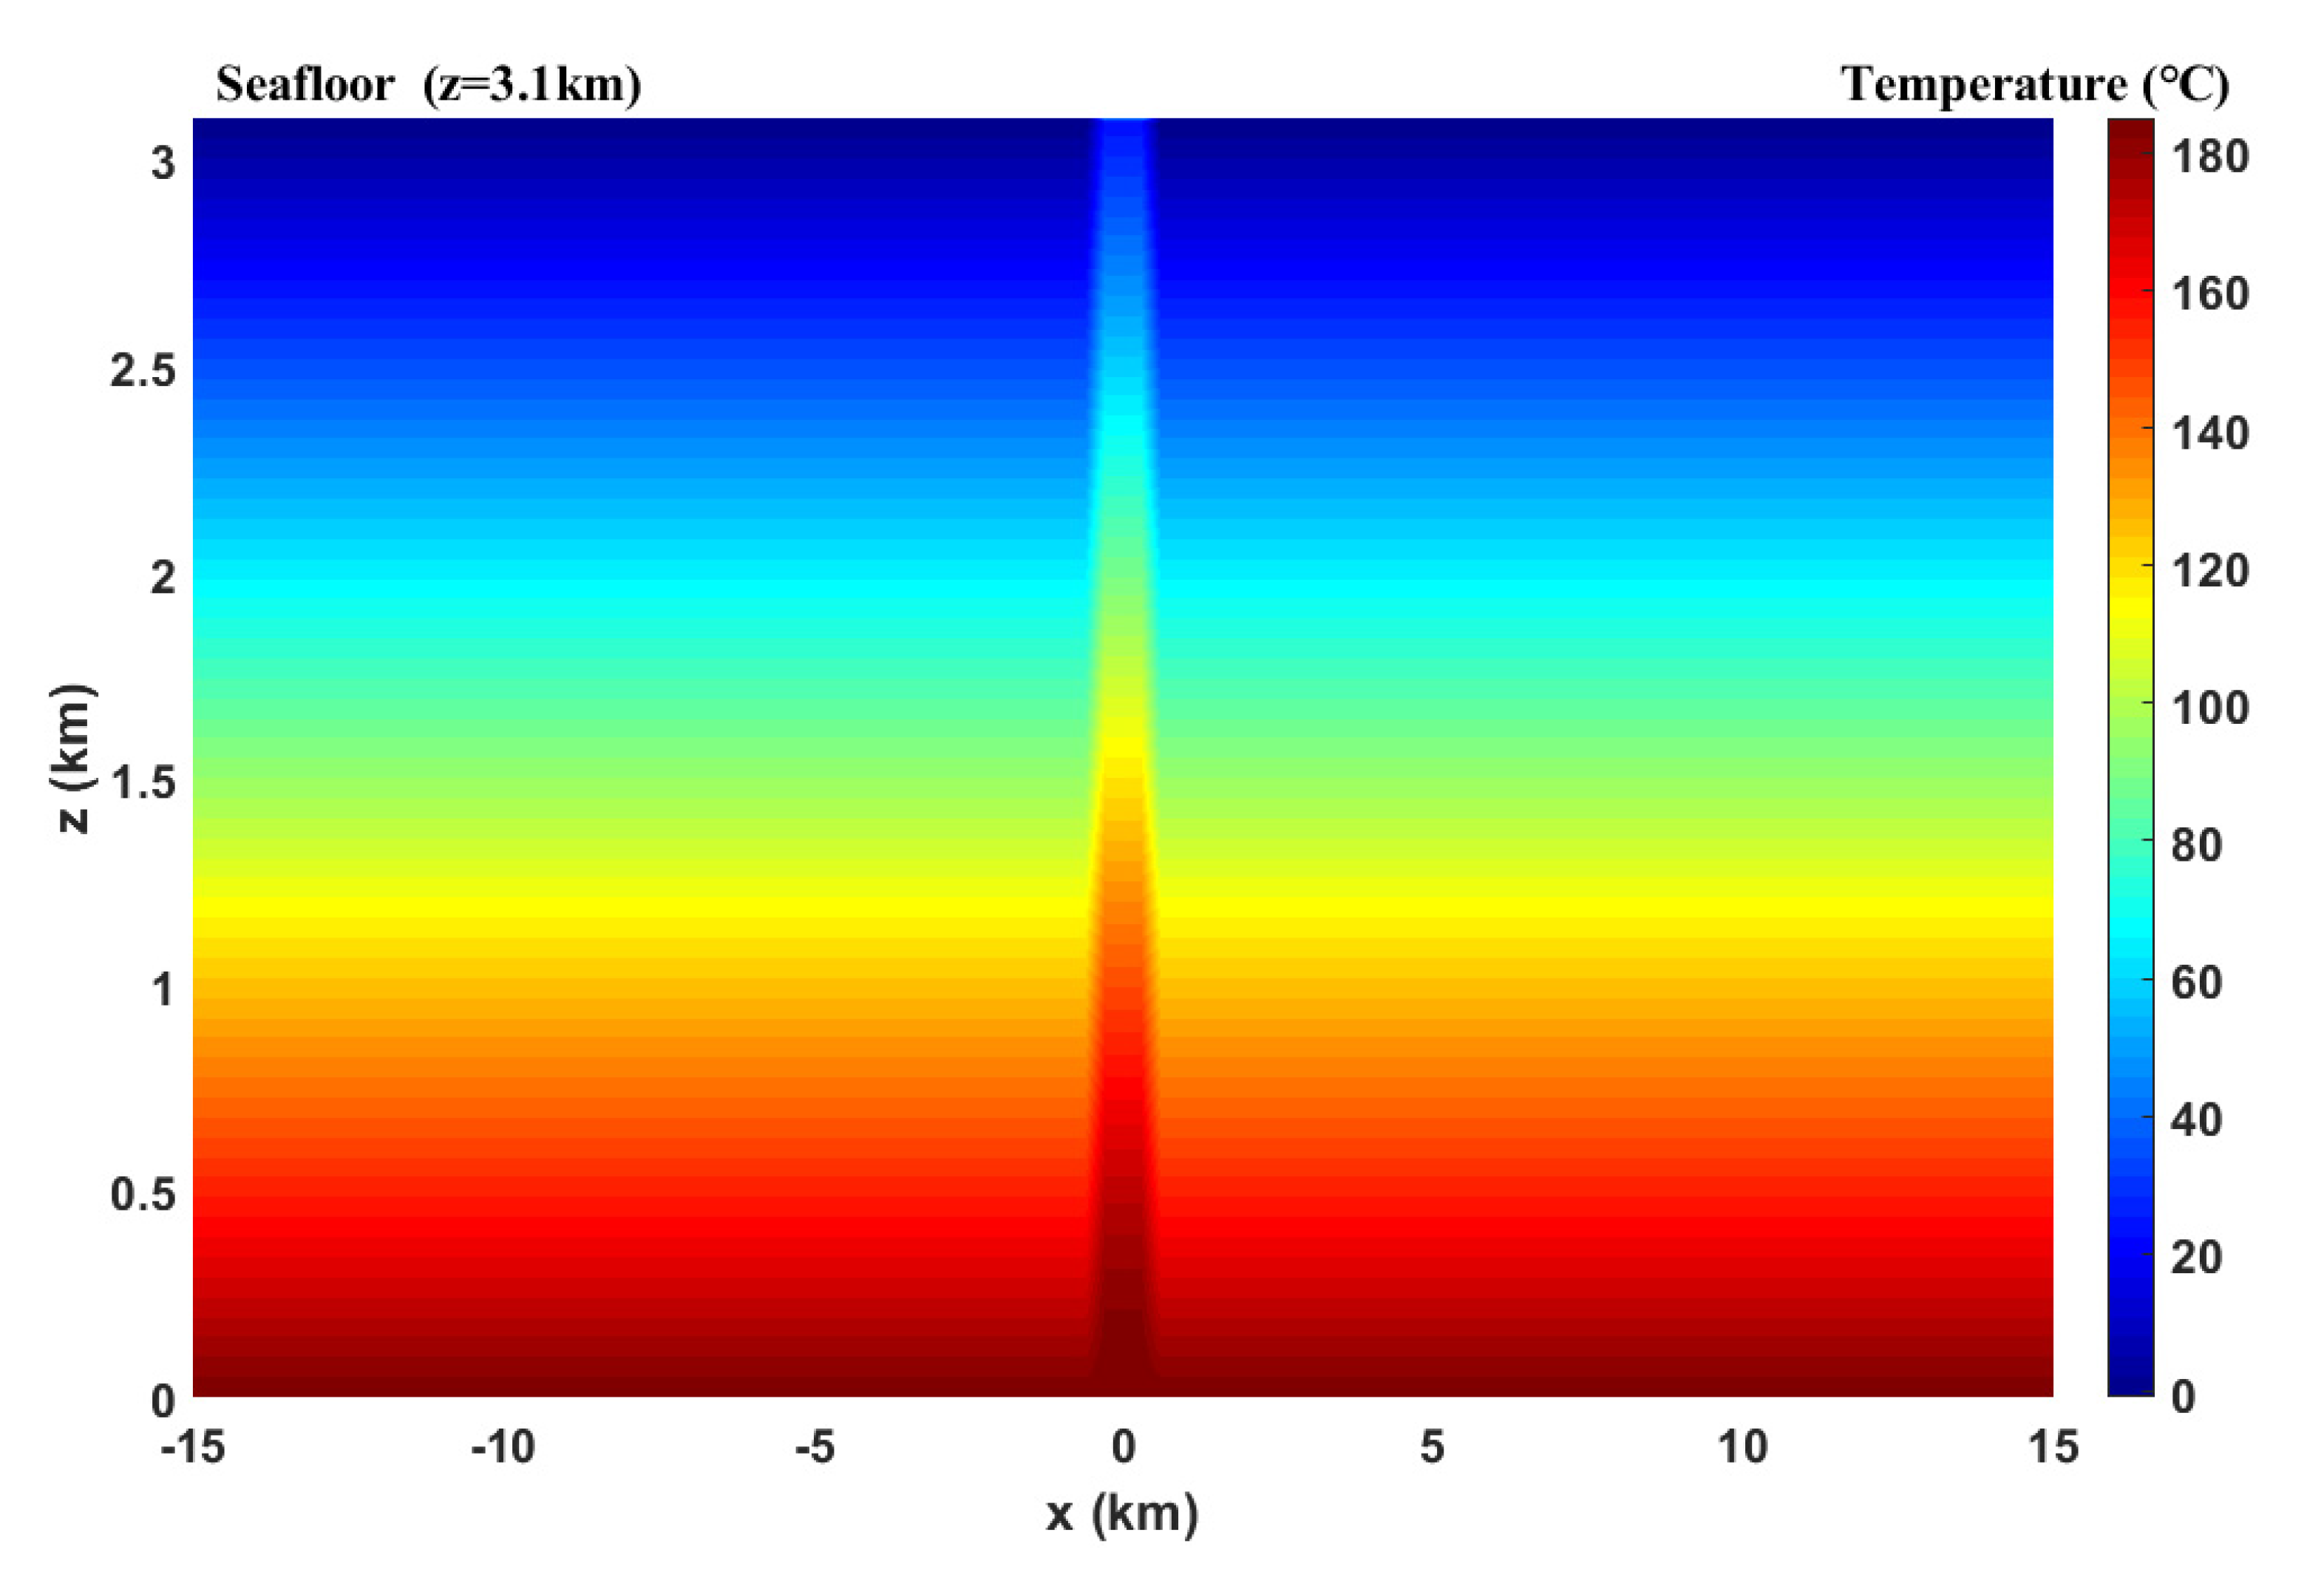
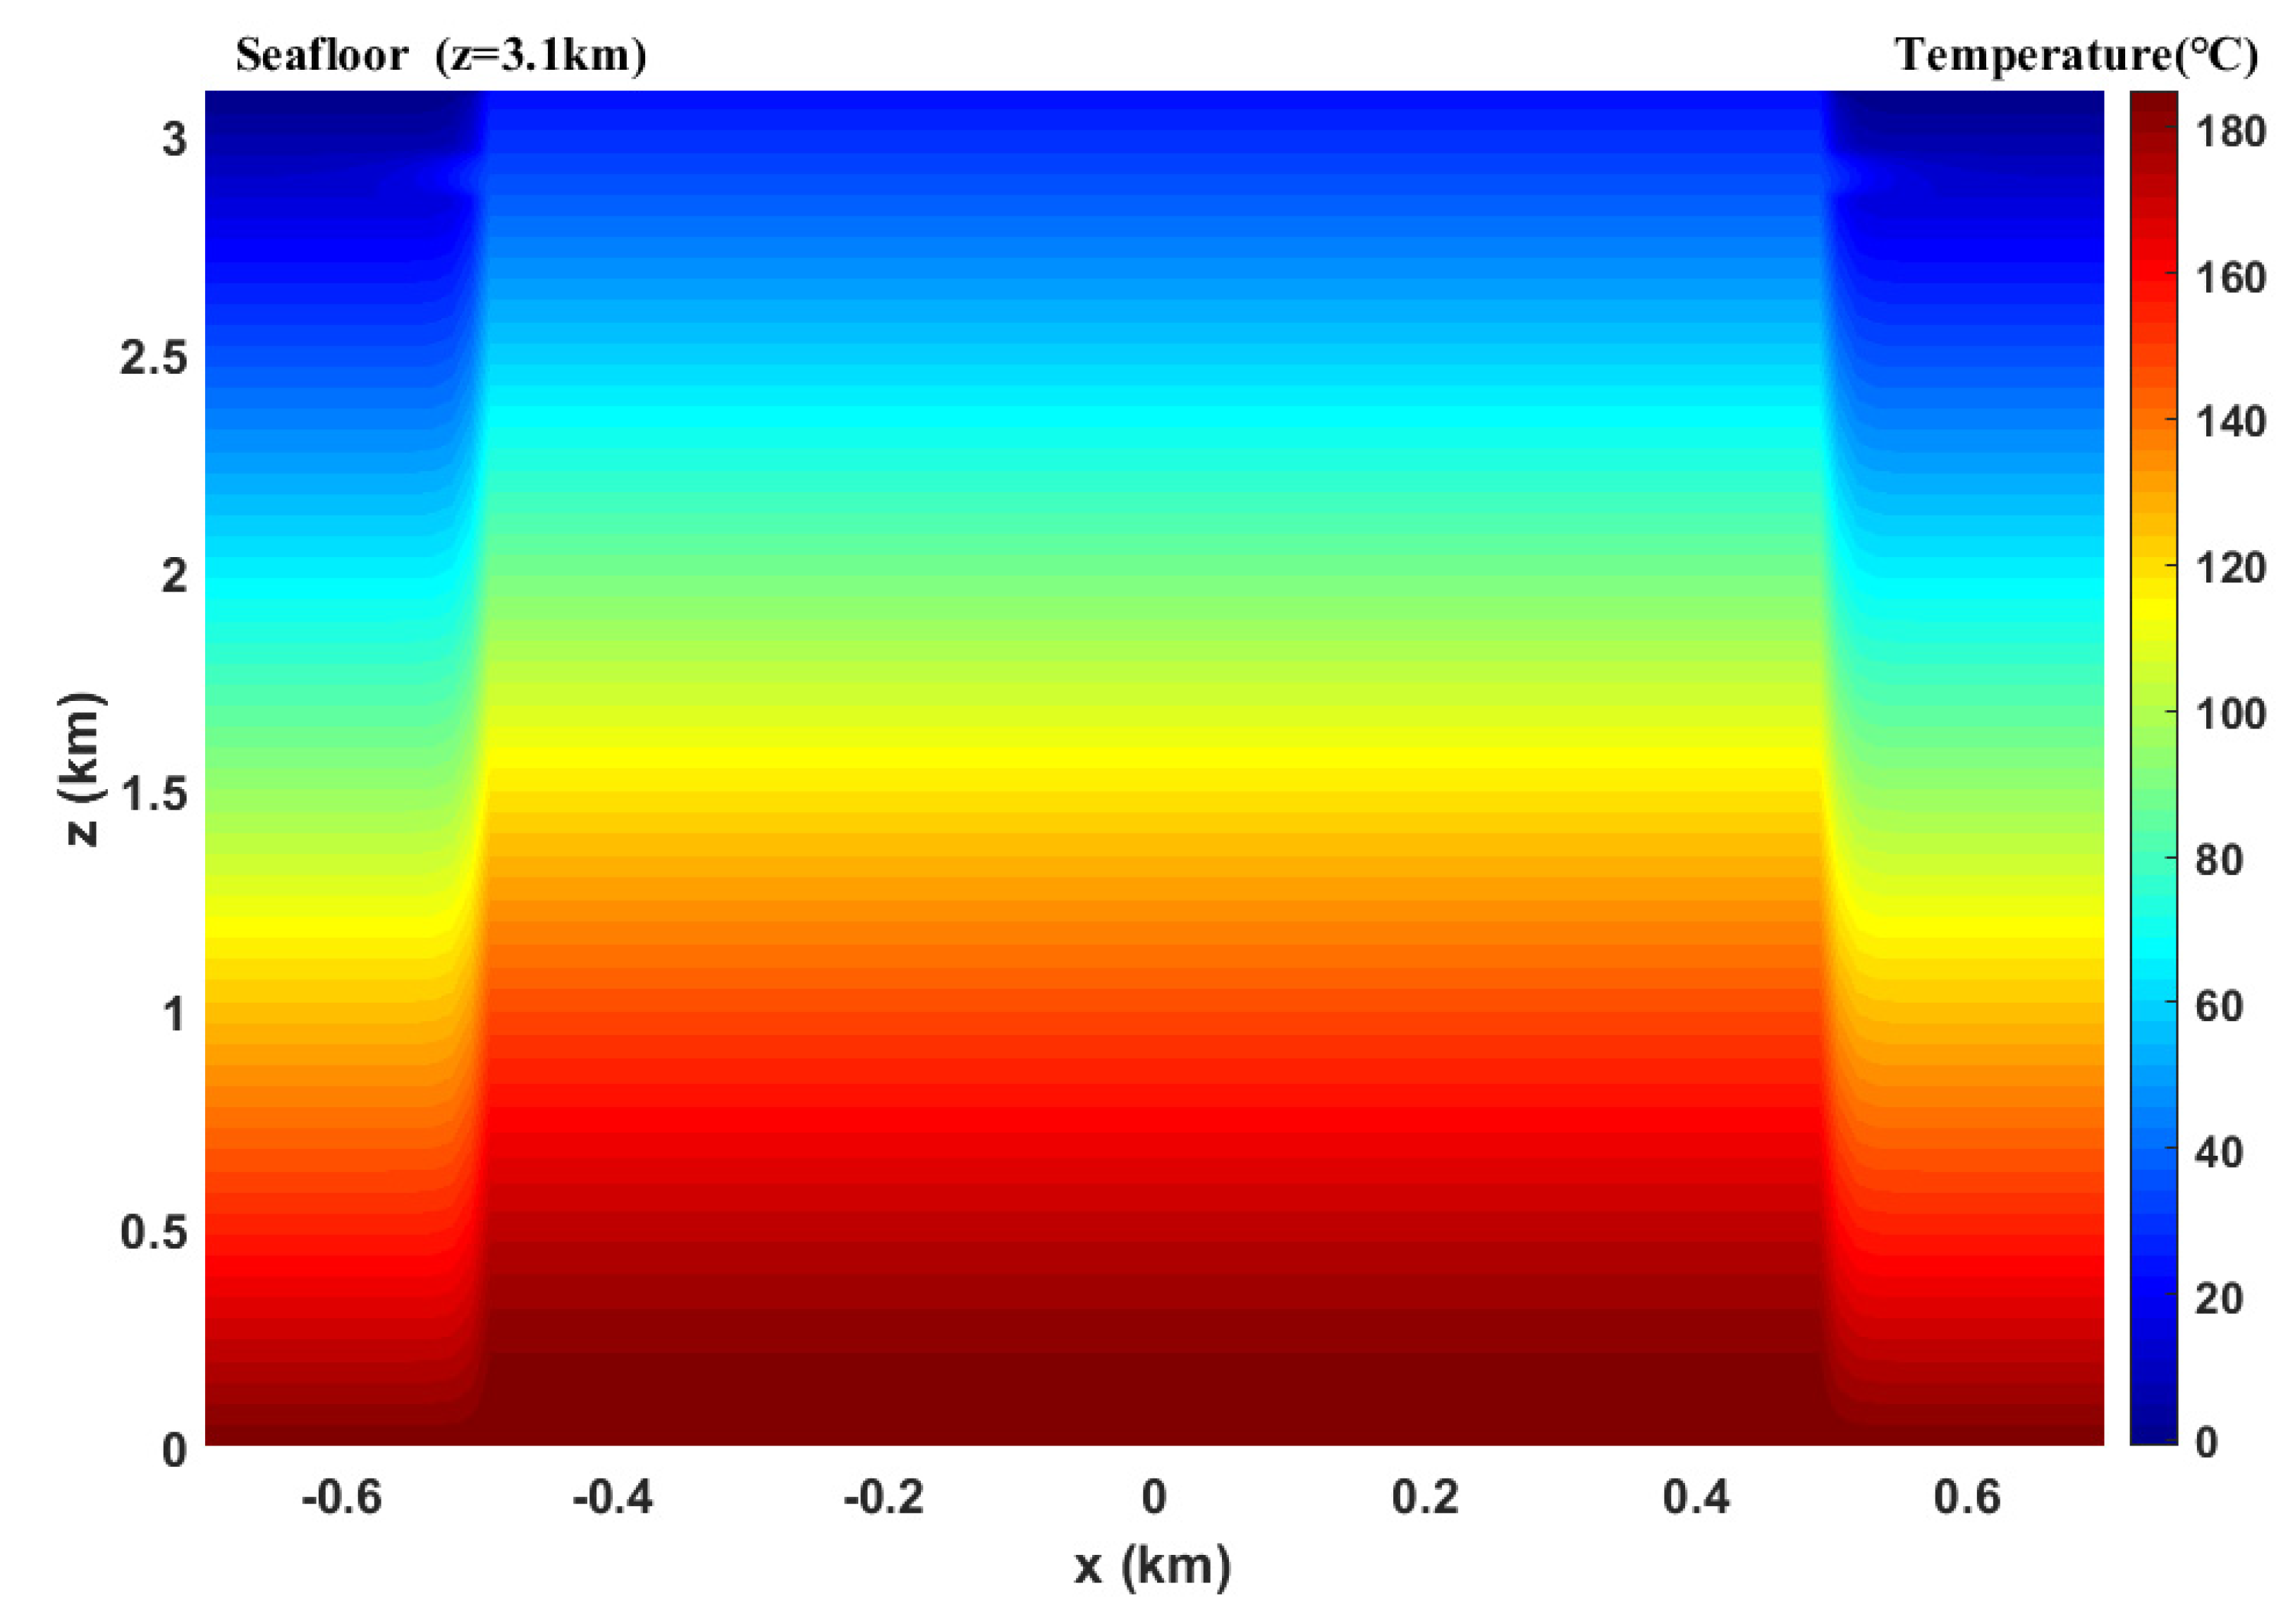
3.2.2. Effects of Mud Volcano Thermal Fluid on Surrounding Sediment

After setting up the initial temperature in the conduit, we used the transient heat conduction Equation (17) to calculate the temperature of the surrounding strata affected by mud volcano thermal fluid [42], and then we used MATLAB® 2017b for finite difference numerical calculations.
ρ c p T t = x ( k x T x ) + z ( k z T z )
When the thermal conductivity of k x is equal to k z , we express = k ρ c p , Equation (17) can be written as Equation (18),
T t = α ( 2 T x 2 + 2 T z 2 )
then we employ an explicit finite difference method to discretize the transient heat Equation (18), the formula is written as Equations (19)–(21):
T ( z , x , t ) can be uniformly meshed as T ( i z , j x , n t ) , expressed as T i , j n , and Equation (18) becomes Equation (20):
2 T z 2 = T i + 1 , j n 2 T i , j n + T i 1 , j n z 2
T i , j n + 1 T i , j n t = α ( T i , j + 1 n 2 T i , j n + T i , j 1 n ( x ) 2 + T i + 1 , j n 2 T i , j n + T i 1 , j n ( z ) 2 )
We express s x = α t ( x ) 2 and s z = α t ( z ) 2 . Finally, from Equation (18) to (20),   T i , j n + 1 is introduced as:
T i , j n + 1 = T i , j n + s x ( T i , j + 1 n 2 T i , j n + T i , j 1 n ) + s z ( T i + 1 , j n 2 T i , j n + T i 1 , j n )
When 2 α t min ( ( x ) 2 , ( z 2 ) ) 1 , the explicit equations are stable, all parameters of these equations are listed in Table 3.

4. Results

4.1. Vertical Temperature Distribution within the Mud Volcano Conduit

We used the thermodynamic Equation (16) to calculate the temperature distribution within the mud volcanic conduit. The result is shown in Figure 4. The abscissa was the vertical distance from where the fluid flowed, and the ordinate was the temperature. The initial position (layer 5) where the mud volcano fluid began to flow was taken as the coordinate origin. After the mud volcano fluid began to flow, the mud volcanic thermal fluid temperature continuously decreased as the temperature on the lateral surface of the conduit was lower than the mud volcanic thermal fluid temperature. The initial temperature of the fluid in the mud volcano conduit was 185 °C, and it dropped to 22.62 °C when it reached the seafloor. The temperature of the mud volcano fluid decreased from the original stratum to the seafloor by 162.38 °C. The slope of the curve in Figure 4 was gentle at first and then increased. It showed that the temperature of the mud volcano fluid decreased slowly at the beginning due to the small temperature difference between the flowing fluid and the side during the fluid ascent. Subsequently, as the distance from the source of the fluid increased, the temperature of the mud volcano hot fluid decreased rapidly due to the increasing temperature difference between the flow fluid and the side. Therefore, the heat dissipation is closely related to the temperature difference between the flowing fluid and the lateral surface.
The ARK-XIX/3b voyage measured a geothermal gradient of up to 46 °C/m near the mud volcano center. The ARK-XIX/3b voyage recorded a maximum sediment temperature of 24.55 °C at 0.55 mbsf in this region in 2003, while the VICKING voyage recorded 20.47 °C in 2006 [8]. Our simulation of the temperature of the sediment layer at the top of a mud volcano fell in this range, which verified the feasibility and accuracy of the model. The simulated temperatures at the center of mud volcano channels are listed in Table 4. The errors of temperature within 1 m of surface layer may be related to the disturbance and covering of the surface mud layer, bottom water temperature, etc., which were ignored in this simplified model.
After calculating the temperature variation of the thermal fluid at different depth in the mud volcano conduit, we used heat conduction Equation (21) to simulate the influence of the mud volcano thermal fluid on the surrounding sediments. Figure 5 depicted the temperature distribution of sediment around a mud volcano. The simulation results showed that at the same depth, the temperature in the mud volcanic conduit was much higher than that in the surrounding strata. Taking the layer 220 mbsf as an example, the temperature in the mud volcano conduit in this layer was about 36 °C, while the temperature in the surrounding background stratum was only 12 °C, which increased to 24 °C. The heat conduction of the mud volcano’s hot fluid raised the temperature of the surrounding strata. The simulation also showed that the temperature influence of the mud volcano was about a cylinder with a radius of 1000 m, which was twice as large as the mud volcano tunnel radius of 500 m. It could be seen that the heat conduction of mud volcano had a great influence on the surrounding strata.

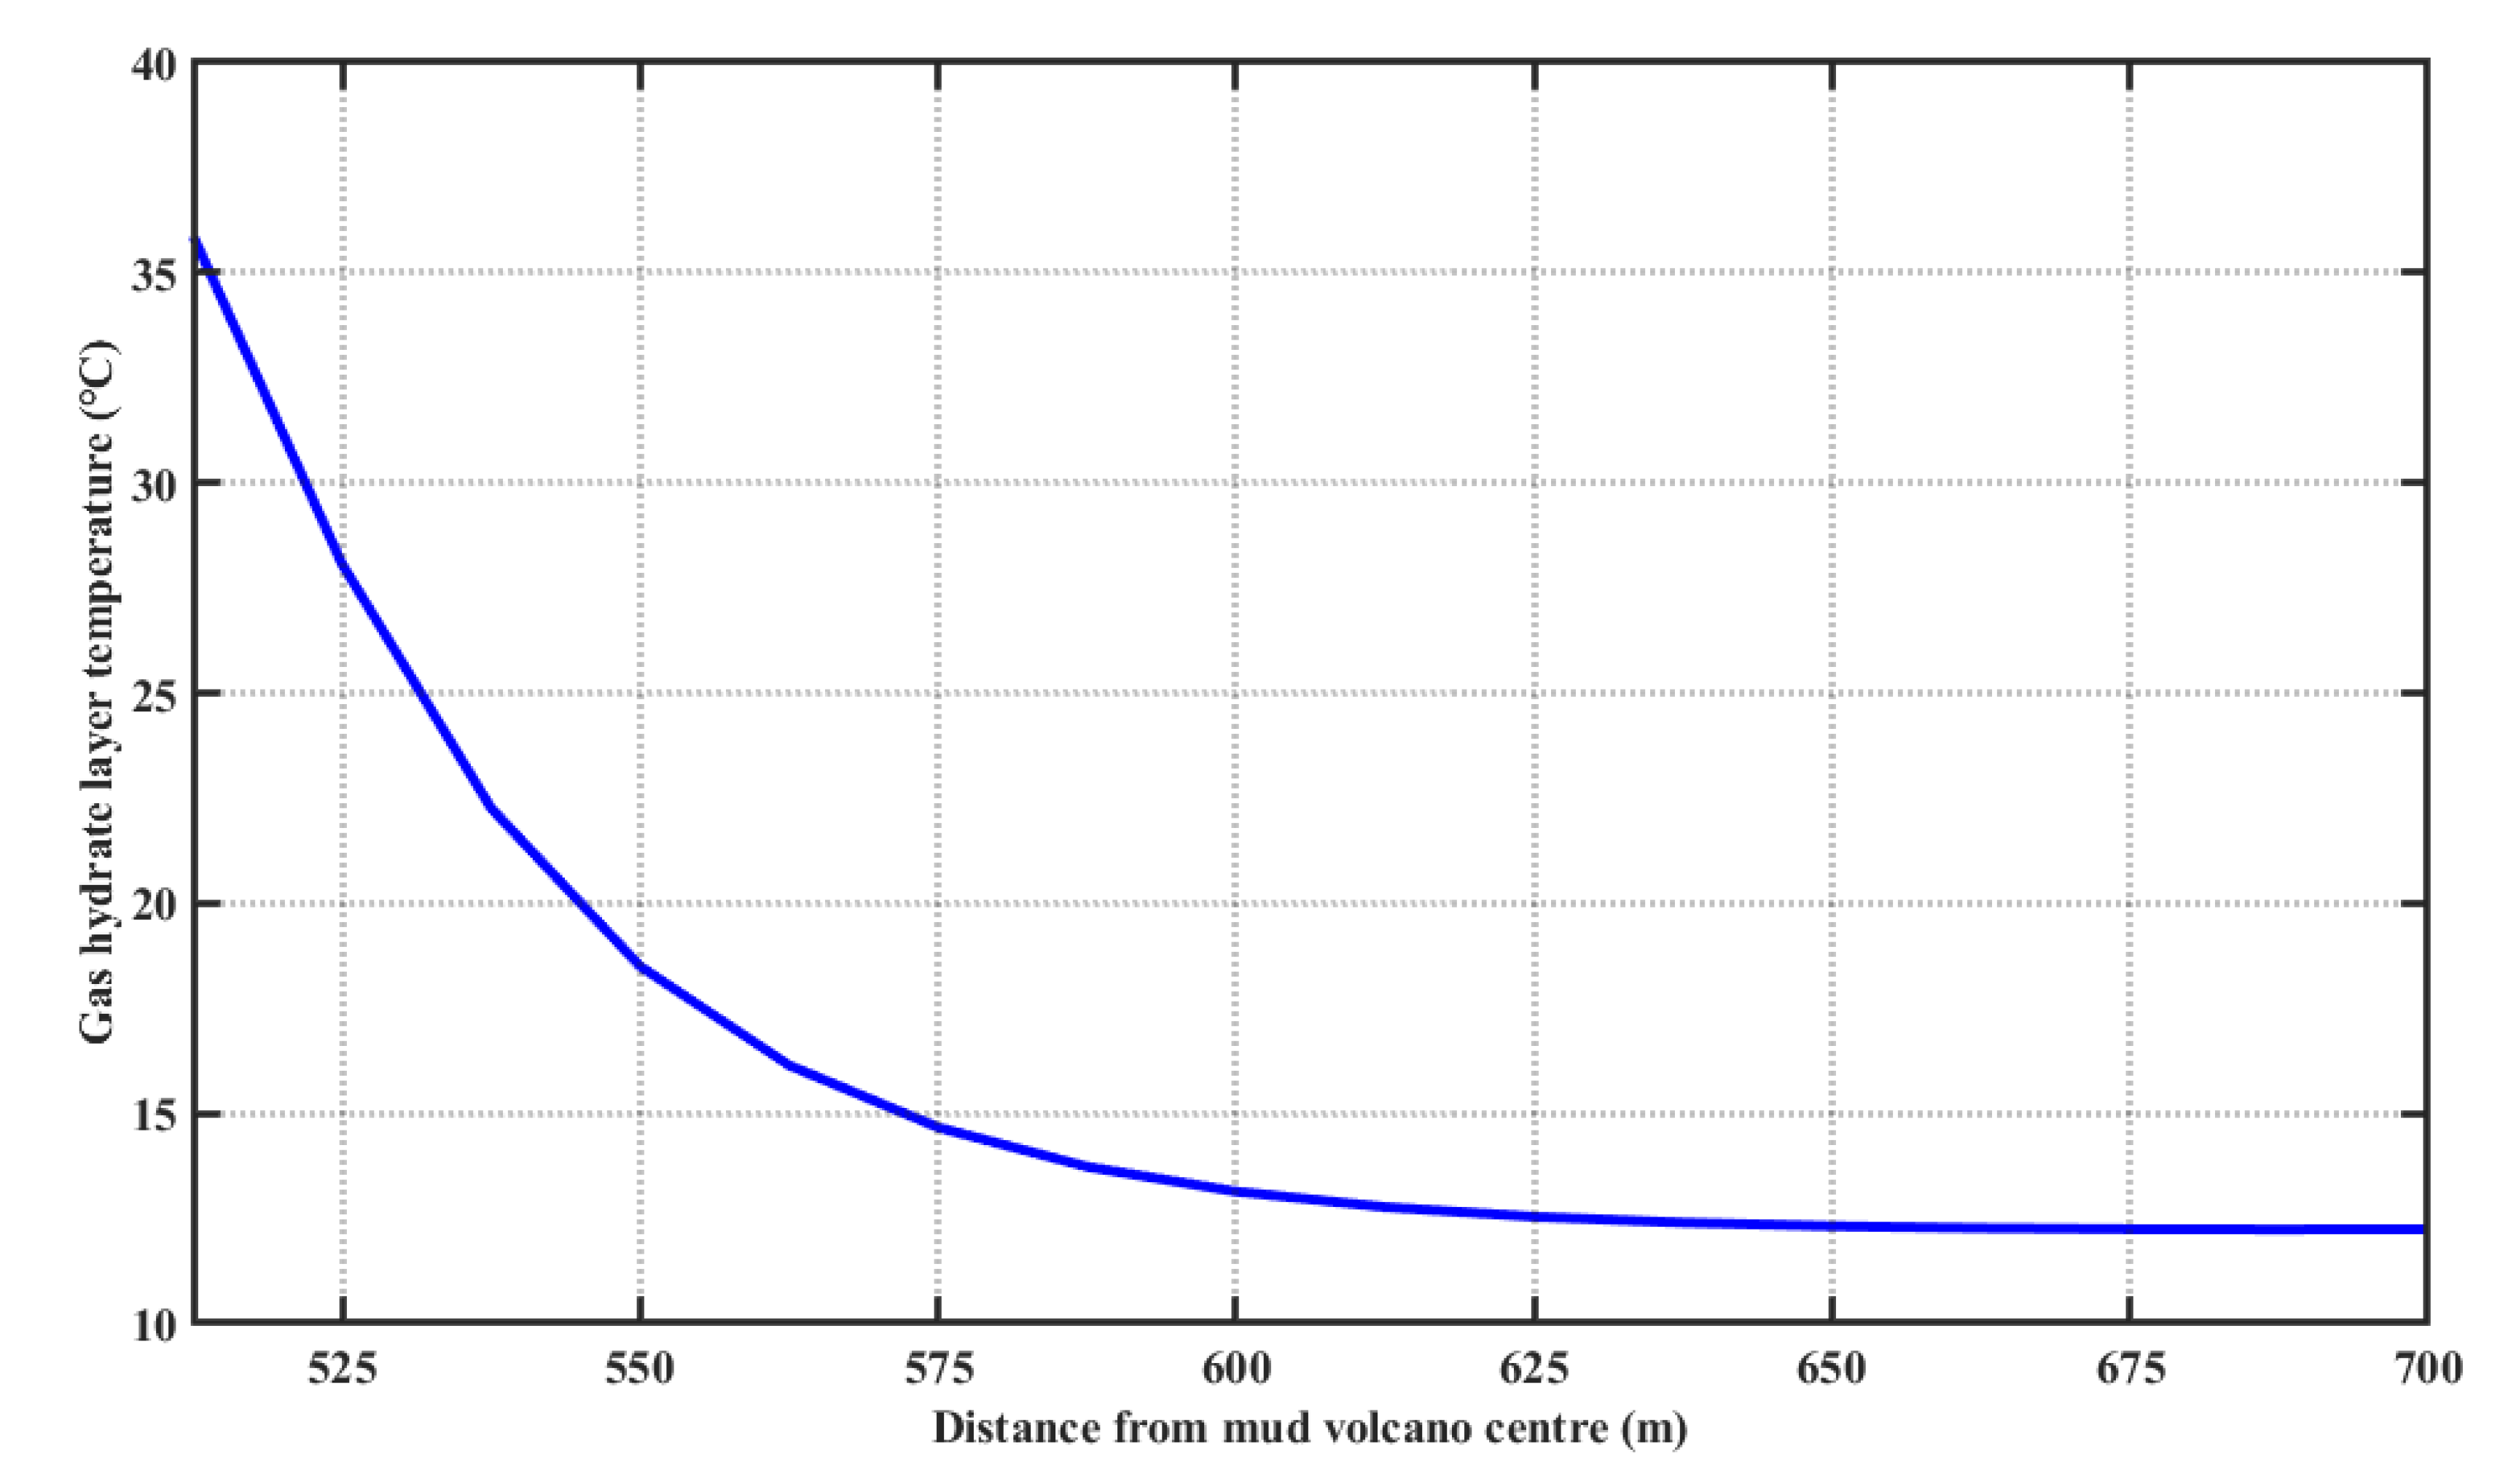
4.2. Temperature Variation of Gas Hydrate Occurrence Layer

The thermal fluid in the mud volcano conduit acts as a heat source, and the gas hydrate occurrence depth is 140 to 220 mbsf. Combining the gas hydrate layer physical parameters in Table 1 and thermodynamic Equation (21), we simulated the heat conduction effect of the mud volcano thermal fluid on the gas hydrate occurrence layer after invasion in Figure 6. It could be seen from Figure 6 that the thermal conductivity and thermal diffusivity of gas hydrate were larger than those of surrounding strata, so the thermal fluid in the mud volcano conduit had a greater influence on the thermal effect of the gas hydrate layer and the influence range was longer.
The heat transfer effect and temperature distribution curve of thermal fluid on the gas hydrate occurrence layer is shown in Figure 7. With upwelling warm fluid, the temperature of the thermal fluid at the bottom of the gas hydrate layer in the mud volcanic conduit was 35.87 °C. The temperature decreased to 13.14 °C at 602 m and 12.23 °C at 700 m away from the mud volcano center at the same depth. Beyond 700 m, the temperature approached 12.20 °C. The simulation results indicated an annular temperature distribution at the gas hydrate layer with the mud volcano center as the axis. This corroborated with the temperature distribution of the surface layer of the mud volcano and was consistent with previous conclusions [11].

5. Discussion

5.1. Temperature Anomalies in the Mud Volcano Development Area

The global marine survey found that mud volcanoes and other fluid seepage pathways generally have thermal anomalies. A temperature rise of sedimentary stratum in the sea is obviously directly related to fluid migration pathways, such as gas chimneys, mud volcanoes and mud diapirs. Detailed heat flow investigations have been carried out on the seepage structures in the deep-sea area of the Gulf of Mexico, the Black Sea, the Barbados trench, the Norwegian Sea and the Costa Rican island-arc. The results showed that fluid seepage conduits were often accompanied by increased heat flow and temperature. Mud volcanoes and mud diapir activities resulted in significantly enhanced heat flow [43]. Significant enhanced heat flow was also observed in the mud volcanoes of the Håkon Mosby development area in the SW Barents Sea. The background geothermal gradient of the mud volcano surrounding strata was significantly higher than the background geothermal gradient value of the non-seepage tectonic development area [8].
Three voyages, the ARK-XIX/3b, AWI-ROV and VICKING submarine heat flow surveys, and gas hydrate research drilling were conducted in the Håkon Mosby Mud Volcano occurrence area in the SW Barents Sea in 2003, 2005 and 2006 [8,11,12,15]. The results indicated that: (1) The temperature anomaly was obviously concentrated in the geometric center of the mud volcano. (2) There was a significant change of temperature gradient at the seafloor near the mud volcano. It equaled 46 °C/m at the conduit of the mud volcano, and reduced to 0.042 °C/m at 3.5 km away from the conduit [8]. The results showed that the temperature in the mud volcano conduit was obviously higher than that in the surrounding sediments. Temperature anomalies were mainly concentrated in the geometric center of the mud volcano. At the same depth, the closer to the mud volcano vent, the higher the temperature. The thermal anomaly amplitude and influence range of mud volcanoes are different in different regions, and their relationship with the development characteristics and geological background of mud volcanoes needs further study. However, it is certain that the characteristics of thermal anomalies in mud volcano development areas can provide indicators for searching and measuring mud volcanoes in the future.
The high fluid velocity in the mud volcano area results in high heat flux and generates the thermal anomalies. The fluid flow velocity in the global seepage conduits spans several orders of magnitude. The fluid velocity within and near the Håkon Mosby and other active mud volcanoes or mud diapir structures was significantly higher than the background value. The vertical flow velocity decreased rapidly with the increase of the lateral distance from the mud volcano vent [12,44].
When the deep thermal fluid flows upward along seepage pathways, such as a mud volcano, in a vertical direction, heat is rapidly transferred upward mainly by heat convection. The heat dissipation and temperature changes when deep thermal fluid flows to the seafloor are closely related to the temperature difference between the flowing fluid and the lateral surface. In the lateral direction, since lateral fluid flow are not obvious, the temperature in the periphery of the mud volcanic conduit is mainly elevated by heat conduction from the conduit. Therefore, the temperature anomaly in global mud volcano development areas is caused by the deep thermal hydrocarbon-rich fluid transferring its heat to the mud volcanic peripheral sediments by heat conduction during ascension along the migration pathway, resulting in the obvious increase of surrounding sediment temperature. The longitudinal is mainly manifested as heat convection, and the lateral is mainly manifested as heat conduction.
In summary, this study believes that mud volcano fluid activity causes thermal anomalies in surrounding strata, inhibiting the accumulation of gas hydrate. It can even lead to the decomposition of natural gas hydrate in local areas, which is also the general view of relevant researchers [45]. However, quantitative study of mud volcano thermal evolution and its influence on gas hydrate occurrence is relatively limited, so it is difficult to effectively reveal gas hydrate occurrence in mud volcano development areas and guide the evaluation and exploration of gas hydrate resources. In view of this, we carried out the numerical simulation of the heat transfer during the mud volcanic thermal fluid flow to the seafloor. The fluid seepage and thermodynamic changes of this process were analyzed. In our model, the mud volcanic fluid originated from the Late Pliocene stratum of approximately 3.1 km depth [28]. The initial temperature of the stratum fluid was 185 °C [10]. During the mud volcano thermal fluid flowed to the seafloor, the fluid temperature was continuously reduced by heat dissipation. The simulation indicated that the thermal fluid at the seafloor in the conduit rapidly decreased to 22.62 °C in the process of mud volcano activity. However, it was still very warm compared to the sea floor and the surrounding strata. After the activity stopped, the temperature of the fluid continued to drop because there was still a large temperature difference between the fluid and the surrounding formation, and the fluid transferred heat to the surrounding sediments through heat conduction, increasing the temperature of the surrounding formation. In short, the change of temperature field caused by mud volcano made the geological background and dynamic conditions of the region more complicated.

5.2. Influence of a Mud Volcano Fluid Thermal Anomaly on Gas Hydrate Distribution

Current studies generally believe that the hot fluid activity of mud volcano leads to the excessive temperature of mud volcano vents, which can lead to the decomposition of gas hydrate in some regions [13]. In addition, the formation of hydrate blocks the upward migration of gas in mud volcano to a certain extent. However, it is difficult to form hydrate in a mud volcano channel because of its fast flow rate and high temperature. This allows the gas to migrate up and sideways, forming hydrates in shallower layers. However, these understandings only remain at the stage of qualitative description and speculation of conceptual models. Due to the lack of quantitative research on the thermodynamic evolution of mud volcano fluid, it is difficult to reveal the occurrence state of gas hydrate in the mud volcano development area effectively.
By establishing the thermodynamic model of mud volcano fluid and calculating the heat dissipation during fluid flow, the heat conduction effect of thermal fluid intrusion on the gas hydrate layer can be simulated, and the abnormal temperature distribution of the hydrated layer is revealed to be caused by the thermal fluid activity. The thermal simulation results showed that the mud volcano conduit acted as a heat source (linear source), and the thermal fluid transferred heat laterally to the strata around the mud volcano conduit through heat conduction. When mud volcano was active, the temperature of gas hydrate layer in mud volcano conduit was 35.87 °C, while the surrounding background temperature was about 12.20 °C. This temperature difference produced strong heat conduction. In the gas hydrate occurrence layer, because the thermal conductivity of gas hydrate was much higher than that of other sedimentary sediments, the heat transfer effect of thermal fluid was obviously enhanced and the temperature distribution curve was obviously convex to both sides (Figure 5 and Figure 6). This indicated that obtaining accurate strata information, such as the thermal conductivity coefficient of regional gas hydrate, was the key to accurately and quantitatively evaluating the thermal effect of mud volcano fluid.
Through numerical simulation, the distribution range of temperature anomalies caused by mud volcano hot fluid can be predicted, and the gas hydrate occurrence zone in and near mud volcano can be delineated. This is of guiding significance to the evaluation and exploration of gas hydrate resources in mud volcano development area. The shape of the thermal effect of the mud volcano on the gas hydrate layer was a cylinder centered on the mud volcano, with a wide bottom and a narrow top. Therefore, the distribution of the gas hydrate was opposite to its shape. The gas hydrate layer gradually thickened as it moved away from the center of the mud volcano (Figure 8). In terms of data, the temperature of the hydrated strata decreased with the distance from the crater after mud volcano activity, and the temperature dropped fastest within 575 m. The temperature at 604 m away from the mud volcano vent was 13.14 °C, and the critical occurrence temperature of gas hydrate in this area was 13.20 °C. This meant that hydrogen deposits, vented at about 604 m away from the mud volcano, decomposed and could not form gas hydrate in these areas. Therefore, according to the critical temperature of gas hydrate accumulation, the thermal structure of mud volcano fluid simulation can determine the occurrence range of gas hydrate. The temperature of the mud volcano gradually decreases from the center to the surroundings. Outside the temperature line of gas hydrate formation, it is beneficial for gas hydrate enrichment. After obtaining the simulated temperature result under the thermal effect of the mud volcano, combining regional water depth, formation pressure and other information, the GHSZ of natural gas hydrate in this region can be calculated, and the accurate distribution depth of gas hydrate in mud volcano region can be obtained. Therefore, the simulation results in this study can effectively reveal the distribution and resource potential of gas hydrate in mud volcano development areas from the perspective of thermodynamics and provide deep data support for the calculation of regional GHSZ.
In 1999 and 2007, several voyages were carried out in the HMMV area in the SW Barents Sea. The results of the gas hydrate drilling indicated that gas hydrates were distributed in an annular shape on the periphery of the mud volcano; gas hydrate were not drilled in the mud volcano vents but were found in several sites in the hummocky outer zone [13,33]. The high temperature in the conduit makes gas hydrate unstable, resulting in a situation where no gas hydrate can form. The drilling results confirm our conclusions.
As an effective fluid seepage pathway, submarine mud volcano can provide sufficient gas for the formation of shallow gas hydrates and is an important symbol for searching for gas hydrates [3]. On the other hand, the high temperatures caused by mud volcano fluids also inhibit gas hydrate accumulation. The upwelling hot fluid in the mud volcano brings a great deal of heat to the shallow layer of gas hydration products by thermal convection. In addition, it raises the temperature of the surrounding gas hydrated layer through heat conduction. The rising temperature pushes the bottom of the GHSZ toward the ocean floor. It can also break down gas hydrates in surrounding sediments that formed before mud volcanoes formed and release methane and other hydrocarbon gases into the seafloor. Therefore, while focusing on the thermal effect of mud volcanoes and other fluid pathways on gas hydrate, special attention should be paid to the destruction, remigration and reaccumulation of gas hydrate under thermal anomaly conditions, as well as the gas hydrate accumulation dynamics related to mud volcanoes.
The mud volcano model used in this study is a stable state, but in reality, mud volcano activity is periodic, with alternating active and dormant periods [46]. At present, the research foundation of gas hydrate accumulation dynamics related to mud volcanoes is still weak. Based on the existing research basis, it is concluded that from the end of mud volcano eruption period to the quiescent period, the migration of thermal fluid weakens and the deep hydrocarbon gas (such as methane) continues to migrate from the deep to the GHSZ through the mud volcano conduit. When the temperature in and near a mud volcano drops to a stable value, gas hydrates that form from hydrocarbon gases remain in the sediment. The thickness of the hydrated strata increases gradually. Gas hydrates are distributed in a circular pattern in sediments around mud volcano seepage pathways. During the active phase, these gas hydrates may again be decomposed by rising temperatures. Thus, mud volcano activity dynamically affects gas hydrate accumulation in and around mud volcanoes. In addition, the periodic thermal activity of mud volcanoes inevitably leads to the change of the thickness of the GHSZ. In this situation, the formation of double BSRs and the origin and whereabouts of the increased and decreased hydrocarbon gases and other geological issues need to be further studied.
Mud volcano eruptions are short-term events, and mud volcano models change repeatedly over long time scales. At present, the Håkon Mosby Volcano is in an active stage, and our simulated data and measured data are also based on the active mud volcano. Therefore, in order to further validate our simulated results, predict gas hydrate resource distribution area and reveal the gas hydrate occurrence zone complex cyclical change, we should undertake a long-time actual observation after the thermal simulation and build a mud volcano spatio-temporal three-dimensional temperature field model by using the method of “line and plane combination”.

6. Conclusions

In the process of mud volcano hot fluid migrating upward to the seafloor, the temperature of the mud volcano fluid decreases with the increase of temperature difference between the flow fluid and the side. Taking the Håkon Mosby Volcano as an example, a mud volcano thermal simulation model was established in this paper to calculate the thermal fluid temperature changes at different depths of the mud volcano conduit and simulate the influence of the mud volcano thermal fluid on the surrounding sediments. The simulation results showed that the mud volcanic conduit was taken as a heat source, and the thermal fluid laterally transferred its heat to the peripheral strata in the form of a line source. Because the thermal conductivity is much higher than that of the sedimentary layer, the heat transfer of the hot fluid to the gas hydrate layer is obviously enhanced, and the temperature distribution curve obviously protrudes on both sides. This process increases the temperature field of the gas hydrate reservoir in a short time, causes abnormal heat flow, changes the phase state of gas hydrate and even decomposes part of gas hydrate deposits formed in the early stage. The thermodynamic evolution of mud volcano fluid and its influence on gas hydrate formation are quantitatively analyzed and studied. Based on the simulation of mud volcano fluid flow characteristics and heat transfer, the complex evolution framework of fluid temperature field thermal structure was established. This study provides a thermodynamic theoretical basis for gas hydrate accumulation research, exploration and exploitation in a fluid seepage tectonic environment.

Author Contributions

Z.W.: Writing—original draft, Methodology, Data analysis; J.L. (Junsheng Luo): Writing—original draft, Data analysis; X.Y.: Writing—original draft, Methodology; W.Z.: Main idea, Methodology, Writing—review and editing; J.L. (Jinqiang Liang): Methodology, Project administration; L.Z.: Editing and rechecking the codes, Helping MATLAB code debugging; Y.S.: Supervision, Resimulation of the results. All authors have read and agreed to the published version of the manuscript.

Funding

This work was supported by the Guangdong Province Marine Economic Development (Six Major Marine Industries) Special Fund Project (No. [2021] No. 58), National Nature Science Foundation of China (No. 42076054), Innovation Group Project of Southern Marine Science and Engineering Guangdong Laboratory (Zhuhai) (No. 311021004), National Key R&D Program of China (2018YFC0310000).

Institutional Review Board Statement

Not applicable.

Informed Consent Statement

Not applicable.

Data Availability Statement

The codes in this article are permitted for noncommercial or academic use, sharing, adaptation, distribution, and reproduction, and credit to the original authors is appreciated.

Acknowledgments

Our deepest gratitude goes to the anonymous reviewers and the editors for their careful work and thoughtful suggestions that have helped improve this paper substantially.

Conflicts of Interest

The authors declare that they have no known competing financial interests or personal relationships that could have appeared to influence the work reported in this paper.

References

  1. Kopf, A.J. Significance of mud volcanism. Rev. Geophys. 2002, 40, 2-1–2-52. [Google Scholar] [CrossRef] [Green Version]
  2. Milkov, A.V. Worldwide distribution of submarine mud volcanoes and associated gas hydrates. Mar. Geol. 2000, 167, 29–42. [Google Scholar] [CrossRef]
  3. Dimitrov, L.I. Mud volcanoes-the most important pathway for degassing deeply buried sediments. Earth-Sci. Rev. 2002, 59, 49–76. [Google Scholar] [CrossRef]
  4. Dimitrov, L.I. Mud volcanoes—A significant source of atmospheric methane. Geo-Mar. Lett. 2003, 23, 155–161. [Google Scholar] [CrossRef]
  5. Wing, B. Archaean biogeochemistry: Unexpectedly abiotic. Nat. Geosci. 2012, 5, 598–599. [Google Scholar] [CrossRef]
  6. Wan, Z.; Xu, X.; Wang, X.; Xia, B.; Sun, Y. Geothermal analysis of boreholes in the Shenhu gas hydrate drilling area, northern South China Sea: Influence of mud diapirs on hydrate occurrence. J. Pet. Sci. Eng. 2017, 158, 424–432. [Google Scholar] [CrossRef]
  7. Poort, J.; Khlystov, O.M.; Naudts, L.; Duchkov, A.D.; Shoji, H.; Nishio, S.; De Batist, M.; Hachikubo, A.; Kida, M.; Minami, H. Thermal anomalies associated with shallow gas hydrates in the k-2 mud volcano, lake baikal. Geo-Mar. Lett. 2012, 32, 407–417. [Google Scholar] [CrossRef]
  8. Feseker, T.; Foucher, J.P.; Harmegnies, F. Fluid flow or mud eruptions? sediment temperature distributions on håkon mosby mud volcano, sw barents sea slope. Mar. Geol. 2008, 247, 194–207. [Google Scholar] [CrossRef]
  9. Vogt, P.; Cherkashev, G.; Ginsburg, G.; Ivanov, G.; Milkov, A.; Crane, K.; Sundvor, A.; Pimenov, N.; Egorov, A. Haakon mosby mud volcano provides unusual example of venting. EOS Trans. Am. Geophys. Union 1997, 78, 549–557. [Google Scholar] [CrossRef] [Green Version]
  10. Eldholm, O.; Sundvor, E.; Vogt, P.; Hjelstuen, B.; Crane, K.; Nilsen, A.; Gladczenko, T. Sw barents sea continental margin heat flow and håkon mosby mud volcano. Geo-Mar. Lett. 1999, 19, 29–37. [Google Scholar] [CrossRef]
  11. Kaul, N.; Foucher, J.P.; Heesemann, M. Estimating mud expulsion rates from temperature measurements on håkon mosby mud volcano, sw barents sea. Mar. Geol. 2006, 229, 1–14. [Google Scholar] [CrossRef] [Green Version]
  12. De Beer, D.; Sauter, E.; Niemann, H.; Kaul, N.; Foucher, J.P.; Witte, U.; Schlüter, M.; Boetius, A. In situ activity in surface sediments of the håkon mosby mud volcano. Limnol. Oceanogr. 2006, 51, 1315–1331. [Google Scholar] [CrossRef]
  13. Ginsburg, G.; Milkov, A.; Soloviev, V.; Egorov, A.; Cherkashev, G.; Vogt, P.; Crane, K.; Lorenson, T.; Khutorskoy, M. Gas hydrate accumulation at the haakon mosby mud volcano. Geo-Mar. Lett. 1999, 19, 57–67. [Google Scholar] [CrossRef]
  14. Milkov, A.V.; Vogt, P.R.; Crane, K.; Lein, A.Y.; Sassen, R.; Cherkashev, G.A. Geological, geochemical, and microbial processes at the hydrate-bearing håkon mosby mud volcano: A review. Chem. Geol. 2004, 205, 347–366. [Google Scholar] [CrossRef]
  15. Pape, T.; Feseker, T.; Kasten, S.; Fischer, D.; Bohrmann, G. Distribution and abundance of gas hydrates in near-surface deposits of the håkon mosby mud volcano, sw barents sea. Geochem. Geophys. Geosyst. 2011, 12, 1–22. [Google Scholar] [CrossRef] [Green Version]
  16. Glørstad-Clark, E.; Faleide, J.I.; Lundschien, B.A.; Nystuen, J.P. Triassic seismic sequence stratigraphy and paleogeography of the western barents sea area. Mar. Pet. Geol. 2010, 27, 1448–1475. [Google Scholar] [CrossRef]
  17. Volkov, D.L.; Kubryakov, A.A.; Lumpkin, R. Formation and variability of the lofoten basin vortex in a high-resolution ocean model. Deep Sea Res. Part I Oceanogr. Res. Pap. 2015, 105, 142–157. [Google Scholar] [CrossRef]
  18. Faleide, J.I.; Gudlaugsson, S.T.; Jacquart, G. Evolution of the western Barents Sea. Mar. Pet. Geol. 1984, 1, 123–150. [Google Scholar] [CrossRef]
  19. Faleide, J.; Myhre, A.; Eldholm, O. Early tertiary volcanism at the western Barents Sea margin. Geol. Soc. Lond. Spec. Publ. 1988, 39, 135–146. [Google Scholar] [CrossRef]
  20. Faleide, J.; Gudlaugsson, S.; Eldholm, O.; Myhre, A.; Jackson, H. Deep seismic transects across the sheared western barents sea-svalbard continental margin. Tectonophysics 1991, 189, 73–89. [Google Scholar] [CrossRef]
  21. Johansen, S.; Ostisty, B.; Fedorovsky, Y.; Martirosjan, V.; Christensen, O.B.; Cheredeev, S.; Ignatenko, E.; Margulis, L. Hydrocarbon potential in the barents sea region: Play distribution and potential. In Norwegian Petroleum Society Special Publications; Elsevier: Amsterdam, The Netherlands, 1993; Volume 2, pp. 273–320. [Google Scholar]
  22. Perez-Garcia, C.; Safronova, P.; Mienert, J.; Berndt, C.; Andreassen, K. Extensional rise and fall of a salt diapir in the sørvestsnaget basin, sw barents sea. Mar. Pet. Geol. 2013, 46, 129–143. [Google Scholar] [CrossRef]
  23. Faleide, J.I.; Vågnes, E.; Gudlaugsson, S.T. Late mesozoic-cenozoic evolution of the south-western barents sea in a regional rift-shear tectonic setting. Mar. Pet. Geol. 1993, 10, 186–214. [Google Scholar] [CrossRef]
  24. Blaich, O.; Tsikalas, F.; Faleide, J. New insights into the tectono-stratigraphic evolution of the southern stappen high and its transition to bjørnøya basin, sw Barents Sea. Mar. Pet. Geol. 2017, 85, 89–105. [Google Scholar] [CrossRef]
  25. Ryseth, A.; Augustson, J.H.; Charnock, M.; Haugerud, O.; Knutsen, S.M.; Midbøe, P.S.; Opsal, J.G.; Sundsbø, G. Cenozoic stratigraphy and evolution of the sørvestsnaget basin, southwestern Barents Sea. Nor. J. Geol./Nor. Geol. Foren. 2003, 83, 107–130. [Google Scholar]
  26. Eldholm, O.; Faleide, J.I.; Myhre, A.M. Continent-ocean transition at the western Barents Sea/Svalbard continental margin. Geology 1987, 15, 1118–1122. [Google Scholar] [CrossRef]
  27. Solheim, A.; Milliman, J.D.; Elverhøi, A. Sediment distribution and sea-floor morphology of storbanken: Implications for the glacial history of the northern Barents Sea. Can. J. Earth Sci. 1988, 25, 547–556. [Google Scholar] [CrossRef]
  28. Hjelstuen, B.; Eldholm, O.; Faleide, J.; Vogt, P. Regional setting of håkon mosby mud volcano, sw Barents Sea margin. Geo-Mar. Lett. 1999, 19, 22–28. [Google Scholar] [CrossRef]
  29. Andreassen, K.; Nilssen, E.G.; Ødegaard, C.M. Analysis of shallow gas and fluid migration within the plio-pleistocene sedimentary succession of the sw Barents Sea continental margin using 3d seismic data. Geo-Mar. Lett. 2007, 27, 155–171. [Google Scholar] [CrossRef]
  30. Faleide, J.I.; Solheim, A.; Fiedler, A.; Hjelstuen, B.O.; Andersen, E.S.; Vanneste, K. Late cenozoic evolution of the western barents sea- svalbard continental margin. Glob. Planet. Chang. 1996, 12, 53–74. [Google Scholar] [CrossRef]
  31. Gudlaugsson, S.; Faleide, J.; Johansen, S.; Breivik, A. Late palaeozoic structural development of the south-western Barents Sea. Mar. Pet. Geol. 1998, 15, 73–102. [Google Scholar] [CrossRef]
  32. Fiedler, A.; Faleide, J.I. Cenozoic sedimentation along the southwestern Barents Sea margin in relation to uplift and erosion of the shelf. Glob. Planet. Chang. 1996, 12, 75–93. [Google Scholar] [CrossRef]
  33. Jerosch, K.; Shlüter, M.; Foucher, J.P.; Allais, A.G.; Klages, M.; Edy, C. Spatial distribution of mud flows, chemoautotrophic communities, and biogeochemical habitats at Håkon Mosby mud volcano. Mar. Geol. 2007, 243, 1–17. [Google Scholar] [CrossRef] [Green Version]
  34. Foucher, J.P.; Westbrook, G.K.; Boetius, A.; Ceramicola, S.; Dupré, S.; Mascle, J.; Mienert, J.; Pfannkuche, O.; Pierre, C.; Praeg, D. Structure and drivers of cold seep ecosystems. Oceanography 2009, 22, 92–109. [Google Scholar] [CrossRef]
  35. Niemann, H.; Lösekann, T.; De Beer, D.; Elvert, M.; Nadalig, T.; Knittel, K.; Amann, R.; Sauter, E.J.; Schlüter, M.; Klages, M.; et al. Novel microbial communities of the Håkon Mosby mud volcano and their role as a methane sink. Nature 2006, 443, 854. [Google Scholar] [CrossRef]
  36. Vogt, P.; Gardner, J.; Crane, K. The Norwegian–Barents–Svalbard (nbs) continental margin: Introducing a natural laboratory of mass wasting, hydrates, and ascent of sediment, pore water, and methane. Geo-Mar. Lett. 1999, 19, 2–21. [Google Scholar] [CrossRef]
  37. Perez-Garcia, C.; Feseker, T.; Mienert, J.; Berndt, C. The håkon mosby mud volcano: 330 000 years of focused fluid flow activity at the sw barents sea slope. Mar. Geol. 2009, 262, 105–115. [Google Scholar] [CrossRef]
  38. Shulgin, A.; Mjelde, R.; Faleide, J.I.; Høy, T.; Flueh, E.; Thybo, H. The crustal structure in the transition zone between the western and eastern Barents Sea. Geophys. J. Int. 2018, 214, 315–330. [Google Scholar] [CrossRef] [Green Version]
  39. Dickens, G.R.; Quinby-Hunt, M.S. Methane hydrate stability in seawater. Geophys. Res. Lett. 2013, 21, 2115–2118. [Google Scholar] [CrossRef]
  40. Jiji, L.M. Heat Convection; Springer: Berlin/Heidelberg, Germany, 2006. [Google Scholar]
  41. Haese, R.R.; Meile, C.; Cappellen, P.V.; Lange, G. Carbon geochemistry of cold seeps: Methane fluxes and transformation in sediments from kazan mud volcano, eastern Mediterranean Sea. Earth Planet. Sci. Lett. 2003, 212, 361–375. [Google Scholar] [CrossRef]
  42. Recktenwald, G.W. Finite-difference approximations to the heat equation. Mech. Eng. 2004, 10, 1–27. [Google Scholar]
  43. Henry, P.; Le Pichon, X.; Lallemant, S.; Lance, S.; Martin, J.B.; Foucher, J.P.; Fiala-Médioni, A.; Rostek, F.; Guilhaumou, N.; Pranal, V. Fluid flow in and around a mud volcano field seaward of the Barbados accretionary wedge: Results from Manon cruise. J. Geophys. Res. Solid Earth 1996, 101, 20297–20323. [Google Scholar] [CrossRef]
  44. Wallmann, K.; Drews, M.; Aloisi, G.; Bohrmann, G. Methane discharge into the black sea and the global ocean via fluid flow through submarine mud volcanoes. Earth Planet. Sci. Lett. 2006, 248, 545–560. [Google Scholar] [CrossRef]
  45. Smith, A.J.; Flemings, P.B.; Liu, X.; Darnell, K. The evolution of methane vents that pierce the hydrate stability zone in the world’s oceans. J. Geophys. Res. Solid Earth 2014, 119, 6337–6356. [Google Scholar] [CrossRef]
  46. Anna, Z.; Stephen, A. Modelling eruption cycles and decay of mud volcanoes. Mar. Pet. Geol. 2009, 26, 1879–1887. [Google Scholar]
Figure 1. (a) Location map of the Håkon Mosby Mud Volcano (HMMV), located on a slide scar of the Bear Island sedimentary fan in the southwestern Barents Sea. (b) Picture of the regional setting; the yellow rectangle indicates the location of (a), and the red star is HMMV. (c) Interpretation and sequence stratigraphic division of the regional MCS profile that crosses HMMV; the location of the profile is the white line shown in (a) (modified from [17,28]). R7-R1: Plio–Pleistocene sequence boundary; G0: pre-glacial unit; GI–GIII: glacial units; GI, GII and GIII correspond to thicknesses 600 m, 1800 m and 700 m, respectively, separated by the seismic reflection events of R7, R5 and R1; COB: continental–ocean boundary; A6, A7, A13: magnetic anomaly belt.
Jmse 10 00832 g001
Figure 2. Geological model of the Håkon Mosby Mud Volcano (HMMV). The fluid storage tank is located in the fifth layer. The mud volcano can be traced to a depth of 3.1 km below the seafloor. Biosiliceous oozes originated from pre-glacial period (layer 5), which flowed upward and erupted from the seafloor forming the mud volcano structure.
Jmse 10 00832 g002
Figure 3. Schematic illustration of temperature changes in the mud volcanic channel.
Jmse 10 00832 g003
Figure 4. Temperature variation curve of the thermal fluid at different depth in the mud volcanic channel, where distance (z) = 0 is where the fluid flow originates. Here, the initial temperature of the mud volcano is 185 °C and the channel width is 1000 m. Other parameters are listed in Table 2.
Jmse 10 00832 g004
Figure 5. Based on the physical parameters of the mud volcano strata, we simulated the heat consumption and temperature variation characteristics of the mud volcano fluid migration channel after an eruption. The seafloor is set to z = 3.1 km.
Jmse 10 00832 g005
Figure 6. Simulation results of mud volcano thermal fluid invading the hydrate occurrence layers and its influence on the hydrate layers’ temperature field. Setting 140 to 220 meters as the hydrate occurrence layer, the simulation results indicated that the heat conduction effect of the thermal fluid on the hydrate layers was significantly enhanced, and the temperature distribution curve is noticeably convex towards both sides.
Jmse 10 00832 g006
Figure 7. Variation curve of the hydrate layers’ temperature with horizontal distance from a mud volcano vent (temperature–distance curve). The thermal conductivity of hydrate layers and the related data are listed in Table 1.
Jmse 10 00832 g007
Figure 8. Schematic diagram of the hydrate occurrence pattern in the mud volcano development area. The model represents the distribution rule of hydrates in the shallow layer around the mud volcano after the mud volcano eruption. The temperature contour represents the bottom of the hydrate stability zone, and the arrow represents the direction of heat flow.
Jmse 10 00832 g008
Table 1. Geophysical parameters of the HMMV model. Based on the results of the submarine heat flow survey and hydrate drilling in the HMMV conducted by the researchers, the physics parameters of each layer in the mud volcano geological model were established. G0: pre-glacial unit; GI-GIII: glacial units; GI, GII, GIII-I and GIII-II, correspond to thicknesses 600 m, 1800 m, 480 m and 140 m, respectively (the sources of the petrophysical, thermodynamic, sedimentary and hydrate parameters are from [8,10,11,12,15,37]).
LayerLayer TypeRock TypeThicknessThermal ConductivityDensityHeat CapacityThermal Diffusivity
mW/(m·k)kg/m3J/(kg·K)m2/s
L1Sea waterWater12500.56103042201.29 × 10−7
L1GIII-IISandy glacial muds1401.5321008508.57 × 10−7
L1HydrateHydrate802.2090020401.20 × 10−6
L2GIII-ISandy glacial muds4801.5321008508.57 × 10−7
L3GIISandy glacial muds18001.5321008508.57 × 10−7
L4GISandy glacial muds6001.5321008508.57 × 10−7
L5G0Biosiliceous oozes32002.07251011806.99 × 10−7
Table 2. Input parameters value of heat convection equation used for calculating the temperature variation of the thermal fluid at different depth in the mud volcanic channel (the sources of the numerical simulate data are from [8,11,12,15,37]).
ParameterValueUnit
cspecific heat capacity of mud volcano fluid1040J/(kg·k)
dchannel diameter1000m
rchannel radius500m
ggeothermal gradient0.06°C/m
kthermal conductivity of fluid1.2W/(m·k)
h average   thermal   transfer   coefficient ,   h = 3.657   k / d 4.39 × 10⁻³W/(m2·k)
vfluid flow velocity9.51 × 10−9m/s
ρdensity of fluid1400kg/m3
mmass flow rate, m = πr2ρv10.45kg/s
pchannel perimeter, p = πd3140m
T 0 mean inlet temperature of the mud volcano185°C
zperpendicular distance from mud volcano original layervariablem
T(z) temperature at z of the channel when the lateral surface temperature of channel changes with depthvariable°C
Tw(z) lateral   surface   temperature   at   z   of   the   mud   volcanic   channel ,   changes   with   depth ,   T w ( 0 ) = T 0 gz variable°C
Te(z) temperature at z of the channel when the lateral surface temperature of channel did not change with depthvariable°C
Tslateral surface temperature of the channel when it did not change with depth, a constantconstant°C
Table 3. Parameters of heat conduction equation used for calculating mud volcano thermal fluid effects on surrounding sediment.
ParameterUnit
αthermal diffusivity coefficient of each layerm2/s
ρdensity of each layerkg/m3
cpspecific heat capacity of each layerJ/(kg·k)
kxthermal conductivity in x direction of each layerW/(m·k)
kzthermal conductivity in z direction of each layerW/(m·k)
tthe size of a time step/
xnode spacing in x and z spatial directions/
∆znode spacing in x and z spatial directions/
Table 4. Simulated thermometers of the central and unaffected regions of mud volcanoes at different depths.
Depth(m)Simulated Temperatures at the Center of Mud Volcano Channels (°C)Simulated Temperatures of Unaffected
Surrounding Strata (°C)
022.62−0.80
1023.28−0.37
22035.8712.20
100082.5759.00
3000184.30179.00
Publisher’s Note: MDPI stays neutral with regard to jurisdictional claims in published maps and institutional affiliations.

