Article

Feasibility Study of Harnessing Low Wind Speed Turbine as Hybrid Power Source for Offshore Platforms

by
Izleena Md Iqbar
1,2,
Masdi Muhammad
2,
Syed Ihtsham Ul-Haq Gilani
2 and
Frank Adam
3,4,*
1
Facilities of Future, PETRONAS Research Sdn. Bhd., Bangi 43000, Malaysia
2
Mechanical Engineering Department, Universiti Teknologi PETRONAS, Seri Iskandar 32610, Malaysia
3
Chair of Wind Energy Technology, University of Rostock, 18059 Rostock, Germany
4
Department Wind Engineering, GICON—Großmann Ingenieur Consult GmbH, 18069 Rostock, Germany
*
Author to whom correspondence should be addressed.
J. Mar. Sci. Eng. 2022, 10(7), 963; https://doi.org/10.3390/jmse10070963
Submission received: 6 June 2022 / Revised: 3 July 2022 / Accepted: 10 July 2022 / Published: 14 July 2022
(This article belongs to the Topic Marine Renewable Energy)

Abstract

:
In this study, the viability of harnessing wind energy for offshore oil and gas (O&G) platforms as a micro-grid solution in low wind speed regions to power O&G platforms is explored. However, wind, as a renewable energy, is known to be highly variable and is unable to provide standalone power reliably within a micro-grid solution due to the variation of the wind speed at hub height, which subsequently leads to a variation of the power outcome. Here, a hybrid power generation concept is developed in which one gas turbine generator (GTG) is replaced with a floating horizontal axis wind turbine (WT) system. By setting up this system, the reduction of the maintenance costs of the GTGs and the reduction of fuel gas consumption reduces carbon dioxide (CO2) emissions. In addition to this, the fuel gas savings in terms of the business side of such a solution provide a positive revenue impact. In this feasibility study, a technical framework is developed, followed by an economic framework. In the technical framework, wind assessments are performed to obtain the annual energy production for the selected field. Furthermore, an economic framework is established for both conventional and hybrid concepts in two scenarios: greenfield and brownfield, where the incremental net present value (NPV) and levelized cost of energy are calculated. The resultant difference in NPV for hybrid power generation compared to conventional power generation was found to be between 22% and 37%. The levelized cost of energy (LCOE) for WT is USD 165.52/MWh, which is 39% lower than for conventional, gas turbine-only operations. The LCOE for the hybrid approach is lower than for the conventional scenario by 22%. In conclusion, the hybrid micro-grid concept solution can harness wind energy from low wind regions with better economic benefits compared to conventional methods through the proper selection of the WT system, its floating substructure, and efficient micro-grid system for powering oil and gas platforms.

1. Introduction

Most of the regions in Malaysia are low wind speed areas. This is why photovoltaic devices are often used for renewable energy production in different onshore or offshore wind applications. However, there are some business cases that make wind as a renewable energy source more attractive. One of these cases is to power offshore oil and gas (O&G) platforms, as will be described in the following sections.

1.1. Background and Motivation

As the world is progressing towards a zero-carbon economy with strong commitments shown during COP26, where nearly 200 countries agreed to reduce emissions to limit the global temperature rise to 1.5 °C [1], renewable power generation is desirable.
Malaysia is known for low wind speeds as per [2,3], where commercially available wind power systems do not produce significant or economically viable amounts of power as per the current knowledge. However, it is well known that the offshore wind speed is higher and more constant than that of onshore wind [4]. This means that the implementation of offshore wind turbines (WTs) in Malaysia would make more sense than onshore wind turbines. This is especially true if the business case is not based on the financial income tariff (FIT) model or similar. For example, a power-purchase agreement (PPA) could be more attractive for specific industrial sectors, e.g., with an O&G operator, as is the case for the European market or as per the intentions of the Scottish O&G authorities.
Many offshore oil and gas platforms rely on conventional methods using fuel-based generators (for example, gas or diesel) for reliable power generation. This philosophy normally requires two generators running with one on standby, as illustrated in Figure 1. Each generator delivers 50% of the load. The combustion of fuel gas emits CO2, which must be reduced to zero in the next decade as per laws or in-house requirements. It is also found that these offshore fuel-based generators incur high maintenance costs and are less efficient than similar onshore systems [5,6]. This, plus the need to renew the power generation, provides the basis for offshore wind generation to power O&G.
Malaysia has approximately 349 offshore platforms and 281 power generators, with an estimated 30% of them having central processing platforms (CPPs) [7] and all being located offshore in water depths deeper than 50 m to 60 m [8]. However, harnessing solar energy on these platforms is typically only utilized for low power generation due to the limited availability of free and open space on these platforms. Wave energy exploitation is still in its infancy and is less economically attractive, as well as not being able to achieve the necessary industrial levels. Therefore, depending on the water depth, fixed or floating offshore wind systems currently seem to be the most viable industrial solution for this sector.
The motivation of this study was to investigate the usage of renewable energy, especially floating offshore wind, to reduce the CO2 emissions in power generation on oil and gas platforms, as well as to present this as a commercial solution. Considering the CO2 emissions of around 200 million tons of CO2 a year associated with powering Malaysian O&G platforms, as well as the knowledge that offshore power generation consumes around 5% of the offshore wellhead production of fuel gas globally [9], the need to power these offshore platforms with renewable energy is clearly apparent.
In an example of large power generation, Norway has been utilizing subsea cables in the Utsira High region, up to 200 km from the shore, and is planning to build 11 floating offshore wind turbines (the Hywind Tampen project) for the Gullfaks and Snorre oil fields. These turbines can supply the five platforms with up to 35% of their power needs, whilst cutting CO2 emissions by 200,000 tons per year [10].
Different to the Hywind Tampen project, with a spar buoy solution, the so-called GICON®-TLP with a 5 MW WT on top (shown in Figure 2) was chosen for this study. It is a tension-leg platform (TLP) [11]. TLPs are known to possess favorable motion characteristics compared to other floating substructure types, such as semi-submersibles or spar buoys [12,13,14,15], due to the lower number of degrees of freedom as well as their dynamic behavior. The TLP’s positive buoyancy results in a large net-upward force. By activating suitable pre-tensions in the moorings, the platform provides a very stiff system, which can be designed to resist adverse environmental conditions with minimum accelerations and deflections. Owing to its tension-mooring-derived stability, a TLP can be designed to be smaller and lighter than other floating substructures such as semi-submersibles or spar buoys. The CAPEX for this is taken as EUR 18 Mil and OPEX is EUR 24.30/MWh [11].

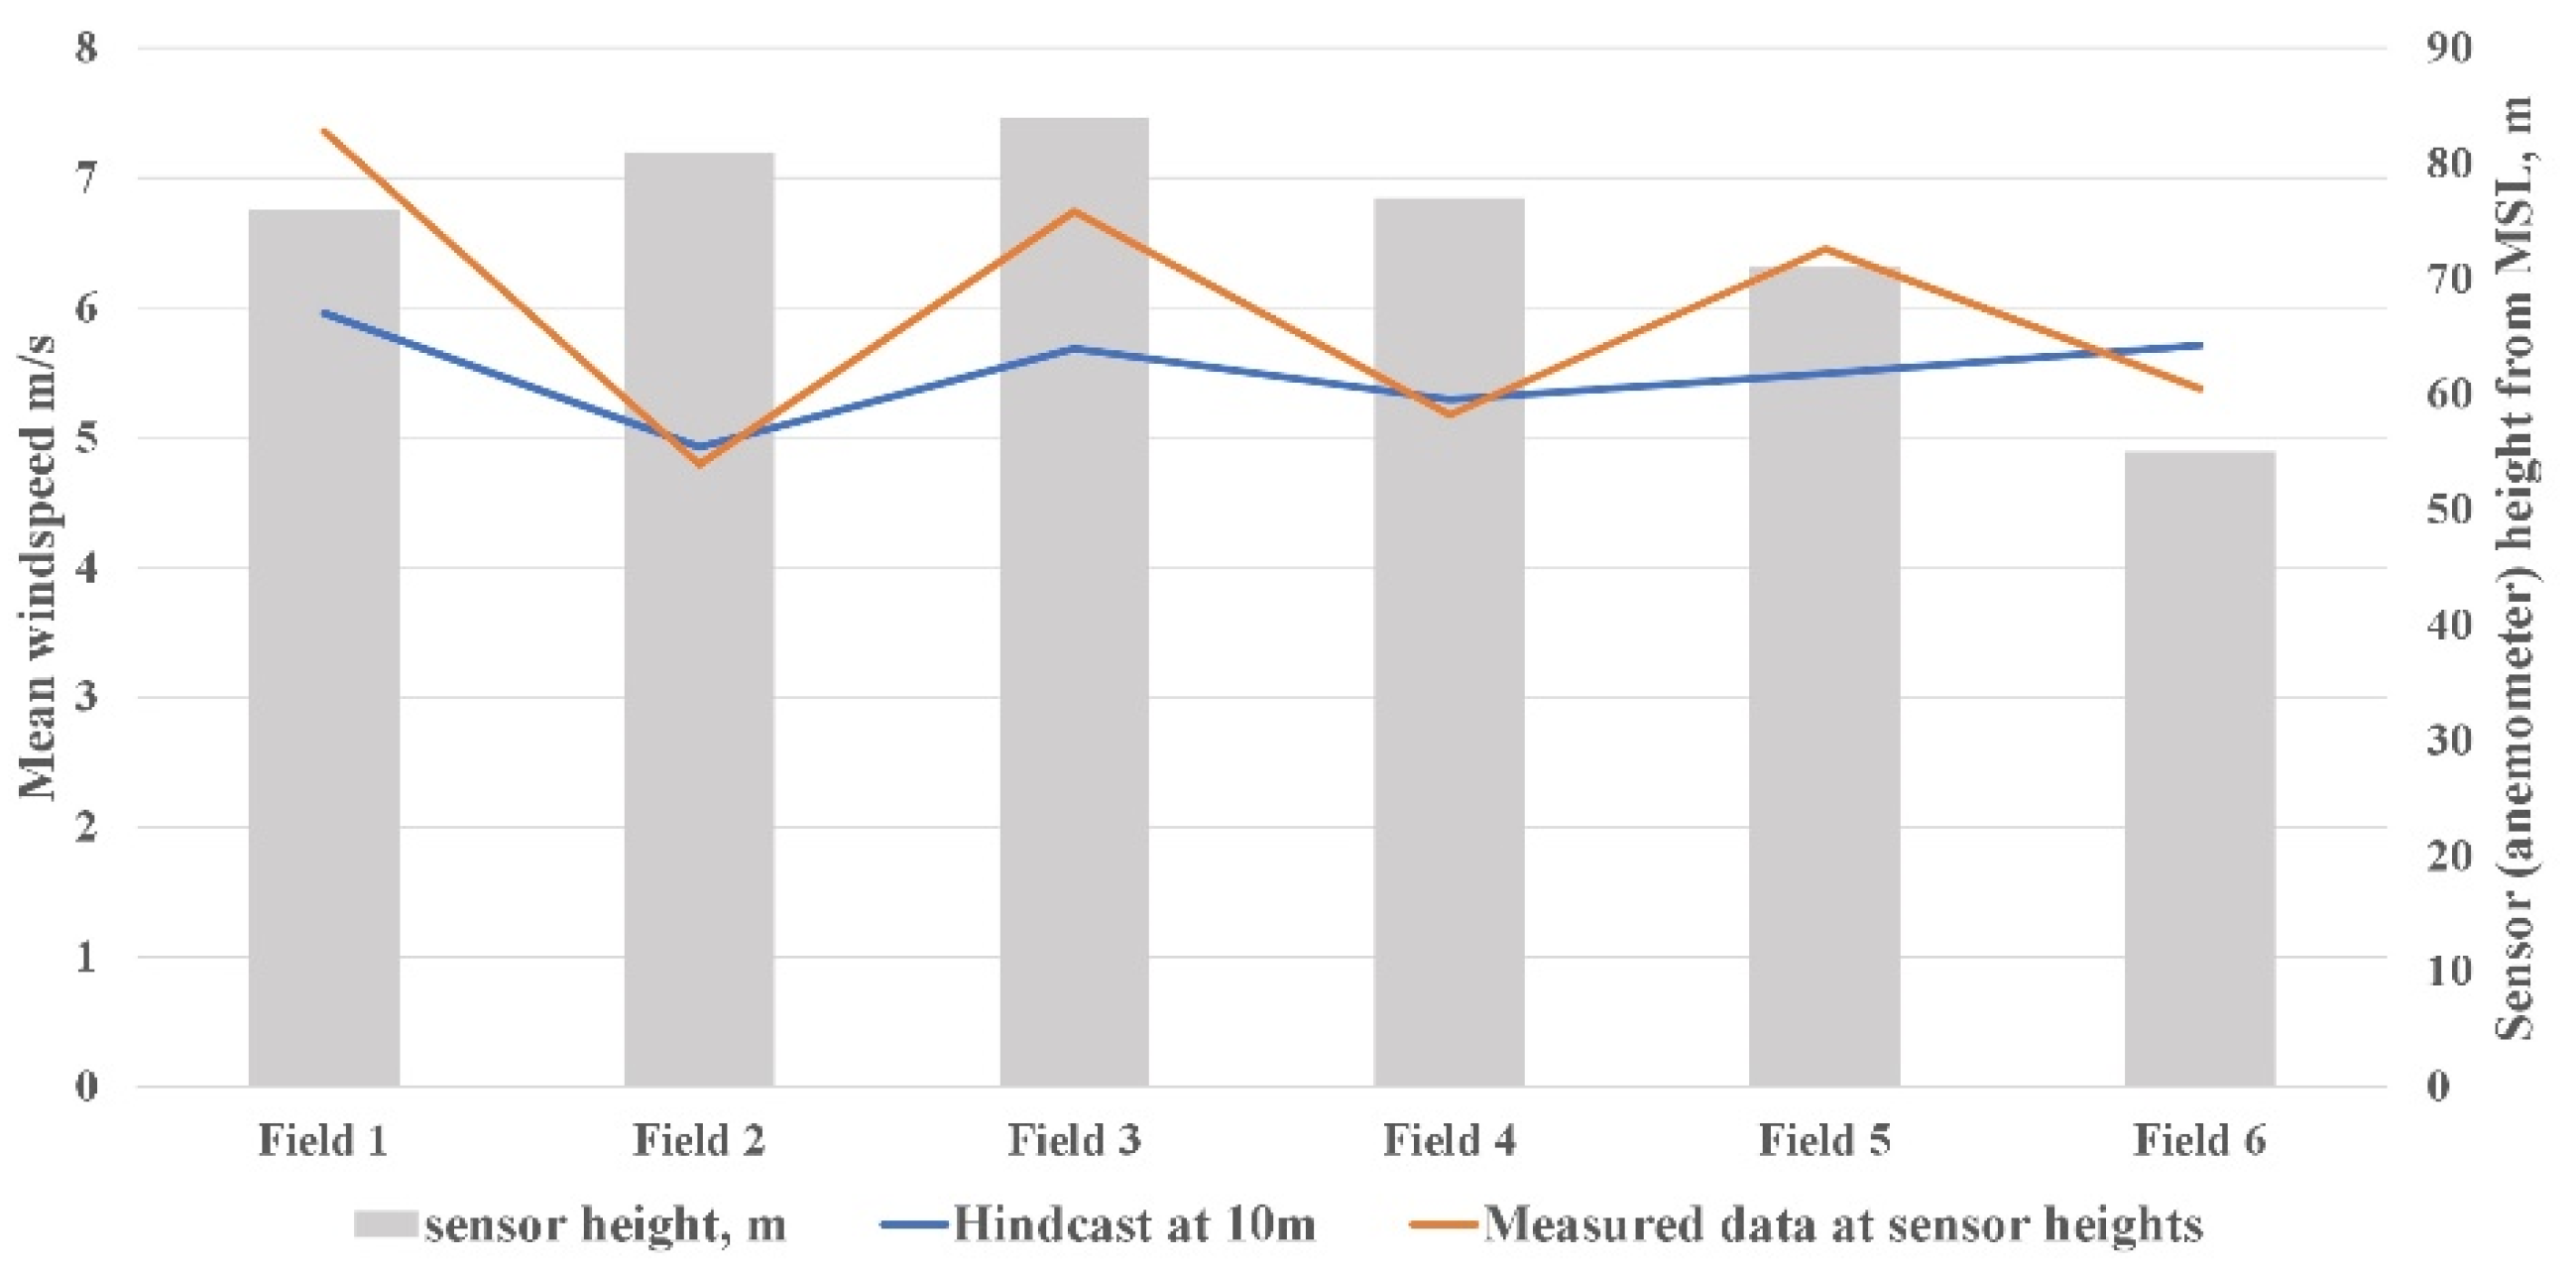
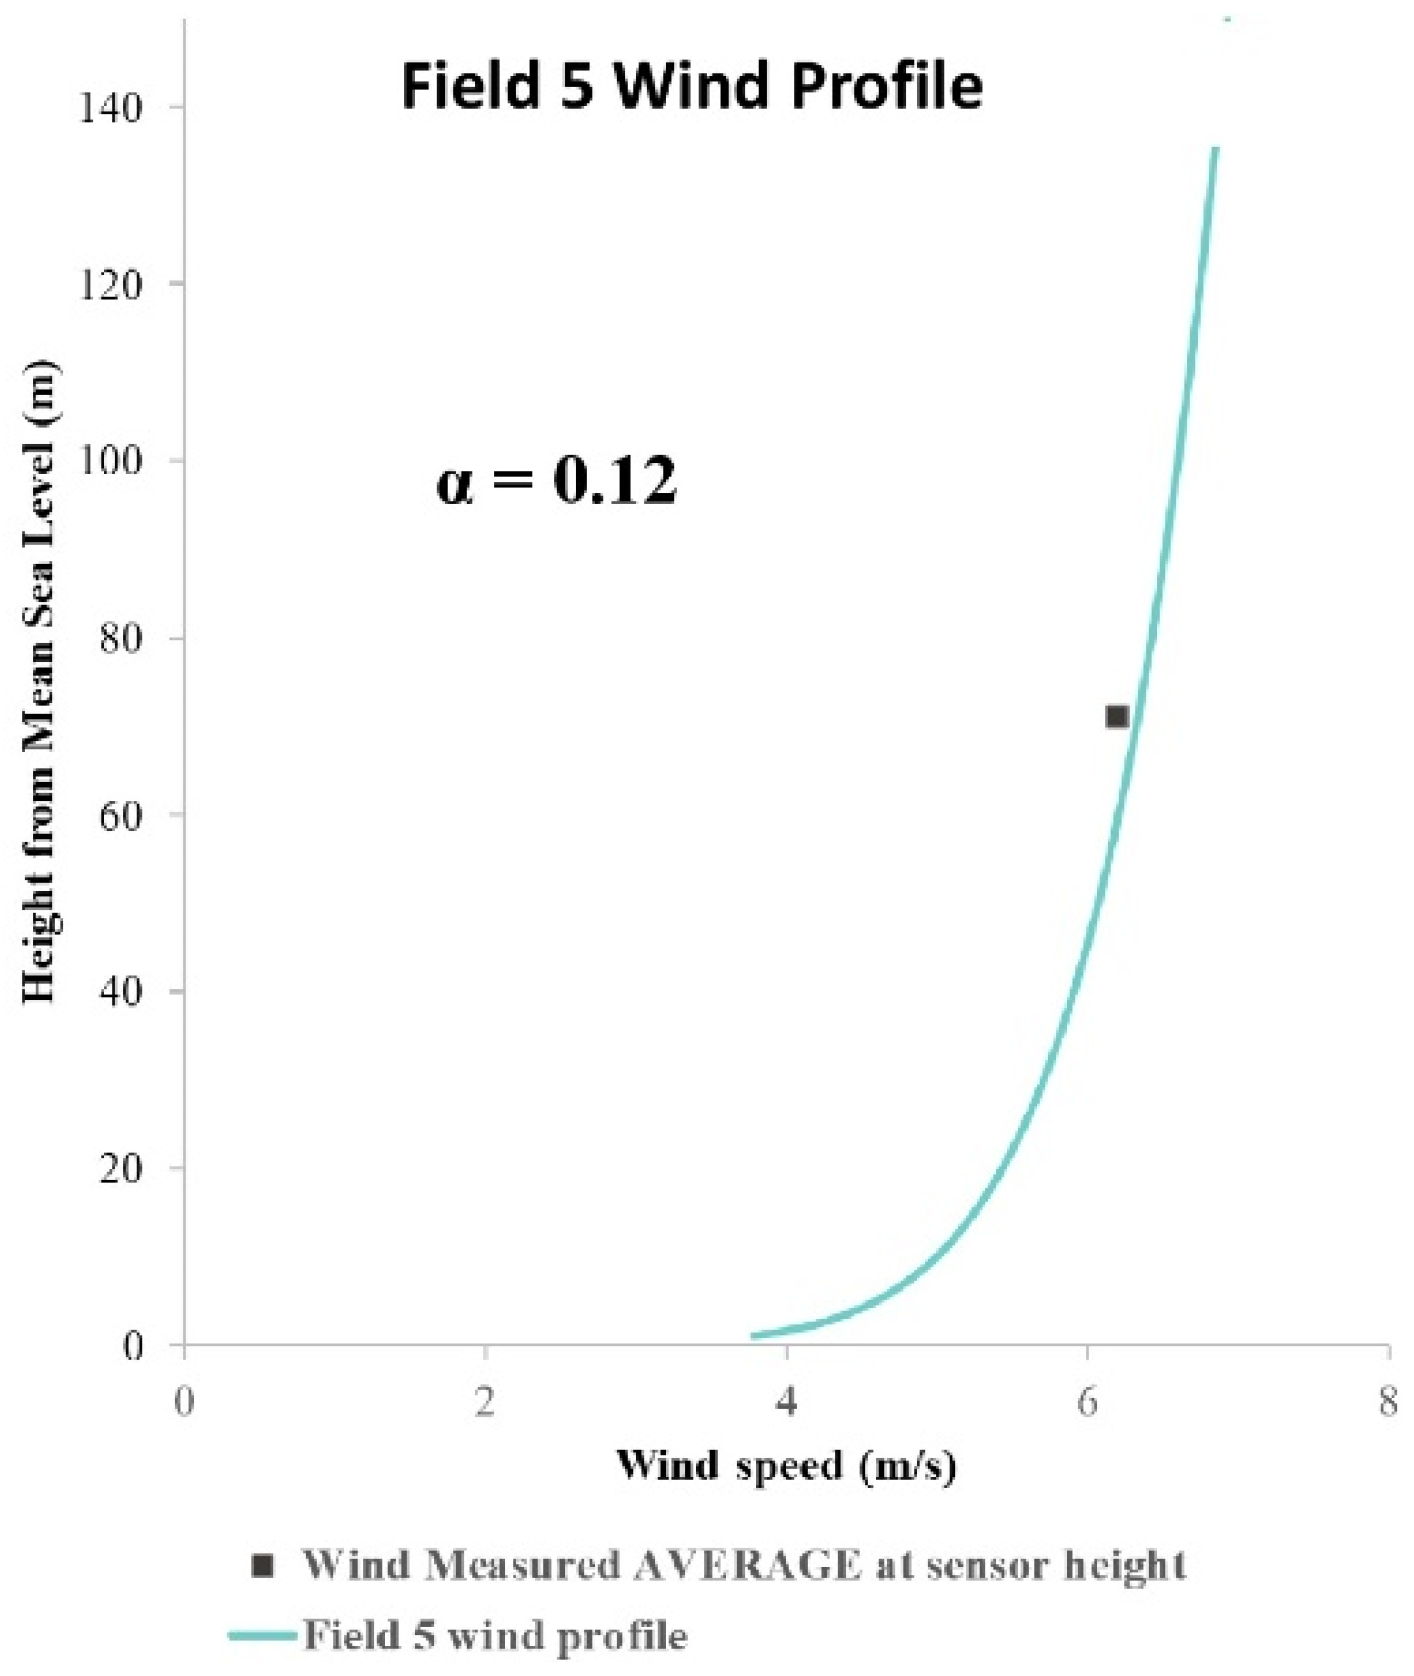
1.2. Wind Assessment

To perform this study, environmental data, especially wind data, are needed. Normally, offshore oil and gas platforms obtain wind data from default-installed wind sensors such as anemometers. While these data are not valid for an offshore wind assessment, such data can be used for an indicative study. For a bankable study, a wind assessment with offshore met masts or LiDAR solutions is needed.
However, the available hindcast data from measurement programs can be used. For example, SEAMOS, the South East Asia Meteorological and Oceanographic Study, provides data on meteorological and oceanographic extreme and operational conditions, which can be used in the design of offshore structures and the planning of offshore operations in the South China Sea. SEAFINE (SEAMOS—South Fine Grid Hindcast) is the updated and extended version of SEAMOS that addresses the problems related to the complexity of bathymetry and the relative sparseness of tropical cyclones in the southern part of the basin. It also expanded the historical period from 1956 to 2015, covering the entire southern half of the SEAMOS domain. It is based on a uniform grid of 25 km embedded with very high-resolution fine grid nests, each with a grid spacing of about 6 km. SEAFINE has become a common tool to assess the marine meteorology information in the South China Sea [16].
The SEAFINE hindcast models wind speeds at a 10 m height above mean sea level (MSL). However, for WTs, the wind at hub height νhub is required. In the absence of this value based on the SEAFINE hindcast, a theoretical approach was taken for this study to determine the νhub using the established Hellman power law profile [17,18]. The value of α under neutral stability conditions over open water is taken as 0.11 [19].
Weibull was chosen as the statistical analysis to capture the behavior of the wind velocity to determine the wind energy potential [20]. The wind energy is calculated as annual energy production (AEP). It is defined as an estimate of the total energy production of a WT during a one-year period, applying the measured power curve to different reference wind speed frequency distributions at hub height, assuming 100% availability. The approach to evaluate the annual energy production follows the general rules laid out in the power-performance measurement document of the IEC standard [21].

1.3. Economical Aspect

As known, the capacity factor provides the average power generated, divided by the rated peak power [22]. Depending on the location/area, offshore windfarms could reach up to 55–60% capacity [23].
The yardstick for power generation technology is the levelized cost of energy (LCOE) in USD/MWh, which measures discounted lifecycle CAPEX and OPEX (USD), divided by discounted lifecycle AEP (kWh) [11,24]. The fixed bottom structure is a matured technology, where its LCOE went down from USD 200/MWh in 2014 to USD 87/MWh in 2017. The floating wind projects are currently at the pre-commercial stage, where the estimated cost is around USD 240–268/MWh. It is expected to reach USD 108–134/MWh during the first commercial projects between 2023 and 2025. By 2030, it is expected to be at the mature commercial stage, where it is targeted to reach USD 54–80/MWh [8]. These LCOE values will be used as benchmark values against conventional LCOE values to produce electricity via fossil fuels offshore, considering O&M costs, CO2 reduction, etc.
Therefore, this study focuses on the development of the hybrid power generation concept for offshore oil and gas power generation in Malaysia. Here, the techno-economic framework is developed to analyze the parameters that impact the economic model and to evaluate whether harnessing wind energy in low wind speed regions for use in offshore oil and gas platforms is feasible. The major contributions of this study are as follows. Based on the data obtained from one of the Malaysian offshore oil and gas fields, the economic feasibility of harnessing wind energy for hybrid power generation in a low wind speed area is analyzed for the first time.
  • A feasible techno-economic framework is established as a decision-making tool to optimize the economic and technical elements for offshore hybrid power generation in Malaysia.
  • The life cycle model and the levelized cost energy was developed, where the CAPEX and OPEX, which included not only the maintenance cost, but also the carbon tax, decommissioning costs, and sales gas offsets, are analyzed. This model is validated to ensure the simulation results are correct.
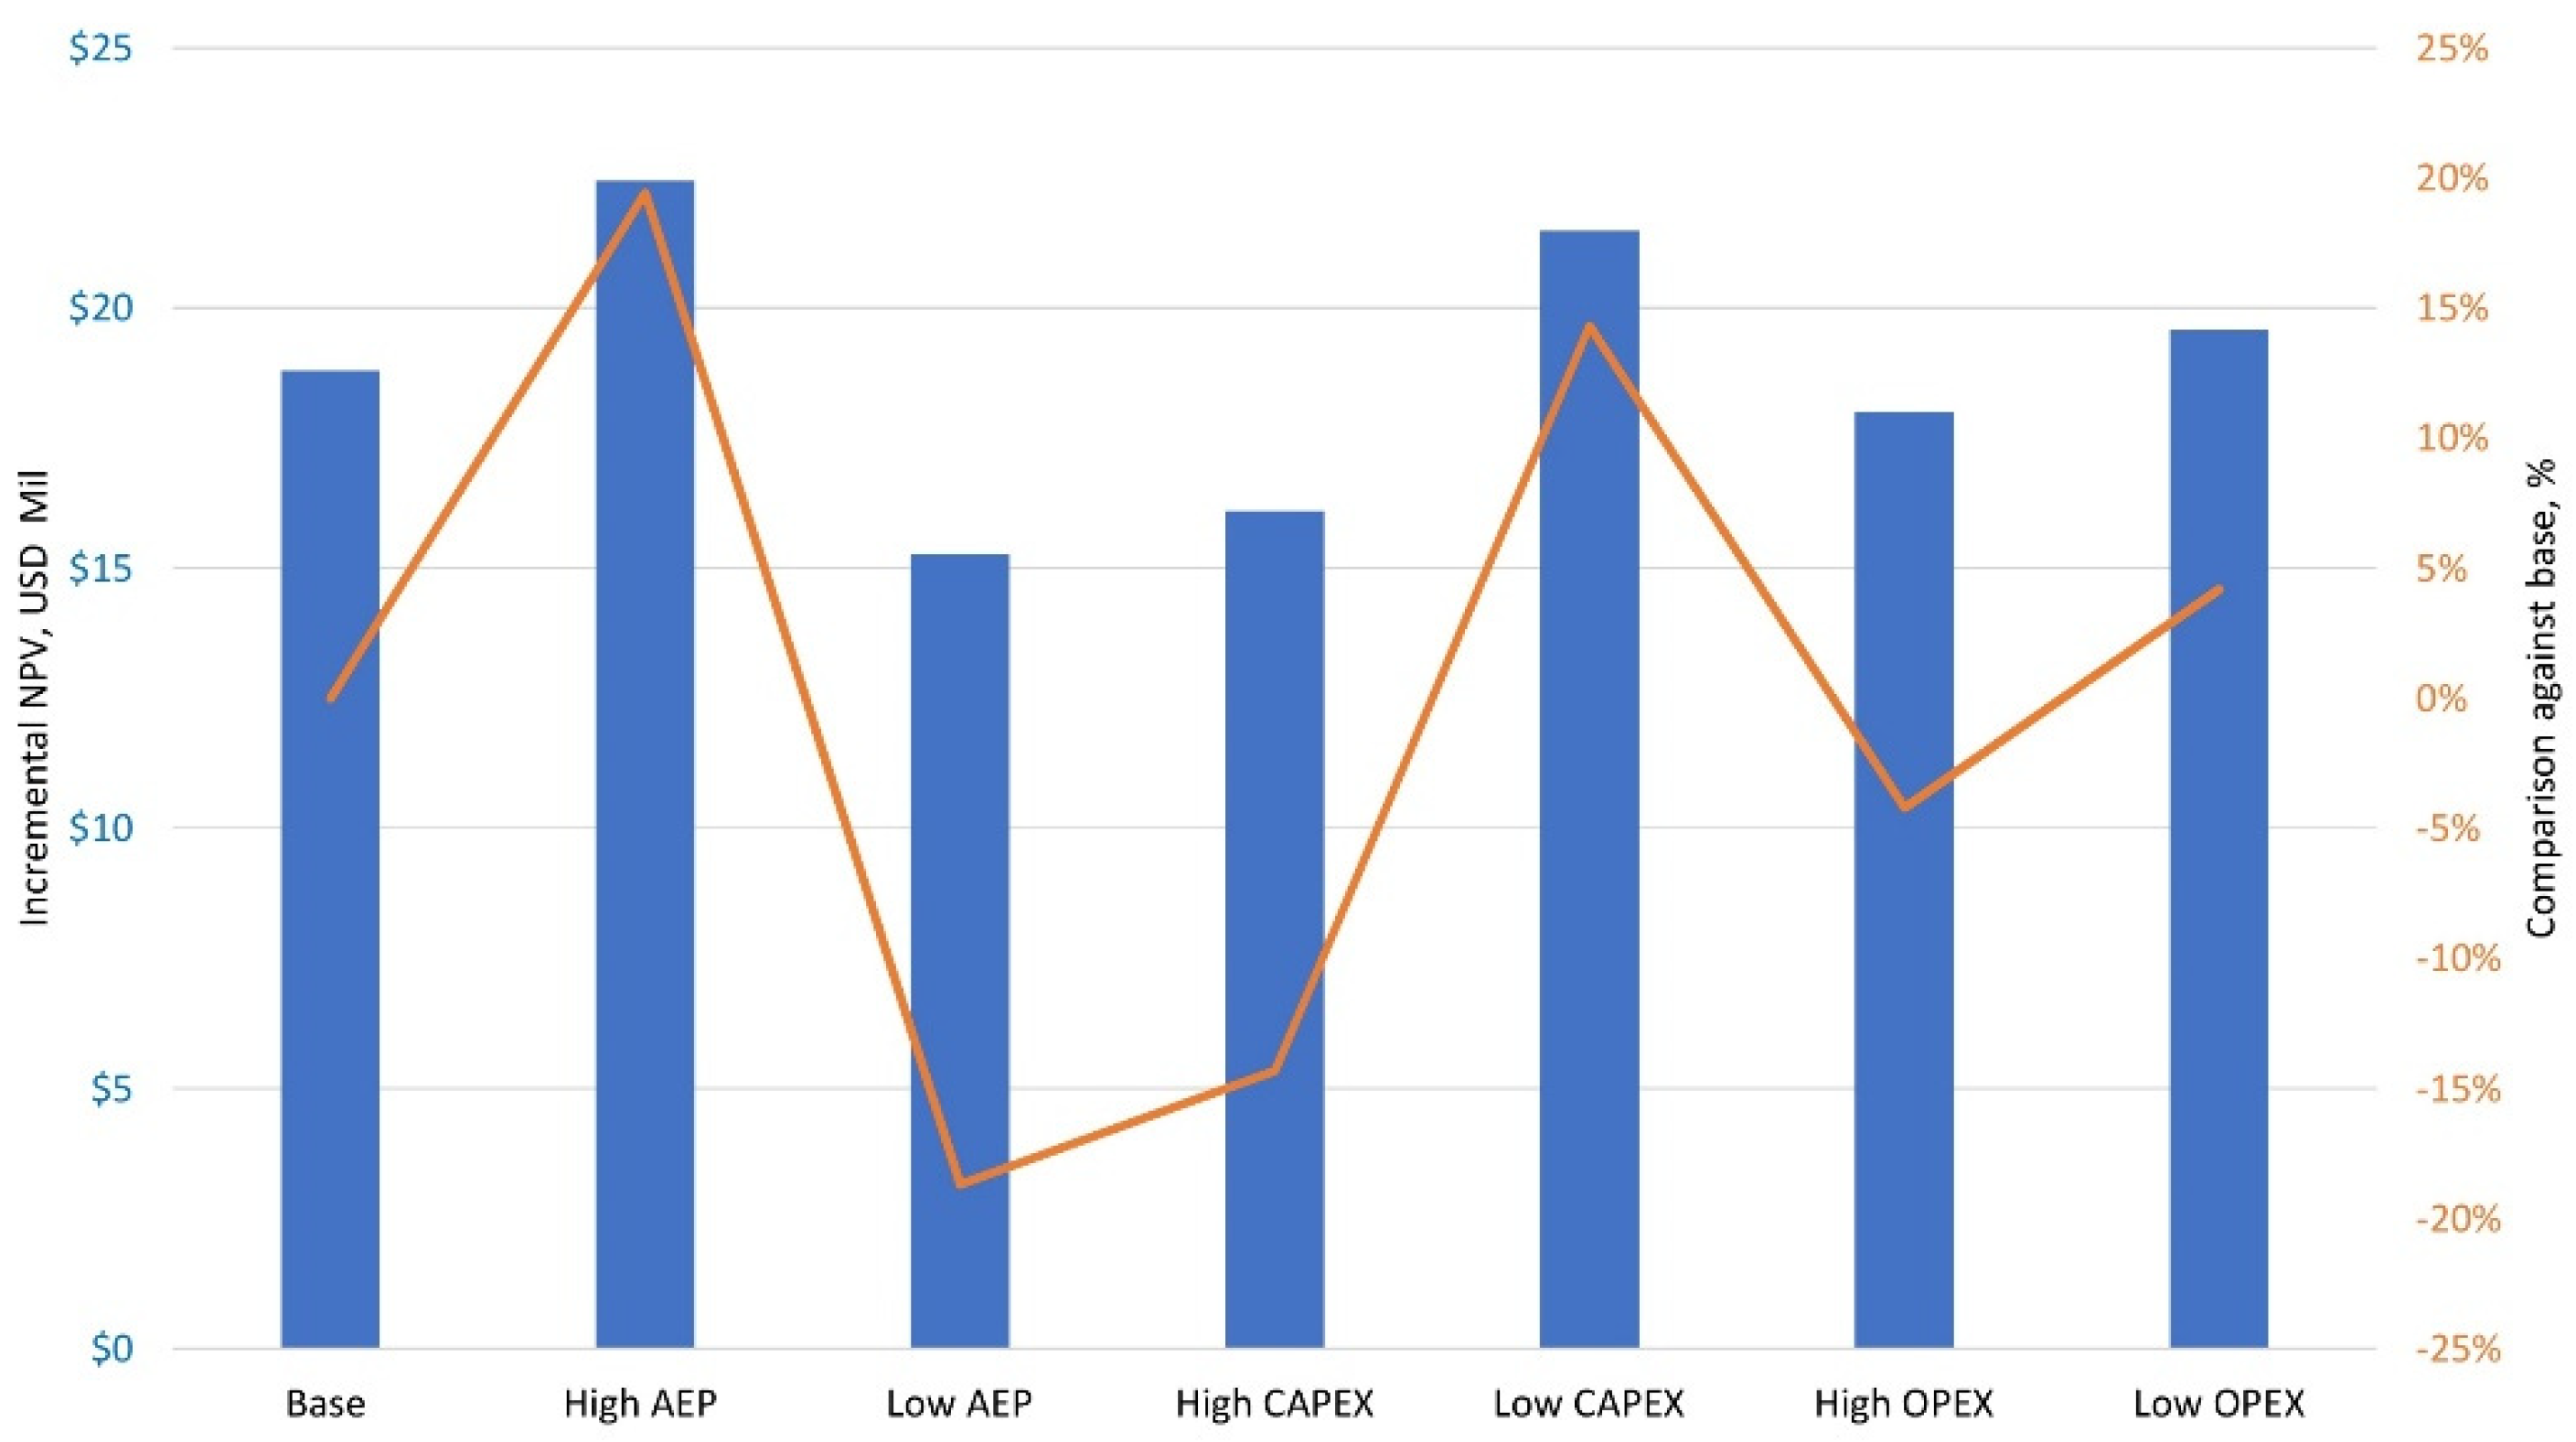
  • The sensitivity analysis compares the impact of key parameters such as CAPEX, OPEX, and AEP to define the economic threshold for a viable hybrid power generation concept.

2. Methodology

One of the solutions to reduce carbon emissions and the operational expenditure (OPEX) of power generation, whilst maintaining reliable power availability, is to implement a floating wind including gas turbine as a hybrid micro-grid power generation approach, as illustrated in Figure 3. In this concept, one GTG is replaced by a WT system. There will be one generator running with a WT and one other generator on standby.
The sizing of the GTGs needs to be properly studied, where each GTG should be able to take up 100% of the load. The system is housed on a floating platform held by a gravity anchor. It will be an unmanned platform and will be remotely operated with embedded condition monitoring systems. Since it is a non-fired system, the maintenance is low compared to gas turbine maintenance; hence, this will result in a reduction in the maintenance cost. In addition, the fuel gas usage will be reduced, which lowers the fuel gas cost and reduces carbon emissions. Moreover, the unused fuel gas is converted into additional gas revenue, thereby improving the economics of the hybrid power generation compared to conventional power generation. Firstly, the technical framework was established. An offshore O&G field in Malaysia with a 5 MW power generation requirement was selected. Two scenarios were developed: brownfield and greenfield. The brownfield scenario is an existing field that has existing GTGs in operation. Therefore, there were no additional GTGs being purchased, hence zero CAPEX for GTGs. The greenfield scenario is a new field where the CAPEX for GTGs are included. For each scenario, two power generation concepts were drawn up, namely, conventional and hybrid power generation. In the conventional power generation scenario, there were three GTGs, whereas in the hybrid power generation scenario, there were two GTGs and one WT system. The OPEX consisted of maintenance cost, carbon tax, and abandonment cost. Meanwhile, the CAPEX of the hybrid concept omitted one GTG and included one WT instead. The OPEX considerations for both concepts were similar for the two scenarios.
Next, the economic framework was established. The cash flow was based on revenue minus royalty minus cost minus tax and discounted to 2022. In the lifecycle cost, the present value (PV) for each year was calculated based on the discounted revenue minus the cost formula, and the net present value (NPV) was determined over the lifecycle period, as shown in Equation (1).
P V = C F ( 1 + r ) t
where:
  • PV = present value,
  • CF = future cash flow,
  • r = discount rate,
  • t = number of years.
The NPV was based on the incremental gain between conventional and hybrid concepts for each scenario. The important parameters that are considered in this study are the gas-heating value of 1000 mmBTU/mmscf, fuel gas efficiency of 0.5 mmscfd/MW, carbon tax rate of USD 26.10/ton of carbon dioxide, escalation rate of 3%, weighted average cost of capital (or the discount rate) of 7%, and the OPEX of USD 27.70/MWh [11], and the EUR to USD exchange is taken as 1.14. The Malaysian tax rates applicable here are the oil and gas upstream tax of 38% and downstream tax of 24%. The abandonment cost and sales gas price are confidential company data.
Next, the LCOE, as shown in Equation (2) [11], was calculated, where the incremental gain between the conventional and hybrid case was analyzed.
L C O E = C A P E X + t = 1 n O P E X ( 1 + W A C C ) t t = 1 n E P N e t ( 1 + w A C C ) t          
where:
  • EPNet = AEP over the total project lifetime,
  • WACC = weighted average cost of capital.
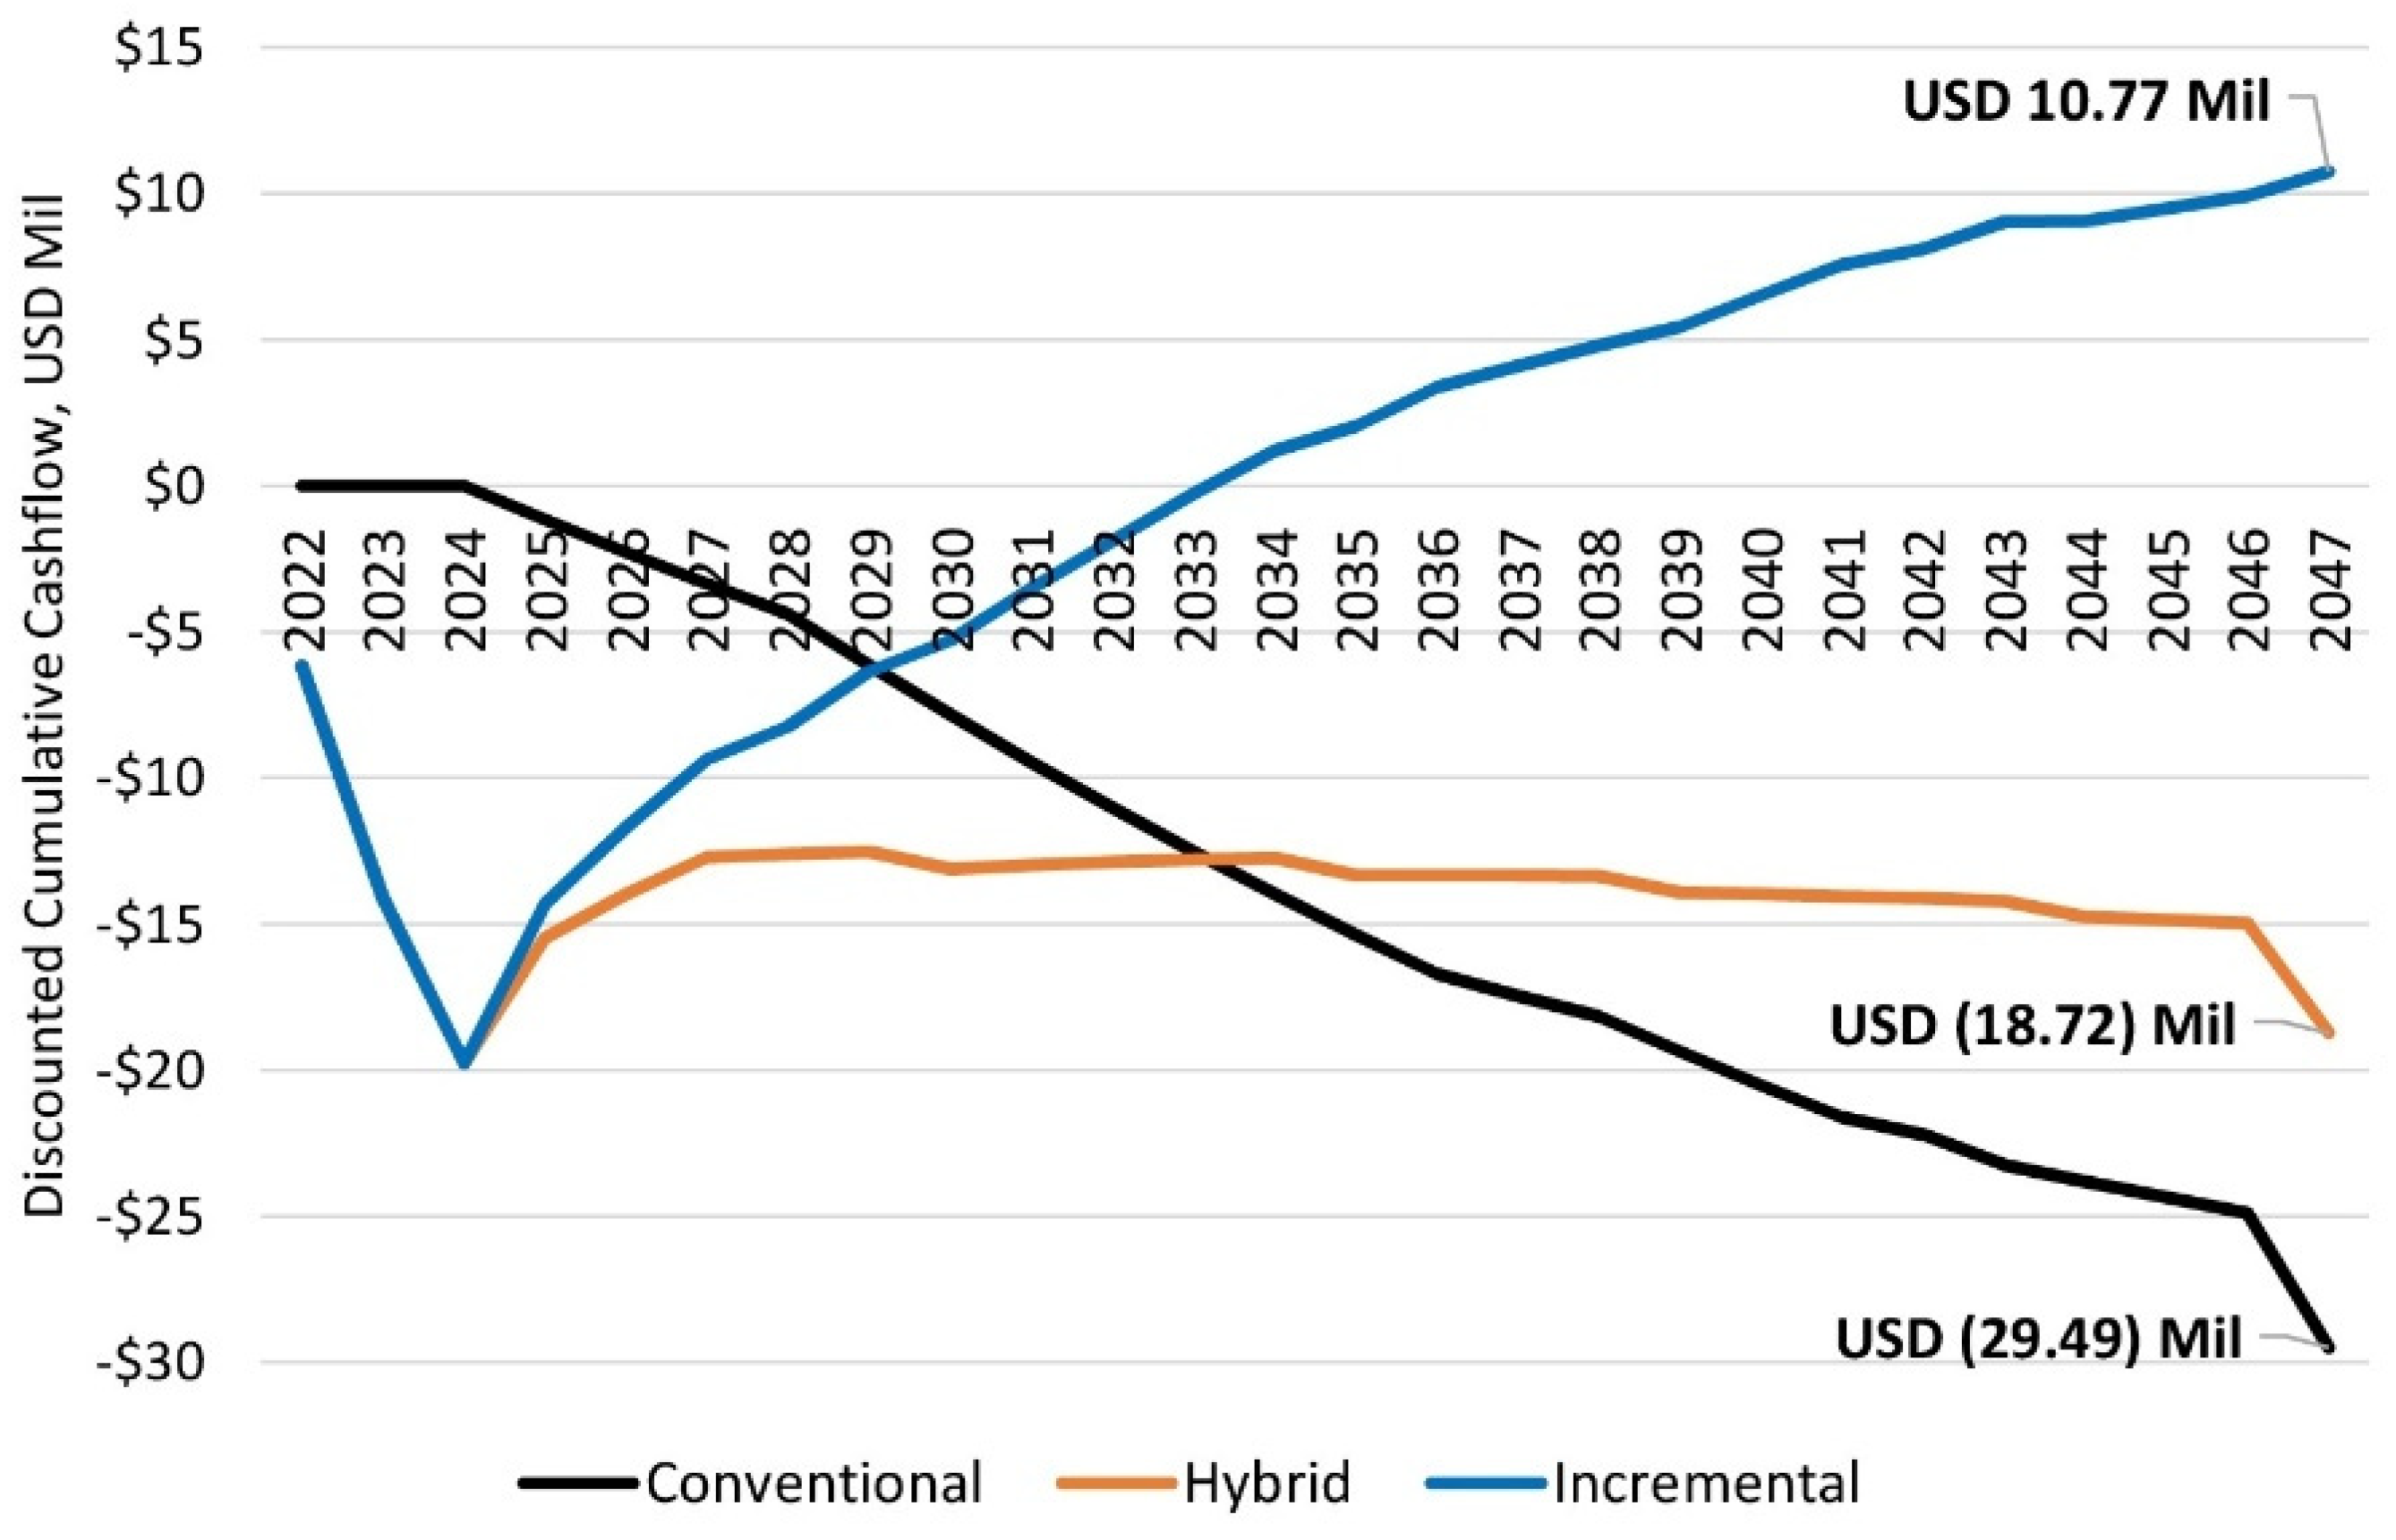
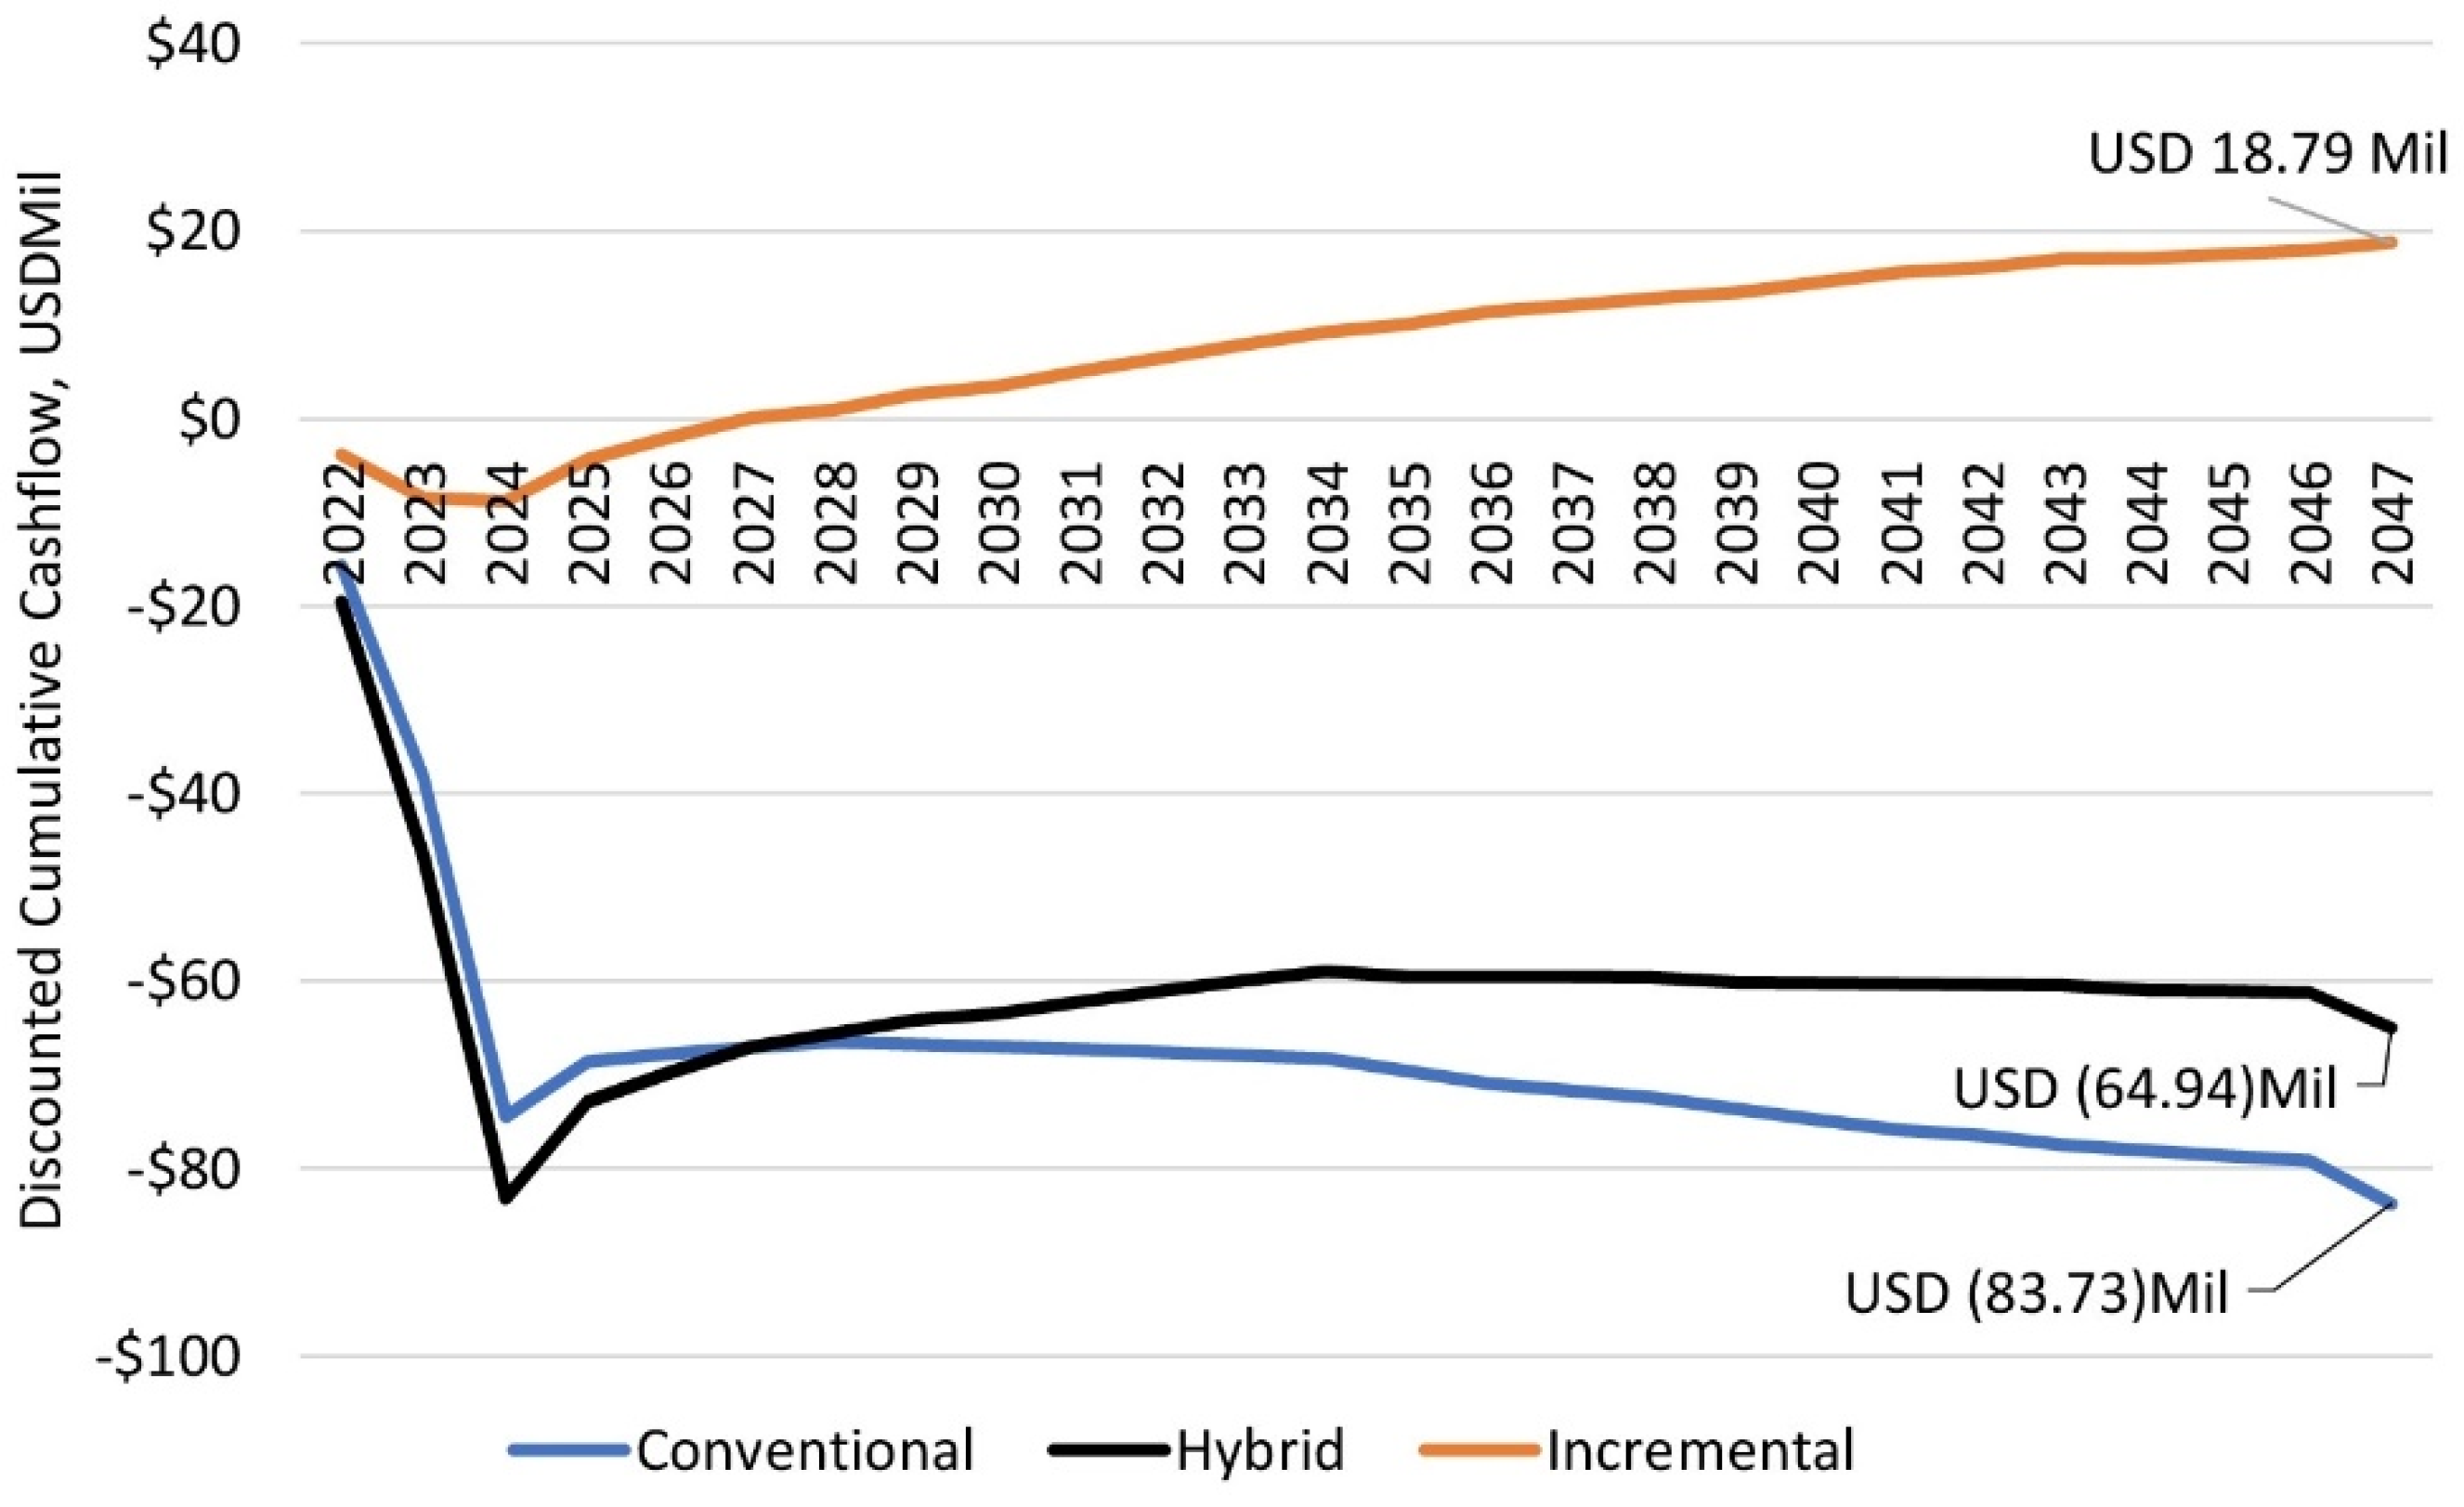
Next, the sensitivity analysis was performed, where the CAPEX, OPEX, and wind energy (AEP) were analyzed. Lastly, the economic threshold for a viable hybrid concept was defined and the optimum configuration was recommended.

3. Results

The 10 min average wind speed at a 10 m height at various oil and gas platforms based on 20 years of SEAFINE hindcast data was studied, as illustrated in Figure 4. Generally, the average annual mean wind speed was found to be between 5 and 6 m/s. The wind was strongest at platforms in offshore Peninsular Malaysia and offshore Sabah.
For the techno-economic analysis, Field 5 was selected based on the following selection criteria:
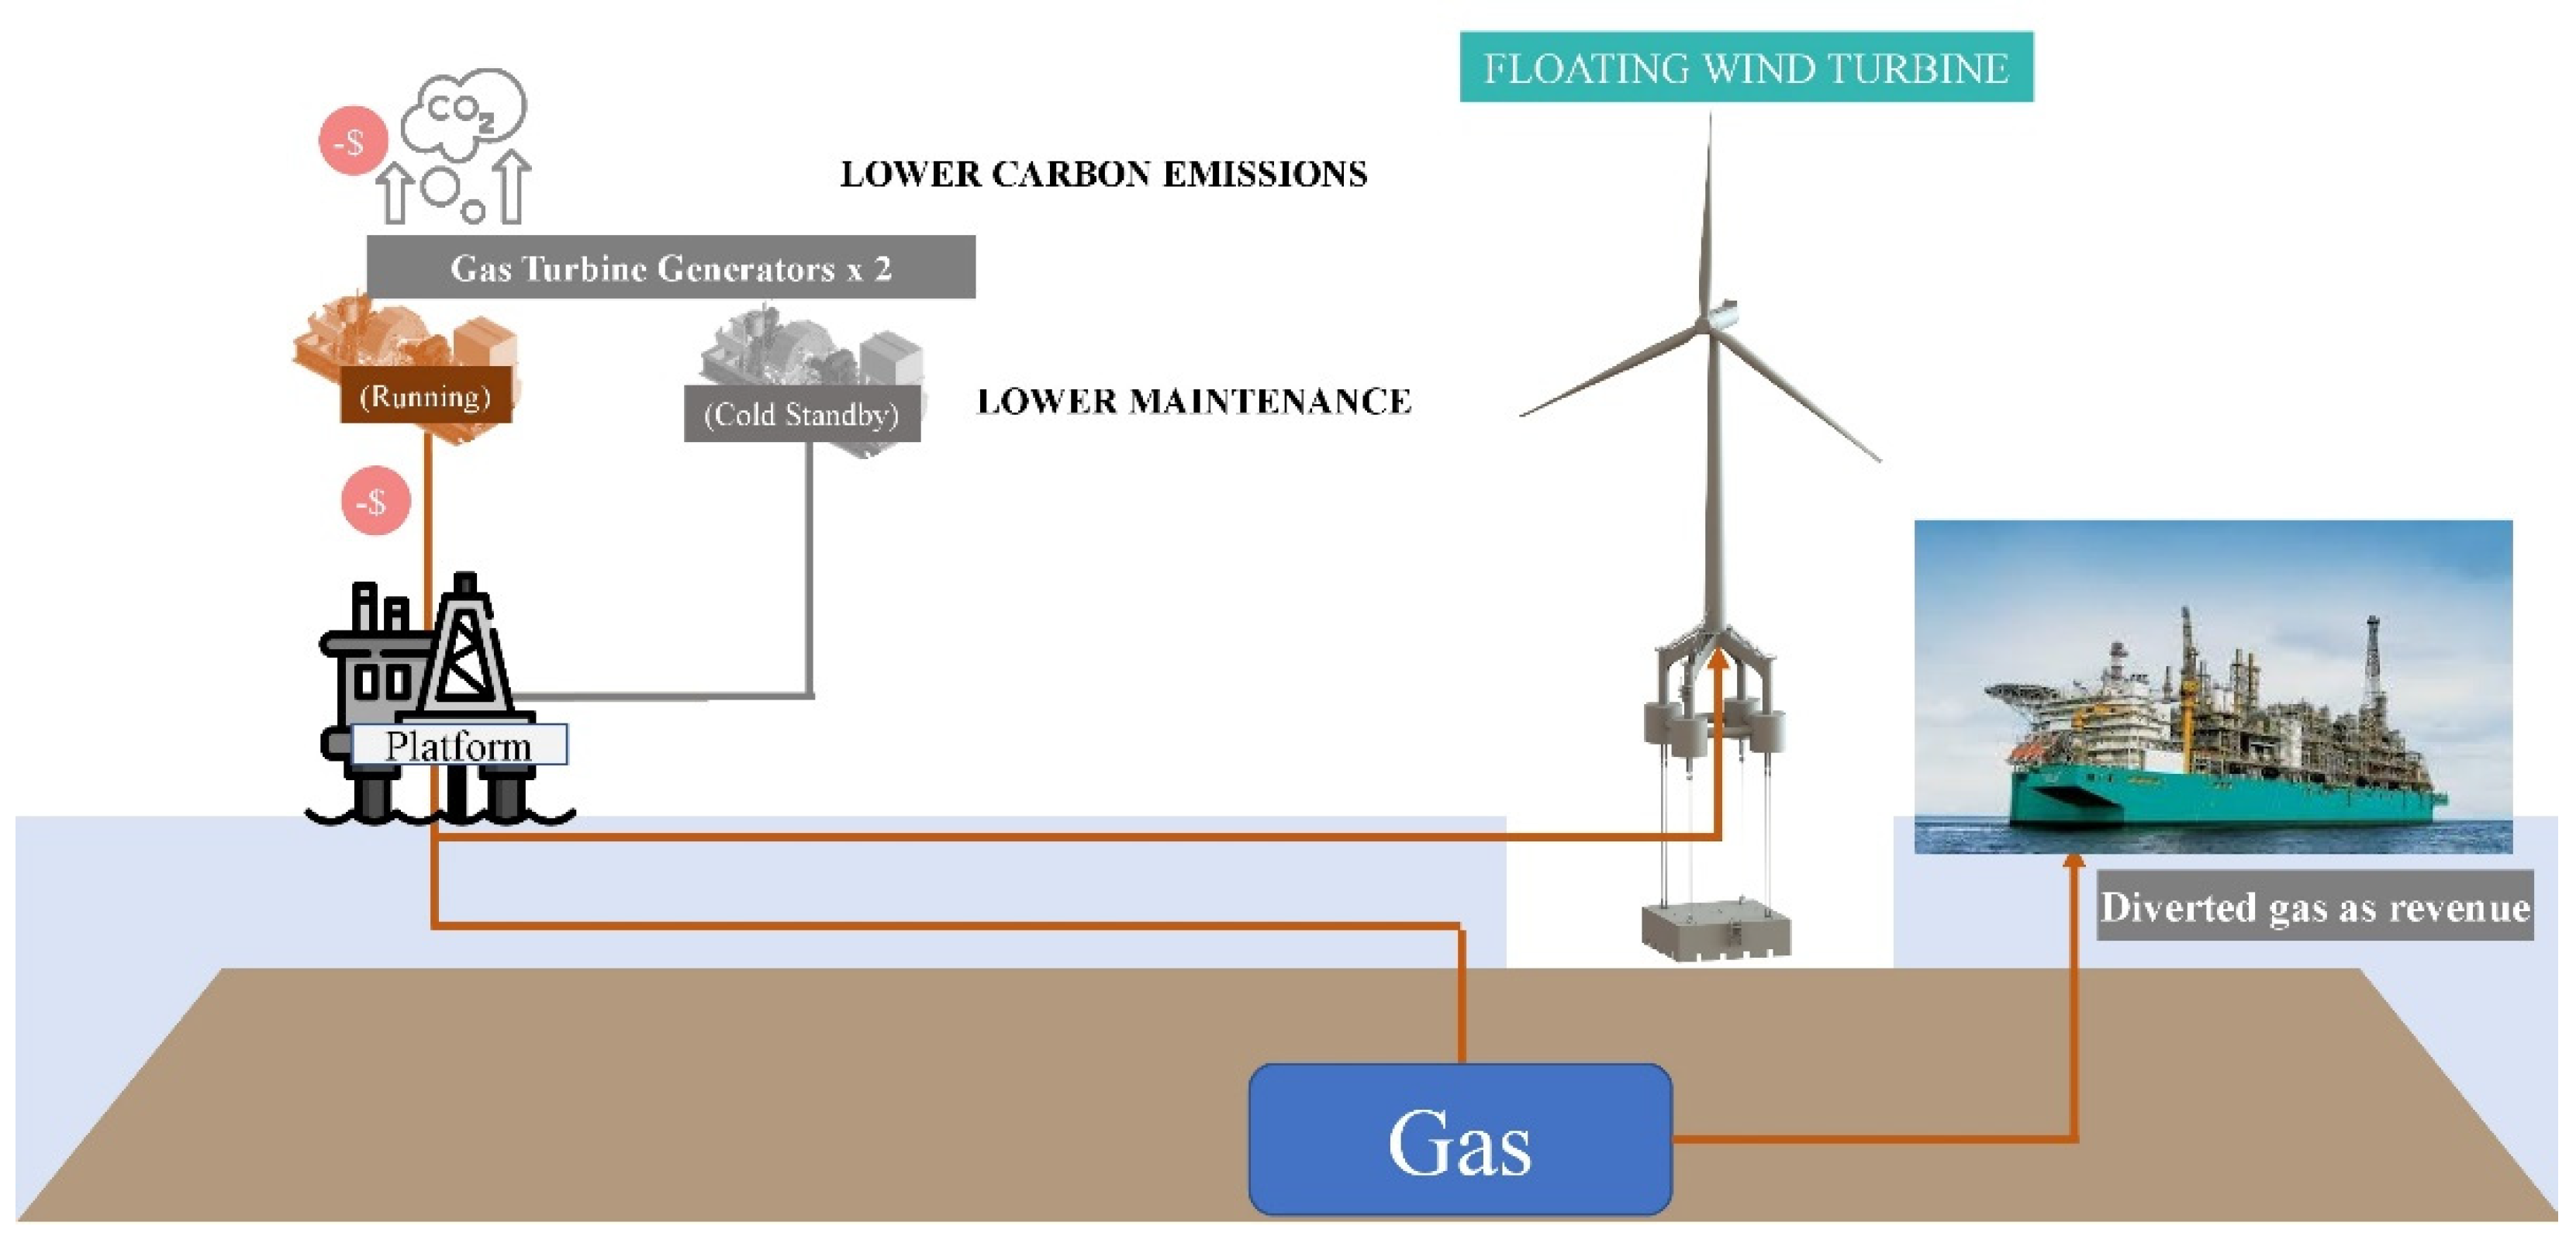
  • It is a gas-producing platform as the fuel gas savings will result in additional sales gas revenue.
  • An oil producing platform is only possible if it has gas evacuation pipelines.
In this study, the power law was applied to the measured data and the hindcast data, where the alpha value was derived and shown in Figure 5 to be 0.12.
As per the SEAFINE hindcast, the annual wind speed at 110 m mean sea level was found to be 6.80 m/s, which was chosen for this study. The Weibull shape factor is assumed to be equal to Rayleigh distribution where k is assumed as 2.
In this study, it is assumed that the power required on Field 5 is 5 MW. The parameters based on ELEON WT are shown in Table 1.
The Weibull distributions and the corresponding energy yield per wind speed bins (Figure 4) were calculated and are shown in Table 2. The AEP is the total power generated in each bin, which was found to be 16,507 MWh/a. At the annual mean wind speed of 6.8 m/s, the Weibull distribution was found to be the highest at 11%. However, the energy yield was only 5% of the AEP (797 MWhr/a). The energy yield was the highest from 10 to 11 m/s, even though the Weibull distribution was only 13%; this range gave the highest energy output, which catered for approximately 1/3 of the AEP.
The AEP was based on a P50 probability value. The other probability values (P70, P75, P80, P90) were based on 15% uncertainty, where the industrial practice ranged between 8% and 15% (for example, the wind data, metrology data, power curve, etc.). A summary of the probability values for the Field 5 AEP is shown in Table 3. From here, it can be calculated that the capacity factors for P50 and P90 are 38% and 30%, respectively, which is within the industry standard.
There is an incentive given by the Government of Malaysia for undertaking petroleum operations that require intensive capital investment, called capital allowances on qualifying plant expenditure [25]. GTGs fall under the category of “Any other case” and WTs fall under the category of “Environment protection equipment and facilities”, and the rates of the initial and annual allowances up to 100% of the capital expenditure against the gross income for each year of assessment are illustrated in Table 4. This can be carried forward to offset future business income. Here, it can be seen that the tax allowance for WTs can be obtained as early as 3 years, while for GTGs, this will take longer—at least 10 years.
A generic cost for three 6.5 MW GTGs including engineering, procurement, construction, installation, and commissioning costs, along with the related topside and jacket requirements, is assumed to be USD 11 Mil higher than two units of similar GTGs in the hybrid concept (based on the PETRONAS inhouse 5–6.5 MW GTG cost database). The WT OPEX is taken as USD 27.7/MWh [11]. OPEX included GTG OPEX, WT OPEX, and carbon tax. The fuel gas cost was not included here. The abandonment costs of three GTGs are USD 2 Mil higher compared to two GTGs. The WT abandonment was taken as USD 2 Mil with the assumption that the abandonment costs are shared with the field abandonment.
The lifecycle cost was analyzed, where the discounted cash flow for the conventional and hybrid concepts was calculated and the incremental NPV@7 between them was derived. Figure 6 and Figure 7 illustrate the lifecycle costs for the brownfield and greenfield scenarios, respectively, where the incremental lifecycle costs were USD 10.77 Mil and USD 18.79 Mil, respectively. For both scenarios, the earlier cash sink was due to CAPEX in the development phase. The conventional cash flow was worse than hybrid for both scenarios, as the latter had reduced OPEX and additional revenue from diverted fuel gas. Greenfield had a higher incremental gain due to GTG CAPEX considerations in the conventional concept. The incremental NPV for the hybrid compared to the conventional concept for brownfield and greenfield were found to be 37% and 22%, respectively. Greenfield had a lower incremental gain due to higher CAPEX from GTG CAPEX inclusion.
Figure 8 illustrates the discounted cumulative cashflow of both scenarios. As Greenfield has a higher incremental gain, the payment period is only 4 years compared to 12 years for brownfield. The greenfield scenario is 43% better than the brownfield scenario. The positive incremental NPV for both the greenfield and brownfield scenarios for the hybrid concept in comparison to the conventional approach was due to the additional sales gas revenue, which is the main advantage for oil and gas platforms compared to the typical power to grid cases.
Next, the LCOE was calculated and is shown in Table 5. It was found that the LCOE for the WT, hybrid, and conventional concepts was USD 165.52/MWh, USD 213.59/MWh, and USD 273.28/MWh, respectively. For 5 MW power generation, the total AEP required (345 days of operation annually) is 41,400 MWh. The WT capacity factor is 38%, which shows adequate performance in low wind areas. The WT will supply about 40% of the power requirements of Field 5, and the remaining will come from the GTG. Whilst the CAPEX of the hybrid is higher than the GTG, the OPEX is reduced by 27% due to the lower maintenance costs, carbon tax, and ABEX, as the ABEX for WTs is lower than for GTGs. The hybrid solution has the revenue stream for additional sales gas that offsets the LCOE by USD 56.26/MWh, without which the hybrid LCOE will be USD 269.85/MWh, which is 12% lower than for GTG only. It can be concluded that the WT LCOE was 39% lower than the conventional approach, while the hybrid solution was 22% lower than the conventional. It can also be concluded that the LCOE for the WTs in low wind speed areas was found to be between 19% and 34% higher than the expected first commercial project targets.
Sensitivity analyses were performed on the greenfield scenario as a base. The parameters were CAPEX (±20%), OPEX (±20%), and AEP (+20% and P90), where the P90 AEP was approximately 19% lower than the base case. This analysis will be used to determine the core parameters that will impact the techno-economics. Table 6 illustrates the analysis, and Figure 9 gives the graphical representation. The lifecycle cost was impacted the most by the AEP (wind energy), followed by CAPEX, and then OPEX with the least impact.
It is also interesting to note that for all of the cases, the resultant incremental NPV was higher than the brownfield scenario, between 30% (low AEP case) and 52% in the high AEP case. The payback period ranged between 4 and 8 years, which indicates robust economic performance.

4. Conclusions

The importance of marine renewable energy is gaining traction with governments around the globe committed to COP26 on carbon reduction, where offshore wind, wave, tidal, and other energies are key drivers to promote the decarbonization of power generation at offshore O&G platforms. Since renewables are not as reliable as full standalone power, a hybrid concept has been shown to be more economically feasible compared to the conventional concept. The incremental NPV7 for the hybrid concept in the greenfield scenario (USD 18.79 Mil) was around 43% better than for the brownfield scenario (USD 10.77 Mil). This is expected, as for brownfield, there was no CAPEX for the included GTGs as there were pre-existing GTGs available. In addition, the OPEX for the GTGs was higher in the brownfield case, as there was an additional GTG to maintain, and the addition of the WT OPEX in the greenfield case was still lower than the extra GTG available in the brownfield scenario. The payback periods for greenfield and brownfield, at 4 and 12 years, respectively, are strong indicators that wind energy in low wind speed areas can yield economic benefits for oil and gas platforms.
The LCOE of the WT was calculated to be USD 165.52/MWh, around 39% lower than the LCOE for the conventional approach (USD 273.28/MWh). The LCOE for the hybrid solution including a combination of GTGs and WTs was found to be USD 213.59/MWh, around 22% lower than the conventional concept.
For the sensitivity analysis of the NPV, the variable parameters taken were the wind energy (AEP), CAPEX, and OPEX. Wind energy gave the most impact, and OPEX the least. It was interesting to note that the incremental NPV for all cases was still higher than for the conventional approach.
This study has shown that with the careful design and selection of a WT system, harnessing wind energy is viable in low wind speed regions. Thus, it is hoped that these findings give confidence to the adoption of offshore wind power, not only in southeast Asia, but also other regions around the world where low wind speeds prevail.

Author Contributions

Conceptualization, methodology, software, validation, formal analysis, investigation, resources, data curation, I.M.I., M.M. and S.I.U.-H.G.; writing—original draft preparation, I.M.I.; writing—review and editing, F.A.; visualization, I.M.I. and F.A.; supervision, M.M., S.I.U.-H.G. and F.A.; project administration, I.M.I. All authors have read and agreed to the published version of the manuscript.

Funding

This research received no external funding.

Institutional Review Board Statement

Not applicable.

Informed Consent Statement

Not applicable.

Data Availability Statement

From the authors as pre request.

Acknowledgments

PETRONAS is acknowledged for permission to publish these results. Furthermore, the author would like to thank Azam A Rahman, M Nasir Abdullah and M Faieez M Jupri for their assistance in reviewing the technical results and performing some of the numerical computations.

Conflicts of Interest

The authors declare no conflict of interest.

References

  1. COP26 Keeps 1.5C Alive and Finalises Paris Agreement. Available online: https://ukcop26.org/cop26-keeps-1-5c-alive-and-finalises-paris-agreement/ (accessed on 9 July 2022).
  2. Ho, L.W. Wind energy in Malaysia: Past, present and future. Renew. Sustain. Energy Rev. 2016, 53, 279–295. [Google Scholar] [CrossRef]
  3. Samo, K. Wind Characterization for Renewable Energy Applications. In Proceedings of the 4th IASME/WSEAS International Conference on Energy and Environment, Cambridge, UK, 24–26 February 2016. [Google Scholar]
  4. Onshore vs. Offshore Wind: What Are the Differences and Facts? Available online: https://greencoast.org/onshore-vs-offshore-wind/ (accessed on 9 July 2022).
  5. Chokhawala, R. Powering Platforms Connecting Oil and Gas Platforms to Mainland Power Grids. ABB Rev. 2008. Available online: https://library.e.abb.com/public/aab4c01eb564adf3c1257427002e53a5/52-56%201M811_ENG72dpi.pdf (accessed on 9 July 2022).
  6. Wood Mackenzie. Why Powering Oil and Gas Platforms with Renewables Makes Sense; Wood Mackenzie: Edinburgh, UK, 2019. [Google Scholar]
  7. PETRONAS. Activity Oulook 2018–2020. Available online: https://www.petronas.com/sites/default/files/2018-12/petronas-activity-outlook-2018-2020.pdf (accessed on 9 July 2022).
  8. Floating Offshore Wind Energy; A Policy Blueprint for Europe. Available online: https://windeurope.org/wp-content/uploads/files/policy/position-papers/Floating-offshore-wind-energy-a-policy-blueprint-for-Europe.pdf (accessed on 9 July 2022).
  9. ABB. Electrification of petroleum installations, Commercially justifiable and necessary for the climate. Available online: https://library.e.abb.com/public/1239733f013ac1c485257ddc004d0246/PT0147%20BR%20ABB%20og%20elektrifisering_A4_engelsk_3mm.pdf (accessed on 9 July 2022).
  10. Power Management Options for Offshore Oil and Gas Rigs. Available online: https://www.wpowerproducts.com/new-s/how-to-power-offshore-oil-rigs/#:~:text=The%2-0most%20common%20way%20to,use%20of%20diesel%2Dpowered%20generators.&text=As%20such%2C%20the%20generators%20that,wind%20that%20are%20present%20offshore (accessed on 9 July 2022).
  11. Kausche, M.; Adam, F.; Dalhaus, F.; Grosmann, J. Floating offshore wind—Economic and ecological challenges of a TLP solution. Renew. Energy 2018, 128, 270–280. [Google Scholar] [CrossRef]
  12. Butterfield, S.; Musial, W.; Jonkman, J.; Sclavounos, P. Engineering Challenges for Floating Offshore Wind Turbines. In Proceedings of the 2005 Copenhagen Offshore Wind Conference, Copenhagen, Denmark, 26–28 October 2005. [Google Scholar]
  13. Musial, W.; Butterfield, S.; Boone, A. Feasibility of Floating Platform Systems for Wind Turbines. In Proceedings of the ASME Wind Energy Symposium, Reno, NV, USA, 5–8 January 2004. [Google Scholar]
  14. Paul, D.S. Dynamic Simulations of Deep Water Floating Offshore Wind Turbine Concepts. In Proceedings of the IEA Workshop on Deepwater Offshore Turbine Modeling Needs Riso National Laboratories, MA, USA, 13–14 January 2005. [Google Scholar]
  15. Adam, F.; Myland, T.; Schuldt, B.; Großmann, J.; Dahlhaus, F. Evaluation of internal force superposition on a TLP for wind turbines. Renew. Energy 2014, 71, 271–275. [Google Scholar] [CrossRef]
  16. Oceanweather. Available online: https://www.oceanweather-.com/metocean/seafine/index.html (accessed on 9 July 2022).
  17. Albani, A.; Ibrahim, M.Z. Wind Energy Potential and Power Law Indexes Assessment for Selected Near-Coastal Sites in Malaysia. Energies 2017, 10, 307. [Google Scholar] [CrossRef] [Green Version]
  18. IEC 61400-1; Wind Turbines—Design Requirements. IEC: Geneva, Switzerland, 2014.
  19. Wind Shear Exponent Value. Available online: https://en.wikipedia.-org/wiki/Wind_profile_power_law (accessed on 9 July 2022).
  20. Chang, T.P. Estimation of wind energy potential using different probability density functions. Appl. Energy 2011, 88, 1848–1856. [Google Scholar] [CrossRef]
  21. IEC 61400-12-1; Wind Turbines—Part 12-1: Power Performance Measurements of Electricity Producing wind Turbines. IEC: Geneva, Switzerland, 2017.
  22. Capacity Factor. Available online: https://en.wikipedia.org/wiki/Capacity_factor (accessed on 9 July 2022).
  23. McNamara, B. Challenges for Hybrid Renewable Energy Systems. 2012. Available online: http://ecolo.org/documents/documents_in_english/Renewable-Challenges-EFN-UK-I.pdf (accessed on 9 July 2022).
  24. DOE Office of Indian Energy. Levelised Cost of Energy. Available online: https://www.energy.gov/sites/prod/files/2015/08/f25/LCOE.pdf (accessed on 9 July 2022).
  25. Nor, S.M. Petroleum Fiscal Regime—Malaysia’s Experience. In Proceedings of the Natural Resource Taxation in the Asia-Pacific Region. A Forum on the Design, Implementation and Evaluation of Fiscal Regimes for Extractive Industries, Jakarta, Indonesia, 11–13 August 2015. [Google Scholar]
Figure 1. Conventional power generation concept.
Jmse 10 00963 g001
Figure 2. GICON®-TLP.
Jmse 10 00963 g002
Figure 3. Hybrid power generation concept.
Jmse 10 00963 g003
Figure 4. Comparison between hindcast and measured windspeeds.
Jmse 10 00963 g004
Figure 5. Field 5 wind profile.
Jmse 10 00963 g005
Figure 6. Brownfield-lifecycle cost.
Jmse 10 00963 g006
Figure 7. Greenfield-lifecycle cost.
Jmse 10 00963 g007
Figure 8. Greenfield vs brownfield-discounted cumulative cashflow.
Jmse 10 00963 g008
Figure 9. Sensitivity analysis-graphical illustration.
Jmse 10 00963 g009
Table 1. Wind turbine parameters.
ParametersUnitValue
Rotor diameterm155
Turbine heightm187.5
Hub heightm110
Tower heightm90
Swept aream218,877
Rated powerMW5
Design lifetimea25
Cut in speedm/s2.5
Cut off speedm/s21
Rated speedm/s11
Table 2. Weibull and AEP analysis.
WindspeedPower CurveWeibull Cumulative Distribution Function (CDF)Weibull Power Distribution FrequencyPower Generated
[m/s][kW][%][%][MWh/a]
101.68%1.68%-
2.55710.07%8.39%-
310914.18%4.10%30
429323.80%9.62%169
559434.60%10.80%420
6103845.74%11.15%797
7164756.49%10.75%1264
8241366.28%9.78%1740
9323474.74%8.46%2092
10407281.70%6.97%2230
11500087.19%5.49%2181
12500091.33%4.14%1814
13500094.33%3.00%1313
14500096.42%2.08%913
15500097.81%1.39%610
16500098.71%0.90%393
17500099.26%0.55%243
18500099.59%0.33%145
19500099.78%0.19%83
20500099.89%0.11%46
21500099.94%0.06%25
Total99.94%16,507
Table 3. AEP probability values.
ProbabilityAEP, MWh/a
P5016,507
P7015,209
P7514,837
P8014,423
P9013,334
Table 4. Capital allowance.
Capital AllowanceGTGWT
Initial Allowance20%40%
Annual Allowance8%20%
Table 5. LCOE cost breakdown.
Cost BreakdownGTG OnlyHybridWT Only
Description3 GTG2 GTG1 WT1 WT
AEP, MWh41,40039,79316,50716,507
Discounted CAPEX, USD Mil74,445,70083,192,34819,761,500
Discounted OPEX, USD Mil36,943,02226,799,7077,139,706
Discounted Revenue, USD Mil (22,932,536)
Discounted AEP, USD Mil407,606407,606162,524
LCOE, USD/Mwh273.28213.59165.52
Percentage improvementBase22%39%
Table 6. Sensitivity analysis.
NoCasesIncremental NPV7, USD MilComparison Incremental NPV7, %Payback Period, Years
1Base18.79Base5
2High AEP22.4519%5
3Low AEP15.28−19%7
4High CAPEX16.10−14%8
5Low CAPEX21.4814%4
6High OPEX18.00−4%6
7Low OPEX19.584%5
Publisher’s Note: MDPI stays neutral with regard to jurisdictional claims in published maps and institutional affiliations.

