1. Introduction
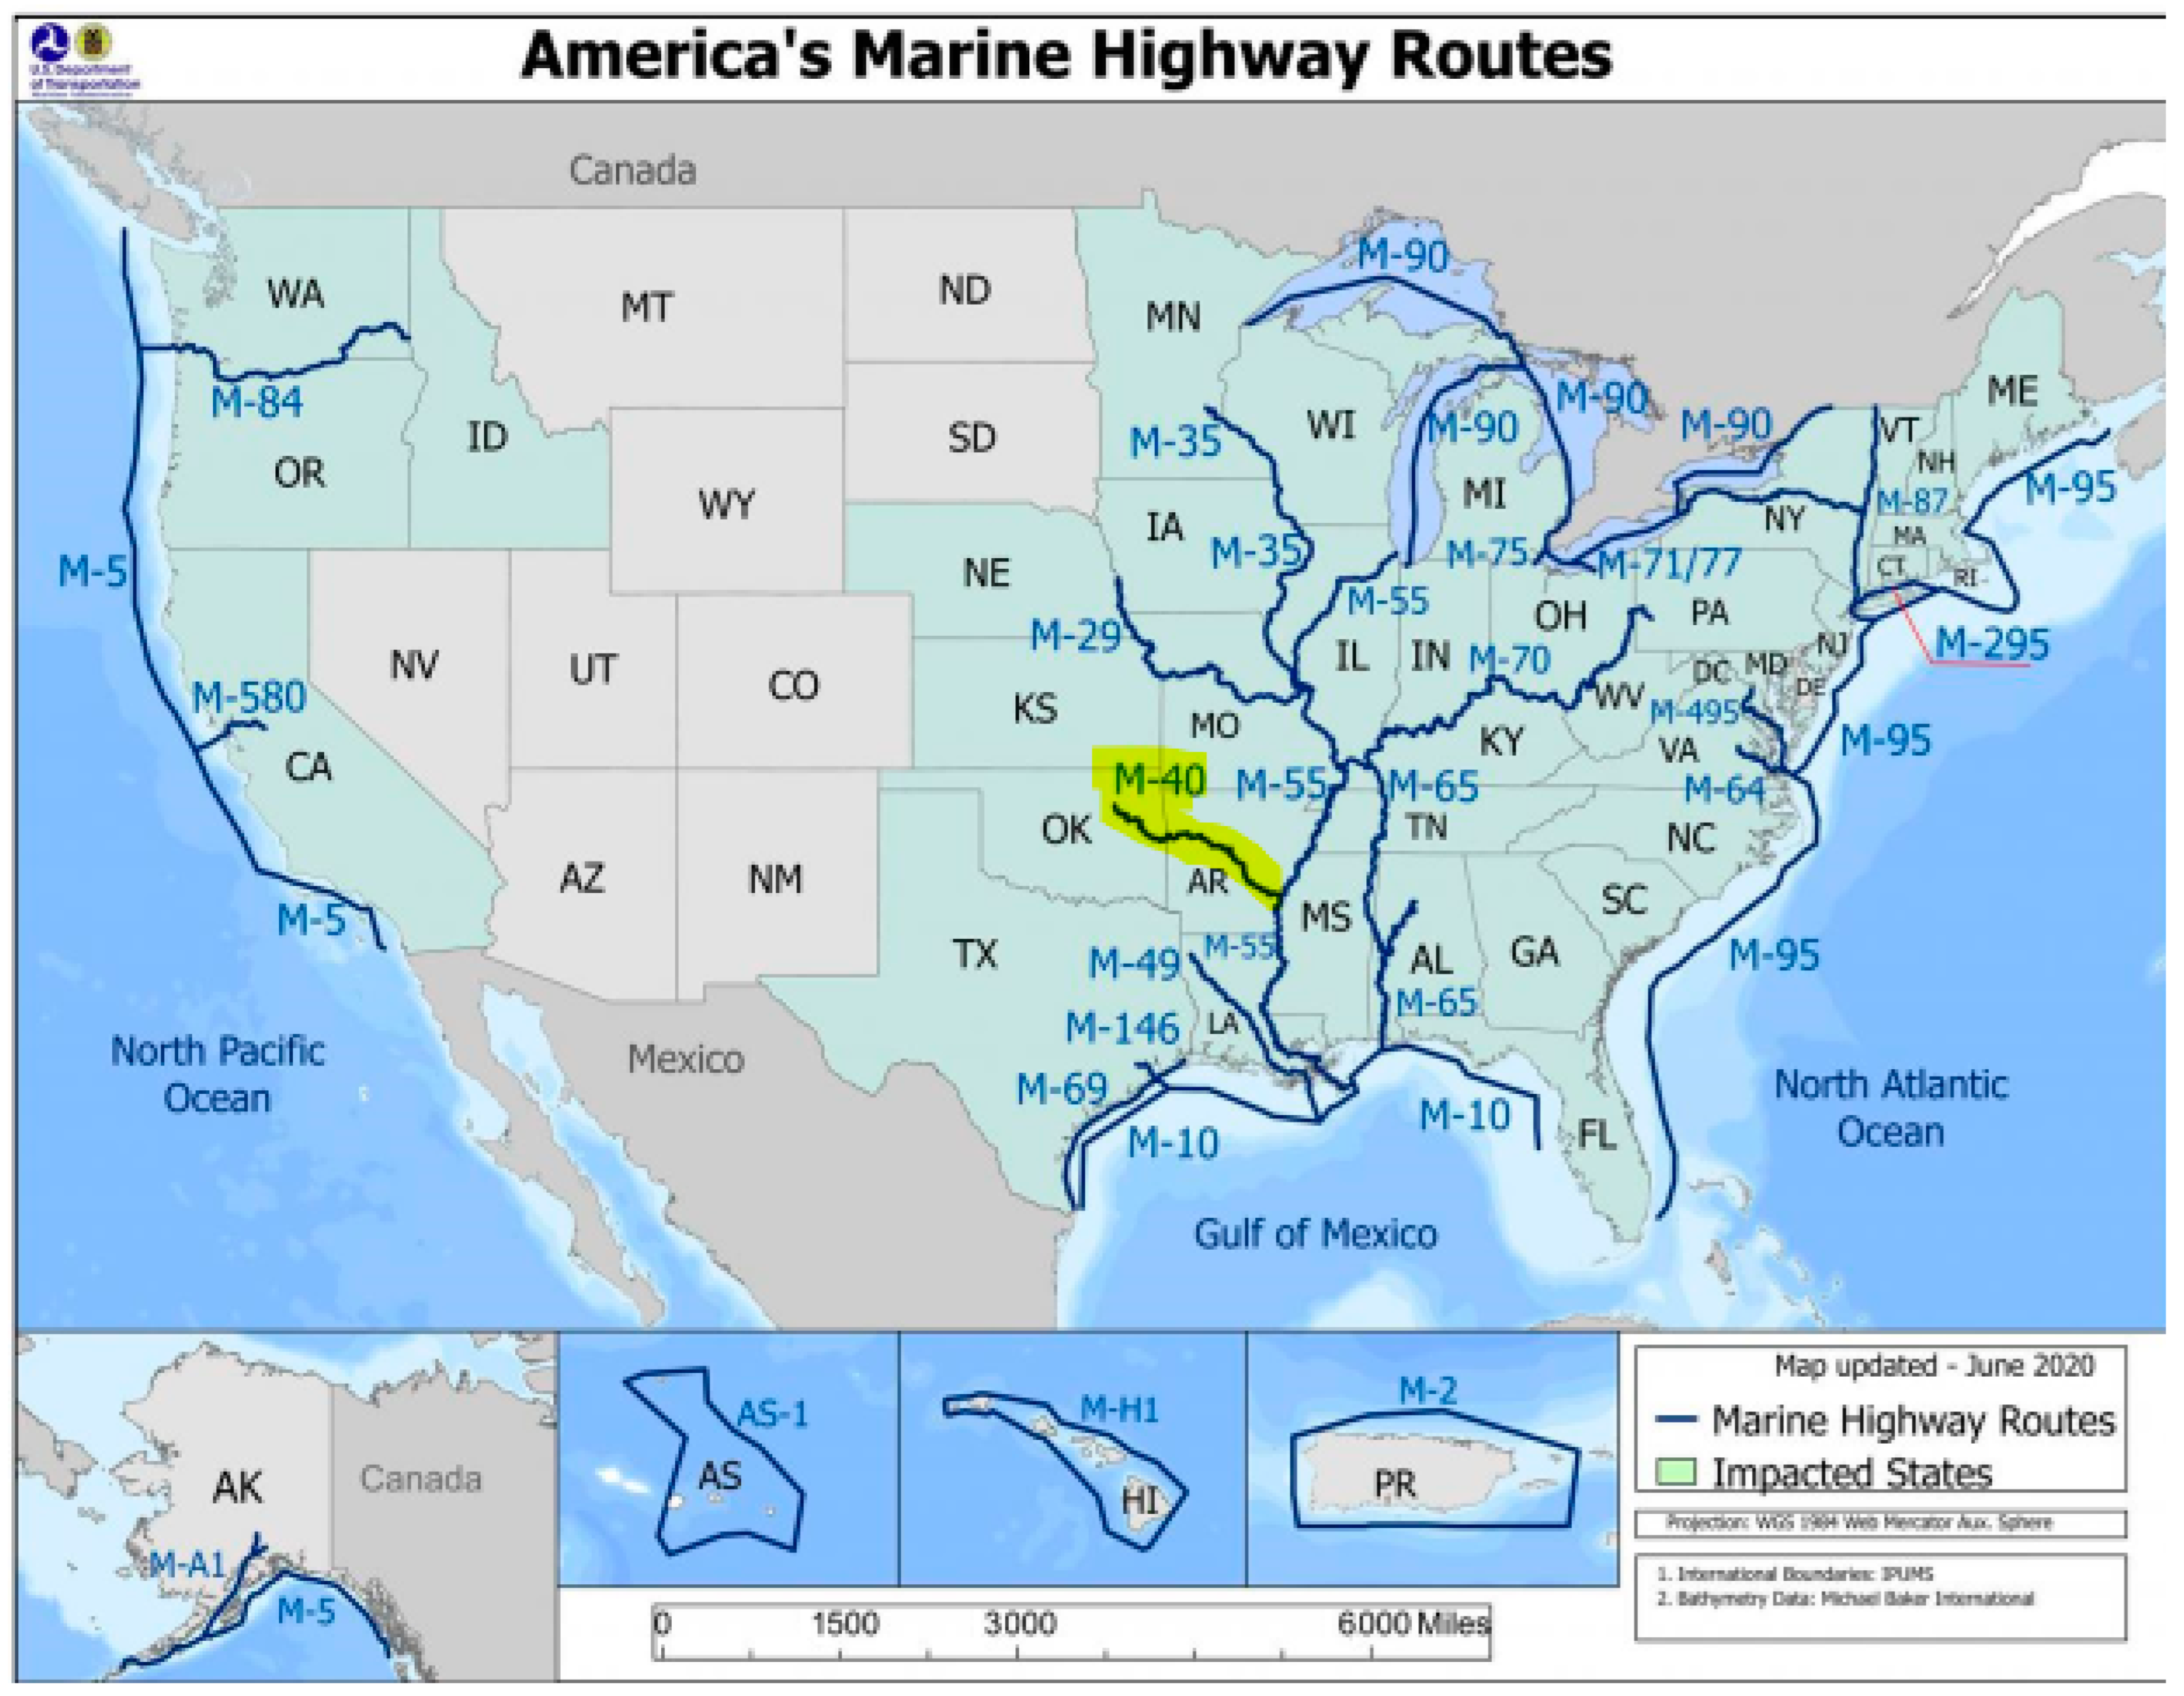
The inland waterway transportation system (IWTS) of the U.S. moves freight via 12,000 miles of inland waterways and 11,000 miles of intracoastal waterways (
Figure 1) [
1]. This waterway system secures benefits for both the consumers and the producers in different sectors of U.S. industry, including construction materials, petroleum products, agriculture, etc. [
2]. The IWTS transports around 830 million tons of cargo and supports more than half a million jobs annually [
3]. The MKARNS is one of the United States’ IWTSs, connecting the heartland to the Gulf Coast. With access to the nation’s interstate highway system and railroads, it has a significant economic impact on both the region and the country. Despite the importance of MKARNS, a lack of capital investment over decades has led to severe system inefficiencies and failures, billions of dollars of economic damage, and the loss of thousands of jobs. To better understand the economic implications of these effects for the future, we utilized a state-of-the-art multimethod simulation model, the MarTranS, to study several scenarios including Panama Canal expansion, channel deepening, port investments, and lock/dam investments.
The MKARNS, or M-40, highlighted in
Figure 1, is a 445-mile inland waterways navigation system originating from the Tulsa Port of Catoosa [
4]. There is a 420-foot drop in elevation from there to the Mississippi River. A series of eighteen locks and dams work together to maintain navigation throughout the system [
5]. The system provides sustainable freight transportation by decreasing air emissions and reducing accidents, which tend to occur at a higher rate in rail and truck transportation [
6].
Millions of tons of freight valued at billions of dollars are transported annually via the MKARNS. These commodities include iron and steel; chemical fertilizer; petroleum products; coal and coke; sand, gravel, and rock; grains; forest products/minerals; and manufactured equipment and machinery [
4]. In addition, the MKARNS provides a variety of ancillary benefits, including flood protection, power generation, recreation, a water supply, and habitat for fish and wildlife [
8].
Due to its aging infrastructure, measuring the economic impacts of the MKARNS is necessary to better understand its current and future operations. Most of the locks and dams, one of the important components of the system, were built over 50 years ago. The MKARNS infrastructure recently received a condition indicator of D+ [
9]. A D means that the infrastructure is at the end of its life cycle and that there is a significant risk of system failure [
9]. Based on historical data, 90% of the locks and dams have experienced some type of unscheduled delay in recent years. As a result, the economic cost to the regional economy is considerable. No recent national metrics exist for the cost of delays; however, the U.S. Army Corps of Engineers (USACE) estimated 25 years ago that the cost of a delay was about USD 300–400 per hour, based on a 15-barge tow pushed by a 2200–4400 horsepower towboat [
10]. Therefore, this aging and potentially unreliable system could become a financial liability to the industries that rely on the inland waterways to move their products [
11].
To illustrate the importance of the MKARNS to the regional and national economy, comprehensive modeling techniques are required that accurately represent the complex relationships among the system components. Therefore, for this study, the Maritime Transportation Simulator (MarTranS) [
12] was used to model the relationships among the MKARNS system components and to predict the economic impact of future investment scenarios. The scenarios investigated included normal operations without additional investment (the base scenario); three investment scenarios involving the deepening of the navigation channel, port expansion, and lock/dam rehabilitation; and a demand-change scenario of impacts from the Panama Canal expansion.
The findings of this study reveal that the economic impact of the MKARNS is not sustainable in the long term without future investments in lock and dam infrastructure. This research can help transportation decision makers gain a better understanding of the performance of the system components. The findings of this research help transportation agencies to prioritize future investment based on available funds. As revealed through our literature review, the MarTranS is the only comprehensive model that integrates multiple simulation approaches, system dynamics, agent-based modeling, and discrete event simulation to model the economic impacts of maritime transportation systems. Our study fills a gap in the research that deals with maritime transportation scenarios by considering navigation channel deepening, port investment, lock/dam investment, and Panama Canal expansion, with the aim of helping maritime authorities make informed decisions that can lead to an increase in long-term total employment and positive economic impacts.
This paper is organized as follows: The first section provides an introduction to the IWTS. The second section presents an overview of the literature on its economic impacts and the potential for investing in the MKARNS, as well as on existing approaches, and discusses the shortfalls of the cited studies.
Section 3 outlines the methodological approach of this study.
Section 4 explains the data analysis and simulation results and analyzes the investment decisions.
Section 5 discusses the results of the simulation analysis. The last section offers suggestions for further study.
2. Literature
Inland waterway transportation offers the advantage of freight movement and has been an active field of empirical research ([
13,
14]). However, its economic impacts and potential investment scenarios have received limited attention in the literature. Some prior research has focused on the economic effects of disruptions. For instance, Oztanriseven and Nachtmann [
15] developed a Monte Carlo simulation method to estimate the potential economic impacts of the MKARNS, and the results helped system stakeholders to increase their preparedness and reduce potential economic losses. Pant, Barker, and Landers [
16] developed a dynamic framework to assess multi-regional and multi-industry losses due to disruptions in MKARNS ports and waterway links. They examined simulation-driven disruption scenarios, such as dock closures, that affect daily commerce across the waterway network and integrated them with a dynamic interdependency model to quantify the effects of disruptions on industry inoperability across multiple regions and multiple industries. Their resulting dock-specific, industry-specific, and region-specific insights can guide preparedness decision making.
In a simulation study MacKenzie, Barker, and Grant (2012) evaluated the economic impacts of MKARNS’s port closures using an input-output model. The results reveal that a short-term port closure could lead to a billion dollars in lost production. In addition, they indicate that Arkansas ports directly and indirectly contribute to the economic growth of the state, including its economic value, earnings, and employment, and the findings show that the utilization of the waterways is linked to the economic prosperity of Arkansas [
17].
In order to inform waterway stakeholders of the value of the system, Boudhoum, Oztanriseven, and Nachtmann [
18] evaluated the regional economic impacts of the MKARNS in terms of hydropower energy generation, USACE operation and maintenance expenditures, private sector investment expenditures, port activity, shipping activity, transportation cost savings, and recreation benefits.
Only a few scholars have used multimethod simulation models to study the economic impacts of maritime transportation systems. Elbert et al. [
19] integrated agent-based modeling with discrete-event simulation to study container ports between Hamburg and Le Havre. They illustrated how price inelasticity at these ports could result in higher intermodal rates. In another study, by Silva et al. [
20], system dynamics and agent-based modeling were combined to better understand the relationship between ocean carriers and manufacturing companies. The authors used system dynamics to address the aggregate view while integrating agent-based modeling to model agent interactions and decisions. Darabi et al. [
21] integrated system dynamics with agent-based simulation to model shipments and ports, while employing system dynamics to integrate other modes of transportation. They did not provide an application of their integrated model, but they claimed that their model could be applied to a variety of scenarios, including scenarios involving supply and demand changes, as well as system disruptions. Even though the number of hybrid simulation models is growing rapidly, their application to operational research is still very limited [
22]. The majority of studies of this type integrate system dynamics with discrete-event simulation [
22].
This review of the literature indicates that measuring the economic impacts of the MKARNS in light of different scenarios is crucial to identifying system bottlenecks and to assisting with decision making. This study remedies gaps in the literature on investment decisions concerning ways to improve the performance of the MKARNS and increase its economic impact. The results can be implemented by transportation agencies in their decision-making processes to better prioritize which MKARNS components should be addressed first.
3. Methodology
The MKARNS consists of ports, locks and dams, and navigation channels. These components affect the performance and efficiency of the system. The Maritime Transportation Simulator (MarTranS) [
12] was the simulator selected for this study; it is a hybrid model that integrates agent-based modeling, discrete-event simulation, system dynamics, and multiregional input-output analysis. It was used in this case to evaluate the relationships between IWTS components and their associated economic impacts in order to support more informed decisions that could increase economic benefits. Historical data on the system, such as the processing time of each lock and dam, the number of scheduled unavailabilities, time per scheduled unavailability, travel times, demand, and average commodity flow values were used to predict and simulate the future performance of the system. An improved understanding of these relationships is critical to the assessment of risk reduction. Additionally, understanding the economic impacts associated with MKARNS operations can help maritime stakeholders make better capital investment decisions relating to the system infrastructure. We limited our case study to publicly available data. AnyLogic software was utilized to run the simulation model.
The MarTranS consists of three sub-models, as illustrated in
Figure 2. These models run system dynamics (color-coded orange), agent-based (color-coded yellow), and discrete-event simulations (color-coded blue). The agent-based sub-model connects the system dynamics and discrete-event simulation sub-models by routing the agents and commodity shipments. The input parameters are investments (in dollars), demand changes (in tonnage), and IWTS disruptions (in days). In the model, available budget funds can be invested in ports, locks/dams, and/or navigation channels. Since investment amounts can be set by the decision makers, they are defined as endogenous variables. Demand changes and system disruptions are considered exogenous variables since there is little or no control over these variables by the model users or decision makers. Both endogenous and exogenous variables impact the parameters of the discrete event simulation model, including port processing times, lockage times, lock scheduled and unscheduled unavailability, and transportation times [
12].
Commodities transported via the MKARNS are grouped into four categories:
Dry cargo: (1) iron and steel and (2) manufacturing equipment/machinery
Dry bulk: (1) chemical fertilizer, (2) coal and coke, (3) sand/gravel and rock, and (4) minerals and building materials
Liquid bulk: (1) other chemicals and (2) petroleum products
Grain: (1) wheat, (2) soybeans, and (3) food/farm products.
To evaluate the performance of the MKARNS, the model initially focused on economic impacts under normal operations over a fifty-year study timeframe to account for long-term impacts. Furthermore, analyses of real-world scenarios were conducted to examine the economic impacts of MKARNS. These scenarios were as follows:
Base scenario: In this scenario, the system infrastructure remains unchanged and no investments in improvements are made. It is assumed that lock/dam disruptions, due to scheduled and unscheduled unavailabilities, will continue throughout the entire time frame of the study. These disruptions are based on trends observed in the historical disruption records. Additionally, it is assumed that the Panama Canal expansion will have no impact on the MKARNS, and no investments will be made in the MKARNS infrastructure, such as in ports, locks/dams, and the navigation channel.
Investment scenarios: The MKARNS was officially dedicated 5 June 1971, by former President Richard Nixon [
4], and like many inland waterways in the U.S., due to a lack of available funding, it suffers from limited investment in its aging infrastructure [
23]. Thus, potential investment scenarios were investigated and analyzed, and their economic outcomes were compared. To get a clear picture of economic outcomes, three investment scenarios were modeled in MarTranS:
Channel deepening: The first scenario involved investing in the navigation channel to increase the channel depth from nine to twelve feet (9′ to 12′). This investment strategy was approved by the U.S. Congress in 2004, with a projected cost of USD 183 million, but the funds were never appropriated [
2]. It is estimated that under this plan, the current capacity of 1500 short tons would increase by 200 tons per each additional foot of draft ([
24,
25]). This would enable barges to carry more weight (an extra 600 tons), which would result in a reduction of costs for customers. Moreover, the MKARNS would be a more competitive option in comparison with inland rivers, which would eventually result in the further economic growth of the region.
Port investment: The second investment scenario involved investing in the congested ports. Different modes of transportation, including barge, train, and truck transportation, connect in inland waterway ports. It is estimated that about 40% of U.S. waterway commerce, corresponding to one billion tons of cargo, traverses inland ports. Therefore, these ports are considered hubs that play an important role in the U.S. economy [
26]. A performance measure examined in the port investment model is the port utilization rate, which is measured as the average percentage of time for which a port operates in a given year. In this study, a dock in a port was considered congested if its utilization rate exceeded 80% of the utilization rate in the base scenario.
Lock and dam investment: The third investment scenario involved investing in critical locks/dams. Regular shutdowns of aging locks caused by maintenance requirements can lead to increased delays in the system, as well as problems with vessel traffic. The average delay per lockage was 64 min in 2000, which increased to 121 min by 2014 [
11]. These delays in the IWTS reveal the importance of investing in locks and dams. The performance measure examined in the lock and dam investment model is lock and dam utilization, which is measured as the average percentage of time for which locks and dams operate in a given year. A lock/dam is defined as critical if its utilization rate exceeds 80%.
Demand change due to the Panama Canal expansion: The Panama Canal serves 14,000 vessels and connects 1700 ports annually in more than 160 countries [
16]. The canal expansion is expected to double the current capacity of the canal and have an economic impact on the Mississippi River system and the IWTS. In this scenario, demand increases annually at a rate of three percent, due to the Panama Canal expansion [
27].
4. Results
The results of the real-world scenario analyses conducted via MarTranS to examine the economic impacts of the IWTS are discussed in this section. Four performance measures—GDP, employment, commodity flow, and port utilization—were evaluated. For each scenario, these performance measures were evaluated against the ones in the base scenario.
4.1. Base Scenario
Table 1 presents the results of the four selected performance measures (GDP, employment, commodity flows, and port utilization) for this scenario. It can be observed that the net present value (NPV) of the GDP is USD 67.4 billion for the fifty-year study period. Correspondingly, on average, 33,074 jobs would be generated every year, directly or indirectly, due to MKARNS maritime activities. On average, over 4.4 million tons of commodity flow per year would be generated, based on the simulation runs.
Another performance measure examined in the model was port utilization, which was measured as the average percentage of time that a port operates in a given year. The port utilization values for all commodities are shown in
Figure 3 (the port codes can be found in
Appendix A). In the model results, dry cargo and grain ports have the highest utilization rates. As shown in
Figure 3, some ports experience a higher rate of utilization. For instance, five dry cargo ports and one grain port exceed the port utilization rate of 80%. The dry cargo ports are (1) the Tulsa Port of Catoosa, (2) Johnston’s Port 33 (Oakley), (3) the Port of Muskogee, (4) the Port of Dardanelle, and (5) the Port of Pine Bluff; the grain port is the Port of Dardanelle. The dry bulk and liquid bulk ports do not even reach a 60% utilization rate, due to their excess capacity. High utilization rates increased transportation delays and costs; therefore, the high utilization rates of these ports indicate a need to make port rehabilitation and expansion investments a high priority. The average port utilization rate for all commodities is 51%.
Figure 4 presents the percentage of full utilization for all 18 locks/dams in the MKARNS over 50 years (the lock and dam codes can be found in
Appendix B). In 2020, all the locks are projected to have a utilization rate of less than 80%; however, due to scheduled and unscheduled unavailability disruptions, utilization rates will increase over the fifty-year study time frame. It can be observed that Lock 5 (Colonel Charles D. M.), Lock 2 (Arkansas), and Lock 10 (Dardanelle) reach utilization rates above 90%, and Lock 13 (James W. Trimble) and Lock 22 (Robert C. Byrd) reach utilization rates above 80%. These high utilization rates indicate the need for a high priority for investing in rehabilitation to decrease lock delays.
4.2. Channel Deepening
It can be observed from
Table 1 that the NPV of the GDP economic impacts is USD 86.2 billion for the fifty-year study period. The total GDP impact in this scenario in 50 years is 28% higher than that of the base scenario (at USD 67 billion). Correspondingly, on average, 41,669 jobs would be generated every year, directly or indirectly, due to maritime activities related to the MKARNS. The total job creation is 26% higher than that in the base scenario, and the total flow of commodities is 14% higher than the flow in the base scenario. The average port utilization rate is 11% higher. Due to the increase in commodity flow due to the channel deepening, the port utilization rate is increased in this scenario.
With the increase in depth of the navigation channel, barges can carry an extra 600 tons of commodities. It can be deduced from a comparison of the base scenario with the channel-deepening scenario that deepening the MKARNS channel would generate a greater economic impact.
4.3. Port Investment
In this scenario, investment in the six port docks that have a utilization rate of 80% or higher (based on the base scenario simulation) is analyzed. Five of these docks handle dry cargo, and the other one is devoted to grain cargos. Since the dry bulk and liquid bulk docks in the MKARNS did not exceed an 80% utilization rate, investment in these docks was not considered. The dry cargo docks are (1) the Tulsa Port of Catoosa, (2) Johnston’s Port 33 (Oakley), (3) the Port of Muskogee, (4) the Port of Dardanelle, and (5) the Port of Pine Bluff; the grain port is the Port of Dardanelle. The dry and liquid bulk ports do not even reach a 60% utilization rate, due to their excess capacity.
In the scenario, the capacity of the congested docks was doubled. The cost of these expansion projects for each ton-per-day of cargo-handling capacity was calculated based on past port investments and commodity flows. This cost is associated with expenditures for structure and equipment and was calculated as USD 27.28 for dry cargo and USD 35.50 for grain dock. The annual total cost for these port expansion investments was calculated to be USD 171.9 million.
The results presented in
Table 1 show that the NPV of the GDP economic impacts is USD 69.7 billion for the fifty-year study period. The total GDP impact in this scenario is 3% higher than the base scenario. Correspondingly, on average, 36,695 jobs would be created every year, directly or indirectly, due to maritime activities related to the MKARNS, which is 11% higher than the total employment in the base scenario. According to the model outputs, the average port utilization rate in this scenario is 39%, which is 12% less than in the base scenario. The commodity flow is 3% less. In general, the findings of the port investment scenario show that investing in non-bottleneck infrastructures would not yield the same level of economic impact as investing in bottleneck system components. Since the economic impacts do not increase significantly due to investment in the MKARNS ports, it can be concluded that the ports are not the bottlenecks in the MKARNS. While the average port utilization decreased by 12% due to expanded port capacity, the limited improvement in the GDP, by USD 46 million every year over the base scenario, makes investing USD 171.9 million every year in port expansion an unfavorable decision.
4.4. Lock and Dam Investment
The results of the channel-deepening and port investment scenarios indicate that only limited improvement in the economic indicators can be attained. Moreover, lack of funding for lock/dam infrastructure is considered the biggest threat to the IWTS [
28]. To understand whether the MKARNS locks/dams are the bottlenecks in the system, a lock/dam investment scenario was conducted.
In this scenario, the critical locks/dams were selected as the investment targets. A lock/dam is defined as critical if it has a greater-than-80% utilization rate compared to the base scenario. In the base scenario, the congested locks/dams are Lock 13 (James W. Trimble), Lock 22 (Robert C. Byrd), Lock 5 (Colonel Charles D. M.), Lock 2 (Arkansas), and Lock 10 (Dardanelle). These congested locks/dams were the only ones considered for rehabilitation investments, in the amount of an average of USD 35 million per lock/dam, which means the total cost of rehabilitation investment in these five locks/dams would be approximately USD 175 million. Construction of a new lock/dam was not considered an option. This was due to the high cost of such a project, ranging from USD 126 to USD 252 million [
29]. Moreover, studies show that the life of a lock/dam can be extended by only 25 years with major rehabilitation. Consequently, it was assumed in our study that by investing in lock/dam rehabilitation, the lock/dam scheduled and unscheduled unavailabilities would be reduced by 100% in the first year with no reduction at the end of the twenty-fifth year, supposing that the reduction would decrease linearly every year.
In this scenario, the NPV of the GDP economic impacts is USD 115.5 billion for the fifty-year study period (
Table 1), which is 71% higher than the base scenario. Correspondingly, on average, 59,111 jobs would be generated every year, directly or indirectly, due to maritime activities related to the MKARNS. The total job creation in the lock and dam improvement scenario is 79% higher than in the base scenario. From the simulation results, it can be inferred that the total commodity flow would be 64% higher than that of the base scenario. It is also observed that average port utilization is 63%, which is 12% higher than the base scenario. This increase in the port utilization rate can be explained by the increase in the total flow of commodities. The results also indicate that investing in the rehabilitation of locks and dams would increase the GDP by USD 961.7 million every year over the base scenario GDP, making annual lock and dam maintenance investments of
$175 million a favorable decision.
4.5. The Scenario with Demand Change Due to the Panama Canal Expansion
Table 1 presents the results of the four selected performance measures. It can be observed that the NPV of the GDP economic impacts is
$68.6 billion for the fifty-year study period. This is 2% higher than in the base scenario. Correspondingly, on average, 33,162 jobs would be generated every year, directly or indirectly, due to maritime activities related to the MKARNS, which is equal to the number of jobs for the base scenario. The total commodity flow is 4% less than in the base scenario. It is also observed that the average port utilization is 62%, which is 11% higher than that of the base scenario.
It can be deduced from the comparison between the base scenario and the Panama Canal expansion scenario that the MKARNS would experience a slightly greater economic impact. Therefore, investing in the MKARNS infrastructure should be considered by the maritime transportation authorities in order to benefit more from the Panama Canal expansion.
5. Discussion
Based on the simulation results,
Figure 5 compares the predictions of the total economic impact on GDP for all the scenarios over the fifty years. These results validate the research hypothesis that a lack of future investment in the MKARNS infrastructure will result in a significant decline in the long-term economic impact of the MKARNS. This collapse would follow from congestion in the system due to component failures and a lack of investment in MKARNS infrastructure.
The results of the impact on GDP of all the scenarios explored in this study reveal that the dam investment scenario would generate the highest economic impact, followed by the channel-deepening and port investment scenarios, in descending order. All of the scenarios predict a collapse after a few years, albeit in the lock and dam investment scenario, the system can be expected to operate longer than in the others. Therefore, for future operations to continue, investing in the MKARNS is necessary, specifically for aging locks/dams, which are the most critical investment targets (
Figure 5). The main findings of our study are as follows:
On average, in all of the scenarios, about 70% of the economic impact is generated by dry cargo and dry bulk commodities, while about 70% of the flow consists of dry bulk and grain commodities. Therefore, MKARNS authorities may want to invest more in the infrastructure involved for dry cargo and dry bulk commodities to improve the total economic benefits.
Given that investment in critical lock/dams is not being considered by the MKARNS authorities, it appears that the generated economic impacts will start to fall sometime after 2025, followed by a collapse by 2040. However, to keep the MKARNS and its economic contributions sustainable, new lock/dam investments should be considered, due to the current age of the facilities. With an investment in critical locks and dams, the MKARNS would generate USD 115.5 billion in GDP over the fifty-year study period, and the life of the MKARNS increases by more than a decade.
In the scenarios, decisions to respond to the Panama Canal expansion, deepen channels, and invest in port improvements, without investing in critical locks/dams resulted in a limited (between 2% and 28%) improvement in economic gains. That is because several locks/dams are bottlenecks in the system. However, investing in channel deepening, congested ports, and critical locks/dams all together would reduce the negative economic impacts of delays and generate the greatest economic benefits.
In addition, the observed increase in average port utilization by more than 12%, as a result of lock/dam investment, urges a reconsideration of investments in both the navigation channel and congested ports, along with the lock/dam investment. Therefore, it can be seen that it would be informative to run a scenario to measure the economic impact of the MKARNS based on all the investments in inland waterway infrastructures, including deepening the navigation channel and freeing up the six congested ports and the five congested locks/dams. The analysis of the simulation with investments in all the IWTS components revealed that the NPV of the GDP economic impacts would be USD 148.9 billion for the fifty-year study period, which is 121% higher than in the base scenario. Correspondingly, on average, 79,983 jobs would be generated directly or indirectly due to maritime activities related to the MKARNS, which is 142% higher than in the base scenario. The total flow of commodities is this scenario is nine million tons, which is 121% higher than the total commodity flow in the base scenario. The average port utilization rate is 62%, which is 11% higher than the base scenario and which is related to the growth in commodity flow.
The results reveal that in this system-wide investment scenario, the system can be expected to operate longer. Therefore, for future operations to continue, investing in the MKARNS is necessary, specifically for the aging locks/dams, which are the most critical components.
6. Conclusions
The MKARNS, as a part of the inland waterway system, connects the heartland of the United States to the international maritime transportation system. The benefits of the MKARNS include flood control, hydropower generation, navigation, water supply, wildlife conservation, and recreation. Despite regularly scheduled (preventive) and unscheduled maintenance of the system, there are unavailabilities in the IWTS, which is not acceptable. The future success of the MKARNS depends on investments in its aging infrastructure. Investments in the system’s infrastructure are investments in sustaining the U.S. as a major player in the global market and in the long-term strength and security of the nation. Hence, evaluating the components of the system and identifying bottlenecks is important for guaranteeing long-term returns from the system.
In this study, the economic impacts of real-world scenarios on the MKARNS were investigated. The results are presented in terms of economic indicators: GDP, employment, commodity flows, and port utilization. Judging from a comprehensive review of the literature, there is no study that uses a comprehensive multimethod simulation model to measure the potential economic impacts of investment scenarios on the U.S. inland waterway systems. The results of the simulations conducted for this study can help decision makers better understand the performance of the system and make the best investment decisions.
The results of the analyses of the five scenarios show that the locks/dams in the MKARNS are the part of the infrastructure it is crucial to invest in, especially the five locks identified as critical. Investing in these locks/dams is shown to improve the impact on GDP by 70%. However, investing separately in deepening the navigation channel and freeing up congested ports resulted in GDP impact increases of 28% and 3%, respectively. Similarly, the economic impact of the Panama Canal expansion, with no investment in MKARNS infrastructure, resulted in only a 2% improvement of impact on GDP over the base scenario. In addition, to increase the total economic benefits, maritime authorities should consider the investments suggested by all of the scenarios, if the available budget is adequate. Otherwise, they should prioritize investing in the critical locks/dams.
This study included an application of the MarTranS, which integrates system dynamics, agent-based modeling, and discrete-event simulation with input-output models. Integrating these four modeling approaches enabled us to (1) study economic impacts holistically, based on different investment decisions, (2) allow shipments in the study area to interact, based on the expected system delays, (3) monitor operation-level improvements and inefficiencies, and (4) measure the indirect and induced economic impacts resulting from the direct economic impacts. Judging from our comprehensive literature review, this is the only maritime economic impact study that investigates Panama Canal expansion and explores different investment scenarios for ports, locks, and navigation channels separately and simultaneously, based on mode-of-transportation decisions and the price elasticities associated with different types of commodities.
For future work, it is advisable to develop a decision model to analyze the locks and dams (the bottlenecks in the system) and to enhance their performance. In addition, using optimization methods to determine the sequencing and scheduling of the rehabilitation and maintenance of the critical locks and dams is suggested. In addition, other types of disruptions for ports and lock and dams such as strikes, terrorist attacks, and natural disasters could be added to the scenarios.


