Article

Optimization of Container Shipping Network Reconfiguration under RCEP

1
Merchant Marine College, Shanghai Maritime University, Shanghai 201306, China
2
Institute of Logistics Science and Engineering, Shanghai Maritime University, Shanghai 201306, China
*
Author to whom correspondence should be addressed.
J. Mar. Sci. Eng. 2022, 10(7), 873; https://doi.org/10.3390/jmse10070873
Submission received: 31 May 2022 / Revised: 21 June 2022 / Accepted: 23 June 2022 / Published: 25 June 2022
(This article belongs to the Special Issue Sustainable Maritime Transportation Systems)

Abstract

:
Due to its advantages of large transportation volume and low transportation cost, container shipping has become an important transportation mode in current international trade. The recovery of the shipping industry in 2021 and the signing of RCEP make the reconfiguration and optimization of the container shipping network a very important task at present. The network service capability is an important factor affecting the container shipping network. Based on the complex network theory, the coefficients of port location, the importance of distance and route among ports are taken as the service capacity reconfiguration coefficients of the global container shipping network. A max-min mixed integer model is established for global container shipping network reconfiguration. A sort of communication-reducing conjugate gradient method based on Krylov Subspace (CR-CG-KS) is proposed to reduce the reconfiguration computation. The results show that the global container shipping network does not need large-scale reconfiguration but requires small-scale changes to optimize the network feature vector centrality and make the network more balanced and stable. This study is beneficial for business managers to proactively respond to the future development of the shipping network and improve the operational efficiency of the global container shipping network.

1. Introduction

Because of the advantages of high throughput, low costs and fewer access restrictions, maritime transportation accounts for more than 70% of global trade [1]. Container shipping has become an important mode of transportation mode with many advantages such as high security, high loading and unloading and high energy efficiency. Liner shipping operation is generally employed, that is, sailing according to a predetermined schedule and fixed routes, stopping at fixed ports, and carrying out international shipping at fixed freight rates. Affected by economic, political, policy and other factors, the container shipping network is constantly developing and changing.
Regional Comprehensive Economic Partnership (RCEP) is an agreement initiated by ASEAN (Association of Southeast Asian Nations) in 2012 and developed by 15 members, including China, Japan, Korea, Australia, New Zealand and ten ASEAN countries. The signing of RCEP marks the official departure of the most populous, largest economic and trade scale and most promising free trade area. On 1 January 2022, RCEP officially entered into force. As the largest free trade zone in effect in the world, RCEP can enhance the foreign trade competitiveness of member states, especially to promote trade among countries that have not signed bilateral free trade agreements. The signing of RCEP has also had a significant impact on the maritime industry. It will significantly promote the increase in container shipping between Chinese coastal ports and Japan, South Korea, ASEAN, Australia and New Zealand, reduce export costs, and further increase the proportion of near-ocean container routes [2]. Facing more and more frequent trade exchanges, reconfiguring and optimizing the global container shipping network is also a growing concern.
With the development of complex network theory, a wide range of transportation networks have been studied within the framework of complex networks, which are able to capture the interactions between the entities [3]. They demonstrate structure properties that are not evident when each component is considered independently [4]. For this reason, many scholars have studied different transportation modes from the perspective of complex networks in recent years. In aviation networks, Jia T. and Jiang B. [5] explored the U.S. airport model using complex network theory and classified airports according to various network metrics. Wang et al. [6] used a complex network approach to study the network structure and node centrality of cities in the Air Transportation Network of China (ATNC), and confirmed that centrality captures an important aspect of locational advantage in the ATNC and is important in shaping the spatial pattern of economic activity. LIN et al. [7] applied characteristics of nodes and edges to analyze and compare the relationship of urban traffic growth mechanisms, but there are no significant small-world characteristics in urban networks [8], which differs from shipping networks. Container shipping networks are large-scale networks consisting of many ports, routes, ships and other elements. They can also be understood as a complex structure, similarly to other transportation networks, consisting of a set of vertices (ports) connected by edges (routes) [9].
Seaports and shipping routes form the topology of the container shipping network [10]. The importance of topology in transportation modes has prompted many researchers to investigate and describe the structure and dynamics that make transportation a complex network [11]. Current research on maritime transportation networks has focused on the topology of the world’s maritime transportation networks, including degree distributions, clustering coefficients, and average shortest path lengths [12]. Meanwhile, the topological characteristics (such as number of lines, throughput, average degree, clustering coefficient, average distance, power law distribution index, and community) of the world ocean transportation network are compared with those of the sub-networks of container transportation, dry cargo transportation and oil transportation, respectively. There are also many studies on the weight distribution and seaport distance distribution of the world ocean transport network.
Connectivity is a basic concept in topology. In recent years, the interconnection levels of different infrastructure networks have been analyzed in various transportation networks such as railways, highways and shipping [13]. Container shipping is a typical liner shipping method, and the United Nations Conference on Trade and Development (UNCTAD) proposes the Liner Shipping Connectivity Index (LSCI) as the basis for evaluating the trade cost and competitiveness of various countries, which covers the following aspects: the number of ships expected to berth in a country per week, the designed throughput, the number of scheduled liner routes to and from the country, the number of liner companies providing services to and from the country, the average size of ships deployed on scheduled routes and the number of countries that trade directly with the country by sea via transshipment [14]. Therefore, the connectivity of the container shipping network can not only measure the liner connection index but also reflect the service capacity of the ports [15].
Since the introduction of the LSCI index, there has been an increasing amount of research on the connectivity of shipping networks. Among them, Pan et al. [16] showed that the global shipping network is represented by an unsigned Laplacian matrix, which could be decomposed to produce its eigenvectors and corresponding eigenvalues. The maximum gap among eigenvalues was then used to determine the optimal number of communities within the network. This efficient method identified major port communities and analyzed the network connectivity of the global shipping network according to the community structure.
However, understanding these structures is inherently more difficult due to their dynamic complexity [17], the evolution of the network [18], the diversity of connections [19] or the diversity of nodes. There is little research to enhance the properties of the ports and their links [20]. With the rapid development of the global economy, commodity characteristics and environmental factors will also affect shipping decisions [21]. We need to consider the status quo of the global economy to pay attention to the sustainable development of famous international organizations [22], carry out research on the connectivity and reconfiguration of container shipping networks, predict the next developments in maritime transport and make recommendations to the global maritime industry, and propose predictive implementation solutions for port decision-making.
In this paper, the impact of RCEP is focused on, and a new global container shipping network is established based on the complex network theory, which is more realistic and current. A new concept of future port expectations is proposed based on the existing expectations of ports, and the increase or decrease in port link expectations is calculated for the reconfiguration and optimization of global container ports. The applied complex network analysis provides insight into the operational and geographical dynamics of the ports participating in the container shipping network, helping lines and ports understand and measure their competitive position in the network [23].

2. Reconfiguration Model of Container Shipping Network

In the container shipping network, nodes correspond to ports with different specifics. Some ports have the advantages of being able to accommodate large ships, better geographical location, and higher route accessibility. We classify such ports as ports with high service capacity. Some ports are more remote with few direct connections, which are classified as ports with lower service capacity. However, after data analysis and literature research, it is found that the service capacity of many ports is significantly higher than the current demand. At the same time, due to the surge in trade demand, the service capacity of some ports cannot meet the transportation demand, and congestion often occurs. Therefore, the reconfiguration and optimization of the port service capability in the global container shipping network is a problem that needs to be considered.
Based on throughput, port location, distance among ports and route importance, this paper focuses on the port connection and port centrality to establish a large-scale sparse matrix linear system to realize the reconfiguration optimization of global container shipping network service capacity. A floating-point arithmetic model is established, and the optimization result of the model is measured by the largest eigenvalue of the weighted adjacency matrix. However, it would take a long time to solve the large sparse matrix, which is the bottleneck in the calculation of the port service capacity of the entire shipping network. A communication-reducing conjugate gradient method based on Krylov Subspace (CR-CG-KS) is put forward to quickly calculate the reconfiguration of shipping network service capabilities. At the same time, the service capacity reconfiguration coefficient of the global container shipping network is designed to facilitate the decision and selection for the service capacity reconfiguration optimization of global container ports, and the eigenvector centrality is used to measure the performance of reconfiguration optimization.

2.1. Container Shipping Network Model Construction

The container shipping network is a relatively complex stochastic system, and there are many factors affecting the network operation efficiency. These influencing factors will interact with each other, thus having an extremely far-reaching impact on the shipping network. The following assumptions are made for the model:
(1)
The service capacity and efficiency of different ports are the same, and the price competition between ports is not considered.
(2)
Only the conventional container transportation network is considered, and the interference of factors such as random events is not considered.
(3)
The container vessels deployed on the route are all regular operating vessels of the world fleet at this stage, and the number of vessels is sufficient.
(4)
The distance calculation only considers the straight-line distance between two ports, without considering some passing terminals.
(5)
The fuel cost does not consider gaps among them and is calculated only on the global average fuel price.
Consider a container transportation network, in which V is the set of ports, E is the set of links, and W is a vector of link weights representing the link frequency. A is the weighted adjacency matrix of the network, and each element of A can be expressed as:
a i j = w e ,   if   e = i , j E 0 ,   otherwise  
where w e = a i j , and both a i j and a j i are the sailing frequency between ports i and j . In this paper, if there is a container route from port i to port j , the link is a directional one-way link. That means the container shipping network cannot be seen as a symmetrical net. Let D be the degree matrix:
D = j V a i j i V   when   i = j             0   otherwise   i , j V
L is the Laplacian for the container shipping network G :
L = D A
In this model, the largest eigenvalue of the frequency-weighted adjacency matrix is the node-weighted average link frequency. Thus, the largest eigenvalue can be used as a measure of network connectivity with the same units as the elements of the adjacency matrix. The eigenvector, which corresponds to the largest eigenvalue of a non-negative adjacency matrix with a unit criterion, is denoted as the “principal eigenvector” in this paper. In addition, this study does not require the adjacency matrix to be symmetric, as the world container transport network is highly asymmetric.
It is well known that connecting two nodes bidirectionally can ensure strong connectivity of the network. In this paper, we aim to improve the network connectivity by adding links frequency among hub ports or among ports located in RCEP or among hub ports and ports located in the RCEP. The key notations are shown in Table 1.

2.2. Container Port Service Capability

2.2.1. Importance Evaluation of Container Ports Based on Location

In addition to the impact of port throughput, we also consider both the hub ports and the ports covered by the RCEP:
w Q = Q i j = i j q i j + i j k q i j x k R + i j k q i j x k H

2.2.2. Cost-Based Importance Evaluation of Container Ports

The fuel cost is the major component of the ship operating cost. For the transportation cost, we mainly consider the fuel cost, which is proportional to the oceanic distance. Distances between nodes are calculated in Equation (5) by latitude and longitude coordinates: A α 1 , β 1 and B α 2 , β 2 , where r = 6371.004 km.
D I S A B = r arccos cos β 1 cos β 2 cos α 1 α 2 + sin β 1 β 2
When the conventional sea route is used for shipping containers, the cost for transporting one TEU container can be described as:
w T = T i j = i j O i j D I S i j

2.2.3. Importance Evaluation of Container Shipping Routes

Suppose that the container shipping network consists of x routes and y ports on the target transport route. Then, the importance of each link on that route can be calculated as the number of routes including this link:
w F = i j R O U i j C M K
The Borda Count is a single-winner election method. In the Borda Count method, voters rank candidates in descending order of preference, giving each candidate a certain score based on the total number of candidates involved, and ultimately each candidate is selected as the winner based on the total score received from all voters. Because the method tends to select the option that is widely accepted by voters rather than the one preferred by the majority, Borda Count is often described as a consensus-based voting system rather than a majority–minority voting system. The method provides a reasonable way to integrate the evaluation results of the various weighting indicators by avoiding result bias caused by decision makers’ personal preferences. In the importance ranking of container ports, the various indicators can be treated as voters and the ports as candidates. Then the ranking of the ports obtained according to the different centrality indicators can be calculated for each port based on the following equation.
S Q i = n Rank Q i + 1 S T i = n Rank T i + 1 S F i = n Rank F i + 1
where n denotes the total number of ports in the sample network. S Q i , S T i and S F i represent the scores of ports based on corresponding ranking, respectively.
Based on these scores, we can derive the combined centrality score of port i as follows:
S o i = w Q i S Q i + w T i S T i + w F i S F i
where S o i represents the composite score of port i. w Q i , w T i   and   w F i denote the ranking of port i in the sample network based on throughput capacity, transportation cost and route importance, respectively. The weights are determined by the throughput capacity, transportation cost and route importance, respectively.

2.3. Mathematical Model

From Section 2.2, A is an n × n Hermitian matrix. The Rayleigh quotient RA is:
R A X = A x , x x , x
Let Uk denote a subspace of dimension nk + 1. By checking the dimensionality, it can be known that the intersection of span{U1, …, Uk} and the subspace Un-k+1 is not zero. Therefore, there exists a vector v at this intersection:
v = i = k n α i u i
Its Rayleigh quotient is
R A v = i = k n λ i α i 2 i = k n α i 2 λ k
Hence,
              m i n R A x x U k λ k
Since this is true for all subspace U, we can conclude that
m i n m a x R A x x U   and   x 0 dim U = k λ k
Therefore, the largest eigenvalue can be regarded as the node-weighted average link frequency. Eigenvector centrality, i.e., the largest eigenvalue and its associated eigenvectors, is our chosen criterion to measure the connectivity of the container shipping network.
In the whole process of service capability reconfiguration analysis, A is the weighted adjacency matrix of the global container shipping network, and the weight is set to the frequency of anchoring and service capability. For the operation of the matrix, we use the standard floating-point operation method.
f A x = A x + δ   with   δ ε A x + A x
where ε is the unit rounding of the machine.
Most liner optimization models of container shipping are mixed-integer models [24,25]. By analyzing the frequency-weighted adjacency matrix, the largest eigenvalues and their corresponding eigenvectors, this paper proposes a max-min integer optimization model based on a Rayleigh quotient for better connectivity in the shipping network.
The optimization model maximizing the algebraic connectivity is as follows:
M A X M I N   v , A , I , Z , v i f A x , v v , v
s.t.
0 a i j f , i , j N
a i j + Z i j 1
Z i j 1 I i j
0 R k C N R
0 H m H N H
    x k R 0 , 1 , k N
x k H 0 , 1 , k N
A i , j = 0 , i , j N
I i , j = 0 , i , j N
Z i , j = 0 , i , j N
          I i j I j i = 0 , i , j N
    I 0 , 1 n × n
Z 0 , 1 n × n
The objective is to maximize the largest eigenvalue by changing the service capability of ports. Constraint (17) ensures that the link frequency cannot be greater than the maximum link frequency for each node. Constraints (18) and (19) ensure that Zij = 0 if Iij = 1 for each candidate pair of nodes i and j, thus A(i,j) ≥ 1 as Iij is a binary variable according to constraint (27). Constraints (20)–(23) ensure that containers can only be routed via an open hub port. Constraints (24)–(26) ensure that Bij, Iij, Zij are set as zero for each non-candidate node pair. Constraints (27) ensure that the in-coming and out-going shipping activities between ports i and j are mutual. Constraints (28) and (29) define the domain of the decision variables.
This max-min model is NP-hard as it contains a fractional objective function and integer constraints. In this paper, a communication-reducing conjugate gradient method based on Krylov Subspace is proposed to find an optimal or near-optimal solution.
3. The Reconfiguration Optimization Algorithm

From Section 2, the global container shipping network can be seen as a large sparse matrix. The Krylov subspace methods (KSMs) are a class of iterative methods that can maintain the sparsity of the coefficient matrix and require less computation at each iteration step. Therefore, the Krylov subspace method is the preferred method for solving this type of problem. However, in the Krylov subspace iteration, the classical formulation needs to move the data in each iteration, which causes a performance bottleneck and thus increases the running time.
In this section, after the introduction of KSMs, the Krylov subspace parallel computing strategy is detailed, which can improve the calculation efficiency and maintain numerical stability. Then a modified algorithm, CR-CG-KS, is proposed to improve the stability and accuracy of reconfiguration optimization.

3.1. Krylov Subspace Methods

In the n-th iteration, the solution xn and the residual rn are updated to
x n = x n 1 + α n 1 p n 1                         r n = r n 1 α n 1 A p n 1
where xn and rn have different rounding patterns at finite precision. That is, the expression of xn does not depend on rn, while the expression of rn does not depend on xn. Therefore, computational errors that occur in xn cannot be self-corrected. These errors accumulate over many iterations, leading to a deviation between the true residual and the updated residual. Writing the true residual as b A x n = r n + b A x n r n , we can constrain its criterion by
| | b A x n   =   | | r n + b A x n r n
b A x n r n is the magnitude of the deviation between the true residual and the updated residual. If this deviation becomes large, it will limit the maximum achievable accuracy.
In the S-step Krylov subspace algorithm, the iterative loop is divided into an outer loop and an inner loop, and the inner loop computes S steps of the iterative process for each outer loop. Such a formulation has been re-derived many times in the last decades, mostly with the aim of increasing parallelism [26] and avoiding data movement between two memory levels on sequential machines and between processors in parallel environments [27].

3.2. Krylov Subspace Parallel Computing Strategy

Since Krylov subspace computation requires frequent access to main memory, for large sparse matrix operations, data transmission in each step of computation will occupy most of the time, which is a bottleneck for efficient computation. For this problem, the operations in iterations need to be rearranged to make full use of the locally saved data. In the calculation, some data are used by each computer node, such as parallel calculation of sparse matrix-vector multiplication and inner product calculation requiring global communication; however, some data are stored in the local memory of the computer and do not need to be communicated. If they run separately, the amount of calculation data will be very large, and the simultaneous calculation will block most of the communication time. Many scholars have adopted the S-step approach to increase parallelism [26,28] and avoid data moving between two memory levels on sequential machines and between processors in parallel environments [29], which has been derived many times and proven to be important steps to enhance the parallel nature of the Krylov subspace method.
Based on the S-step method, this paper reorders the calculation sequence of the iterative method, which delays the solution correction by one iteration step. That is, the solution correction does not have to wait for the completion of the inner product calculation, thereby realizing the overlapping of communication and calculation. This method not only improves the calculation efficiency but also maintains the numerical stability of the iterative method [30].

3.3. Conjugate Gradient Algorithm (CG) for Communication Reduction

CR-CG-KS consists of an outer loop indexed by k and an inner loop iterating from j = 1 to s. Its objective is to determine the information needed to compute the conjugate gradient vectors psk+j, rsk+j and xsk+j for 1 ≤ j ≤ s and s > 0. From the properties of CG, it can be known that
                    p s k + j , r s k + j k j + 1 A , p s k + k j A , r s k                     x s k + j x s k k j A , p s k + k j 1 A , r s k
The j-th Krylov subspace with starting vector v generated from the initial matrix A is
K j A , v = s p a n v , A v , , A j 1 v
The conjugate gradient vector from iteration sk + 1 to sk + s for the subspace with the starting vector Rsk can be calculated by Equations (34) and (35):
              P k = ρ 0 A p s k , , ρ s A p s k     s p a n P k = K s + 1 A , p s k
        R k = ρ 0 A r s k , , ρ s 1 A r s k   s p a n R k = K s A , r s k
where ρ j z is a polynomial of degree j that satisfies the three-term recurrence formula:
ρ 0 z = 1 , ρ 1 z = z θ 0 · ρ 0 z γ 0 ρ j z = ( z θ j 1 · ρ j 1 z σ j 2 · ρ j 2 z ) γ j 1
V k = P k , R k , and all elements of V k and V k are the same except for all zeros in columns s + 1 and 2s + 1. Hence
A V k = V k B k
B k is a (2s + 1) order tridiagonal matrix to avoid confusion with the tridiagonal matrix of Lanzos coefficients generated by CG. Similarly, we replace the coordinates P s k + j , r s k + j and x s k + j x s k in the conjugate gradient iteration by P k , j , r k , j and x k , j , respectively. That is, in V k ,
p s k + j = V k p k , j , r s k + j = V k r k , j , x s k + j x s k = V k x k , j
For 1 ≤ js, the iterative update of CG is:
V k x k , j = V k x k , j 1 + α s k + j 1 V k p k , j 1     V k r k , j = V k r k , j 1 + α s k + j 1 A V k p k , j 1                                                                                 V k p k , j = V k r k , j 1 + β s k + j 1 V k p k , j 1
In the inner loop, we just update its coordinates in V k :
                x k , j = x k , j 1 + α s k + j 1 p k , j 1                           r k , j = r k , j 1 α s k + j 1 B k p k , j 1 p k , j = r k , j 1 + β s k + j 1 p k , j 1
It is set that G k = V k T V k in the inner loop computation, which greatly reduces the memory cost in each iteration. The matrix G k can be computed by the update reduction in each outer loop, and its asymptotic delay cost is the same as that of a single inner product computation. Since the dimensions of B k and G k are both (2s + 1) × (2s + 1), α s k + j 1 and β s k + j 1 can be computed locally in the inner loop.
α s k + j 1 = r k , j 1   T G k r k , j 1 T p k , j 1   T G k B k p k , j 1 T β s k + j 1 = r k , j   T G k r k , j T r k , j 1   T G k r k , j 1

3.3.1. Residuals of the Solution and Update

Residuals of the solution and update can be calculated according to Equation (42):
                  x s k + j = V ^ k x k , j + x ^ s k r s k + j = V ^ k r ^ k , j
At the end of each outer loop iteration (when j = s), the solution and residuals denoted, respectively, as x ^ s k + j and r ^ s k + j are computed with finite precision. Their error can be limited as follows:
x ^ s k + j = fl V ^ ¯ k x ^ k , j + x ^ s k = V ^ ¯ k x ^ k , j + x ^ s k + ϕ s k + j = x s k + j + ϕ s k + j ϕ s k + j ϵ x ^ s k + j + N V V _ ¯ k x ^ k , j , r ^ s k + j = fl V ^ ¯ k r ^ k , j = V ^ ¯ k r ^ k , j + ψ s k + j = r s k + j + ψ s k + j ψ s k + j ϵ N V V ^ ¯ k r ^ k , j

3.3.2. Deviation between True Residual and Updated Residual

At step sk+j of the finite-precision CR-CG-KS algorithm, set δ s k + j = b A x s k + j r s k + j . Then,
| | δ s k + j b A x 0 r 0 | | + ϵ l = 0 k 1 A x ^ s l + s + N V A | V ^ l | | | x ^ l , s | | + | | V ^ l | | r ^ l , s | | + ϵ l = 0 k 1 i = 0 s C 1 A | | V ^ l | | x ^ l , i | | + C 2 | | V ^ l | | B l | | x ^ l , i | | + | | V ^ l | | r ^ l , i | | + ϵ i = 1 j C 1 | | V ^ k | | x ^ k , i | | + C 2 | | V ^ k | | B k | | x ^ k , i | | + | | V ^ k | | r ^ k , i | |
where
C 1 = 7 + 2 N A C 2 = 8 + 2 N B
Assuming the algorithm terminates at step sk+j, return x ^ s k + j and r ^ s k + j . The deviation between the true residual b A x ^ s k + j and the updated residual b A x ^ s k + j are limited as follows:
δ ^ s k + j δ s k + j + ε ( A x ^ s k + 1 + N V A | V ^ k x ^ k , j + N V | V ^ k | r ^ k , j | )
Then
b A x ^ s k + j r ^ s k + j = b A x s k + j + ϕ s k + j r s k + j + Ψ s k + j = δ s k + j A ϕ s k + j Ψ s k + j
Equation (46) can be further simplified as:
A ϕ s k + j ε A x ^ s k + 1 + N V | V ^ k | | x ^ k , j |
It is expected that the true residuals and updated residuals of iteration sk + j in CR-CG-KS are the same size as those in CG, which play an important role in determining the accuracy of CR-CG-KS relative to CG.

3.3.3. Residual Replacement Algorithm for CR-CG-KS

In each iteration, the estimated value d s k + j + m is updated as follows:
d s k + j + m = d s k + j + m 1 + ε 4 + N A | | V ^ k | | x ^ k , j | | + | | V ^ k | | B k | | x ^ k , i | | + | | V ^ k | | r ^ k , j | | + ε A | x ^ s k + s | + 2 + 2 N | | V ^ k | | x ^ k , s | | + N | | V ^ k | | r ^ k , s | | , j = s 0
Meanwhile, there is a constraint i = 1 j   x ^ k , i 1 2 + ε i = 1 j x ^ k , i . It is set that d m = ε r ^ m + 1 + 2 N z ^ m , m = 1 , , s k + j at each replacement step.
It is set that d s k + j + m 1 ε ^ V ^ k r ^ k , j 1 2 , d s k + j + m > ε ^ V k r ^ k , j 2 and d s k + j + m > 1.1 d j min to ensure that there is a non-linear increase in error since the last substitution step to avoid unnecessary substitutions. Then, the algorithm must start a new outer loop that generates a new S-step base relative to the residuals being replaced.
Next, to perform an inertial update, we must be able to estimate the norm of A easily, preferably only once. We discuss how to obtain the remaining norms without increasing the asymptotic computation or communication cost of CR-CG-KS.
| | V ^ k | | x ^ k , j | | 2 = | x ^ k , j | T G ˜ k | x ^ k , j | + O ε | | V ^ k | | r ^ k , j | | 2 = | x ^ k , j | T G ˜ k | r ^ k , j | + O ε | | V ^ k | | B k | | x ^ k , j | | 2 = x ^ k , j T B k T G ˜ k B k x ^ k , j + O ε
We must also calculate z ^ m 2 and r ^ m 2 at each residual replacement step m, r ^ m 2 can be calculated in the next outer loop after the replacement, and r ^ m 2 = r ^ 0.0 T G 0 r ^ 0.0 0.5 + O ε   .
Hence, we can finally obtain
x ^ sk + s 2 l = 0 k V ^ l x ^ l , s 2 + O ε = l = 0 k x ^ l , s T G l x ^ l , s + O ε

4. Calculation and Analysis

4.1. Numerical Processing and Preliminary Network Generation

According to Alphaliner’s statistics in 2021, the three major shipping alliances account for about 79% of the global container shipping market share (2M accounts for 34%, Ocean Alliance accounts for 28%, THE Alliance accounts for 17%), and the remaining shipping companies only account for 21% of shipping market share. The top 10 global container shipping companies and their market shares in 2021 are shown in Table 2.
To construct a global container shipping network under RCEP, we use the information published on the websites of Clarkson, Maersk, CMA-CGM, Evergreen Marine, Hapag-Lloyd, COSCO Container, and CSCL in 2021. The schedules show the paths of ships calling at ports during their voyages, including the names of ports and shipping routes. In our network model, links are established only between consecutive ports along the shipping routes [31,32]. In total, 237 major ports in the world and 1434 undirected links among them are included in the sample for the global container shipping network. The weight of each link is represented by the service frequency. Thus, the frequency-weighted adjacency matrix A provides a realistic representation of the global shipping network. The global container shipping network is constructed based on the construction principle of the L space network [33].

4.2. Numerical Example

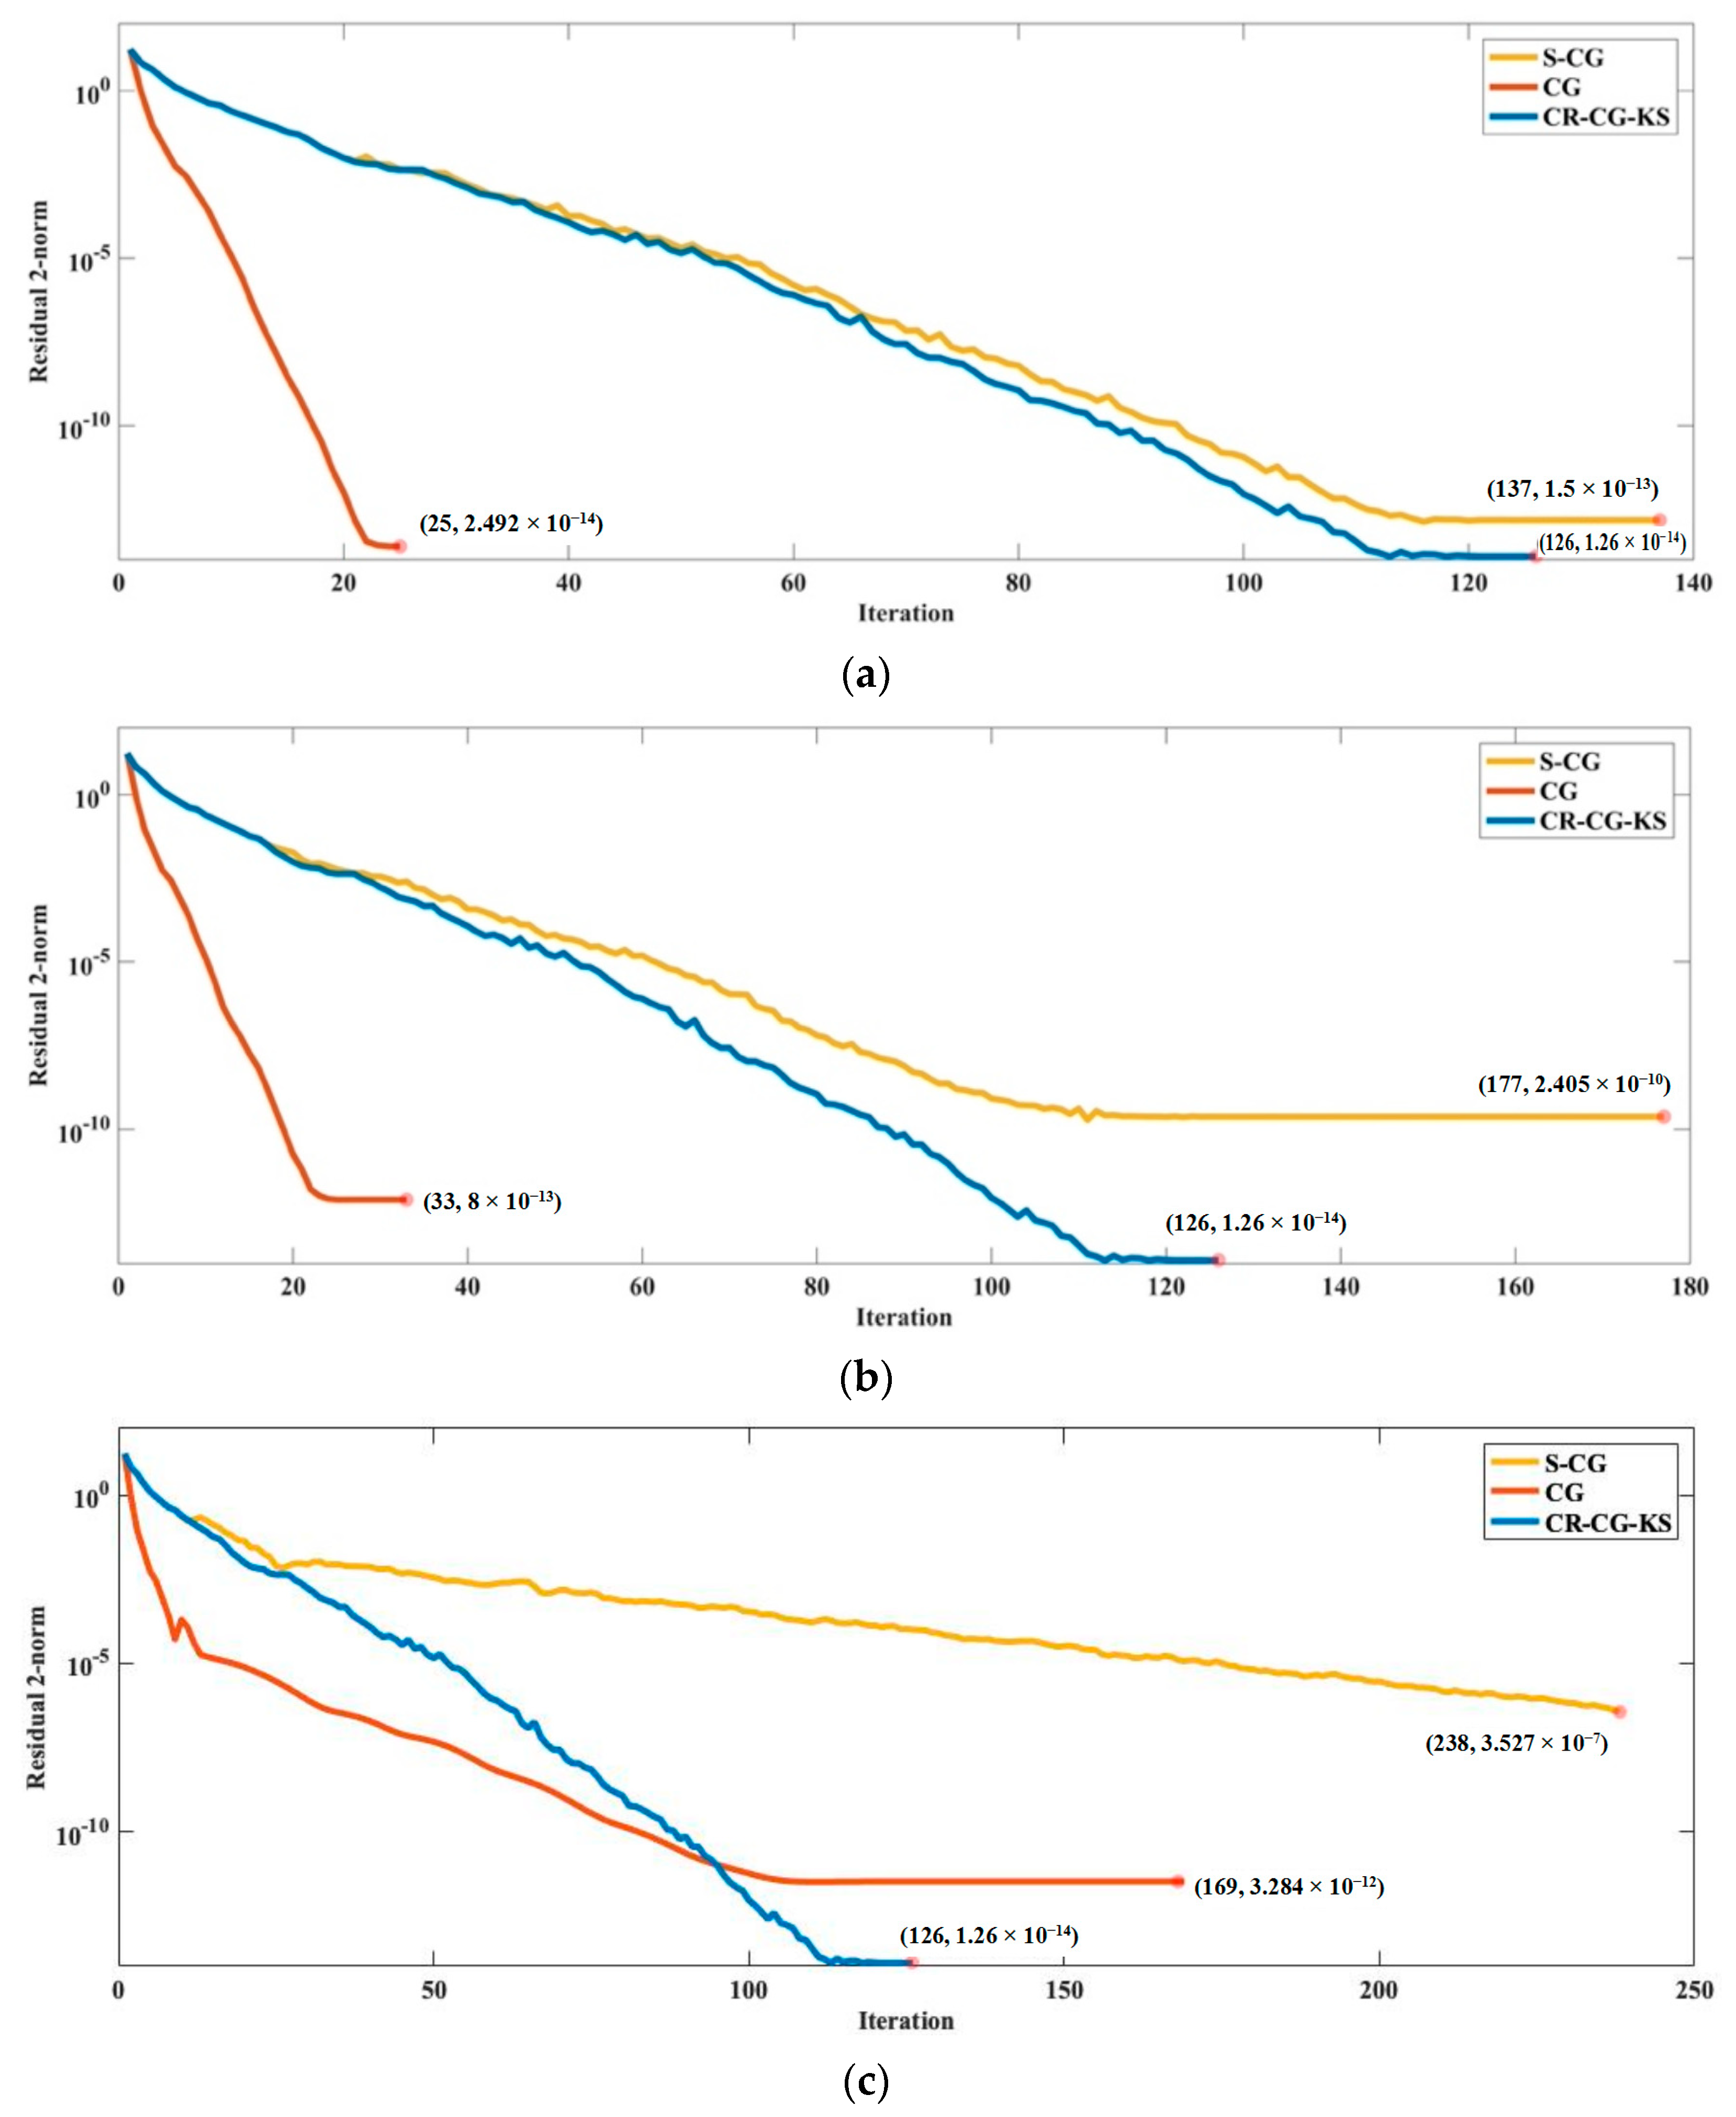
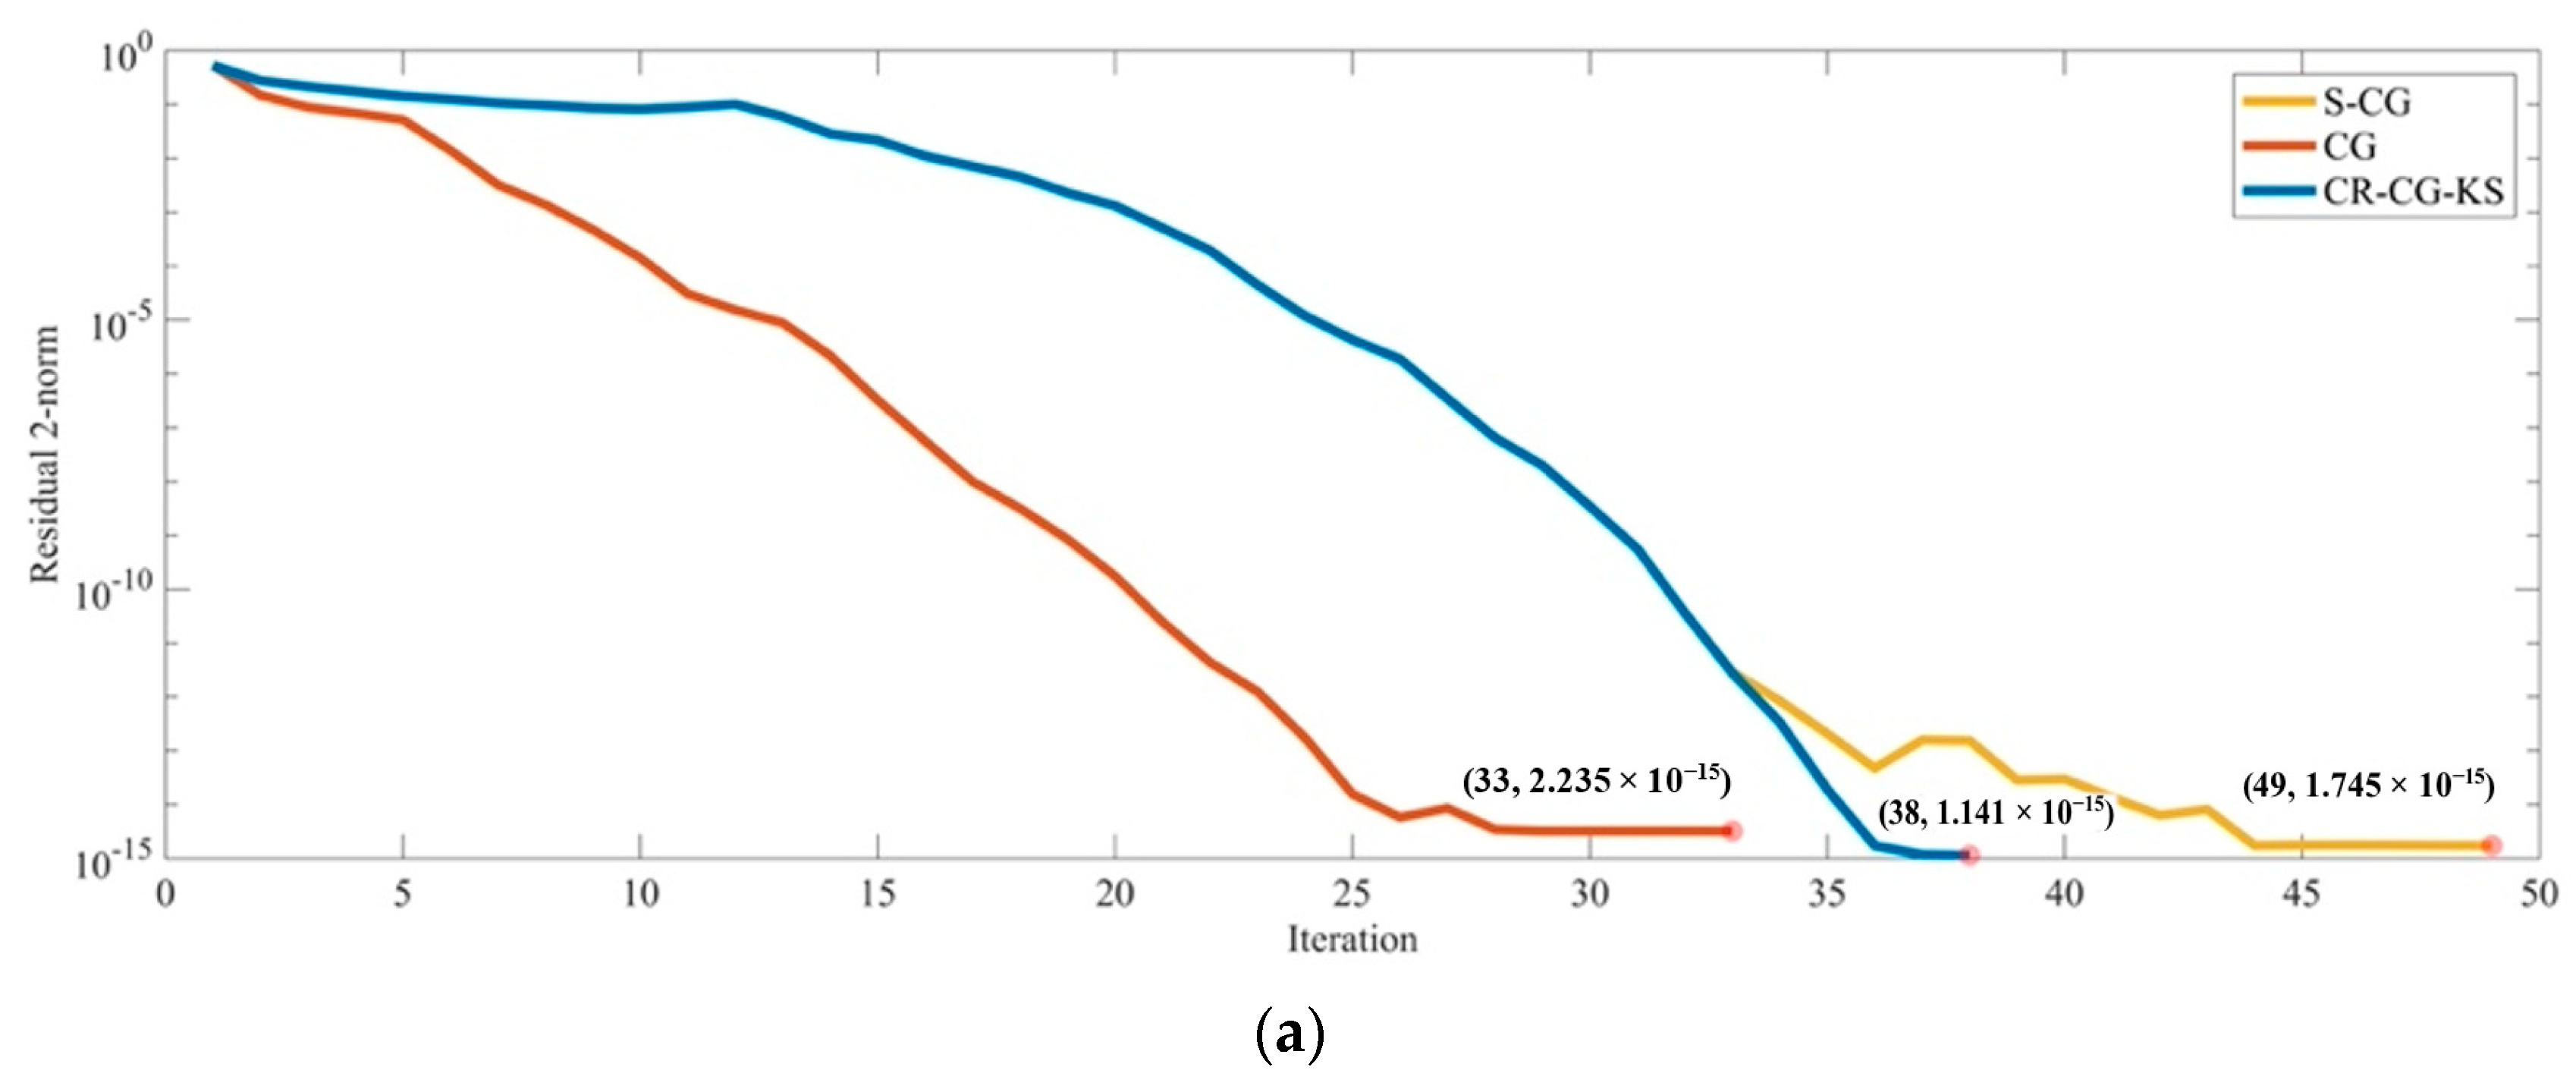
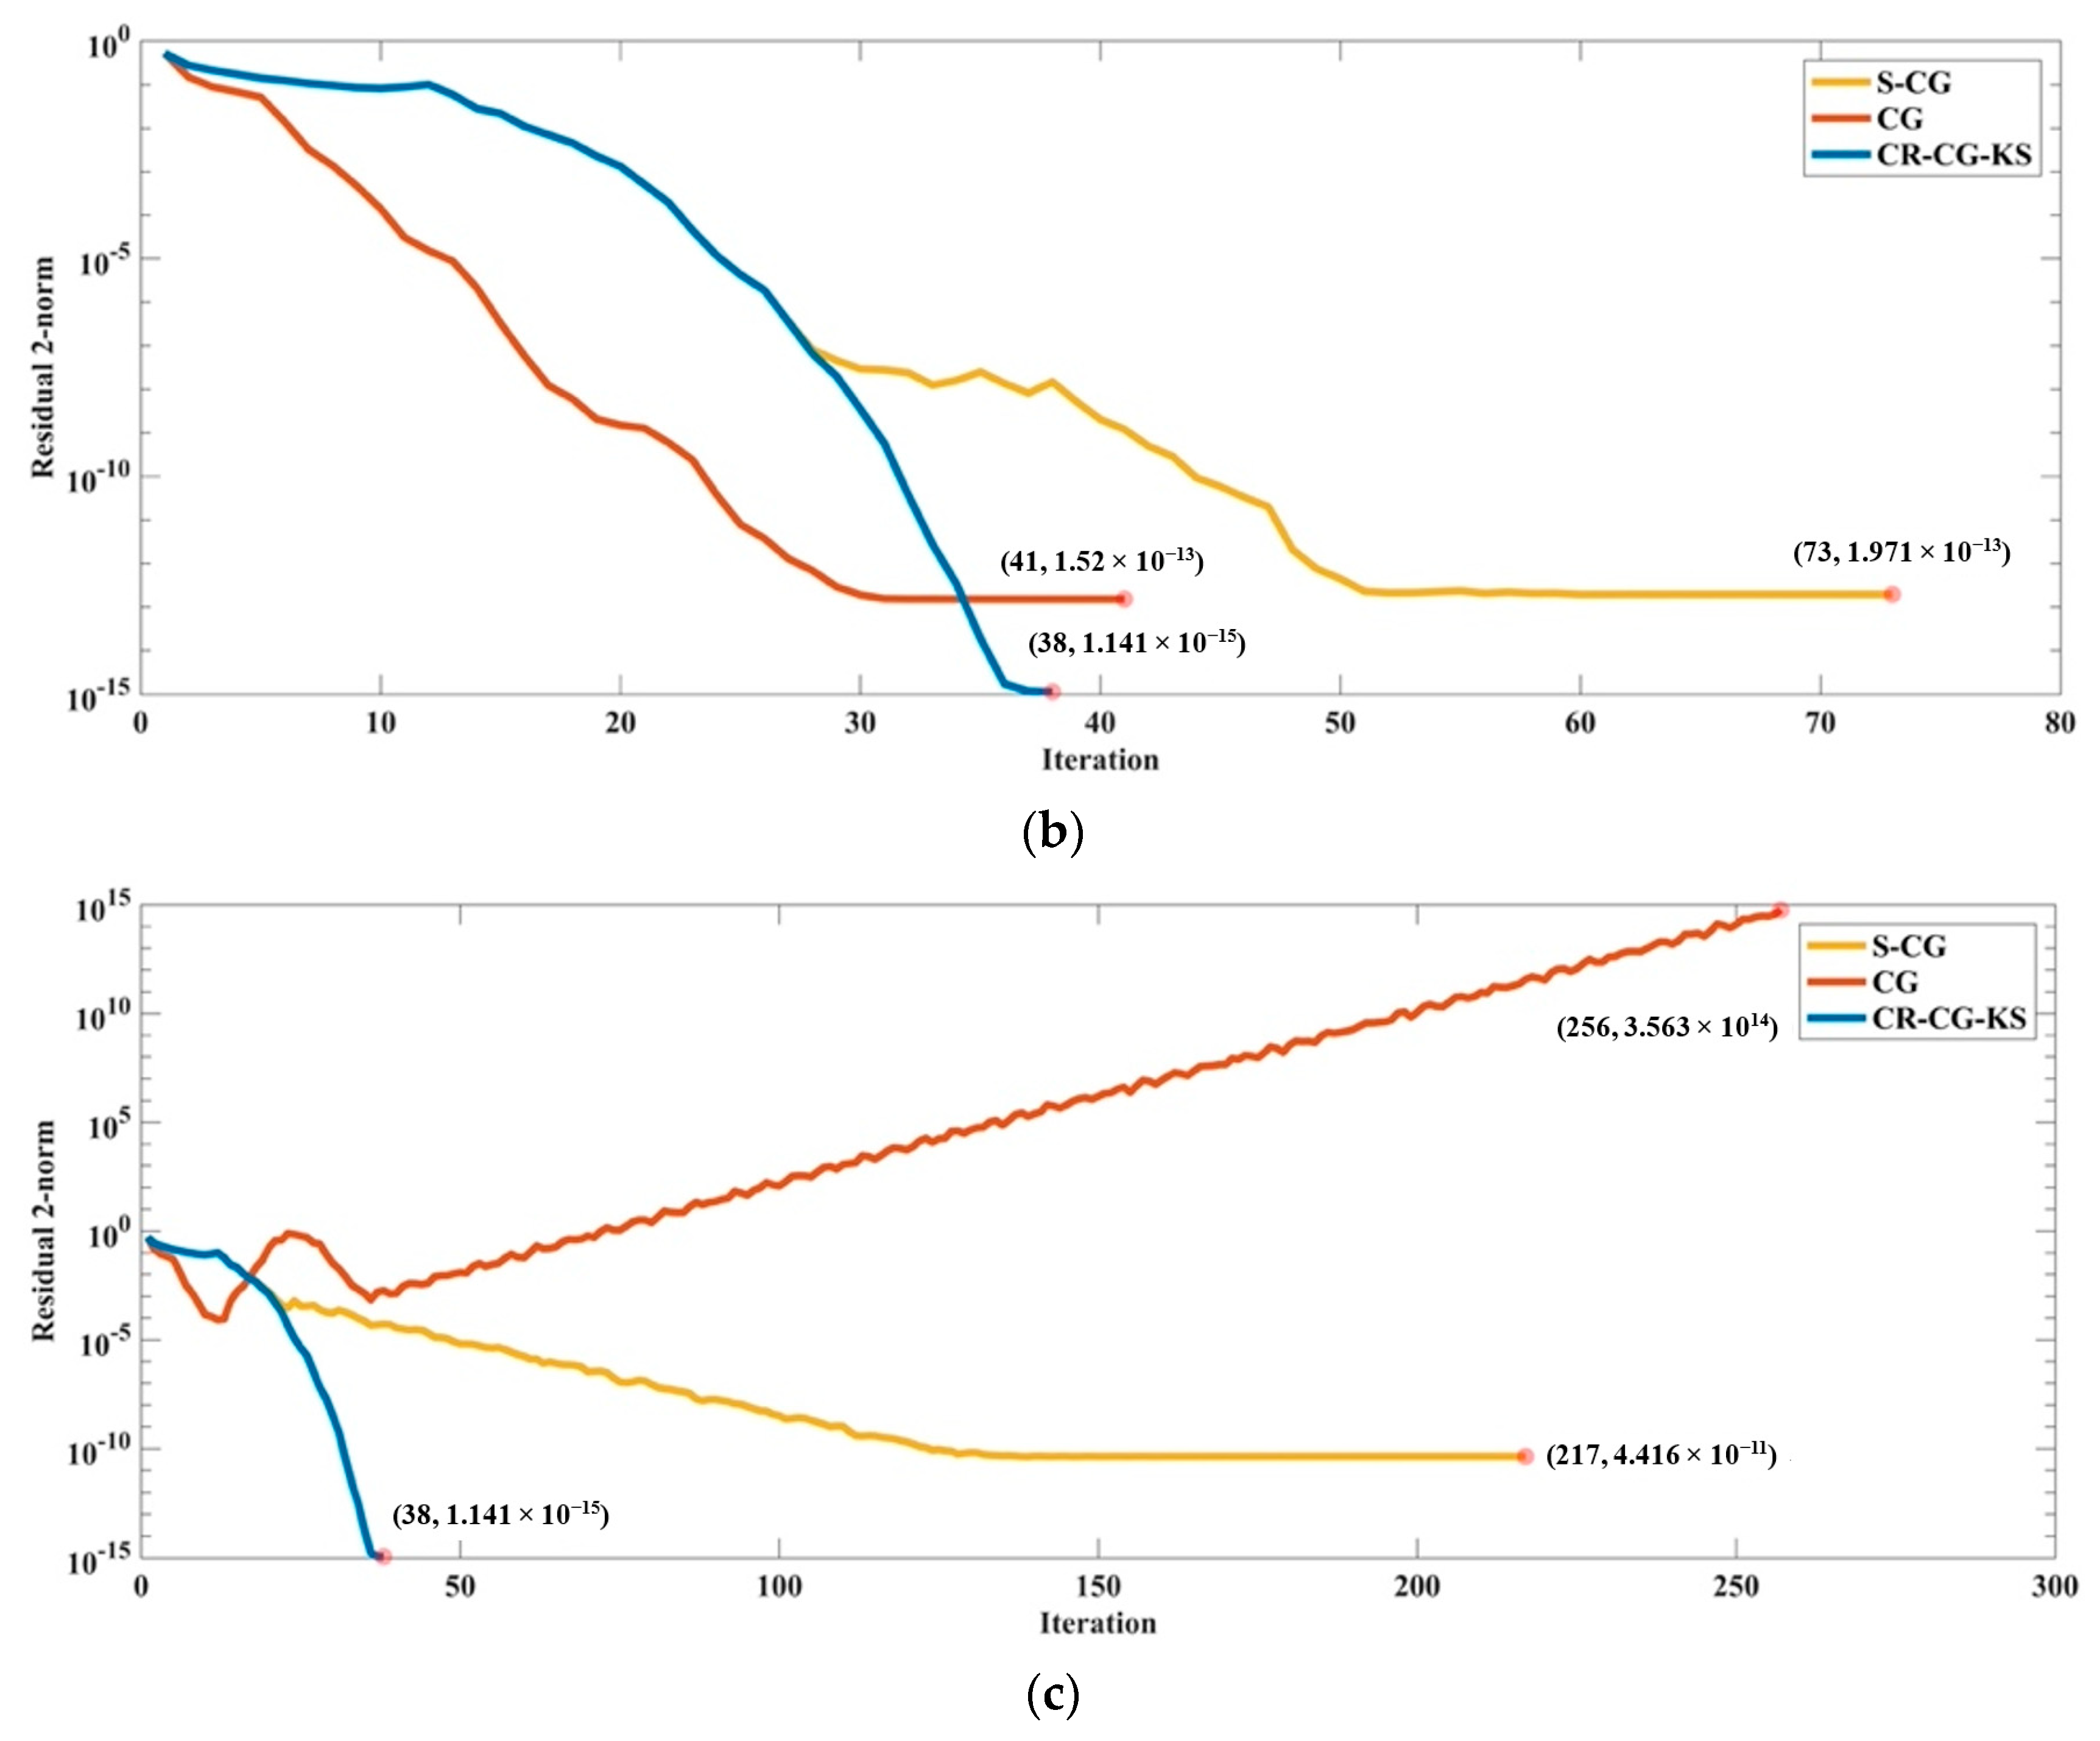
A 256-order sparse matrix is used as the test matrix to evaluate the residual replacement strategy of this paper. The error is set to 10 16 , and N = N A = N B = N V = 1 [30]. CG and the S-step Krylov subspace conjugate gradient algorithm (S-CG) are used to conduct comparative experiments. The result comparisons when S = 4, 8 and 12 are shown in Figure 1a–c, respectively.
From Figure 1, CG reaches convergence at the 33rd time when S = 4, and the convergence speed is the fastest, but the residual values are larger than the other two methods, and the calculation accuracy is not high. When S = 8, the number of iterations is 41, and the residual value is also more than 100 times different from those when S = 4. When S = 12, the number of iterations is 217. Although the residual meets the convergence requirements, the calculation time is long, and the calculation memory is too much. It can be seen that the number of inner loops has a great influence on the calculation results obtained by CG.
In contrast, S-CG sequentially selects the orthogonal S-direction vectors of A to form an orthogonal orientation matrix, while minimizing the residual vectors in these S-directions) [28]. When S = 4 and S = 8, the variation of iteration number and residual distance is similar to those of CG. The residual value reaches the optimal value when S = 8, but the convergence requirement cannot be satisfied when S = 12.
CR-CG-KS proposed in this paper has the same iteration number and residual values when S = 4, 8 and 12. The residual values are the minimum values among those of these three algorithms. It can be seen that CR-CG-KS has better stability and accuracy.

4.3. Reconfiguration Analysis of Global Container Shipping Network

4.3.1. The Major Container Shipping Network

According to the data collection of the global container shipping network with 237 major ports and considering the practical application, the data are discrete and analyzed to obtain the optimal solution and scheme. Figure 2a–c show the result comparisons among the three methods.
From Figure 2a–c, the convergence speed of CG is always the fastest. However, its final convergence accuracy is worse than that of CR-CG-KS. During the early iteration period, the errors of S-CG and CR-CG-KS are almost the same regardless of whether the inner loop step is 4, 8 or 12. However, the convergence speed of S-CG becomes much lower than that of CR-CG-KS, and its final error is significantly larger. As S increases, the convergence speed of CG and S-CG becomes slower, and their convergence accuracy becomes worse. The change of S has little effect on the convergence speed and accuracy of CR-CG-KS. The errors of CR-CG-KS always reach their minimum in the 126th iteration, and the minimum errors of CR-CG-KS are always 1.26 × 10⁻¹⁴. It can be seen that the improvement of CR-CG-KS for the global container shipping network reconfiguration is significant.
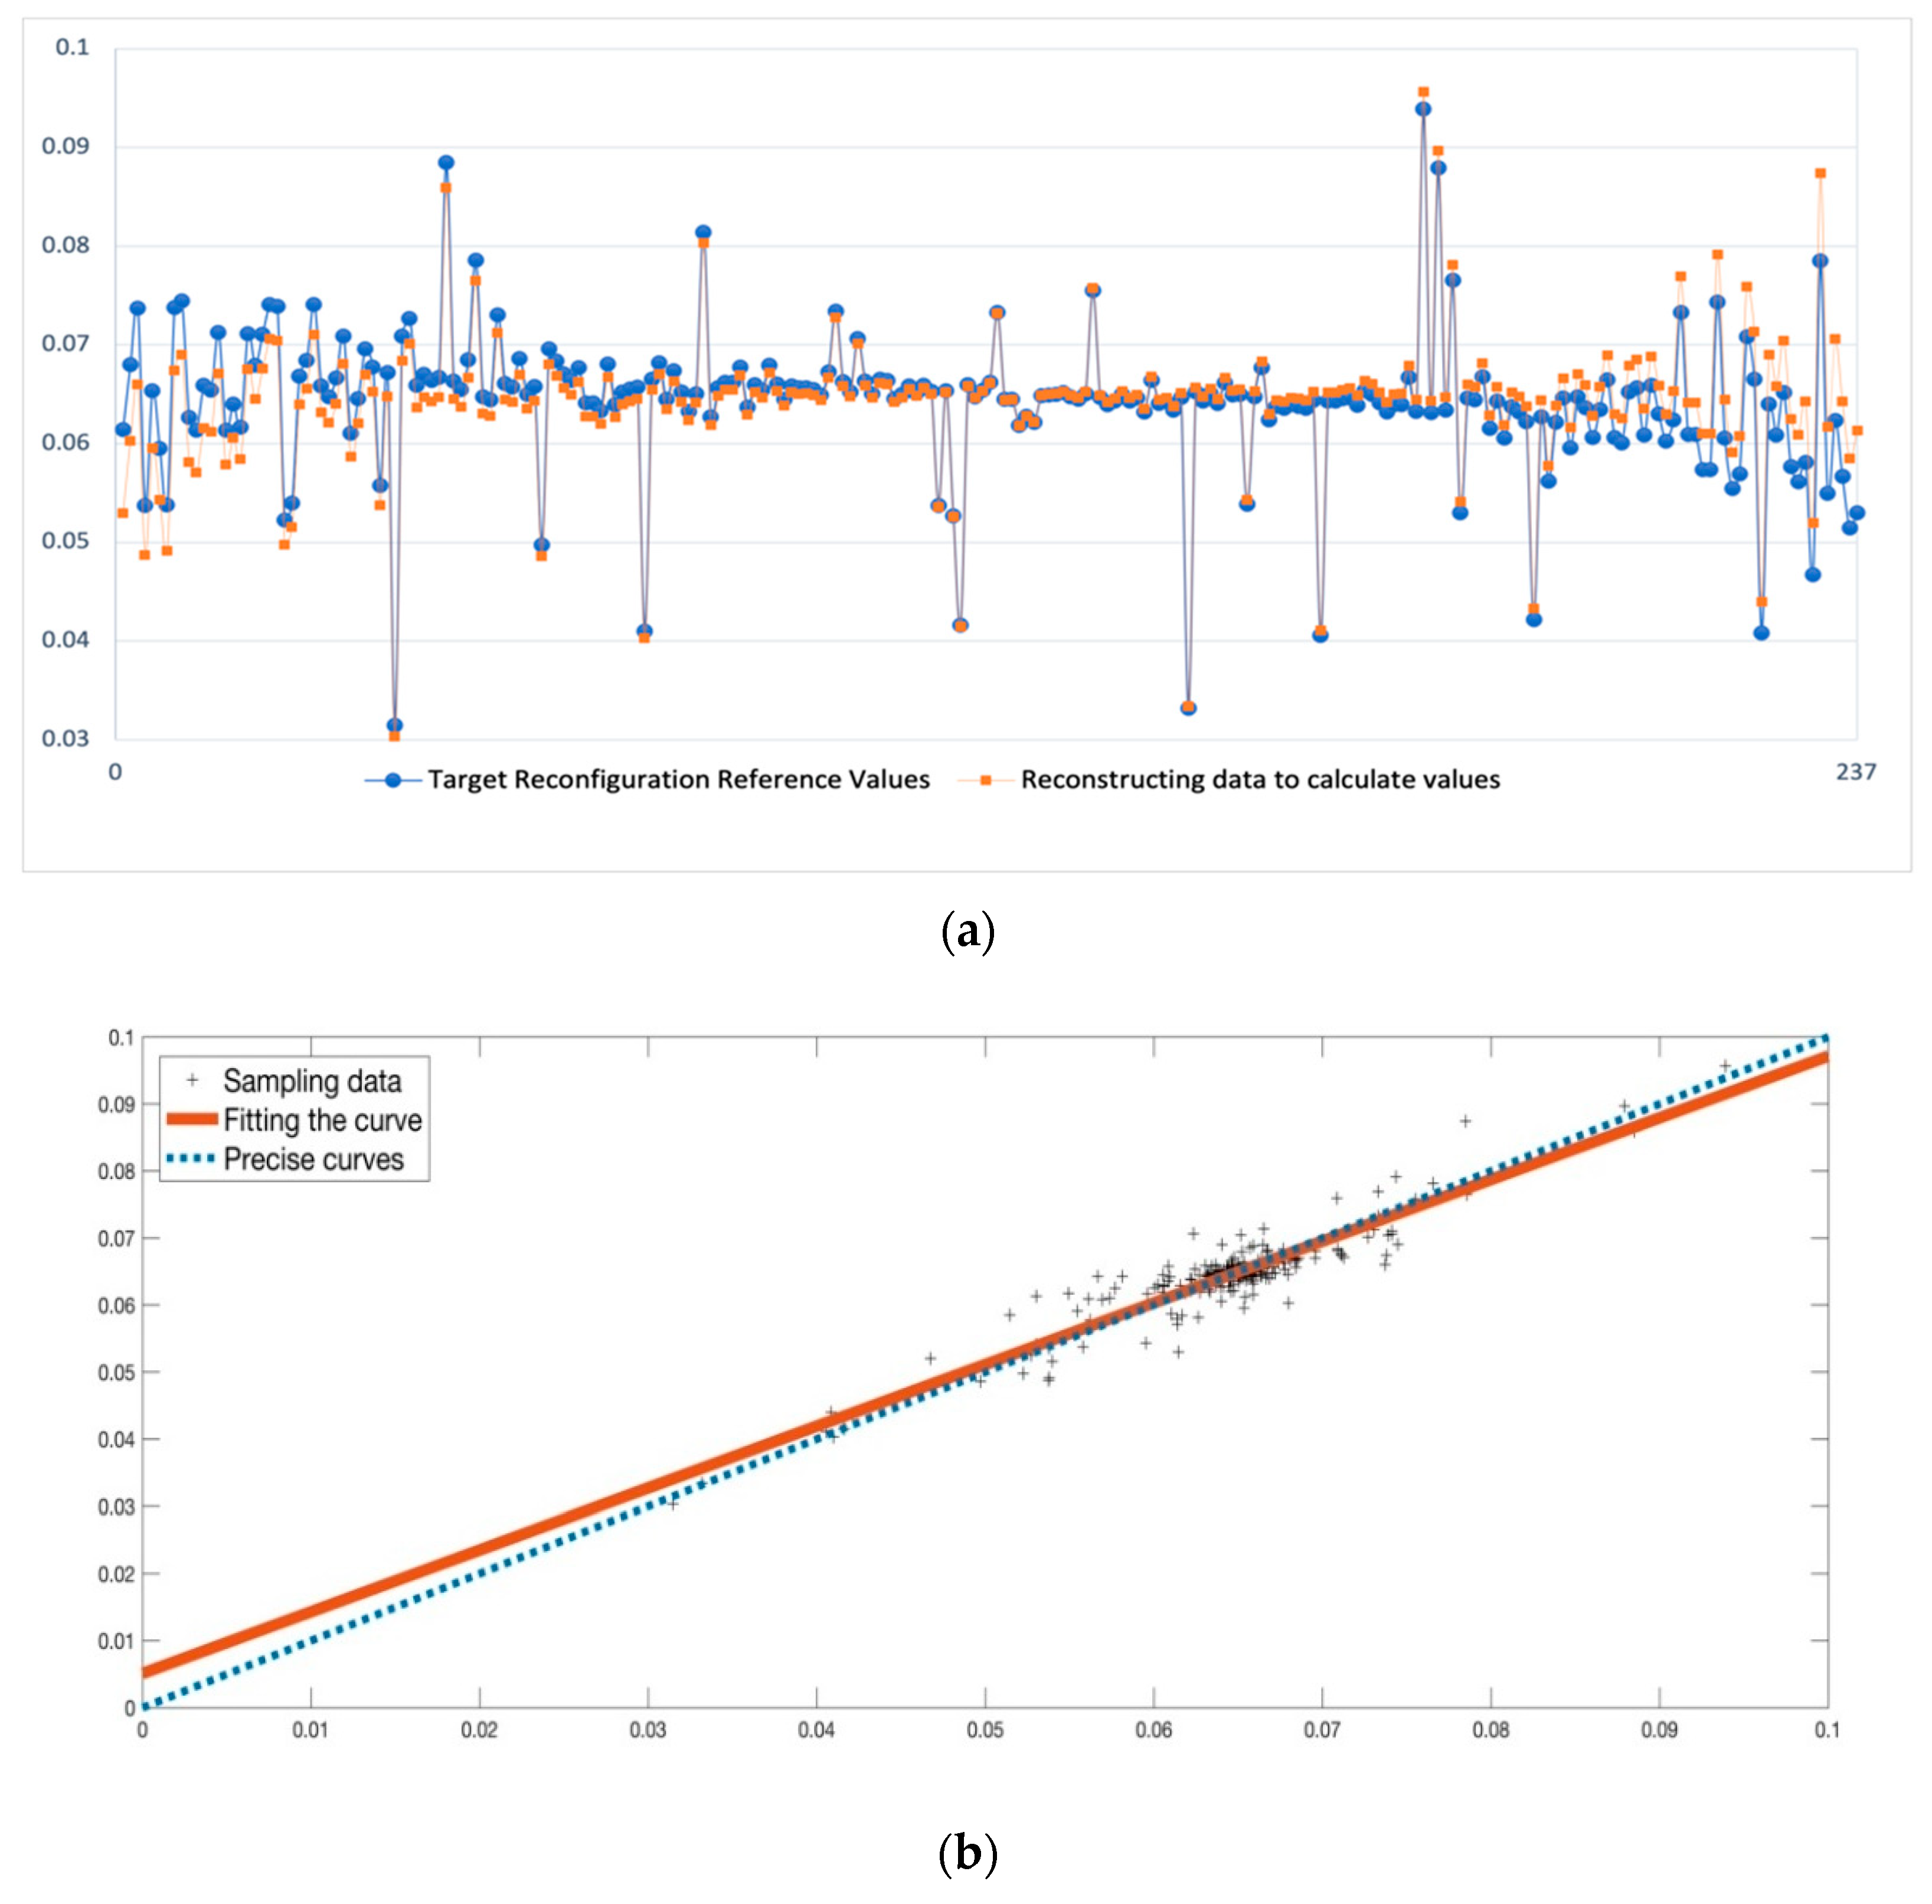
Specifically, we compare the expected reference value of the global container shipping network with the planned reconfiguration coefficients. The global container shipping network reconfiguration results are shown in Figure 3a, and their fitting comparison is shown in Figure 3b.
If P is greater than or equal to 10%, it is needed to enhance the corresponding service capability; if P is less than or equal to −10%, the service capability is redundant, which can be reduced.
P = S n i S o i S o i
where S o i is the preliminary calculation value of the global container port service capacity, S n i is the global container port service capacity calculated by CR-CG-KS.
From Figure 3a, there is a certain difference between the calculation result and the predetermined reconfiguration result, which indicates that some container ports need reconfiguration optimization to a certain extent. Figure 3b shows the expecting reconfiguration reference value and the first-order linear fitting of the calculated reconfiguration results. The slope and the intercept of the fitted curve are 0.920 and 0.005, respectively. It can be seen that the change in the reconfiguration value is not significant, which is highly similar to the preset reconfiguration value.
In particular, ports with sufficient service capacity and underserved capacity are listed in Table 3 and Table 4, respectively. Proportions of global container transport network reconfiguration with different P ranges are shown in Table 5.
From Table 3, Table 4 and Table 5, there are three ports with P below -10%, accounting for 1% of all ports, namely Tampa, Rijeka, Ensenada, which have redundant service capabilities and need to be reduced; eight ports with more than 10%, accounting for 3% of all ports, namely Taipei, Miami, Denmark, Dublin, Kaliningrad, Morocco, Bangkok, Yantai, which need to increase their service capabilities. In addition, 122 ports with −10% to 0, accounting for 52% of all ports; 108 ports with 0–10%, accounting for 44% of all ports. These 230 ports do not need to optimize the port service capacity.

4.3.2. The Global Container Shipping Network Considering Non-Major Ports

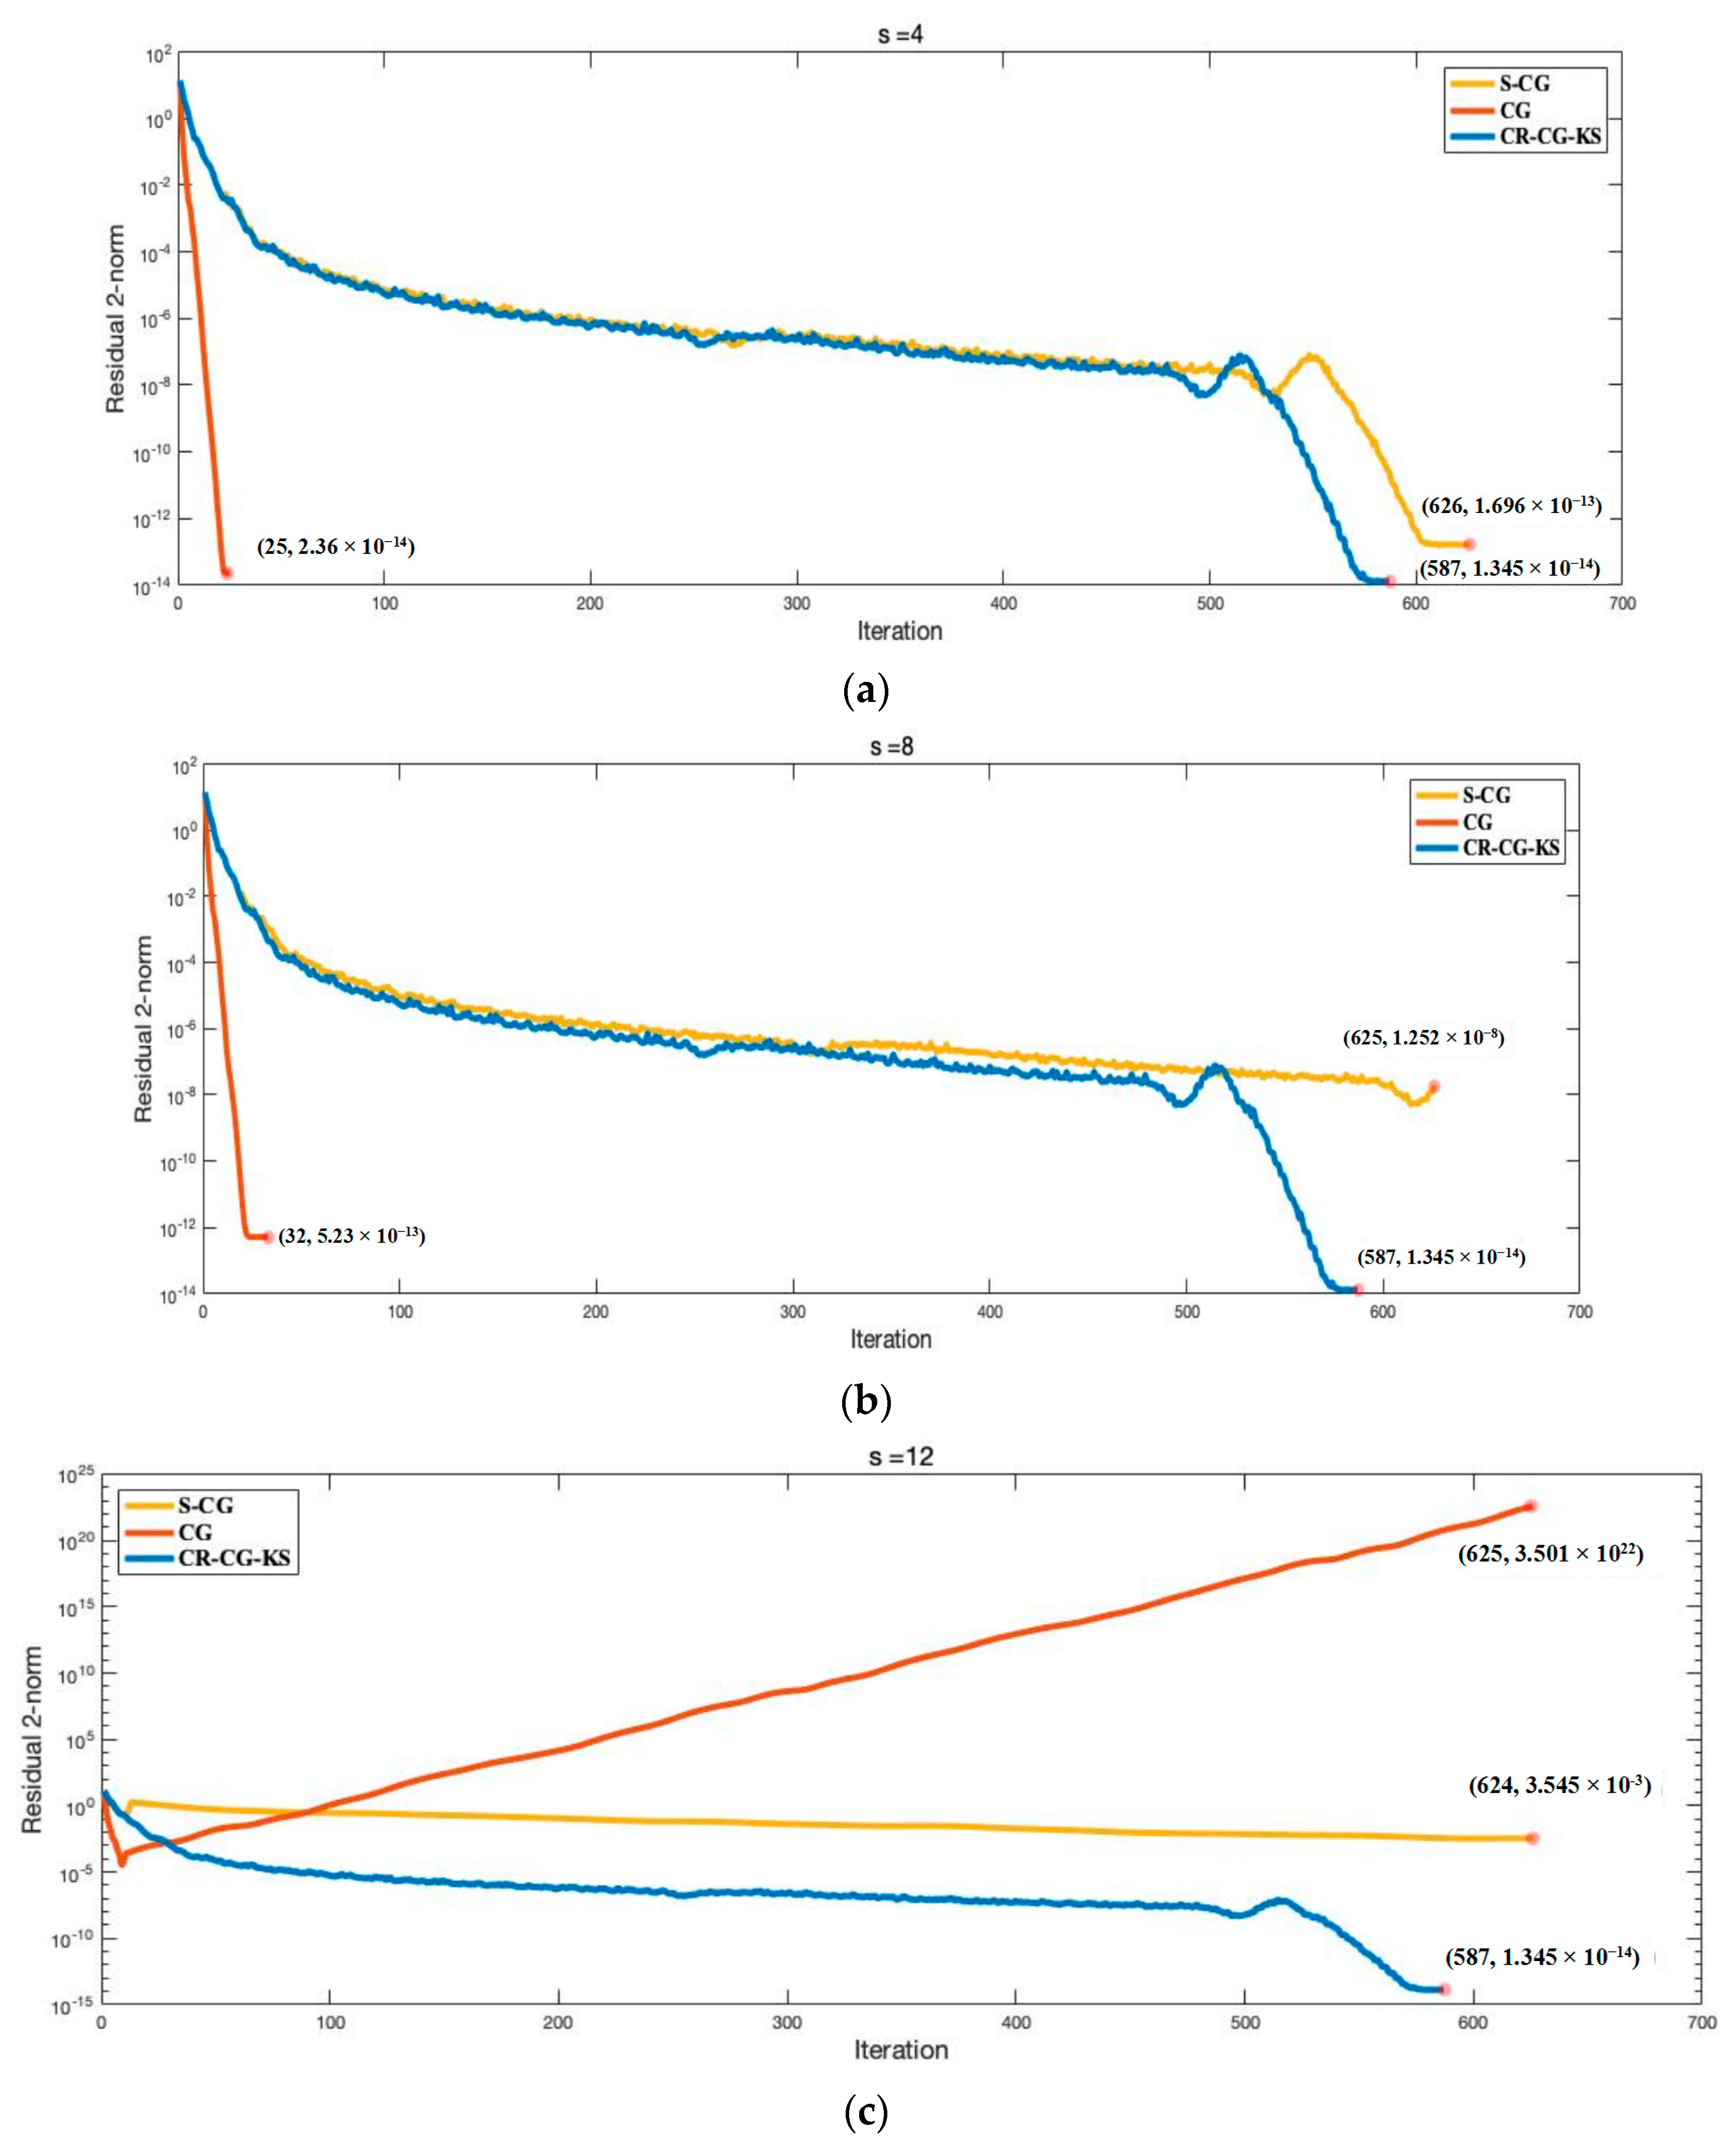
Based on these 237 more important ports, we continued to collect some other relatively less important ports. Finally, we collected a total of 625 ports. Similar to the reconfiguration and optimization of the major container shipping networks in the world, we perform a similar simulation analysis on the global container shipping networks of these 625 ports. The result comparisons among three methods with different S are shown in Figure 4a–c.
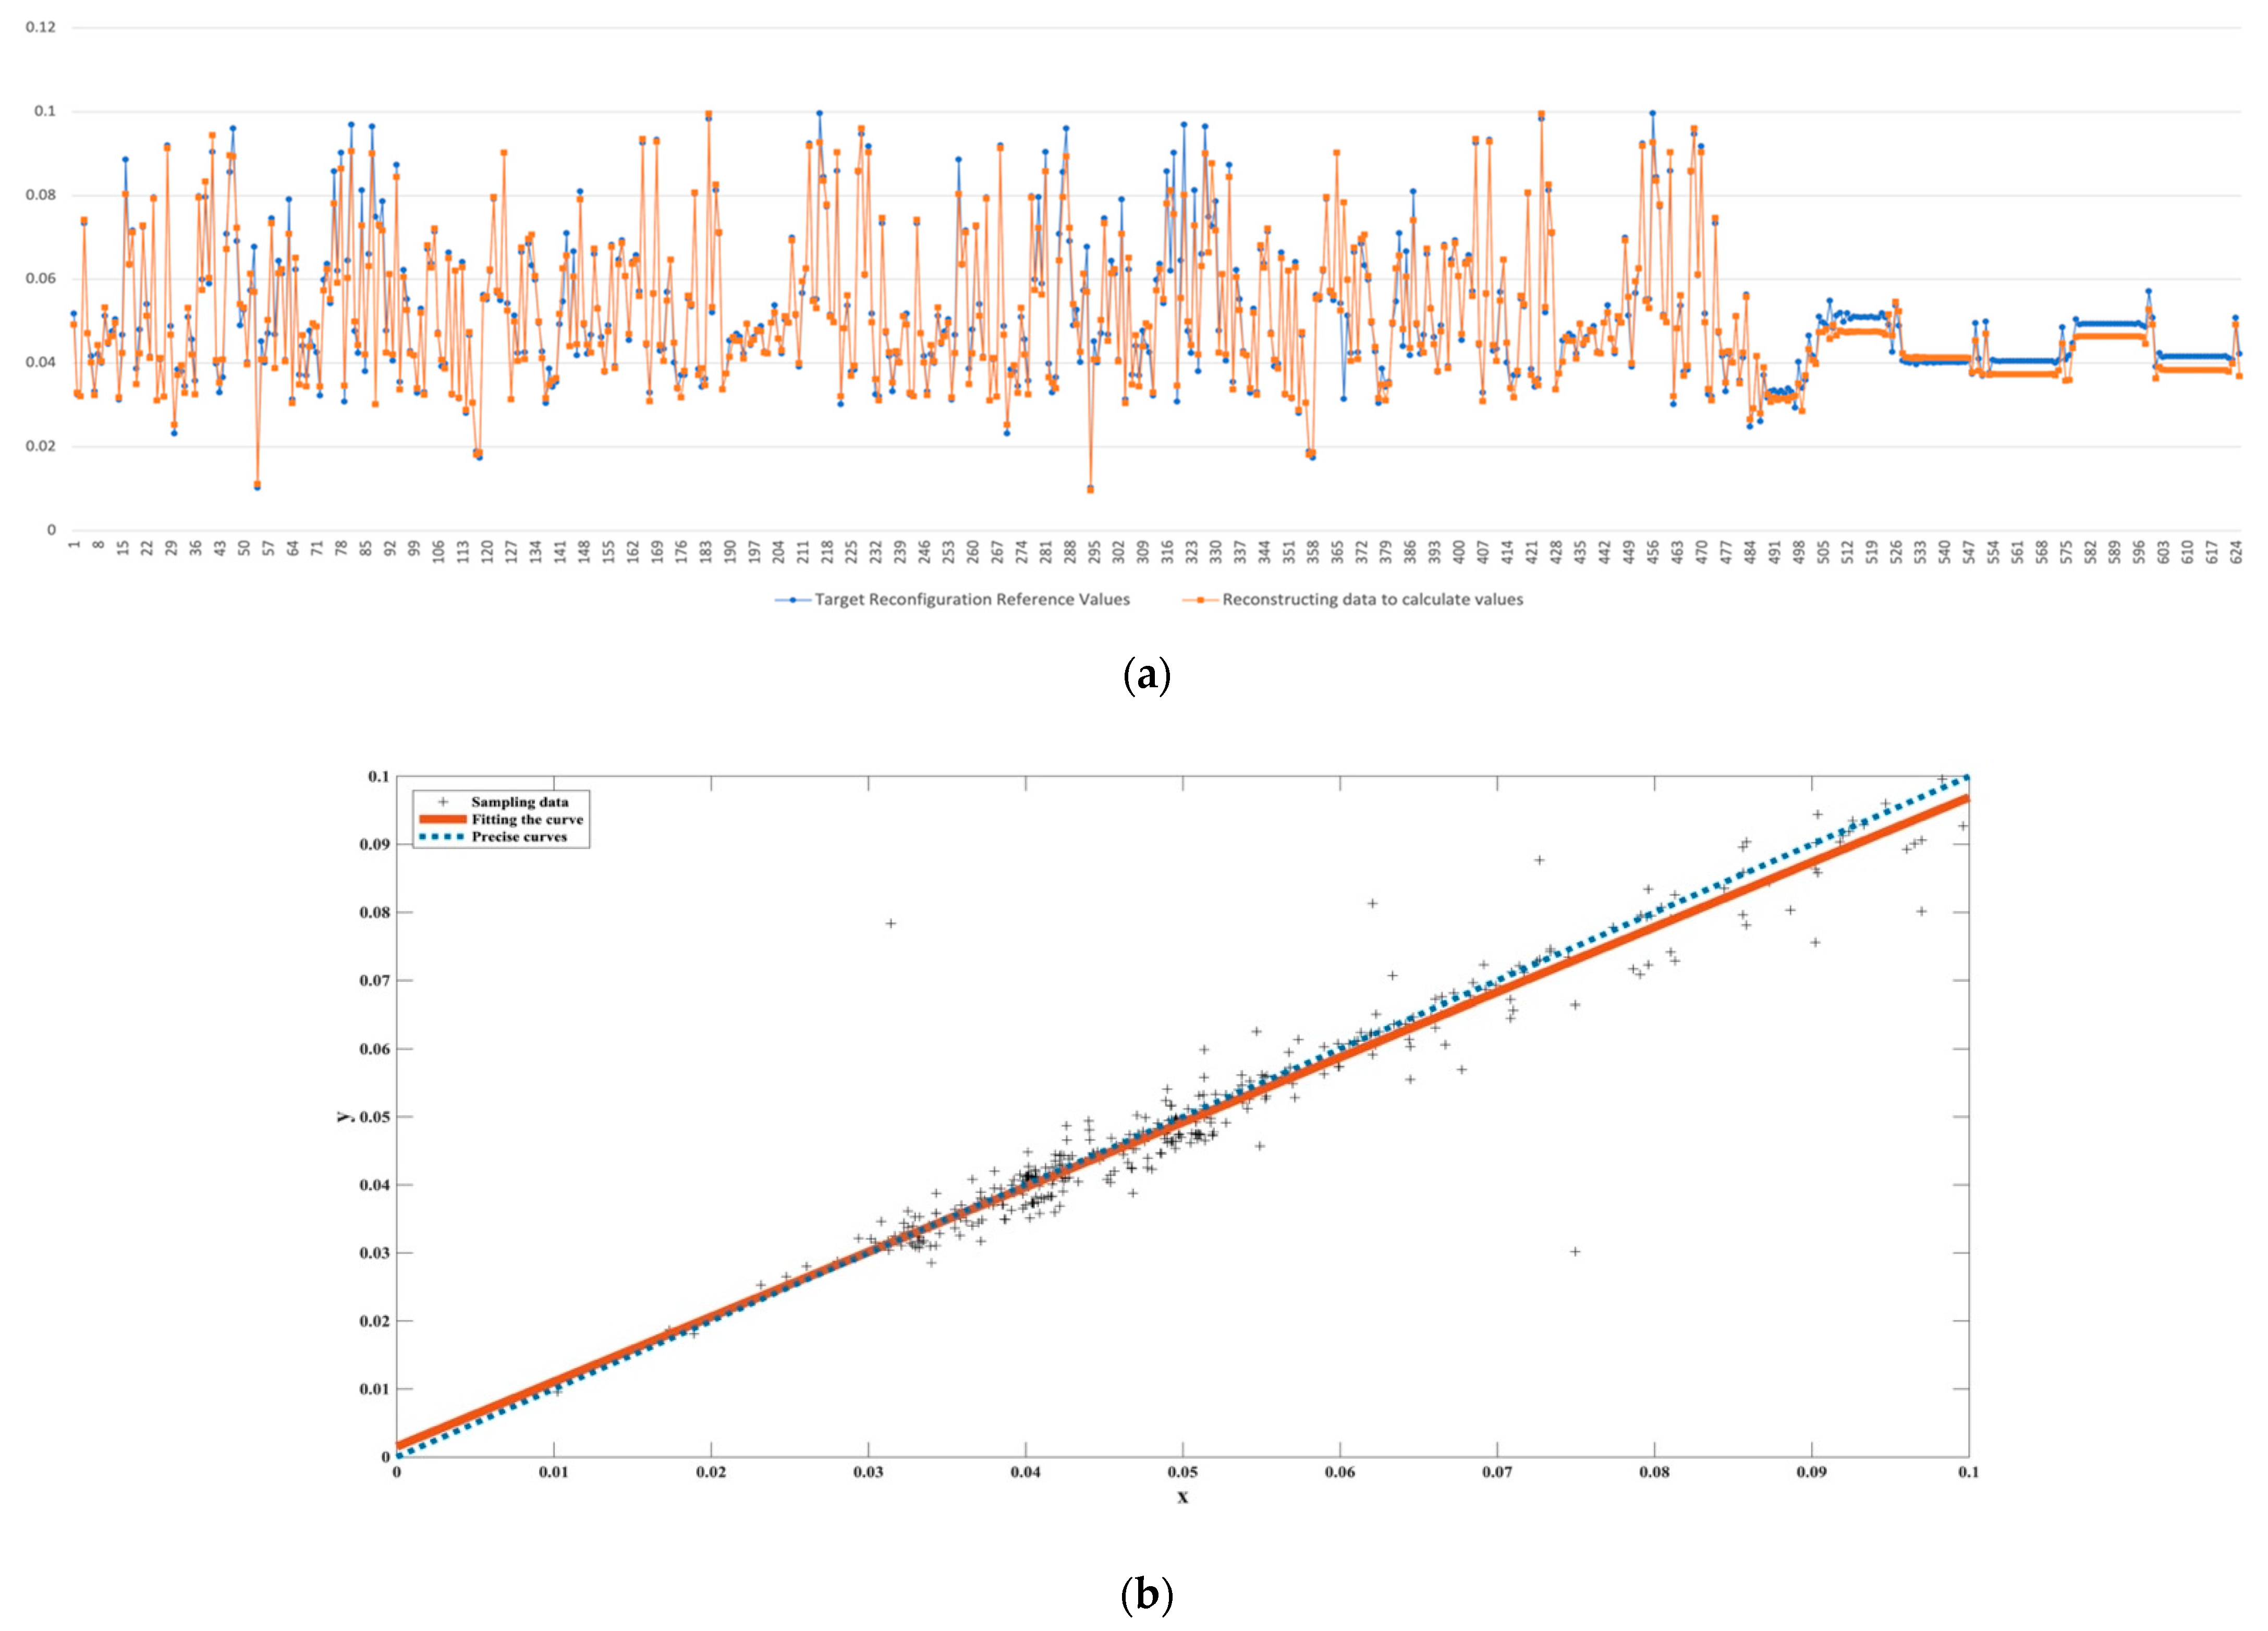
The expected reference value of the global container shipping network was calculated and compared with the calculated planned reconfiguration coefficients. The global container shipping network reconfiguration results are shown in Figure 5a, and their fitting comparison is shown in Figure 5b.
From Figure 5a, the calculation results of the reconfiguration and optimization of the global container shipping network of 625 ports are somewhat different from the reconfiguration results present in this paper. It indicates that the global container shipping network has a certain difference, and some ports need to be refactored and optimized. Figure 5b gives the first-order linear fit of the expected reconfiguration reference value and the calculated reconfiguration result. From Figure 5b, compared with the major container shipping network in Section 4.3.1, there are a few ports with a larger difference; but at the same time, the slope and intercept of the fitted curve are 0.9539 and 0.0015, respectively, which are larger than the first order of the previous one. The fitting effect is better. It can be seen that the method in this paper is also applicable to larger calculation examples.
Similarly, the reconfiguration proportions of the global container shipping network under different P ranges are shown in Table 6. It can be seen that 25 ports have redundant service capabilities and need to be reduced, and 23 ports need to increase their service capabilities. Their proportion in all ports are 4.00% and 3.68%, respectively.

4.3.3. Sensitivity Analysis of the Global Container Shipping Network

Clarksons noted that key “hot spots” for container network congestion this year include the United States, China and Northern Europe. The negative impact of emergencies such as the new crown epidemic on the maritime industry will be very long-term and profound. Even if the epidemic is over and the port congestion problem is solved, the maritime market will need sufficient time to restore its former order and vitality.
Based on the eigenvector centrality, this paper scores the centrality of the global container shipping network and ranks the top 10 centrality score tables in Table 7. It can be seen that No. 1 is Shanghai Port. For the sensitivity analysis of unexpected events, we halved the throughput of Shanghai Port. Since Shanghai Port is one of the most important container ports in the world, not only would the throughput of Shanghai Port itself be significantly affected, but the transportation efficiency of the ports directly connected to Shanghai Port would also be affected to a certain extent. Therefore, we set the throughput of these ports to 0.75 of the original throughput. Figure 6a,b shows the result comparisons of three methods.
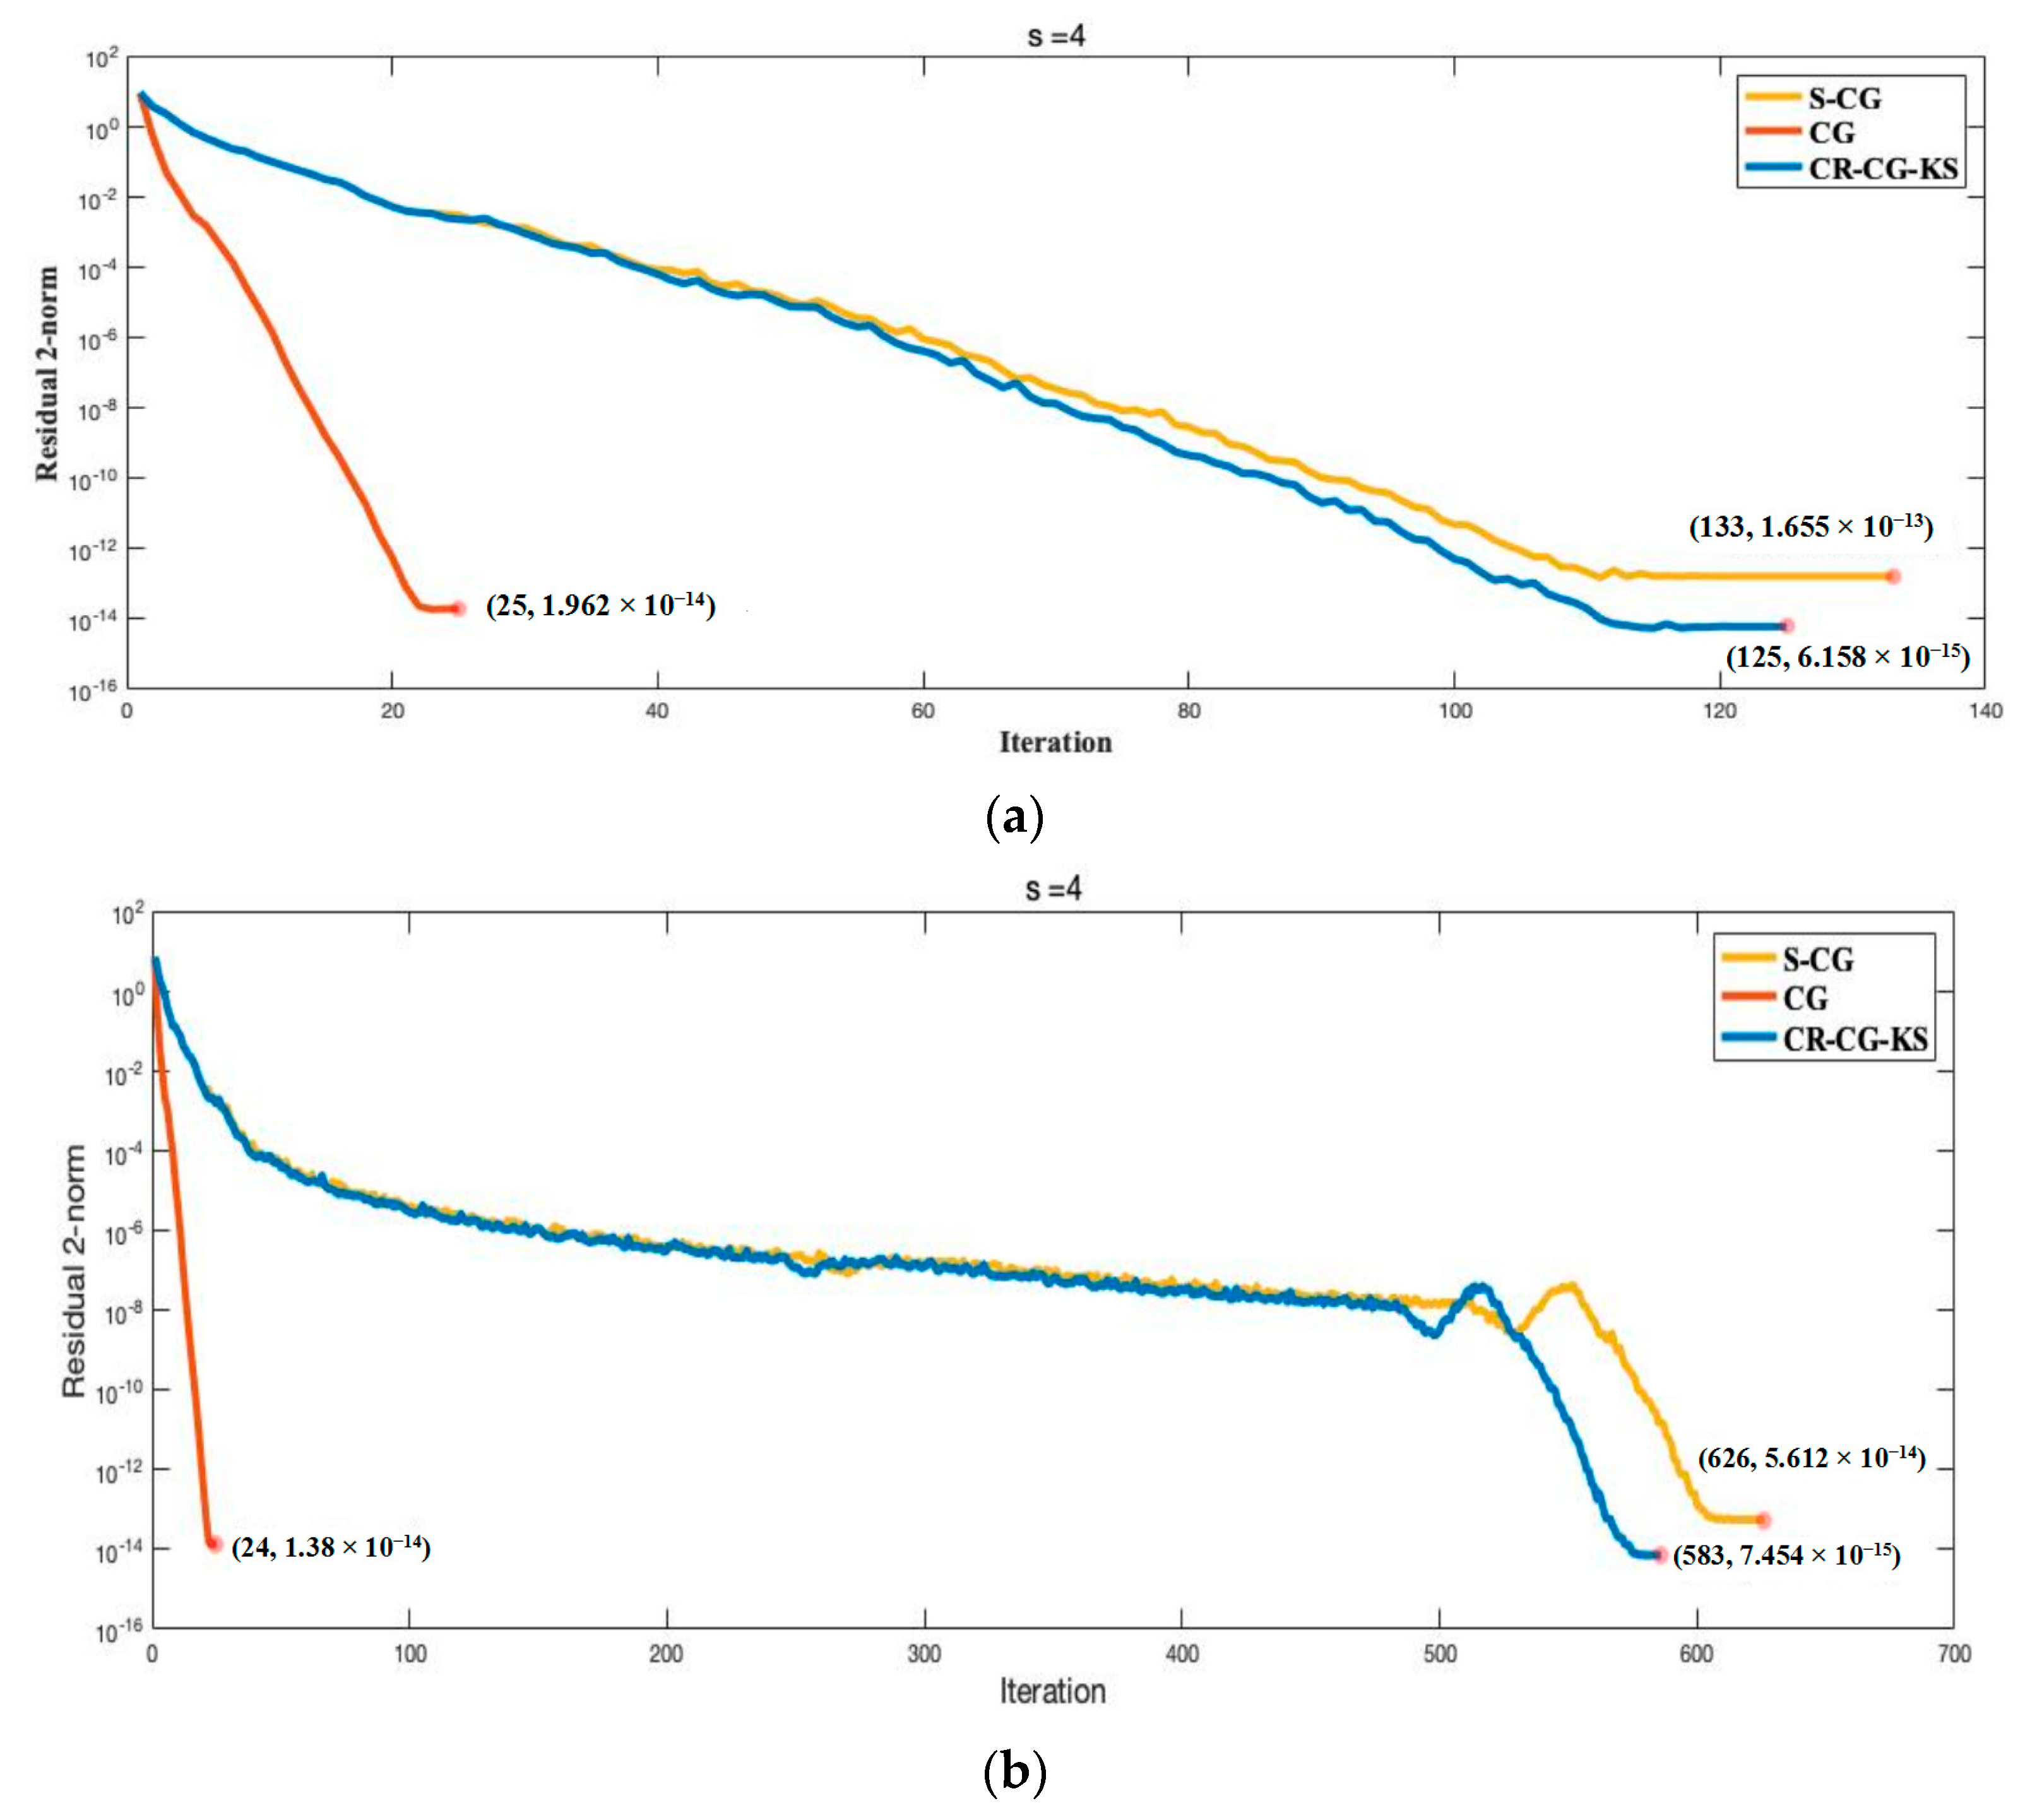
From the analysis in Section 4.2, it can be seen that CR-CG-KS is not very sensitive to S. Therefore, in this section, we will only use the inner loop parameter of S = 4 for the sensitivity simulation of the shipping network. Since Shanghai Port is a core port, the throughput of its directly connected ports decreases, which has a great impact on the entire network. In the container shipping network of 237 ports, the optimal solution is obtained in the 126th iteration, and the residual 2-norm is 1.26   ×   10−14; in the container shipping network of 625 ports, the optimal solution is obtained in the 587th iteration, the residual 2-norm is 1.345   × 10−14. Different from the normal network in Section 4.3.1 and Section 4.3.2, the container shipping network with 237 ports needs to iterate 125 times, and the residual 2-norm is 6.158   × 10−15; the container shipping network with 625 ports needs to iterate 583 times, and the residual 2-norm is 7.454   × 10−15. It can be seen that the number of iterations of the algorithm in this paper increases a lot with the scale of the network. Although the throughput of some ports has changed greatly, even if this port is a very important port, it has little effect on the number of iterations of the algorithm. However, when the throughput of the core port is reduced, the residual 2-norm is also reduced.

4.4. Network Connectivity Analysis

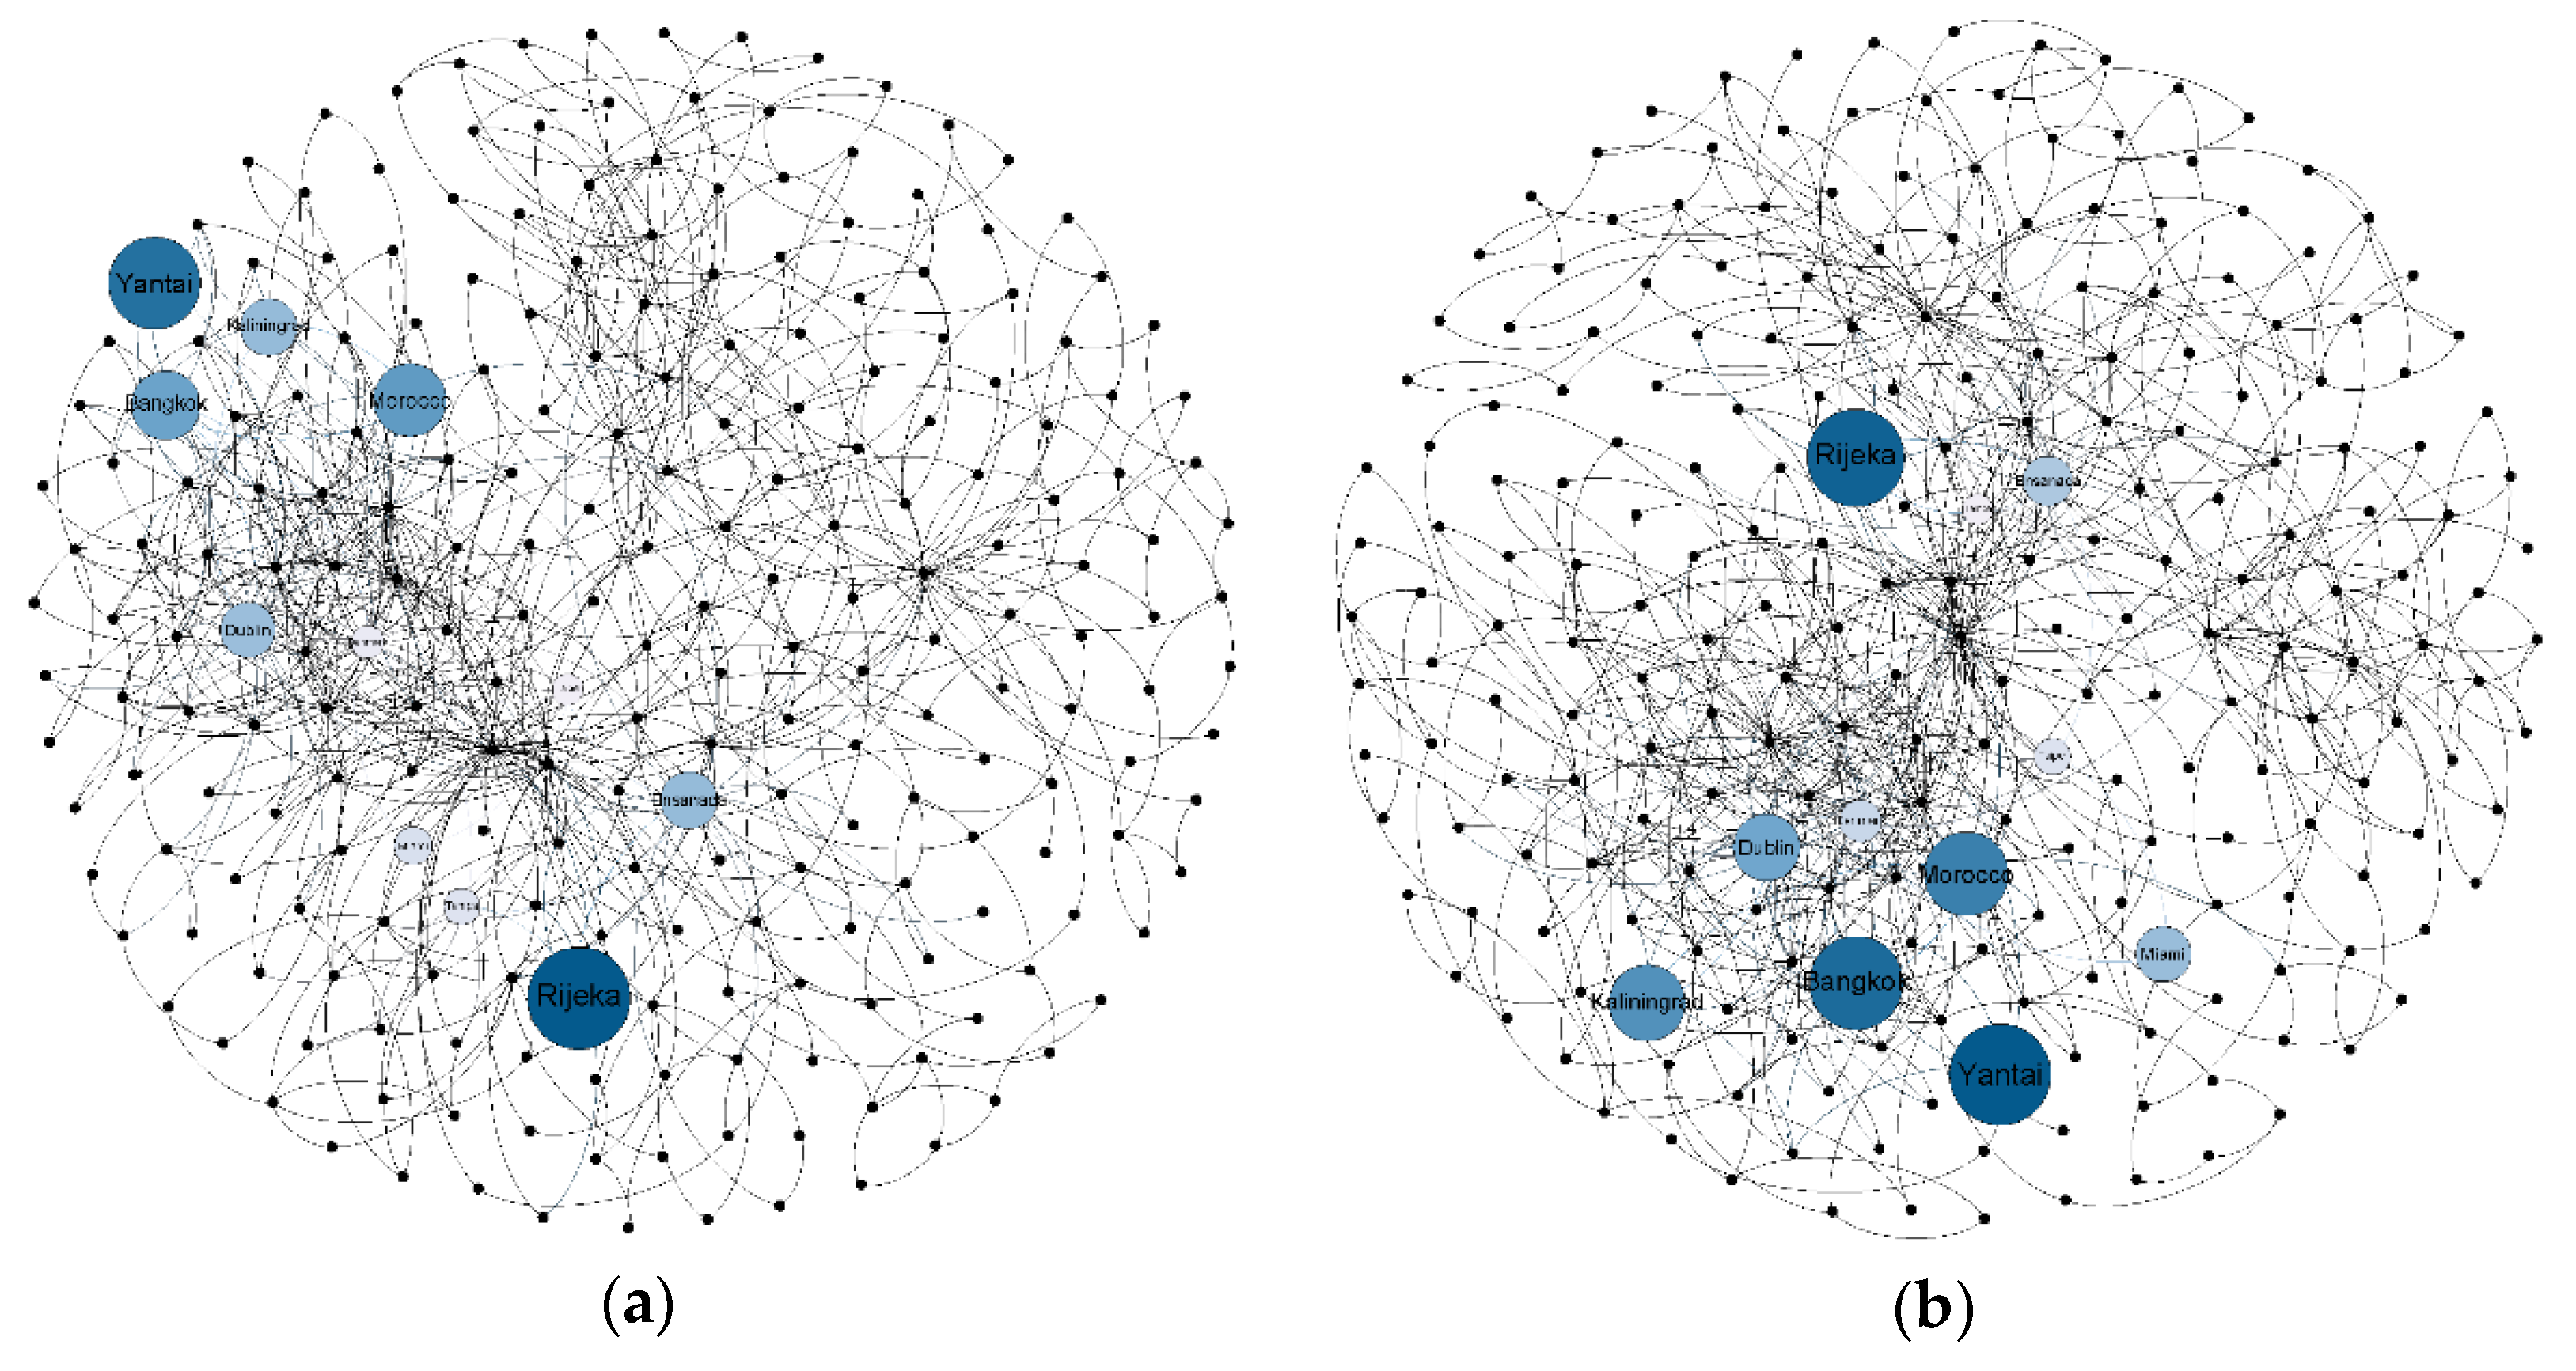
The reconfiguration will change the centralities of ports, the links and the topology of container shipping network. For example, there are obvious changes in the central ranking of the 11 ports that need to be optimized, which is shown in Table 8; and the major container shipping network with 237 ports after reconfiguration has a significant difference to that before reconfiguration, which can be seen in Figure 7a,b. This will lead to changes in network performance. Network efficiency is an important property of network performance research. In the domain of complex networks, Latora and Marchiori demonstrated the relationship between network efficiency and the shortest paths [34]. In the research of container transportation networks, network efficiency such as E[A] in Equation (52) has been widely used as a measure of connectivity.
E [ A ] = 1 n ( n 1 ) i j N 1 a i j
As seen in Equation (52), the higher the link weight, the lower the efficiency, which is not applicable to the case of service capacity considered in this paper. Wang [35] used eigenvector centrality to determine the accessibility of ports in liner shipping networks. Their results validated the superiority of this approach and demonstrated that the principal eigenvectors were also an important indicator of the nature of ports, and eigenvector centrality could provide a good measure of network connectivity.
To verify the connectivity after reconfiguration of the global container shipping network, this paper takes the product of the network efficiency and the largest eigenvalue as the connectivity measure coefficient and calculates the connectivity improvement proportional coefficient based on the model in Section 2.3:
P L = E ( A n ) e i g n E ( A s ) e i g s E ( A s ) e i g s
where E A s and E A n represent the network efficiency before and after network reconfiguration, respectively, and e i g s and e i g n represent the maximum eigenvalues before and after the reconfiguration of the global container shipping network, respectively.
From the calculation, the connectivity coefficient of the major container shipping network with 237 ports before reconfiguration is 50.72, while the eigenvalue after reconfiguration is 52.88, and the overall property is improved by 4.26%. The connectivity coefficient of the global container shipping network with 625 ports is 183.29, while the eigenvalue after optimization is 190.53, and the overall property is improved by 3.95%. It can be seen that after the service capability reconfiguration of the global container shipping network, its connectivity has also been improved.

5. Conclusions

In this paper, a new mixed integer model of global containerized shipping network reconfiguration is developed based on the combination of connectivity frequency, throughput, port distance and route importance. A communication-reducing conjugate gradient method based on Krylov Subspace is proposed to quickly calculate the shipping network reconfiguration values. The comprehensive reconfiguration performance is measured by the maximum eigenvalue of the weighted adjacency matrix. Due to the rapid development of the maritime industry and the increasing emphasis on containerized shipping, this study is beneficial for business managers to proactively respond to the future development of the maritime network and to improve the operational efficiency of the global containerized shipping network.
In future work, we will comprehensively consider the reconfigurability of ports, routes, and container flows to further improve the practicability of models and algorithms. In addition, we will investigate the possibility of applying the proposed approach to other transport networks.

Author Contributions

Conceptualization, resources, review and editing, J.L.; methodology, software, validation, formal analysis, writing, H.Z.; supervision, B.X. All authors have read and agreed to the published version of the manuscript.

Funding

This research was funded by the National Natural Science Foundation of China (No. 52102466), the Natural Science Foundation of Shanghai (No. 21ZR1426900), the Soft Science Research Project of Shanghai (No. 21692108300) and the University Think Tank Connotation Construction Program Support Project of Shanghai (No. 2022ZKNH039). Here we would like to express our gratitude to them.

Conflicts of Interest

The authors declare no conflict of interest.

References

  1. Naanwaab, C.; Antwi, J. International Integration, Trade, and the Great Recession. Int. Econ. J. 2019, 33, 128–148. [Google Scholar] [CrossRef]
  2. Chang, Y.-C. Accelerating domestic and international dual circulation in the Chinese shipping industry—An assessment from the aspect of participating RCEP. Mar. Policy 2022, 135, 104862. [Google Scholar] [CrossRef]
  3. Zhang, L.; Lu, J.; Fu, B.; Li, S. A Review and Prospect for the Complexity and Resilience of Urban Public Transit Network Based on Complex Network Theory. Complexity 2018, 2018, 2156309. [Google Scholar] [CrossRef] [Green Version]
  4. Roca-Riu, M.; Estrada, M.; Trapote, C. The design of interurban bus networks in city centers. Transp. Res. Part A Policy Pract. 2012, 46, 1153–1165. [Google Scholar] [CrossRef]
  5. Jia, T.; Jiang, B. Building and analyzing the US airport network based on en-route location information. Phys. A Stat. Mech. Its Appl. 2012, 391, 4031–4042. [Google Scholar] [CrossRef]
  6. Wang, J.; Mo, H.; Wang, F.; Jin, F. Exploring the network structure and nodal centrality of China’s air transport network: A complex network approach. J. Transp. Geogr. 2011, 19, 712–721. [Google Scholar] [CrossRef]
  7. Lin, J.; Ban, Y. Comparative Analysis on Topological Structures of Urban Street Networks. ISPRS Int. J. Geo-Inf. 2017, 6, 295. [Google Scholar] [CrossRef] [Green Version]
  8. Shang, W.-L.; Chen, Y.; Bi, H.; Zhang, H.; Ma, C.; Ochieng, W.Y. Statistical Characteristics and Community Analysis of Urban Road Networks. Complexity 2020, 2020, 6025821. [Google Scholar] [CrossRef]
  9. Wang, N.; Wu, N.; Dong, L.-l.; Yan, H.-k.; Wu, D. A study of the temporal robustness of the growing global container-shipping network. Sci. Rep. 2016, 6, 34217. [Google Scholar] [CrossRef]
  10. Parola, F.; Risitano, M.; Ferretti, M.; Panetti, E. The drivers of port competitiveness: A critical review. Transp. Rev. 2017, 37, 116–138. [Google Scholar] [CrossRef]
  11. Kang, D.J.; Woo, S.-h. Liner shipping networks, port characteristics and the impact on port performance. Marit. Econ. Logist. 2017, 19, 274–295. [Google Scholar] [CrossRef]
  12. Bell, M.G.H.; Kurauchi, F.; Perera, S.; Wong, W. Investigating transport network vulnerability by capacity weighted spectral analysis. Transp. Res. Part B Methodol. 2017, 99, 251–266. [Google Scholar] [CrossRef]
  13. Ameln, M.; Sand Fuglum, J.; Thun, K.; Andersson, H.; Stålhane, M. A new formulation for the liner shipping network design problem. Int. Trans. Oper. Res. 2019, 28, 638–659. [Google Scholar] [CrossRef]
  14. Ducruet, C.; Wang, L.H. China’s Global Shipping Connectivity: Internal and External Dynamics in the Contemporary Era (1890–2016). Chin. Geogr. Sci. 2018, 28, 202–216. [Google Scholar] [CrossRef] [Green Version]
  15. Jiang, J.L.; Lee, L.H.; Chew, E.P.; Gan, C.C. Port connectivity study: An analysis framework from a global container liner shipping network perspective. Transp. Res. Part E-Logist. Transp. Rev. 2015, 73, 47–64. [Google Scholar] [CrossRef]
  16. Pan, J.J.; Bell, M.G.H.; Cheung, K.F.; Perera, S.; Yu, H. Connectivity analysis of the global shipping network by eigenvalue decomposition. Marit. Policy Manag. 2019, 46, 957–966. [Google Scholar] [CrossRef]
  17. Tagawa, H.; Kawasaki, T.; Hanaoka, S. Exploring the factors influencing the cost-effective design of hub-and-spoke and point-to-point networks in maritime transport using a bi-level optimization model. Asian J. Shipp. Logist. 2021, 37, 192–203. [Google Scholar] [CrossRef]
  18. Fontes, F.F.d.C.; Goncalves, G. A variable neighbourhood decomposition search approach applied to a global liner shipping network using a hub-and-spoke with sub-hub structure. Int. J. Prod. Res. 2019, 59, 30–46. [Google Scholar] [CrossRef]
  19. Rodrigue, J.-P. The geography of maritime ranges: Interfacing global maritime shipping networks with Hinterlands. GeoJournal 2020, 87, 1231–1244. [Google Scholar] [CrossRef]
  20. Basallo-Triana, M.J.; Vidal-Holguín, C.J.; Bravo-Bastidas, J.J. Planning and design of intermodal hub networks: A literature review. Comput. Oper. Res. 2021, 136, 105469. [Google Scholar] [CrossRef]
  21. Zhang, X.N.; Lam, J.S.L.; Iris, C. Cold chain shipping mode choice with environmental and financial perspectives. Transp. Res. Part D-Transp. Environ. 2020, 87, 102537. [Google Scholar] [CrossRef]
  22. Minárik, M.; Čiderová, D. The new “global”: The role of cargo maritime transport of goods with focus on the transportation corridor between Southeast Asia and Northwestern Europe. SHS Web Conf. 2021, 92, 09010. [Google Scholar] [CrossRef]
  23. Tsiotas, D.; Niavis, S.; Sdrolias, L. Operational and geographical dynamics of ports in the topology of cruise networks: The case of Mediterranean. J. Transp. Geogr. 2018, 72, 23–35. [Google Scholar] [CrossRef]
  24. Christiansen, M.; Hellsten, E.; Pisinger, D.; Sacramento, D.; Vilhelmsen, C. Liner shipping network design. Eur. J. Oper. Res. 2020, 286, 1–20. [Google Scholar] [CrossRef]
  25. Brouer, B.D.; Desaulniers, G.; Pisinger, D. A matheuristic for the liner shipping network design problem. Transp. Res. Part E-Logist. Transp. Rev. 2014, 72, 42–59. [Google Scholar] [CrossRef] [Green Version]
  26. Van Der Vorst, H.A.; Ye, Q. Residual Replacement Strategies for Krylov Subspace Iterative Methods for the Convergence of True Residuals. SIAM J. Sci. Comput. 2000, 22, 835–852. [Google Scholar] [CrossRef] [Green Version]
  27. Carson, E.C. An adaptive $s$-step conjugate gradient algorithm with dynamic basis updating. Appl. Math. 2020, 65, 123–151. [Google Scholar] [CrossRef]
  28. Chronopoulos, A.T.; Gear, C.W. On the efficient implementation of preconditioned s-step conjugate gradient methods on multiprocessors with memory hierarchy. Parallel Comput. 1989, 11, 37–53. [Google Scholar] [CrossRef]
  29. Carson, E.C. The adaptive s-step conjugate gradient method. Siam J. Matrix Anal. Appl. 2018, 39, 1318–1338. [Google Scholar] [CrossRef] [Green Version]
  30. Carson, E.; Demmel, J. A residual replacement strategy for improving the maximum attainable accuracy of s-step krylov subspace methods. SIAM J. Matrix Anal. Appl. 2014, 35, 22–43. [Google Scholar] [CrossRef] [Green Version]
  31. Zhang, D.H.; Zhang, Y.J.; Zhang, C. Data mining approach for automatic ship-route design for coastal seas using AIS trajectory clustering analysis. Ocean. Eng. 2021, 236, 109535. [Google Scholar] [CrossRef]
  32. Bai, X.W.; Cheng, L.Q.; Iris, C. Data-driven financial and operational risk management: Empirical evidence from the global tramp shipping industry. Transp. Res. Part E-Logist. Transp. Rev. 2022, 158, 102617. [Google Scholar] [CrossRef]
  33. Ammirati, M.; Bernardo, A.; Musumeci, A.; Bricolo, A. Comparison of different infratentorial-supracerebellar approaches to the posterior and middle incisural space: A cadaveric study. J. Neurosurg. 2002, 97, 922. [Google Scholar] [CrossRef]
  34. Latora, V.; Marchiori, M. Efficient Behavior of Small-World Networks. Phys. Rev. Lett. 2001, 67, 198701. [Google Scholar] [CrossRef] [Green Version]
  35. Wang, Y.; Cullinane, K. Measuring Container Port Accessibility: An Application of the Principal Eigenvector Method (PEM). Marit. Econ. Logist. 2008, 10, 75–89. [Google Scholar] [CrossRef]
Figure 1. Sparse matrix algorithm comparison: (a) S = 4; (b) S = 8; (c) S = 12.
Jmse 10 00873 g001aJmse 10 00873 g001b
Figure 2. Algorithm iterative process comparisons (237 ports): (a) S = 4 (b) S = 8 (c) S = 12.
Jmse 10 00873 g002
Figure 3. Global container shipping network reconfiguration results comparison (237 ports): (a) direct comparison; (b) fitted comparison.
Jmse 10 00873 g003
Figure 4. Algorithm iterative process comparison (625 ports): (a) S = 4 (b) S = 8 (c) S = 12.
Jmse 10 00873 g004
Figure 5. Global container shipping network reconfiguration results comparison (625 ports): (a) direct comparison; (b) fitted comparison.
Jmse 10 00873 g005
Figure 6. Algorithm iterative process comparison: (a) S = 4, 237 ports (b) S = 4, 625 ports.
Jmse 10 00873 g006
Figure 7. The global container shipping network comparison under service capability configuration: (a) before configuration (b) after configuration.
Jmse 10 00873 g007
Table 1. Key notations.
NotationMeaning
GThe global container network
AThe frequency matrix
DThe degree matrix of A
LThe Laplacian for the container shipping network G
NSet of ports
vThe eigenvector of A
HSet of hub ports
RSet of ports in RCEP
NHNumber of hub ports
NRNumber of ports in RCEP
x k R A binary variable that equals 1 if port k is port in RCEP, and 0 otherwise
x k H A binary variable that equals 1 if port k is port in set H, and 0 otherwise
qijThe number of containers to be transported from origin port i to destination port j
OijThe cost for transporting one TEU (twenty-foot equivalent unit) container between ports i and j.
DISijThe distance between ports (or dummy nodes) i and j
MSet of links in the container shipping network
CSet of container shipping routes
R O U i j C M If there is a link between ports i and j, and the link belongs to both sets M and C, it is 1; otherwise, it is 0
KTotal number of global container shipping routes
fMaximum link frequency
IThe indicator matrix
SoInitial reconfiguration factor
Table 2. Top 10 container shipping companies in the world as of 2021.
RankShipping CompanyMarket Share
1Mediterranean Shg Co17.2%
2Maersk16.7%
3CMA CGM Group12.8%
4COSCO Group11.5%
5Hapag-Lloyd6.8%
6Evergreen Line6.0%
7ONE (Ocean Network Express)5.9%
8HMM Co Ltd.3.2%
9Yang Ming Marine Transport Crop2.6%
10Zim1.8%
Table 3. Excellent service capacity ports.
PortDefault ValueCalculated ValueP
Tempa0.0240.021−13.78%
Rijeka0.0620.056−11.26%
Ensanada0.0360.031−10.45%
Table 4. Service capacity needs to be optimized for these ports.
PortDefault ValueCalculated ValueP
Taipei0.0210.02410.54%
Miami0.0250.03411.26%
Denmark0.0220.02711.38%
Dublin0.0350.04012.35%
Kaliningrad0.0360.04513.28%
Morocco0.0450.04913.43%
Bangkok0.0430.05413.71%
Yantai0.0560.05815.62%
Table 5. Proportion of global container transport network reconfiguration (237 ports).
PNumber of PortsMeasuresProportion
P ≤ −10%3Reduce service capabilities1%
−10% < P ≤ 0122-52%
0 < P ≤ 10%104-44%
P > 10%8Increase service capabilities3%
Table 6. Proportion of global container transport network reconfiguration (625 ports).
PNumber of PortsMeasuresProportion
P ≤ −10%25Reduce service capabilities4.00%
−10% < P ≤ 0334-53.44%
0 < P ≤ 10%243-38.88%
P > 10%23Increase service capabilities3.68%
Table 7. Ports with excellent service capacity.
RankPortCountryScore
1ShanghaiChina0.627
2SingaporeSingapore0.163
3NingboChina0.104
4Hong KongChina0.080
5TianjinChina0.077
6QingdaoChina0.073
7ShenzhenChina0.071
8PusanKorea0.066
9Port kelangMaMalaysia0.062
10XiamenChina0.060
Table 8. Port centrality score comparison.
NumberPortInitial RankingAfter Reconfiguration
22Taipei6145
65Miami3026
104Denmark9886
111Dublin144123
155Kaliningrad9994
182Morocco213123
213Bangkok223136
233Yantai234145
46Tampa173201
88Sankt Veit am Flaum129156
201Ensenada158170
Publisher’s Note: MDPI stays neutral with regard to jurisdictional claims in published maps and institutional affiliations.