Next Article in Journal
Four Points of View on the Designation of the Navigation Area for Yachts
Next Article in Special Issue
The Tanais Bay of the Eastern Paratethys Sea at the Sarmatian–Maeotian Transition (Late Miocene): Widespread Desiccations and Local Uplifts in the Light of Historical Information
Previous Article in Journal
A Novel Wellbore-Wall Heating Method without External Energy Injection for Natural Gas Hydrate Production—A Heat Transfer Device
Previous Article in Special Issue
Organic Matter Burial in Deep-Sea Fans: A Depositional Process-Based Perspective
 
 
Correction published on 4 November 2022, see J. Mar. Sci. Eng. 2022, 10(11), 1654.
Article

Geochemical Analysis of Cretaceous Shales from the Hazara Basin, Pakistan: Provenance Signatures and Paleo-Weathering Conditions

by
Abdul Ghaffar Fazal
1,*,
Muhammad Umar
2,
Faisal Shah
1,3,
Muhammad Armaghan Faisal Miraj
4,
Hammad Tariq Janjuhah
5,*,
George Kontakiotis
6 and
Abdul Khaliq Jan
7
1
Department of Earth Sciences, Abbottabad University of Science and Technology, Havelian 22500, Pakistan
2
Department of Earth Sciences, The University of Haripur, Haripur 22620, Pakistan
3
National Centre of Excellence in Geology, University of Peshawar, Peshawar 25000, Pakistan
4
Institute of Geology, University of the Punjab, Lahore 54590, Pakistan
5
Department of Geology, Shaheed Benazir Bhutto University, Sheringal 18050, Pakistan
6
Department of Historical Geology-Paleontology, Faculty of Geology and Geoenvironment, School of Earth Sciences, National and Kapodistrian University of Athens, Panepistimiopolis, 15784 Athens, Greece
7
Department of Chemistry, Shaheed Benazir Bhutto University, Sheringal 18050, Pakistan
*
Authors to whom correspondence should be addressed.
J. Mar. Sci. Eng. 2022, 10(6), 800; https://doi.org/10.3390/jmse10060800
Submission received: 27 April 2022 / Revised: 1 June 2022 / Accepted: 6 June 2022 / Published: 10 June 2022 / Corrected: 4 November 2022
(This article belongs to the Special Issue Recent Advances in Geological Oceanography)

Abstract

:
The geochemical investigation of shales from the Early to Middle Cretaceous Chichali Formation in the Hazara Basin was conducted to determine the origin, tectonic setting and evolution, paleo-weathering conditions, and paleo-oceanographic reconstruction. The research included a comprehensive field survey, sample collection, and analysis of a variety of main, trace, and rare-earth elements using an X-ray fluorescence spectrometer (XRF). Bivariate plots and ternary diagrams were used to determine the provenance, tectonic setting, and paleo-weathering conditions that existed during the development of the Chichali Formation in the Hazara Basin. The values of Ba/Sc, Ba/Co, Th/Sc, Cr/Th, Cr/Zr, Th/Co, Th/Cr, Sc/Th, bivariate plots of Al2O3 vs. TiO2, TiO2 vs. Zr, TiO2 vs. Ni, Df1–Df2, Zr vs. Nb, and La/Sc vs. Th/Co, and ternary diagram of K2O–Fe2O3–Al2O3 were used to illustrate the passive continental margin setting of Chichali Formation shales. The detailed chemical analysis also provides an understanding of the marine geochemical cycle, which reflects the origin of these sediments. The average K2O/Al2O3 value is less than 0.4, indicating that the shale contains clay minerals. The Chichali Formation’s Chemical Index of Alteration (mean = 71) and Index of Compositional Variation (mean = 1.12) values show a modest degree of chemical weathering in the source locations. From an environmental standpoint, the Chichali Formation is richer in toxic elements such as Ba, Zn, Ni, Cr, and Cu, which may be damaging to agricultural soils and drinking water when present in excess. These metals are incorporated into the formation during the weathering process.

1. Introduction

The Hazara Basin is located in northern Pakistan’s Lesser Himalaya and provides exceptional exposure to sedimentary strata ranging from the Late Proterozoic to the Holocene. It is a significant geological province due to its stratigraphic, sedimentological, and structural connections to the Himalayan orogeny [1]. The Chichali Formation is located in the Western Salt Range, Northern Kohat ranges, Trans Indus ranges, Kala-Chitta, Nizampur, and Southern Hazara. The Chichali Formation is mainly exposed in the Hazara area in Riyala, Abbottabad Township, Hernoi, Galyat, and Balolia [2]. The formation is composed of yellowish-brown to dark grey to black shale with a few interbeds of marl and sandstone in the research region [3,4]. The Chichali Formation is thought to have been deposited in mid-to-upper-outer-shelf settings [1]. Its lower contact with the Samana Suk Formation is unconformable, whereas the upper contact with the Lumshiwal Formation is transitional [5]. The formation is highly fossiliferous and ranges in age from the Late Jurassic to the Early Cretaceous [6].
There is relatively limited published work on geochemical analysis of the Chichali Formation in Pakistan’s Hazara Basin, and no major study on the geochemical investigation of these shales has been conducted so far. Shale is a common form of sedimentary rock that is exposed to the Earth’s surface [7]. The concentration of elements in shale is influenced by a variety of processes, including weathering, transport, and sedimentation into the marine environment. The chemical composition of siliciclastic sediments has been extensively used to identify the features of the source rocks [8,9,10]. The relative variation of major components within shale determines the tectonic setting of sedimentary basins [11]. Major element analysis may be used to interpret both paleo-weathering and paleo-tectonic settings [12].
Water and soil are of prime concern to mankind as both are directly linked to human health. The incorporation of increased levels of trace elements in marine sedimentary deposits above their acceptable limits produces toxic effects on soils and marine fauna. Weathered agricultural soil may be toxic to crops, and when these crops are consumed by live organisms, they can have negative effects. It can be hazardous to aquatic life as well if it mixes with the surface streams. Surface runoff and erosion of sediments will ultimately have adverse effects if they reach the underground water by percolating through the soil deep into the ground, thus contaminating the groundwater and causing adverse effects on the environment. Overall, this research will explore the geochemical characterization of shales to obtain a better understanding of the study area’s source rock potential, origin, tectonic context, and paleo-weathering environmental conditions.

2. Geological Setting and Stratigraphy

During the Cenozoic, the collision of India and Asia resulted in the formation of the Himalayas, a huge mountain chain [2,13]. The southern Hazara was formed as a result of the collision of the Indian and Eurasian plates. It is a part of the Himalayan fold and thrust belt [14,15]. The study area is in Hazara, which is situated within the Hazara Kashmir Syntaxis (Figure 1).
The exposed rocks in the Hazara area vary in age from Precambrian to Holocene [1,16], except the middle and upper Paleozoic (Figure 2) [17,18].
The Chichali Formation is well exposed in the Hazara region, particularly at Riyala (Section 1), Township Abbottabad (Section 2), and Hernoi (Section 3). The formation’s major composition is shale with intercalations of marl and sandstone. The thickness of the formation varies from 33 m in Section 1 to about 55 m in Sections 2 and 3. Shale is yellowish-brown, greenish to dark grey, and black. Due to the prevalence of glauconite, the weathered surface is yellowish-brown, but the fresh unweathered surface is greenish-grey to black. The base of Chichali, near Section 3, has coal seams, and some of those seams have been mined (Figure 3) [19,20].

3. Material and Methods

Fieldwork was conducted in detail, and three stratigraphic sections were selected for measurement and sampling. Three stratigraphic sections were measured, described, and sampled in the field (Riyala, Township Abbottabad, and Hernoi). In the field, a total of 40 shale samples were collected. The concentration of major and trace elements was determined for seventeen shale samples. An X-ray fluorescence spectrometer was used to determine the percentages of main and trace elements at Bestway Cements Limited in Hattar (PANalytical Cubix 2300 XRF), Almelo, The Netherlands.
Chemical Index of Alteration (CIA) values and the A–CN–K ternary plot reveal the paleo-weathering and tectonic history of sedimentary rocks [21]. This equation was used to calculate the Chemical Index of Alteration (CIA) for paleo-weathering analysis.
The Chemical Index of Alteration (CIA) was derived for paleo-weathering analysis using the following equation:
CIA = {Al2O3/(Al2O3+ CaO + Na2O + K2O)} × 100
The index of compositional variability (ICV) quantifies the maturity of the aluminosilicates transported to the depositional location, i.e., basin [22]. The following formula was used to calculate ICV [22]:
ICV = (Fe2O3+ K2O + Na2O + CaO + MgO + TiO2)/Al2O3

4. Results

4.1. Major and Trace Elements

The major and trace element studies of the Chichali Formation shales are summarized in Table 1. Among the principal elements analyzed, SiO2 ranges from 17.89 to 60.14 wt%; Al2O3 ranges from 4.89 to 21.19 wt%; TiO2 ranges from 0.5 to 1.48 wt%; Fe2O3 ranges from 1.26 to 9.27 wt%; K2O ranges from 0.61 to 5.75 wt%; and Na2O ranges from 0.01 to 0.17 wt%.
Sc ranges from 4.1–15.3 parts per million; V ranges from 64–270 ppm; Cr ranges from 85–135 ppm; Co ranges from 3.71–11.4 ppm; Ni ranges from 9–28 ppm; Cu ranges from 29–79 ppm; Zn ranges from 41–169 ppm; Rb ranges from 119–248 ppm; Sr ranges from 103–350 ppm; Zr ranges from 100–485 ppm; La ranges from 15.6–39.9 ppm; Th ranges 15.1–38.2 ppm; and U ranges from 2.4–5.3 ppm. CaO is present in small amounts in the sediments owing to the lack of carbonate cement. MgO and CaO are often found in association with dolomite, ferrous carbonates, and calcite [23]. Increased MgO and CaO concentrations indicate the presence of carbonate minerals, while a low concentration indicates the presence of clay minerals [24]. The reduced Na2O demonstrates the source rock’s recycling, moderate to severe weathering, and its removal during transportation [25]. The K2O/Al2O3 ratio is used to determine the original composition of ancient mud rocks. The K2O/Al2O3 ratios in the Hazara area’s Chichali Formation shales are less than 0.4, indicating the presence of clay minerals.
The trace element ratio is frequently used to estimate the felsic and mafic composition of rocks. This research makes use of the Th/Sc, Th/Cr, Th/Co, and La/Sc ratios [26]. The results of the present study’s elemental ratio analysis were compared to the conventional values for felsic and mafic rocks (Table 2). The findings indicate that all trace element ratios are in favor of a felsic composition (Table 2).

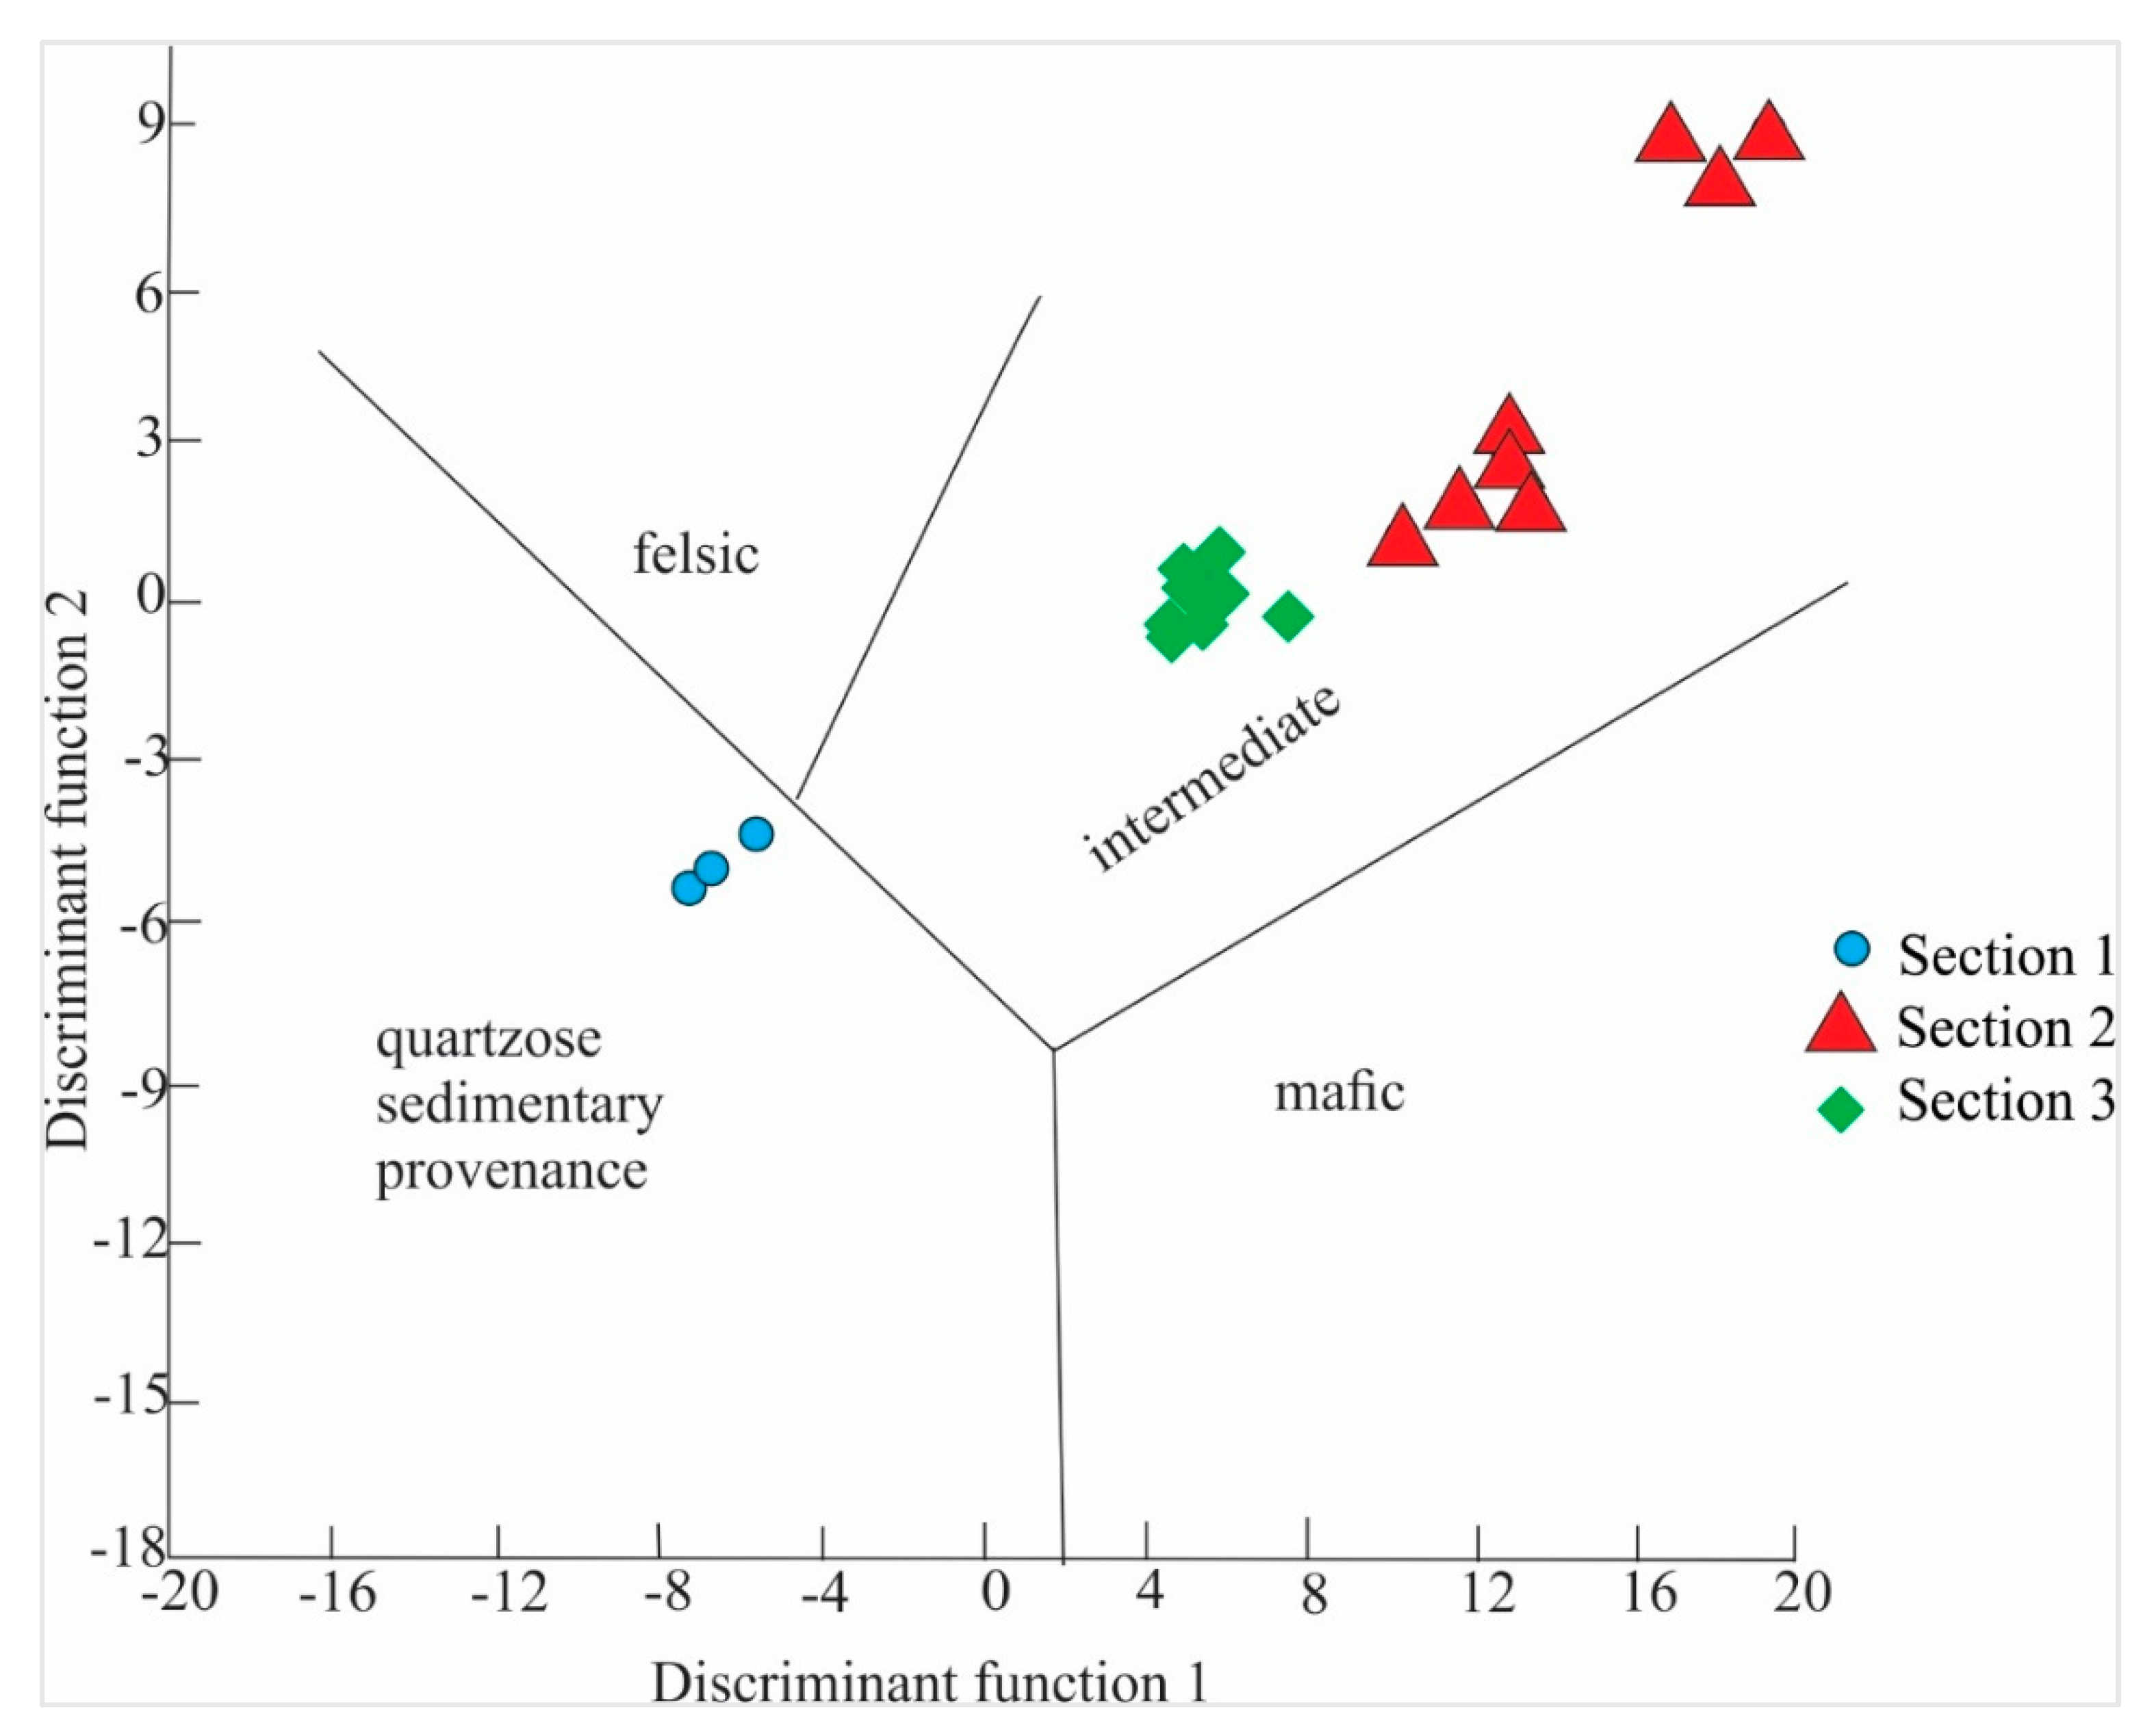
4.2. Provenance and Source Rock Potential

The relationship between TiO2 and Al2O3 was employed to determine the provenance [28]. The bivariate Al2O3 and TiO2 graph shows a concentration of data in the granodiorite area and some in the granite and basalt region (Figure 4). The plot of TiO2 vs. Ni is often used to classify rocks into acidic and basic igneous regions [29]. According to the TiO2 vs. Ni plot in our model, the Chichali Formation is derived from intermediate igneous rocks (Figure 5).
The ternary diagram of K2O–Fe2O3–Al2O3 [30] demonstrates that all shales of the Chichali Formation plotted around the Al2O3 apex, indicating Al2O3 enrichment. This finding implies that clay minerals controlled the element abundances in this shale (Figure 6) [29,31]. The plot of La/Sc vs. Th/Co may be used to identify the composition of the source rock [32]. The plotted data for La/Sc and Th/Co [32] indicate the presence of a silicic rock composition zone (Figure 7). The quantity of a trace element may be a reliable predictor of its origin [33]. The concentrations of Ni and Cr are used to indicate the presence of ultramafic rocks in the source location (Cr > 150 ppm and Ni > 100 ppm). The Chichali Formation samples show an average Cr value of 117.62 ppm and a Ni concentration of 16.35 ppm, indicating the lack of ultramafic rocks in the source region. The relationship between SiO2/Al2O3 and K2O/Na2O [10,28] suggests that the majority of the Chichali shale data plotted in the field reflect Proterozoic–Phanerozoic shale composition, demonstrating that clay minerals regulate the main element composition (Figure 8) [10,28].
Numerous authors, such as Adriano [33], Eqani, et al. [34], Qasim, et al. [35], and Martini, Walter, Ku, Budai, McIntosh and Schoell [11], have presented a variety of diagrams for discriminating between major and trace elements. To establish the provenance, the discrimination diagram makes use of variably mobile major elements and static minor elements [36]. In the discriminating diagram, Sections 2 and 3 are mostly plotted in the field of intermediate igneous rock, while Section 1 is primarily plotted in the field of quartzose sedimentary provenance (Figure 9). Additionally, the ternary diagram of K2O–Fe2O3–Al2O3 reveals important information concerning its origin [30].

4.3. Tectonic Setting

The binary diagram shows that all samples are plotted within the passive margin field, indicating that the Chichali Formation was deposited within a passive margin environment (Figure 10). The plot of SiO2 vs. K2O/Na2O is used to determine whether the shale was deposited on passive continental edges, active continental margins, or oceanic island arc margins [37]. Additionally, by incorporating major and trace element data, the discrimination diagrams can be used to infer the tectonic settings of previous terrains [38,39,40], distinguishing oceanic island arc, active continental margin, passive continental margin, and continental island arc (Figure 11).

4.4. Paleo-Weathering in the Source Area

The findings indicate that the average CIA values for all three examined sections ranged from 58 to 78, with an average of 71, indicating that the weathering conditions for these shales were mild (Table 1). Al2O3 represents the immobile component in the CIA index, while CaO, Na2O, and K2O represent the mobile components. CaO, K2O, and Na2O are employed as mobile components due to their susceptibility to weathering and their propensity for leaching during weathering. The rise in CIA values indicates that CaO, K2O, and Na2O are being removed at a faster rate than the more stable Al2O3 (Figure 12).
For kaolinite and chlorite, the CIA value is close to 100; for shale, the average value is between 70 and 75 [41]; and for fresh granite, the average value is about 50 [42].
The ICV values of the shale studied in this research are modest, with an average of 1.12. ICV values greater than one indicate immature shale, which includes rock-forming minerals such as plagioclase, K-feldspar, amphiboles, and pyroxene. The present study’s average ICV results indicate the existence of K-feldspar (0.8–1) [43]. A cross plot of the CIA and ICV values reveals an interesting picture of the chemistry of the key elements. According to Figure 13, the source rock is felsic to intermediate in composition. The classification of siliciclastic rocks is based on the plot between SiO2/Al2O3 and Fe2O3/K2O [44]. Due to the samples’ low SiO2/Al2O3 and Fe2O3/K2O contents, they all fall into the shale field when plotted in the SiO2/Al2O3 and Fe2O3/K2O binary plots (Figure 14).
Th/Sc vs. Zr/Sc plots may be used to monitor sedimentary recycling and sorting. While first-order sediments exhibit a straightforward association between Th/Sc and Zr/Sc ratios, recycled sediments exhibit a significant rise in Zr/Sc relative to Th/Sc. The Th/Sc ratio is utilized to indicate chemical differentiation in the plot [40], while the Zr/Sc ratio indicates sediment recycling in the source area [45]. Zr is an abbreviation for zircon, a physically and chemically very stable mineral that may be used to determine the influence of recycling in the source location. All samples examined in the Th/Sc vs. Zr/Sc binary plot [45] exhibit a linearly rising compositional tendency toward a higher Zr/Sc ratio, and all samples plotted in the sediment recycling field (zircon added) exhibit a linearly increasing compositional trend toward a higher Zr/Sc ratio (Figure 15). These findings indicate that the rise in zircon content in the source region occurred before sediment transfer to the Hazara basin. Thus, a binary plot of Th/Sc vs. Zr/Sc is used to figure out the effect of recycling.
The findings indicate that the average Zr/Hf ratios in the examined samples are much higher (26.73–182.37, with an average of 81.24) than in UCC and PAAS (31.6 and 42, respectively) [46]. These increased ratios may be the outcome of recycling in the source location. The Al2O3/K2O ratio exceeds 0.3, indicating the existence of K-feldspar [47].
Zr has a positive correlation value with Hf, r = 0.36. The Zr/Hf ratio of the Chichali Formation samples analyzed in the Hazara basin ranges from 26 to 182, with an average of 81. If the Zr/Hf ratio is greater than 40, zircon controls these elements. The favorable correlations between K2O and Sc, K2O and Co, Sc–Al2O3, and Co–Al2O3 indicate that these elements are concentrated in phyllosilicates after they have been broken down by the weather.
Al2O3 has a declining trend when plotted against SiO2/Al2O3, Fe2O3/Al2O3, and K2O/Al2O3 ratios for samples obtained from the Chichali Formation (Figure 16A–C). As a result of these plots, it can be deduced that as weathering proceeds, Al2O3 stays as a residue while Fe2O3, K2O, and Na2O weather away. As a result, it is indicative of the existence of clay minerals.

4.5. Geochemical Analysis of Chichali Formation

The quantities of various components in the samples investigated are summarized in Table 1. Soils are formed as a result of the weathering of rocks. In Figure 17, V, Cu, Ba, Zn, and U histograms are compared to the normal elemental concentrations of Cu, Ba, Zn, and U in soils (Figure 17) [48]. Cu levels greater than usual are seen in Sections 1 (65.67 ppm), 2 (36.88 ppm), and 3 (52 ppm) (Figure 17). Cu enrichment beyond the recommended level may result in stunting, discoloration of the root system, decreased growth, and chlorosis [49].
At 90 ppm, Zinc is recommended to be in typical soils around the globe [50]. Zn readings are greater than usual in Sections 1 (123.33 ppm) and 3 (116.33 ppm) but are within allowed limits in Section 2 (56 ppm) (Figure 17). These elevated levels cause toxicity in plants and crops. Ni levels are lower than usual in all three parts investigated, namely, Section 1 (9.33 ppm), Section 2 (18.125 ppm), and Section 3 (17.5 ppm). The examined sections show that Cr levels are much higher than usual in all of them, including Section 1 (131 ppm), Section 2 (115 ppm), and Section 3 (114 ppm).
Comparison of the average values of main oxides in the analyzed portions is displayed in the histogram (Figure 18). Section-wise comparison of SiO2 indicates that SiO2 is practically similar in Sections 1 and 3 and less in Section 2. Fe2O3 concentration is greater in Section 3 compared to Sections 1 and 2. The peaks of CaO are extremely lower, suggesting the lack of carbonates in these sediments. MgO content in Section 1 is greater than Sections 2 and 3. The presence of mafic minerals suggests a high concentration of MgO, yet the concentration of MgO here is considerably smaller compared to the mafic minerals. Sections 2 and 3 contain about the same quantity of MgO. Na2O concentration may also be observed in the histogram (Figure 18), which reveals extremely low concentration of Na2O in all the sections. This may be rationalized by the weathering events which dissolved Na2O to generate clay minerals in the examined portions.

4.6. Statistical Analysis

Other intriguing aspects of the shale are shown by the ratios of key oxides and correlation coefficient data for major and trace elements. The Pearson coefficients of correlation are listed in Supplementary Table S1. Microsoft Excel was used to compute the correlation coefficients for the major and selected trace elements in the studied shale. Correlation coefficient data aided in the comprehension of the geochemical characteristics of the Chichali Formation.
Correlations between Al2O3 and TiO2 (r = 0.90) and K2O (r = 0.88) are statistically significant. Al2O3 has a negative Pearson correlation value of −0.30 and −0.39 with CaO and MgO, respectively. Al2O3 has a highly positive and significant association with Na2O and Fe2O3 at 0.83 and 0.76, respectively. All of these correlations indicate that sediments arrange themselves during transportation. Al2O3 has a substantial positive correlation with K2O (r = 0.88) and SiO2 (r = 0.75), suggesting the existence of kaolinite and K-feldspar.
TiO2 has a significant positive correlation (r = 0.90) with Al2O3 and a negative association (r= −0.25) and MgO (r = −0.56) with CaO and MgO. TiO2 correlates positively with both Na2O and K2O (r = 0.75 and 0.65, respectively). This indicates that TiO2 is a key chemical element of clays, rather than mafic minerals. SiO2 has a negative correlation with a number of key elements, suggesting that quartz has been dissolved. The strong relationship between TiO2 and Al2O3 and the negative correlation between TiO2 and other significant elements (CaO and MgO) indicate that TiO2 is a key chemical ingredient of clays (kaolinite) rather than mafic minerals. Al2O3 correlates positively with K2O (r = 0.88) and strongly positively with SiO2 (r = 0.75). These linear lines indicate the traces of kaolinite. CaO has a negative correlation with SiO2 (r = −0.44), indicating that calcite is somewhat dominant over other minerals.
Na2O has a positive correlation with SiO2 (r = 0.71), Al2O3 (r = 0.83), Fe2O3 (r = 0.62), TiO2 (r = 0.75), and K2O (r = 0.80), but correlates negatively with CaO and MgO (r = −0.23 and −0.19). These relationships imply the presence of smectite in the shale. Certain trace elements, such as Zr, Co, Rb, Ba, and Hf, have a positive correlation with Al2O3 (r = 0.70, 0.71, 0.16, 0.34, and 0.24, respectively), suggesting that they are likely fixed in K-feldspars and clays. On the other hand, some trace elements, such as Cr, V, Ni, Cu, Rb, Nb, Cs, and U, correlate positively with Al2O3 (r = 0.04, 0.16, 0.17, 0.08, 0.16, 0.13, 0.01, and 0.08, respectively) and negatively with Sc, Sr, Sb, La, Ce, Nd, Sm, Eu, Gd, Tb, Yb, and Th (r = −0.35, −0.41, −0.02) [31].
Correlations between Ni, Cr, and Co may be utilized to determine the contribution of mafic minerals to the formation of rock. Between Cr and Ni, the correlation value is negative (r = −0.15), whereas Co is negatively connected with Cr (r = −0.01). This association indicates that acidic minerals are more prevalent than basic and ultrabasic minerals.
The concentration of large-ion lithophile elements (LILEs) varies significantly among examined samples. The alkali element Rb varies between 131–248 ppm with a mean value of 185 ppm, 119–193 ppm with a mean value of 167 ppm, and 151–227 ppm with a mean value of 192 ppm for Sections 1–3. Sr concentrations range from 130–211 ppm with an average of 163 ppm in Section 1, 124–234 ppm with an average of 152 ppm in Section 3, and 103–350 ppm with an average of 215 ppm in Section 2. The concentration of Ba in samples obtained from Section 3 ranges between 187 and 631 parts per million, with an average of 299 ppm. Its concentration ranges between 153–299 ppm with an average of 215 ppm in Section 1, whereas it fluctuates between 165–292 ppm with an average of 206 ppm in Section 2. The association between K2O and Rb is negligible, i.e., r = 0.03. The positive value indicates that the abundance of these elements is primarily controlled by clay minerals containing potassium (i.e., illite, muscovite, and biotite) [45,51]. The association between Al2O3 and Rb is positive, indicating that phyllosilicates regulate the distribution of these elements. Similarly, Al2O3 and Ba exhibit a positive correlation, indicating that phyllosilicates control the distribution of these elements as well.

5. Discussion

The findings and their interpretation in our models indicate that the Chichali Formation sediments were derived from intermediate igneous rock, namely, granodiorite. This may be validated geologically since the deposition of shelf glauconitic sand and shale of the Chichali Formation was observed during the Late Jurassic [52]. This is related to the Tethys transgression in the Late Jurassic as a result of the Indian Plate’s northwestern margin expanding along rift faults. Flooding occurred during the Late Jurassic due to the rifting of the Indian Plate’s passive continental edge. Clasts from the exposed portion of the Indian Shield were deposited in the Chichali and Sembar Formations on the shelf as a result of the thermal rising of the Indian Shield’s eastern and southern margins [2,20].
The findings of U–Pb dating are consistent with the Tethyan and lower Himalayan values. The Indian Plate was believed to be the source of the Early Cretaceous Chichali Formation due to its similarities to the Tethyan and Lesser Himalayas. In this period, the present Higher Himalayas were not excavated because they were covered by Tethyan Himalayan sediments, which ruled out the possibility of the Chichali Formation being derived from them [53]. As a result of the detrital zircon provenance, the Indian Plate was the source of the Chichali Formation. The Indian Plate split apart from Gondwana between the Late Jurassic and Early Cretaceous period and began its journey north via the Somali and Mozambique basins [54,55]. The Indian Plate was also experiencing domal uplift during this period when it passed through the Ninety-East Kerguelen [56]. As a result of domal uplift-induced erosion, the Indian Plate basins contain a significant amount of detrital sediment [57]. The evidence from the detrital record of the Chichali Formation supports erosion from Cambrian and Ordovician plutons that are common in the Tethyan and Lesser Himalayas [58]. Thus, the Aravalli Ranges might be considered a prospective source of sediment inside the Indian Plate during the Cretaceous period.
According to the interpretations made in this study, the source area experienced moderate weathering. This can be justified further by the fact that during the Late Jurassic, the study area was located at −35° paleo-latitude, which was a part of the sub-tropical climate belt, and a slightly humid to dry climate prevailed, resulting in moderate weathering in the source area. The Th/U ratio in the majority of upper crustal rocks is between 3.5 and 4. A Th/U ratio greater than 4 implies moderate to severe weather conditions in the source location. In the majority of instances, U is lost during weathering, increasing the Th/U ratio. The ratio of uranium to thorium in the Chichali Formation is more than 4, which means that the weathering of clasts from the parent rock happened in a somewhat wet-to-dry environment.
According to several tectonic setting discriminating diagrams, the Chichali Formation was deposited on the tectonically stable passive continental margin of the northern Indian Plate. At the period of the deposition of the Chichali Formation, the Indian Plate was in a state of calm, since no collisions with the Kohistan Island Arc (KIA) or the Eurasian Plate had occurred.
Nickel concentrations in typical soils have been reported to be as high as 40 ppm and as low as 25 ppm by various researchers [33,59]. Chromium levels in typical soils have been observed to range from trace to as high as 5.23% [60]. Cr concentrations of up to 4000 ppm are predicted in soils derived from igneous rocks, i.e., ultramafic rocks, while Cr concentrations of up to roughly 11 ppm are expected in sedimentary rocks [61]. The permitted limits for Zn, Ba, Ni, Cu, and Cr in drinking water are 5 ppm, 0.7 ppm, 0.02 ppm, and 0.05 ppm, respectively, as determined by Karasakal [62] (Table 3). This indicates that the average concentrations of Zn, Ba, Ni, Cu, and Cr in the examined sections that were looked at are higher than the acceptable limits set by US-EPA (1978) and Pakistan-EPA (1978).
The soil would be enriched with Cu, Zn, and Cr as a result of weathering and erosion. As Bowen [63] anticipated, weathering of the examined shale results in higher concentrations of Ba, Cu, and Zn than those seen in typical soils [64]. These elevated levels of trace elements have a toxic effect on soils. These are either agricultural or non-agricultural soils. If the soil formed by weathering is agricultural soil, it may be toxic to crops, and when these crops are consumed by living organisms, they may cause injury. The next section discusses some of the hazardous impacts of enriching these elements in crops, plants, and soils. While copper is required in minimal amounts for both plants and animals, its excessive concentration may be hazardous. Copper concentrations over a certain level may result in stunted development and chlorosis [65]. Although chromium is neither needed nor useful for plants, it is necessary for trace amounts for mammals. It is poisonous and may cause cancer in animals when present at high concentrations [66].
If surface runoff rises and erodes the Chichali Formation sediments, they will have hazardous consequences if they reach the underground water, which percolates deep into the soil pores. If it combines with surface streams, it may be toxic to aquatic life.
Copper levels in the examined portion exceed WHO (2004) and US-EPA (1978) acceptable drinking water limits [67]. If the copper in the examined portion combines with surface water or percolates down into the subsurface water table, it may cause hazardous consequences in animals and humans, such as gastrointestinal tract stimulation, irritation of stomach nerve endings, and induction of the vomiting reflex [68]. Chromium concentrations within the allowable range are required for human nutrition to sustain proper glucose metabolism. When that level exceeds a particular threshold, poisoning occurs. The deleterious consequences of consuming a high concentration of Cr in drinking water might result in nephritis and glycosuria. Nickel is reasonably safe since the US-EPA (1978) does not propose any limitations for drinking water [69]. When water containing dissolved nickel comes into contact with the skin, it may cause dermatitis, and inhalation of the water can induce lung cancer. Taking into account all of the trace elements, it has been determined that if the Chichali Formation weathers and mixes with streams or reaches the water table, a high concentration of trace elements would pollute the water, rendering it unfit for residential use.

6. Conclusions

SiO2 (17.89–60.14 wt%) is the primary major oxide in the Chichali Formation in the Hazara Basin, followed by Al2O3 (4.89–21.19 wt%), MgO (1–7.27 wt%), Fe2O3 (1.26–9.27 wt%), CaO (0.99–2.88 wt%), K2O (0.61–5.75 wt%), Na2O (0.01–0.17 wt%), and TiO2 (0.5–1.48 wt%). We computed ratios such as Ba/Sc, Ba/Co, Th/Sc, Cr/Th, Cr/Zr, Th/Co, Th/Cr, and Sc/Th, bivariate plots such as Al2O3 (wt%) versus TiO2 (ppm), TiO2 (wt%) vs. Zr (ppm), and TiO2 (wt% vs. Ni (ppm), and discriminant function (Df1–Df2). The bivariate plots of SiO2 vs. K2O/Na2O and discriminant function (Df1–Df2) indicate that the Chichali Formation’s Early Cretaceous shales have mostly passive margin settings.
The computed values of CIA, ICV, Rb, and Cs indicate that the source regime experienced mild chemical weathering. The presence of heavy metals (Ba, Zn, Ni, Cr, and Cu) in the soils formed from Chichali Formation shale implies toxicity to agriculture and drinking water if the soils are combined with agricultural soils and/or drinking water.

Supplementary Materials

The following supporting information can be downloaded at: https://www.mdpi.com/article/10.3390/jmse10060800/s1, Table S1: Pearson correlation of major and minor oxides.

Author Contributions

Conceptualization, A.G.F. and M.U.; methodology, A.G.F.; software, A.G.F. and H.T.J.; validation, A.G.F., M.U. and H.T.J.; formal analysis, A.G.F., M.U. and H.T.J.; investigation, A.G.F., M.U. and H.T.J.; resources, A.G.F. and M.U.; data curation, A.G.F. and M.U.; writing—original draft preparation, A.G.F. and M.U.; writing—review and editing, H.T.J., F.S., M.A.F.M., G.K. and A.K.J.; visualization, M.U., H.T.J., F.S. and M.A.F.M.; supervision, M.U.; project administration, M.U.; funding acquisition, G.K. and H.T.J. All authors have read and agreed to the published version of the manuscript.

Funding

This research received no external funding.

Institutional Review Board Statement

Not Applicable.

Informed Consent Statement

Not Applicable.

Data Availability Statement

Not Applicable.

Acknowledgments

We would like to express our gratitude to Bestway Cements Limited in Hattar, Pakistan, for permitting us to utilize their facilities. The authors declare that they have no potential conflicts of interest related to the article’s authorship and publication. We would like to thank the editor and the anonymous reviewers for their thorough and helpful reviews, which made our study much more valuable.

Conflicts of Interest

The authors declare no conflict of interest.

References

  1. Umar, M.; Sabir, M.A.; Farooq, M.; Khan, M.M.S.S.; Faridullah, F.; Jadoon, U.K.; Khan, A.S. Stratigraphic and sedimentological attributes in Hazara Basin Lesser Himalaya, North Pakistan: Their role in deciphering minerals potential. Arab. J. Geosci. 2015, 8, 1653–1667. [Google Scholar] [CrossRef]
  2. Ali, S.K.; Janjuhah, H.T.; Shahzad, S.M.; Kontakiotis, G.; Saleem, M.H.; Khan, U.; Zarkogiannis, S.D.; Makri, P.; Antonarakou, A. Depositional Sedimentary Facies, Stratigraphic Control, Paleoecological Constraints, and Paleogeographic Reconstruction of Late Permian Chhidru Formation (Western Salt Range, Pakistan). J. Mar. Sci. Eng. 2021, 9, 1372. [Google Scholar] [CrossRef]
  3. Abbasi, I.A.; Haneef, M.; Obaid, S.; Daud, F.; Qureshi, A.W. Mesozoic deltaic system along the western margin of the Indian plate: Lithofacies and depositional setting of Datta Formation, North Pakistan. Arab. J. Geosci. 2012, 5, 471–480. [Google Scholar] [CrossRef]
  4. Janjuhah, H.T.; Ishfaque, M.; Mehmood, M.I.; Kontakiotis, G.; Shahzad, S.M.; Zarkogiannis, S.D. Integrated Underground Mining Hazard Assessment, Management, Environmental Monitoring, and Policy Control in Pakistan. Sustainability 2021, 13, 13505. [Google Scholar] [CrossRef]
  5. Qasim, M.; Khan, M.A.; Haneef, M. Stratigraphic characterization of the Early Cambrian Abbottabad Formation in the Sherwan area, Hazara region, N. Pakistan: Implications for Early Paleozoic stratigraphic correlation in NW Himalayas, Pakistan. J. Himal. Earth Sci. 2014, 47, 25. [Google Scholar]
  6. Ahsan, N. Facies modeling, depositional and diagenetic environments of Kawagarh Formation, Hazara Basin, Pakistan. Doctoral Dissertation, College of Earth and Environmental Sciences, Punjab University, Lahore, Pakistan, 2007. [Google Scholar]
  7. Hasterok, D.; Gard, M.; Webb, J. On the radiogenic heat production of metamorphic, igneous, and sedimentary rocks. Geosci. Front. 2018, 9, 1777–1794. [Google Scholar] [CrossRef]
  8. Armstrong-Altrin, J.S.; Lee, Y.I.; Verma, S.P.; Ramasamy, S. Geochemistry of Sandstones from the Upper Miocene Kudankulam Formation, Southern India: Implications for Provenance, Weathering, and Tectonic Setting. J. Sediment. Res. 2004, 74, 285–297. [Google Scholar] [CrossRef]
  9. Armstrong-Altrin, J.S.; Lee, Y.I.; Kasper-Zubillaga, J.J.; Carranza-Edwards, A.; Garcia, D.; Eby, G.N.; Balaram, V.; Cruz-Ortiz, N.L. Geochemistry of beach sands along the western Gulf of Mexico, Mexico: Implication for provenance. Geochemistry 2012, 72, 345–362. [Google Scholar] [CrossRef]
  10. Zaid, S.M. Integrated petrographic, mineralogical, and geochemical study of the Late Cretaceous–Early Tertiary Dakhla Shales, Quseir–Nile Valley Province, central Egypt: Implications for source area weathering, provenance, and tectonic setting. Arab. J. Geosci. 2015, 8, 9237–9259. [Google Scholar] [CrossRef]
  11. Martini, A.M.; Walter, L.M.; Ku, T.C.W.; Budai, J.M.; McIntosh, J.C.; Schoell, M. Microbial production and modification of gases in sedimentary basins: A geochemical case study from a Devonian shale gas play, Michigan basin. AAPG Bull. 2003, 87, 1355–1375. [Google Scholar] [CrossRef]
  12. Lin, N.H.; Guo, Y.; Wai, S.N.; Tamehe, L.S.; Wu, Z.; Naing, N.M.; Zhang, J. Sedimentology and geochemistry of Middle Eocene-Lower Oligocene sandstones from the western Salin Sub-Basin, the Central Myanmar Basin: Implications for provenance, source area weathering, paleo-oxidation and paleo-tectonic setting. J. Southeast. Asian Earth Sci. 2019, 173, 314–335. [Google Scholar] [CrossRef]
  13. Ding, L.; Qasim, M.; Jadoon, I.A.; Khan, M.A.; Xu, Q.; Cai, F.; Wang, H.; Baral, U.; Yue, Y. The India–Asia collision in north Pakistan: Insight from the U–Pb detrital zircon provenance of Cenozoic foreland basin. Earth Planet. Sci. Lett. 2016, 455, 49–61. [Google Scholar] [CrossRef]
  14. Jan, I.U.; Iqbal, S.; Davies, S.J.; Zalasiewicz, J.A.; Stephenson, M.H.; Wagreich, M.; Haneef, M.; Hanif, M.; Ahmad, S. A Periglacial Palaeoenvionment in the Upper Carboniferous-Lower Permian Tobra Formation of the Salt Range, Pakistan. Acta Geol. Sin. Engl. Ed. 2017, 91, 1063–1078. [Google Scholar] [CrossRef]
  15. Khan, U.; Janjuhah, H.T.; Kontakiotis, G.; Rehman, A.; Zarkogiannis, S.D. Natural Processes and Anthropogenic Activity in the Indus River Sedimentary Environment in Pakistan: A Critical Review. J. Mar. Sci. Eng. 2021, 9, 1109. [Google Scholar] [CrossRef]
  16. Ishfaque, M.; Dai, Q.; Haq, N.U.; Jadoon, K.; Shahzad, S.M.; Janjuhah, H.T. Use of Recurrent Neural Network with Long Short-Term Memory for Seepage Prediction at Tarbela Dam, KP, Pakistan. Energies 2022, 15, 3123. [Google Scholar] [CrossRef]
  17. Malkani, M.S. Stratigraphy, mineral potential, geological history and paleobiogeography of Balochistan Province, Pakistan. Sindh Univ. Res. J. -SURJ (Sci. Ser.) 2015, 43. Available online: https://sujo-old.usindh.edu.pk/index.php/SURJ/article/view/1383 (accessed on 26 April 2022).
  18. Garzanti, E.; Liang, W.; Andò, S.; Clift, P.D.; Resentini, A.; Vermeesch, P.; Vezzoli, G. Provenance of Thal Desert sand: Focused erosion in the western Himalayan syntaxis and foreland-basin deposition driven by latest Quaternary climate change. EarthSci. Rev. 2020, 207, 103220. [Google Scholar] [CrossRef]
  19. Malkani, M.S.; Mahmood, Z. Revised stratigraphy of Pakistan. Geol. Surv. Pak. Rec. 2016, 127, 1–87. [Google Scholar]
  20. Malkani, M.S.; Mahmood, Z. Stratigraphy of Pakistan. Geological Survey of Pakistan. Memoir 2017, 24, 1–134. [Google Scholar]
  21. Nesbitt, H.W.; Young, G.M. Early Proterozoic climates and plate motions inferred from major element chemistry of lutites. Nature 1982, 299, 715–717. [Google Scholar] [CrossRef]
  22. Cox, R.; Lowe, D.R.; Cullers, R. The influence of sediment recycling and basement composition on evolution of mudrock chemistry in the southwestern United States. Geochim. Cosmochim. Acta 1995, 59, 2919–2940. [Google Scholar] [CrossRef]
  23. Besly, B.; Burley, S.D.; Turner, P. The late Carboniferous ‘Barren Red Bed’ play of the Silver Pit area, Southern North Sea. In Geological Society, London, Petroleum Geology Conference Series; Geological Society of London: London, UK, 1993; Volume 4, pp. 727–740. [Google Scholar] [CrossRef]
  24. Wang, L.; Cho, D.-W.; Tsang, D.C.; Cao, X.; Hou, D.; Shen, Z.; Alessi, D.; Ok, Y.S.; Poon, C.S. Green remediation of As and Pb contaminated soil using cement-free clay-based stabilization/solidification. Environ. Int. 2019, 126, 336–345. [Google Scholar] [CrossRef] [PubMed]
  25. Hossain, I.; Roy, K.K.; Biswas, P.K.; Alam, M.; Moniruzzaman, M.; Deeba, F. Geochemical characteristics of Holocene sediments from Chuadanga district, Bangladesh: Implications for weathering, climate, redox conditions, provenance and tectonic setting. Chin. J. Geochem. 2014, 33, 336–350. [Google Scholar] [CrossRef]
  26. Cox, P.; Wood, R.; Dickson, J.; Al Rougha, H.; Shebl, H.; Corbett, P. Dynamics of cementation in response to oil charge: Evidence from a Cretaceous carbonate field, U.A.E. Sediment. Geol. 2010, 228, 246–254. [Google Scholar] [CrossRef]
  27. Deru, X.; Xuexiang, G.; Pengchun, L.; Guanghao, C.; Bin, X.; Bachlinski, R.; Zhuanli, H.; Gonggu, F. Mesoproterozoic–Neoproterozoic transition: Geochemistry, provenance and tectonic setting of clastic sedimentary rocks on the SE margin of the Yangtze Block, South China. J. Southeast. Asian Earth Sci. 2007, 29, 637–650. [Google Scholar] [CrossRef]
  28. Paikaray, S.; Banerjee, S.; Mukherji, S. Geochemistry of shales from the Paleoproterozoic to Neoproterozoic Vindhyan Supergroup: Implications on provenance, tectonics and paleoweathering. J. Southeast. Asian Earth Sci. 2008, 32, 34–48. [Google Scholar] [CrossRef]
  29. Howarth, R.J. Sources for a history of the ternary diagram. Br. J. Hist. Sci. 1996, 3, 337–356. [Google Scholar] [CrossRef]
  30. Nagarajan, R.; Madhavaraju, J.; Nagendra, R.; Armstrong-Altrin, J.S.; Moutte, J. Geochemistry of Neoproterozoic shales of the Rabanpalli Formation, Bhima Basin, Northern Karnataka, southern India: Implications for provenance and paleoredox conditions. Rev. Mex. De Cienc. Geológicas 2007, 24, 150–160. [Google Scholar]
  31. Cullers, R.L.; Barrett, T.; Carlson, R.; Robinson, B. Rare-earth element and mineralogic changes in Holocene soil and stream sediment: A case study in the Wet Mountains, Colorado, U.S.A. Chem. Geol. 1987, 63, 275–297. [Google Scholar] [CrossRef]
  32. Adriano, D. Trace Elements in Terrestrial Ecosystems; Springer: New York, NY, USA, 1986. [Google Scholar]
  33. Cullers, R.L. The controls on the major and trace element variation of shales, siltstones, and sandstones of Pennsylvanian-Permian age from uplifted continental blocks in Colorado to platform sediment in Kansas, USA. Geochim. Cosmochim. Acta 1994, 58, 4955–4972. [Google Scholar] [CrossRef]
  34. Eqani, S.A.M.A.S.; Kanwal, A.; Bhowmik, A.; Sohail, M.; Ullah, R.; Ali, S.M.; Alamdar, A.; Ali, N.; Fasola, M.; Shen, H. Spatial distribution of dust–bound trace elements in Pakistan and their implications for human exposure. Environ. Pollut. 2016, 213, 213–222. [Google Scholar] [CrossRef] [PubMed]
  35. Qasim, M.; Ding, L.; Khan, M.A.; Jadoon, I.A.K.; Haneef, M.; Baral, U.; Cai, F.; Wang, H.; Yue, Y. Tectonic Implications of Detrital Zircon Ages From Lesser Himalayan Mesozoic-Cenozoic Strata, Pakistan. Geochem. Geophys. Geosystems 2018, 19, 1636–1659. [Google Scholar] [CrossRef]
  36. Roser, B.; Korsch, R. Provenance signatures of sandstone-mudstone suites determined using discriminant function analysis of major-element data. Chem. Geol. 1988, 67, 119–139. [Google Scholar] [CrossRef]
  37. Keskin, Ş. Geochemistry of Çamardı Formation sediments, central Anatolia (Turkey): Implication of source area weathering, provenance, and tectonic setting. Geosci. J. 2011, 15, 185–195. [Google Scholar] [CrossRef]
  38. Agrawal, S.; Guevara, M.; Verma, S.P. Tectonic Discrimination of Basic and Ultrabasic Volcanic Rocks through Log-Transformed Ratios of Immobile Trace Elements. Int. Geol. Rev. 2008, 50, 1057–1079. [Google Scholar] [CrossRef]
  39. Verma, S.P.; Pandarinath, K.; Verma, S.K.; Agrawal, S. Fifteen new discriminant-function-based multi-dimensional robust diagrams for acid rocks and their application to Precambrian rocks. Lithos 2013, 168, 113–123. [Google Scholar] [CrossRef]
  40. Bhatia, M.R. Plate Tectonics and Geochemical Composition of Sandstones. J. Geol. 1983, 91, 611–627. [Google Scholar] [CrossRef]
  41. Yan, D.; Chen, D.; Wang, Q.; Wang, J. Large-scale climatic fluctuations in the latest Ordovician on the Yangtze block, South China. Geology 2010, 38, 599–602. [Google Scholar] [CrossRef]
  42. Visser, J.N.; Young, G.M. Major element geochemistry and paleoclimatology of the Permo-Carboniferous glacigene Dwyka Formation and postglacial mudrocks in southern Africa. Palaeogeogr. Palaeoclim. Palaeoecol. 1990, 81, 49–57. [Google Scholar] [CrossRef]
  43. Singh, P.K.; Khan, M.S. Geochemistry of Palaeoproterozoic Rocks of Aravalli Supergroup: Implications for Weathering History and Depositional Sequence. Int. J. Geosci. 2017, 8, 1278–1299. [Google Scholar] [CrossRef]
  44. Herron, M.M. Geochemical Classification of Terrigenous Sands and Shales from Core or Log Data. J. Sediment. Res. 1988, 58, 820–829. [Google Scholar] [CrossRef]
  45. McLennan, S.; Taylor, S.; Eriksson, K. Geochemistry of Archean shales from the Pilbara Supergroup, Western Australia. Geochim. Cosmochim. Acta 1983, 47, 1211–1222. [Google Scholar] [CrossRef]
  46. Das, B.K.; Haake, B.-G. Geochemistry of Rewalsar Lake sediment, Lesser Himalaya, India: Implications for source-area weathering, provenance and tectonic setting. Geosci. J. 2003, 7, 299–312. [Google Scholar] [CrossRef]
  47. Tulyaganov, D.; Agathopoulos, S.; Kansal, I.; Valério, P.; Ribeiro, M.; Ferreira, J. Synthesis and properties of lithium disilicate glass-ceramics in the system SiO2–Al2O3–K2O–Li2O. Ceram. Int. 2009, 35, 3013–3019. [Google Scholar] [CrossRef]
  48. Guagliardi, I.; Cicchella, D.; De Rosa, R. A Geostatistical Approach to Assess Concentration and Spatial Distribution of Heavy Metals in Urban Soils. Water Air Soil Pollut. 2012, 223, 5983–5998. [Google Scholar] [CrossRef]
  49. Shabbir, Z.; Sardar, A.; Shabbir, A.; Abbas, G.; Shamshad, S.; Khalid, S.; Natasha; Murtaza, G.; Dumat, C.; Shahid, M. Copper uptake, essentiality, toxicity, detoxification and risk assessment in soil-plant environment. Chemosphere 2020, 259, 127436. [Google Scholar] [CrossRef]
  50. Pak, E. National Standards for Drinking Water Quality; Pakistan Environmental Protection Agency, Ministry of Environment, Government of Pakistan: Isiamabad, Pakistan, 2008. [Google Scholar]
  51. Podkovyrov, V.N.; Grazhdankin, D.V.; Maslov, A.V. Lithogeochemistry of the Vendian fine-grained clastic rocks in the southern Vychegda trough. Lithol. Miner. Resour. 2011, 46, 427–446. [Google Scholar] [CrossRef]
  52. Banerjee, S.; Bansal, U.; Thorat, A.V. A review on palaeogeographic implications and temporal variation in glaucony composition. J. Palaeogeogr. 2016, 5, 43–71. [Google Scholar] [CrossRef]
  53. Jonell, T.N.; Owen, L.A.; Carter, A.; Schwenniger, J.-L.; Clift, P.D. Quantifying episodic erosion and transient storage on the western margin of the Tibetan Plateau, upper Indus River. Quat. Res. 2017, 89, 281–306. [Google Scholar] [CrossRef]
  54. Krishna, J. Applicability of the Sequence Framework in IEAP and GTM, with Brief Comments on the Hydrocarbon Prospects in the Indian Basins. In The Indian Mesozoic Chronicle; Springer: Singapore, 2017; pp. 367–459. [Google Scholar] [CrossRef]
  55. Gakkhar, R.A.; Bechte, A.; Gratzer, R. Source-rock potential and origin of hydrocarbons in the Cretaceous and Jurassic sediments of the Punjab Platform (Indus Basin, Pakistan). Pak. J. Hydrocarb. Res. 2011, 21, 1–17. [Google Scholar]
  56. Ghose, N.C.; Chatterjee, N.; Windley, B.F. Subaqueous early eruptive phase of the late Aptian Rajmahal volcanism, India: Evidence from volcaniclastic rocks, bentonite, black shales, and oolite. Geosci. Front. 2017, 8, 809–822. [Google Scholar] [CrossRef]
  57. Shen, T.; Wang, G.; Leloup, P.H.; van der Beek, P.; Bernet, M.; Cao, K.; Wang, A.; Liu, C.; Zhang, K. Controls on Cenozoic exhumation of the Tethyan Himalaya from fission-track thermochronology and detrital zircon U-Pb geochronology in the Gyirong basin area, southern Tibet. Tectonics 2016, 35, 1713–1734. [Google Scholar] [CrossRef]
  58. Naeem, M.; Burg, J.-P.; Ahmad, N.; Chaudhry, M.N.; Khalid, P. U-Pb zircon systematics of the Mansehra Granitic Complex: Implications on the early Paleozoic orogenesis in NW Himalaya of Pakistan. Geosci. J. 2016, 20, 427–447. [Google Scholar] [CrossRef]
  59. Fulekar, M.H.; Jadia, C.D. Phytoremediation: The application of vermicompost to remove zinc, cadmium, copper, nickel and lead by sunflower plant. Environ. Eng. Manag. J. 2008, 7, 547–558. [Google Scholar] [CrossRef]
  60. Dadar, M.; Adel, M.; Saravi, H.N.; Fakhri, Y. Trace element concentration and its risk assessment in common kilka (Clupeonella cultriventris caspia Bordin, 1904) from southern basin of Caspian Sea. Toxin Rev. 2017, 36, 222–227. [Google Scholar] [CrossRef]
  61. Sarapää, O.; Lauri, L.S.; Ahtola, T.; Al-Ani, T.; Grönholm, S.; Kärkkäinen, N.; Lintinen, P.; Torppa, A.; Turunen, P. Discovery Potential of Hi-Tech Metals and Critical Minerals in Finland; Geological Survey of Finland: Espoo, Finland, 2015. [Google Scholar]
  62. Karasakal, A. Determination of Trace and Major Elements in Vegan Milk and Oils by ICP-OES after Microwave Digestion. Biol. Trace Element Res. 2020, 197, 683–693. [Google Scholar] [CrossRef] [PubMed]
  63. Bowen, H.J.M. Environmental Chemistry of the Elements; Academic Press: Cambridge, MA, USA, 1979. [Google Scholar]
  64. de Caritat, P.; Reimann, C.; Team, N.P.; Team, G.P. Comparing results from two continental geochemical surveys to world soil composition and deriving Predicted Empirical Global Soil (PEGS2) reference values. Earth Planet. Sci. Lett. 2012, 319, 269–276. [Google Scholar] [CrossRef]
  65. Cassanego, M.B.B.; Goldoni, A.; Heldt, F.H.; Osório, D.M.; Windisch, P.G.; Droste, A. Germination and sporophytic development of Regnellidium diphyllum Lindm. (Marsileaceae) in the presence of copper. Acta Bot. Bras. 2013, 27, 26–30. [Google Scholar] [CrossRef]
  66. Pandey, G.; Madhuri, S. Heavy metals causing toxicity in animals and fishes. Res. J. Anim. Vet. Fish. Sci. 2014, 2, 17–23. [Google Scholar]
  67. Sathawara, N.G.; Parikh, D.J.; Agarwal, Y.K. Essential Heavy Metals in Environmental Samples from Western India. Bull. Environ. Contam. Toxicol. 2004, 73, 756–761. [Google Scholar] [CrossRef]
  68. Massa, F.; Monory, K. Endocannabinoids and the gastrointestinal tract. J. Endocrinol. Investig. 2006, 29, 47–57. [Google Scholar]
  69. Christison, T.T.; Rohrer, J.S. Direct determination of free cyanide in drinking water by ion chromatography with pulsed amperometric detection. J. Chromatogr. A 2007, 1155, 31–39. [Google Scholar] [CrossRef] [PubMed]
Figure 1. Tectonic map showing a segment of the Northwestern Himalayas’ fold and thrust belt. The rectangle indicates the location of the research area.
Jmse 10 00800 g001
Figure 2. Representation of the generalized stratigraphic succession of the Hazara Basin.
Jmse 10 00800 g002
Figure 3. Field photographs of the Chichali Formation: (A,B) Yellowish brown to grey shales (Section 1), (CE) organic-rich shales (Section 2), (FH) light to dark brown shales with interbedded marl and sandstone (Section 3).
Jmse 10 00800 g003
Figure 4. Plot of Al2O3 versus TiO2 plot for Chichali Formation shales.
Jmse 10 00800 g004
Figure 5. Diagram illustrating provenance, bivariate diagram of TiO2 wt% vs. Ni (ppm).
Jmse 10 00800 g005
Figure 6. Ternary K2O–Fe2O3–Al2O3 diagram for Chichali Formation shale.
Jmse 10 00800 g006
Figure 7. The plot of La/Sc vs. Th/Co for Chichali Formation shale.
Jmse 10 00800 g007
Figure 8. The plot of SiO2/Al2O3 versus K2O/Na2O for shales of the Chichali Formation.
Jmse 10 00800 g008
Figure 9. Provenance discrimination diagram for shales. Discriminant function 1 = (−1.773 × TiO2%) + (0.607 × Al2O3%) + (0.76 × Fe2O3T%) + (−1.5 × MgO%) + (0.616 × CaO%) + (0.509× Na2O%) + (−1.22 × K2O%) + (−9.09). Discriminant function 2 = (0.445 × TiO2%) + (0.07 ×Al2O3%) + (−0.25 × Fe2O3T%) + (−1.142 × MgO%) + (0.438 × CaO%) + (0.432 × Na2O%) + (1.426 × K2O%) + (−6.861).
Jmse 10 00800 g009
Figure 10. Plot of SiO2 versus K2O/Na2O for shales of the Chichali Formation.
Jmse 10 00800 g010
Figure 11. Discrimination function plot of the Chichali shales. Discrimination function 1 = 0.303 − 0.0447SiO2 0.972TiO2 + 0.008Al2O3 0.267Fe2O3 + 0.14MgO + 0.195CaO + 0.719Na2O − 0.032K2O. Discrimination function 2 = 43.57 − 0.421SiO2 + 1.988TiO2 − 0.526Al2O3 − 0.551Fe2O3 + 0.881MgO − 0.907CaO 0.177Na2O − 1.84K2O.
Jmse 10 00800 g011
Figure 12. Al2O3–CaO+Na2O–K2O ternary diagram.
Jmse 10 00800 g012
Figure 13. Weathering indicators, the Chemical Index of Alteration (CIA), and the Index of Chemical Variation (ICV) in Chichali Formation shales.
Jmse 10 00800 g013
Figure 14. Classification of siliciclastic rocks.
Jmse 10 00800 g014
Figure 15. Plot of the Th/Sc ratio against the ratio of Zr to Sc for the Chichali Formation.
Jmse 10 00800 g015
Figure 16. Plots of Al2O3 against (A): Fe2O3/Al2O3 ratio, (B): SiO2/Al2O3 ratio, and (C): K2O/Al2O3.
Jmse 10 00800 g016aJmse 10 00800 g016b
Figure 17. Histogram comparing the averages of the main oxides.
Jmse 10 00800 g017
Figure 18. Concentrations of elements in soils generated from shales.
Jmse 10 00800 g018
Table 1. Major and trace element data for whole-rock samples of the Chichali Formation. The concentration of major components is expressed as wt%, while trace element concentration is in ppm. CIA is an abbreviation for Chemical Index of Alteration, while ICV is an abbreviation for Index of Compositional Variability.
Section 1Section 2Section 3
Major Oxides/Trace ElementsRC-1RC-2RC-3TC-1TC-2TC-3TC-4TC-5TC-6TC-7TC-8HC-1HC-2HC-3HC-4HC-5HC-6
SiO255.147.449.029.327.244.643.744.641.840.717.854.156.054.360.152.851.0
Al2O39.497.938.027.036.9111.211.611.310.89.564.8921.120.621.219.119.019.2
Fe2O33.513.743.613.743.174.753.244.774.824.581.365.965.75.344.579.27
CaO 2.040.991.771.242.0611.831.91.661.522.881.021.771.471.731.481.79
MgO 5.857.277.11.41.261.521.8211.461.541.341.41.391.421.091.141.22
SO3 0.030.050.040.010.030.020.020.010.010.0100.050.030.070.010.10.06
Na2O 0.040.050.050.010.010.030.02.0120.120.010.010.130.130.10.170.130.11
K2O 3.543.363.281.741.372.011.741.481.861.970.615.55.235.754.64.555.19
TiO20.670.530.50.570.510.971.051.071.050.531.271.171.381.481.421.4
CIA62.864.361.170.166.778.676.376.974.873.258.276.174.374.474.675.573.0
ICV2.032.012.031.241.210.920.830.91.011.121.380.720.760.740.750.70.99
Sc5.3679.6411.81614.91115.311.712.213.414.17.756.378.7311.94.1
Cr14912012595.712712212513512994941221321429185112
V64659713828150130701121199711082678327070
Co6.414.213.715.995.036.054.465.543.94.175.0111.47.966.169.015.298.39
Ni99101519111822201921281413171221
Cu6565675742452444183629463332567966
Zn1121698986417847425746518189121114154139
Rb190119193198169248184199131175183151194159213211227
Sr130211148232261103200142350212222144234124135136139
Zr211347321331259100300200190241210388485476438454327
Nb7464544547853955705748685061734454
Sb0.60.380.250.230.650.150.460.320.390.360.410.590.370.290.390.30.37
Cs2.022.992.593.632.422.462.52.472.82.722.453.592.162.262.193.622.43
Ba299153194184292243208189176165198205187272631210290
La21.129.319.817.623.518.515.633.527.831.934.117.826.917.421.339.930.3
Ce30615777.911612013515213911814413776.654.911715463117
Nd12551.937.256.452.663.673.459.555.661.351.830215178.630.742.9
Sm197.985.068.567.519.3810.58.099.77.988.326.234.37.9711.24.38.45
Eu3.171.381.411.581.341.612.031.461.71.330.981.20.91.462.20.861.61
Gd9.75.135.314.174.295.754.495.445.244.94.24.492.734.637.972.675.04
Tb1.650.920.960.810.790.990.730.890.940.850.811.040.6211.250.581
Tm0.890.60.610.410.450.480.610.530.580.570.510.640.420.640.750.350.64
Yb6.574.163.993.383.54.213.783.63.24.13.94.482.734.215.472.44.35
Lu1.030.640.610.540.550.650.560.570.540.610.590.680.440.650.830.390.66
Hf3.465.293.335.293.333.742.94.12.763.123.43.624.72.613.67.645.72
Ta5.034.033.353.083.155.92.173.774.232.783.124.933.094.274.582.323.6
Th38.228.4292322.43022.328.627.319.822.329.624.224.928.715.122.7
U5.34.764.533.414.185.612.955.194.22.45.25.14.555.152.724.5
Table 2. The elemental ratios of shales from the Chichali Formation were compared to those of equivalent fractions obtained from felsic and mafic rocks in this research.
Elemental Ratio Range of Shales from the Chichali FormationRange of Sediments (Based on Cullers [27]).
Felsic RocksMafic Rocks
Th/Sc1.26–7.120.84–20.50.05–0.22
Th/Co2.52–7.810.67–19.40.04–1.4
Th/Cr0.17–0.310.13–2.70.018–0.046
La/Sc1.24–7.392.5–16.30.43–0.86
Table 3. Criteria of heavy metal concentrations in normal soils and drinking water. A = Standard values for normal soils; B = Maximum contaminant level (MCL); C = Maximum contaminant level (MCL); D = Maximum contaminant level (MCL).
ParameterMean Sec-1Mean Sec-2Mean Sec-3Min–Max Sec-1Min–Max Sec-2Min–Max Sec-3Standard (Soils)A(MCL)B(MCL)C(MCL)D
Copper
(Cu)
65.636.85265–6718–5732–6620–401.311
Chromium
(Cr)
131.3115.2114120–14994–13585–14290-0.050.05
Nickel
(Ni)
9.3318.117.544,81444,88744,92340-0.02<0.02
Zinc
(Zn)
123.356116.389–16941–8681–15444,880555
Barium
(Ba)
215.3206.8299153–299165–243187–631--0.70.7
Publisher’s Note: MDPI stays neutral with regard to jurisdictional claims in published maps and institutional affiliations.

