
Dynamic Appointment Rescheduling of Trucks under Uncertainty of Arrival Time

 ,
, 
Abstract
:1. Introduction
1.1. Background
1.2. Research Significance
1.3. Innovation
- (1)
- This study proposes a re-confirmation strategy which can keep track of the actual arrival time of trucks. For the trucks that cannot arrive at the port on time, a rescheduling strategy is adopted to reduce the comprehensive operating costs of the trucking company and the port company. A model of re-booking and rescheduling of the trucks when the arrival time is uncertain is established to promote the effect of reservation.
- (2)
- In this study, a double-chain real-quantity quantum genetic algorithm is proposed for the re-scheduling problem of trucks that cannot arrive at the port on time. A double-chain real number encoding method is designed to better represent the reservation status of the set card. At the same time, the quantum revolving gate and mutation are adaptively adjusted to speed up the running time of the entire algorithm.
2. Related Works
2.1. Research on the Deterministic Problems
2.2. Research on the Uncertainty Problem
3. Problem Description
4. Dynamic Appointment Rescheduling Model for Trucks with Uncertain Arrival Time
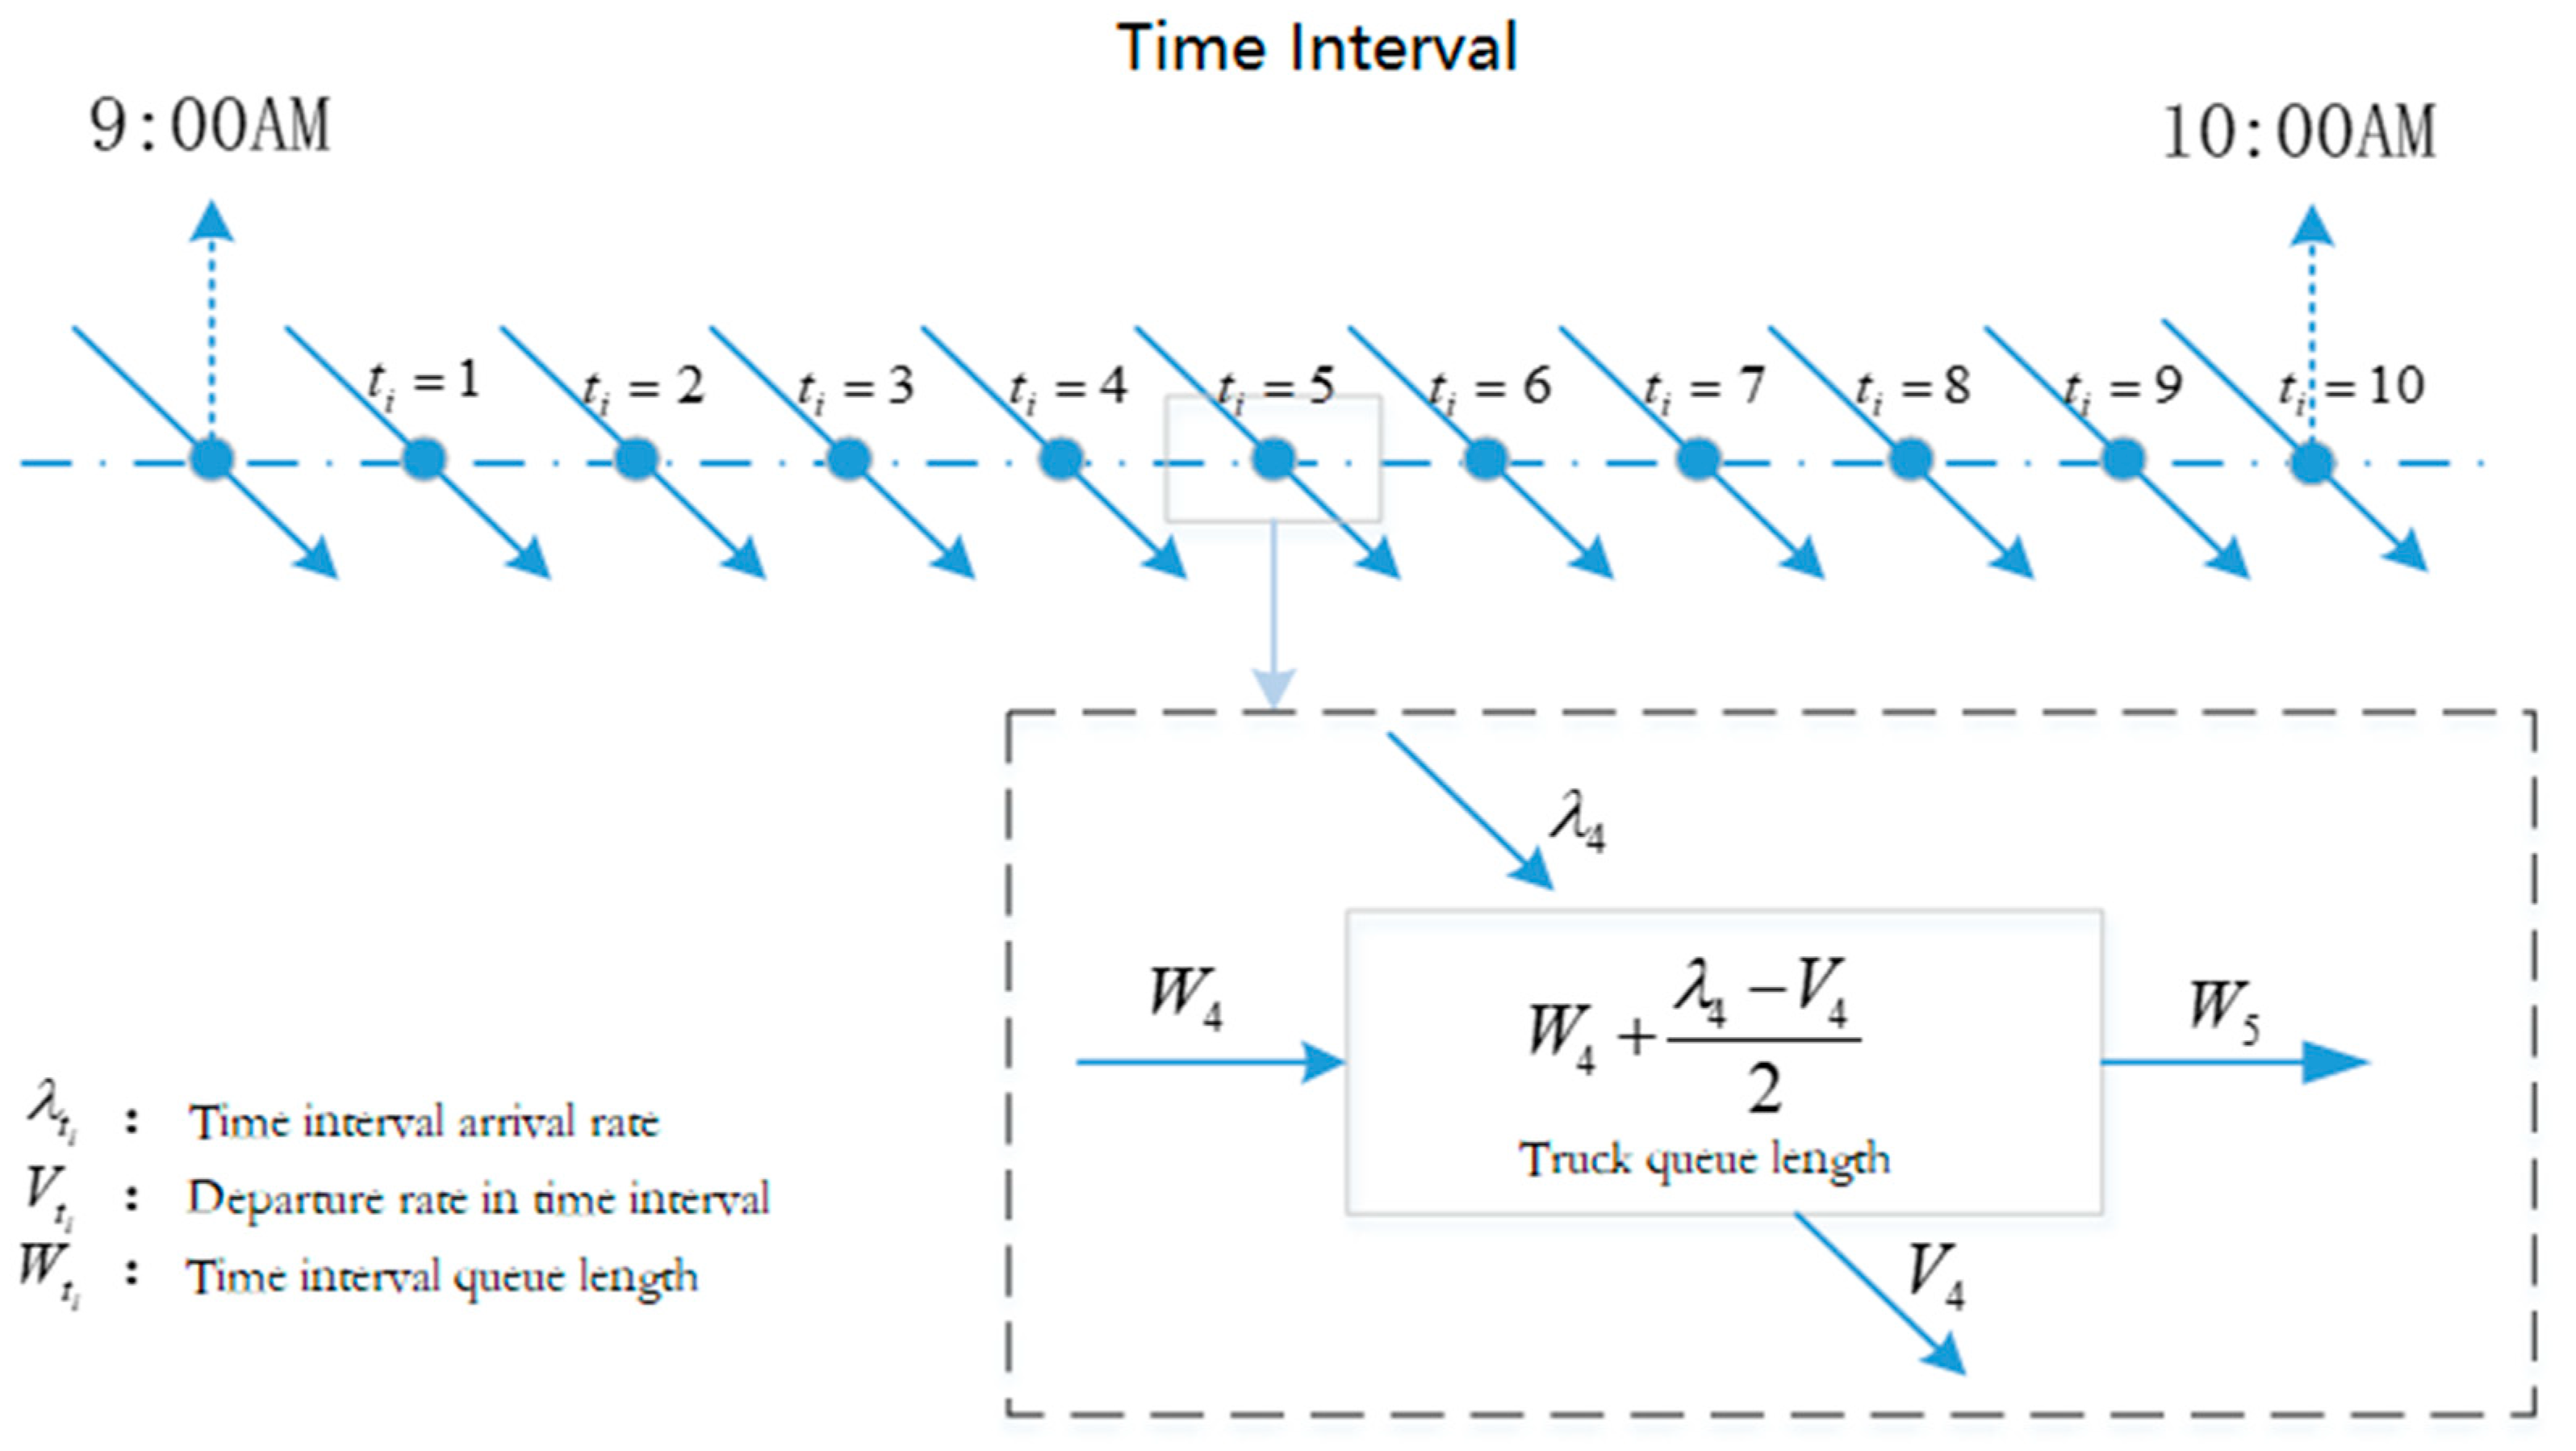
4.1. Variable Definitions
| Time window of the port | |
| Time window for trucks arriving late or early | |
| Time interval of each time window | |
| The ID of the external truck | |
| Number of appointments for an external truck | |
| The appointment number of an external truck |
| Set of time window , ; = 1 means the time window from 8 o’clock to 9 o’clock | |
| Set of time window | |
| Set of time intervals within a time window; e.g., ,, etc.; = 1 means the time interval between 8:00 a.m.–8:06 a.m. in the first time window | |
| Set of the number of appointments for each external truck (this article is set to 1~4 times), ; e.g., = 3 means the external truck has 3 appointments | |
| Appointment collection of external trucks with i appointments, e.g., ;, , etc. | |
| Set of the external Container Truck Company, e.g., , = 1 means company 1 | |
| Set of the gate | |
| Set of exhaust pollutants, ; e.g., = 1 means carbon monoxide (CO), = 2 means hydrocarbon, = 3 means PM |
| The penalty value of the truck waiting in line at Gate | |
| Total number of external trucks that arrived late or early | |
| The number of external trucks that are late or early in time window | |
| Threshold slope | |
| The number of late or early arrivals for truck company : | |
| The transportation cost threshold at various truck companies | |
| The actual number of reserved external trucks in time window | |
| The average arrival rate of the external trucks in the time interval | |
| Average departure rate in time interval | |
| The average queue length of the external trucks in the time interval | |
| The status of the b-th appointment in the time window of the external truck k with i-th appointment | |
| The number of re-schedules in time window of the external trucks that arrived late or early in time window | |
| Number of external trucks late for the last time window of the appointment | |
| Order volume in time window | |
| Indicates the cost of adjusting the time window after all early or late trucks arrive at the port | |
| The number of differences between the time window for re-appointment and the appointment time window after the truck arrives at the port | |
| Total number of gates | |
| Number of inbound trucks at Gate | |
| The actual arrival time window of the truck | |
| The appointment arrival time window of external truck | |
| Total number of appointments submitted by the truck company | |
| Extra congestion time for external trucks | |
| Total change cost of the initial appointment plan of the truck company | |
| The number of re-appointments in time window of the external trucks that are late or early in time window | |
| The number of external trucks that are late or early in time window | |
| The number of time intervals in a time window | |
| Service efficiency at the gate in time interval | |
| Coefficient of variance of gate service time | |
| Emission coefficient of Class pollutants for trucks under unobstructed road conditions | |
| Emission coefficient of Class pollutants for trucks under unobstructed road conditions | |
| The environmental cost caused by each additional category pollutant | |
| Pickup truck reconfirmation arrival time |
4.2. Mathematical Model
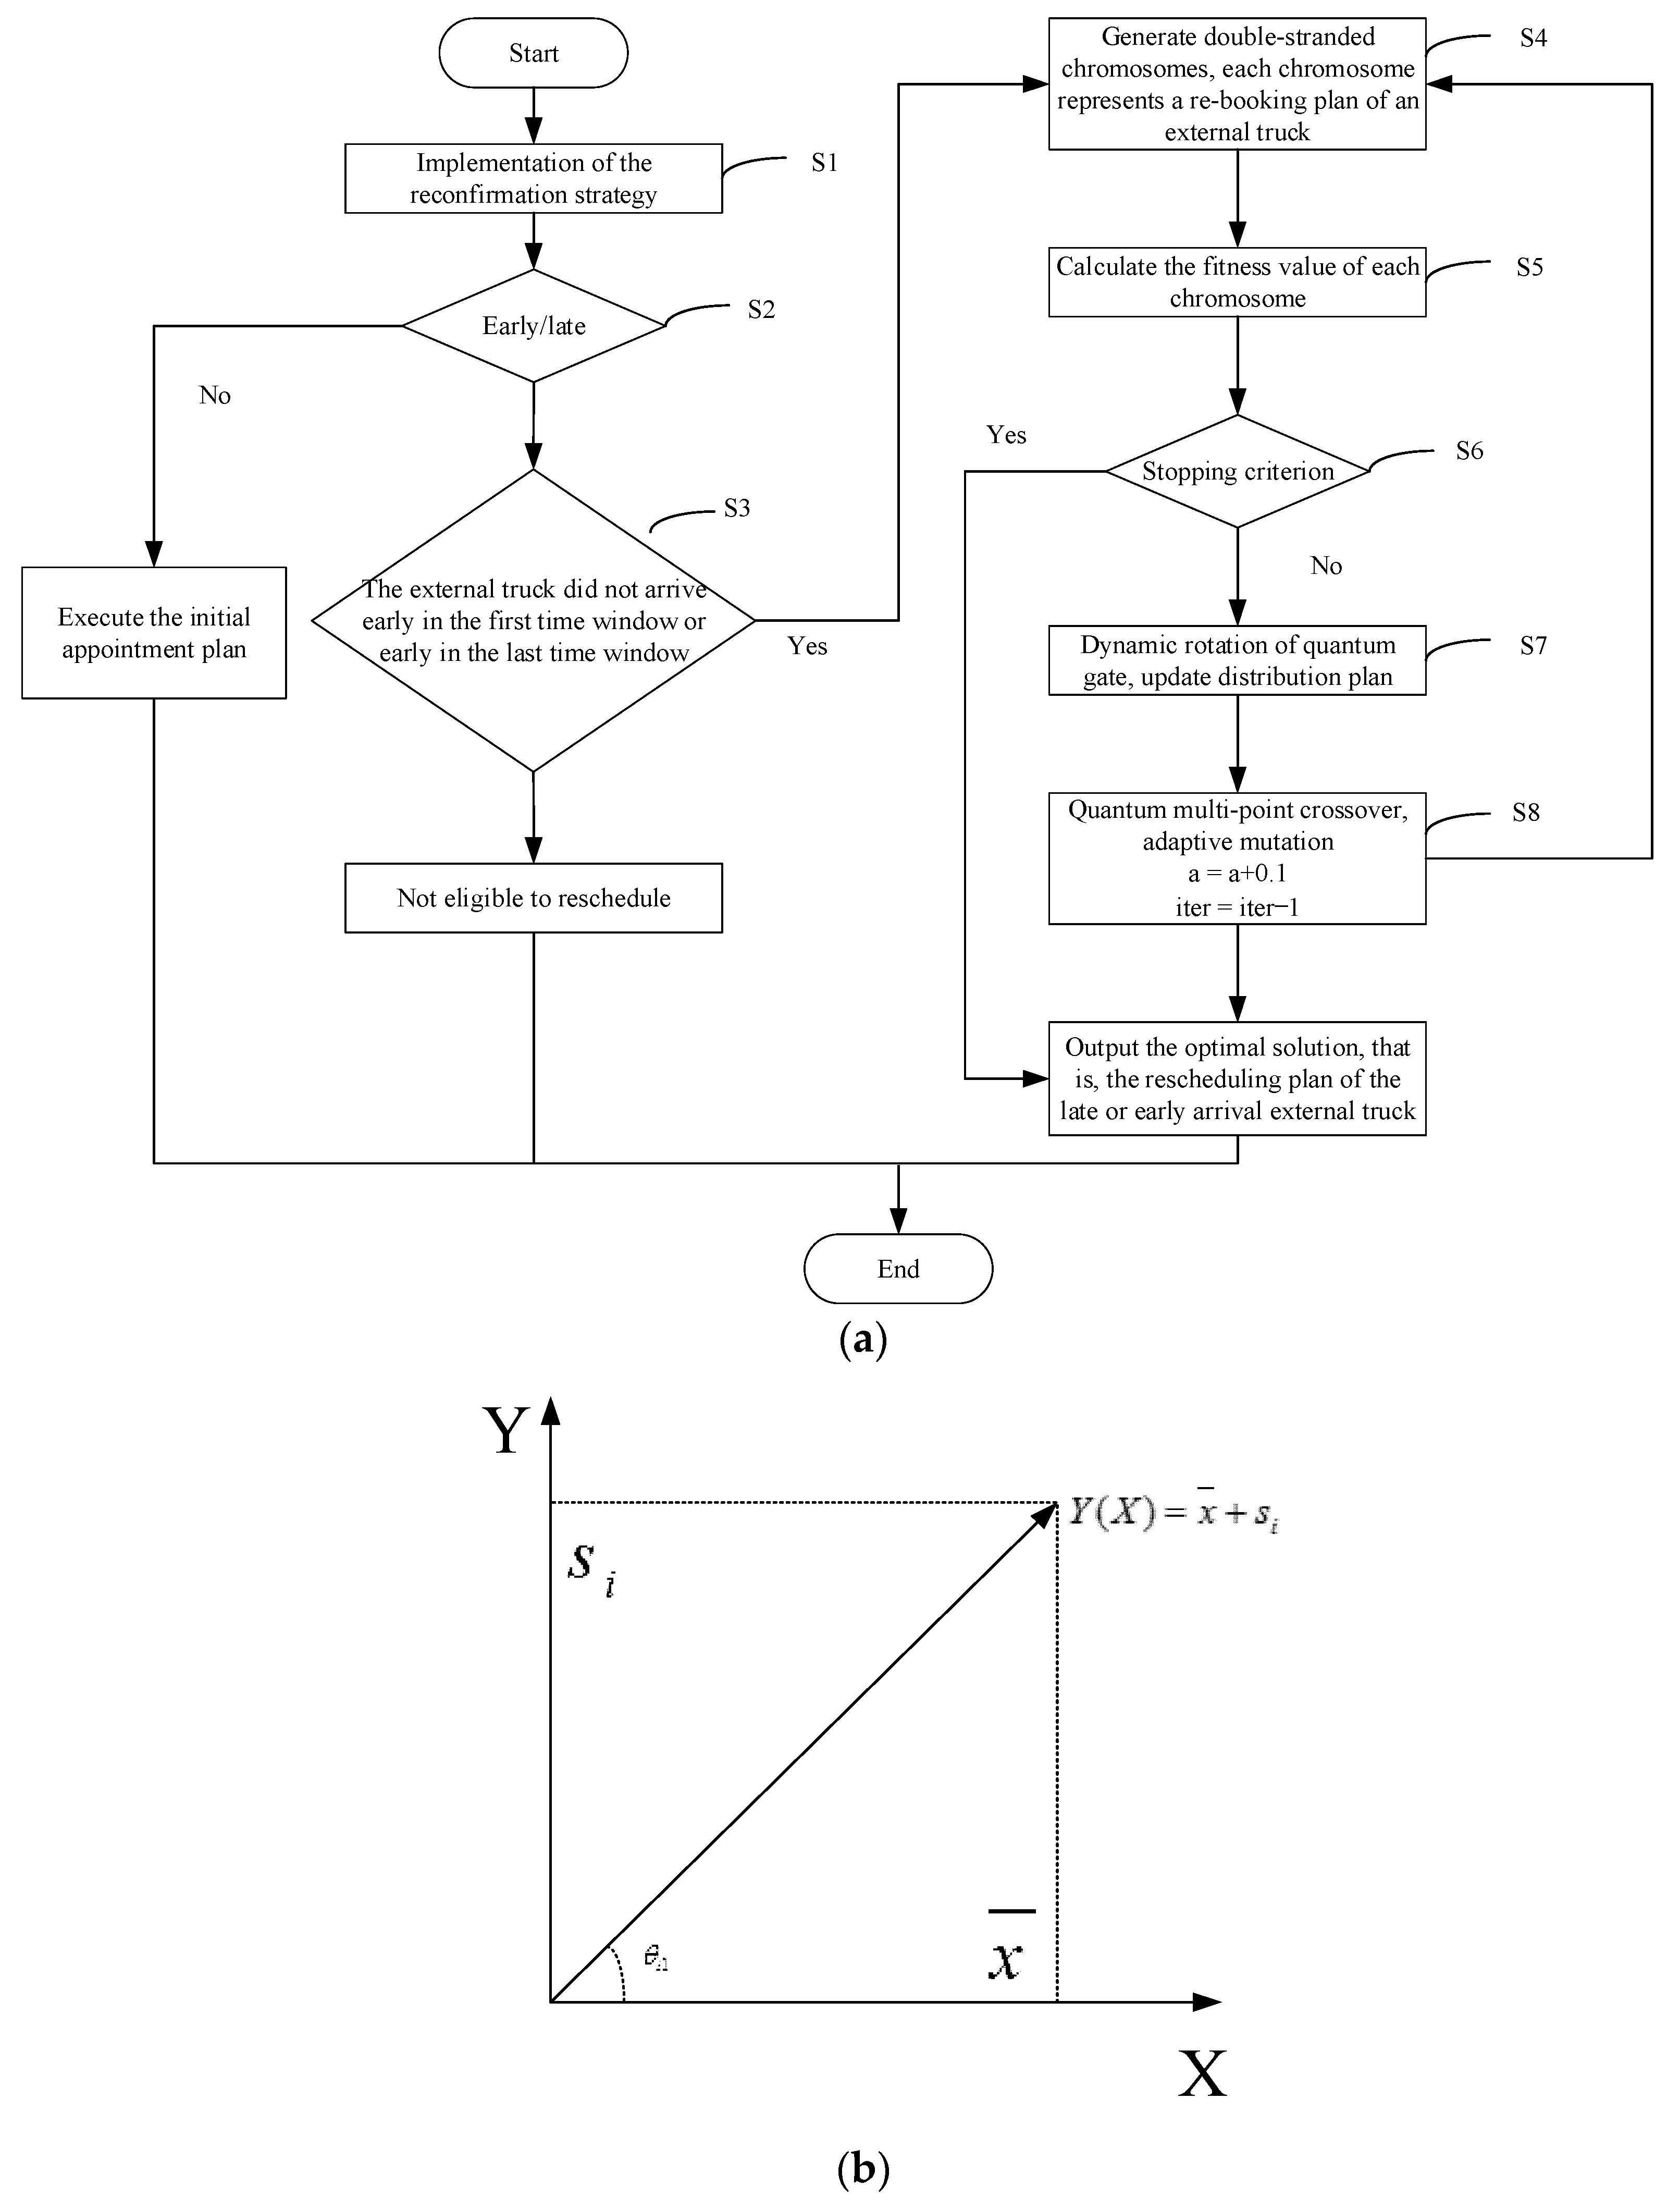
5. Solution Methodology
5.1. Encoding Rules
5.2. Cross and Mutation Operation
5.3. Adaptive Quantum Revolving Door Update
5.4. Termination Condition
- (1)
- If the model has a feasible solution, increase the value of a, which will affect the current company’s threshold. When the threshold reaches the set maximum threshold, stop running and output the optimal solution. If there is no feasible solution before reaching the set threshold, directly output the optimal solution currently running.
- (2)
- Set the maximum number of iterations. When the number of iterations reaches the maximum, stop running and output the current optimal solution.
5.5. Algorithm Flow
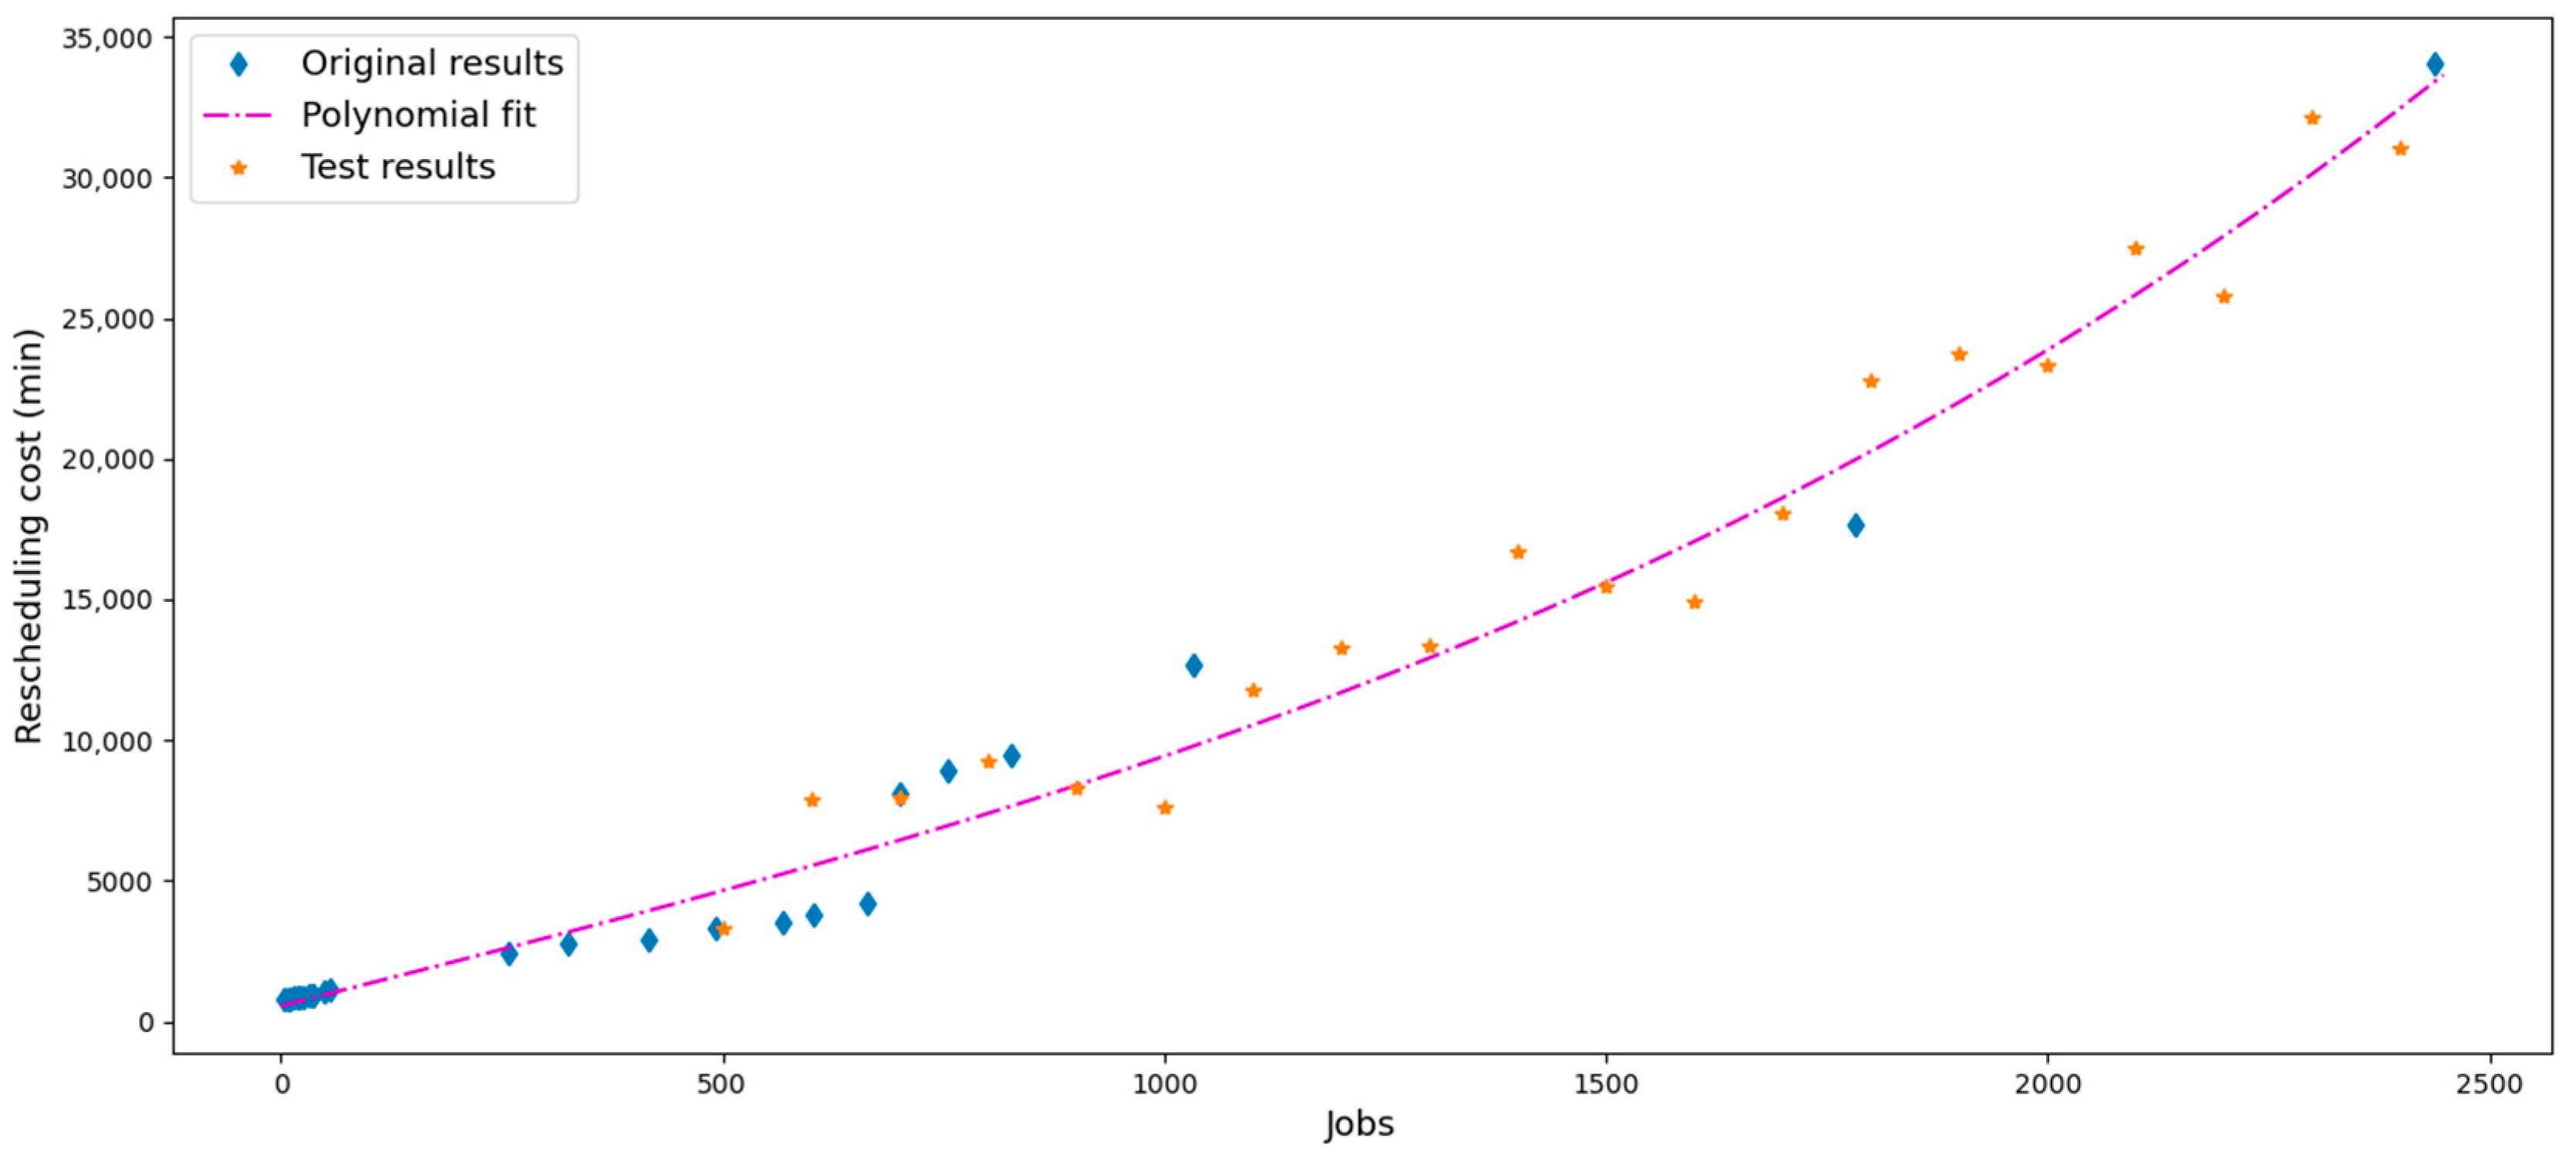
6. Numerical Experiments
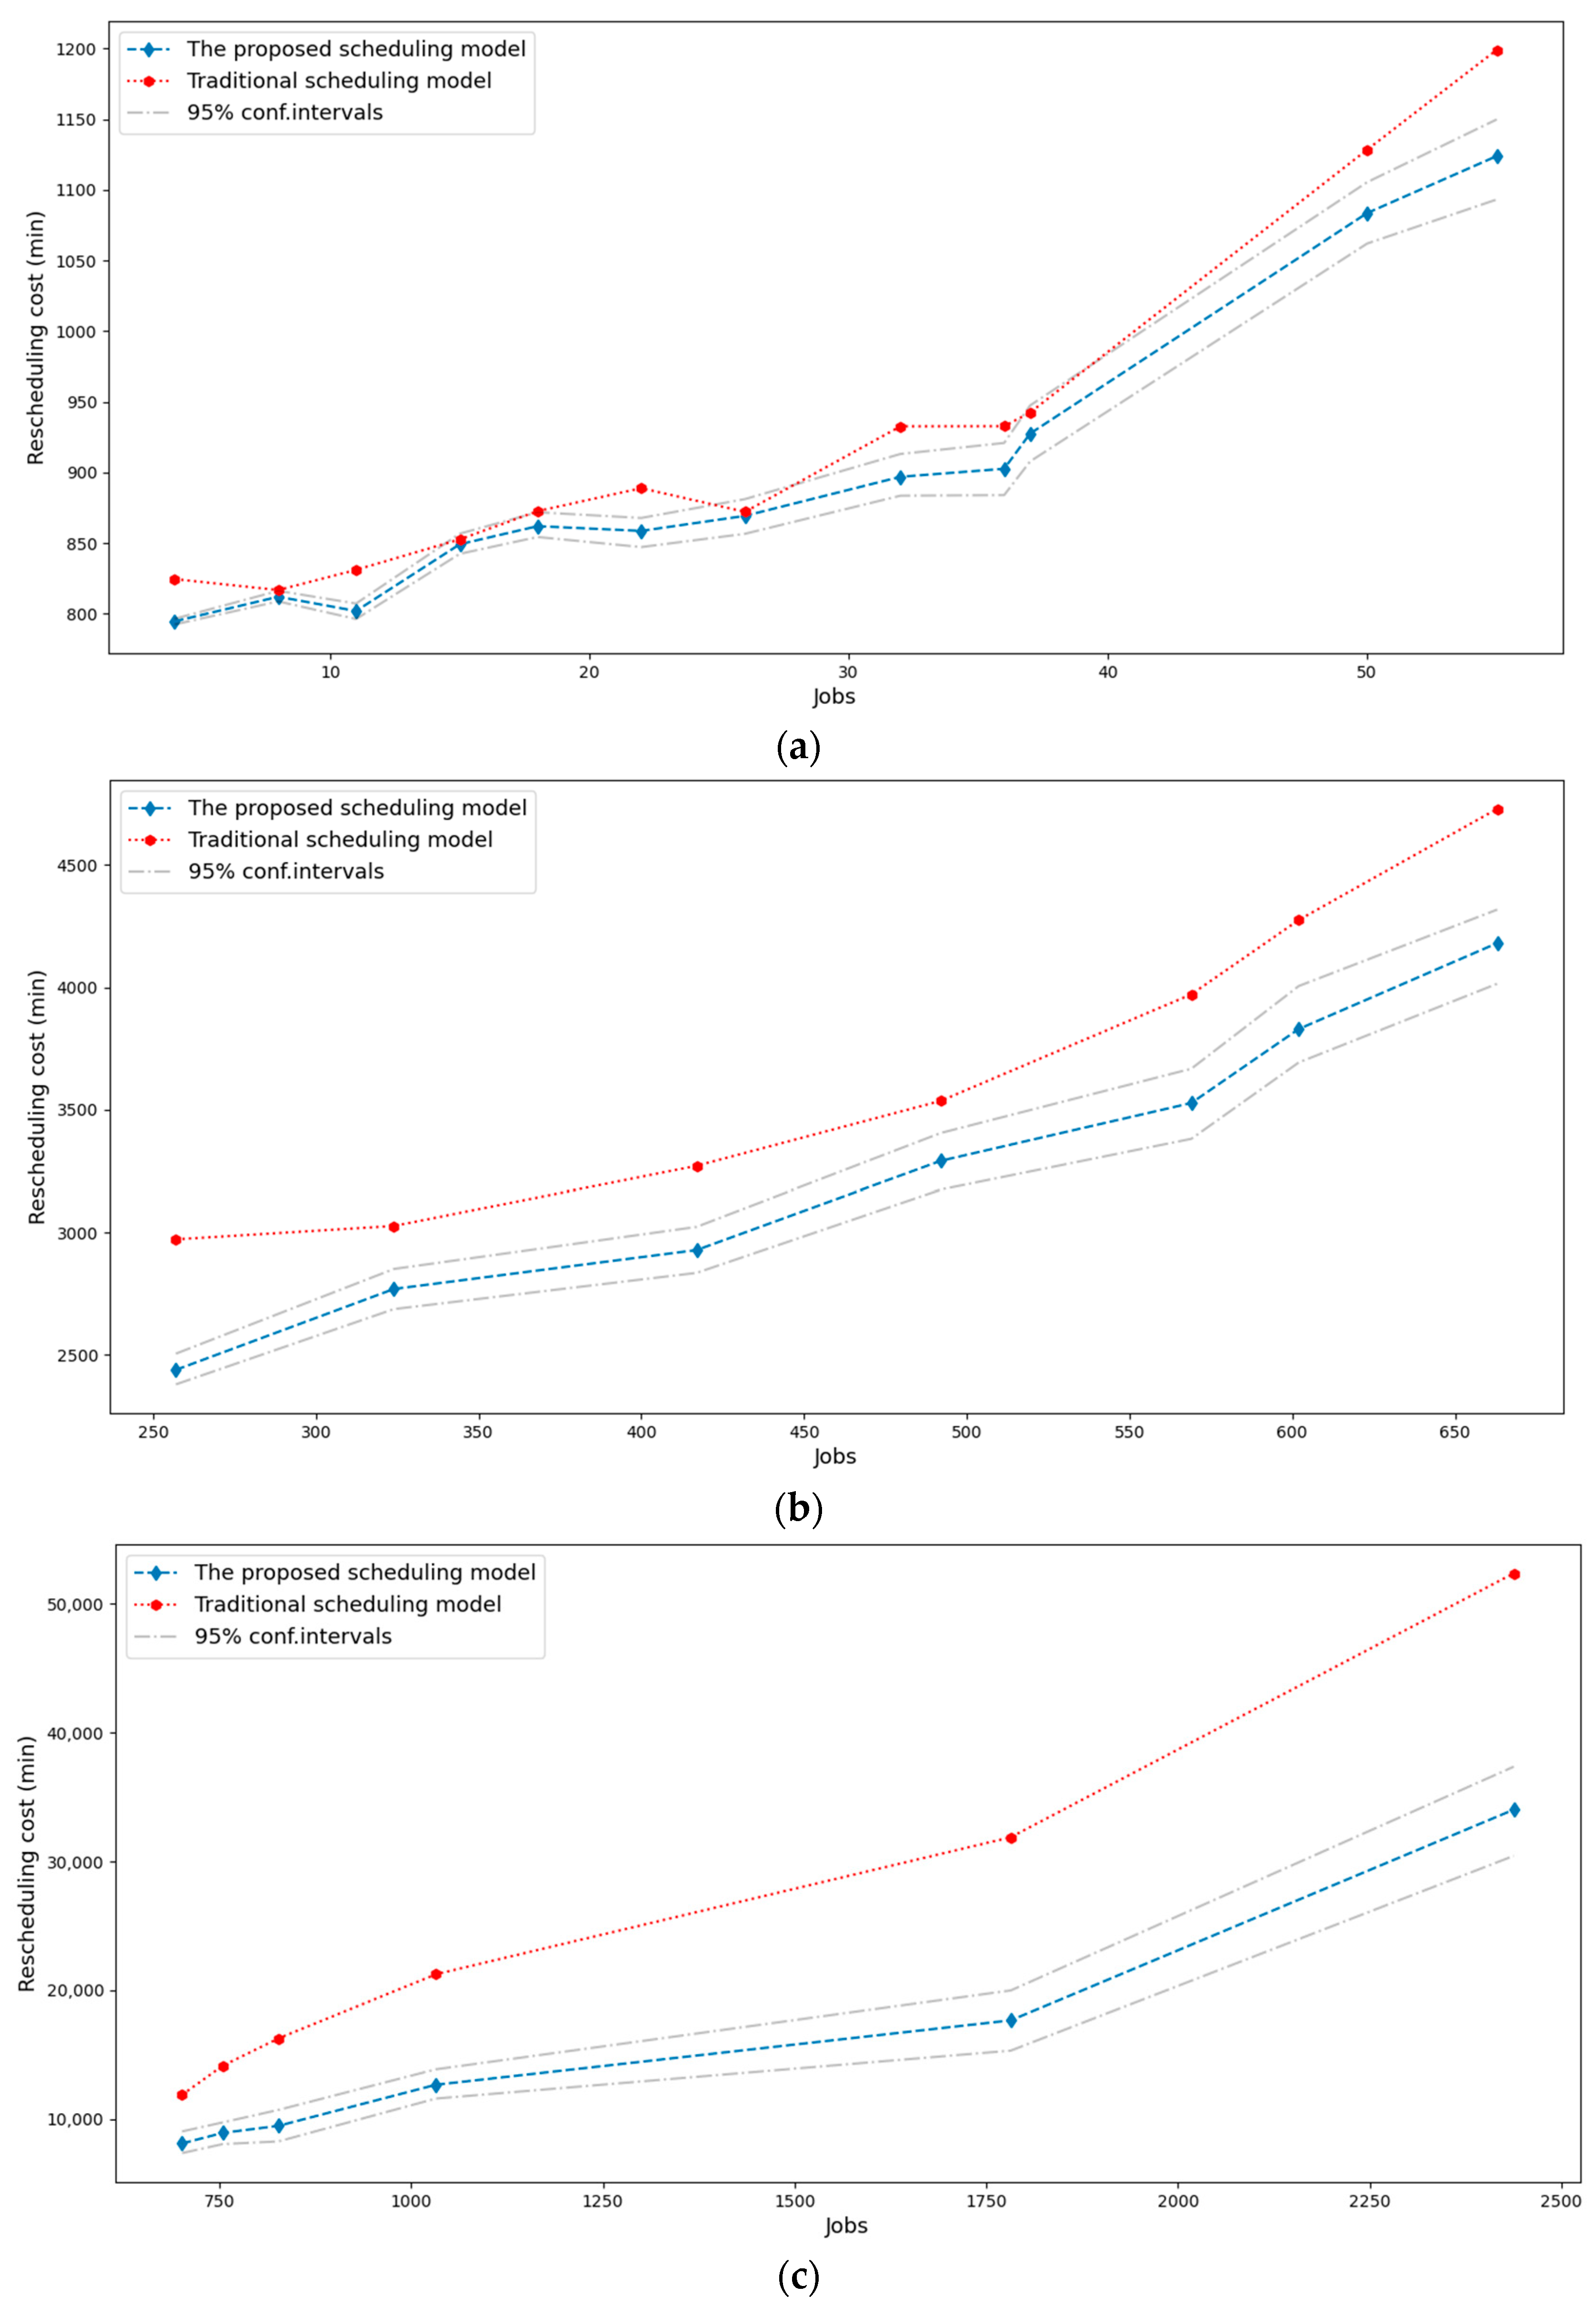
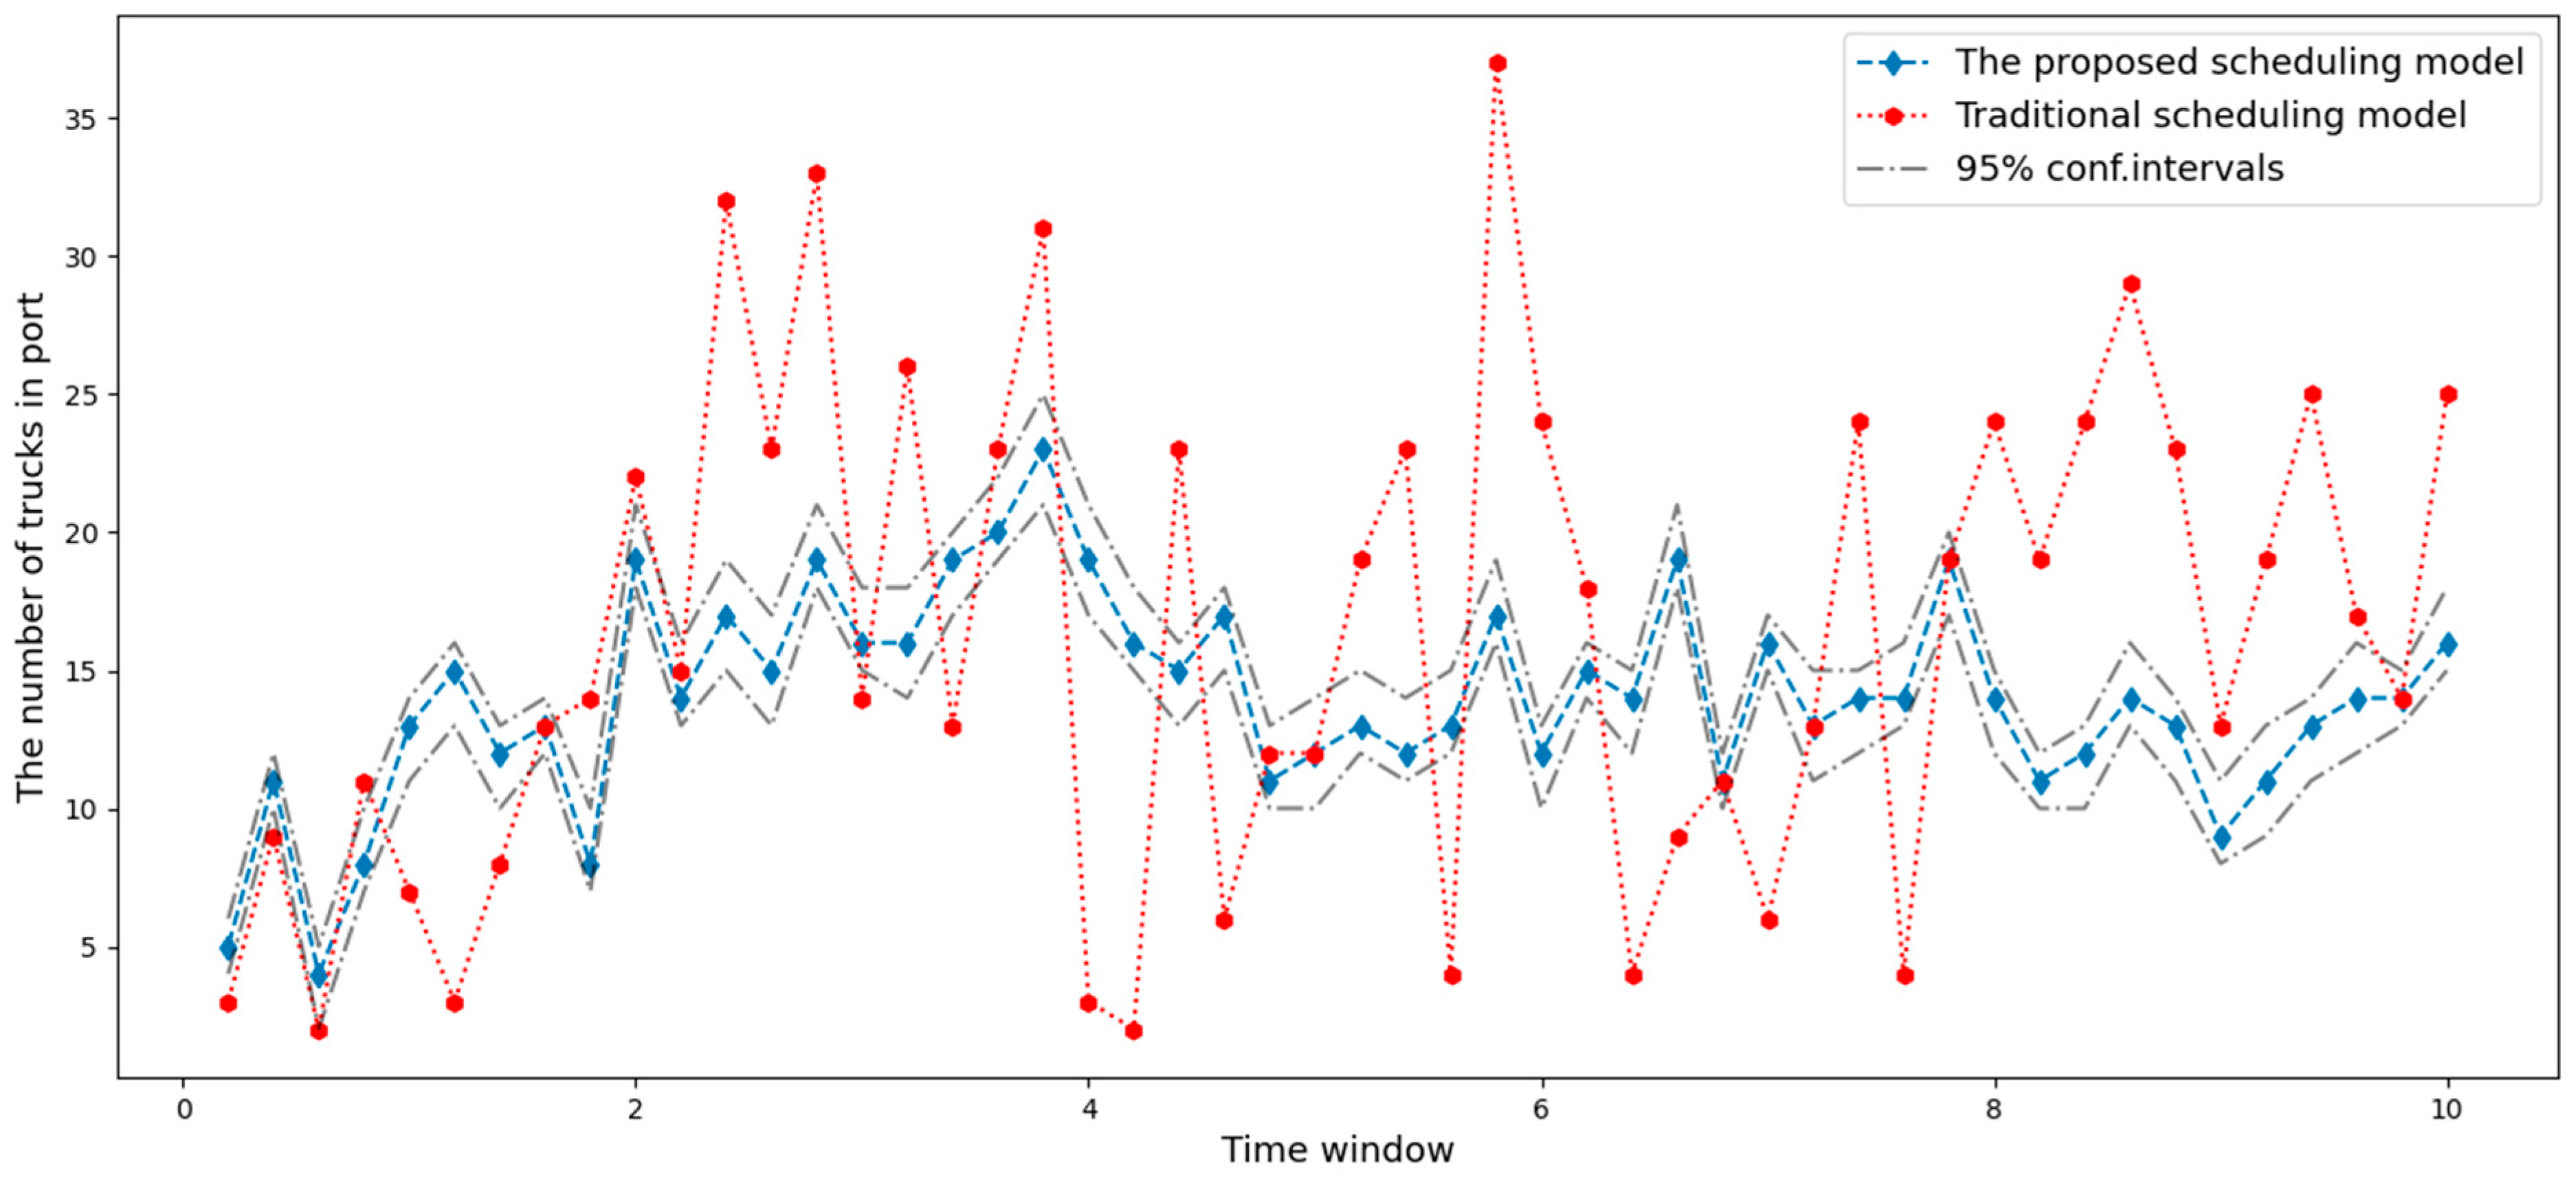
6.1. Comparison of Simulation Experiment Results
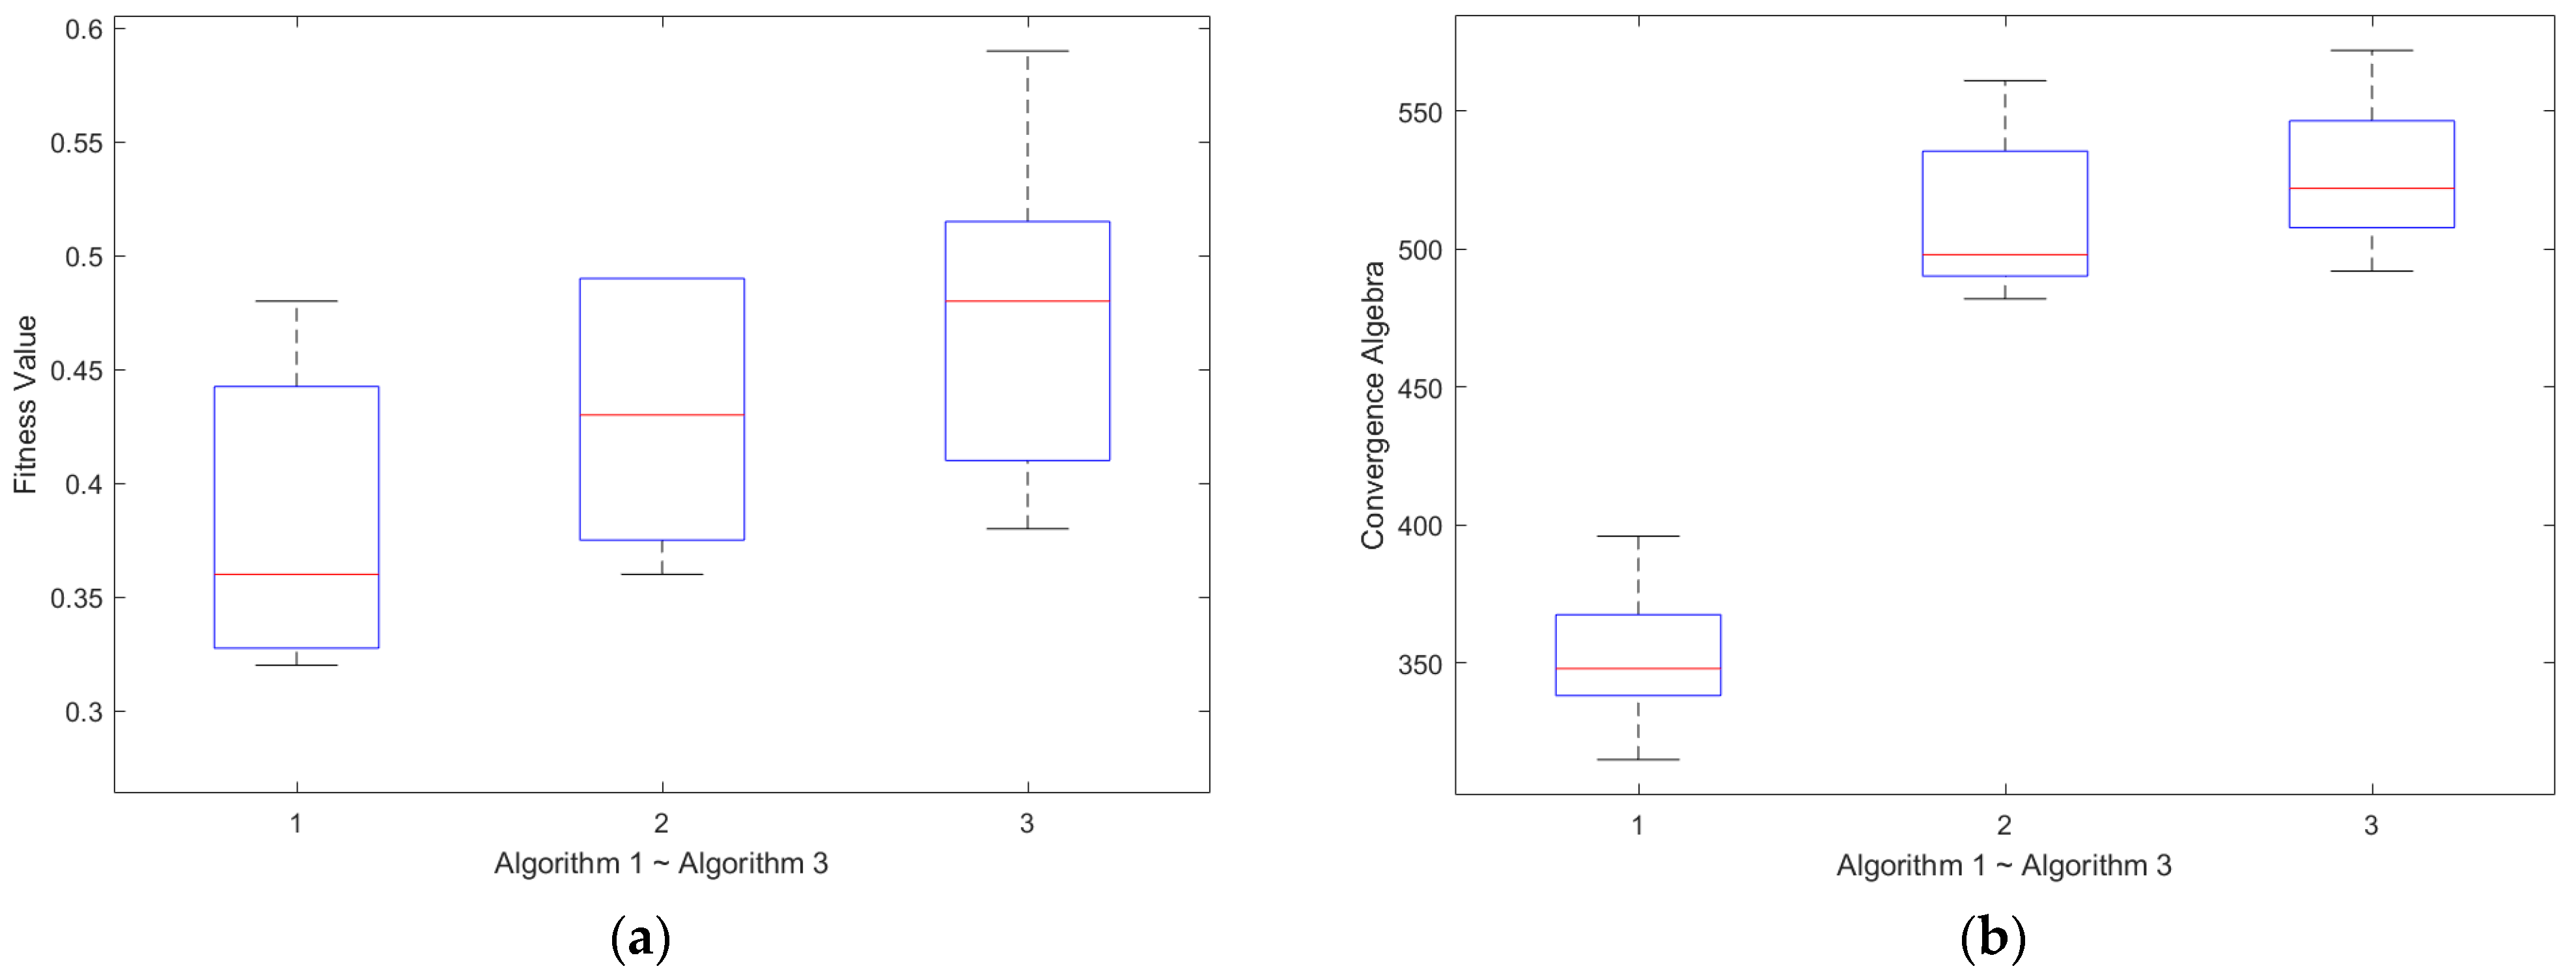
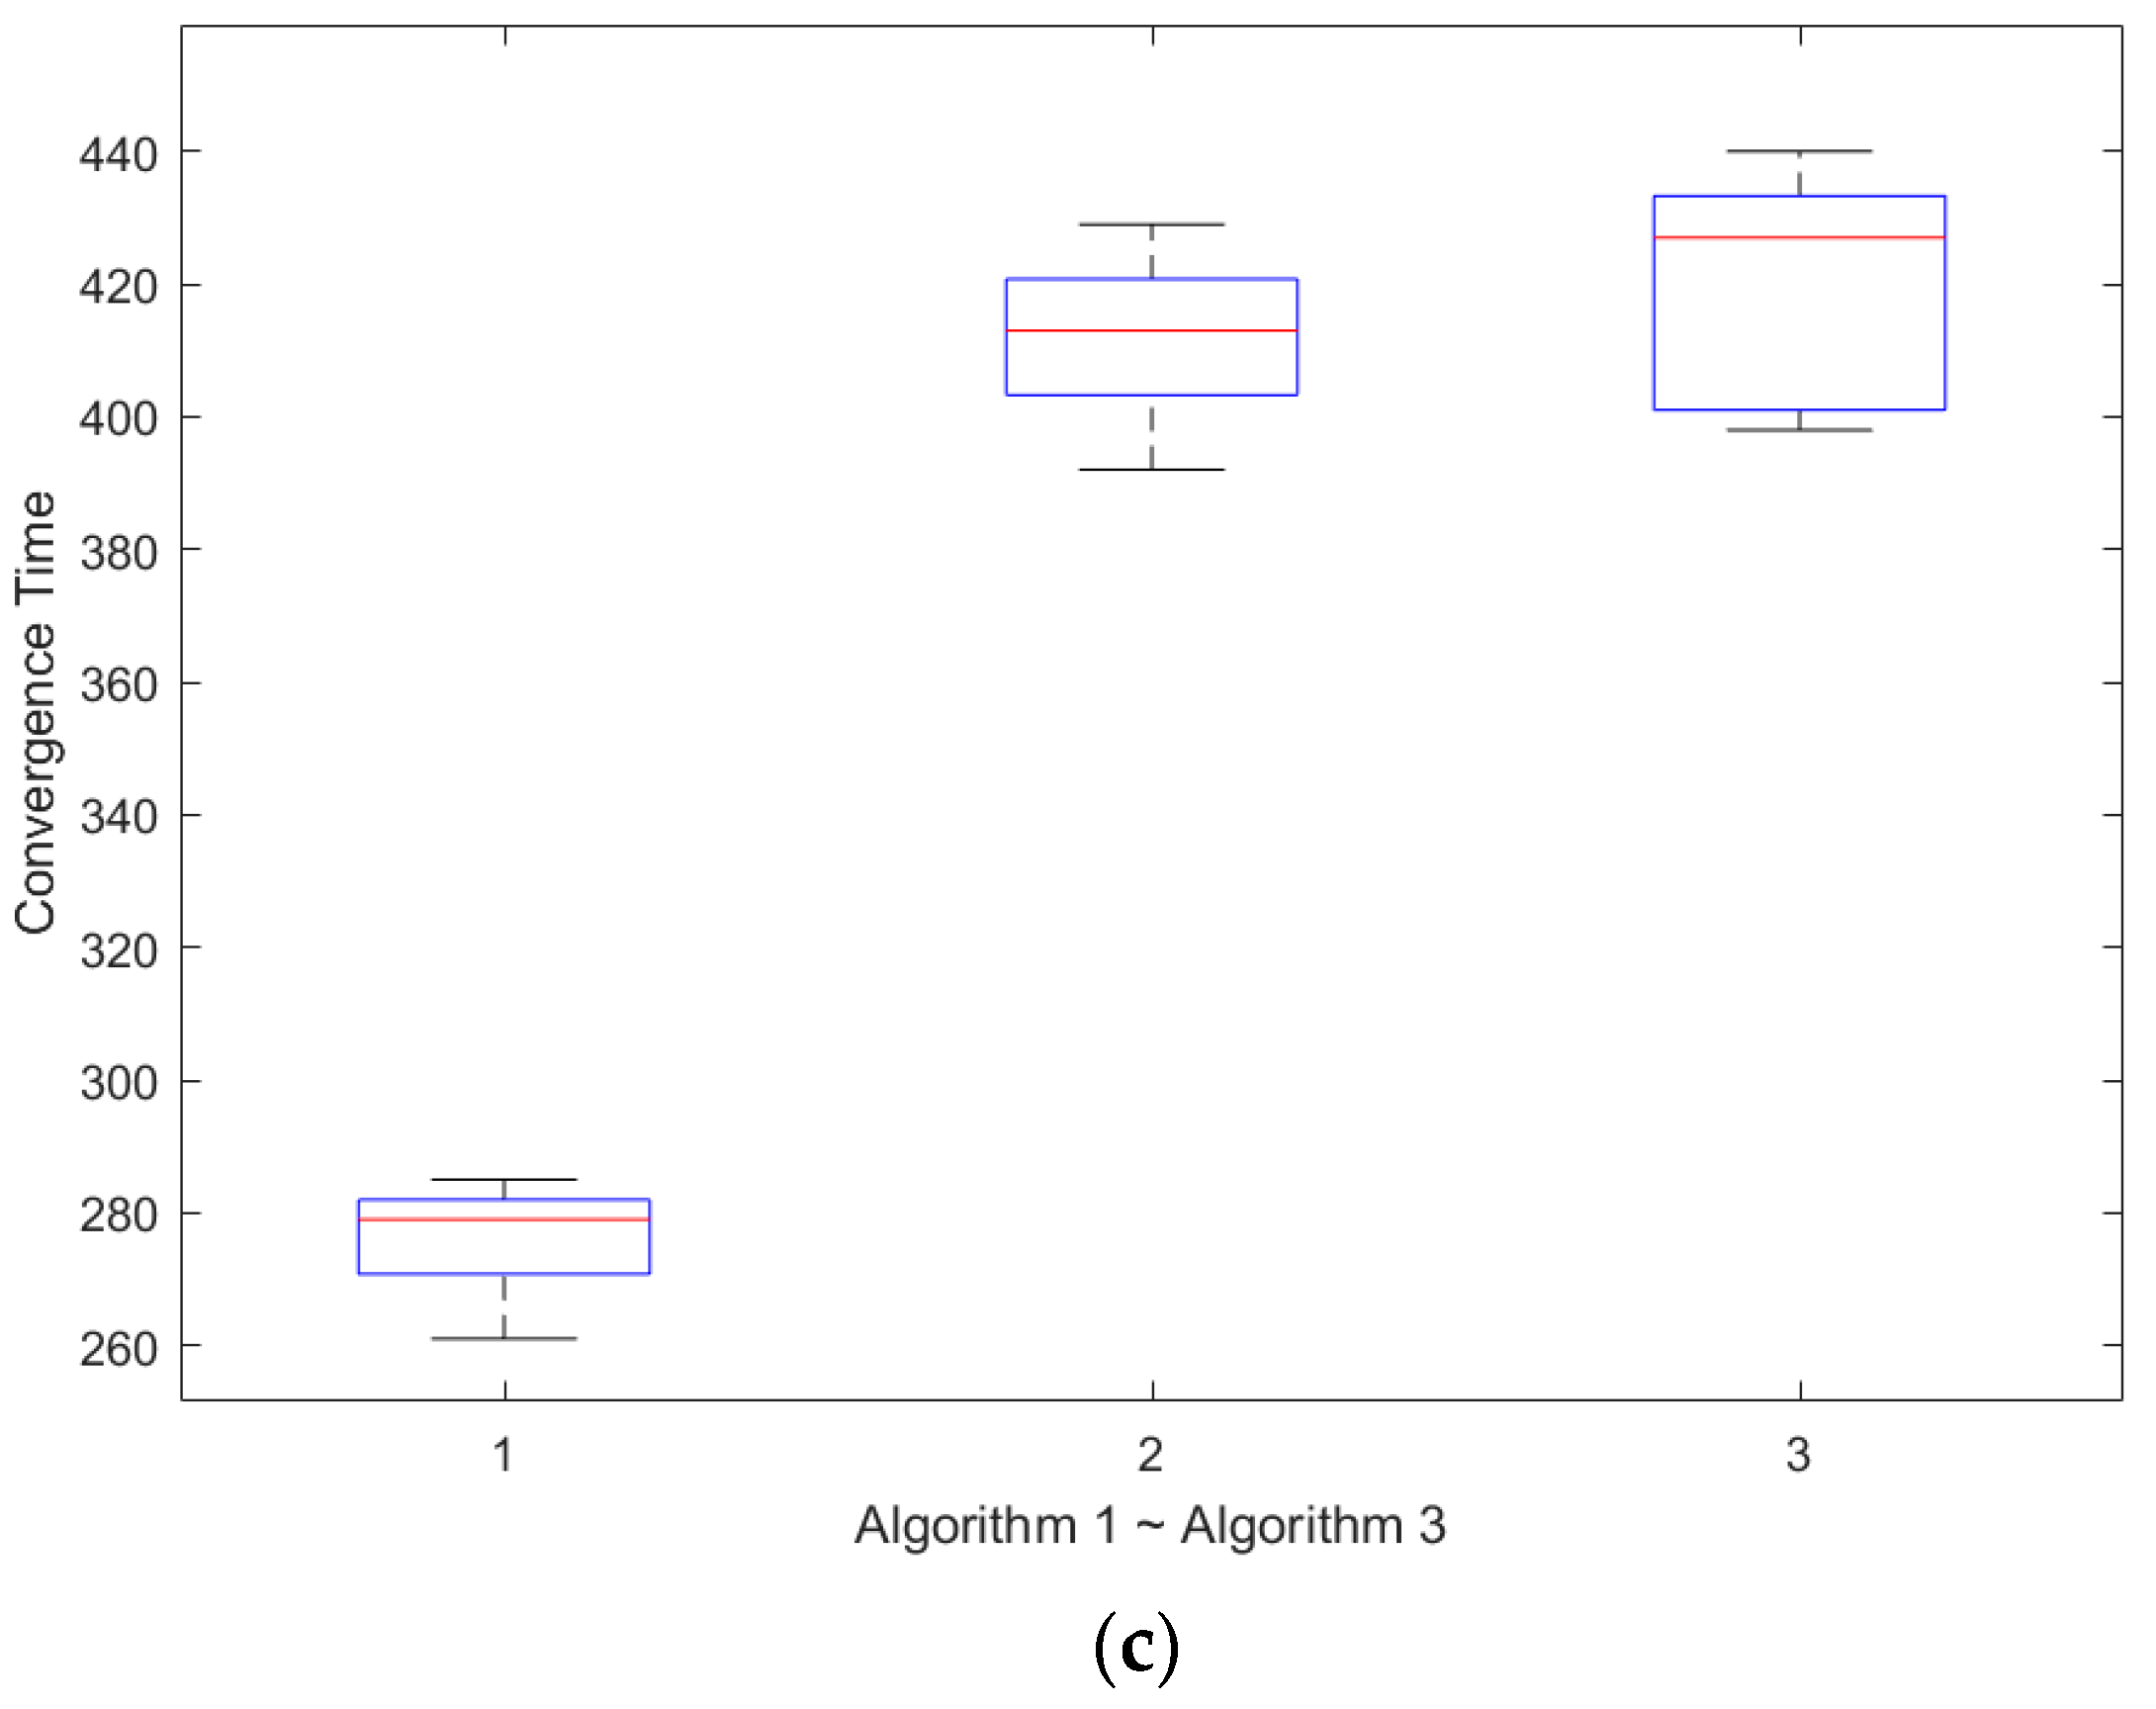
6.2. Algorithm Comparison
6.3. Sensitivity Analysis
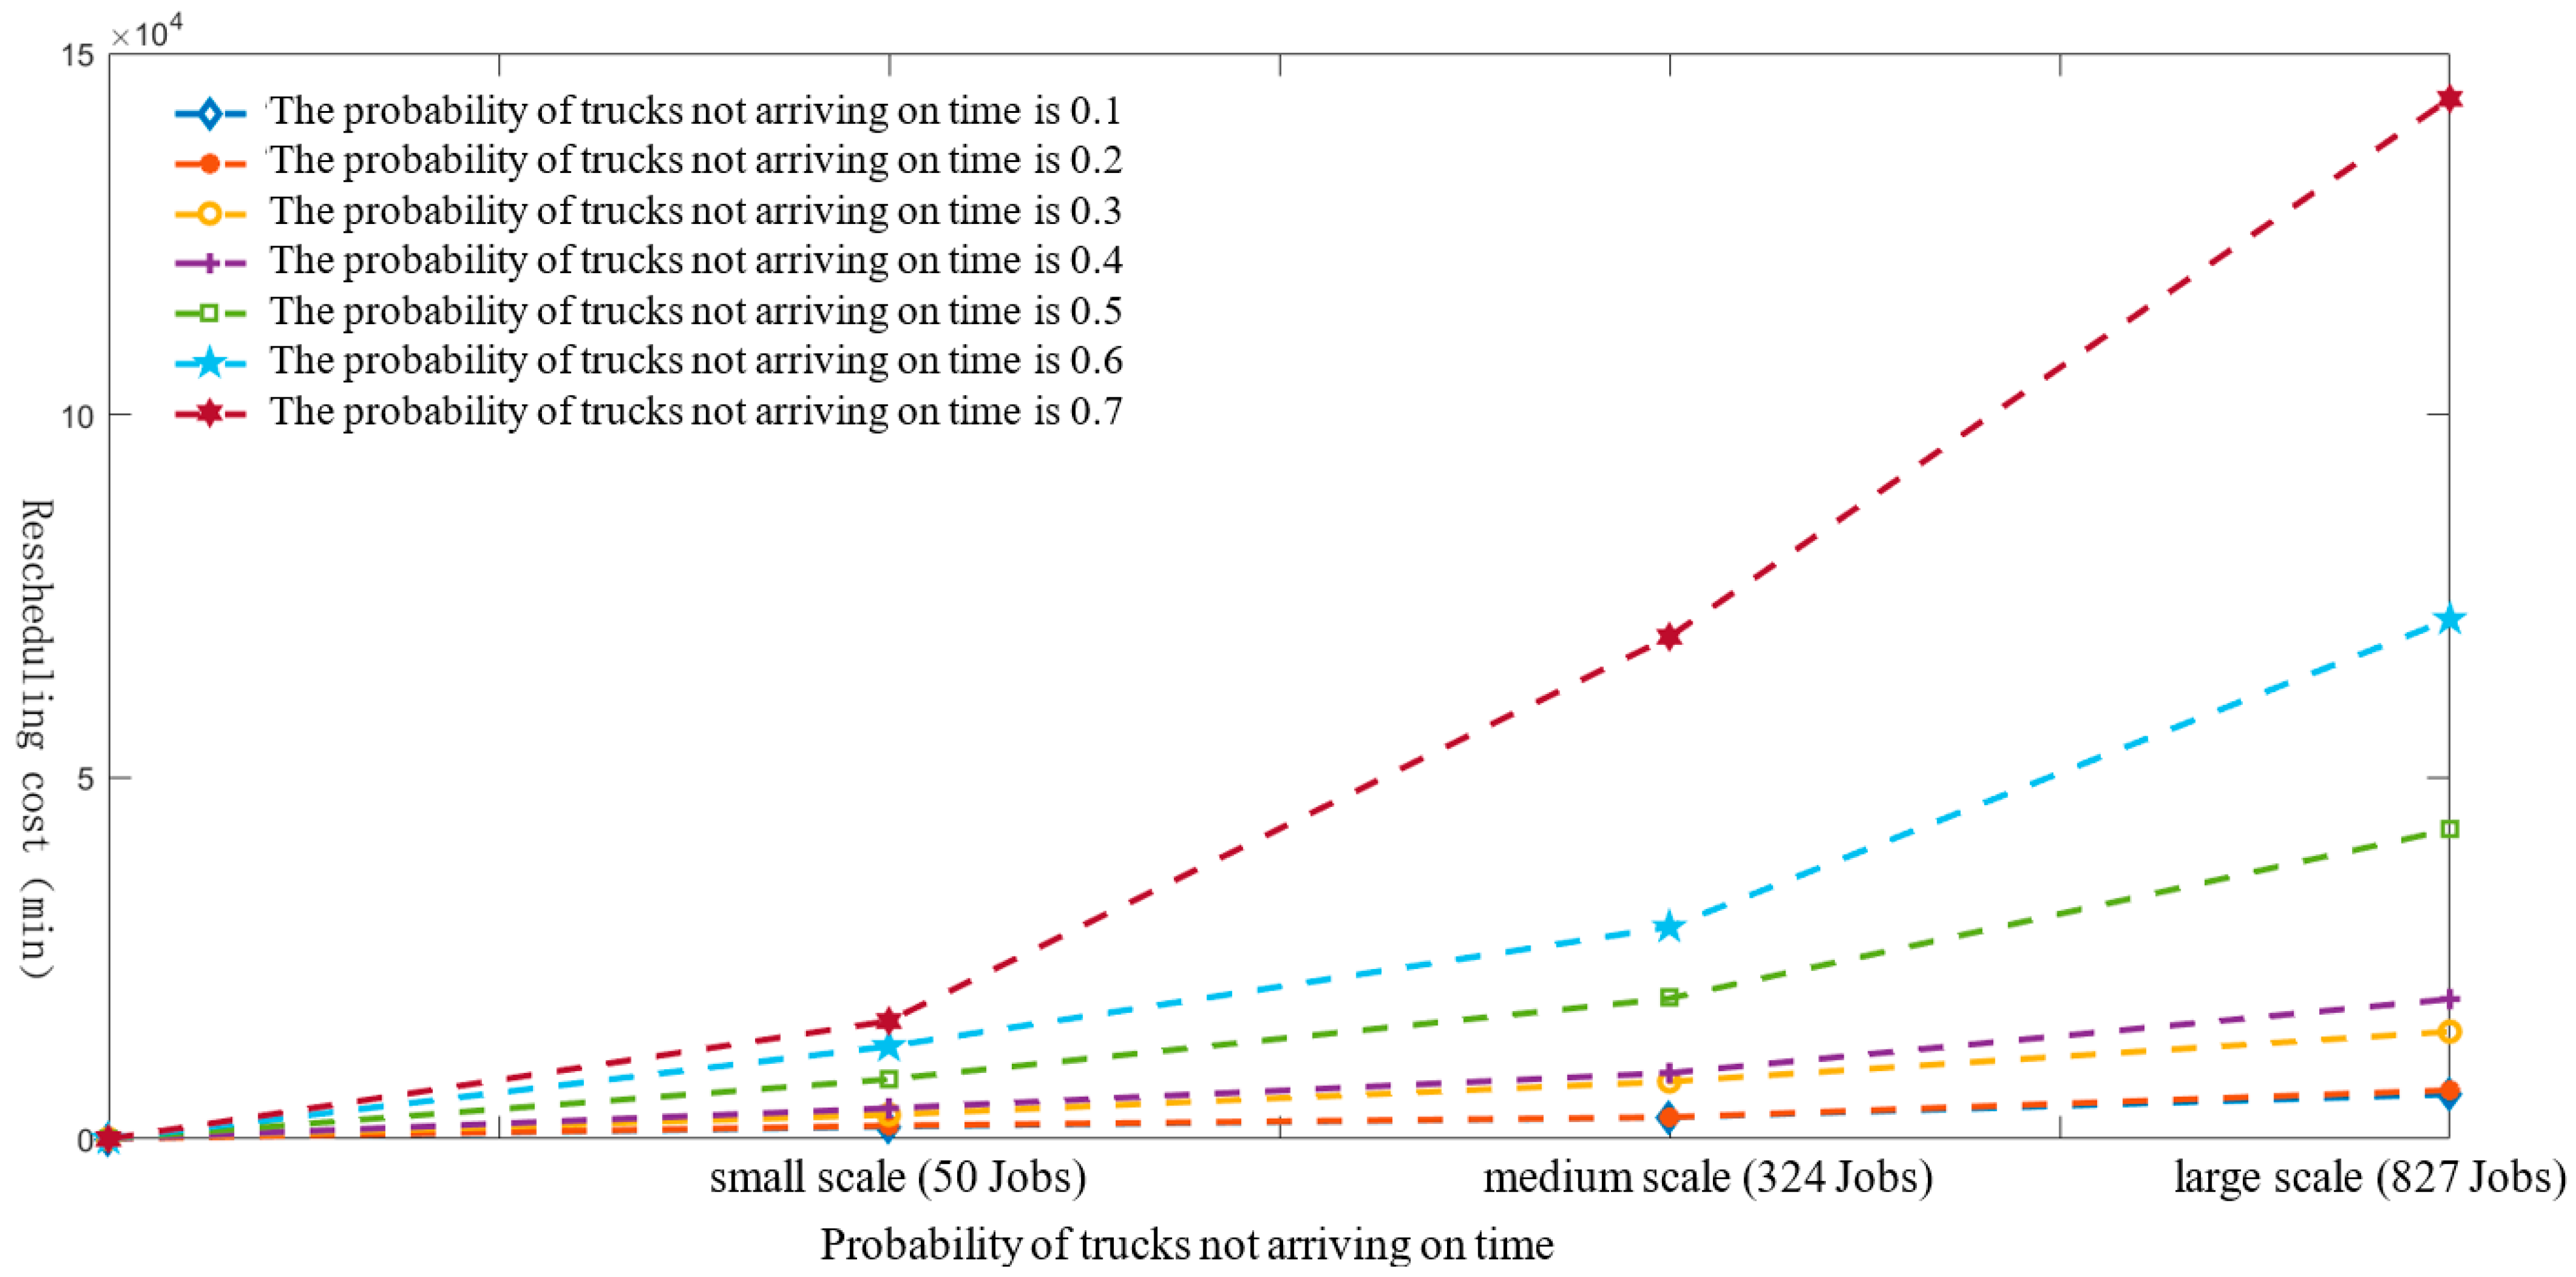
6.3.1. The Impact of the Probability of Trucks Not Being Able to Arrive at the Port on Time on the Re-Scheduling Cost of the TAS
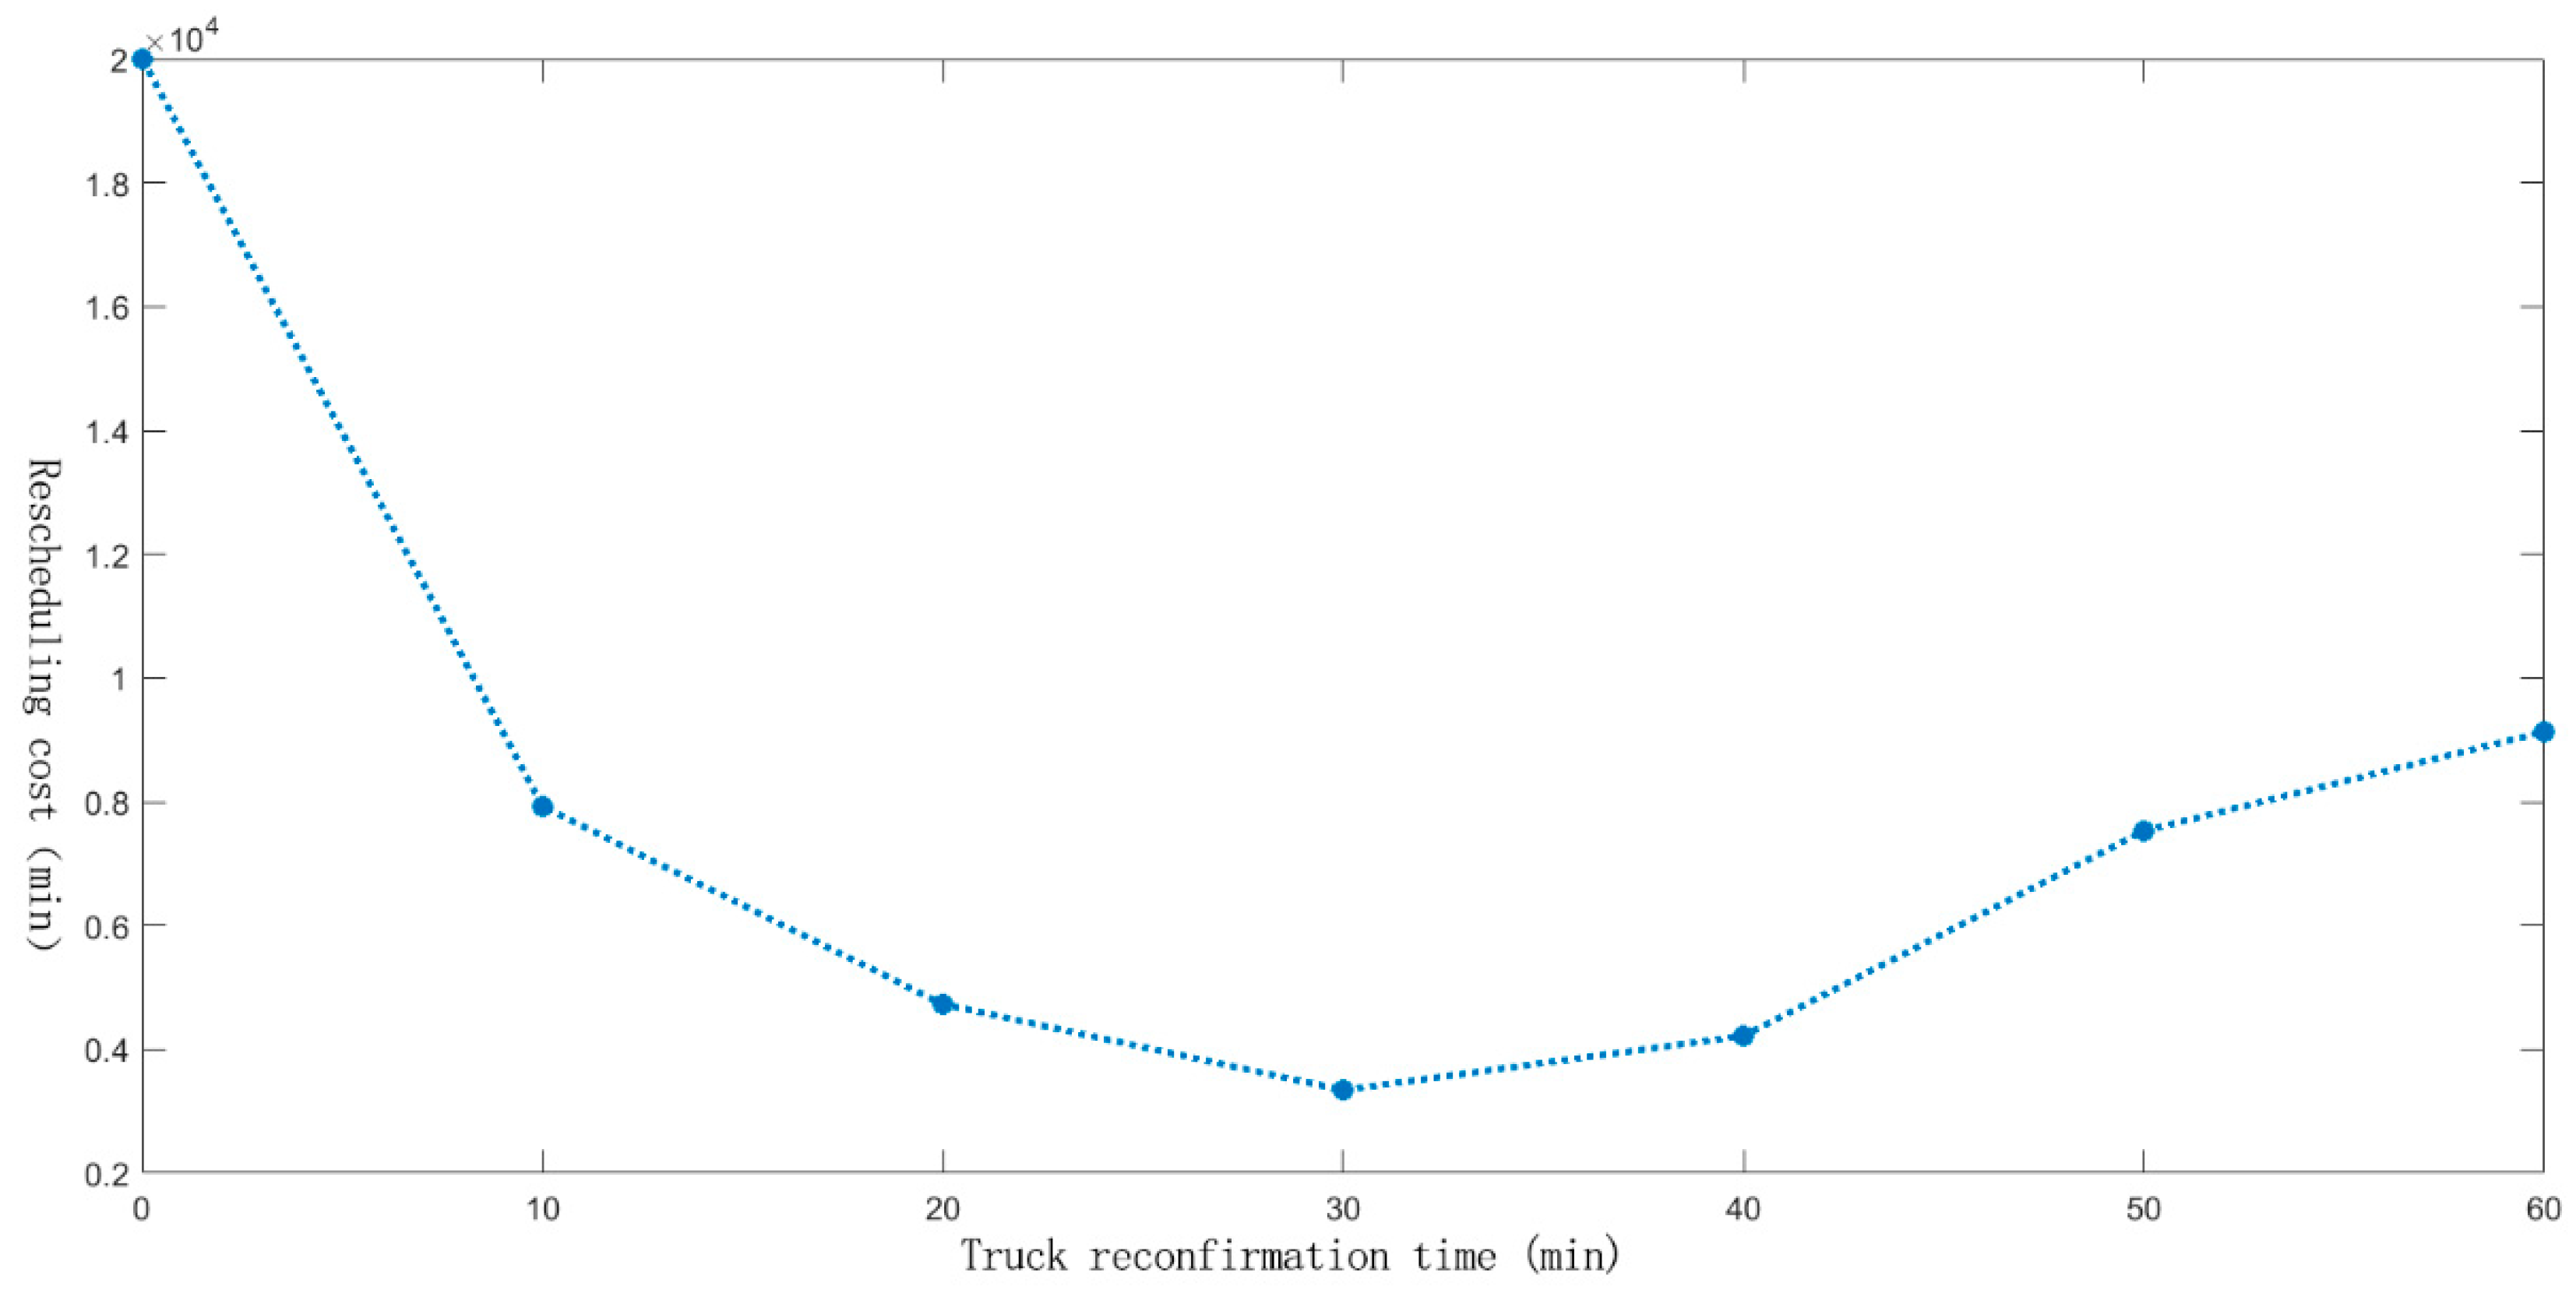
6.3.2. The Impact of the Trucks Reconfirming Time on the Cost of the Rescheduling
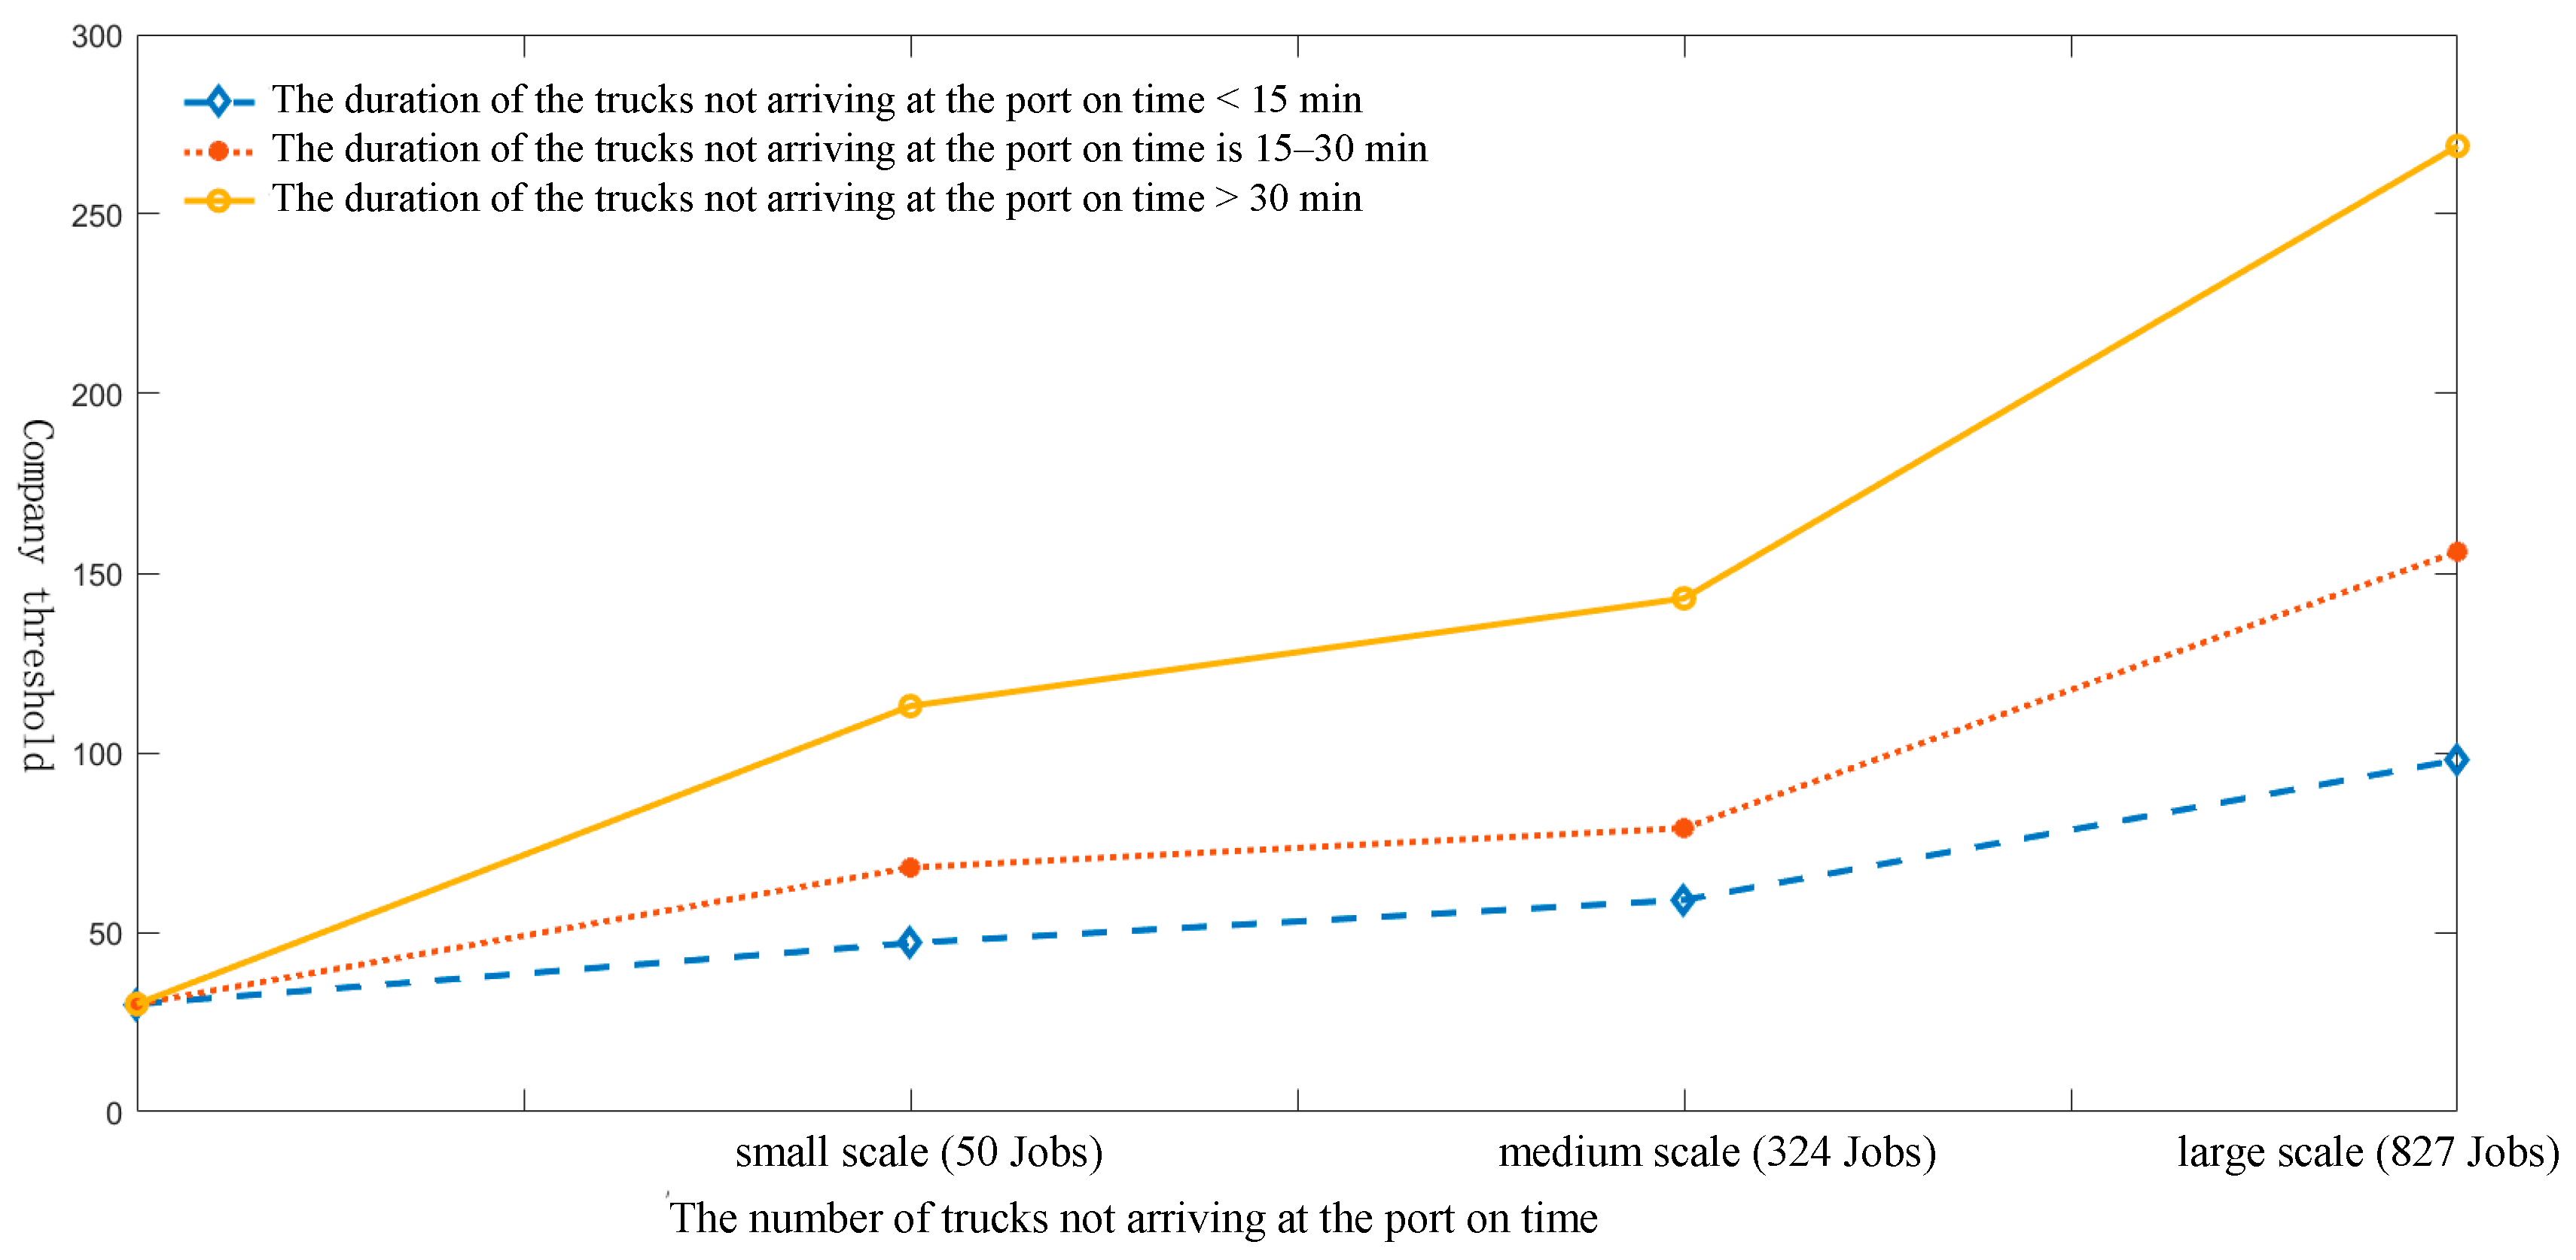
6.3.3. The Impact of the Truck’s Failure to Arrive at the Port on Time on the Threshold of the Truck Company
7. Conclusions
Author Contributions
Funding
Institutional Review Board Statement
Informed Consent Statement
Data Availability Statement
Conflicts of Interest
Appendix A. Experimental Parameter Data

| NO. | Jobs | Quota per Time Window | Number of Truck Companies | Port Coordinates (min) | Transportation Area | |
|---|---|---|---|---|---|---|
| X | Y | (min × min) | ||||
| 4 | 4 | (1,1,1,1,1,1,1,1,1,1) | 1 | 0 | 80 | 160 × 160 |
| 5 | 8 | (2,2,2,2,2,2,2,2,2,2) | 1 | 0 | 80 | 160 × 160 |
| 6 | 11 | (2,2,3,3,3,3,3,3,2,2) | 2 | 0 | 80 | 160 × 160 |
| 7 | 15 | (3,3,4,4,4,4,4,4,3,3) | 2 | 0 | 80 | 160 × 160 |
| 8 | 18 | (4,4,4,4,4,4,4,4,4,4) | 3 | 0 | 80 | 160 × 160 |
| 9 | 22 | (4,4,5,5,5,5,5,5,4,4) | 3 | 0 | 80 | 160 × 160 |
| 10 | 26 | (5,5,6,6,6,6,6,6,5,5) | 4 | 0 | 80 | 160 × 160 |
| 11 | 32 | (6,6,8,8,8,8,8,8,6,6) | 4 | 0 | 80 | 160 × 160 |
| 12 | 36 | (7,7,8,8,8,8,8,8,7,7) | 5 | 0 | 80 | 160 × 160 |
| 13 | 37 | (7,7,9,9,9,9,9,9,7,7) | 5 | 0 | 80 | 160 × 160 |
| 14 | 50 | (9,9,11,11,11,11,11,11,9,9) | 6 | 0 | 80 | 160 × 160 |
| 15 | 55 | (10,10,13,13,13,13,13,13,10,10) | 7 | 0 | 80 | 160 × 160 |
| 16 | 100 | (18,18,22,22,22,22,22,22,18,18) | 13 | 0 | 80 | 160 × 160 |
| 17 | 157 | (29,29,35,35,35,35,35,35,29,29) | 21 | 0 | 80 | 160 × 160 |
| 18 | 209 | (38,38,46,46,46,46,46,46,38,38) | 27 | 0 | 80 | 160 × 160 |
| 19 | 257 | (47,47,57,57,57,57,57,57,47,47) | 32 | 0 | 80 | 160 × 160 |
| 20 | 324 | (59,59,72,72,72,72,72,72,59,59) | 38 | 0 | 80 | 160 × 160 |
| 21 | 417 | (76,76,92,92,92,92,92,92,76,76) | 47 | 0 | 80 | 160 × 160 |
| 22 | 492 | (89,89,109,109,109,109,109,109,89,89) | 60 | 0 | 80 | 160 × 160 |
| 23 | 569 | (103,103,126,126,126,126,126,126,103,103) | 67 | 0 | 80 | 160 × 160 |
| 24 | 602 | (109,109,133,133,133,133,133,133,109,109) | 71 | 0 | 80 | 160 × 160 |
| 25 | 663 | (120,120,146,146,146,146,146,146,120,120) | 74 | 0 | 80 | 160 × 160 |
References
- Zehendner, E.; Feillet, D. Benefits of a truck appointment system on the service quality of inland transport modes at a multimodal container terminal. Eur. J. Oper. Res. 2014, 235, 461–469. [Google Scholar] [CrossRef]
- Mohssen Abdelmagid, A.; Gheith, M.S.; Eltawil, A.B. A comprehensive review of the truck appointment scheduling models and directions for future research. Transp. Rev. 2022, 42, 102–126. [Google Scholar] [CrossRef]
- Creemers, S.; Lambrecht, M.R.; Beliën, J.; Van den Broeke, M. Evaluation of appointment scheduling rules: A multi-performance measurement approach. Omega 2020, 100, 102231. [Google Scholar] [CrossRef]
- Torkjazi, M.; Huynh, N.; Shiri, S. Truck appointment systems considering impact to drayage truck tours. Transp. Res. Part E Logist. Transp. Rev. 2018, 116, 208–228. [Google Scholar]
- Yi, S.; Scholz-Reiter, B.; Kim, T.; Kim, K.H. Scheduling appointments for container truck arrivals considering their effects on congestion. Flex. Serv. Manuf. J. 2019, 31, 730–762. [Google Scholar] [CrossRef]
- Ramírez-Nafarrate, A.; González-Ramírez, R.G.; Smith, N.R.; Guerra-Olivares, R.; Voß, S. Impact on yard efficiency of a truck appointment system for a port terminal. Ann. Oper. Res. 2017, 258, 195–216. [Google Scholar] [CrossRef]
- Shiri, S.; Huynh, N. Optimization of drayage operations with time-window constraints. Int. J. Prod. Econ. 2016, 176, 7–20. [Google Scholar] [CrossRef]
- Yu, K.; Yang, J. MILP model and a rolling horizon algorithm for crane scheduling in a hybrid storage container terminal. Math. Probl. Eng. 2019, 2019, 4739376. [Google Scholar] [CrossRef] [Green Version]
- He, J.; Tan, C.; Zhang, Y. Yard crane scheduling problem in a container terminal considering risk caused by uncertainty. Adv. Eng. Inform. 2019, 39, 14–24. [Google Scholar] [CrossRef]
- Kourounioti, I.; Polydoropoulou, A. Application of aggregate container terminal data for the development of time-of-day models predicting truck arrivals. Eur. J. Transp. Infrastruct. Res. 2018, 18, 76–90. [Google Scholar]
- Sun, Y.; Hu, X.; Zeng, Q. Multi-objective optimization scheduling model for container terminal loading and unloading operation sequence. Syst. Eng. Theory Pract. 2020, 40, 195–209. [Google Scholar]
- Dos Santos, M.C.; Pereira, F.H. Development and application of a dynamic model for road port access and its impacts on port-city relationship indicators. J. Transp. Geogr. 2021, 96, 103189. [Google Scholar] [CrossRef]
- Wasesa, M.; Ramadhan, F.I.; Nita, A.; Belgiawan, P.F.; Mayangsari, L. Impact of overbooking reservation mechanism on container terminal’s operational performance and greenhouse gas emissions. Asian J. Shipp. Logist. 2021, 37, 140–148. [Google Scholar] [CrossRef]
- Xu, B.; Liu, X.; Yang, Y.; Li, J.; Postolache, O. Optimization for a multi-constraint TAS considering morning and evening peak congestion. Sustainability 2021, 13, 1181. [Google Scholar] [CrossRef]
- Chang, Y.; Ye, X.; Liu, W.; Xie, J.; Li, M. Scheduling Optimization of External Truck at Container Terminal Based on Appointment Feedback Mechanism. Syst. Eng. 2019, 6, 74–81. [Google Scholar]
- Von Westarp, A.G.; Schinas, O. A fuzzy approach for container positioning considering sustainable profit optimization. Transp. Res. Part E Logist. Transp. Rev. 2016, 92, 56–66. [Google Scholar] [CrossRef]
- Xu, B.; Liu, X.; Yang, Y.; Li, J. Multi-constraint scheduling model and algorithm of TAS considering the influence of morning and evening rush hour. Comput. Integr. Manuf. Syst. 2020, 26, 2851–2863. (In Chinese) [Google Scholar]
- Huang, X. Study on the Optimization of Booking Arrival of Container Terminals’ Foreign Trucks; Dalian Maritime University: Dalian, China, 2018. (In Chinese) [Google Scholar]
- Stefanakos, C.; Schinas, O. Fuzzy time series forecasting of bunker prices. WMU J. Marit. Aff. 2015, 14, 177–199. [Google Scholar] [CrossRef]
- Qianqian, S. Container Yard Cranes Configuration and Scheduling Optimization in Truck Appointment Mode; Dalian Maritime University: Dalian, China, 2017. (In Chinese) [Google Scholar]


| Experiment One | Experiment Two | Experiment Three | |
|---|---|---|---|
| Time window quota | (1,1,0,1,1,1,1,1,0,1) | (1,2,1,1,1,2,1,1,1,1) | (2,2,2,2,2,2,2,2,2,2,2) |
| Jobs | 4 | 5 | 5 |
| Appointment window | (1,4,6,8) | (2,3) | (1,1) |
| (2,6,7) | (3,9,9) | ||
| Truck arrival situation | 1 → 2 | 3 → 4 | on time |
| 2 → 4 | 3 → 5 | ||
| Rescheduling time window | (2,4,6,8) | (2,4) | (1,1) |
| (5,6,7) | (5,9,9) | ||
| Total cost | 724.2839 | 769.3842 | 752.2931 |
| Number | Jobs | Number of Truck Companies | Probability of Missing an Appointment | Double-Chain Real Quantum Genetic Algorithm | Taboo Search Algorithm | Genetic Algorithm | |||
|---|---|---|---|---|---|---|---|---|---|
| Target Value (min) | CPU(s) | Target Value (min) | CPU(s) | Target Value (min) | CPU(s) | ||||
| Z1 | 157 | 18 | 0.1 | 2183.29 | 324.72 | 2739.61 | 467.24 | 3228.45 | 491.38 |
| Z2 | 157 | 19 | 0.1 | 1936.28 | 323.94 | 2738.69 | 439.18 | 2964.92 | 472.92 |
| Z3 | 157 | 20 | 0.1 | 1829.37 | 302.43 | 2477.51 | 447.29 | 3192.47 | 443.21 |
| Z4 | 157 | 21 | 0.1 | 1802.48 | 288.18 | 2484.95 | 421.22 | 2780.58 | 458.73 |
| Z5 | 157 | 22 | 0.1 | 1693.52 | 283.45 | 2318.26 | 427.13 | 2639.21 | 442.02 |
Publisher’s Note: MDPI stays neutral with regard to jurisdictional claims in published maps and institutional affiliations. |
© 2022 by the authors. Licensee MDPI, Basel, Switzerland. This article is an open access article distributed under the terms and conditions of the Creative Commons Attribution (CC BY) license (https://creativecommons.org/licenses/by/4.0/).
Share and Cite
Xu, B.; Liu, X.; Li, J.; Yang, Y.; Wu, J.; Shen, Y.; Zhou, Y. Dynamic Appointment Rescheduling of Trucks under Uncertainty of Arrival Time. J. Mar. Sci. Eng. 2022, 10, 695. https://doi.org/10.3390/jmse10050695
Xu B, Liu X, Li J, Yang Y, Wu J, Shen Y, Zhou Y. Dynamic Appointment Rescheduling of Trucks under Uncertainty of Arrival Time. Journal of Marine Science and Engineering. 2022; 10(5):695. https://doi.org/10.3390/jmse10050695
Chicago/Turabian StyleXu, Bowei, Xiaoyan Liu, Junjun Li, Yongsheng Yang, Junfeng Wu, Yi Shen, and Ye Zhou. 2022. "Dynamic Appointment Rescheduling of Trucks under Uncertainty of Arrival Time" Journal of Marine Science and Engineering 10, no. 5: 695. https://doi.org/10.3390/jmse10050695
APA StyleXu, B., Liu, X., Li, J., Yang, Y., Wu, J., Shen, Y., & Zhou, Y. (2022). Dynamic Appointment Rescheduling of Trucks under Uncertainty of Arrival Time. Journal of Marine Science and Engineering, 10(5), 695. https://doi.org/10.3390/jmse10050695