2. Text Correction
Near the eye in the TC-centered reference frame, we find a pattern of model underestimation in the left sector and overestimation in the right sector except near the eye where wave height remains underestimated. This pattern holds, albeit modulated, across various intensities, forward translation velocities, and radii of maximum winds; the exceptions being the fastest translating storms where the error pattern shows a trend towards overestimation in all sectors. The error patterns for intense and compact TCs exhibited more severe underestimation, which dominated the region near the TC eye.
In the original publication,
Figure 3 is incorrect. The correct figure and caption and reproduced below:
Figure 3.
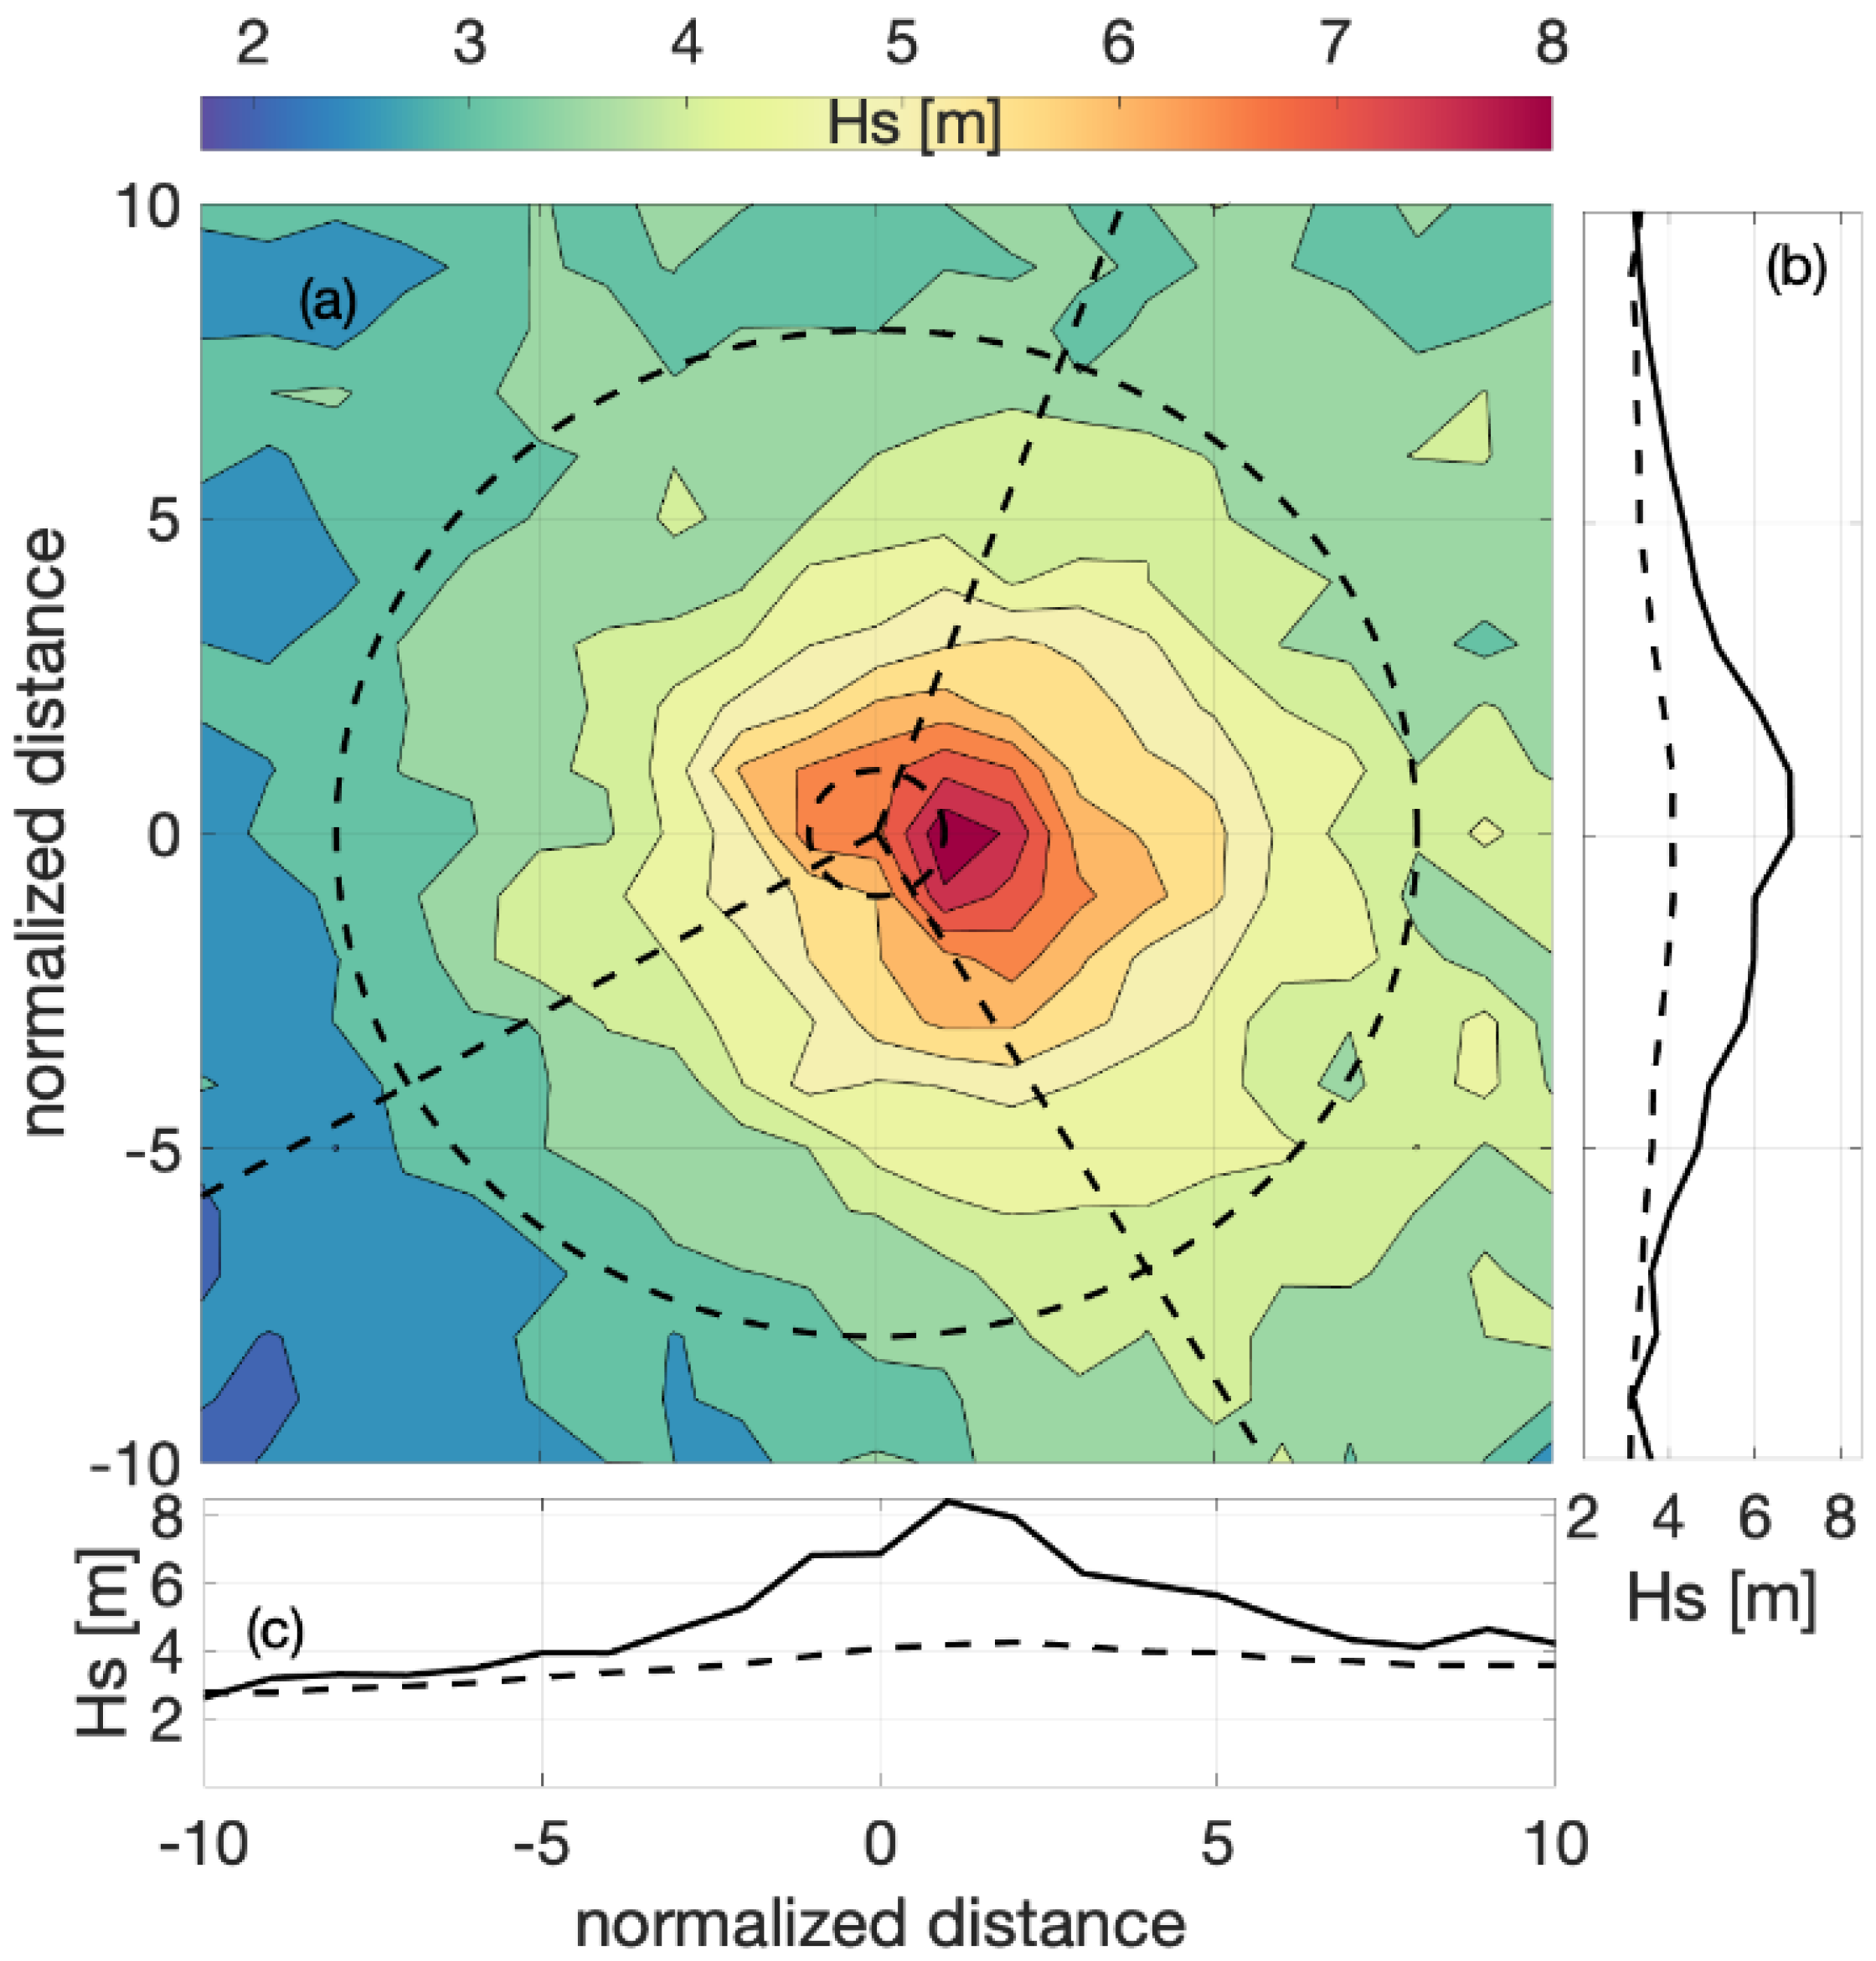
Average wave height observed by altimeters in a TC-centered reference frame (Ur ≥ 33 m/s). (a) Color scale indicates average wave height observed in 2R × 2R bins, with contour lines every 0.5 m. Small dashed circle is R = 1; larger dashed circle is R = 8. Dashed lines show TC sectors according to [27]. Up arrow is the orientation of the TC, moving forward up the page. (b) Solid line is a back to front transect along nX = 0 and the dashed line is the average along the nX axis. (c) as in (b) for nY.
Figure 3.
Average wave height observed by altimeters in a TC-centered reference frame (Ur ≥ 33 m/s). (a) Color scale indicates average wave height observed in 2R × 2R bins, with contour lines every 0.5 m. Small dashed circle is R = 1; larger dashed circle is R = 8. Dashed lines show TC sectors according to [27]. Up arrow is the orientation of the TC, moving forward up the page. (b) Solid line is a back to front transect along nX = 0 and the dashed line is the average along the nX axis. (c) as in (b) for nY.
Figure 3 is referenced in Section 3.1, The corrected text now states:
The wave heights are asymmetric with the highest wave heights in the right sector around R = 1. The left to right asymmetry is pronounced, at R = 5, there is a ~1.5 m difference between the wave height in the right and left sectors along the nY = 0 transect (
Figure 3c). There is also a less pronounced front-to-back symmetry, with higher waves on average in the back hemisphere (
Figure 3c).
In the original publication,
Figure 4 is incorrect. The correct figure is reproduced below:
Figure 4.
Altimeter observed wave height shown in color. Each subplot as in
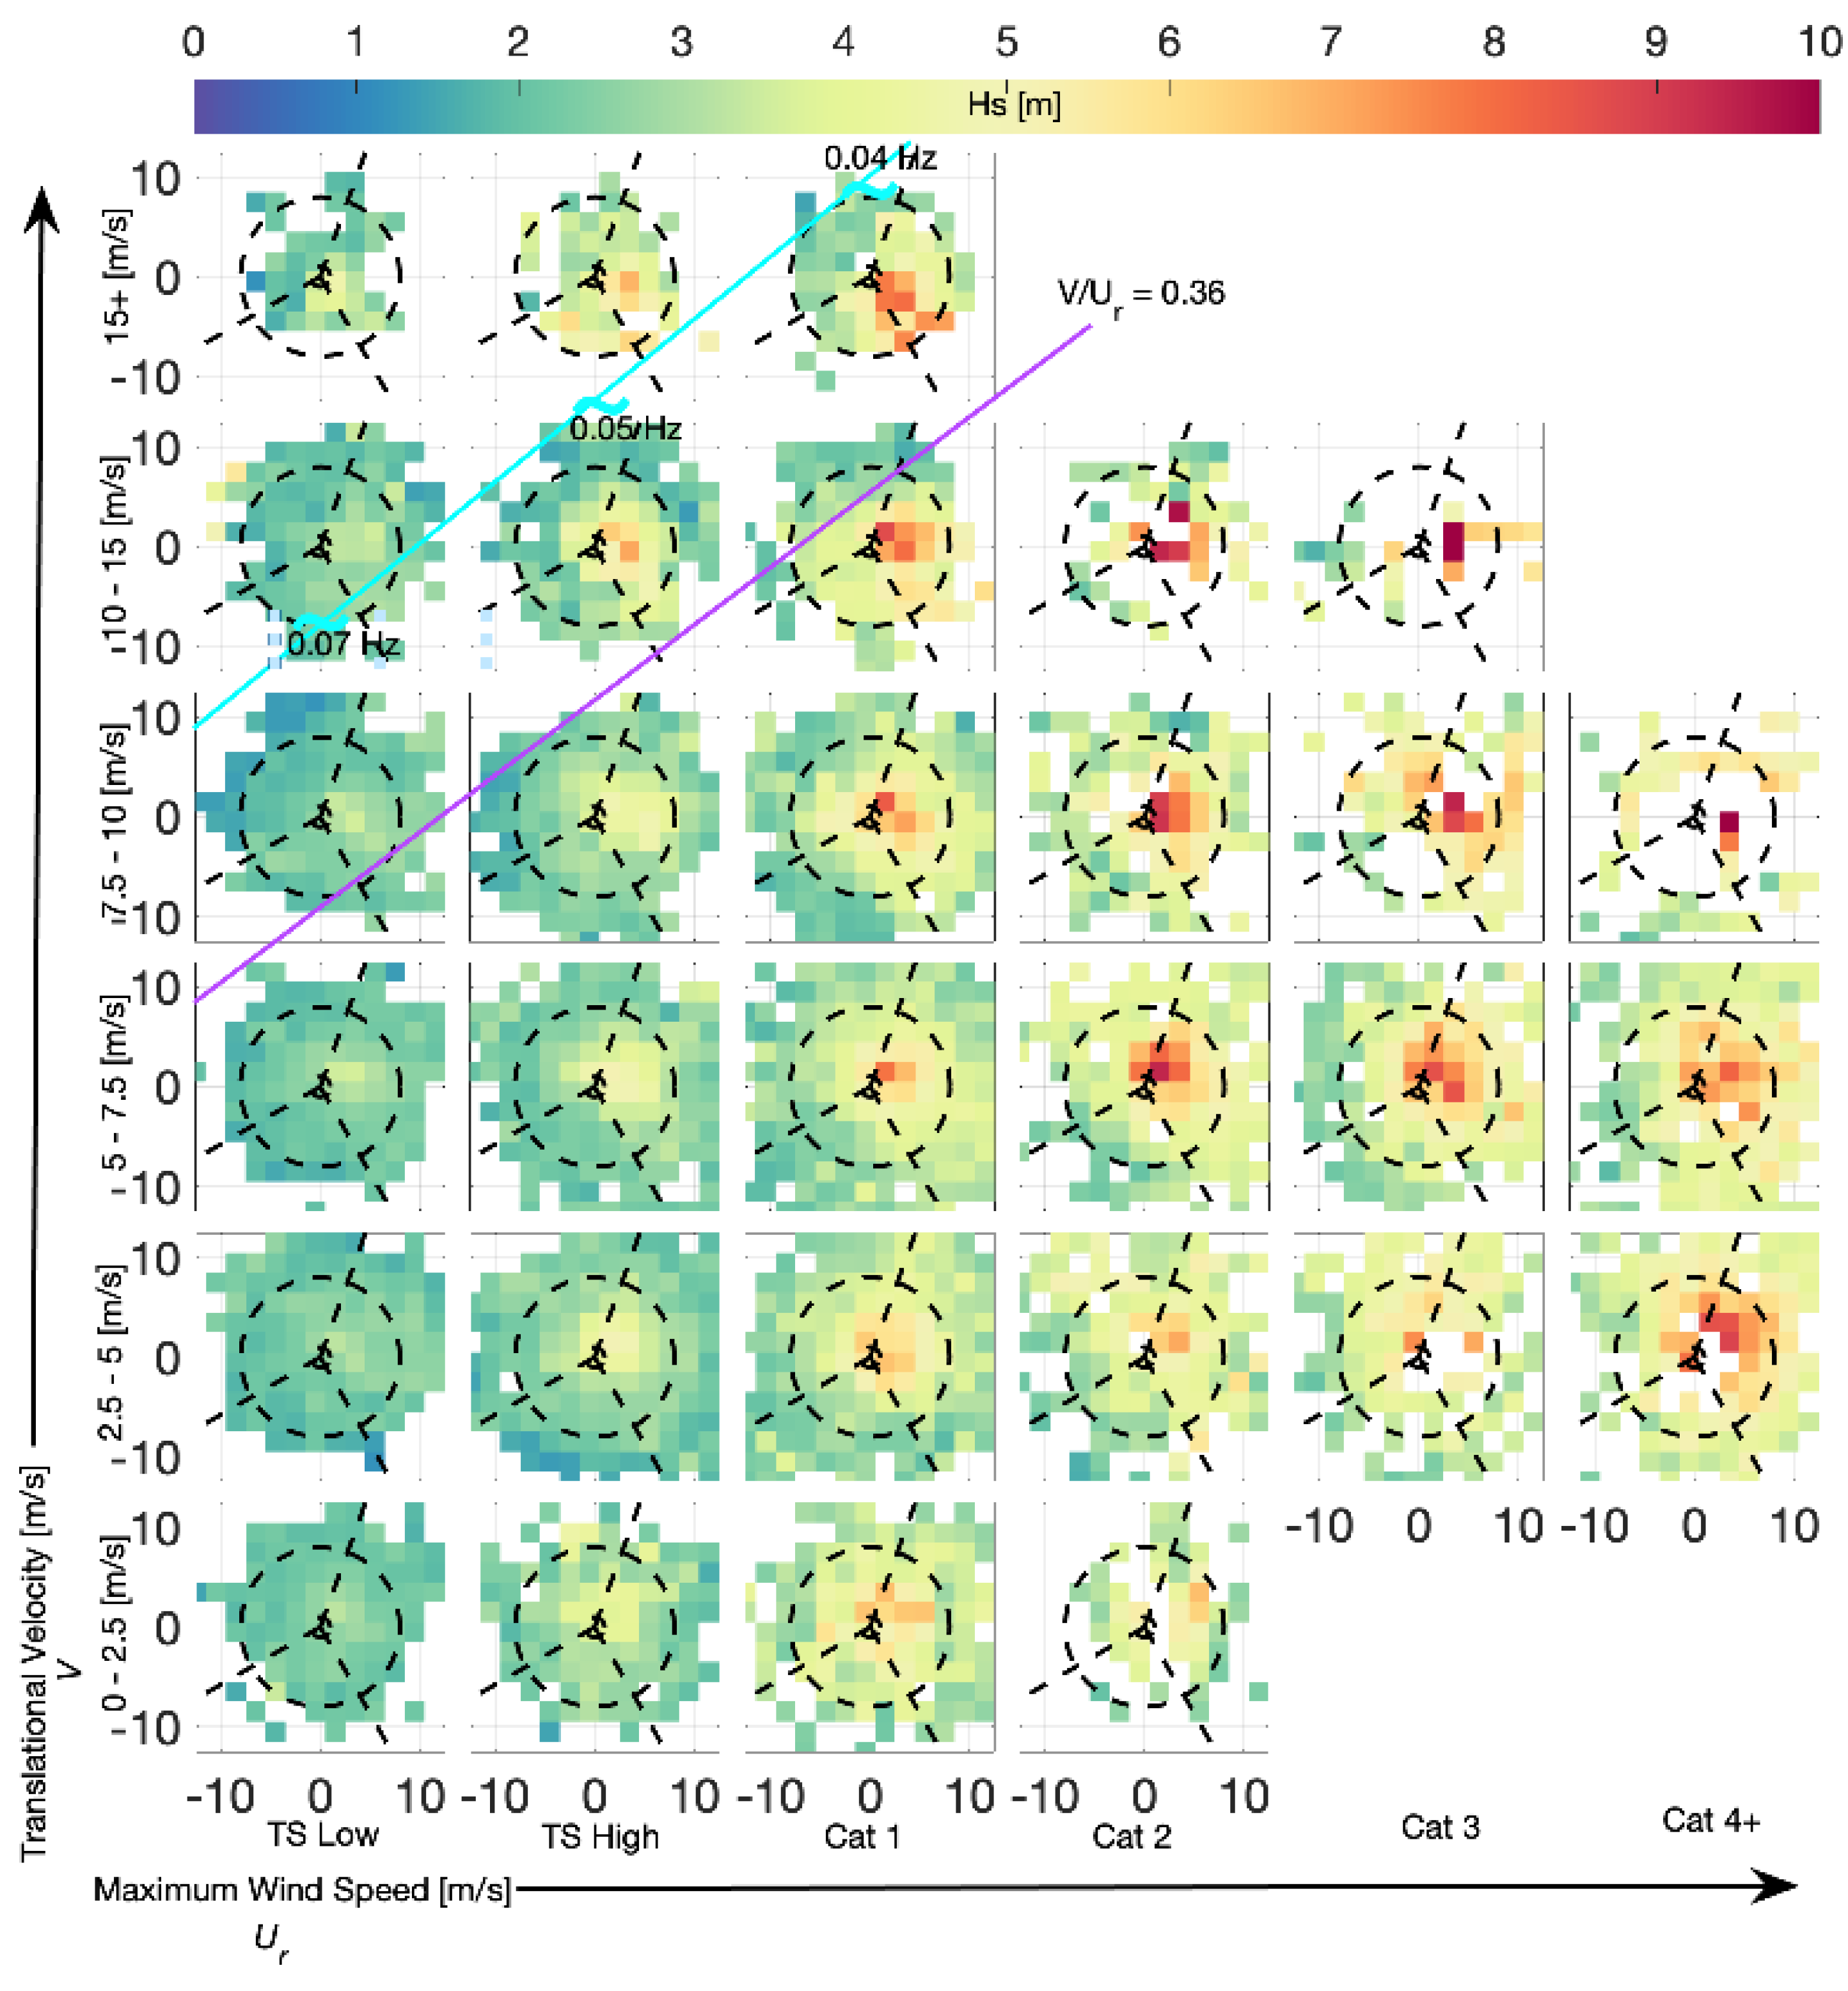
Figure 3 without interpolation or contour lines. Data are binned by S-S category from left to right. From bottom to top, data are binned by TC translation velocity. The color scale indicates significant wave height from 0–10 m. The cyan line shows the approximate correspondence of linear wave phase speed (
x-axis) to group speed (
y-axis). The wave frequency is given at 3 locations along the line. The purple line is the approximate location of the resonance condition of Kudryavtsev et al., 2015.
Figure 4.
Altimeter observed wave height shown in color. Each subplot as in
Figure 3 without interpolation or contour lines. Data are binned by S-S category from left to right. From bottom to top, data are binned by TC translation velocity. The color scale indicates significant wave height from 0–10 m. The cyan line shows the approximate correspondence of linear wave phase speed (
x-axis) to group speed (
y-axis). The wave frequency is given at 3 locations along the line. The purple line is the approximate location of the resonance condition of Kudryavtsev et al., 2015.
Figure 4 was referenced in Section 3.1, the following sentence was added to the end of the last paragraph:
Note also that as the translation velocity increases, the location of the peak wave heights shifts from ahead of the eye to behind.
In the original publication,
Figure 12 is incorrect. The correct figure is reproduced below:
Figure 12.
As in
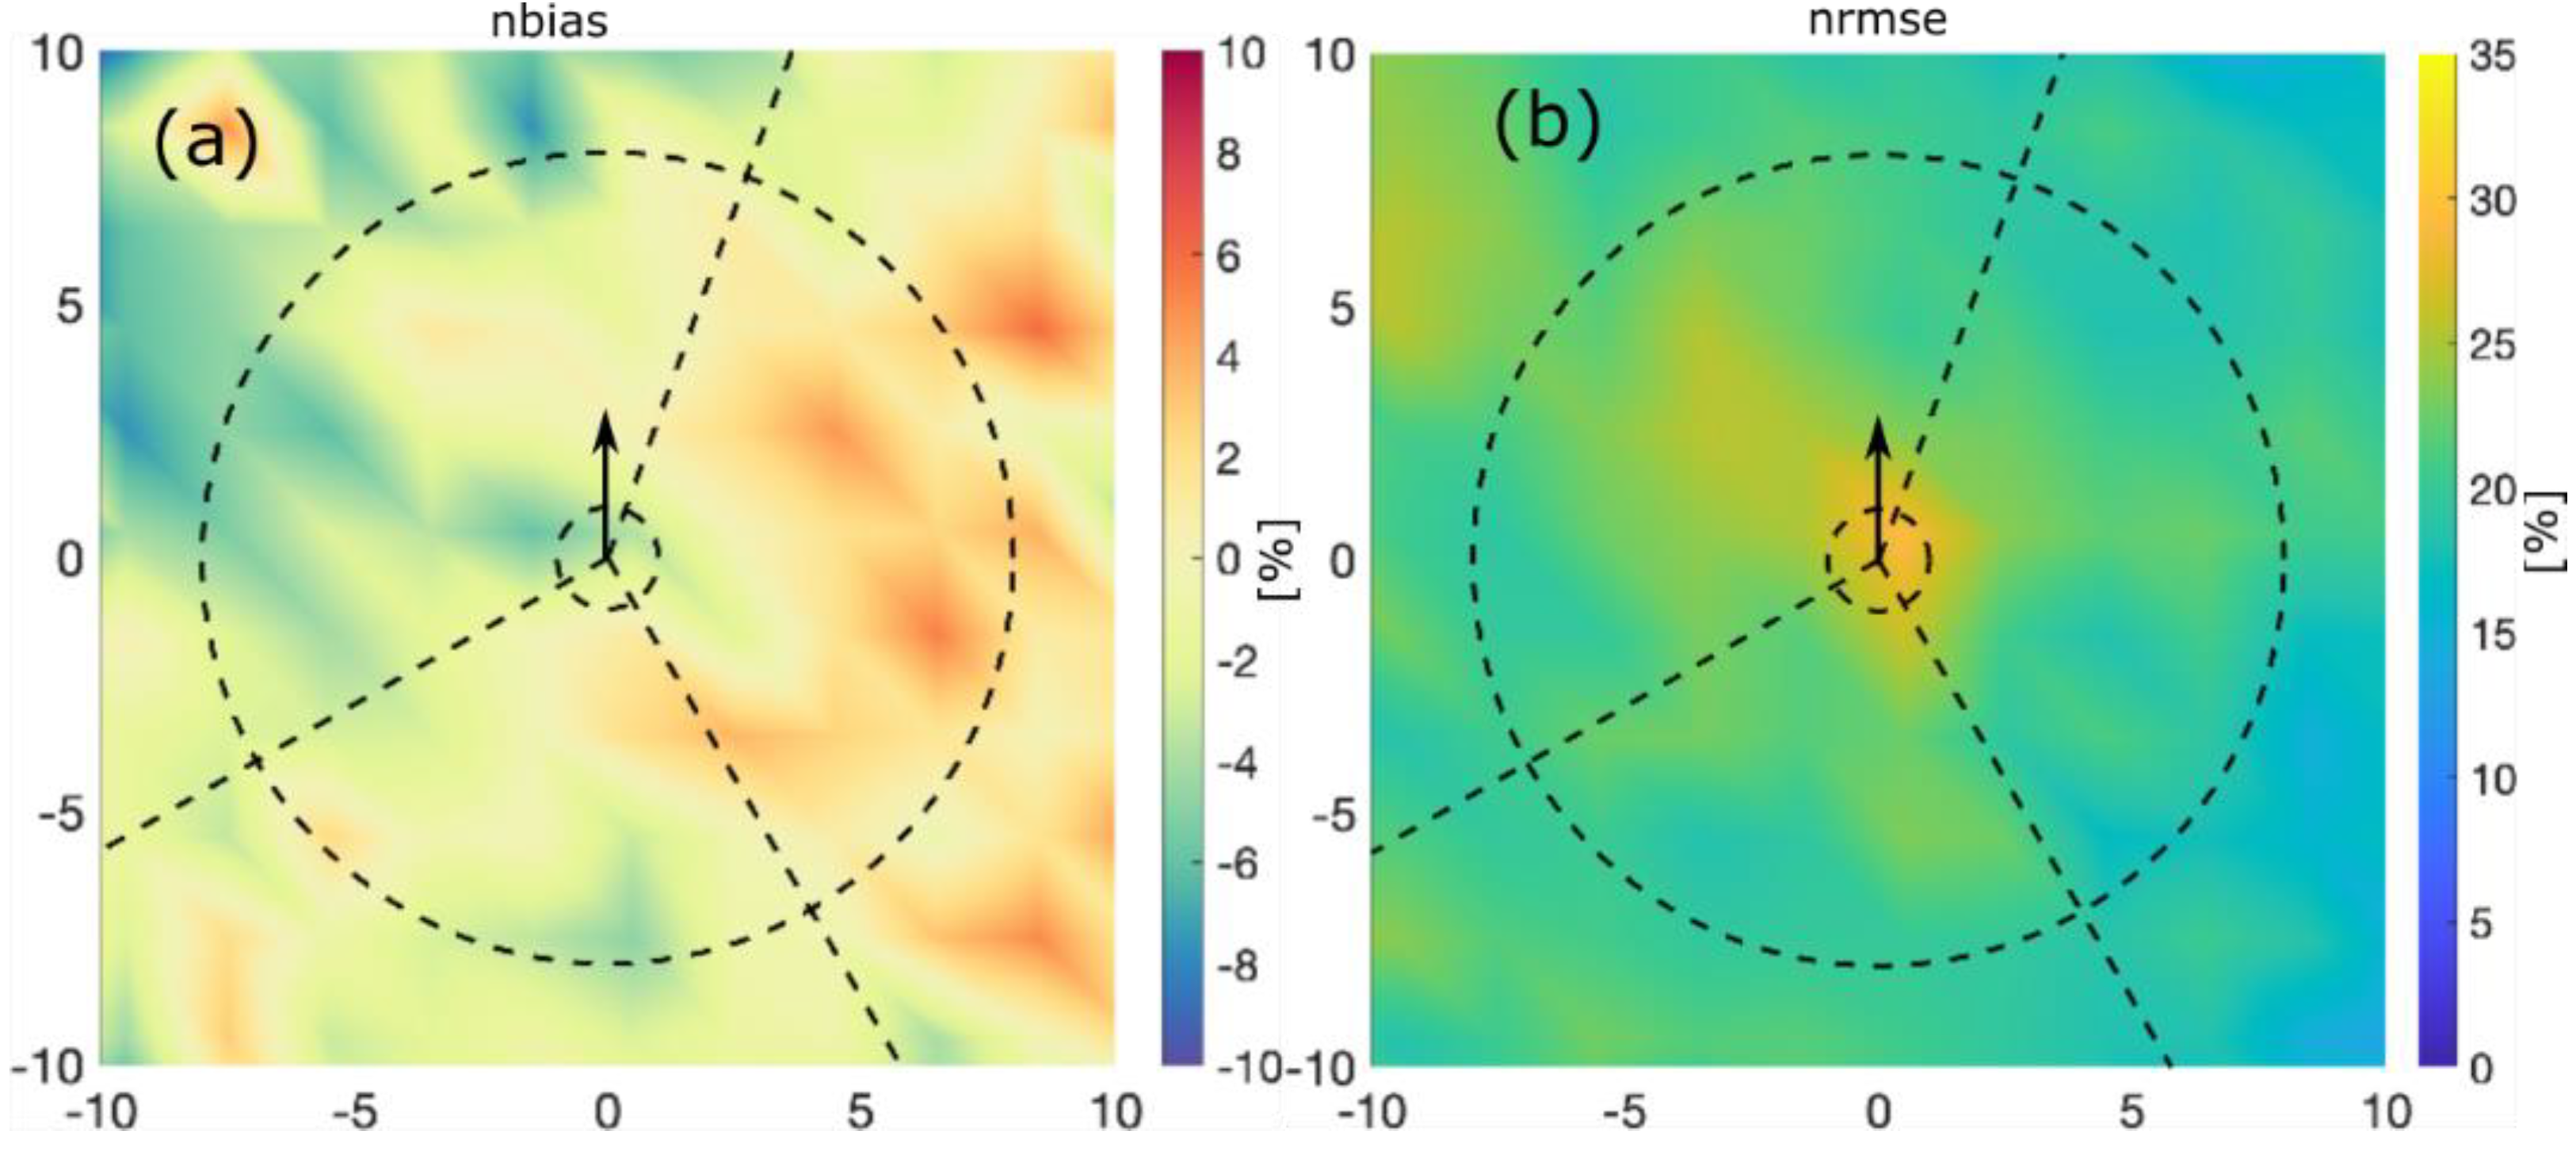
Figure 3 for relative nbias (
a) and nrmse (
b).
Figure 12.
As in
Figure 3 for relative nbias (
a) and nrmse (
b).
Figure 12 is referenced in Section 3.3.4. The correct text now states:
Figure 12 shows the spatial patterns of relative bias and nrmse around a TC. There is general pattern of underestimation of wave height in the left sector (~−4%) and overestimation of wave height in the right sector (~+5%). The exceptions are directly ahead of the storm where technically in the left sector we observed slight overestimation and near the eye where wave height remains underestimated (~−2%). There is a transition area ahead and behind the eye. In the back sector, there are alternating areas of weak under and overestimation. These sectors, as suggested by [27] and others, grossly separate areas of over and underestimation within R < 8, but there remains nuance.
The nrmse is relatively high near the eye of the storm (30%) and decreases out radially. The right sector shows less nrmse than the left. High nrmse emerges near the margins (~R = 15, not shown). The observation density is very high within R < 8. R = 8 corresponds to the 600 samples per bin contour, but there are 100 or fewer samples per bin at the margins at 15R. Next, we parse model-observation pairs in terms of storm attributes: maximum wind speed, translation velocity, and radius of maximum winds.
There were incorrect references to
Figure 12 in Section 4, the correct text now reads:
Figure 12 shows model results in a TC-centered frame of reference. On average, within R = 8, there is a pattern of underestimation in the left sector and overestimation in the right sector. The notable exceptions are an area of slight overestimation directly ahead of the eye (in the left sector) and underestimation near the storm center of all sectors. This pattern is robust across two operational hindcasts and two altimeter databases, as shown in Appendix A. This pattern is modulated when binning data in terms of storm attributes. In terms of TC maximum wind speed, the error patterns for both relative bias and nrmse go from weaker to stronger as intensity increases. Moreover, there tends to be an increase in overestimation in the back and left sectors as intensity increases. In terms of TC forward translation velocity, the bias is systematically shifted in a positive direction as translation velocity increases (nrmse changes little). Binning by rmw exposed error around the center of TCs; for the smallest storms, there was a very strong underestimation of all sectors accompanied by very high nrmse.
Intuitively, systematic underestimation in intensity by reanalysis winds could explain the underestimation of the largest waves in the eye region. However, it is more difficult to make sense of overestimation in the right sector.
In the original publication,
Figure 13 is incorrect. The correct figure is reproduced below:
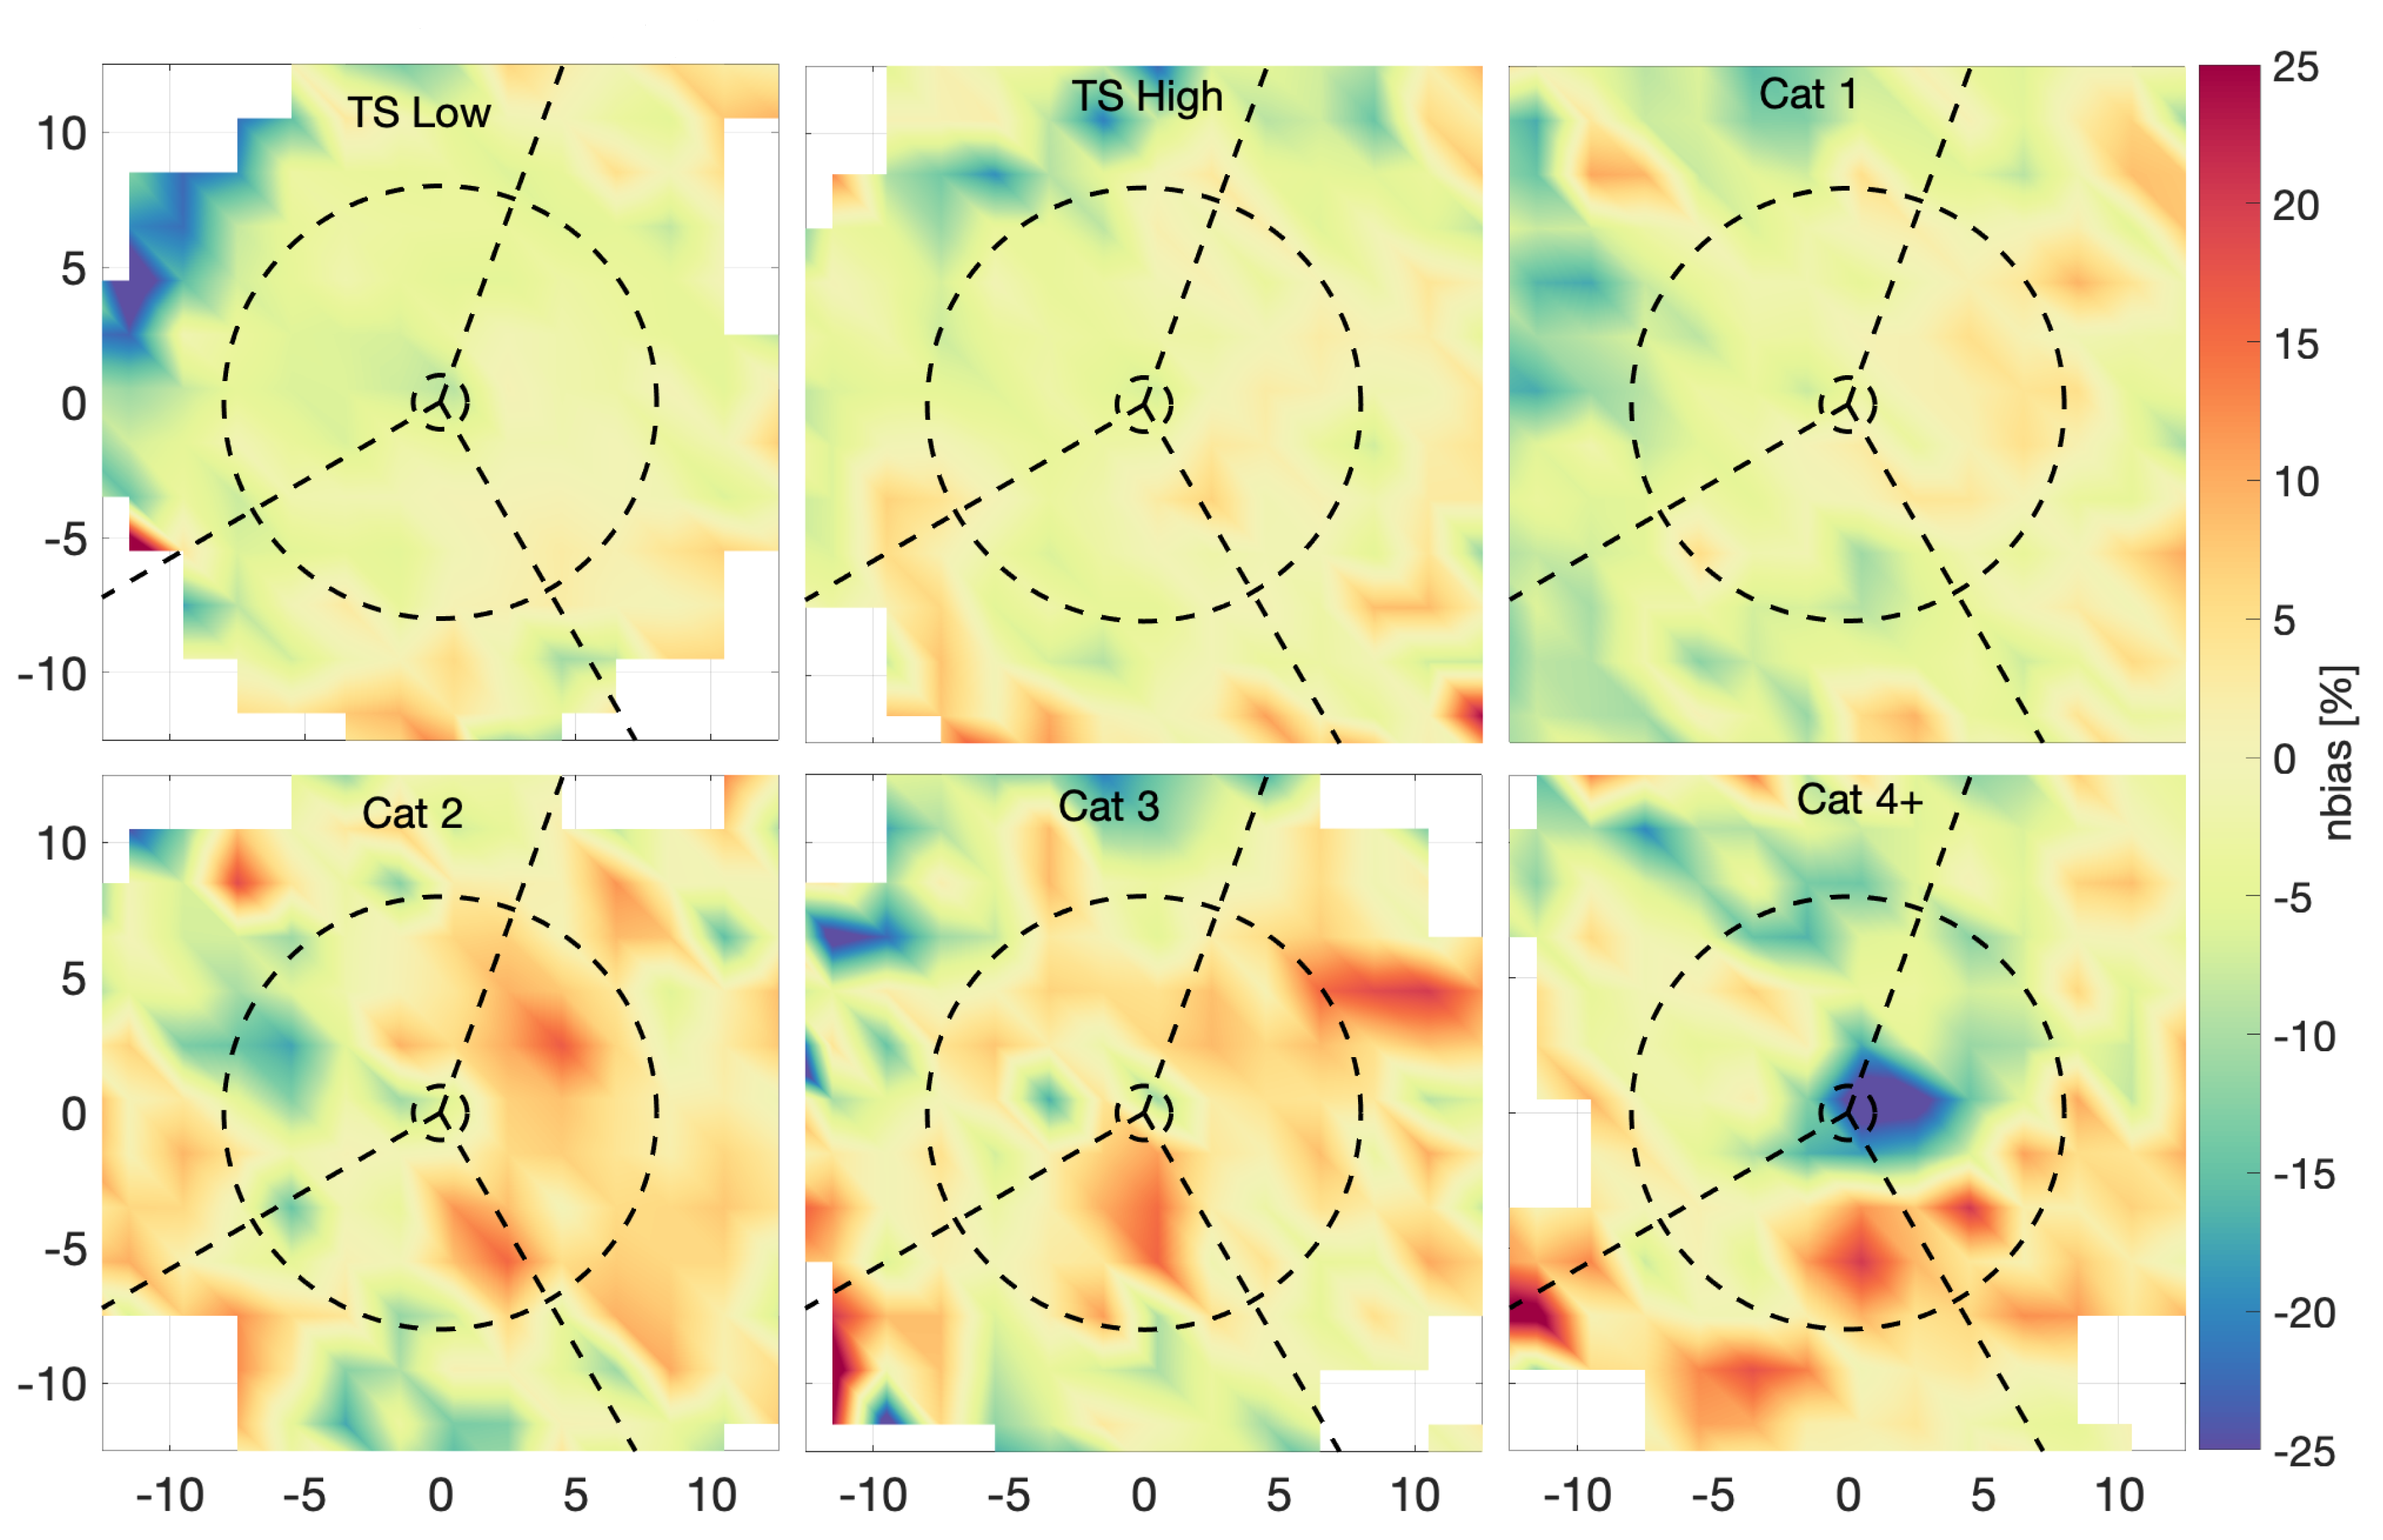
Figure 13.
Each subplot as in
Figure 12a for each category of the S-S intensity scale. (Note the difference in color scale.).
Figure 13.
Each subplot as in
Figure 12a for each category of the S-S intensity scale. (Note the difference in color scale.).
In the original publication,
Figure 14 is incorrect. The correct figure is reproduced below:
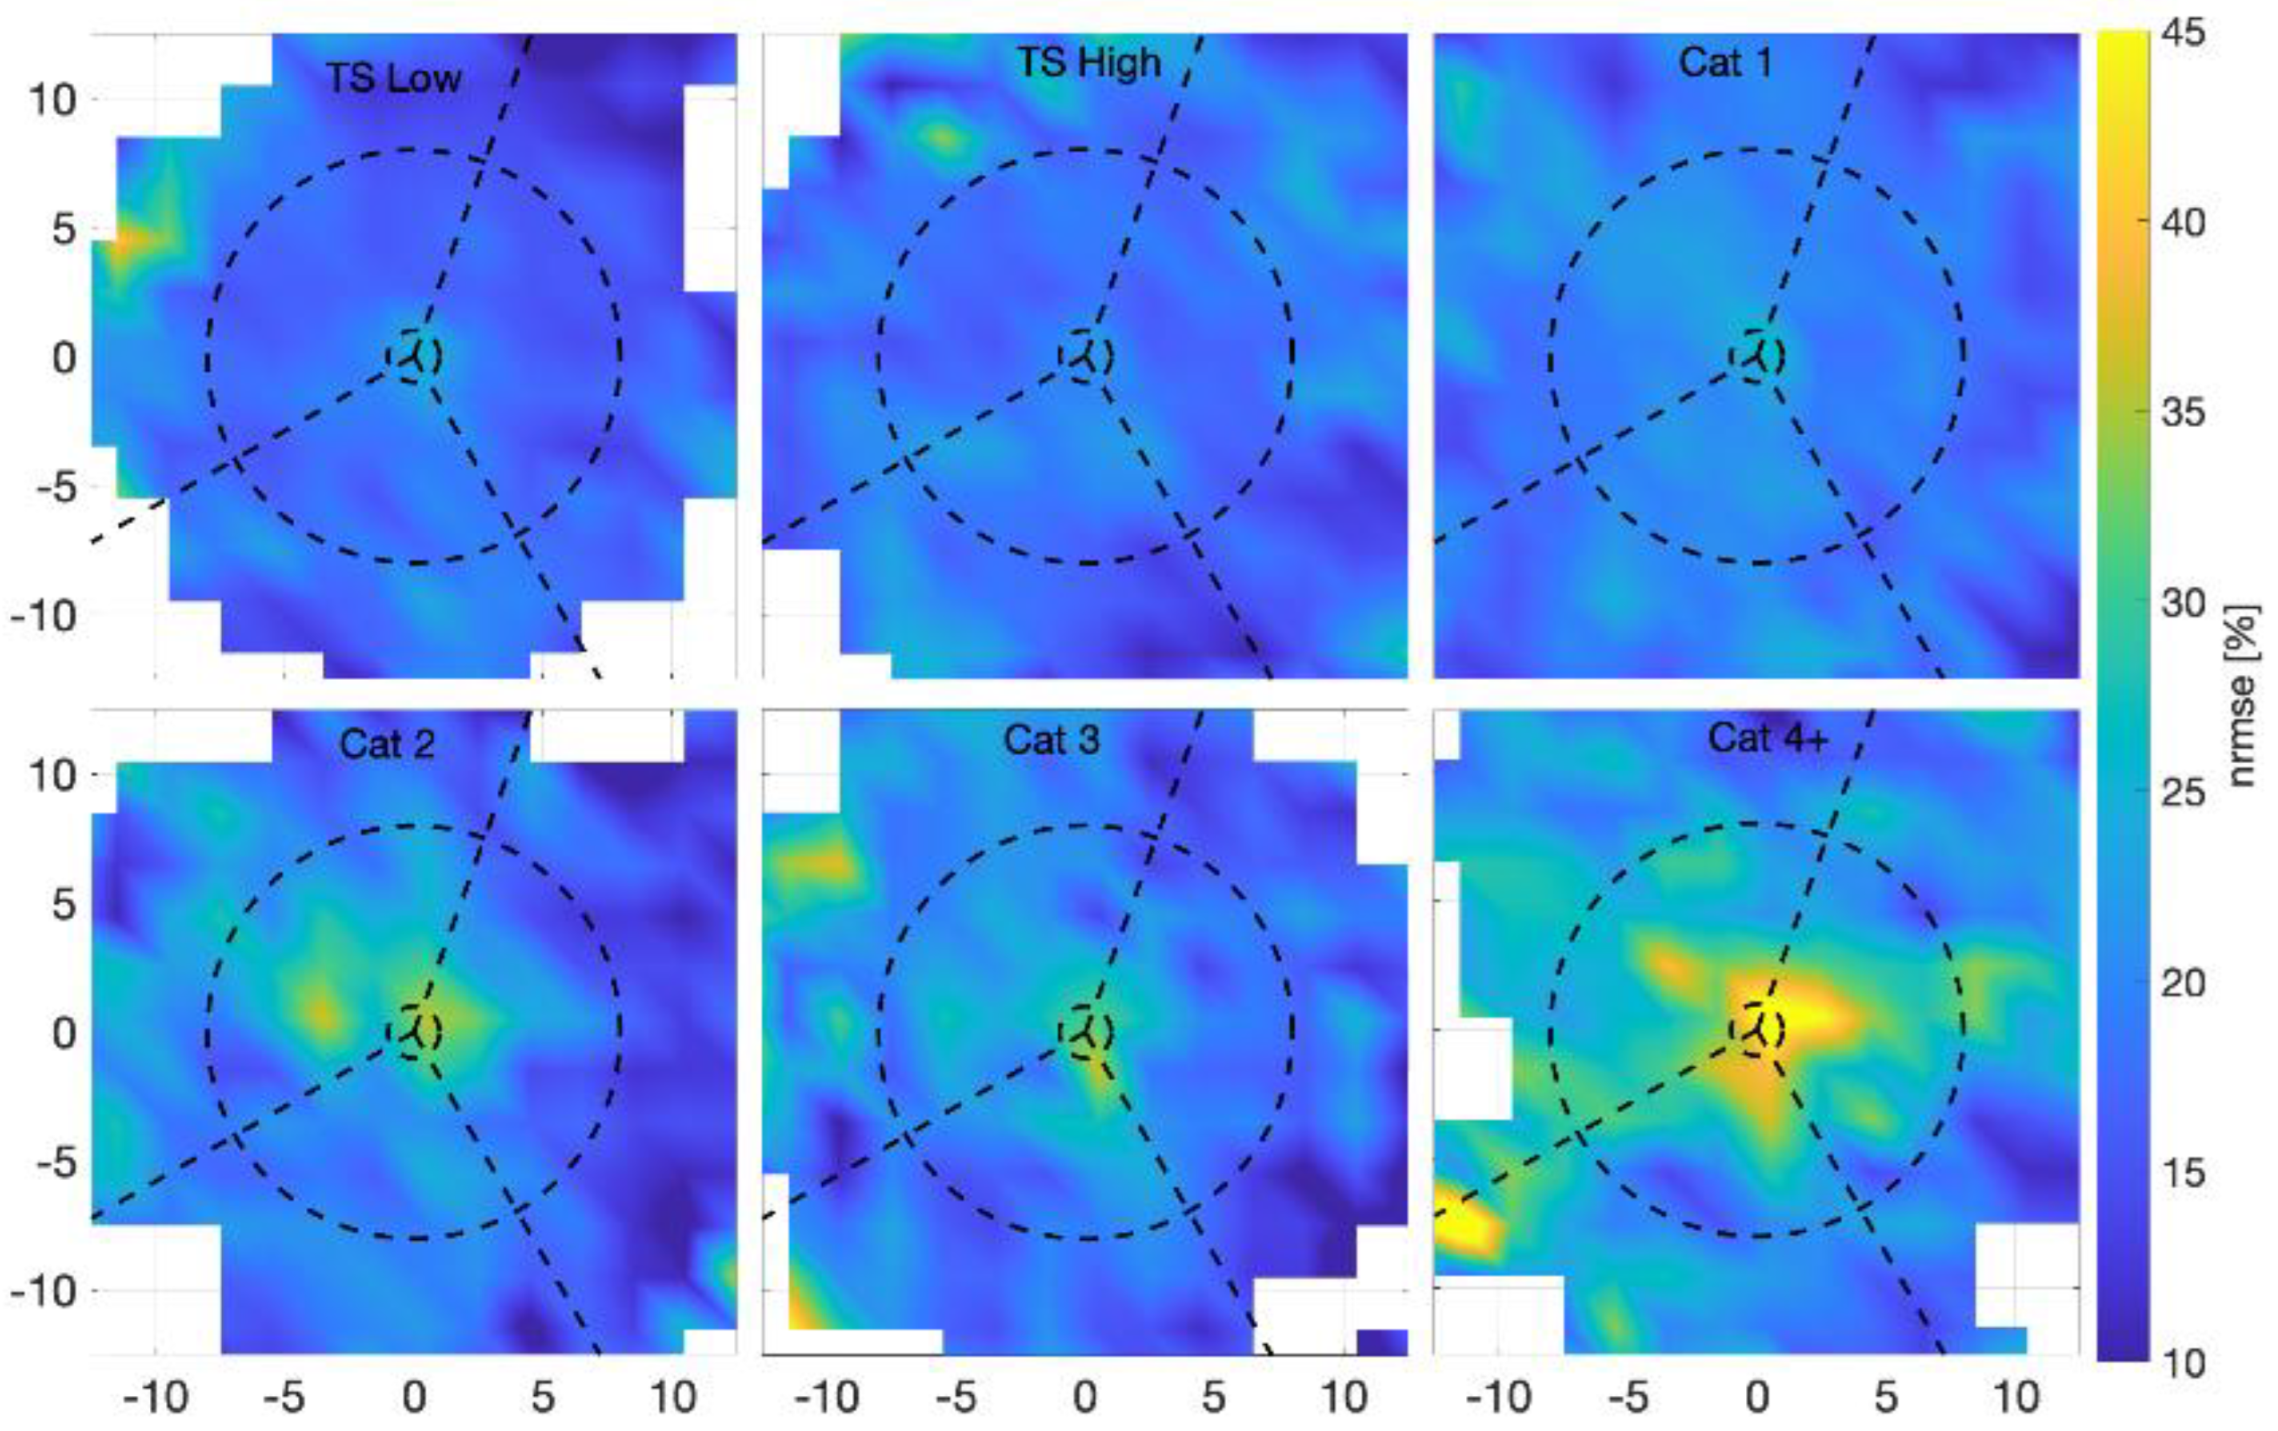
Figure 14.
Each subplot as in
Figure 12b for each category of the S-S intensity scale (note the difference in color scale).
Figure 14.
Each subplot as in
Figure 12b for each category of the S-S intensity scale (note the difference in color scale).
Figure 13 and
Figure 14 are referenced in Section 3.3.4. TC Intensity. The correct text now states:
Data were binned by intensity using the S-S hurricane intensity scale (refer to Table 1).
Figure 13 shows relative bias for each intensity category. For TS Low through Cat 2 wind speeds, the patterns within R = 8 are similar to those found in
Figure 12a. While the pattern is barely discernible for TS Low/High, it appears to strengthen with increasing intensity. For Cat 3 wind speeds, overestimation appears in all sectors except for the region around the eye and areas in the left sector. For Cat 4+ wind speeds, there is strong underestimation (>25+%) within R = 5, mainly in the right sector peaking at −35%. Outside of R = 5, the overestimation emerges in the right and back sectors before R = 8. At this most extreme bin, generally, there is an overestimation behind the eye and underestimation ahead of the eye.
The last sentence of the last paragraph in this section now reads:
The nrmse tends to increase as a function of intensity as nrmse of 25% near the eye of TS low and 50% near the eye of Cat 4+.
In the original publication,
Figure 15 is incorrect. The correct figure is reproduced below:
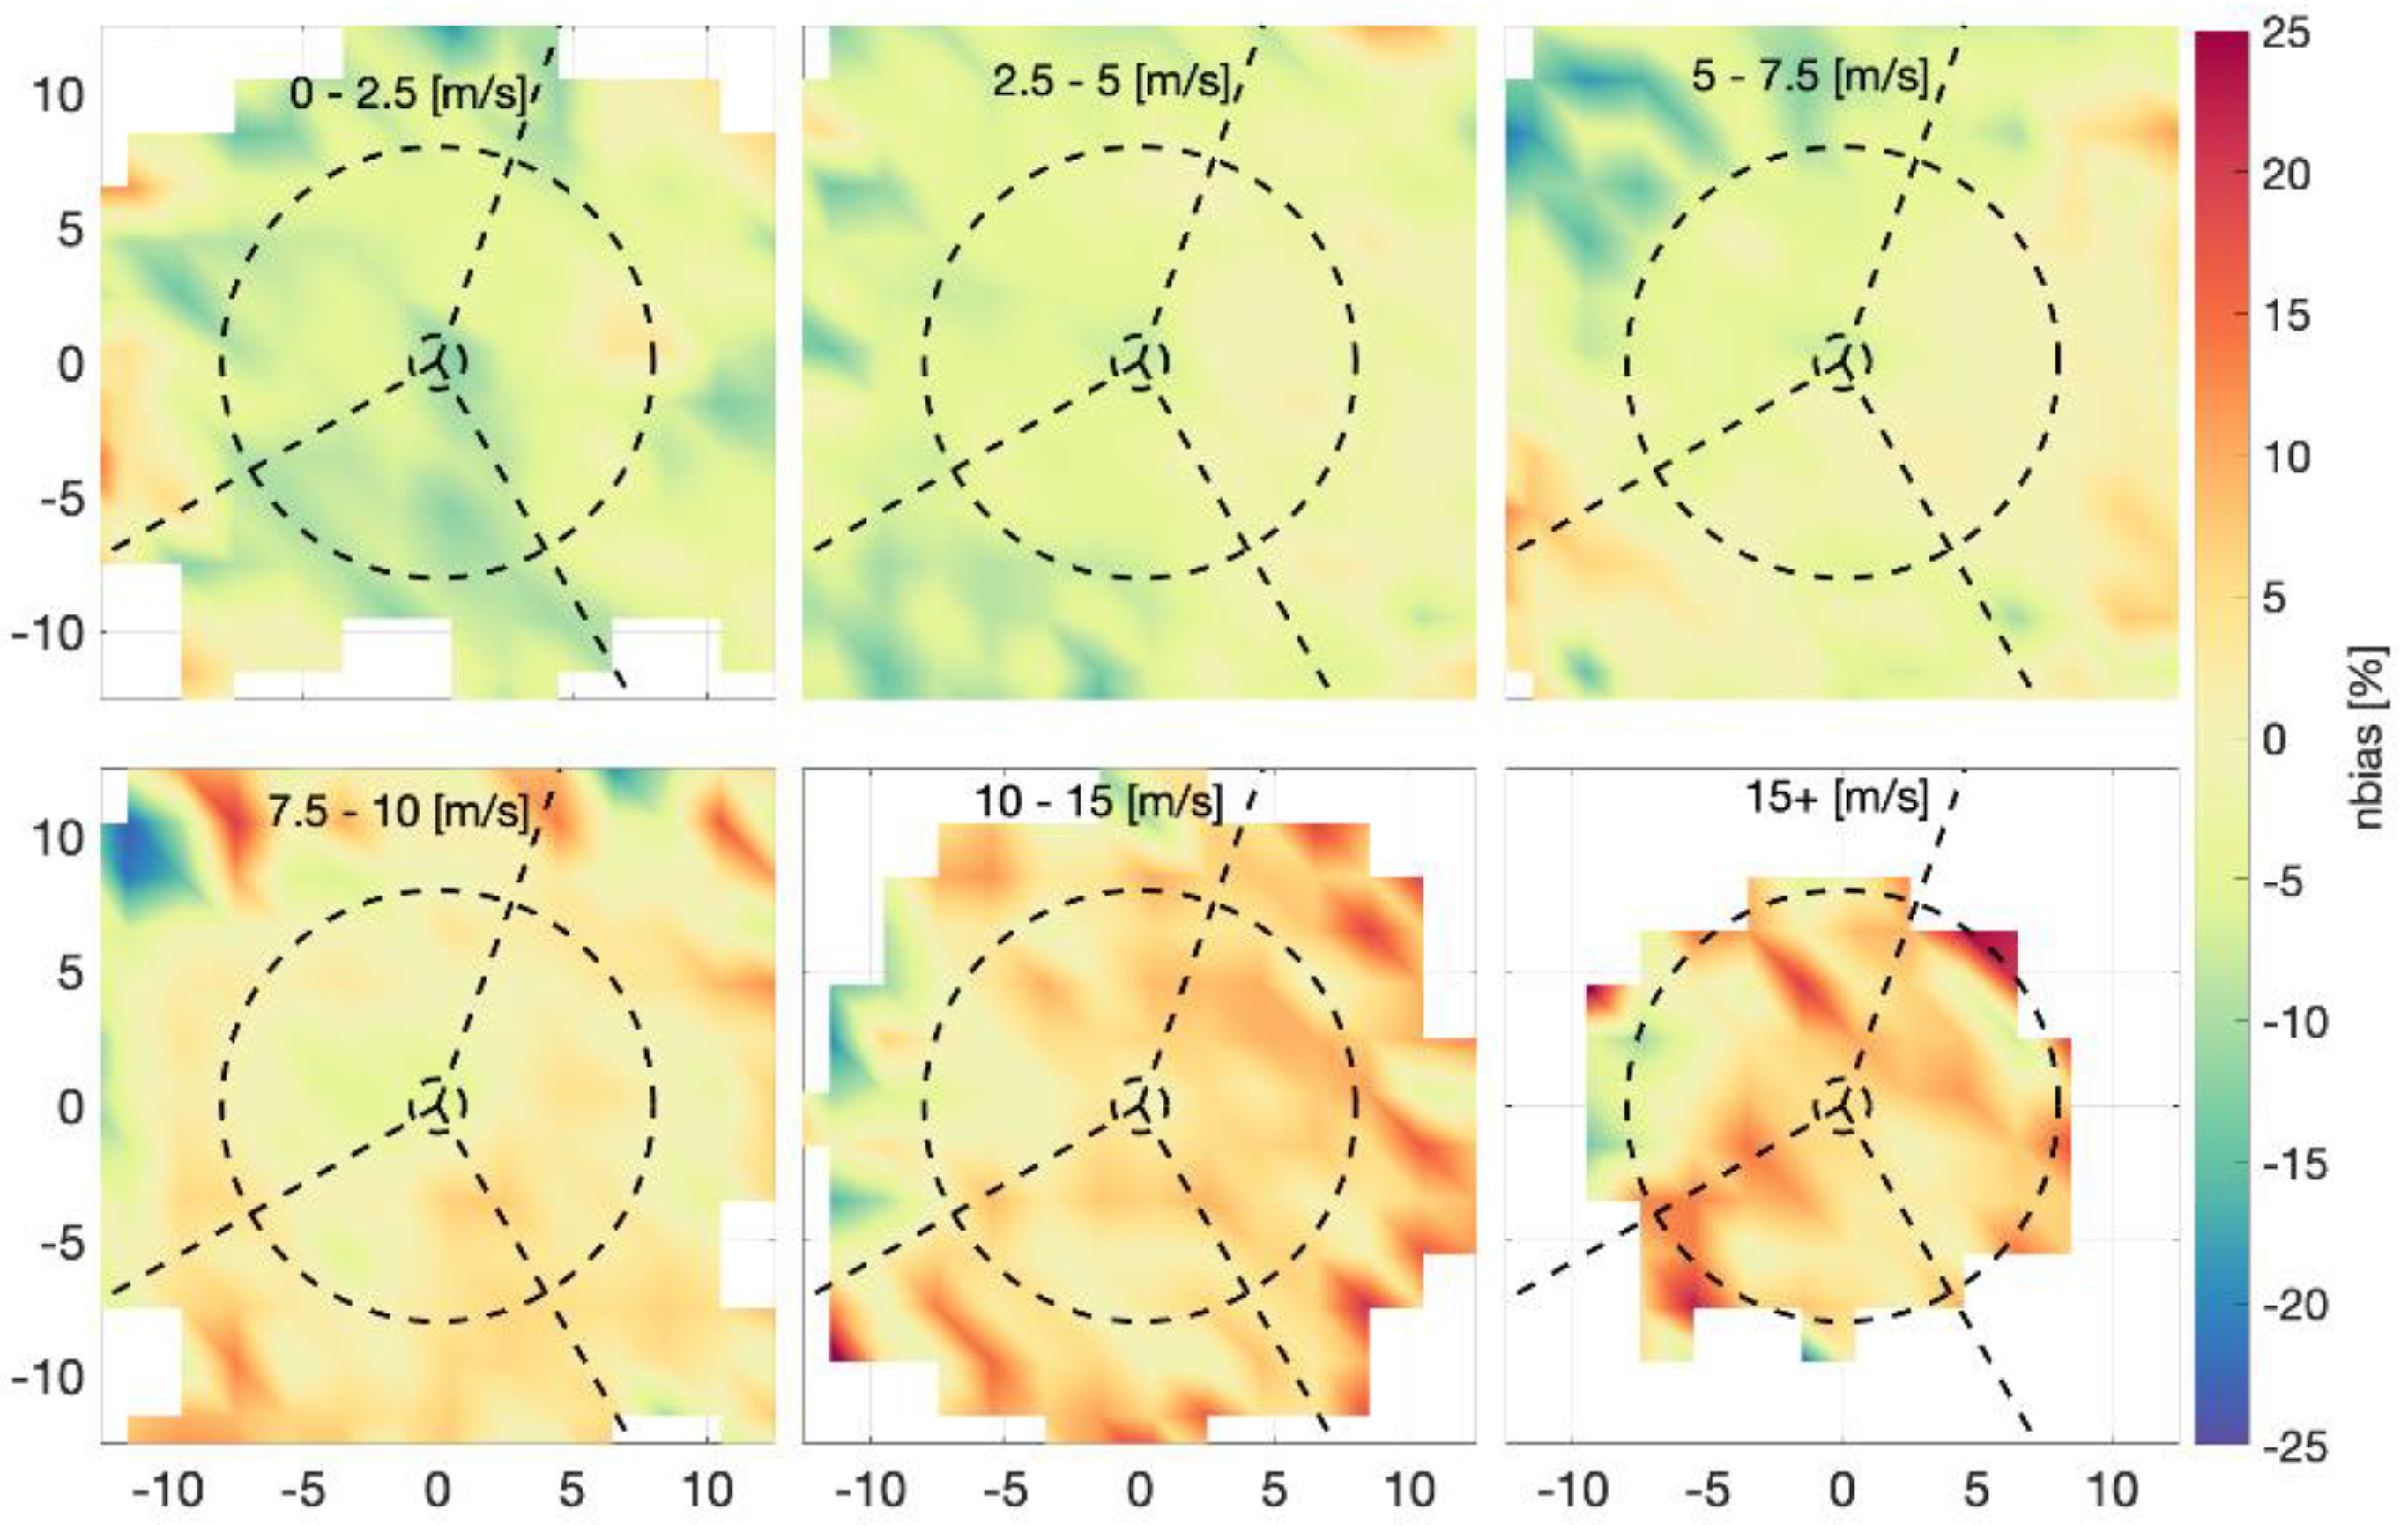
Figure 15.
As in
Figure 13, each subplot parsed by forward translation velocity.
Figure 15.
As in
Figure 13, each subplot parsed by forward translation velocity.
In the original publication,
Figure 16 is incorrect. The correct figure is reproduced below:
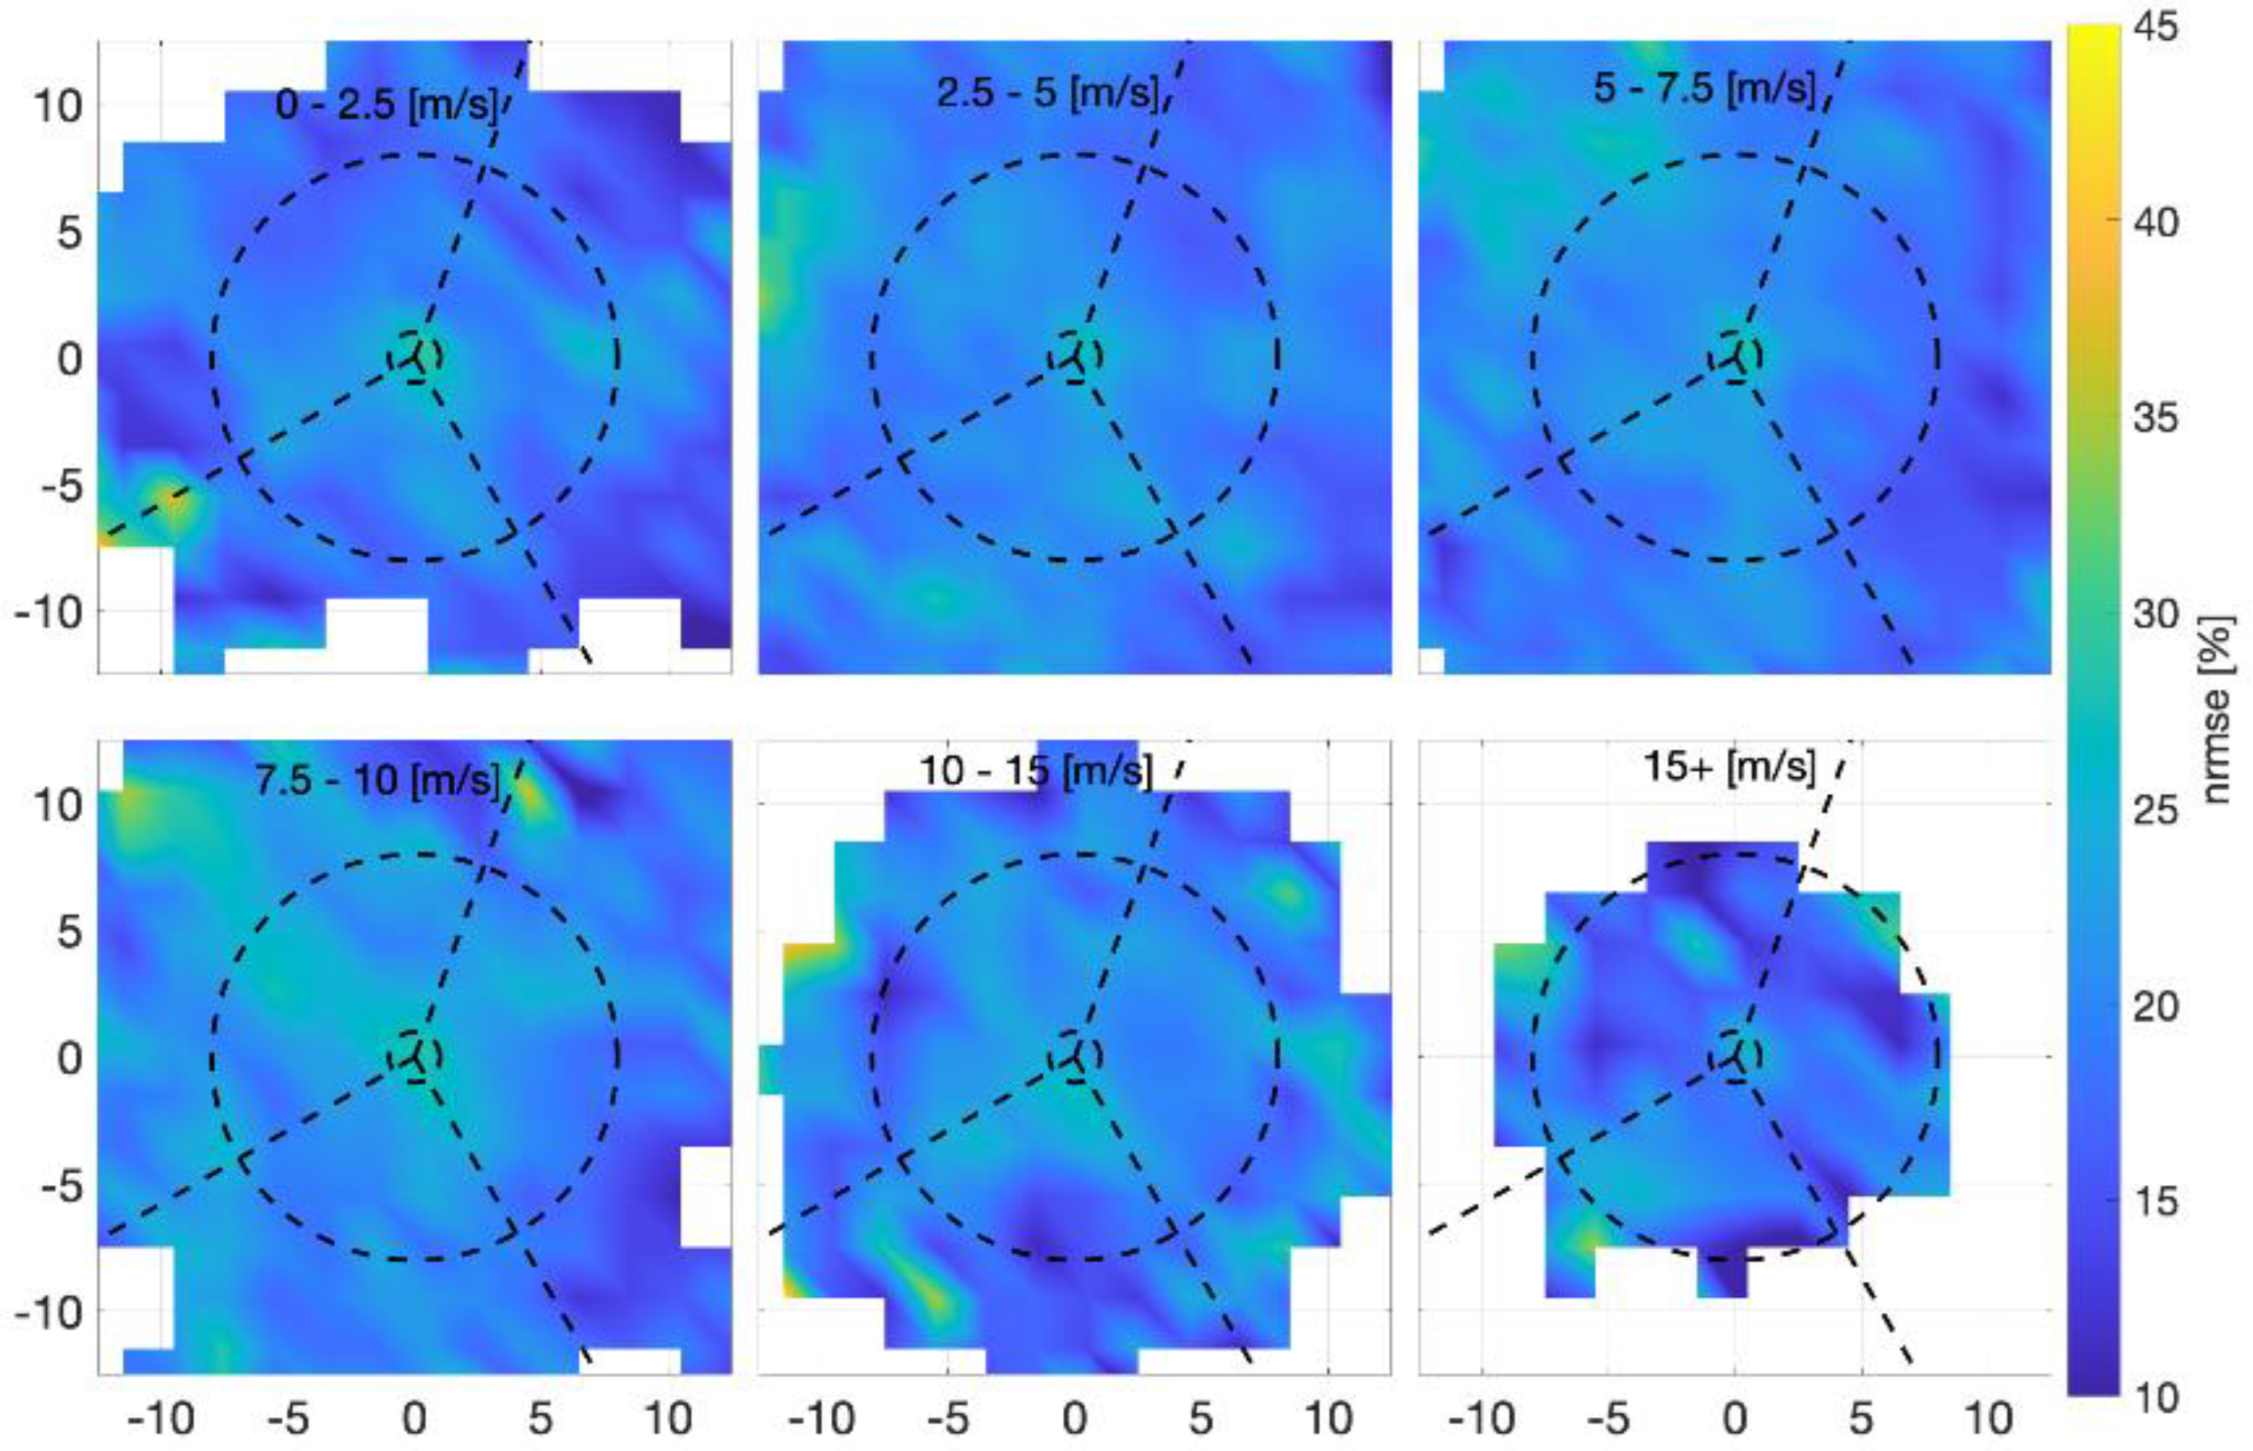
Figure 16.
As in
Figure 14, each subplot parsed by forward translation velocity.
Figure 16.
As in
Figure 14, each subplot parsed by forward translation velocity.
Figure 15 and
Figure 16 are referenced in Section 3.3.4, TC Forward Translation Velocity. The correct text now states:
For all subplots, there is a relative minimum in bias around the eye, and this bias is negative (model underestimation) for all but the fastest storms. There is a systematic shift of relative bias as a function of V. For slow moving storms, V = 0–2.5 m/s, there is a tendency for under estimation (10%) in left and back sectors nearly transitioning to positive bias in the right sector. For moderately fast storms, V = 7.5–10 m/s, there is slight negative bias in the left sector slight positive bias in right and back sectors. For fast storms, V = 10–15 m/s, there is positive bias all sectors and it is relatively strong in the right sector (10%).
Figure 16 shows nrmse for the same forward translation velocity bins. There is nrmse local maxima within R = 8, but it is slight. These are subtle shifts, but no strong pattern emerges in nrmse as the storm speed increases.
In the original publication,
Figure 17 is incorrect. The correct figure is reproduced below:
Figure 17.
As in
Figure 13, each subplot parsed by radius of maximum winds.
Figure 17.
As in
Figure 13, each subplot parsed by radius of maximum winds.
In the original publication,
Figure 18 is incorrect. The correct figure is reproduced below:
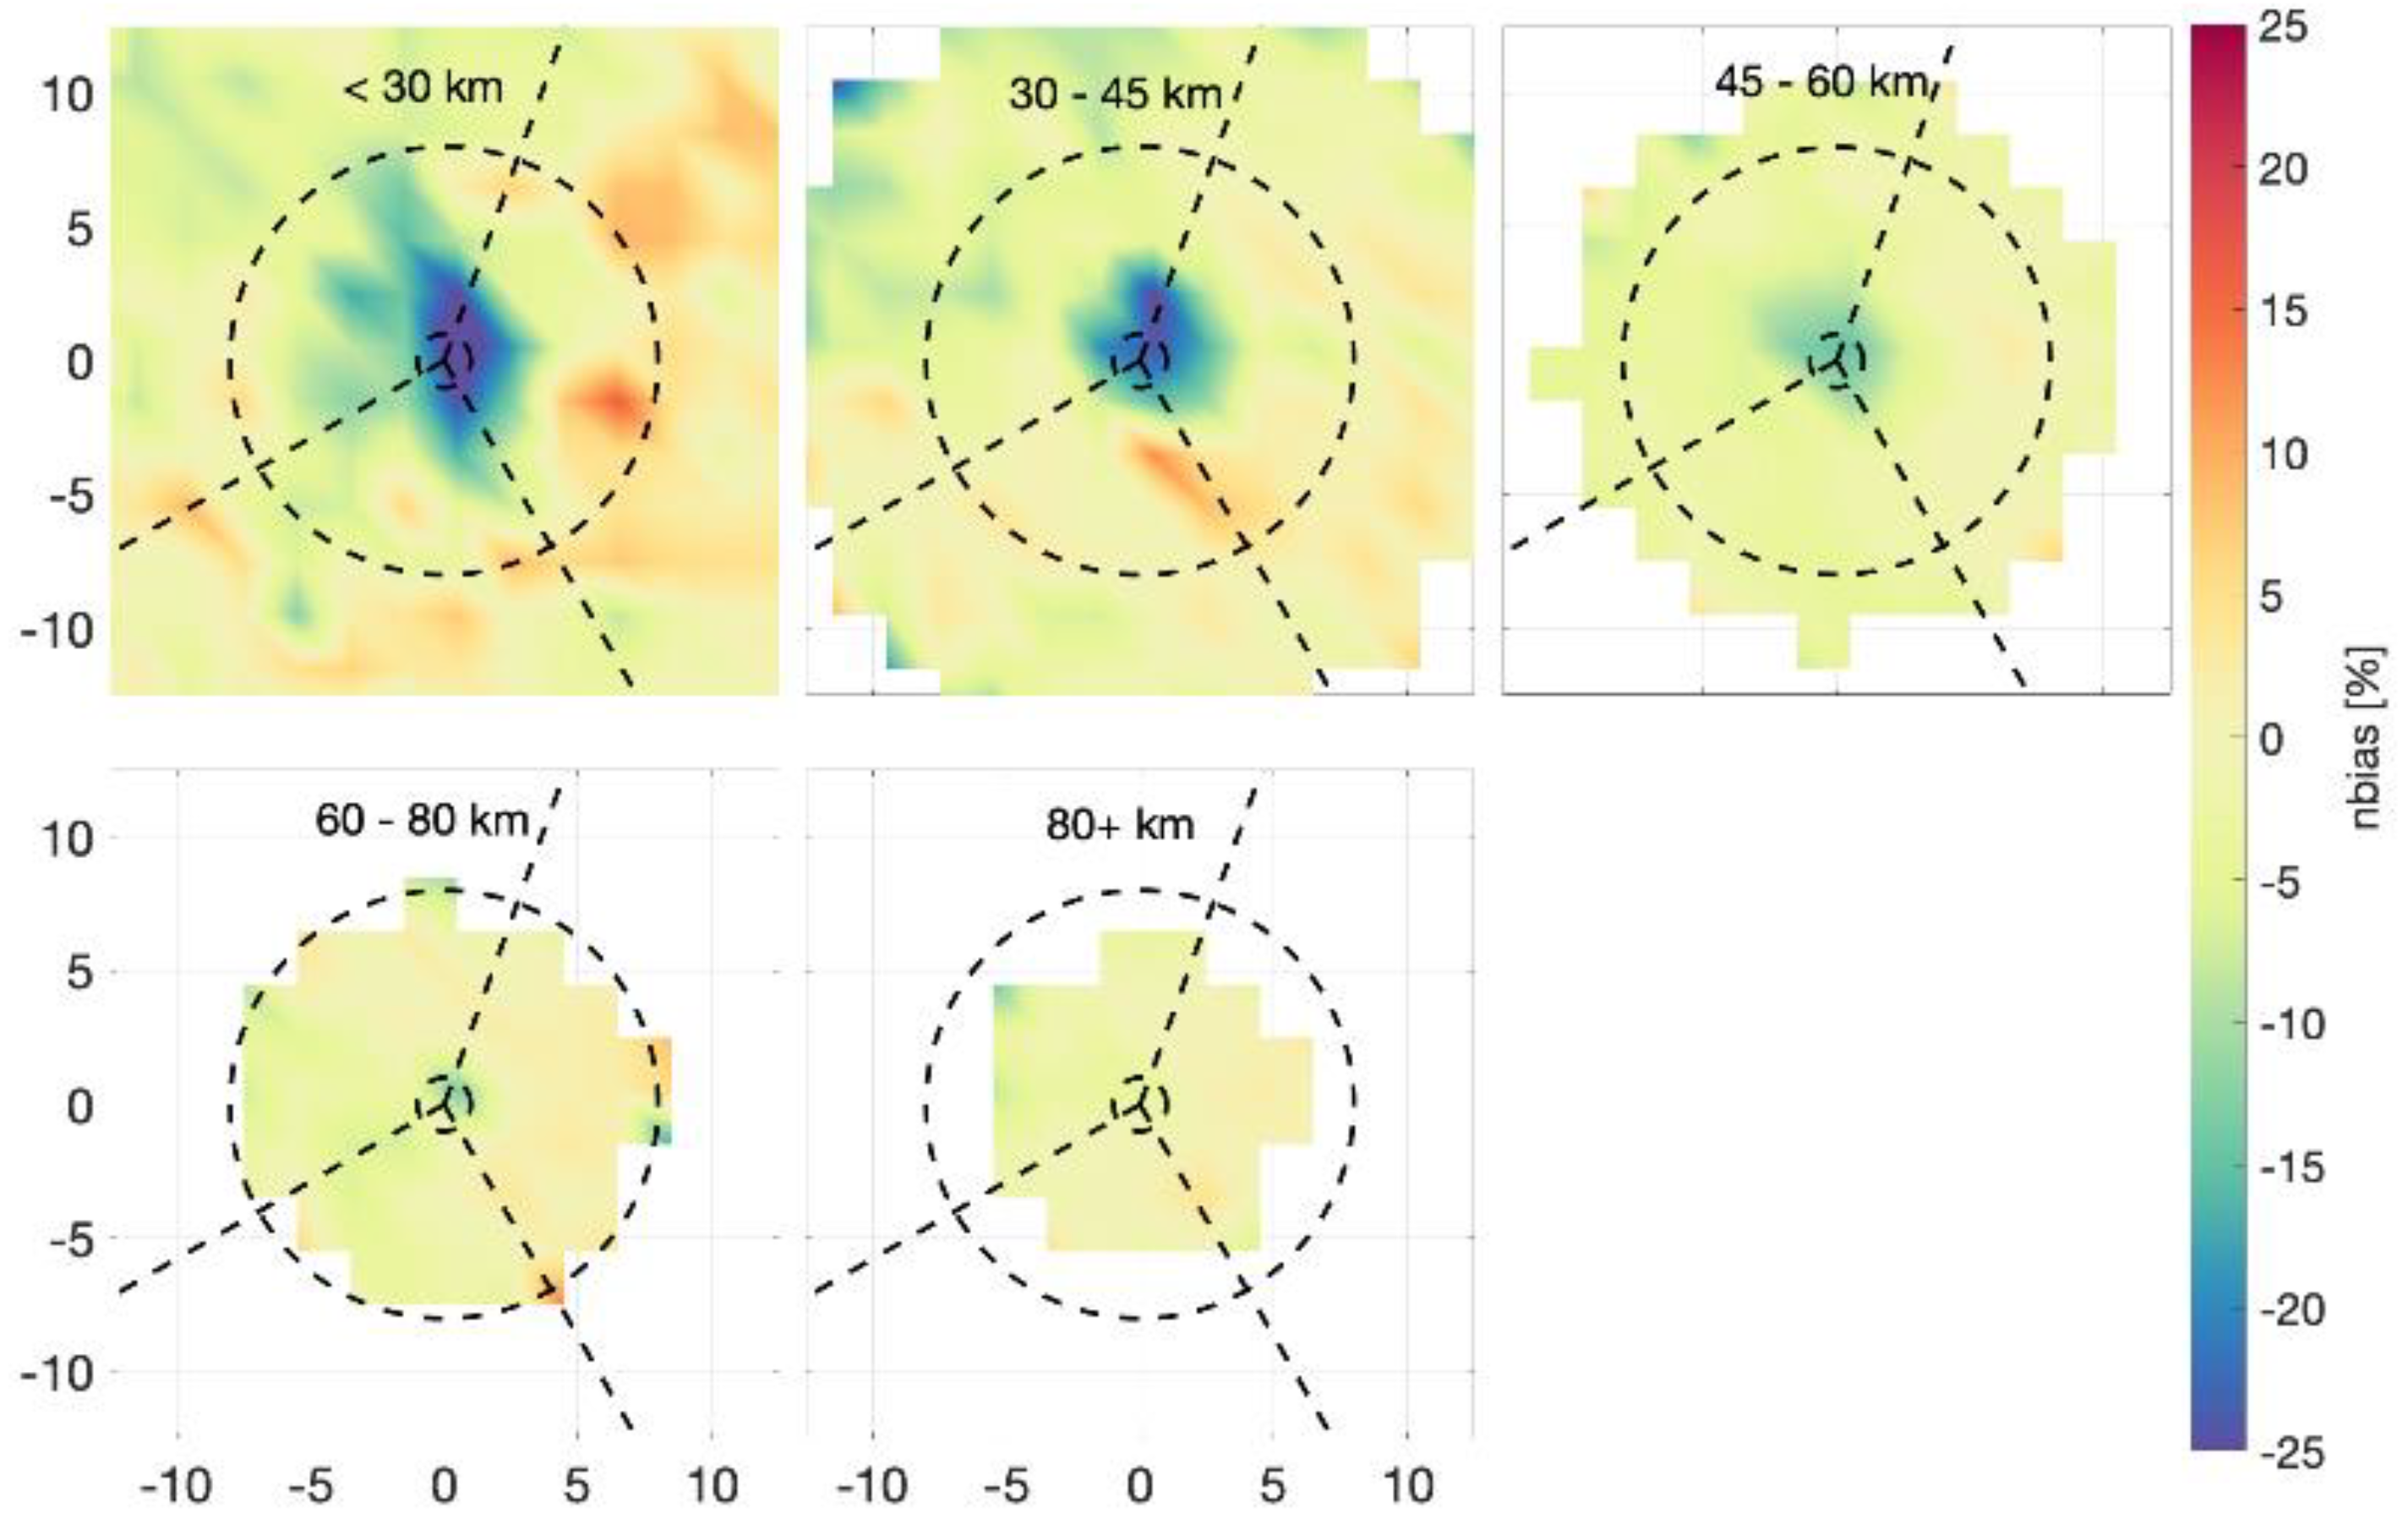
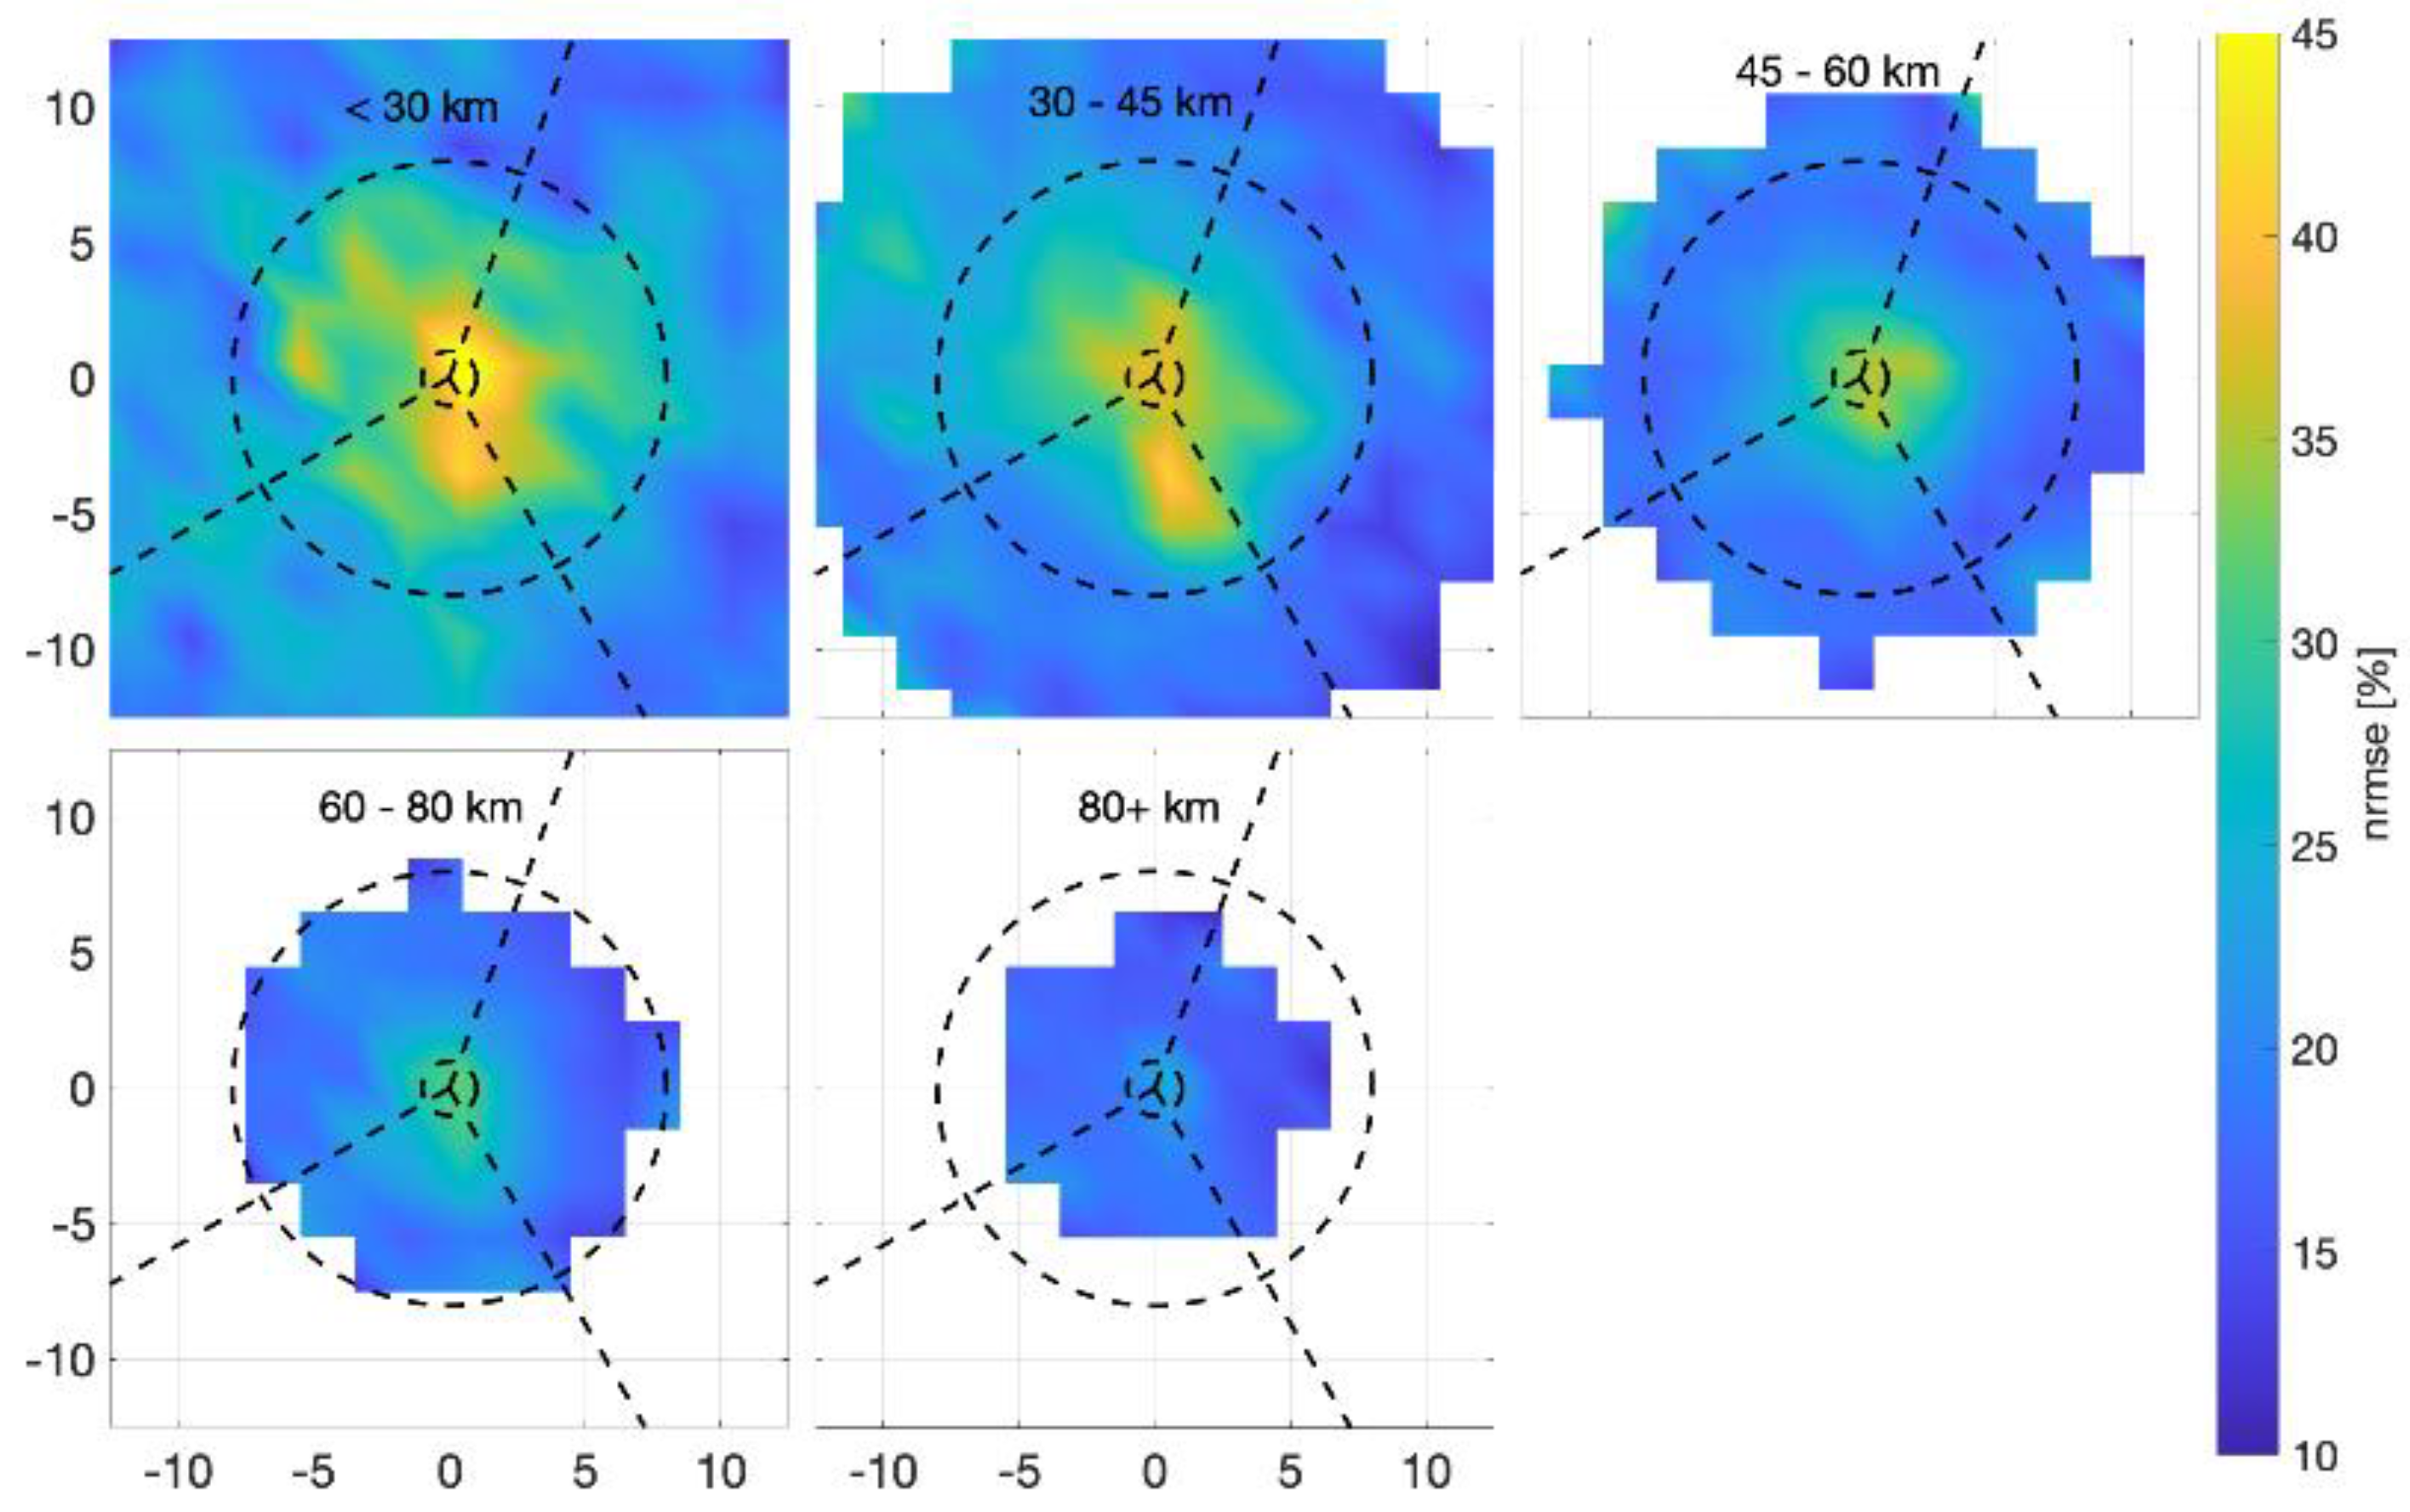
Figure 18.
As in
Figure 14, each subplot parsed by radius of maximum winds.
Figure 18.
As in
Figure 14, each subplot parsed by radius of maximum winds.
Figure 17 and
Figure 18 are referenced in Section 3.3.4, TC Radius of Maximum Winds. The correct text now states:
For the smallest storms, rmw ≤ 30 km, there is severe underestimation (~30%) around the eye in all sectors. There is marked negative bias in the left sector, and positive bias in the right sector outside closer to R = 8. Outside R = 8, overestimation emerges in the right and back sectors. For rmw = 35–45 km, there is underestimation (25%) around the eye in all sectors R < 2. This transitions to overestimation in the right and back sectors. The underestimation around the eye is reduced to (~15%) for rmw = 45–65 km, positive bias is also reduced.
The percentages were updated in the last paragraph:
Figure 18 shows nrmse for various rmw bins. For the smallest storms, rmw ≤ 30 km, there is very high nrmse (~50%) around the eye and high levels everywhere within R = 8. For the next rmw bin, rmw = 30–45 km, nrmse is milder (40%) and more confined.
In the second paragraph of Section 4, we added this sentence to the end in reference to the correct
Figure 4:
We observe that the peak wave heights shift from ahead of the storm to behind the storm as the storm translation speed exceeds the wave group velocity.
In Section 4, addressing the new Appendix, we changed “To facilitate analysis, we had to consider QC-2 data. We address this choice in the methods and Appendix A” to:
We chose to present results based on RY19 QC-2 data. Similar results were achieved with either the RY19 QC-1 or ESA data Appendix A.
In Section 4, we added “…in the storm location.” to increase the specificity of the first sentence in paragraph 4.
In Section 4, the text around paragraph 5 was revised for clarity, it now reads:
Multiple approaches are needed for evaluating and improving models. Satellite altimeters and stationary buoy networks provide complementary perspectives, and both are useful for understanding where and when models err simulating TC waves, respectively. For any individual storm, altimeter observations are sparse, so its utility for evaluating performance for any single storm is limited (e.g., [53]). However, the power of altimeter data is the ability to derive a model performance climatology. In this respect, altimeter data are complementary to data collected by coastal wave buoys (e.g., Rogowski et al., this issue). Buoy data are concentrated along the coastal areas (where the altimeter data tends to deteriorate), buoys provide detailed spectral and directional-spectral data (where altimeters only give significant wave height), and buoys report data from a single point on Earth over the life cycle of a storm. In a TC-centered frame of reference, buoy data is a transect (over the course of many hours) that reflects the evolution of the storm (i.e., the arrival of forerunners, etc.), where an altimeter pass is a purely spatial transect, practically instantaneous on the scale of storm development.
The spatial pattern of error presented here was derived from a composite of many storms, as such, we do not expect this pattern to hold for every storm examined. Indeed, Rogowski et al. (this issue) show that while there is a trend towards underestimation of peak Hs values, bias patterns vary from storm to storm. Because of the snapshot-like data, altimeters cannot address the time dimension implicit in the “missing the peaks” conundrum, but our main result is complimentary: that the highest waves around a TC (around the eye region) tend to be systematically underestimated. Furthermore, the higher the significant wave height, the more the model tends to underestimate; note this issue is not unique to TCs, e.g.,
Figure 16 of [54].
In Section 4, we add the following sentence to the paragraph starting with “Figure 8b”:
The systematic increase in bias with storm speed is an unsolved puzzle.
In Section 5, we reference the incorrect error pattern in
Figure 12, the correct text now reads:
A climatological pattern of error is revealed in the TC centered frame of reference: the underestimation in the left sector and overestimation in the right sector. The notable exceptions were an area of slight overestimation directly ahead of the storm (in the left sector) and near the eye where highest wave heights were consistently underestimated regardless of sector. Our results show that the pattern is robust across most values of storm attributes. It appears to weaken and strengthen with storm intensity and relative bias appears to systematically increase with increasing translational velocity. However, the pattern does not hold for the fastest translating TCs, where we find broad and systematic overestimation of wave heights. Small and intense TCs had expanded area of underestimation, more severe underestimation, and more pronounced random error. The general pattern found here is different to that described in [4], who were able to relate these sectors to particular wave spectral types first suggested in CBLAST [27]. However, their results are consistent with the pattern derived for the most intense storms.
In the original publication, Appendix A and
Figure A1 were incorrect. The text and figure were removed and the question of differences among databased was addressed in a new Appendix A which combines the previous Appendix A and Appendix B.
In the original publication, Figure A2 in Appendix B was incorrect. They are replaced correct figure and caption and reproduced below:
Figure A1.
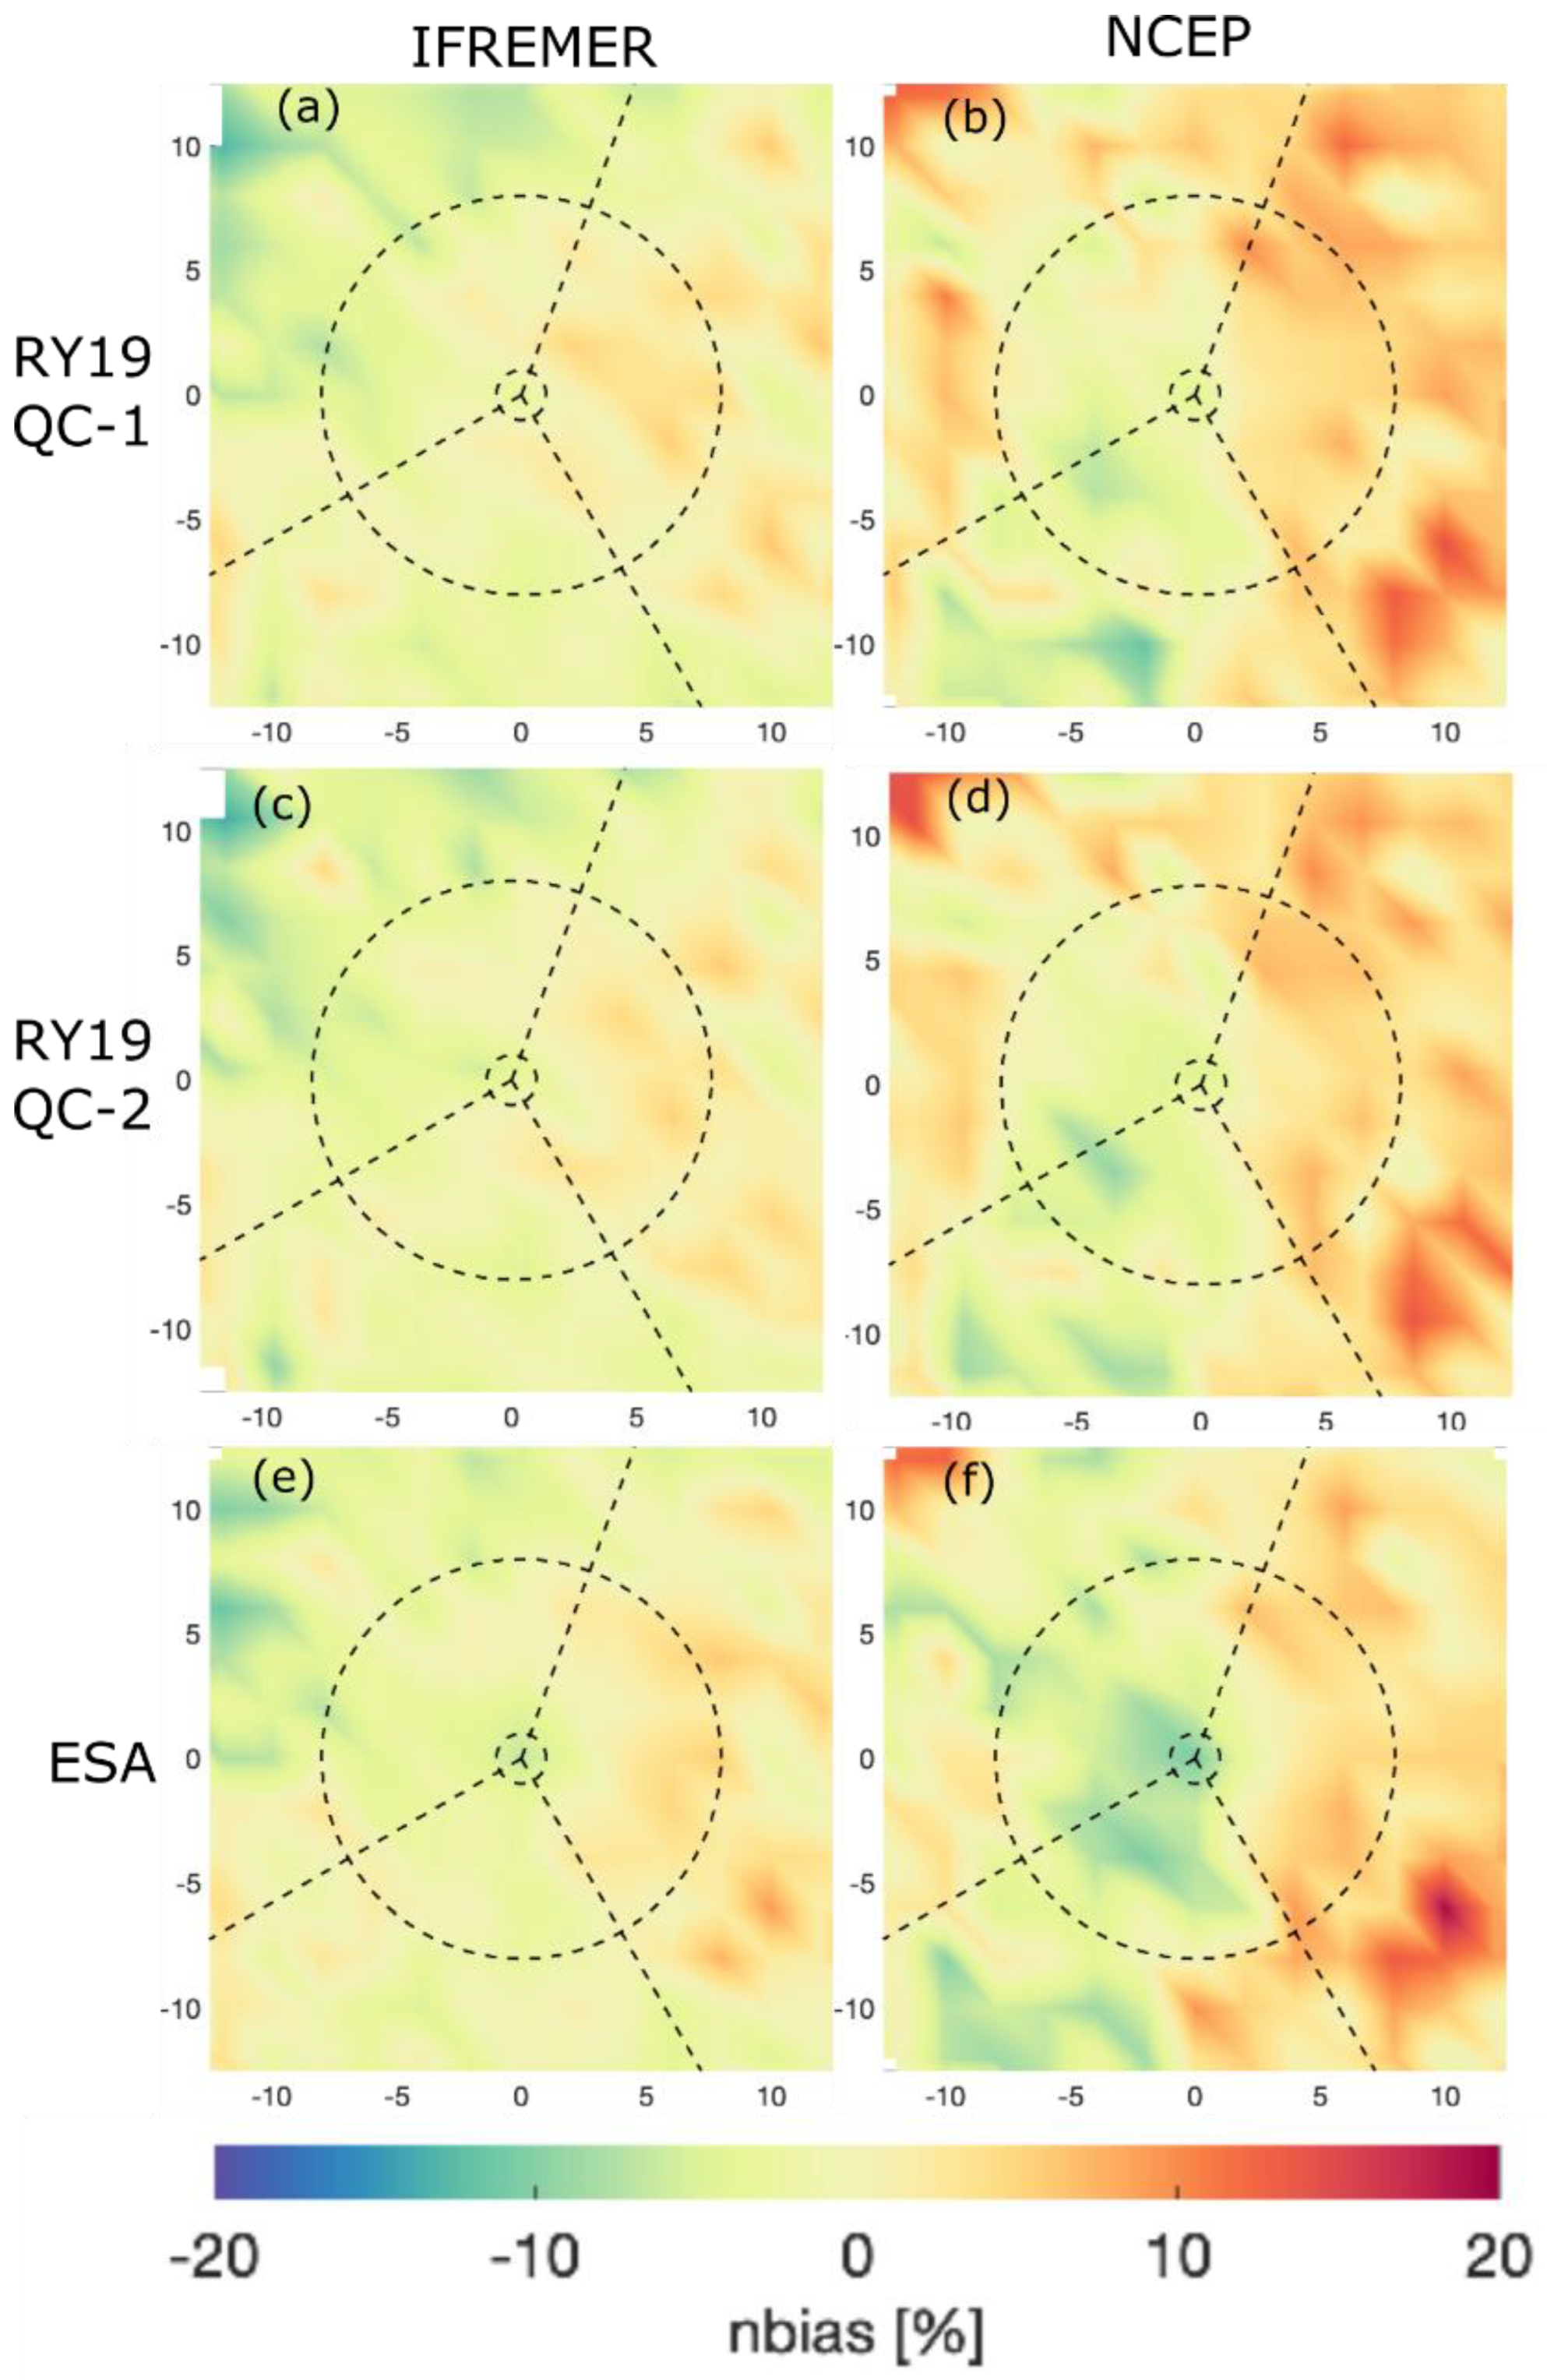
Normalized bias in a TC-centered frame of reference. Left column from Ifremer hindcast. Right column from NCEP hindcast. Top to bottom is RY19 QC-1, RY19 QC-2, and ESA altimeter data.
Figure A1.
Normalized bias in a TC-centered frame of reference. Left column from Ifremer hindcast. Right column from NCEP hindcast. Top to bottom is RY19 QC-1, RY19 QC-2, and ESA altimeter data.
Figure A1 is referenced in Appendix B, which now Appendix A and states:
Although the study focuses on the comparison between the Ifremer global grid andRY19 QC-2 altimeter data, we wanted to show that the pattern of error was robust across models and altimeter data. We tested two different sources of altimeter data and two different quality control levels within one of those datasets: RY19 QC-1 and QC-2 [33] and ESA [34]. For each of these data sources, we evaluated both Ifremer and NCEP hindcasts.
Figure A1 shows the relative bias in a TC-centered reference frame in 2R × 2R bins.
Across data sources, the pattern of error is consistent. There is also good correspondence between the patterns observed in Ifremer and NCEP, although the bias values are higher for NCEP, particularly overestimation in the right sector. Patterns from WIS (not shown) are consistent across databases but are not consistent with those of Ifremer and NCEP.
The authors apologize for any inconvenience caused and state that the scientific conclusions are unaffected. The original publication has also been updated.

