Article

A Method for Identifying the Key Performance Shaping Factors to Prevent Human Errors during Oil Tanker Offloading Work

1
School of Safety Engineering, Beijing Institute of Petrochemical Technology, Beijing 102617, China
2
State Key Laboratory of Explosion Science and Technology, Beijing Institute of Technology, Beijing 100081, China
3
School of Engineering, University of Aberdeen, Aberdeen AB24 3UE, UK
*
Author to whom correspondence should be addressed.
J. Mar. Sci. Eng. 2022, 10(5), 688; https://doi.org/10.3390/jmse10050688
Submission received: 29 March 2022 / Revised: 12 May 2022 / Accepted: 17 May 2022 / Published: 18 May 2022
(This article belongs to the Special Issue Risk Assessment and Traffic Behaviour Evaluation of Ships)

Abstract

:
Oil tanker offloading is a human-related and high-risk task. A small operational error may trigger catastrophic accidents such as fire and explosion. It is recognised that more than 70% of industrial accidents are blamed for human errors, so preventing them is crucial. As human error is associated with a variety of Performance Shaping Factors (PSFs), it is meaningful to identify key PSFs for safe operations during oil tanker offloading process. However, some issues are obstacles to finding the crucial PSFs. The recording data of most PSFs are always incomplete and imperfect. Moreover, the standard for ranking PSFs should be rational. In addition, the performance of each PSF at the different stages is oil offloading is usually unstable and may change with time. As a result, this study aims to conduct a method that mainly relies on Grey Relational Analysis (GRA), the definition of “Risk” (combination of likelihood and impact), and Hierarchical Task Analysis (HTA) to find several significant PSFs to prevent human errors. GRA deals with the incomplete and imperfect data; the definition of “Risk” provides a rational basis for ranking PSFs; and HTA gives support for considering the PSFs’ changes at different stages of a task. The proposed approach is tested on a real engineering case of oil tanker offloading work at offshore terminal. The result indicates that the method can be applied to identify key PSFs, which in turn provides recommendations for human error prevention to ensure the safety both on board and at terminal.

1. Introduction

Human error is a considerable challenge to safety in an oil tanker offloading process. Many published reports and academic articles have concluded that over 70% of accidents are closely associated with human errors in the marine industries and the oil and gas industries [1,2,3,4]. Therefore, preventing human error is important to ensure safety during oil tanker offloading work.
It is acknowledged that human error is associated with many Performance Shaping Factors (PSFs) [5,6], and many publications have indicated different PSFs have different weights on a human error, so finding key PSFs and control them can help to avoid human error strategically [7,8]. However, the way for effectively identifying key PSFs is still a challenge.
Thus far, many techniques have been designed to evaluate the different weights of different PSFs. Among them, the Analytic Hierarchy Process (AHP) and Analytic Network Process (ANP) are two typical methods [9,10]. Both AHP and ANP have the function to estimate the importance weights of PSFs for determining the key one during operating a task [11]. AHP is suitable if all selected PSFs are mutually exclusive, and ANP is otherwise applied [12]. These techniques have been applied widely to assess and rank the significance weight degrees of PSFs. AHP has been selected to recognise the important PSFs for human error in marine-related operations for the oil and gas industries [13,14,15]; ANP has also been used to determine the weight value of each PSF for human error to ensure safety [6,10,
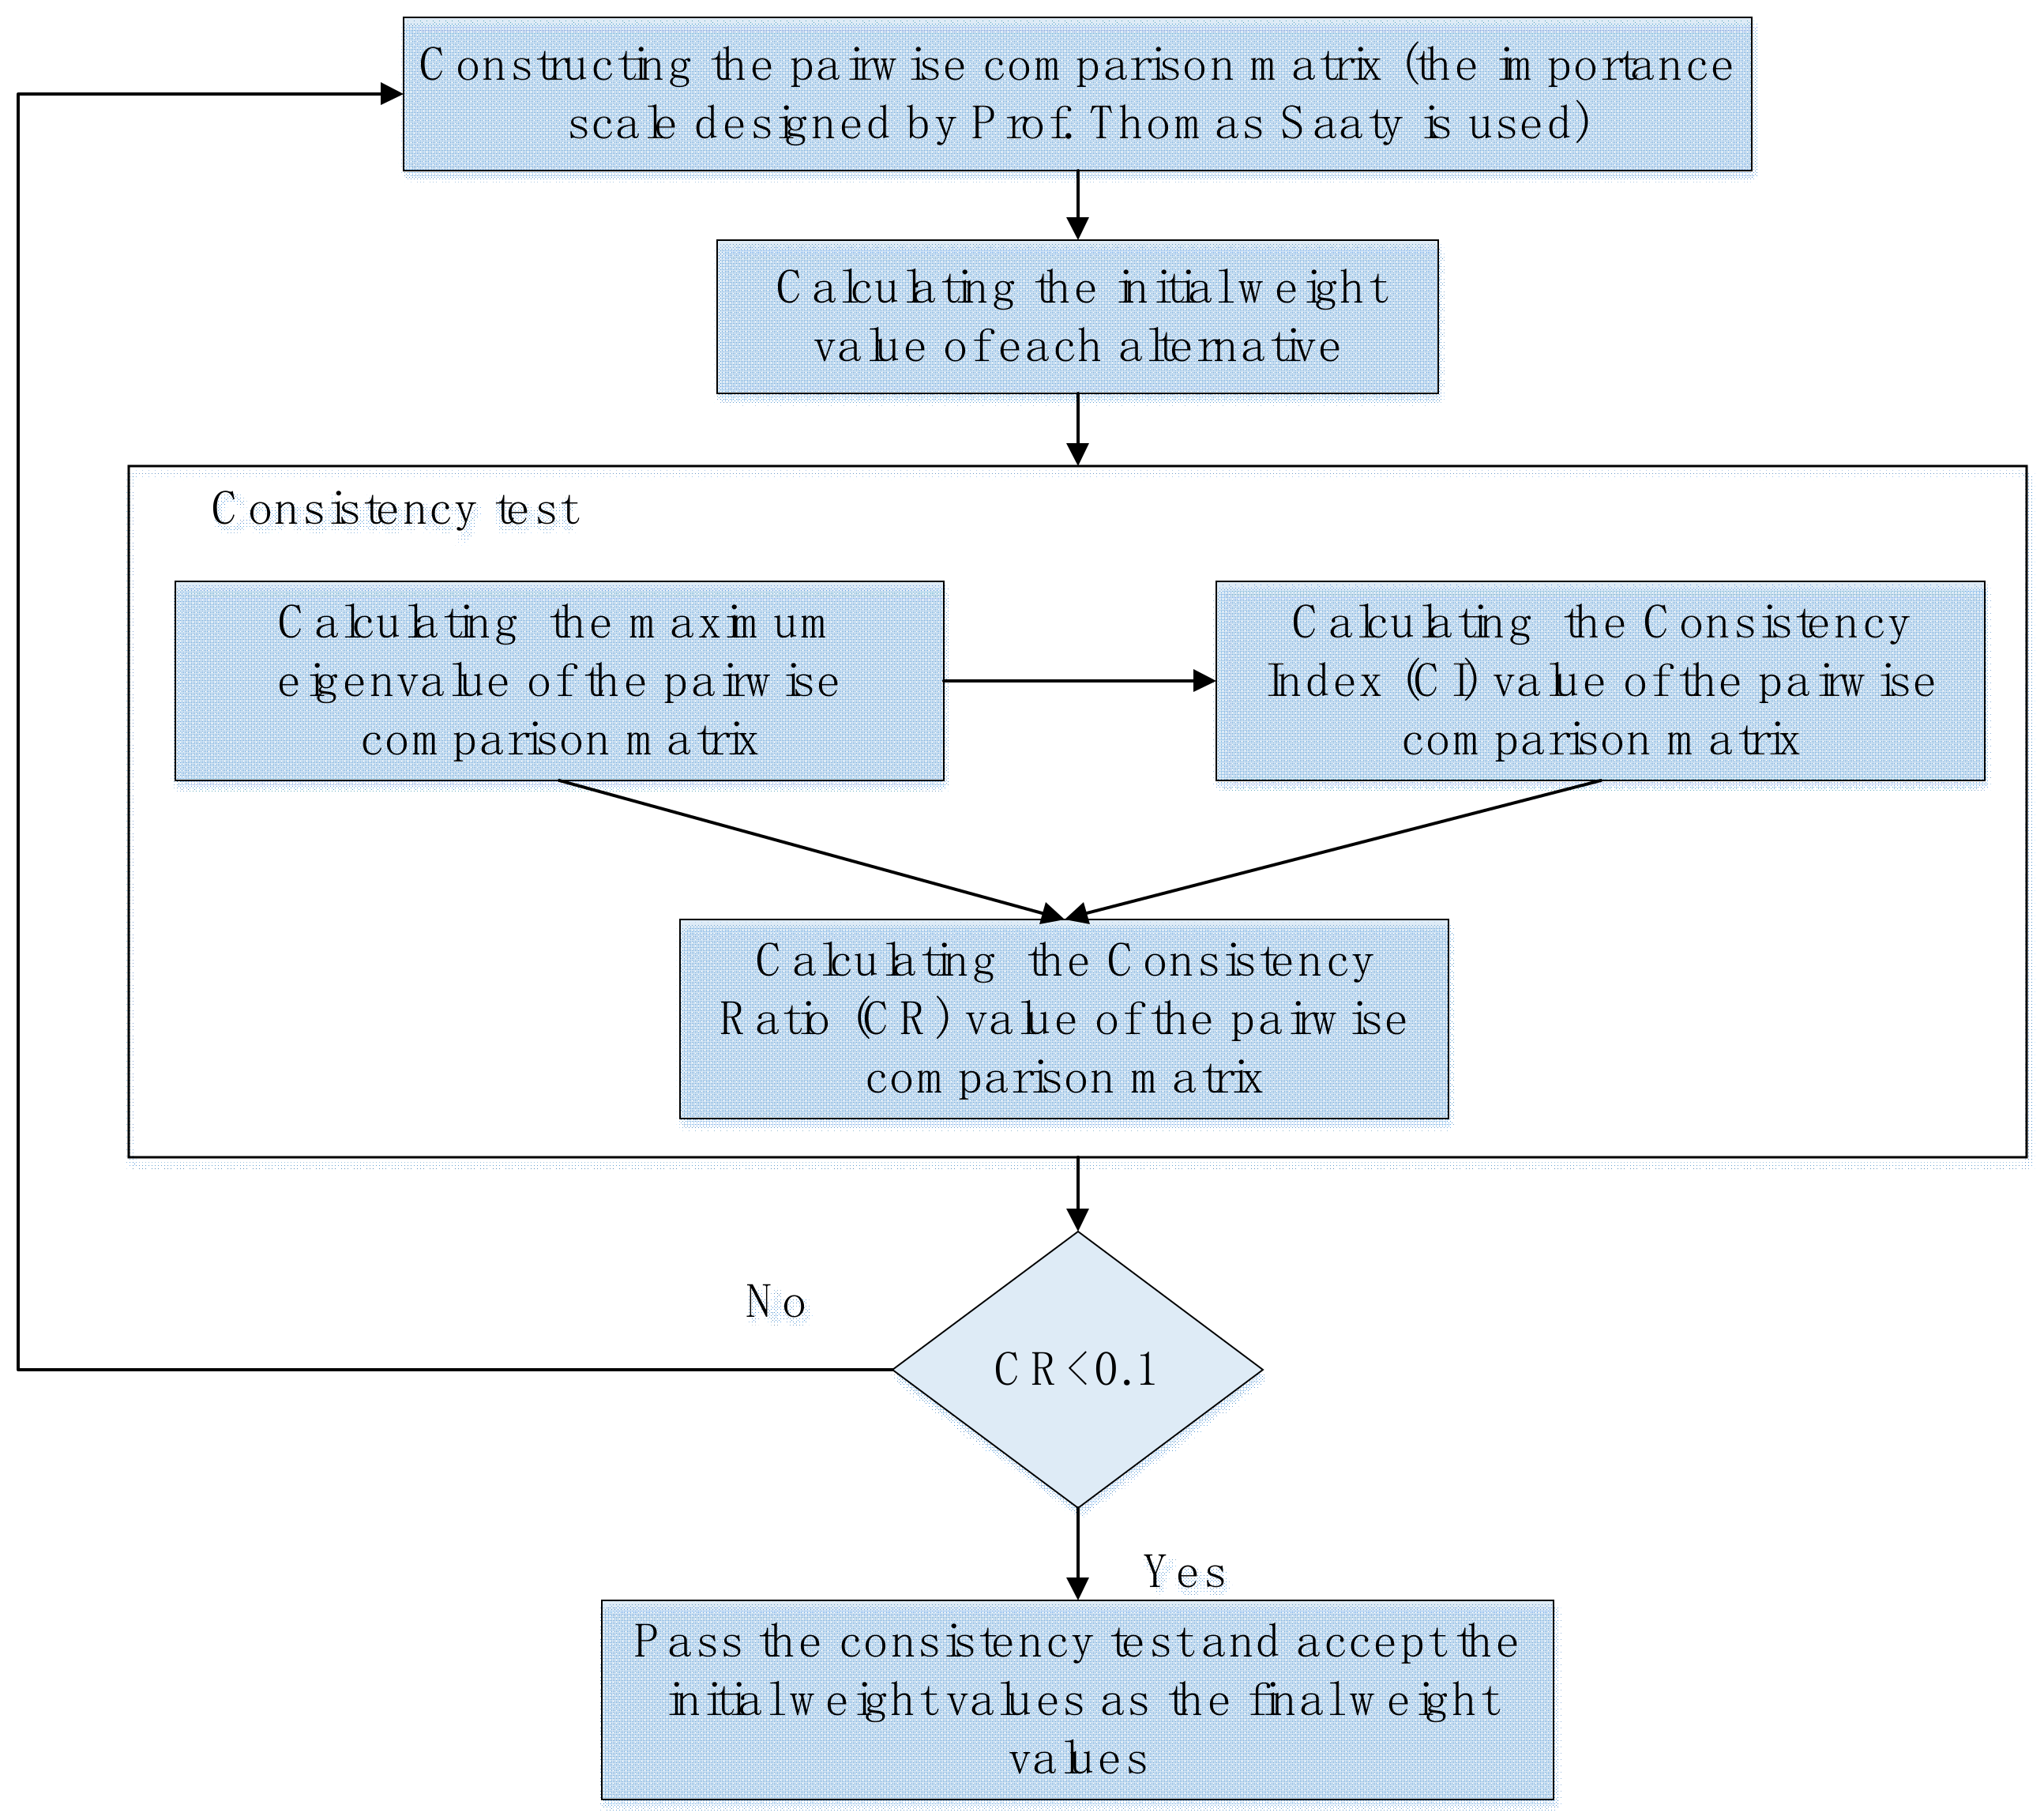
16]. However, AHP and ANP may not a perfect choice. Both AHP and ANP have insufficient considerations about dynamic scenarios in a task, because they mostly treat a task as a static whole. The second limitation is consistency tests are required for AHP and ANP. When there are too many PSFs, large efforts are needed to ensure the constructed pairwise comparison matrix can pass the consistency test. The third limitation is that the historical data of PSFs are always limited and imperfect.
In 2017, a risk-based approach was published to rank key PSFs for the operations in the main control room of nuclear power plants [17]. It provides a well-designed procedure that can assess plenty of PSFs. The definition of “Risk” is used as the standard to identify key PSFs, which makes each PSF can be evaluated reasonably from different dimensions (likelihood and impact) [17]. However, the approach is still not strong enough to provide a robust PSF ranking. As PSF data recording is insufficient, research has used questionnaires for collecting risk data, and the mean value of the collected data for each PSF is used to describe each PSF. However, only using a simple mean value to describe a PSF may not reflect the true performance, since the mean value can be dominated by unreasonable maximum data or minimum data. Another significant issue is that research also gives limited consideration to the dynamic scenarios of a task, but a task is always a dynamic process [18,19]. Therefore, to rely only on this approach is not comprehensive enough, but it is beneficial to judge PSFs by the definition of “Risk”, which can make a rational identification and ranking.
According to the above description, it can be found that the poor recording of PSF data, and the limited consideration on dynamic scenarios in a task are two main challenges to effectively identify key PSFs for human error prevention. In addition, when there are plenty of PSFs involved, the efforts used for finding the key PSFs may large. Therefore, this study will focus on dealing with the poor quality of PSFs’ data recording and to consider the dynamic scenarios in the oil tanker offloading task in a rational way.
As the recording of PSF’s data is always incomplete and imperfect, grey theory should be an option for our research. Proposed by Deng, this theory is specifically designed for a system with incomplete and imperfect information [20], and many grey theory-based methods have been developed [
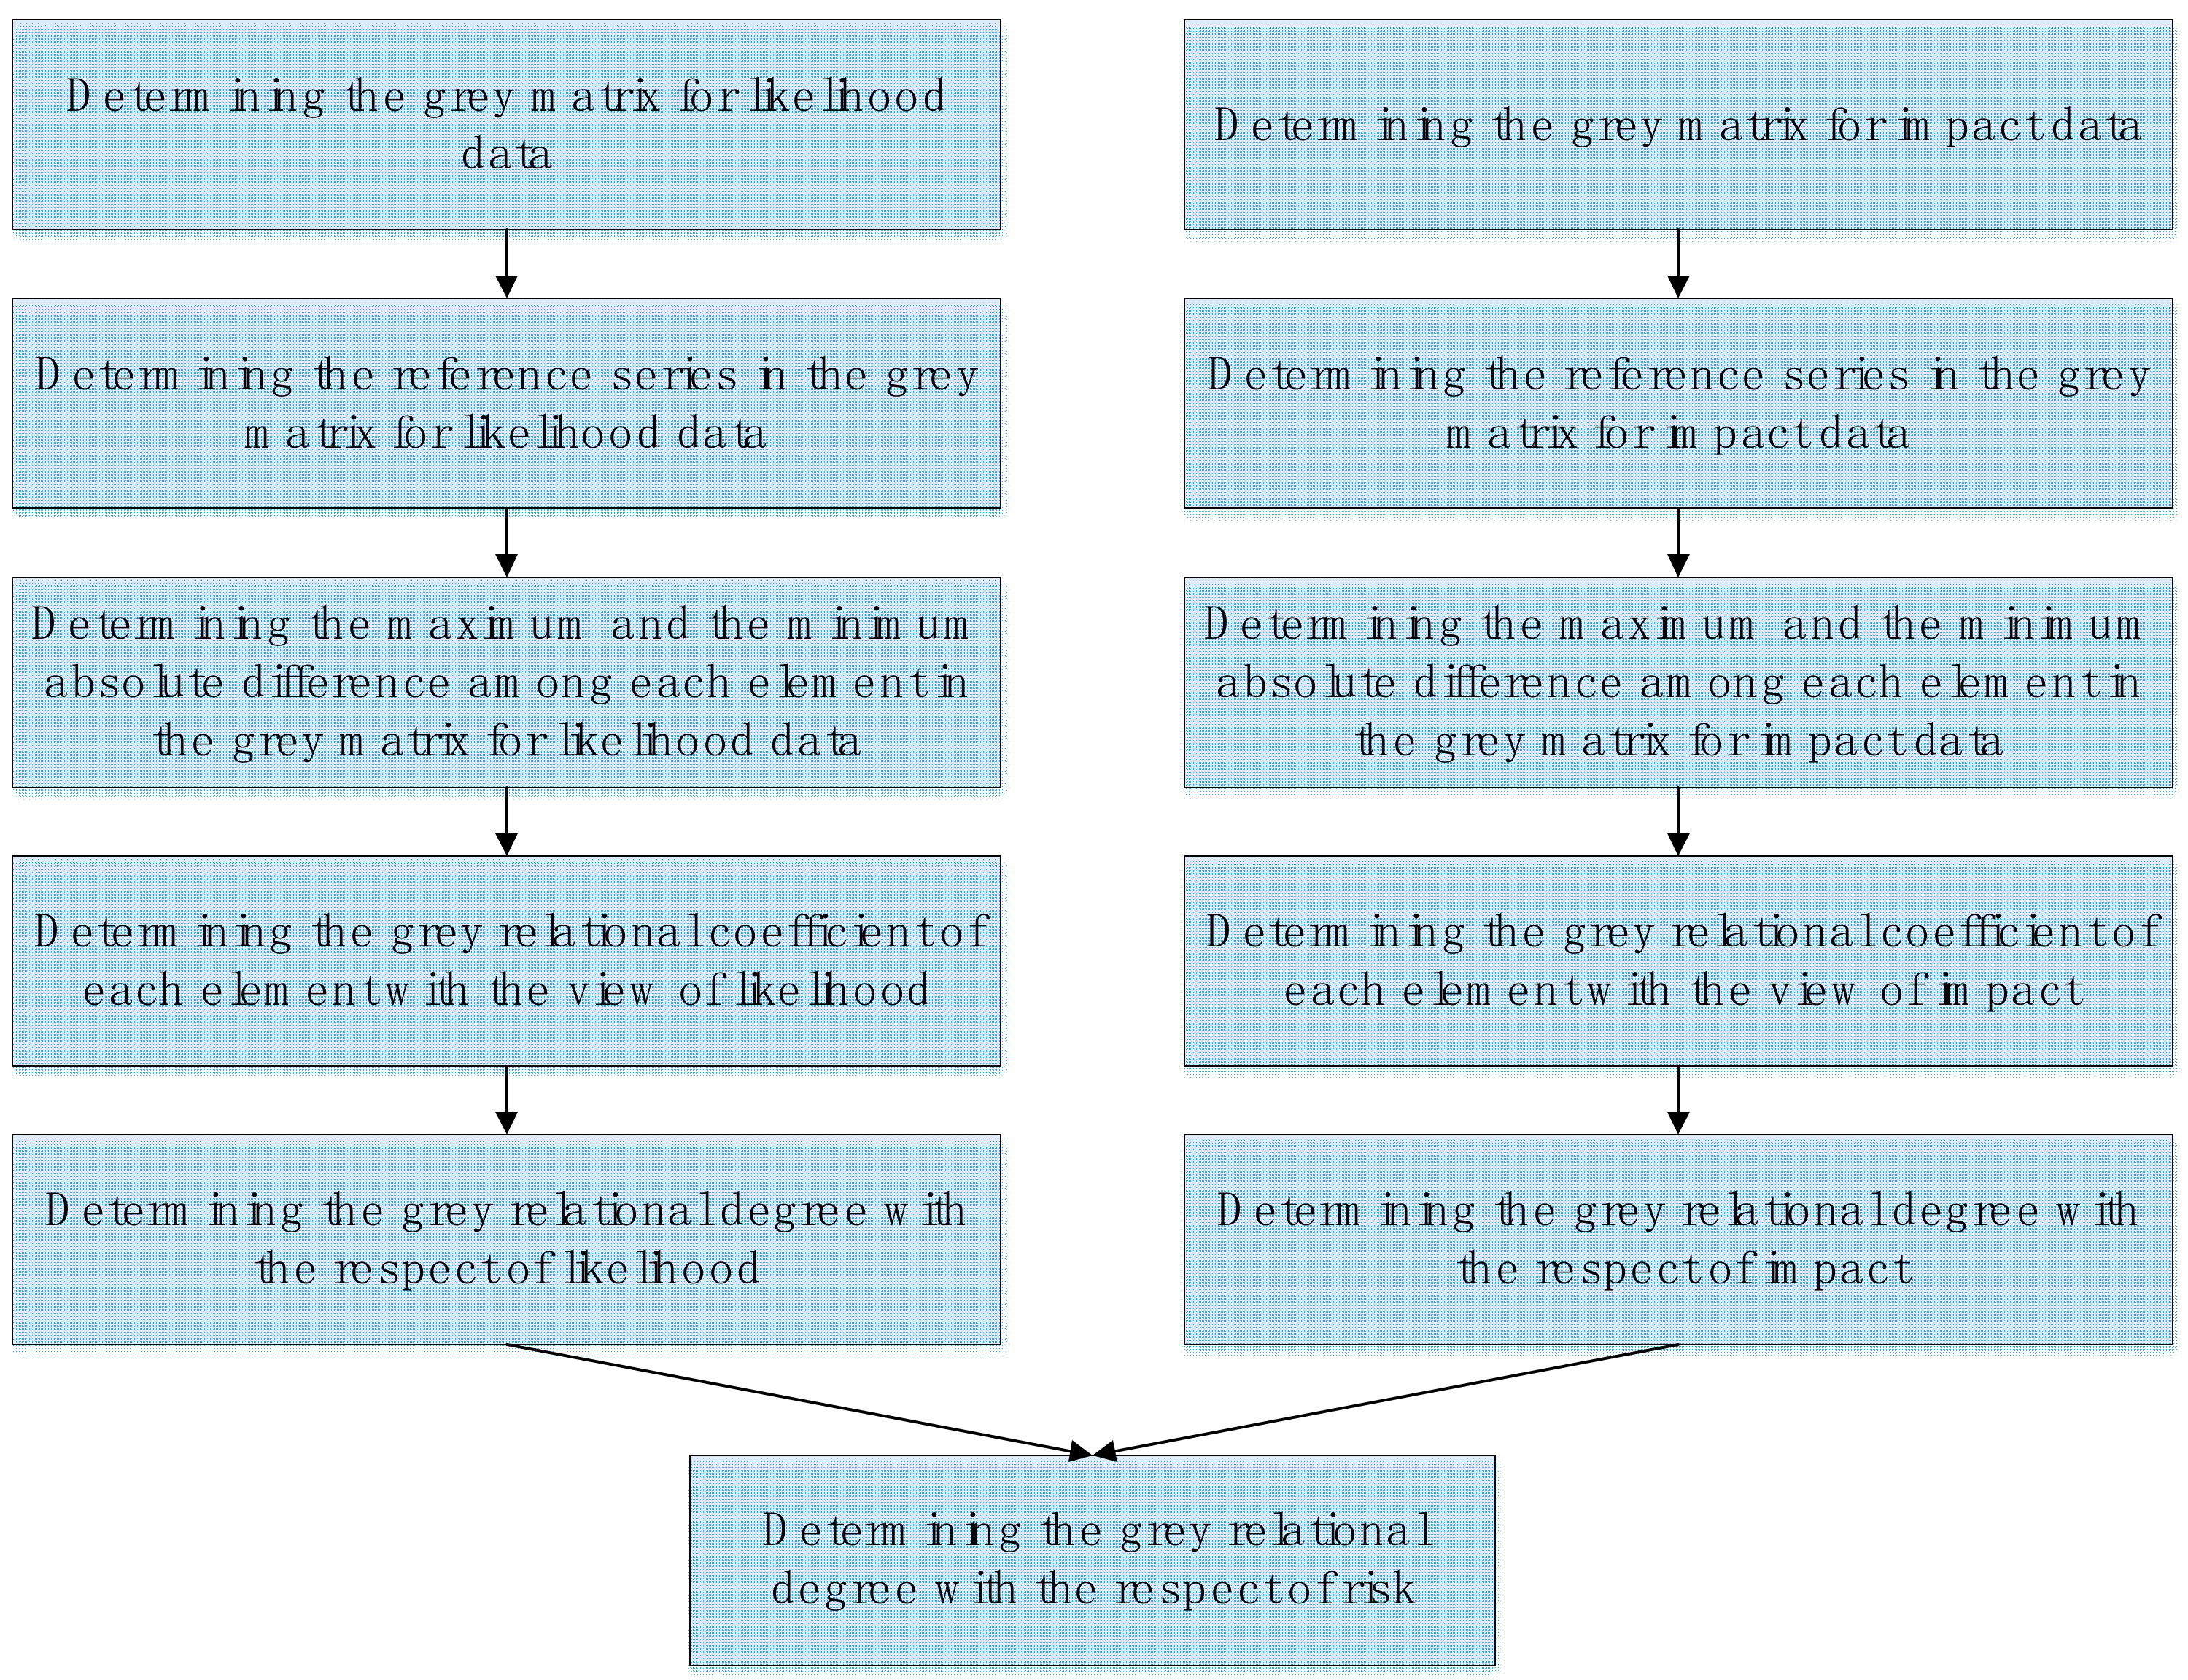
21]. Among them, Grey Relational Analysis (GRA) is a typical one which has been applied to identify safety- and risk-related key factors [22]. This method is based on the similarity of geometric shape formed by all grey data of each contributing factor, so the influence from each datapoint can be easily included without extra efforts, such as through a consistency test. Thus far, GRA has been combined with Failure Mode and Effects Analysis (FMEA) to find the important failure modes among plenty of failure modes of tanker equipment, medical devices, and steam turbine system in power plants from the aspects of occurrence, severity, and detection [23,24,25,26,27]. Moreover, GRA has also been used to identify the key factors that can impact the safety decisions while manoeuvring an autonomous ship [28]. In addition, many data analysis techniques, such as fuzzy logic and Dempster–Shafer theory, have been integrated with GRA [23,24,29,
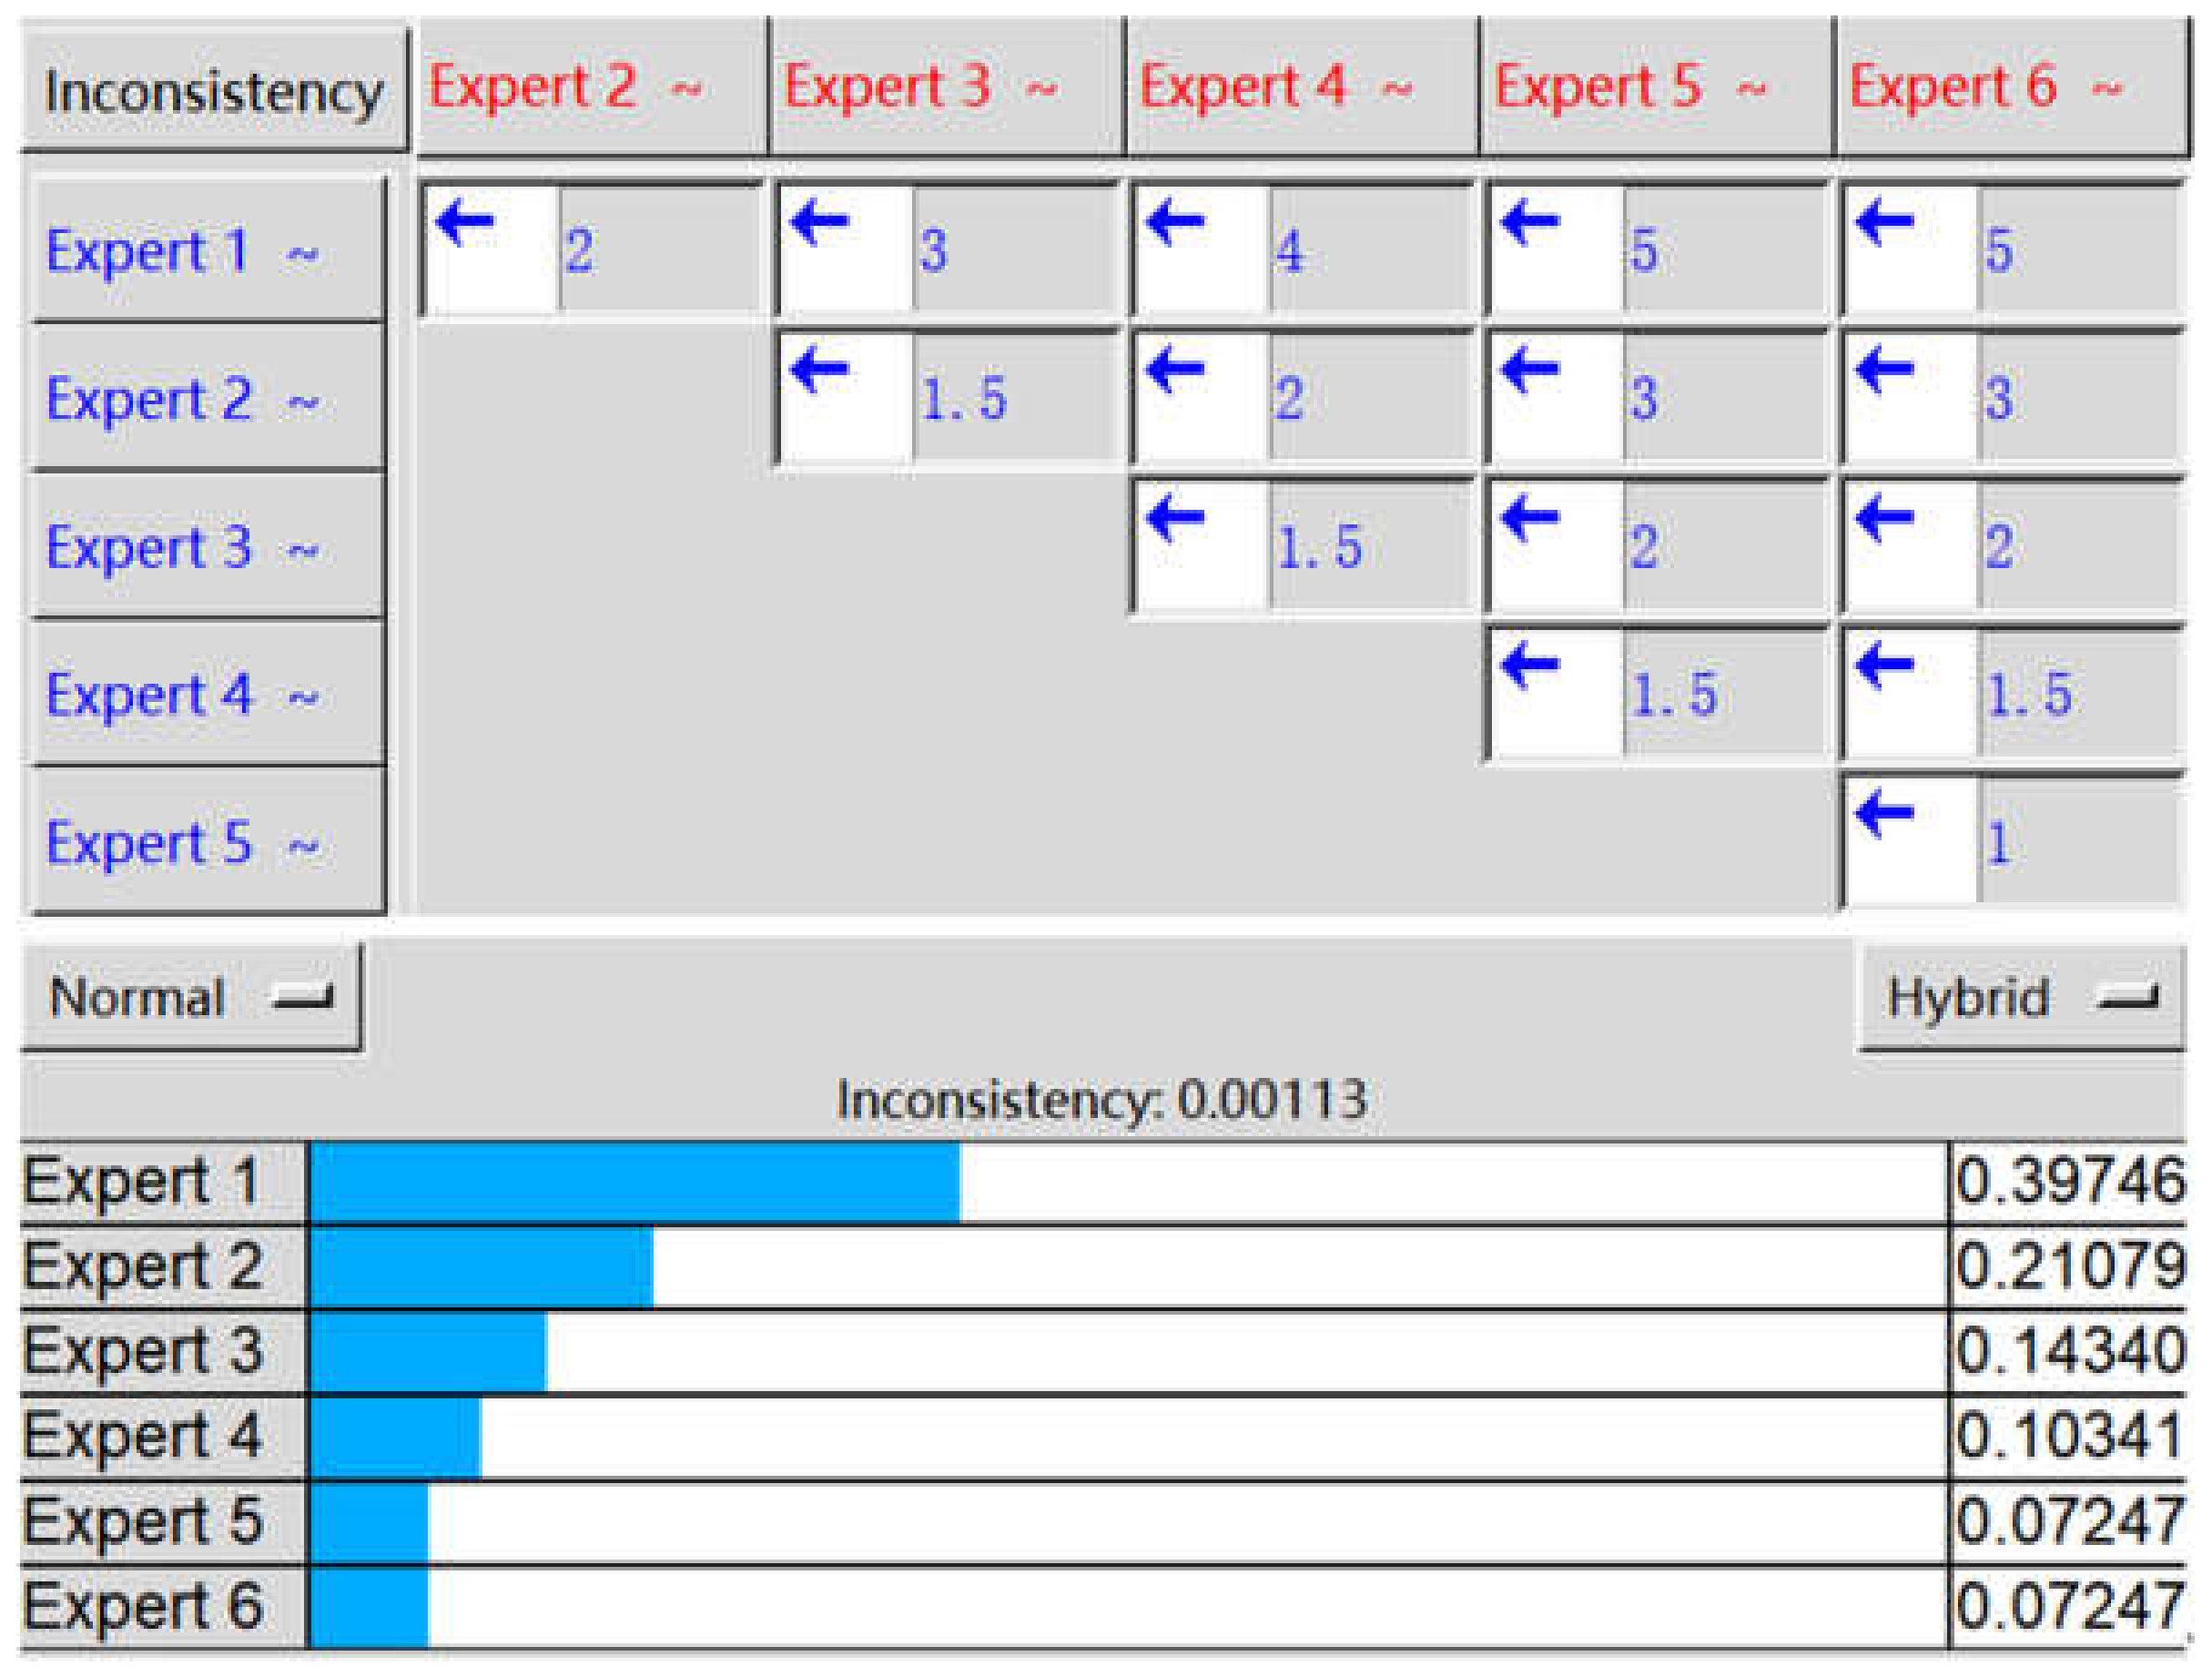
30]. Learning from the combination of GRA with FMEA and concerning this study, we can combine GRA with the definition of “Risk” to perform a grey and risk-based method for rationally finding key PSFs to prevent human errors. Six experienced domain experts are invited for collecting risk-based grey data to support the GRA practice. In order to consider the impacts caused by the differences among the six experts, AHP is used to determine their importance weights. It should be noted that we have enough information about each expert for applying AHP.
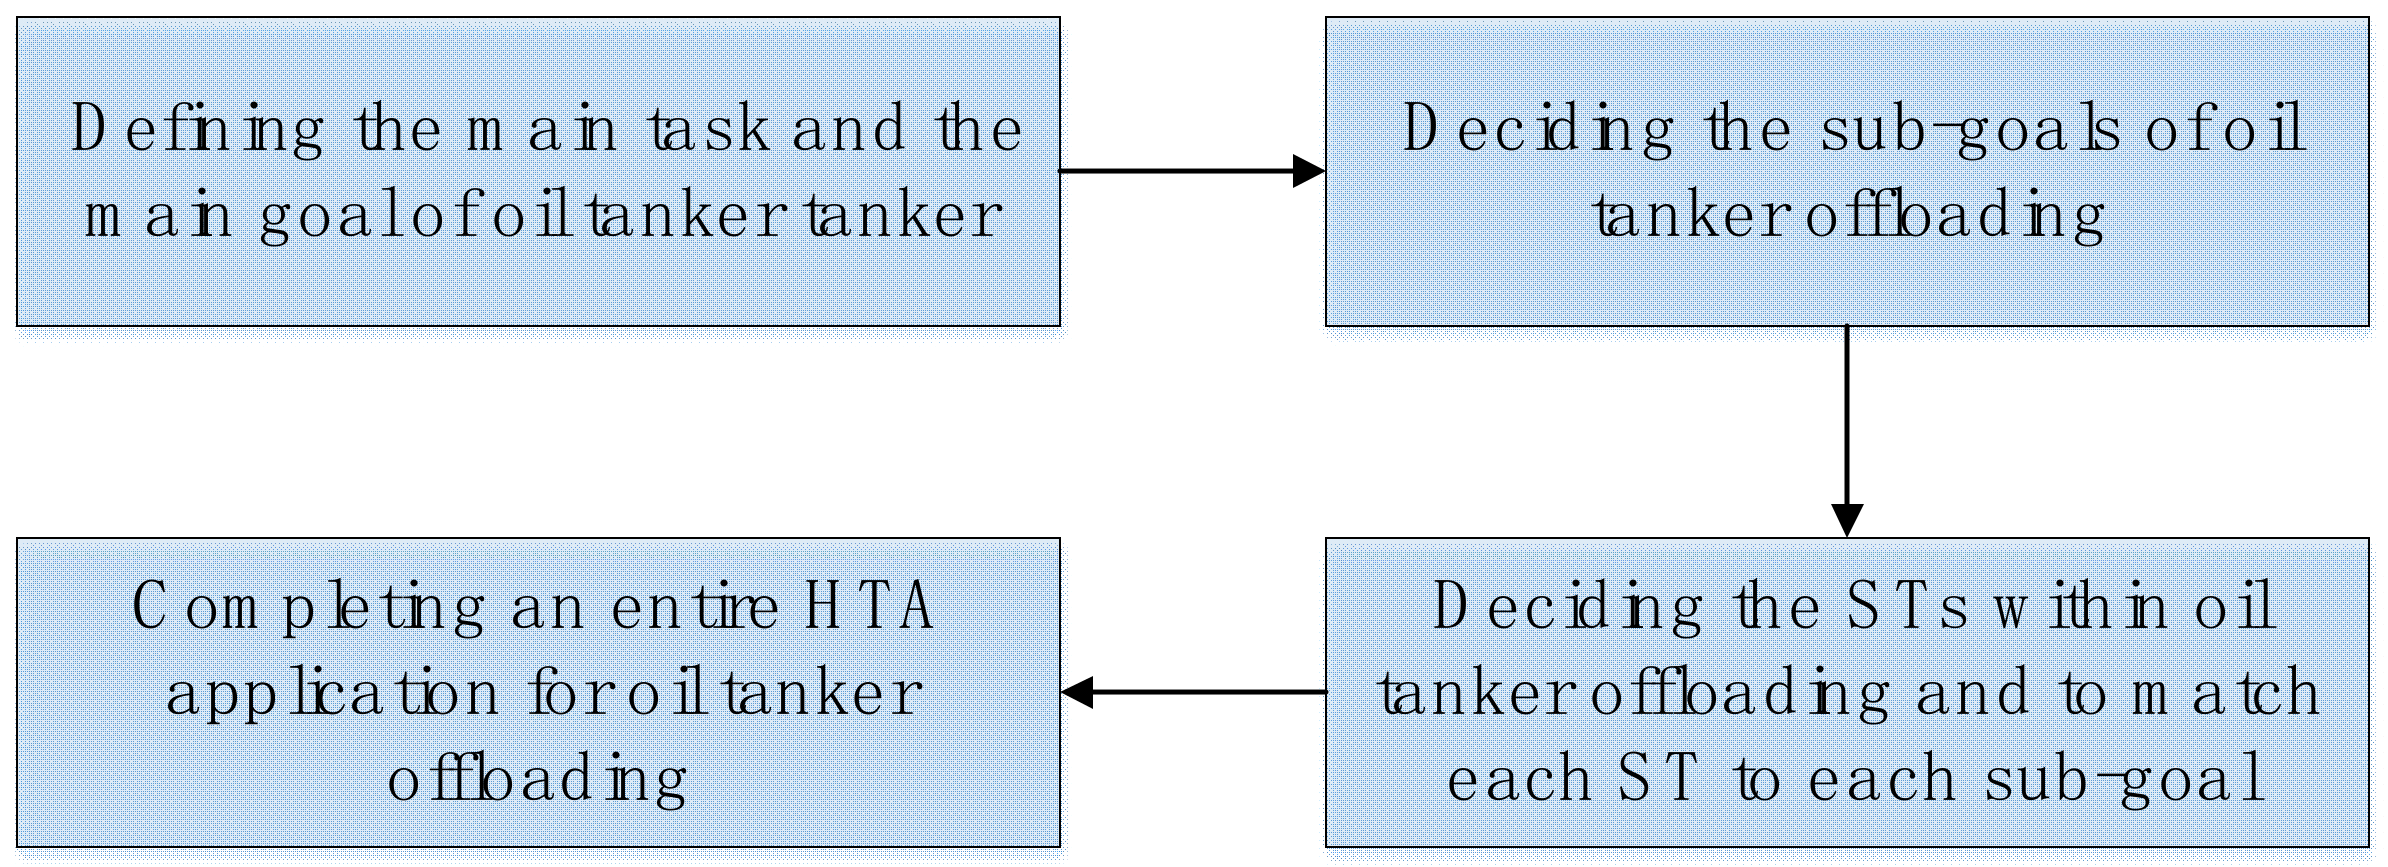
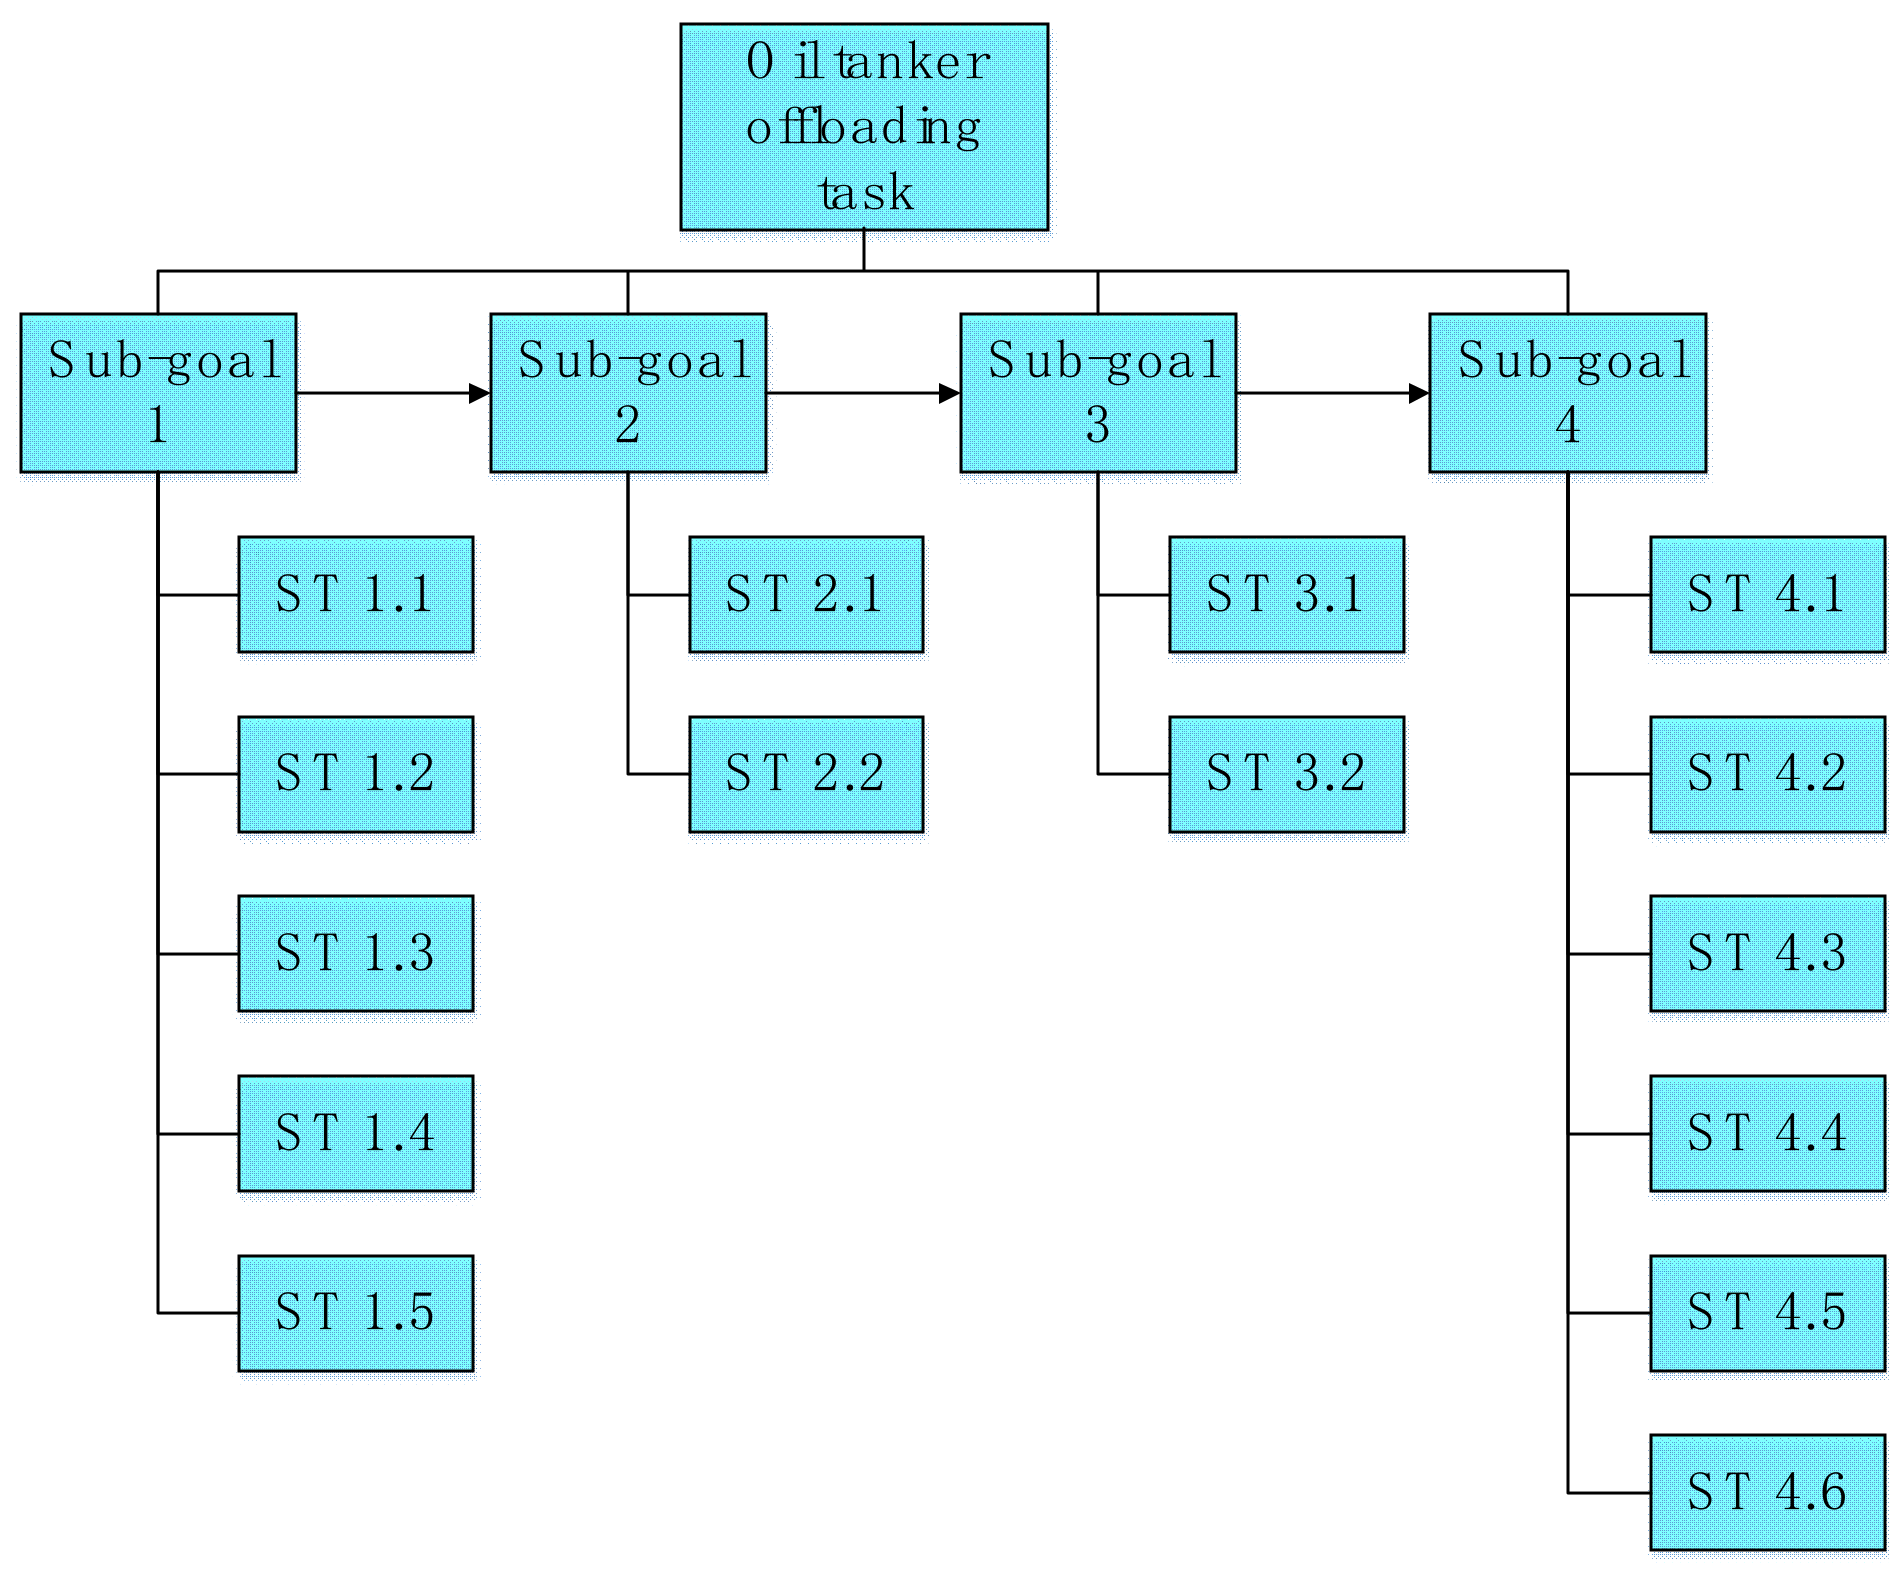
As studies have indicated that a task is always performed dynamically in its different stages, the different performance of each PSF at different stages of a task must be considered. To obtain an effective result that can truly reflect the oil tanker offloading work, HTA should be adopted. It can effectively decompose a task into several Sub-tasks (STs) [31]. In this study, each PSF is considered and assessed in each ST, and with HTA, the changes of each PSF in the task operation process can be analysed for human error prevention.
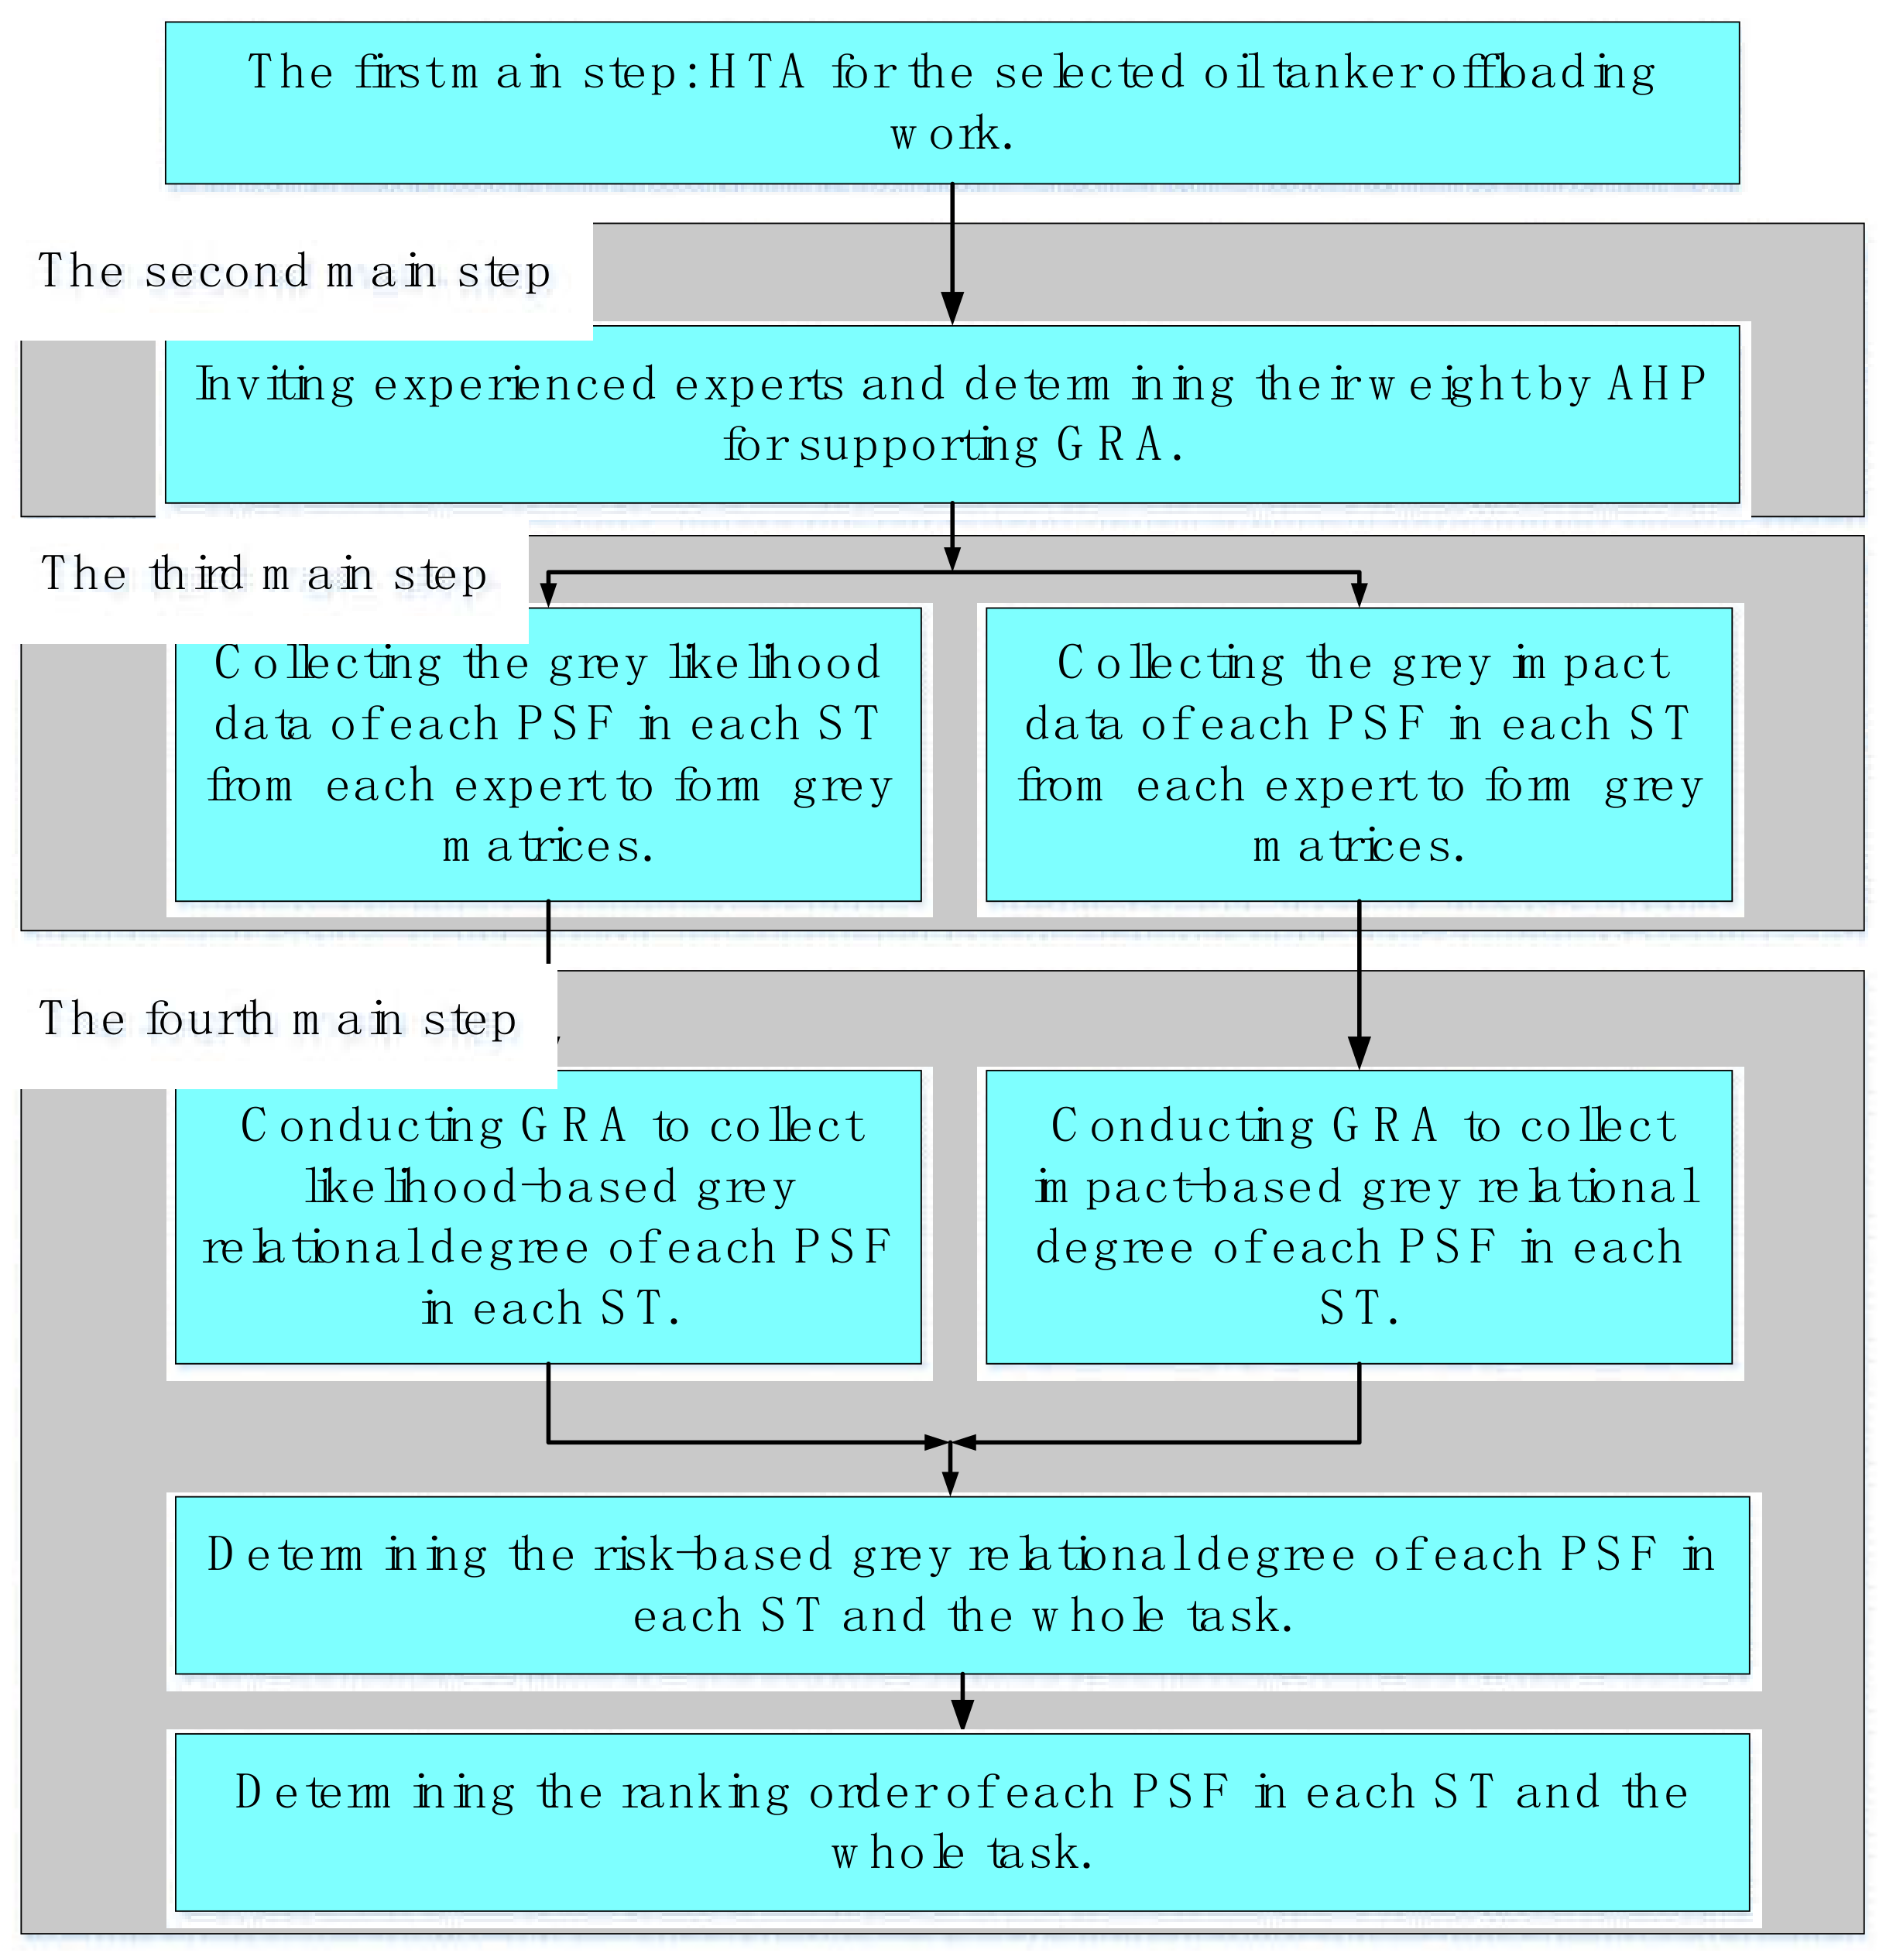
Based on the description above, this study aims to integrate HTA, AHP, GRA, and the definition of “Risk” together for effectively identifying key PSFs to strategically prevent human error. In the proposed method, HTA is conducted for considering the dynamics scenarios (the changes of each PSF during operating oil tanker offloading work); AHP is used to estimate the importance value of each invited expert; and the combination of GRA and the definition of “Risk” is used to deal with the imperfect and incomplete recording of PSFs’ data for identifying some key PSFs. Namely, through the proposed method, this study can consider the dynamic scenarios and each expert’s importance weight; moreover, this proposed method can simultaneously take plenty of PSFs’ performance at different task stages into consideration; furthermore, it can deal with the incomplete and imperfect data of PSFs and to identify some important PSFs in a grey and risk-based rational way. Those together form the main contributions of this research.
The remainder of this article is arranged as follows. Section 2 presents the methodologies used in this study and the steps of using the proposed approach for this study. Section 3 validates the proposed approach through a case study of an oil tanker offloading operation. Our research is compared and discussed in Section 4, and Section 5 relates our conclusions, limitations, and future work.

2. Methodologies

According to the above description, three main approaches (HTA, AHP, and GRA) are selected to determine the significant PSFs for human error prevention during an oil offloading process. The details of the three methods are illustrated in following parts. Moreover, as oil tanker offloading tasks are related to the oil and gas industries, all of the nine PSFs involved in the Petro-HRA (Human Reliability Analysis) method are selected for analysis in this study, shown in Table 1.

2.1. HTA Technique

HTA is one of the most famous techniques for task analysis. It is initially designed to describe and analyse operations in the chemical industries and the energy industries [35], and it has been expanded to many other industries [36]. The method has four steps. The first is to define the main task and its main goal. The second step is to decide the sub-goals of the main task. The third is to decide the STs within the main task and to match each ST to each sub-goal. The final step is to connect the STs to complete an entire HTA application. The procedure of HTA can be also found in Figure 1.

2.2. AHP Technique

AHP is a well-known technique for multicriteria decision-making. It starts with a pairwise comparison matrix to compare each alternative, and then, based on this pairwise comparison matrix, it collects the weight value of each alternative. The detailed procedures of the AHP method are presented as follows. In order to fill the required pairwise comparison matrix, Professor Thomas Saaty (the designer of AHP) provided a scale to describe the relative importance, shown in Table 2.
Then, with Table 2, the pairwise comparison matrix can be formed, and Equation (1) presents its general expression:
A = 1 a 12 a 21 1 a 1 n a 2 n a n 1 a n 2 1
where A is the required comparison matrix; in this matrix, the value 1 (equal importance) means an alternative compared with itself, element a i j ( 1 i n ,   1 j n ,   i j ) in this matrix represents the importance value when one alternative i compared with another alternative j, while n means the total number of alternatives. With the matrix, the initial weight of each alternative can be determined through Equation (2):
W i = 1 n ( j = 1 n a i j k = 1 n a k j ) ,   i = 1 , 2 , , n
where W i is the initial weight value of the ith alternative and a k j is the kth element in the jth column of matrix A. The remaining procedures of the AHP are to prove the comparison matrix and those collected initial weight data can pass a consistency test. This test starts with finding the Consistency Index (CI) value. Equation (3) shows how to find the CI value:
C I = λ m a x n n 1
where n is the order of the matrix A, which equals to the number of alternatives, and λ m a x is the maximum eigenvalue of the matrix A, which can be found from Equation (4):
A λ m a x E · W = 0
where E is the identity matrix and W is the matrix composed of each initial weight data collected from Equation (2) and can be expressed as ( W 1 , W 2 , , W n )T. With the CI value, a Consistency Ratio (CR) is required for a consistency test. The way to find CR is expressed as Equation (5):
C R = C I R I
where RI represents the Random Index obtained from Table 3. When CR is less than 0.1, the consistency test is acceptable. The procedure of AHP is also presented in Figure 2.

2.3. GRA Plus “Risk”

GRA is a powerful technique to evaluate a system with imperfect and grey information [20,21]. GRA generates the grey relational degree for assessing the relationship between the reference sequence and other comparative sequences. The procedures of the GRA application are presented below.
The first step is grey data collection. For this research, several data series must be collected to form a grey matrix, which is expressed as Equation (6):
M G = X 1 X 2 X m = X 1 1 X 1 2 X 1 s X 2 1 X 2 2 X 2 s X m 1 X m 2 X m s
where X 1 through X m are the data series formed by the collected grey data and X m s represents the grey data in for the sth criterion in the mth data series. Because the grey data may have different units and criteria, we use a Likert-type scale from 0 to 5 to ensure comparability.
The second step is to identify the reference series from the grey matrix. The determination of reference series depends on the research objective. For instance, if the objective is to analyse the grey relation between the best performance and other performance, then the best performance value for each criterion is selected to form the reference series, and vice versa. This study is to identify the risk-based grey relation degree, and the higher the risk-related value, the higher the level of importance, so the maximum risk-related value for each criterion is selected to build the reference series. Equation (7) displays the expression of it:
X O = X O 1 ,   X O 2 , , X O s
where X O means the reference series and X O 1 ,   X O 2 , , X O s are the maximum value in the first, the second, , and the sth criterion.
The third step is to calculate the absolute differences between the reference series and other comparative series. Equation (8) presents the passage for obtaining the required absolute different values:
Δ o d h = X o h X d h ,   h = 1 , 2 , , s ;   d = 1 , 2 , , m
where Δ o d h is the absolute difference between X o h , which is the hth element in the reference series, and X d h , which is the hth element in the dth comparative series.
In the fourth step, the grey relation coefficient can be collected through Equation (9) below:
r h d = m i n 1 d m m i n 1 h s Δ o d h + δ × m a x 1 d m m a x 1 h s Δ o d h Δ o d h + δ × m a x 1 d m m a x 1 h s Δ o d h
where r h d is the grey relation coefficient between the hth element in the reference series and that in the dth comparative series. The term m i n 1 d m m i n 1 h s Δ o d h means the minimum value of each Δ o d h . The m a x 1 d m m a x 1 h s Δ o d h is the maximum data of each Δ o d h . δ 0 , 1 is the identifier, and this parameter is to make the difference of grey relation coefficient for each element can be clearly identified. However, there is no certain conclusion about the value of δ , the designer of GRA and most applications suggest taking 0.5 as the value for δ [20,23,24,25,26,27,28,29,30], so this study also takes 0.5 as the value for δ . When the grey matrix M G is determined, the term m i n 1 d m m i n 1 h s Δ o d h and m a x 1 d m m a x 1 h s Δ o d h are two certain values, and the identifier δ is 0.5, so in this equation, the variable is Δ o d h .
The fifth step is to determine the grey relationship degree. Equation (10) provides the way to find this degree:
G d = h = 1 s W h · r h d
where G d is the grey relational degree of the dth comparative series to the reference series. W h means the importance weight of the hth criterion and can be determined by AHP. As this study is risk-based, the grey relational degrees with respect to likelihood and impact are individually calculated. Then, through the product rule, the grey degree of likelihood and that of the impact is combined to determine the final risk-based grey relational degree. Equation (11) gives the expression:
G d C o n . = G d L i k e l i . · G d I m p .
where G d C o n . is the risk-based grey relational degree of the dth comparative series and G d L i k e l i . and G d I m p . are the grey relational degree of the dth comparative series with respect to likelihood and impact, respectively. For this study, the procedure of GRA plus “Risk” is illustrated in Figure 3.

2.4. The Procedure of This Study

Based on the description of the selected methodologies, Figure 4 illustrates the steps to connect them together for identifying key PSFs to prevent human errors in the oil tanker offloading work. Each step is briefly explained as follows.
The first main step is to implement an HTA practise to determine the main goal, the sub-goals, and the STs of the task. The main goal is obviously to successfully offload an oil tanker.
The second main step is to invite several experienced domain experts for collecting grey data from the aspects of likelihood and impact. The importance weight of each expert is also assessed by AHP in this step.
The third main step is to collect the grey data and to form the grey matrices from the aspects of likelihood and impact.
The fourth main step is to calculate the risk-based grey relational degree of each PSF by GRA with definition of “Risk” and then to determine some significant PSFs of each ST and the whole task for human error prevention.

3. Case Study

An oil tanker offloading operation at the Beihai Oil Terminal is selected as a case study. This terminal is located near the South China Sea and has been owned by Sinopec (the largest petrochemical enterprise in China) since 2015. Figure 5 presents an oil tanker offloading operation at this oil terminal, and it is clear that people are highly involved, so preventing human errors is considerably important. According to the selected case, this study illustrates the approach that considers the operation process, experts’ importance weights, and risk-based GRA process together to identify key PSFs for human error prevention.

3.1. HTA Practice for Oil Tanker Offloading Process

According to the procedure illustrated in Figure 4, this study starts with HTA to describe the process of the selected oil tanker offloading case. Based on our previously published research [6,38], the whole oil tanker offloading work can be divided into four sub-goals, and each contains several STs. Table 4 presents the detailed result.

3.2. The Importance Weight Analysis of Each Invited Expert

According to the research procedure, domain experts’ judgement is required for collecting grey data of each PSF in each ST, so several certificated and experienced experts are invited for evaluating PSF. Table 5 gives the demography information of each invited expert.
As each invited expert may have different importance weights in making safety-related decisions, the AHP method is adopted to estimate their weight values. According to the AHP technique illustrated in Equation (1) to Equation (5), the importance weight of each invited expert can be estimated.
Each invited expert is familiar with oil tanker offloading work, with significant experience. The difference between each expert is their power in making decisions on safety. For instance, the chief safety inspector has a higher weight in making safety-related decision than the importance weight of the operating group leader, and the chief manager has more power in making decisions on safety. Based on that, the pairwise comparison matrix for AHP application is determined by the principal leader of the selected oil terminal. This matrix is illustrated as Equation (12). The importance scale (see Table 2) designed for AHP is provided by Professor Thomas Saaty, who is also the designer of AHP method. Therefore, this importance scale is used as the criterion for the top leader to determine each element in the pairwise comparison matrix. With the importance scale in Table 2, each element in the matrix is explainable. For instance, “3” in the first line and the third column means that compared with the third expert the first expert is of moderate importance:
A = 1 2 3 4 5 5 1 / 2 1 3 / 2 2 3 3 1 / 3 2 / 3 1 3 / 2 2 2 1 / 4 1 / 2 2 / 3 1 3 / 2 3 / 2 1 / 5 1 / 3 1 / 2 2 / 3 1 1 1 / 5 1 / 3 1 / 2 2 / 3 1 1
Then, according to Equation (2), the initial importance weight of each invited expert can be estimated. Using the first expert as an example, its initial importance value is 1 6 × 1 1 + 1 2 + 1 3 + 1 4 + 1 5 + 1 5 + 2 2 + 1 + 2 3 + 1 2 + 1 3 + 1 3 + 3 3 + 3 2 + 1 + 2 3 + 1 2 + 1 2 + 4 4 + 2 + 3 2 + 1 + 2 3 + 2 3 + 5 5 + 3 + 2 + 3 2 + 1 + 1 + 5 5 + 3 + 2 + 3 2 + 1 + 1 0.3975 . In this way, other initial significance weight values can be determined, as shown in Table 6.
A consistency test is required for the AHP application to validate that the comparison matrix and the initial weight values are acceptable. According to Equation (4), the maximum eigenvalue of matrix A can be calculated, then based on Equations (3) and (5), and RI value in Table 3 (RI is 1.24, since the order of matrix A is 6 in this study), the CR result can be calculated, which is 0.00113 (less than 0.1). Therefore, the comparison matrix passes the consistency test, and the initial importance weight values in Table 6 are also the final weight value of each expert. The AHP procedure is conducted by the professional AHP software “Super Decisions”, which is shown as Figure 6.

3.3. Grey Data Collection from Experts

Based on the research procedure, after determining the significance weight value of each expert, they need to conduct grey data collection work for the GRA process. A well-designed questionnaire is used for data collection. In this study, the definition of “Risk” is used as the standard to judge each PSF in Table 1 for the process of oil tanker offloading work. As “Risk” combines likelihood and impact, grey data collection is also from these two aspects. The likelihood describes the potential occurrence of each PSF in poor performance, and the impact expresses the consequence level when a PSF is at poor level. A “0–5 Likert-type scale” is selected for experts to estimate and evaluate each PSF. The “0–5 Likert-type scale” is widely used in social science research for collecting subjective data [17]. In this study, “0” means the lowest likelihood level or the lowest impact level, and “5” represents the highest. Different from many other published results, this study considers the PSFs’ differences in each ST during the oil tanker offloading work, rather than viewing the offloading work as a whole. Therefore, the grey data collection is also for each ST in the whole task. According to the HTA result, the data (including likelihood and impact) can be determined by the six invited experts through the designed questionnaire. Figure 7 presents an example question.
Using ST 1.1 in Table 4 as an example, Table 7 and Table 8 display the collected grey data of likelihood and impact, respectively, for ST 1.1. The grey data for the rest STs can be determined in a similar way. With these data, the next section will describe the process for finding key PSFs.

3.4. Risk-Based GRA Process

This part presents the application of the risk-based GRA method to find key PSFs for each ST and for the whole oil tanker offloading task.

3.4.1. Key PSF for Each ST

Choosing ST 1.1 as an example to illustrate the process to identify the key PSF in each ST for this study. Starting from building the grey relation matrices, each data in Table 7 and Table 8 can be viewed as each element in the grey matrix of likelihood and impact. Namely, Table 7 and Table 8, respectively, present the grey relation matrix of likelihood and impact for ST 1.1. According to Equation (6), the grey relation matrices can be determined. The reference series of each grey relation matrix for ST 1.1 can be determined by Equation (7), and they are (2.5, 2, 0.75, 1, 1.25, 1) for likelihood and (3, 1.5, 1.5, 3, 3.25, 3.25) for impact. Then, based on the expert evaluation data in Table 7 and Table 8, and through Equation (8), the maximum absolute difference value for likelihood data and impact data of ST 1.1 is 2 and 3; the minimum absolute difference value for likelihood data and impact data of ST 1.1 is 0 and 0. Afterwards, with Equation (9), the grey relation coefficient for each PSF’s likelihood and impact concerning each expert’s opinion in ST1.1 can be collected. Table 9 and Table 10 give the results.
As discussed previously, experts have their own importance weights. Based on Equation (10) and the weight values in Table 6, the final grey relational degrees of likelihood and impact for PSF1 in ST 1.1 are as follows:
0.3975 × 0.5000 + 0.2108 × 0.5000 + 0.1434 × 0.6667 + 0.1034 × 0.5714 + 0.0725 × 0.5714 + 0.0725 × 0.5714 ≈ 0.5416 (likelihood);
0.3975 × 0.3750 + 0.2108 × 1.0000 + 0.1434 × 0.6000 + 0.1034 × 0.3750 + 0.0725 × 0.3750 + 0.0725 × 0.3750 ≈ 0.5390 (impact).
According to Equation (11), the risk-based grey relational degree of PSF1 in ST 1.1 can be determined as 0.5416 × 0.5387 ≈ 0.2914. Then, each PSF’s risk-based grey degree in ST 1.1 can similarly be identified. Table 11 displays the results.
The risk-based grey relational degree values of PSFs in other STs can be collected by the similar way to ST 1.1. Table 12 and Figure 8 provide the results.
From Table 12 and Figure 8, the most crucial PSF in each ST can be identified. PSF1 plays the dominant role in ST 1.3 and ST 3.1; PSF4 is the key PSF to prevent human error in ST 1.2, ST 1.5, and ST 4.4; PSF5 is the most crucial one in preventing human error in ST 2.1 and ST 4.1; PSF7 is the most significant in ST 1.1, ST 4.2, ST 4.3, ST 4.5, and ST 4.6; PSF8 is the priority one in ST 1.4, ST 2.2, and ST 3.2. The ranking of each PSF in each ST is displayed in Table 13.
Apart from the key PSFs in each ST, the significant PSF for human error prevention in the whole task is also required. Based on the data in Table 12, the next section will present the approach to identify the key PSF in the whole oil tanker offloading task.

3.4.2. Key PSF for the Whole Task

There are 15 STs connecting together to achieve the goal of successfully completing oil tanker offloading. These 15 STs are conducted step by step, so their logical relationship is in series. Figure 9 presents the HTA structure.
As the STs are connected in series, the risk-based grey relational degree of each PSF in each ST can be summed to collect the degree of each PSF for the whole task. Here, PSF1 is used as an example to present the process of calculating its risk-based grey relational degree to the whole task, which is illustrated as:
0.2919 + 0.3177 + 0.6610 + 0.3858 + 0.4404 + 0.4122 + 0.4563 + 0.5674 + 0.3940 + 0.4616 + 0.4235 + 0.4343 + 0.4657 + 0.4481 + 0.5230 ≈ 6.6830
In the same way, the risk-based values for other PSFs in this oil tanker offloading task can be determined, which is displayed in Table 14. The ranking order is PSF7 > PSF8 > PSF1 > PSF4 > PSF6 > PSF5 > PSF3 > PSF9 > PSF2, so PSF7 is the top PSF in the entire oil tanker offloading work.

4. Comparison and Discussion

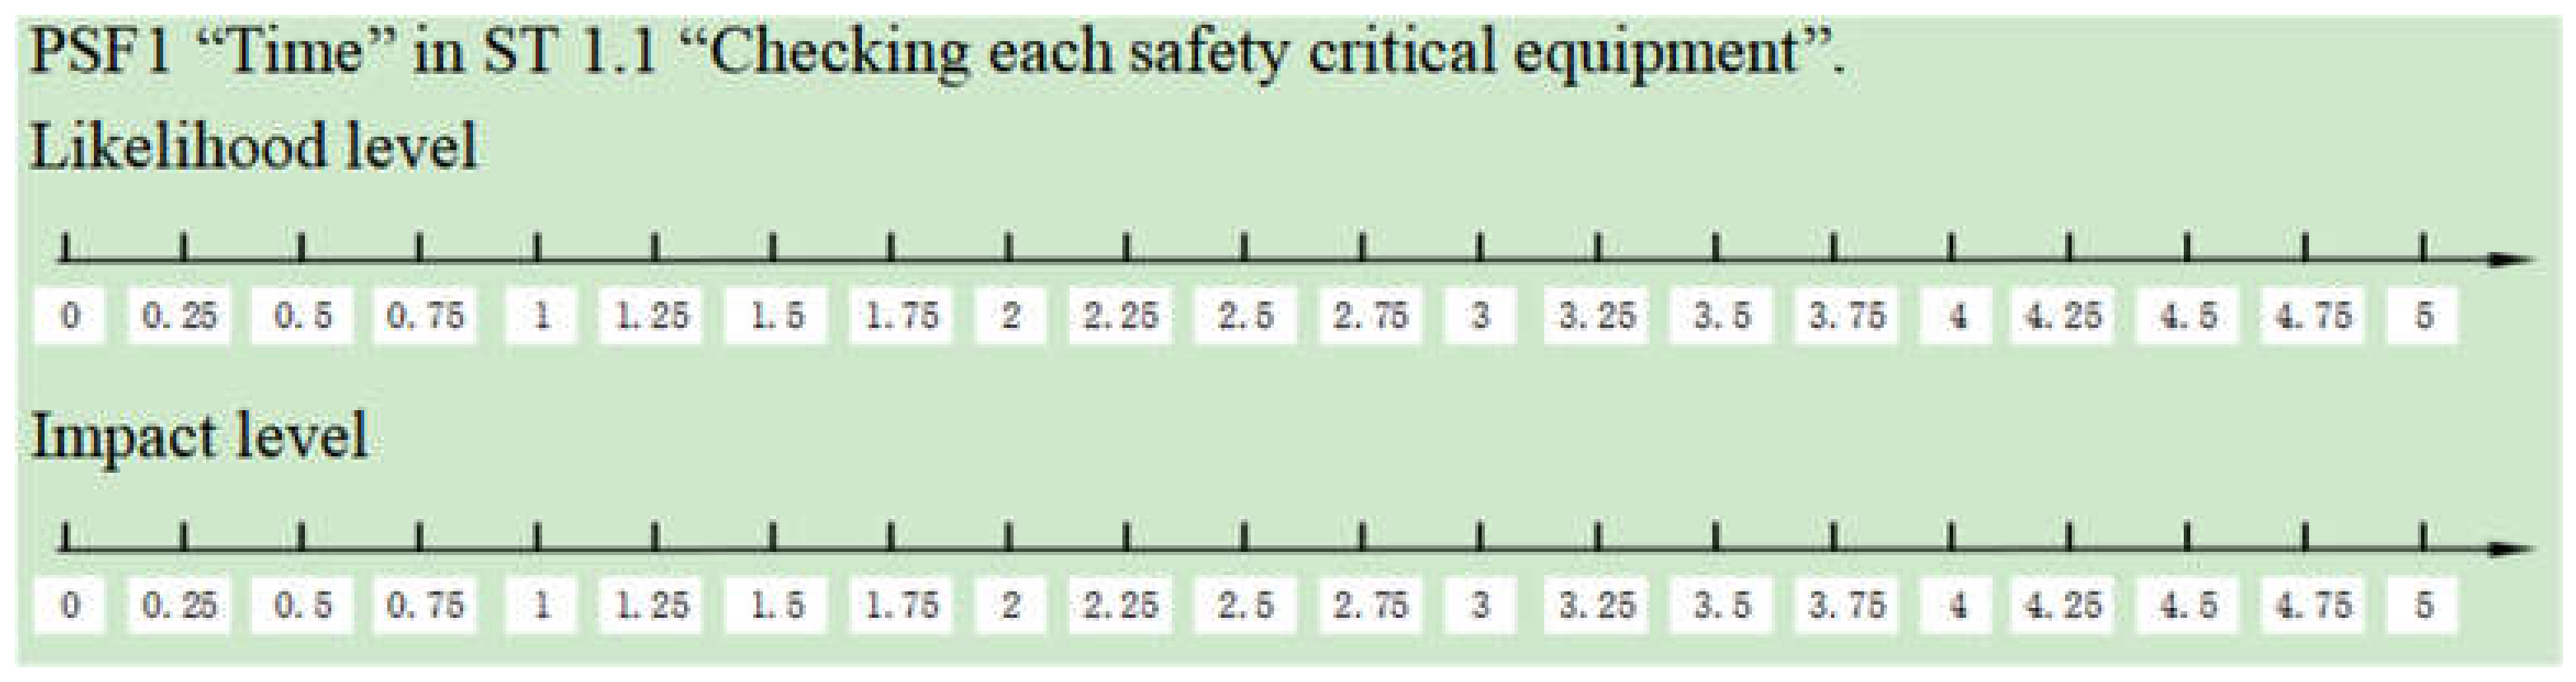
If only using the definition of “Risk” and the expert’s importance weight (traditional risk-based approach), the results for each ST and the whole task can also be determined, still using PSF1 in ST 1.1 as an example. Based on the experts’ importance data, the collected likelihood data, and the collected impact data in Table 6, Table 7 and Table 8. The likelihood data and impact data for PSF1 in ST 1.1 are:
0.3975 × 1.5 + 0.2108 × 1.0 + 0.1434 × 0.25 + 0.1034 × 0.25 + 0.0725 × 0.5 + 0.0725 × 0.25 ≈ 0.9231 (likelihood);
0.3975 × 0.5 + 0.2108 × 1.5 + 0.1434 × 0.5 + 0.1034 × 0.5 + 0.0725 × 0.75 + 0.0725 × 0.75 ≈ 0.7471 (impact).
Then, the risk value for PSF1 in ST 1.1 is 0.9231 × 0.7471 ≈ 0.6896. Through this traditional risk-based approach, the risk value of each PSF for each ST can be calculated. Table 15 gives the result.
With the calculated results in Table 15, the most important PSF in each ST and the whole offloading task can be determined. PSF1 plays the dominant role in ST 1.3, ST 3.1, and ST 4.6; PSF4 is the key PSF to prevent human error in ST 1.2; PSF5 is the most crucial one in preventing human error in ST 2.1 and ST 4.4; PSF 6 is the top ranking in ST 3.2; PSF7 is the most significant in ST 1.1, ST 4.1, ST 4.2, ST 4.3, and ST 4.5; PSF8 is the priority one in ST 1.4, ST 1.5, and ST 2.2. Moreover, for the whole oil offloading task, PSF7 is the most significant one, which is:
3.8472 + 1.8877 + 2.4859 + 0.5236 + 0.6054 + 1.5503 + 1.9361 + 1.1031 + 0.5306 + 1.5101 + 2.6979 + 2.4767 + 1.3960 + 1.5619 + 0.6175 = 24.73
Compared to the results generated by the proposed method in this study, we can find their results are mostly same except for the key PSF in ST 1.5, ST 4.1, and ST 4.5. Table 16 presents their comparison, which contains the most significant PSF in each ST and the whole task.
These differences may be caused by the different analysing theory and procedure between the proposed method in this study and the tradition risk-based approach. The GRA theory is based on the geometric differences, but the tradition way uses the weighted average value. Due to the reality that PSF-related data are always insufficient and have strong characteristics of grey, we believe that the proposed method is currently a better choice for dealing with human error prevention for our study.
It should be noticed that before this study, the leaders in the selected oil terminal knows that human error is crucial, but they have limited idea on human error prevention, and mostly, they only view training as an effective way to avoid human errors. Therefore, the staff have received frequent training on safety, even though most staff are tired of those repetitive trainings. After this research, the leaders realise that apart from some safety training work, more efforts should be paid to operators’ safety attitude and supports for work and management to prevent human errors during oil tanker offloading process. Through learning the result, the management team in the selected terminal has made a strict reward and punishment policy to encourage staff to find, report, record, and correct any unsafe behaviour, to let people form a more positive attitude to safety. Through this policy, from January to April in 2022, there was no report about abnormal incidents. In addition, the working capacity in that oil terminal increased about 17.5% compared with the data from January to April in the last year.

5. Conclusions

This research provides a grey and risk-based method to identify key PSFs for preventing human errors during an oil tanker offloading task. The highlights of this study are listed as follows:
  • The proposed method combines GRA process with the definition of “Risk” together to handle the incomplete and imperfect data of each PSF and to rationally rank each PSF;
  • This study considers the changes of each PSF in different task stages, so the dynamic scenarios are involved;
  • The method can deal with many PSFs without extra efforts such as consistency tests, so it is user-friendly;
  • The different weights of each invited expert are considered.
Through the method proposed by this study, it can be concluded that PSF7 (Attitudes to safety, work, and management support) is the key one for the whole oil tanker offloading task. For each ST, PSF7 (Attitudes to safety, work, and management support), PSF8 (Teamwork), PSF1 (Time), PSF4 (Experience/training), and PSF5 (Procedure) should be considered, since they are ranked as the top PSFs in the corresponding STs.
The results can be used for decision makers and safety management teams to strategically make some effective plans to prevent human errors for oil tanker offloading safety. For instance, except for the reward and punishment policy, more education and broadcasts for strengthening safety attitudes are required to increase the performance level of PSF7 (Attitudes to safety, work, and management support); crew communication skills and mutual trust among each team member should be improved to ensure a high level of PSF8 (Teamwork); more time for dealing with regular procedures and abnormal scenarios can enhance the performance of PSF1 (Time); more targeted trainings are necessary for the improvement of PSF4 (Experience/training); and some operation procedures should be optimised to make sure PSF5 (Procedure) is at good performance.
Apart from the application in the oil tanker offloading process, the proposed method is also suitable to other human-related and safety-related applications for finding key PSFs to prevent human errors. However, this study still needs further developments. Fuzzy characteristics should be involved in the proposed method, and the dependency level of each ST should also be analysed for better calculating the total risk-based grey degree of each PSF. In the future, efforts should be made to improve on this study.

Author Contributions

Conceptualisation, R.Z.; methodology, R.Z.; software, R.Z.; validation, R.Z.; formal analysis, R.Z. and J.G.; investigation, R.Z.; resources, R.Z. and H.M.; data curation, R.Z.; writing—original draft preparation, R.Z.; writing—review and editing, H.M., J.G. and H.T.; visualisation, R.Z.; supervision, R.Z.; project administration, R.Z.; funding acquisition, R.Z. All authors have read and agreed to the published version of the manuscript.

Funding

This research was funded by the Cross-Disciplinary Science Foundation from the Beijing Institute of Petrochemical Technology (grant number: BIPTCSF-003 and BIPTCSF-011) and the Beijing Youth Talent Promotion Project.

Institutional Review Board Statement

Not applicable.

Informed Consent Statement

Not applicable.

Data Availability Statement

Not applicable.

Acknowledgments

The authors would like to appreciate the experts and the engineers working in the Beihai Oil Terminal for their constructive supports during the development of this work. The authors would also like to thank the editors and the anonymous reviewers for their valuable comments.

Conflicts of Interest

The authors declare no conflict of interest.

Abbreviations

AHPAnalytic Hierarchy Process
ANPAnalytic Network Process
FMEAFailure Mode and Effects Analysis
GRAGrey Relational Analysis
HTAHierarchical Task Analysis
Petro-HRAPetro-Human Reliability Analysis
PSF(s)Performance Shaping Factor(s)
STSub-tasks
Symbols
A The required comparison matrix for AHP application
C I Consistency Index
C R Consistency ratio
E Identity matrix
G d The grey relational degree of the dth series to the reference series
G d C o n . The risk-based grey relational degree of the dth series
G d L i k e l i . The grey relational degree of the dth series with respect to likelihood
G d I m p . The grey relational degree of the dth series with respect to impact
M G Grey matrix
R I Random Index
r h d Grey relation coefficient between the hth element in the reference series and that in the dth comparative series
W The matrix composed of each weight data
W h The importance weight of the hth criterion
W i Initial weight value of the ith alternative
X O Reference series
Δ o d h Absolute difference between the hth element in the reference series and the hth element in the dth series
λ m a x The maximum eigenvalue of the matrix A
δ Identifier

References

  1. Dhillon, B.S. Human Reliability and Error in Transportation Systems; Springer Science and Business Media: London, UK, 2007. [Google Scholar]
  2. Liu, P.; Li, Z. Human error data collection and comparison with predictions by SPAR-H. Risk Anal. 2014, 34, 1706–1719. [Google Scholar] [CrossRef] [PubMed]
  3. Wahab, A.N.; Rusil, R.; Shariff, M.A.; Rashid, A.E. Selection of inherently safer preventive measures to reduce human error. J. Loss Prev. Process Ind. 2016, 41, 323–332. [Google Scholar] [CrossRef]
  4. Islam, R.; Anantharaman, M.; Khan, F.; Abbassi, R.; Garaniya, V. A hybrid human reliability assessment technique for the maintenance operations of marine and offshore systems. Process Saf. Prog. 2020, 39, e12118. [Google Scholar] [CrossRef] [Green Version]
  5. Kim, Y.; Park, J.; Jung, W.; Jang, I.; Seong, P. A statistical approach to estimating effects of performance shaping factors on human error probabilities of soft controls. Reliab. Eng. Syst. Saf. 2015, 142, 378–387. [Google Scholar] [CrossRef]
  6. Zhang, R.; Tan, H. A modified human reliability analysis method for the estimation of human error probability in the offloading operations at oil terminals. Process Saf. Prog. 2021, 40, 84–92. [Google Scholar] [CrossRef]
  7. Chandrasegaran, D.; Ghazilla, R.A.R.; Rich, K. Human factors engineering integration in offshore O&G industry: A review of current state of practice. Saf. Sci. 2020, 125, 104627. [Google Scholar]
  8. Yin, Z.; Liu, Z.; Li, Z. Identifying and clustering performance shaping factors for nuclear power plant commissioning tasks. Hum. Factors Ergon. Manuf. Serv. Ind. 2021, 31, 42–65. [Google Scholar] [CrossRef]
  9. Goossens, A.J.M.; Basten, R.J.I. Exploring maintenance policy selection using the Analytic Hierarchy Process; An application for naval ships. Reliab. Eng. Syst. Saf. 2015, 142, 31–41. [Google Scholar] [CrossRef] [Green Version]
  10. Abbroggi, D.M.; Trucco, P. Modelling and assessment of dependent performance shaping factors through Analytic Network Process. Reliab. Eng. Syst. Saf. 2011, 96, 849–860. [Google Scholar] [CrossRef]
  11. Saaty, T.L. Decision Making for Leaders: The Analytic Hierarchy Process for Decisions in a Complex World; RWS Publications: Pittsburgh, PA, USA, 1990. [Google Scholar]
  12. Su, X.; Mahadevan, S.; Xu, P.; Deng, Y. Inclusion of task dependence in human reliability analysis. Reliab. Eng. Syst. Saf. 2014, 128, 41–55. [Google Scholar] [CrossRef]
  13. Yang, Z.L.; Bonsall, S.; Wall, A.; Wang, J.; Usman, M. A modified CREAM to human reliability quantification in marine engineering. Ocean. Eng. 2013, 58, 293–303. [Google Scholar] [CrossRef]
  14. Akyuz, E.; Celik, M. A methodological extension to human reliability analysis for cargo tank cleaning operation on board chemical tanker ships. Saf. Sci. 2015, 75, 146–155. [Google Scholar] [CrossRef]
  15. Ung, S.T. Human error assessment of oil tanker grounding. Saf. Sci. 2018, 104, 16–28. [Google Scholar] [CrossRef]
  16. Chen, X.; Liu, X.; Qin, Y. An extended CREAM model based on analytic network process under the type-2 fuzzy environment for human reliability analysis in the high-speed train operation. Qual. Reliab. Eng. Int. 2021, 37, 284–308. [Google Scholar] [CrossRef]
  17. Liu, P.; Lyu, X.; Qiu, Y.; He, J.; Tong, J.; Zhao, J.; Li, Z. Identifying key performance shaping factors in digital main control rooms of nuclear power plants: A risk-based approach. Reliab. Eng. Syst. 2017, 167, 264–275. [Google Scholar] [CrossRef]
  18. Boring, R.L.; Joe, J.C.; Mandelli, D. Human performance modeling for dynamic human reliability analysis. In Proceedings of the 6th International Conference on Digital Human Modeling and Applications in Health, Safety, Ergonomics and Risk Management, Los Angeles, CA, USA, 2–7 August 2015. [Google Scholar]
  19. Joe, J.C.; Shirley, R.B.; Mandelli, D.; Boring, R.L.; Smith, C.L. The development of dynamic human reliability analysis simulations for inclusion in risk informed safety margin characterization frameworks. Procedia Manuf. 2015, 3, 1305–1311. [Google Scholar] [CrossRef] [Green Version]
  20. Deng, J. Introduction to grey system theory. J. Grey Syst. 1982, 1, 1–24. [Google Scholar]
  21. Wei, J.; Zhou, L.; Wang, F.; Wu, D. Work safety evaluation in Mainland China using grey theory. Appl. Math. Model. 2015, 39, 924–933. [Google Scholar] [CrossRef]
  22. Ai, X.; Hu, Y.; Chen, G. A systematic approach to identify the hierarchical structure of accident factors with grey relations. Saf. Sci. 2014, 63, 83–93. [Google Scholar] [CrossRef]
  23. Zhou, Q.; Thai, V.V. Fuzzy and grey theories in failure mode and effect analysis for tanker equipment failure prediction. Saf. Sci. 2016, 83, 74–79. [Google Scholar] [CrossRef]
  24. Chen, L.; Deng, Y. A new failure mode and effects analysis model using Dempster–Shafer evidence theory and grey relational projection method. Eng. Appl. Artif. Intell. 2018, 76, 13–20. [Google Scholar] [CrossRef]
  25. Wang, H.; Zhang, Y.M.; Yang, Z. A risk evaluation method to prioritize failure modes based on failure data and a combination of fuzzy sets theory and grey theory. Eng. Appl. Artif. Intell. 2019, 82, 216–225. [Google Scholar] [CrossRef]
  26. Li, Z.; Chen, L. A novel evidential FMEA method by integrating fuzzy belief structure and grey relational projection method. Eng. Appl. Artif. Intell. 2019, 77, 136–147. [Google Scholar] [CrossRef]
  27. Song, W.; Li, J.; Li, H.; Ming, X. Human factors risk assessment: An integrated method for improving safety in clinical use of medical devices. Appl. Soft Comput. 2020, 86, 105918. [Google Scholar] [CrossRef]
  28. Xue, J.; Van Gelder, P.H.A.J.M.; Reniers, G.; Papadimitriou, E.; Wu, C. Multi-attribute decision-making method for prioritizing maritime traffic safety influencing factors of autonomous ships’ maneuvering decisions using grey and fuzzy theories. Saf. Sci. 2019, 120, 323–340. [Google Scholar] [CrossRef]
  29. Taylan, O. A hybrid methodology of fuzzy grey relation for determining multi attribute customer preferences of edible oil. Appl. Soft Comput. 2013, 13, 2981–2989. [Google Scholar] [CrossRef]
  30. Yazdani, M.; Kahraman, C.; Zarate, P.; Onar, S.C. A fuzzy multi attribute decision framework with integration of QFD and grey relational analysis. Expert Syst. Appl. 2019, 115, 474–485. [Google Scholar] [CrossRef] [Green Version]
  31. Akyuz, E.; Celik, M. Application of CREAM human reliability model to cargo loading process of LPG tankers. J. Loss Prev. Process Ind. 2015, 34, 39–48. [Google Scholar] [CrossRef]
  32. Rasmussen, M.; Standal, I.M.; Laumann, K. Task complexity as a performance shaping factor: A review and recommendations in Standardized Plant Analysis Risk-Human Reliability Analysis (SPAR-H) adaption. Saf. Sci. 2015, 76, 228–238. [Google Scholar] [CrossRef]
  33. Institutt for Energiteknikk. Available online: https://ife.brage.unit.no/ife-xmlui/handle/11250/2442387 (accessed on 31 January 2017).
  34. Taylor, C.; Øie, S.; Gould, K. Lessons learned from applying a new HRA method for the petroleum industry. Reliab. Eng. Syst. Saf. 2020, 194, 106276. [Google Scholar] [CrossRef]
  35. Stanton, N.A.; Salmon, P.M.; Rafferty, L.A.; Walker, G.H.; Baber, C.; Jenkins, D.P. Human Factors Methods: A Practical Guide for Engineering and Design; CRC Press: London, UK, 2013. [Google Scholar]
  36. Stanton, N.A. Hierarchical task analysis: Developments, applications, and extensions. Appl. Ergon. 2006, 37, 55–79. [Google Scholar] [CrossRef] [PubMed] [Green Version]
  37. Hoscan, O.; Cetinyokus, S. Determination of emergency assembly point for industrial accidents with AHP analysis. J. Loss Prev. Process Ind. 2021, 69, 104386. [Google Scholar] [CrossRef]
  38. Liu, P.; Zhang, R.; Yin, Z.; Li, Z. Human errors and human reliability. In Handbook of Human Factors and Ergonomics, 5th ed.; Salvendy, G., Karwowski, W., Eds.; John Wiley and Sons: Hoboken, NJ, USA, 2021; pp. 514–572. [Google Scholar]
Figure 1. Procedure of HTA for this study.
Jmse 10 00688 g001
Figure 2. Procedure of AHP.
Jmse 10 00688 g002
Figure 3. The procedure of GRA plus “Risk”.
Jmse 10 00688 g003
Figure 4. Research procedure of this study.
Jmse 10 00688 g004
Figure 5. Real oil tanker offloading work at the Beihai Oil Terminal.
Jmse 10 00688 g005
Figure 6. The AHP procedure in “Super Decisions”.
Jmse 10 00688 g006
Figure 7. Example question in the questionnaire.
Jmse 10 00688 g007
Figure 8. Risk-based grey relational degrees in each ST: (a) PSF1, PSF2, PSF3; (b) PSF4, PSF5, PSF6; (c) PSF7, PSF8, PSF9.
Jmse 10 00688 g008
Figure 9. HTA structure of the oil tanker offloading task.
Jmse 10 00688 g009
Table 1. The nine PSFs and the corresponding definitions in Petro-HRA [32,33,34].
PSFDefinition
PSF1Time
PSF2Threat stress
PSF3Task complexity
PSF4Experience/training
PSF5Procedures
PSF6Human–machine interface
PSF7Attitudes to safety, work, and management support
PSF8Teamwork
PSF9Physical working environment
Table 2. The importance scale for filling the comparison matrix [11].
ScaleDefinition
1Equal importance
3Moderate importance
5Essential importance
7Very strong importance
9Extreme importance
(1, 3), (3, 5), (5, 7), (7, 9)Intermediate values between two adjacent judgments
1/2, 1/3, 1/4, 1/5, 1/6, 1/7, 1/8, 1/9The inverse meaning of 2, 3, 4, 5, 6, 7, 8, and 9
Table 3. The corresponding RI value of each matrix order [37].
Matrix Order12345678910
RI000.580.901.121.241.321.411.451.49
Table 4. The HTA result of the selected oil ship offloading task [6,38].
Sub-Goal ST No.ST Description
Sub-goal 1. Safety check before oil offloadingST 1.1Checking each safety-critical equipment to ensure they are at the correct position.
ST 1.2To make sure the sensors and the monitoring systems are functional.
ST 1.3Giving inspections to oil transfer arms, pipelines, valves, and flanges to ensure that there is no leakage.
ST 1.4Keeping effective communication with central control room both at oil ship and at oil port.
ST 1.5Handling all documentation work and obtaining official permission for oil offloading work from both oil port and oil ship.
Sub-goal 2. Moving the oil transfer arms towards the oil tankerST 2.1Starting oil loading arms one by one and moving them towards the oil ship.
ST 2.2Correctly connecting oil loading arms one by one with manifolds at the oil ship.
Sub-goal 3. Oil loading process controlST 3.1Continuously safety inspection to each working pipeline, valve, flange, and transfer arm to make sure they are functional.
ST 3.2Continuously monitoring the ship’s conditions and keep effective communication in time.
Sub-goal 4. Oil loading arm disconnectionST 4.1Cleaning all of the waste oil in each transfer arm.
ST 4.2Disconnecting each transfer arm with manifolds at oil ship.
ST 4.3Quickly installing blind flange and seal it on manifolds to avoid oil leakage.
ST 4.4Operating the transfer arms and move it towards oil port.
ST 4.5Locating the oil transfer arms at their initial position, and then locking them.
ST 4.6Finishing the relative documentation work.
Table 5. The information of each invited expert.
Expert No.GenderAgeWorking Experience (Year)Educational LevelPosition
1Male4926UniversityChief manager of the oil terminal
2Male5129UniversityDeputy chief manager of the oil terminal
3Male5130CollegeChief safety inspector of the oil terminal
4Male5233CollegeSafety inspector of the oil terminal
5Male5436CollegeOperating group leader of oil offloading team 1
6Male5030CollegeOperating group leader of oil offloading team 2
Table 6. The initial importance value of each invited expert in making decision.
Expert No.123456
Importance Weight0.39750.21080.14340.10340.07250.0725
Table 7. The collected likelihood data of each PSF concerning ST 1.1.
PSFExpert 1Expert 2Expert 3Expert 4Expert 5Expert 6
PSF11.510.250.250.50.25
PSF20.500.250.250.50.5
PSF31100.250.50.5
PSF420.50.50.7510.5
PSF51.510.250.50.750.5
PSF6110.250.250.50.25
PSF72.520.750.250.50.25
PSF81100.50.750.25
PSF92.510.511.251
Table 8. The collected impact data of each PSF concerning ST 1.1.
PSFExpert 1Expert 2Expert 3Expert 4Expert 5Expert 6
PSF10.51.50.50.50.750.75
PSF2210.50.250.50.5
PSF31100.50.750.5
PSF42111.251.51.5
PSF5110.7522.252.25
PSF60.51.50.7533.252.5
PSF7311.533.253.25
PSF811022.252.25
PSF9110.750.50.750.25
Table 9. The grey relation coefficient of each PSF’s likelihood in ST 1.1 concerning each expert’s evaluation.
ExpertPSF1PSF2PSF3PSF4PSF5PSF6PSF7PSF8PSF9
Expert 10.50000.33330.40000.66670.50000.40001.00000.40001.0000
Expert 20.50000.33330.50000.40000.50000.50001.00000.50000.5000
Expert 30.66670.66670.57140.80000.66670.66671.00000.57140.8000
Expert 40.57140.57140.57140.80000.66670.57140.57140.66671.0000
Expert 50.57140.57140.57140.80000.66670.57140.57140.66671.0000
Expert 60.57140.66670.66670.6667 0.66670.57140.57140.57141.0000
Table 10. The grey relation coefficient of each PSF’s impact in ST 1.1 concerning each expert’s evaluation.
ExpertPSF1PSF2PSF3PSF4PSF5PSF6PSF7PSF8PSF9
Expert 10.37500.60000.42860.60000.42860.37501.00000.42860.4286
Expert 21.00000.75000.75000.75000.75001.00000.75000.75000.7500
Expert 30.60000.60000.50000.75000.66670.66671.00000.50000.6667
Expert 40.37500.35290.37500.46150.60001.00001.00000.60000.3750
Expert 50.37500.35290.37500.46150.60001.00001.00000.60000.3750
Expert 60.37500.35290.35290.4615 0.60000.66671.00000.60000.3333
Table 11. The grey relational degree of each PSF in ST 1.1.
PSFGrey Relational Degree of Likelihood Grey Relational Degree of Impact Risk-Based Grey Relational Degree
10.54160.53900.2914
20.44710.57030.2550
30.49510.49170.2434
40.65300.61870.4041
50.56530.57310.3239
60.50190.67960.3411
70.89360.94730.8465
80.50500.54920.2773
90.86590.51420.5142
Table 12. Risk-based grey relational degree of each PSF in each ST.
ST No.PSF1PSF2PSF3PSF4PSF5PSF6PSF7PSF8PSF9
ST1.10.29190.25500.24340.40410.32390.34110.84650.27730.4452
ST1.20.31770.31830.49840.61760.38080.57390.48600.46070.3225
ST1.30.66100.23040.27060.27240.24930.21680.48110.23500.2735
ST1.40.38580.41480.32180.37990.29340.69930.43330.78080.3743
ST1.50.44040.28380.31020.61770.27620.37100.30900.58850.2890
ST2.10.41220.29400.35860.37950.48030.47970.45270.38320.2353
ST2.20.45630.26660.37870.46800.41840.43910.53710.62070.2778
ST3.10.56740.22470.27790.27100.23440.25650.43520.25260.3088
ST3.20.39400.33960.23790.23160.19480.44670.28920.40270.2271
ST4.10.46160.30660.38800.44030.52910.35190.48690.37280.3619
ST4.20.42350.24790.32080.38780.36980.39240.73750.54700.3478
ST4.30.43430.34200.33850.37970.33440.42970.74140.61640.3213
ST4.40.46570.24780.43860.51390.65440.37870.50840.35070.3133
ST4.50.44810.22150.23780.26010.27440.24260.56860.30000.1942
ST4.60.52300.39330.39010.45360.34140.33830.53450.52080.3115
Table 13. Risk-based grey relational degree of each PSF in each ST.
ST No.Rank1Rank2Rank3Rank4Rank5Rank6Rank7Rank8Rank9
ST1.1PSF7PSF9PSF4PSF6PSF5PSF1PSF8PSF2PSF3
ST1.2PSF4PSF6PSF3PSF7PSF8PSF5PSF9PSF2PSF1
ST1.3PSF1PSF7PSF9PSF4PSF3PSF5PSF8PSF2PSF6
ST1.4PSF8PSF6PSF7PSF2PSF1PSF4PSF9PSF3PSF5
ST1.5PSF4PSF8PSF1PSF6PSF3PSF7PSF9PSF2PSF5
ST2.1PSF5PSF6PSF7PSF1PSF8PSF4PSF3PSF2PSF9
ST2.2PSF8PSF7PSF4PSF1PSF6PSF5PSF3PSF9PSF2
ST3.1PSF1PSF7PSF9PSF3PSF4PSF6PSF8PSF5PSF2
ST3.2PSF6PSF8PSF1PSF2PSF7PSF3PSF4PSF9PSF5
ST4.1PSF5PSF7PSF1PSF4PSF3PSF8PSF9PSF6PSF2
ST4.2PSF7PSF8PSF1PSF6PSF4PSF5PSF9PSF3PSF2
ST4.3PSF7PSF8PSF1PSF6PSF4PSF2PSF3PSF5PSF9
ST4.4PSF5PSF4PSF7PSF1PSF3PSF6PSF8PSF9PSF2
ST4.5PSF7PSF1PSF8PSF5PSF4PSF6PSF3PSF2PSF9
ST4.6PSF7PSF1PSF8PSF4PSF2PSF3PSF5PSF 6PSF9
Table 14. The risk-based grey degrees for the PSFs in the whole task.
PSFPSF1PSF2PSF3PSF4PSF5PSF6PSF7PSF8PSF9
Risk-based grey degree 6.68304.38625.01166.07725.35515.95777.84746.70924.6037
Table 15. The risk value of each PSF in each ST through the traditional method.
ST No.PSF1PSF2PSF3PSF4PSF5PSF6PSF7PSF8PSF9
ST1.10.68960.39150.53041.73291.23040.97763.84720.83601.2960
ST1.20.57630.95472.92883.74471.00942.34381.88771.24120.5831
ST1.33.81020.74430.83841.16890.69730.37442.48590.60980.5698
ST1.40.32280.69460.37570.40080.17981.64850.52361.93870.5169
ST1.50.52350.39640.47101.50390.32930.59390.60541.55290.3219
ST2.11.19070.76361.24241.48651.69011.65471.55031.36600.5429
ST2.21.27710.76361.44361.76511.66621.58561.93612.21460.6647
ST3.11.54530.47040.76540.77680.43070.41871.10310.51210.5108
ST3.20.44160.59490.38330.39430.21991.12570.53061.04680.4582
ST4.11.09380.78871.22241.47281.26880.73261.51010.81610.5580
ST4.21.13540.73541.30051.51581.59491.57092.69792.09550.8217
ST4.31.13540.94671.32811.52841.24431.55142.47672.09550.7348
ST4.40.65750.51821.13661.46831.86901.15751.39600.81260.5592
ST4.50.65750.54100.63160.79330.82730.68001.56190.94060.2690
ST4.60.96100.58540.45610.54370.34540.39010.61750.57800.3007
Table 16. The most important PSF in each ST.
TaskMost Important PSF (the Proposed Method)Most Important PSF (Traditional Risk-Based Method)
ST 1.1PSF7PSF7
ST 1.2PSF4PSF4
ST 1.3PSF1PSF1
ST 1.4PSF8PSF8
ST 1.5PSF4PSF8
ST 2.1PSF5PSF5
ST 2.2PSF8PSF8
ST 3.1PSF1PSF1
ST 3.2PSF6PSF6
ST 4.1PSF5PSF7
ST 4.2PSF7PSF7
ST 4.3PSF7PSF7
ST 4.4PSF5PSF5
ST 4.5PSF7PSF7
ST 4.6PSF7PSF1
Whole taskPSF7PSF7
Publisher’s Note: MDPI stays neutral with regard to jurisdictional claims in published maps and institutional affiliations.

