Article

Effect of Lateral Stress on the Mechanical Properties of Rock Fracture and Its Implication on the Stability of Underground Oil Storage Caverns

1
Key Laboratory of Ministry of Education on Safe Mining of Deep Metal Mines, Northeastern University, Wenhua Road, Shenyang 110819, China
2
School of Resources and Civil Engineering, Northeastern University, Wenhua Road, Shenyang 110819, China
*
Author to whom correspondence should be addressed.
J. Mar. Sci. Eng. 2022, 10(5), 677; https://doi.org/10.3390/jmse10050677
Submission received: 1 April 2022 / Revised: 28 April 2022 / Accepted: 10 May 2022 / Published: 16 May 2022
(This article belongs to the Section Geological Oceanography)

Abstract

:
It is of great significance to study the mechanical properties of rock fracture for the stability of rock engineering projects. The mechanical properties, including the normal compression and shear properties of rock fracture, are studied by a series of shear tests considering the effect of lateral stress using the self-developed true triaxial test apparatus. The test results show that the initial normal stiffness and the maximum normal closure value of rock fracture increase with the increase of lateral stress, and the peak shear strength and the peak dilatancy angle increase with the increase of lateral stress, whereas the peak shear displacement decreases with the increase of lateral stress. Considering the effect of lateral stress, the improved normal loading model, peak shear strength model and peak dilatancy angle model of rock fracture are established. Using the equivalent parameters of rock fracture obtained based on the test, the hydro-mechanical coupling analysis considering lateral stress is carried out for an underground water sealed oil storage cavern project. It can be concluded that with the increase of lateral stress, the displacement of surrounding rock decreases, and the surrounding rock tends to be more stable.

1. Introduction

Rock matrix and rock fracture are two basic elements of rock mass. The presence of rock fracture makes the rock mass heterogeneous in configuration, highly discontinuous, and non-linear in its behavior with respect to mechanical deformation and fluid flow, therefore, it is of great significance to study the properties of rock fracture for the stability of rock engineering projects.
The mechanical properties of rock fracture mainly include normal compression and shear deformation or strength properties. The normal compression properties of rock fracture have been the focus of many scholars, and many models to quantitatively describe the relationship between normal stress and normal displacement of rock fracture have been established. Bandis et al. [1] used a hyperbolic equation to characterize the relationship between normal stress and normal displacement. Barton et al. [2] modified Bandis’s model on the basis of a large number of laboratory tests and proposed an improved hyperbolic model, namely the Barton–Bandis empirical model. Shehata [3] proposed a semi-logarithm function model to describe the fracture deformation behavior. Malama and Kulatilake [4] presented a new semi-empirical exponential model to predict the rock fracture deformation behavior under normal compressive loading. Many researchers have developed these basic models considering different conditions and factors. On the basis of hyperbolic equation, Saeb and Amadei [5] developed a 2D non-linear elastic constitutive model with consideration of the different normal deformability of rock fracture with mated and unmated initial positions and the effects of the deformability of the surrounding rock mass on the rock fracture. Yin and Wang [6] extended the hyperbolic loading and unloading curves and established a normal cyclic loading constitutive model. Zhang et al. [7] investigated the normal compression deformation properties of rock fracture under normal cyclic loading. Qiao et al. [8] analyzed the relationship between rock fracture stiffness and closure under different peripheral constraints and proposed a constitutive model for normal displacement of rock fracture considering rock matrix deformation and introduced its applicable conditions. Only the normal stress is considered, and the lateral stress is not considered in these basic and developed models, which is inconsistent with the stress state of rock fracture in nature.
Shear properties of rock fracture are very important for the stability of rock engineering projects and a number of experimental, empirical, and analytical methods have been proposed to estimate the properties. The shear properties of rock fracture are related to the fracture surface morphology [9,10]. Patton [11] first attempted to correlate the surface roughness with the shear strength of rock fracture using the assumption that the asperities on the fracture surface have identical shape and inclination angle. Barton and Choubey [12] proposed a well-known shear strength criterion for rock fracture considering the joint roughness coefficient (JRC) and the joint wall compressive strength (JCS), namely the JRC-JCS model. Based on the JRC-JCS model, Zhao [13] proposed the JRC-JMC model by studying the effects of both joint surface roughness and joint matching on the shear strength of rock fracture. Li et al. [14] presented a fracture constitutive model considering the contribution of waviness and unevenness of the fracture surface to shear behavior. The shear properties of rock fracture under different shear rate, dilatancy rate, or loading path were the focus of the scholars’ research [15,16,17]. Ladanyi and Archambault [18] introduced the energy method to study the whole shear process of rock fracture and proposed a non-linear model for predicting the shear strength of rough rock fracture considering shear rate and dilatancy rate. Souley et al. [19] extended the Amadei-Saeb model [5] to include cyclic shear paths through an elastic unloading with the initial shear stiffness and constant shear stress at the residual level during reversed shearing before the initial position of the fracture is recovered. Jafari et al. [20] studied the variation of the shear strength of rock fracture due to cyclic loading and developed a mathematical model for evaluating the shear strength of rock fracture under cyclic loading conditions. Wang et al. [21] carried out direct shear tests with different shear rates on four rock-like fractures with different roughness and proposed a peak shear strength model of rock fracture considering shear rate. In addition, the effect of fillings on the shear properties of rock fracture were also investigated. Tian et al. [22] carried out the direct shear tests for 10 groups of grouted joint specimens and proposed a peak shear strength model for cement filled rock joint. Consistent with normal compression properties, the influence of lateral stress on the shear properties of rock fracture need to be further studied, including both the mechanical behavior and the constitutive model.
In nature, rock fracture is actually under the state of three-dimensional (3D) stress and the influence of lateral stress on rock fracture is real. The influence of lateral stress on the mechanical properties of rock fracture is considered in this study. The normal and shear tests on rock fracture considering lateral stress are conducted using a self-developed true triaxial test apparatus, and the influences of lateral stress on the mechanical properties of rock fractures are investigated. Based on the above widely used model, taking the lateral stress into consideration, the improved normal loading model, peak shear strength model and peak shear dilation angle model of rock fracture are proposed. Furthermore, using the established model and equivalent parameter method, the influence of lateral stress on the surrounding rock stability of an underground water sealed oil storage cavern project is studied.

2. Normal and Shear Tests of Rock Fracture under True Triaxial Stress
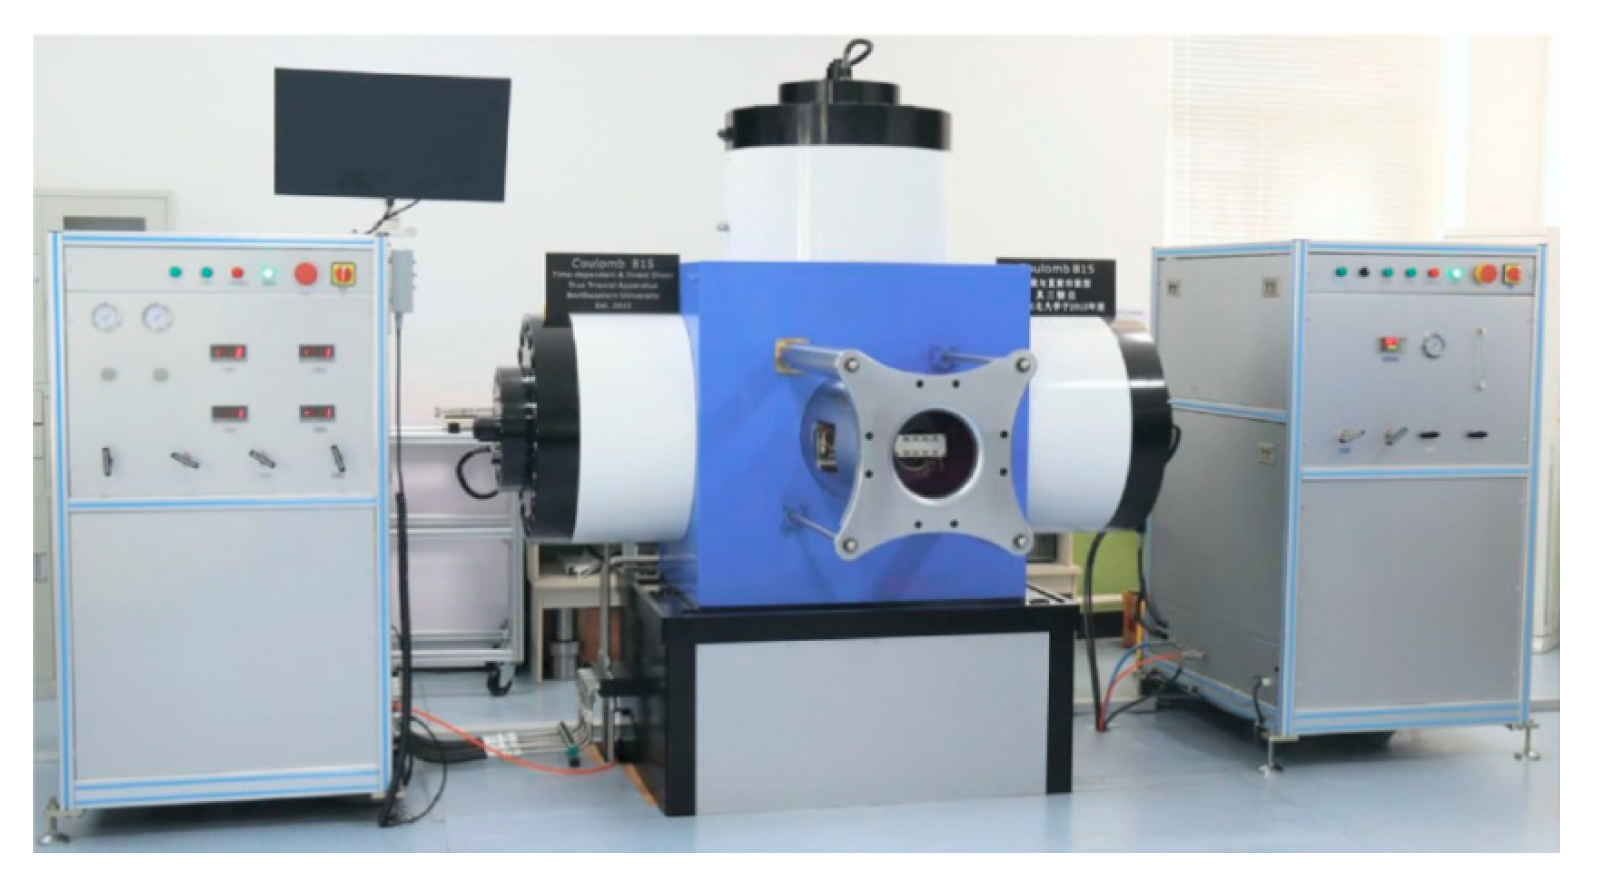
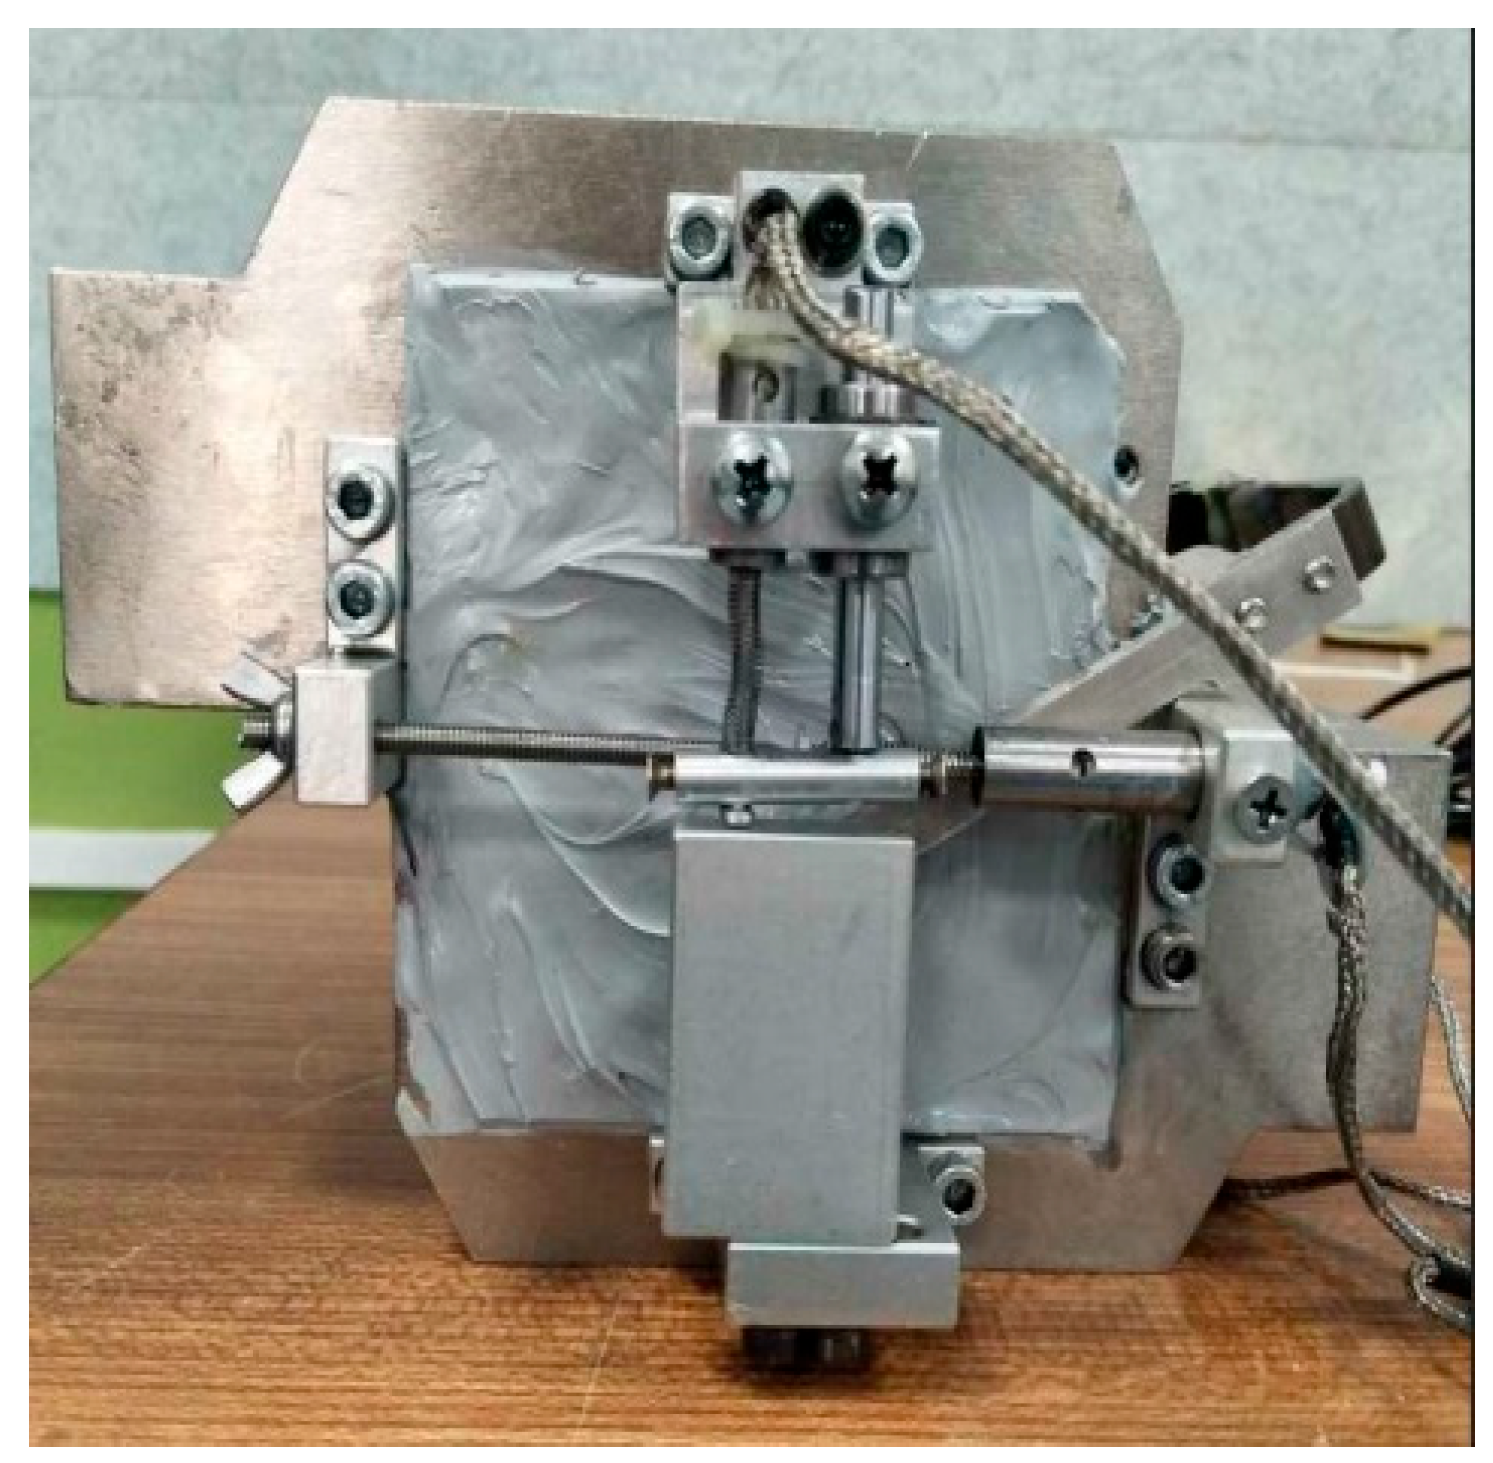
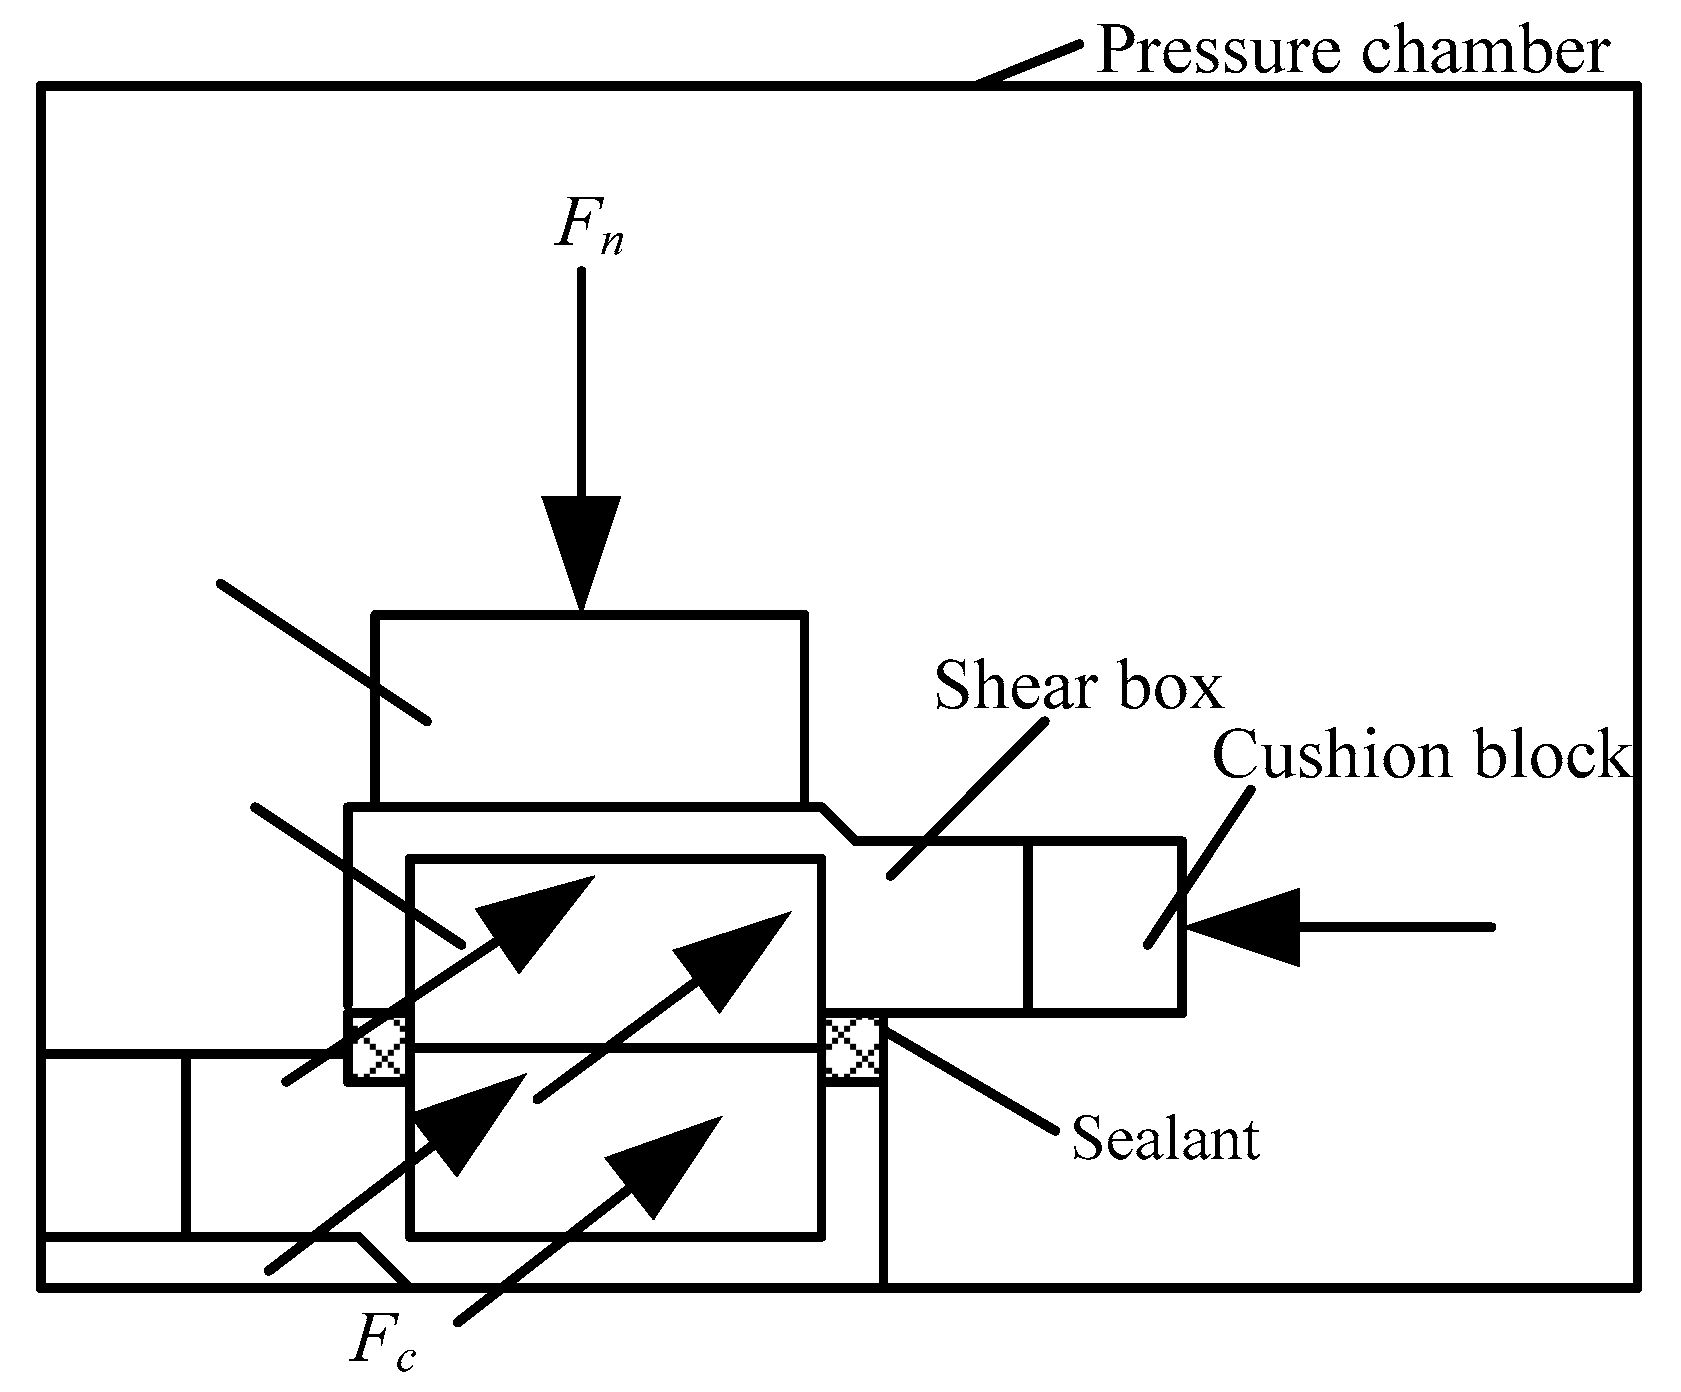
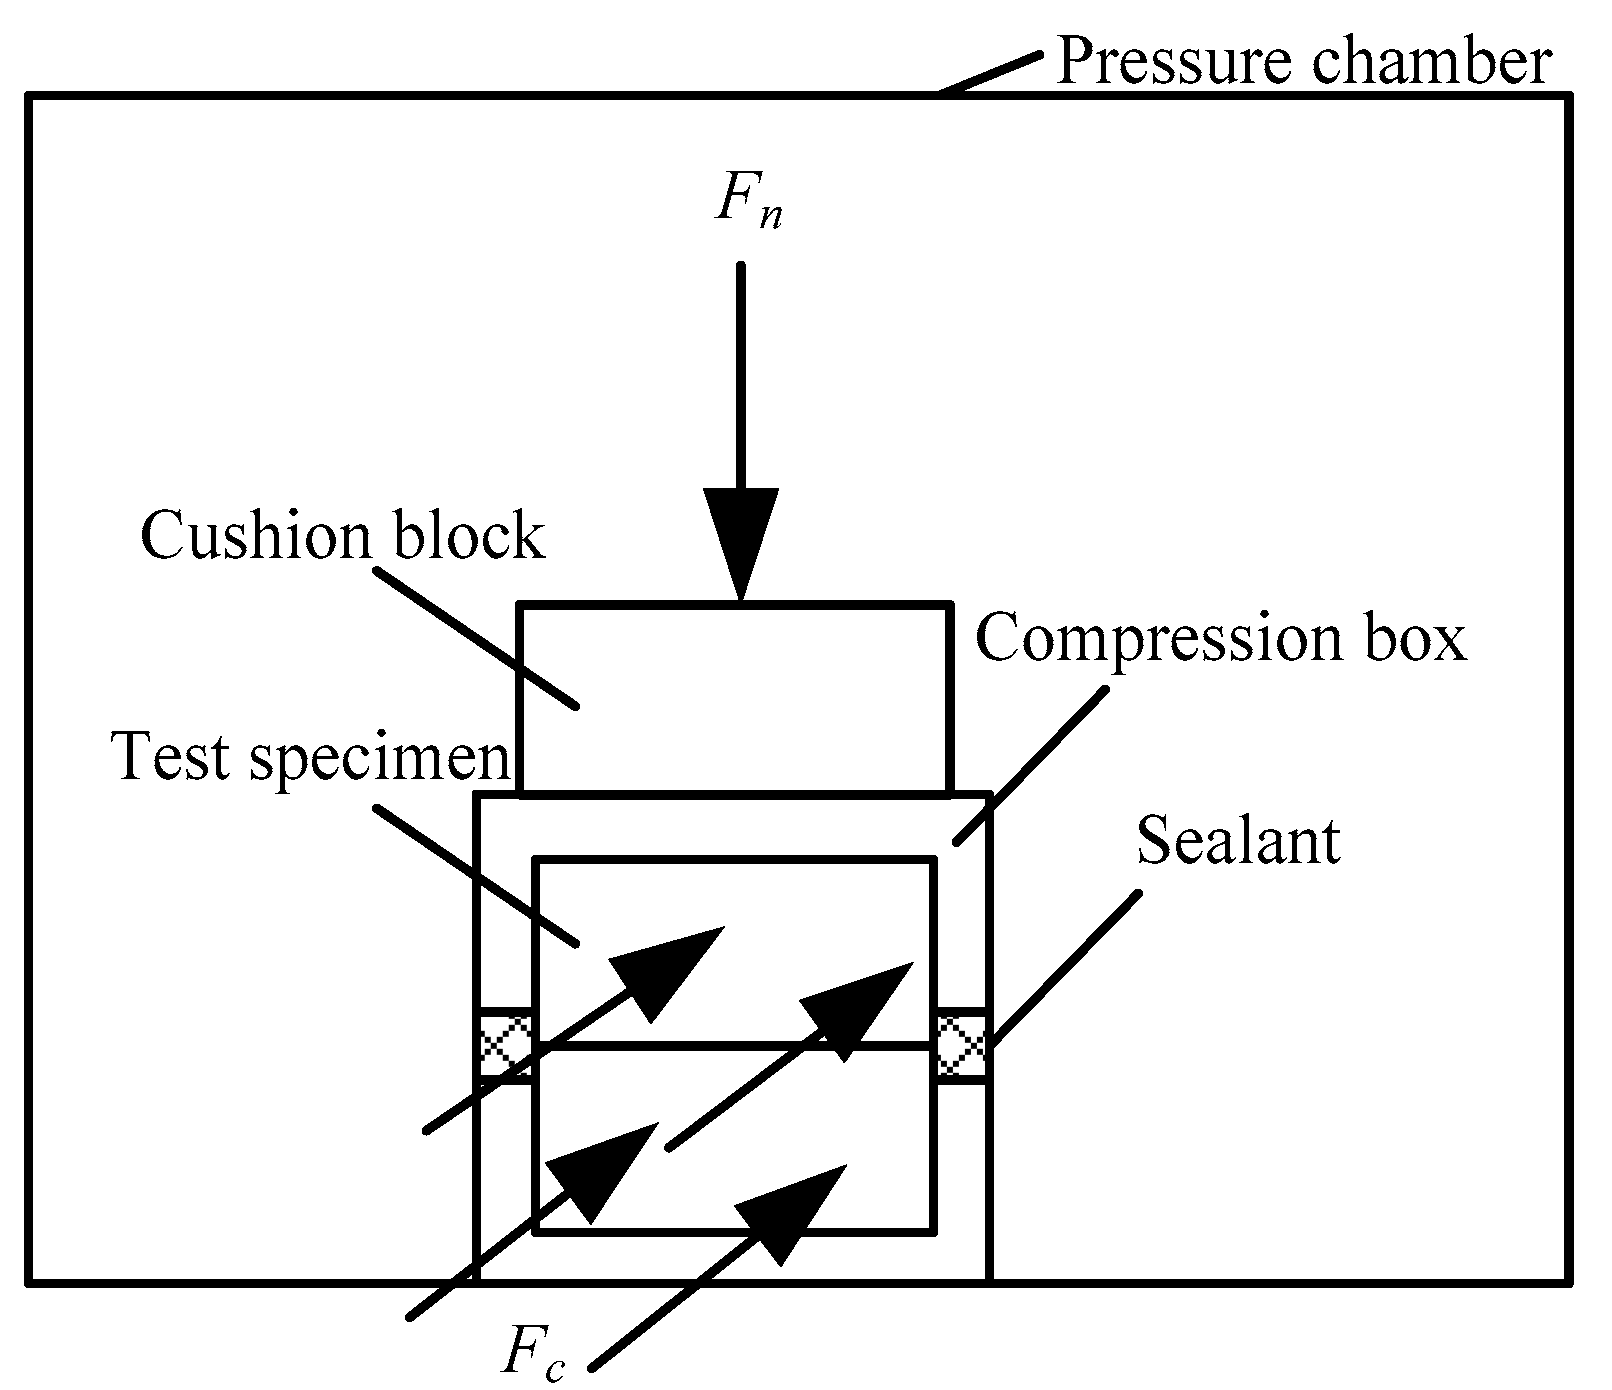
2.1. Test Apparatus

The normal and shear tests of rock fracture in this study were conducted on the self-developed true triaxial test apparatus, as shown in Figure 1 [23]. With long-term constant temperature, high-precision, and high-pressure loading, the apparatus can be employed to conduct pre and post-peak experiments on hard rocks under high stress, true triaxial, and compressive conditions. The stepping hydraulic servo injection pump controlled by servo stepping motor is used to apply different normal stress, lateral stress, and shear stress. The maximum normal load can reach 6000 kN and the maximum shear load can reach 3000 kN. The ultra-high pressure chamber is filled with hydraulic oil by auxiliary pump, and the maximum lateral pressure can reach 100 MPa. The accuracy of the deformation sensor is 0.0001 mm, and the maximum measurement range is 3 mm.

2.2. Test Preparation

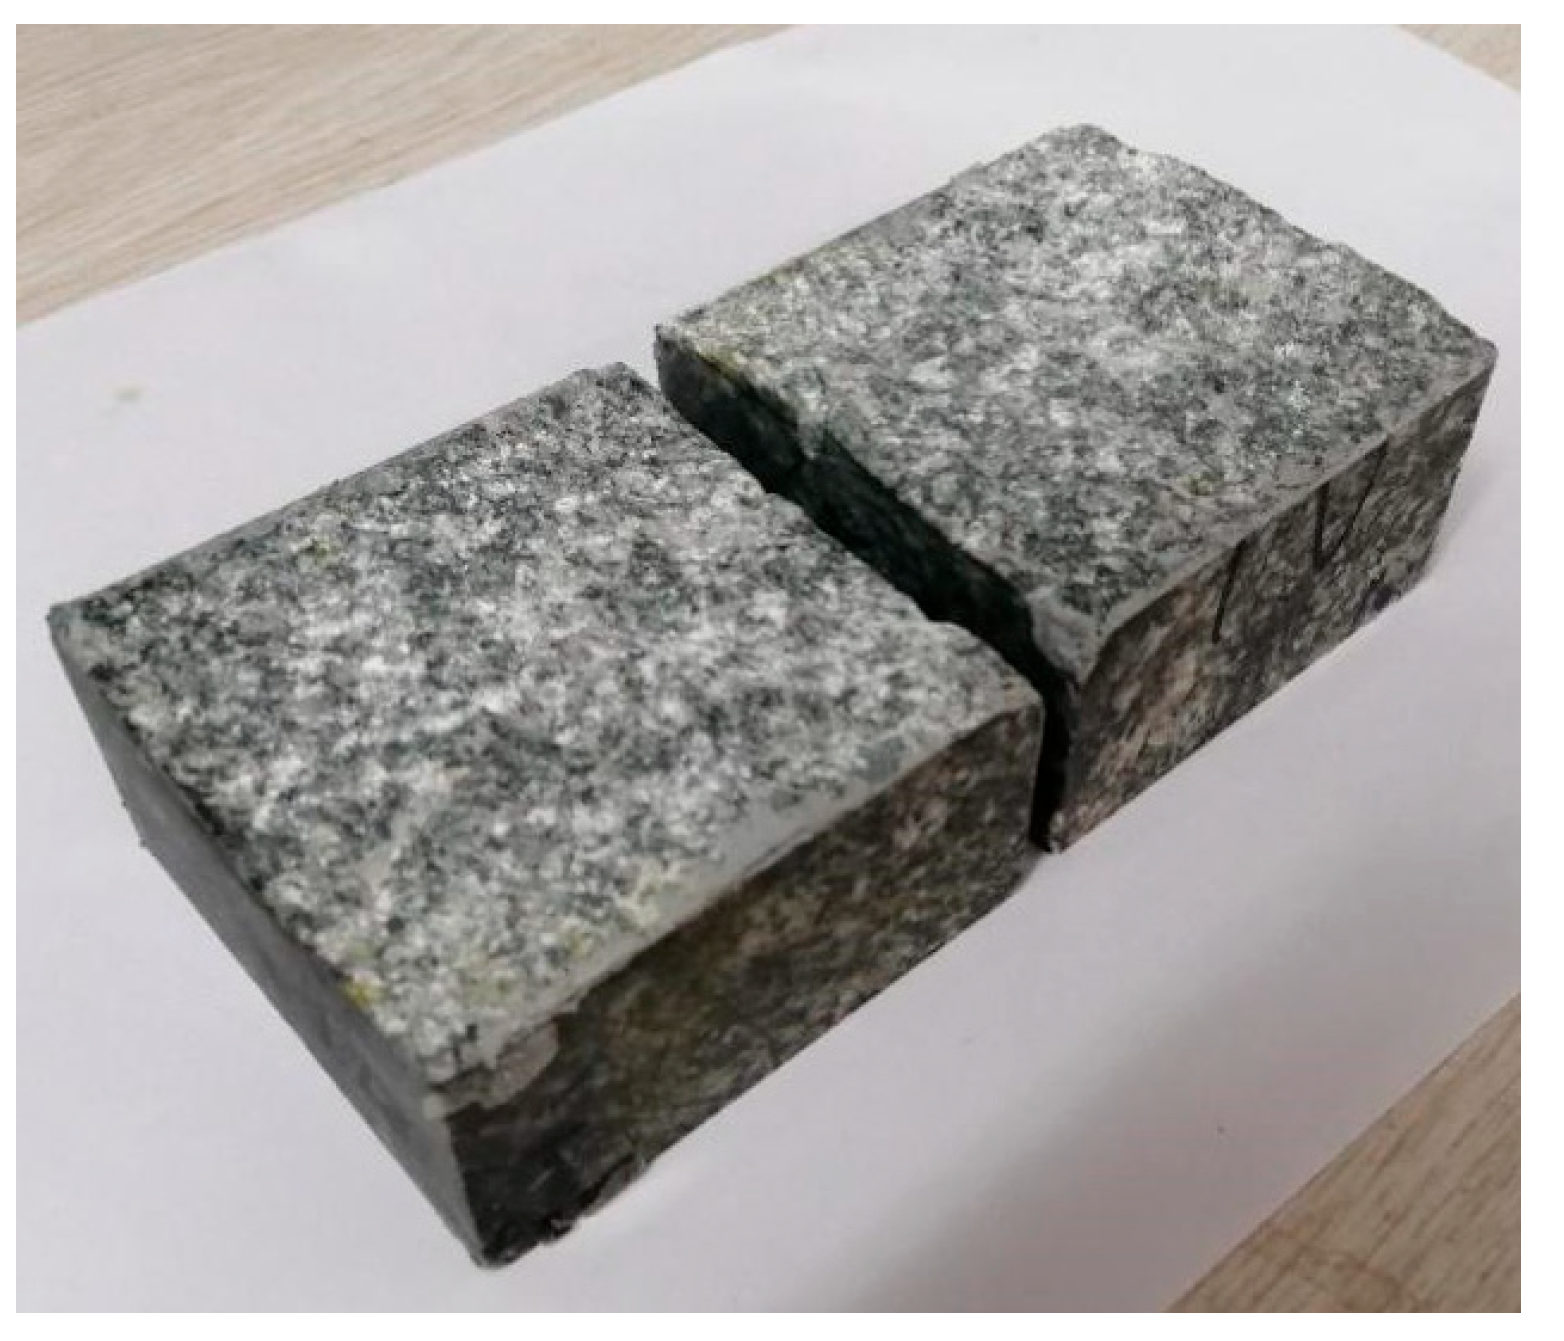
2.2.1. Fabrication of Rock Fracture

The rock specimens were collected from an underground water sealed oil storage cavern project site. The rocks were granite gneiss. Due to the limit of the maximum specimen size of the apparatus, the collected rocks were processed into standard cube specimens with the size of 70 mm × 70 mm × 70 mm by a rock cutting machine, as shown in Figure 2. In order to reduce the friction between the instrument and the specimen, each surface of the rock specimen was polished with a grinder. The perpendicularity tolerance was controlled within 0.025 mm. The Brazilian splitting tests were carried out by a Rockman 207 triaxial compression instrument, and the complete rock fractures were obtained, as shown in Figure 3.

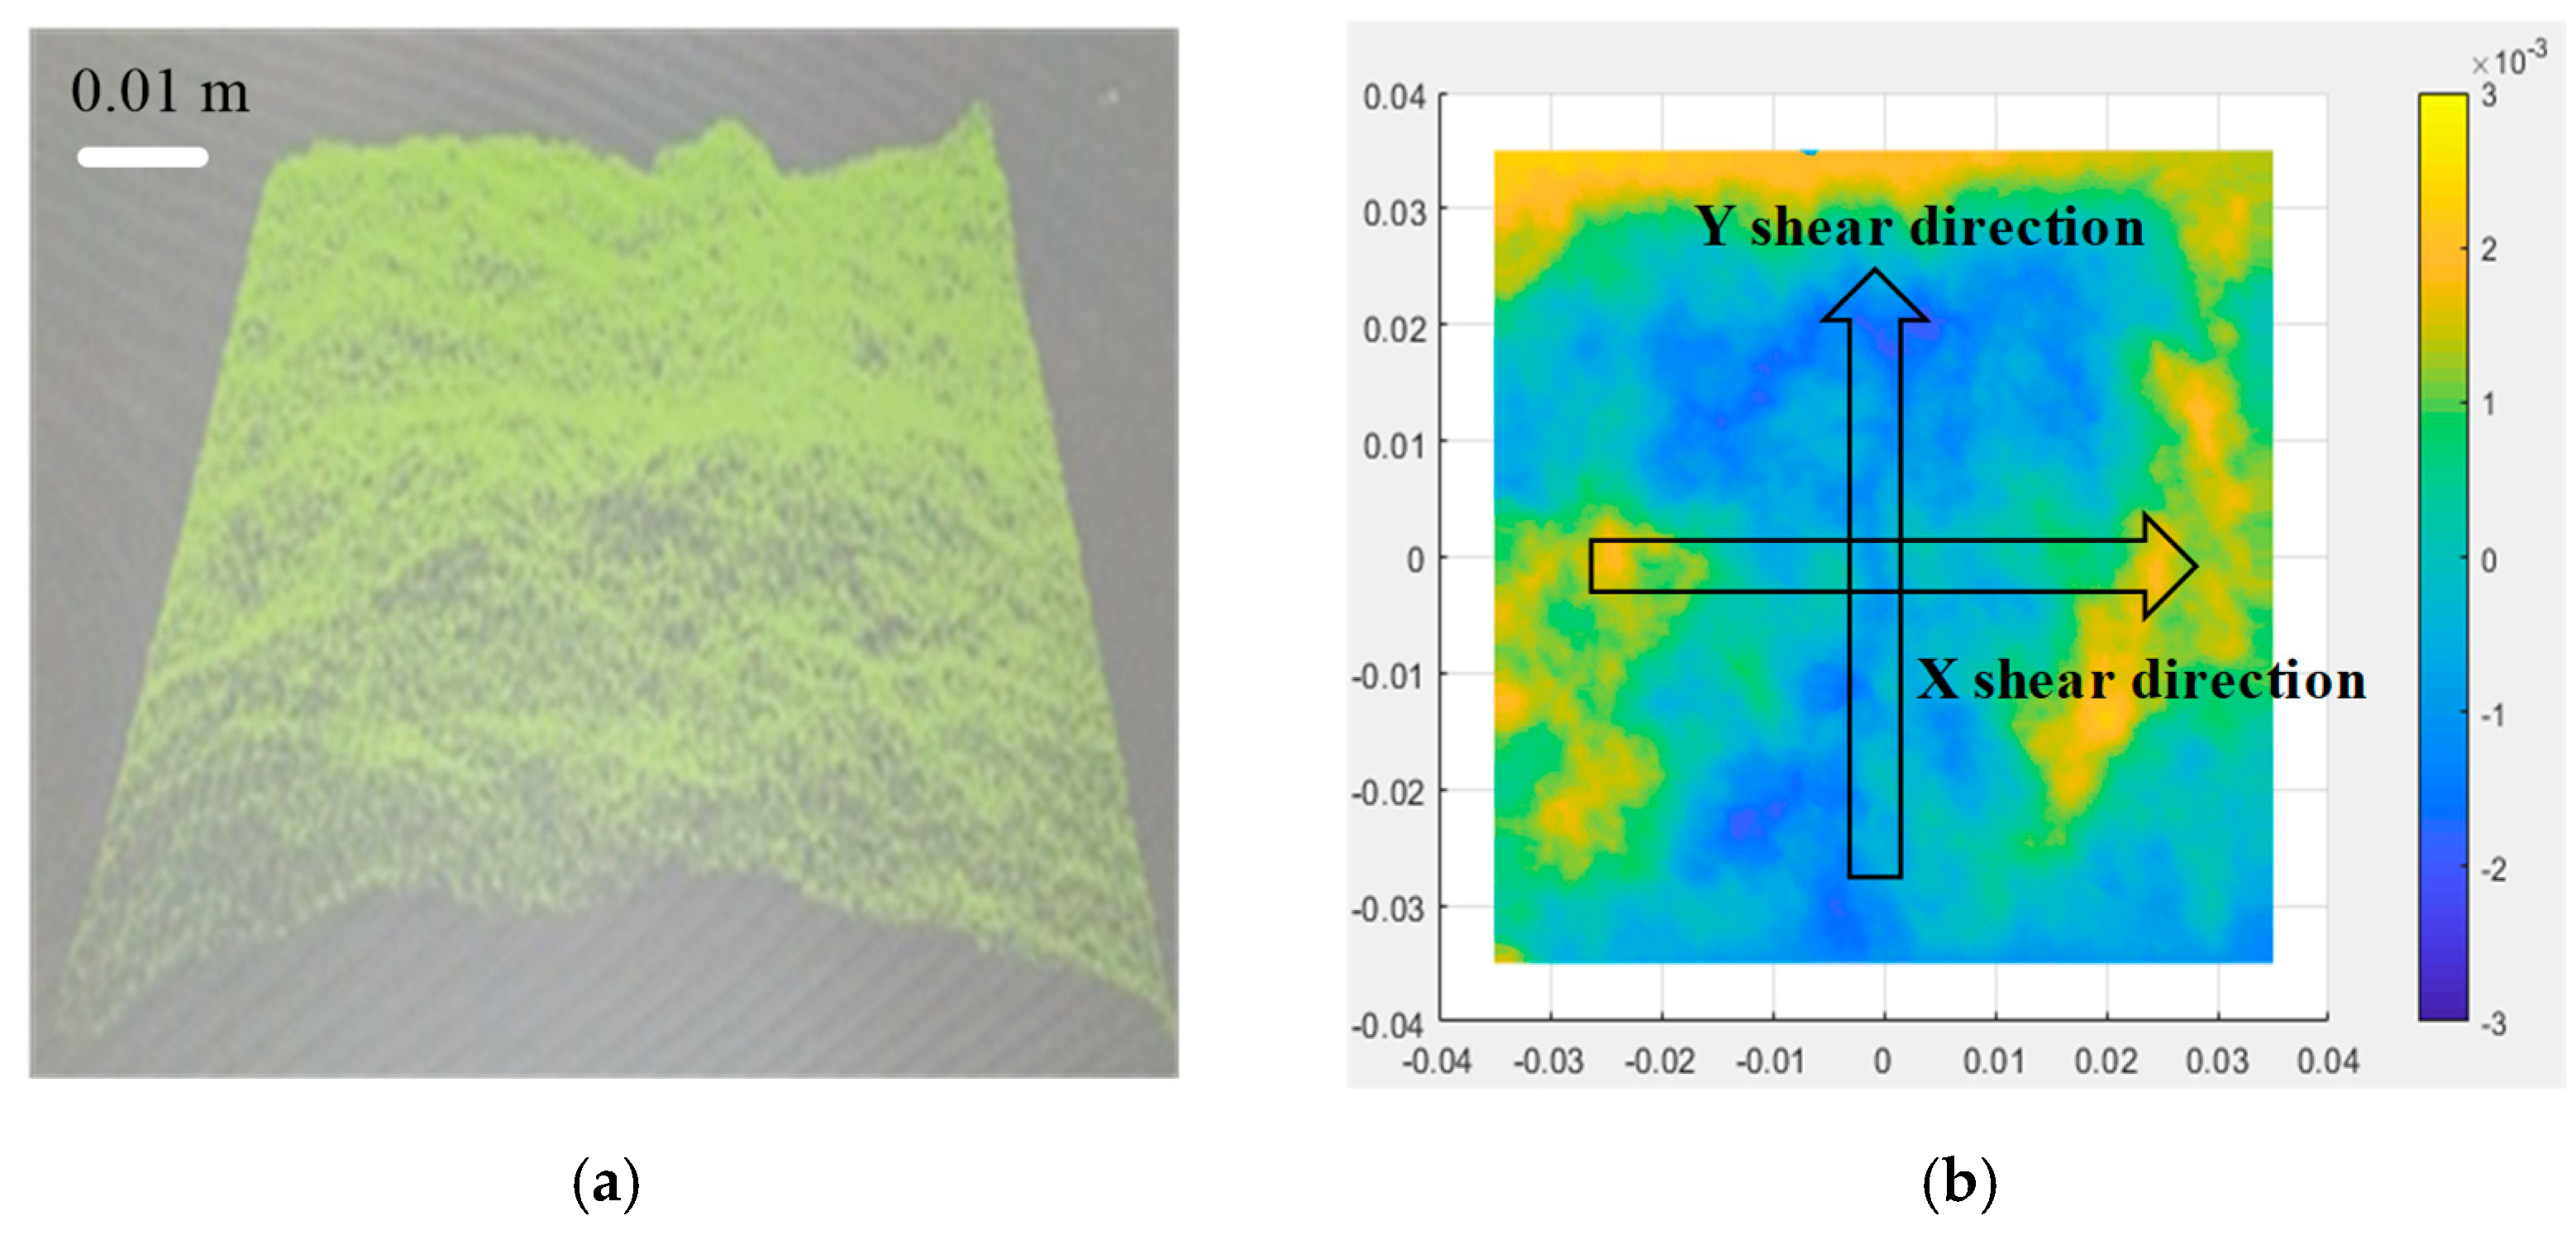
2.2.2. D Topography Scanning and JRC Calculation of Rock Fracture

The 3D topography of the rock fracture was scanned by Arter Spider laser scanner. Figure 4a shows the 3D point cloud images of rock fracture after calibration and de-noising. The reconstructed 3D topography point cloud image of the rock fracture was obtained by interpolation function, as shown in Figure 4b.
Barton [24] used JRC to describe the roughness of the rock fracture surface. At present, the mathematical statistics method is commonly used to calculate the 3D data points of a rock fracture and to quantitatively calibrate the JRC by establishing the functional relationship between the 3D data points and JRC. Tse and Cruden [25] used the root mean square Z2 of the roughness profile curve to quantify the JRC of the rock fracture. The calculation method of the root mean square Z2 is as follows [26,27]:
Z 2 = 1 L x = 0 x = L ( d y d x ) = 1 M ( Δ x ) 2 i = 1 M ( y i + 1 - y i ) 2 0.5
where, L is the length of rock fracture in x direction, Δx is the sampling interval along the x direction, Δ y = y i + 1 y i is the difference in y direction between two adjacent sampling points on the rock fracture, and M is the total number of sampling intervals of the rock fracture.
The value of Z2 is related to the sampling interval. A different sampling interval will cause the different relationship between the value of Z2 and the JRC of the rock fracture. Ge et al. [28] concluded that JRC would increase with the decrease in sampling interval and suggested that the ratio of sampling interval to sampling size should not be higher than 0.05. In this study, the sampling size is 70 mm, the sampling scanning interval is 0.1 mm, and the ratio of sampling interval to sampling size is 0.00143. The sampling interval of 1 mm was used to calculate the JRC, and the following relationship between the value of Z2 and the JRC of the rock fracture was used [25]:
JRC = 53.15 ( Z 2 ) 0.692 6.32   ( Δ x = 1   mm )
Combining Equations (1) and (2), the mean JRC of each rock fracture specimen was calculated for X and Y directions as shown in Figure 4b. With the sampling interval of 1 mm, the detailed results of JRC are listed in Table 1. In order to reduce the dispersion between different specimens, the shear tests were conducted along the X direction of rock fracture specimens #1 to #4 because of the similar roughness of the rock fracture. Specimen #5 had a relatively large dispersion with the others, so it was used for the cyclic normal compression test.

2.3. Test Scheme

2.3.1. Normal Compression Test Scheme

The sealed specimen prepared for the test is shown in Figure 5. The normal stress was loaded by force, and the loading rate was 0.5 kN/s. The lateral stress was applied by filling the hydraulic oil into the ultra-high pressure chamber by oil pump. Figure 6 shows the loading diagram of the normal compression test. During the test, the lateral pressure was loaded first. The specimen in the pressure chamber was completely immersed in the hydraulic oil, so the normal stress equal to the lateral stress would also be loaded by the oil pressure, and then the extra normal stress was loaded according to the test scheme.
For the normal compression test, there were six cases considering different lateral stress from 0 to 30 MPa, as listed in Table 2. The total normal stress was defined as 35 MPa. The specific stress loading mode was as follows:
(1)
For case 5-1 in Table 2, without considering the lateral stress, the normal stress was loaded to 35 MPa with the loading rate of 0.5 kN/s, and then the normal stress was unloaded to 0 with the same loading rate;
(2)
For case 5-2 in Table 2, considering the lateral stress, firstly, the lateral stress was applied to 5 MPa by oil pressure, while the specimen was also subjected to a normal stress of 5 MPa. The extra normal stress of 30 MPa was loaded with the loading rate of 0.5 kN/s, and the total normal stress was 35 MPa. Finally, the normal stress was unloaded to 0 with the same loading rate;
(3)
Following the same method as step 2, all the other cases with different lateral stresses of 10 MPa, 15 MPa, 20 MPa, and 30 MPa were completed.

2.3.2. Shear Test Scheme

In order to reduce the dispersion, the shear test with the specific lateral stress was conducted on a single specimen under different normal stresses. The shear stress was loaded by displacement, and the loading rate was 0.002 mm/s. Figure 7 shows the loading diagram of the shear test. The loading method of normal stress and lateral stress was the same as above. The shear test scheme is listed in Table 3.
The specific stress loading mode was as follows:
(1)
For case 1 in Table 3, without considering the lateral stress, the normal stress of 5 MPa was loaded and maintained constant, and then the shear stress was applied by displacement control with the loading rate of 0.002 mm/s. When the shear stress reached the peak value, the shear stress was unloaded to 0. Following the same method, the cases with different normal stress of 10 MPa and 15 MPa were completed.
(2)
For case 2 in Table 3, considering the lateral stress, firstly, the lateral stress was applied to 2 MPa by oil pressure, while the specimen was also subjected to a normal stress of 2 MPa. The extra normal stress of 5 MPa was loaded with the force loading rate of 0.5 kN/s, and then the shear stress was applied by displacement control with the loading rate of 0.002 mm/s. When the shear stress reached the peak value, the shear stress was unloaded to 0. Following the same method, the cases with different normal stress of 9 MPa, 12 MPa, and 18 MPa were completed.
(3)
Following the same method as step 2, all the other cases with different lateral stress of 7 MPa and 10 MPa were completed.

3. Test Results of Rock Fracture Considering the Lateral Stress

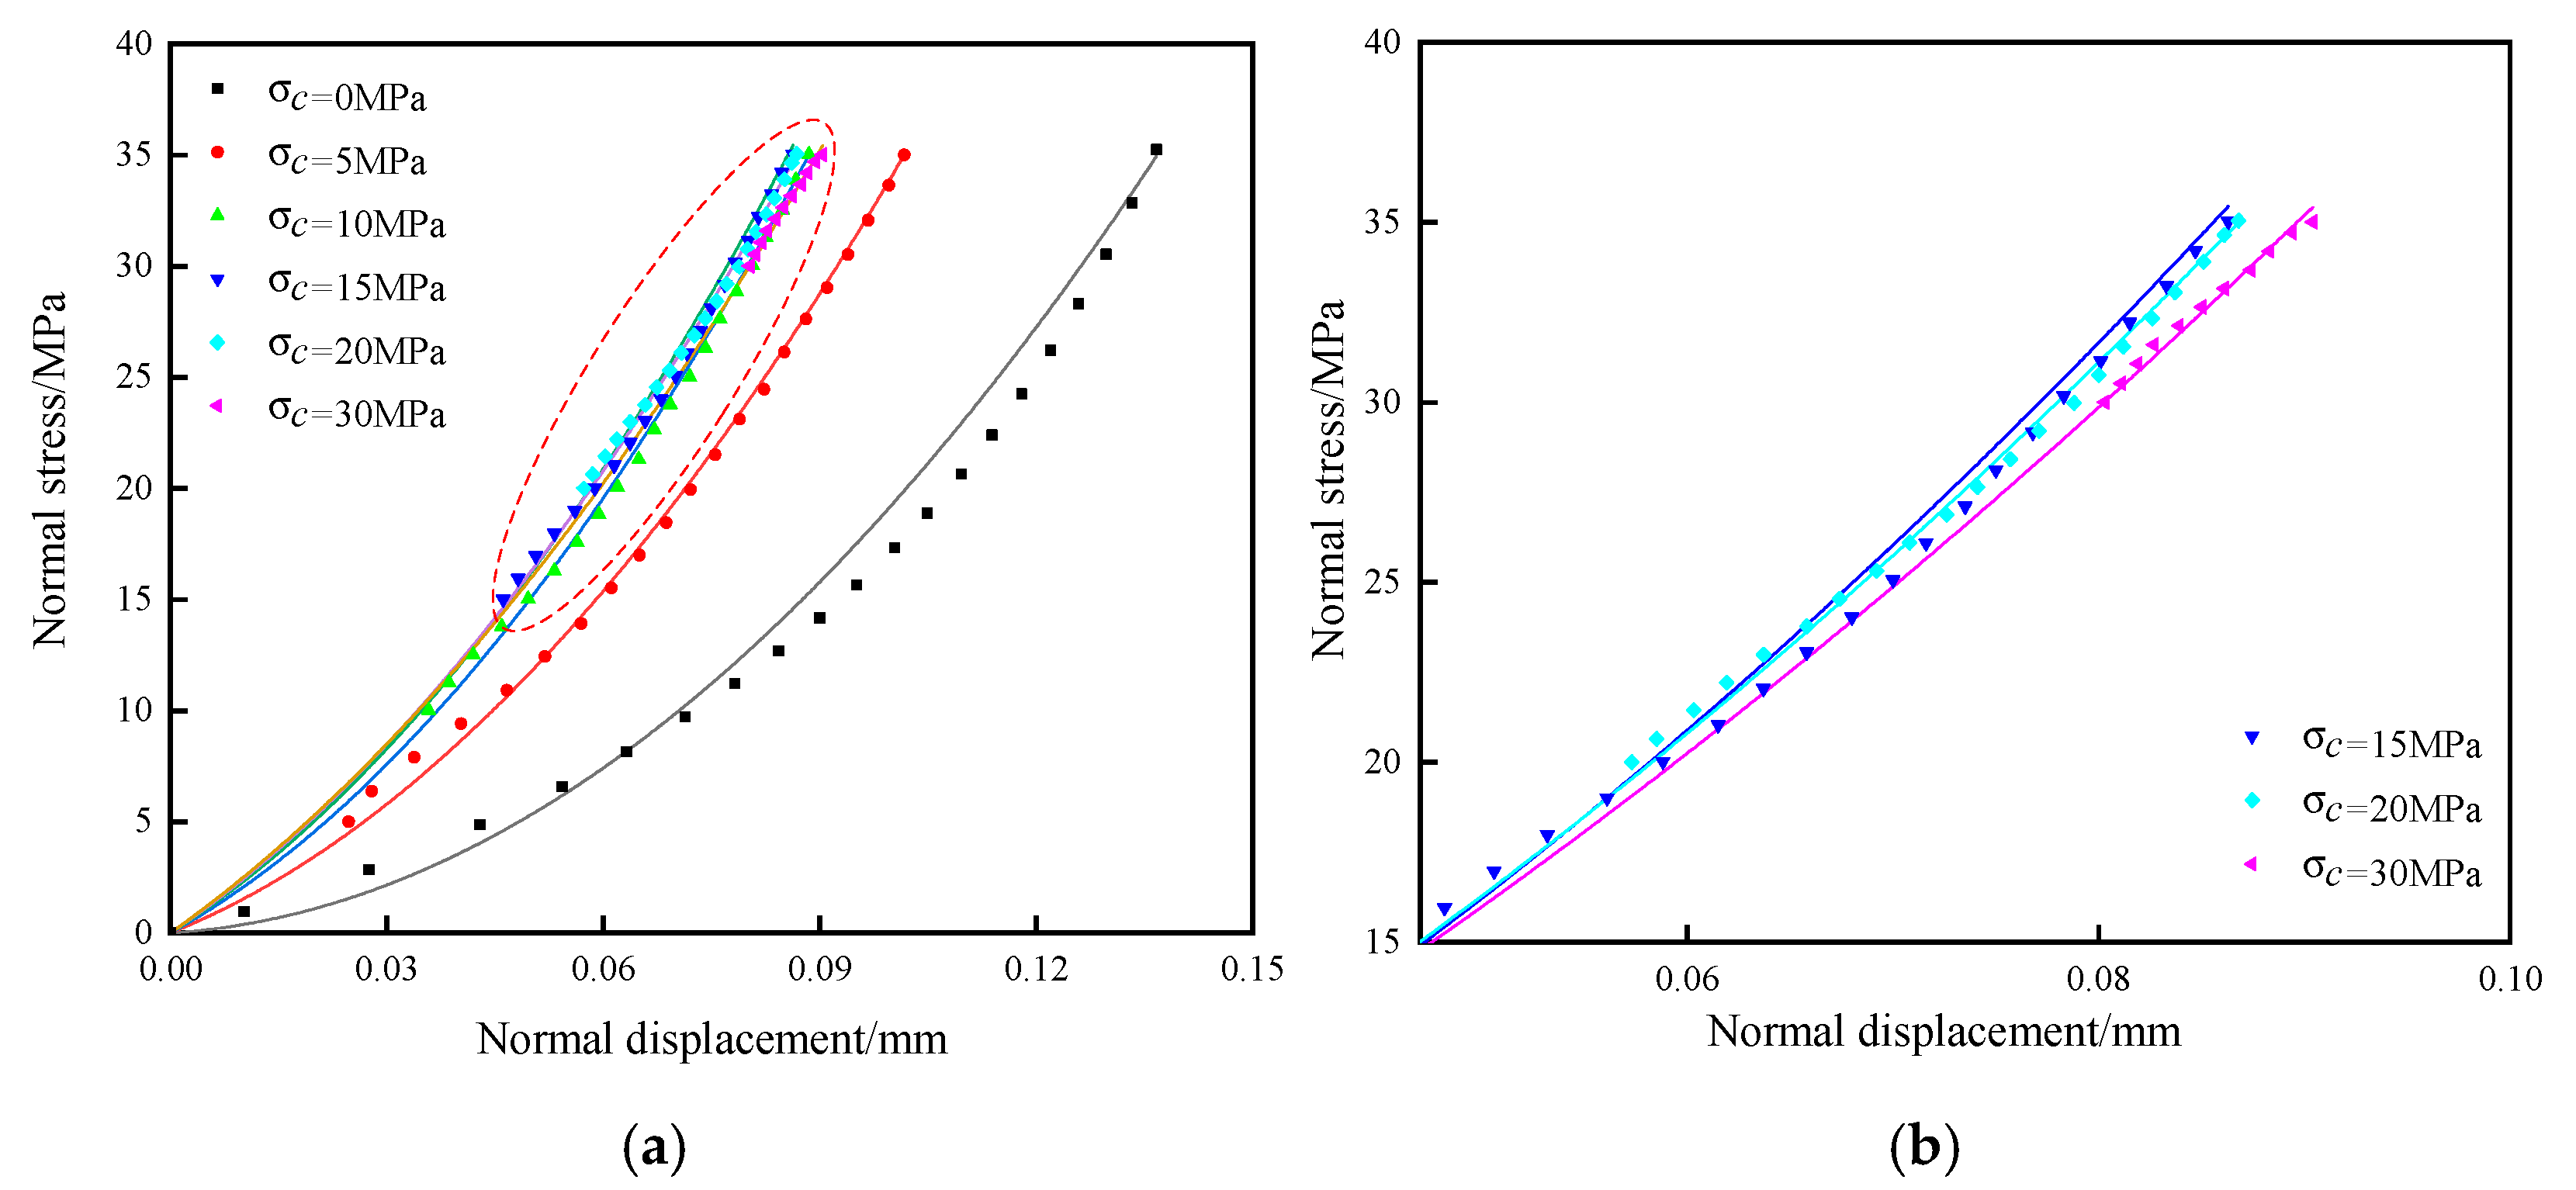
3.1. Normal Compression Test Result

Figure 8a shows the normal loading and unloading stress versus the normal displacement curves of rock fractures under different lateral stresses. The total normal stress was controlled as 35 Mpa, and the closed loop of cyclic loading and unloading curves became smaller with the increased lateral stresses. Figure 8b shows the amplified loading process curve of different cases. It can be found that the normal displacement decreases with the increase of lateral stresses, whereas the normal stiffness of the rock fracture increases with the increase of lateral stress.

3.2. Shear Test Result

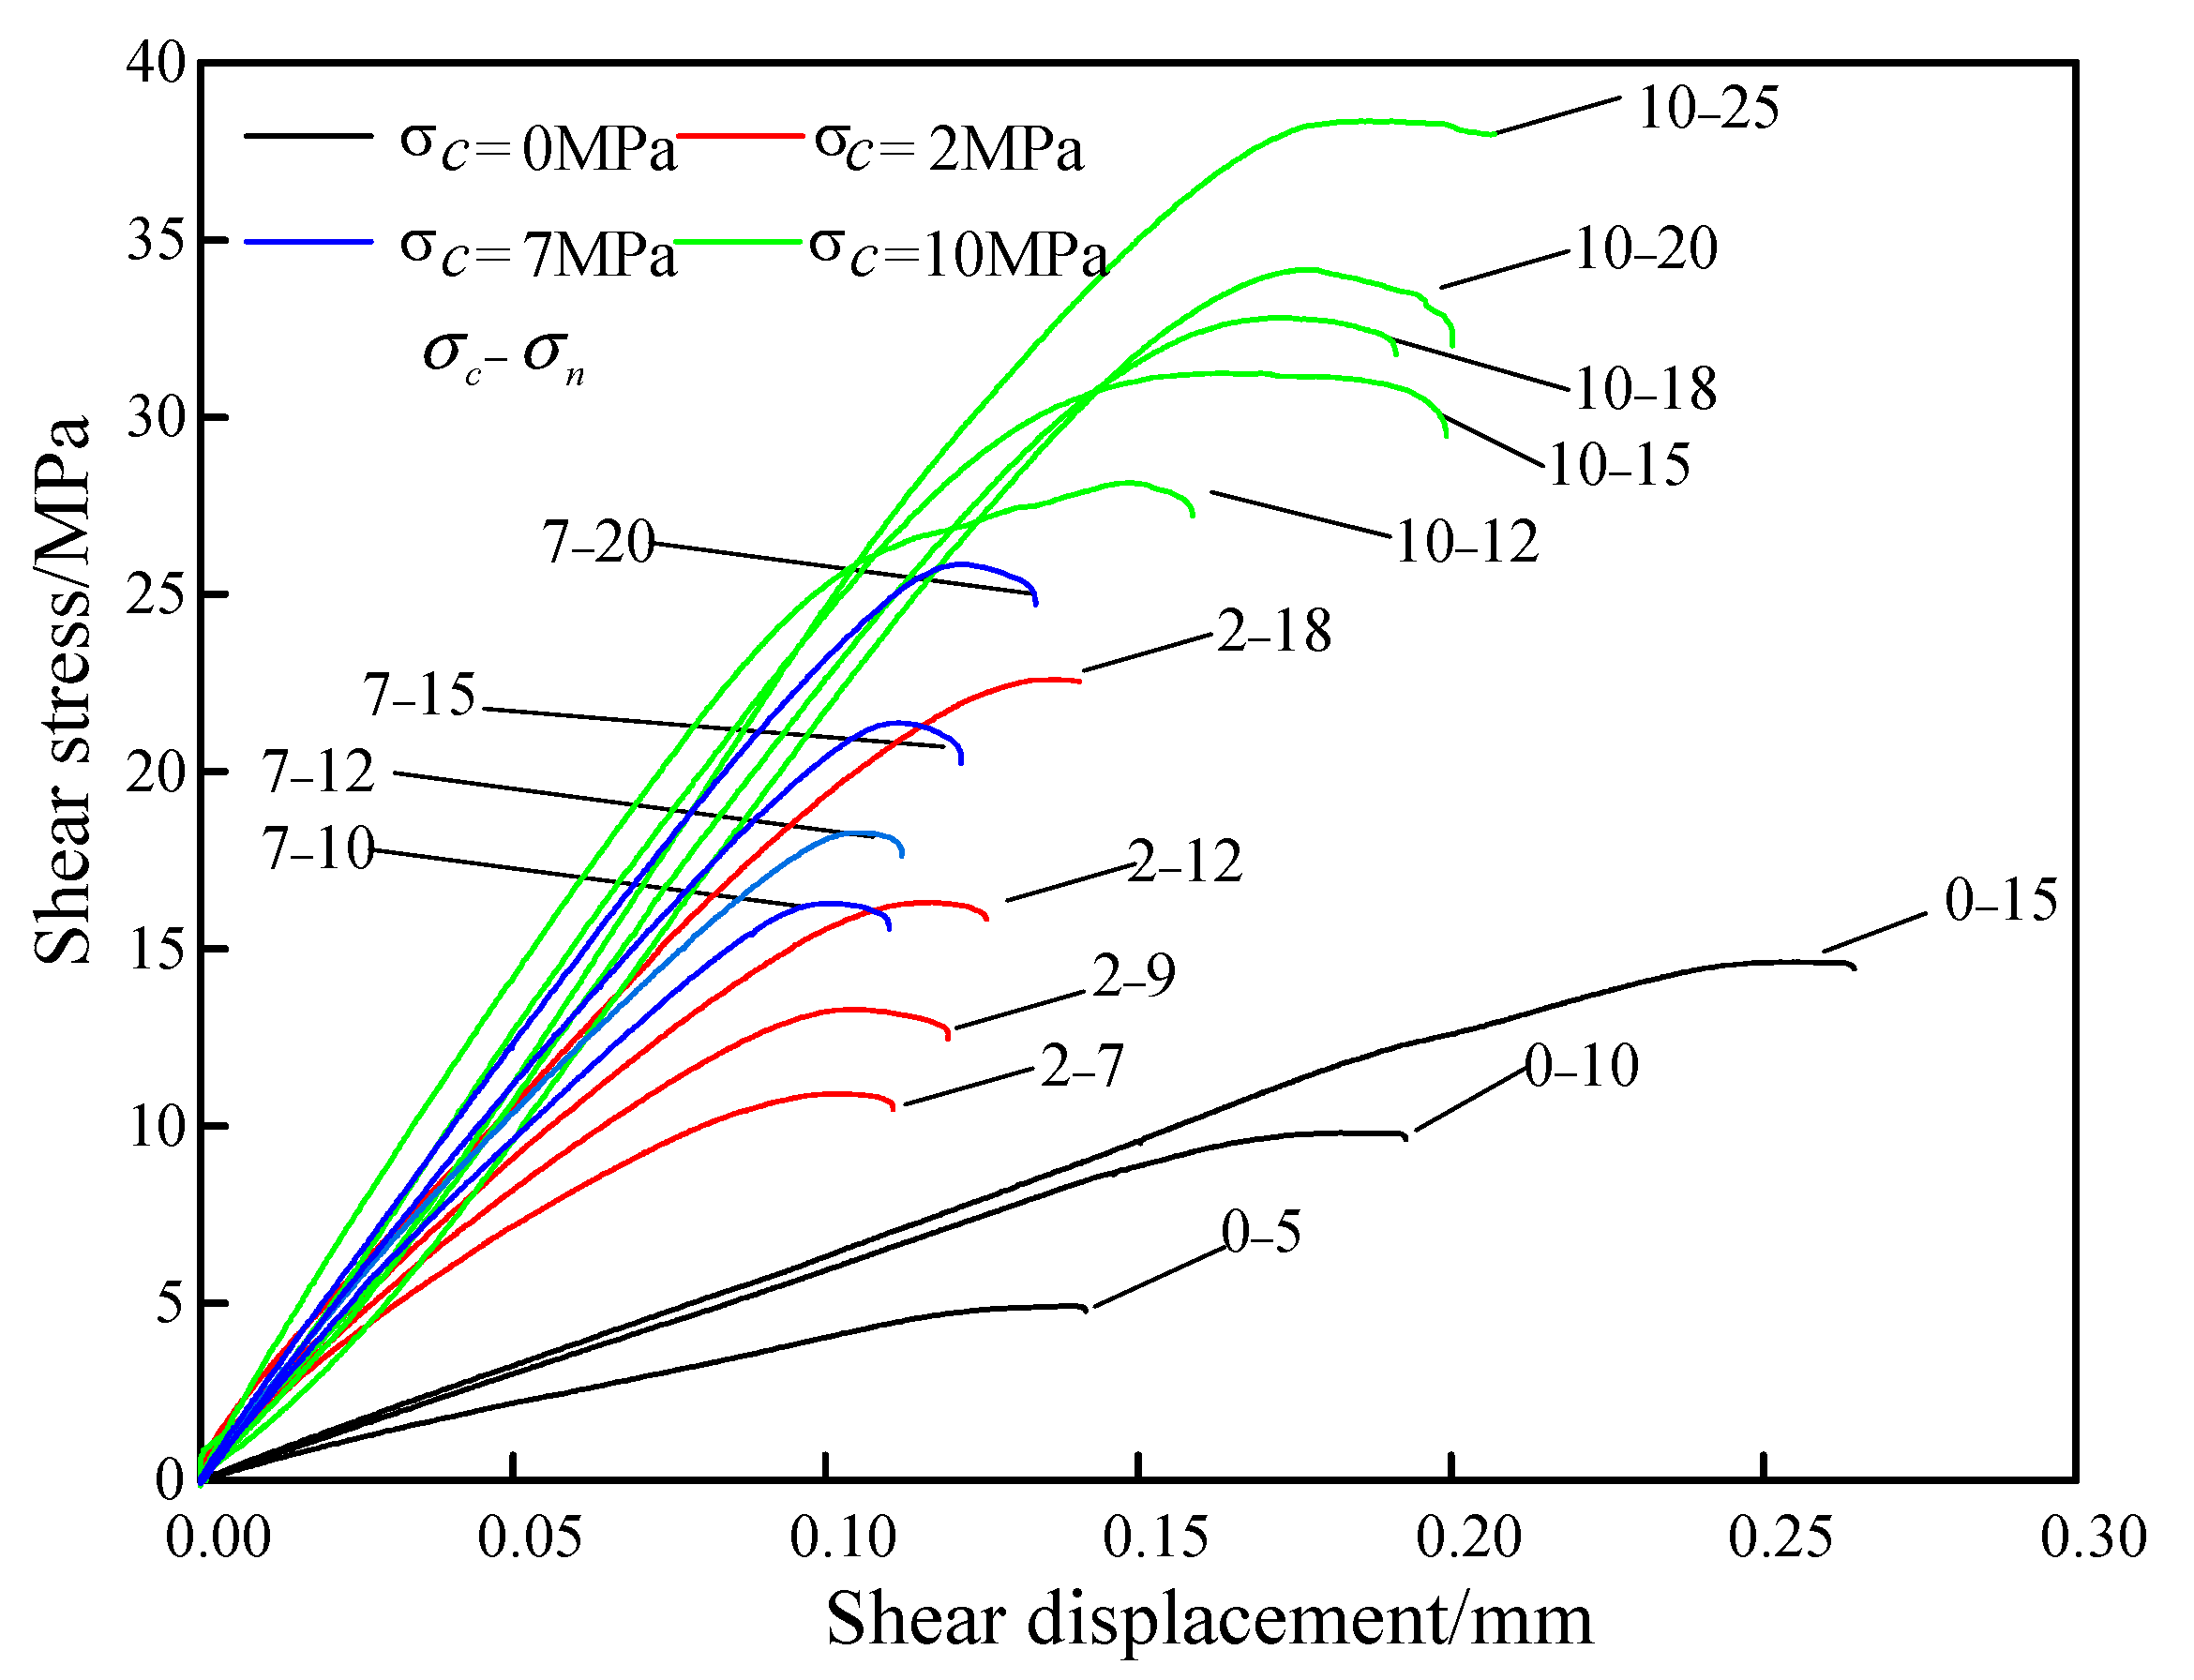
3.2.1. Shear Stress and Displacement Result

Figure 9 shows the shear stress versus shear displacement curves of rock fractures under different lateral stresses. In Figure 9, the curves with the same color represent the test results of the same lateral stress, which is labeled by the left numbers as 0, 2, 7, and 10, respectively, whereas the right numbers represent the different normal stresses with the same lateral stress. It can be found that under the same lateral stress, the shear strength of rock fractures increases with the increase of normal stress, as well as the peak shear displacement.
The shear strength and peak shear displacement under different cases are listed in Table 4. Taking the normal stress of 15 MPa as an example, under the lateral stress of 0, 7, and 10 Mpa, the shear strengths are 14.609, 21.371, and 31.154 Mpa, respectively. Therefore, it can be found that under the same normal stress, the shear strength follows the tendency of increasing with the lateral stress. Under the lateral stress of 2 Mpa, there was no test case of normal stress of 15 Mpa, but from the test result tendency, it can be seen that it follows the above change tendency. For the peak shear displacements, except for the case of lateral stress of 10 Mpa, it can be seen that the peak shear displacements decrease with the increase of lateral stress. The singularities of the peak shear displacement under the lateral stress of 10 Mpa may be caused by the dispersion of the rock fracture specimen.

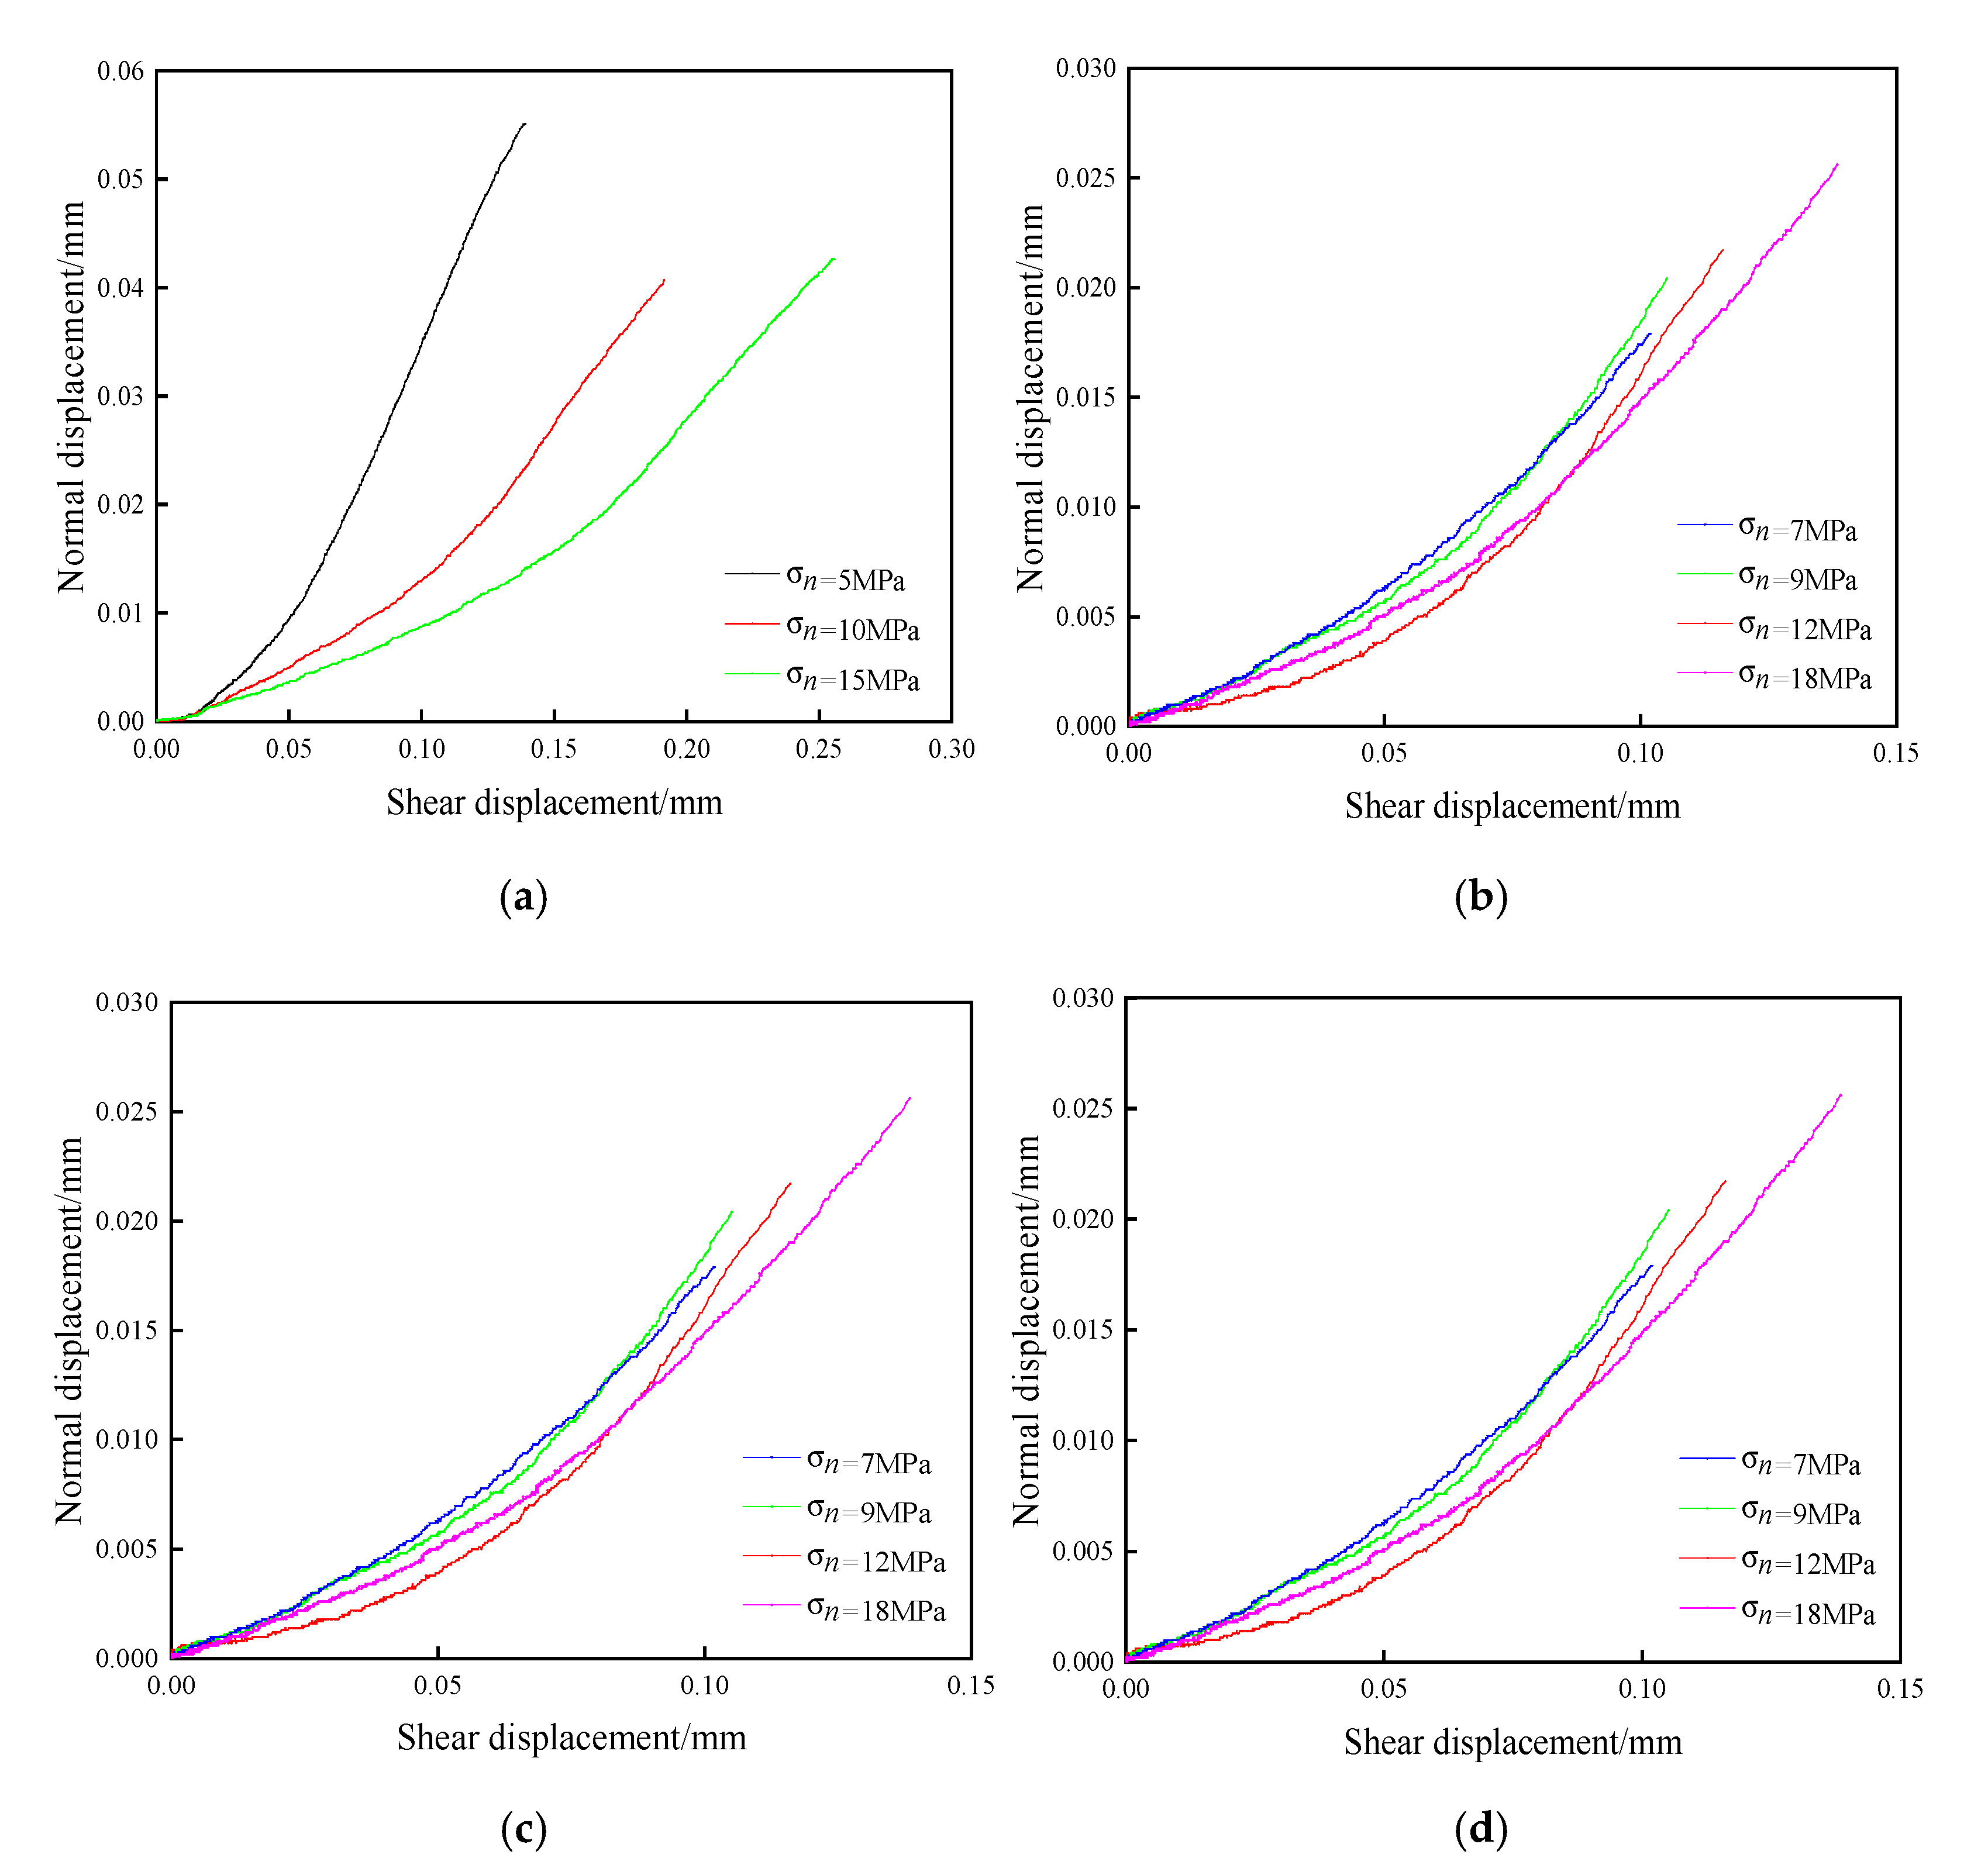
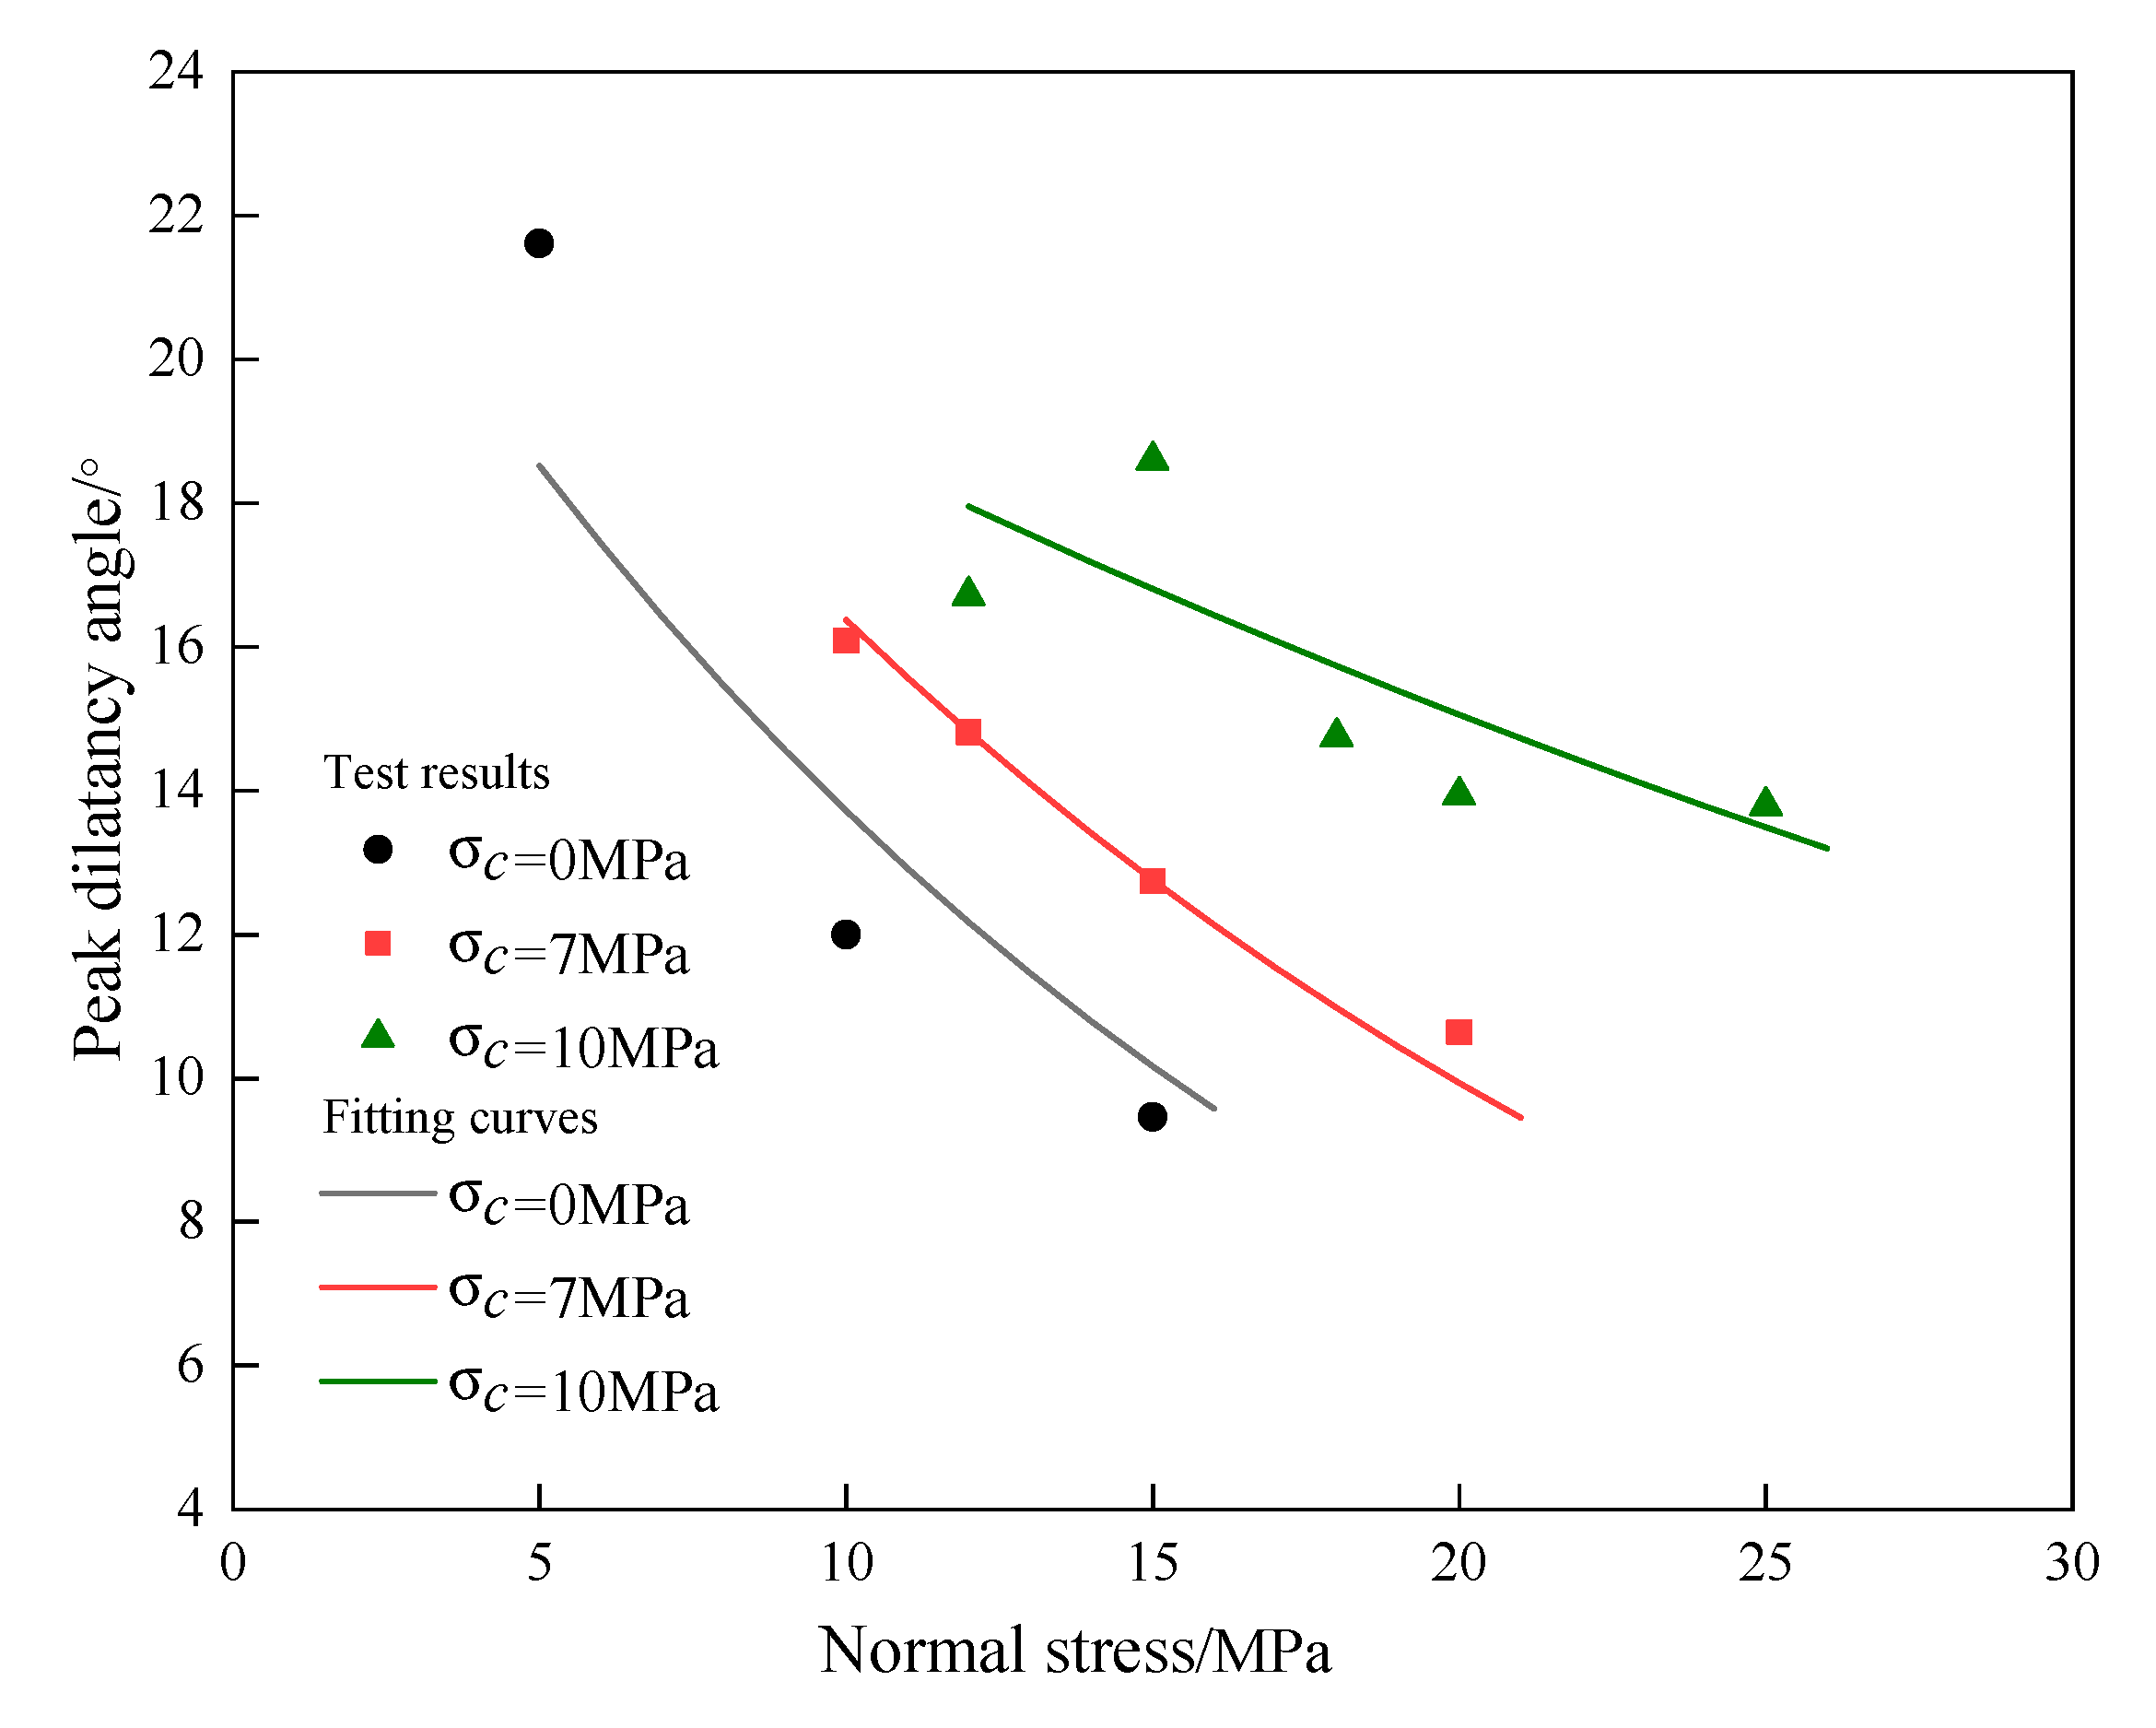
3.2.2. Dilatancy Angle of Rock Fracture

Figure 10 shows the normal displacement versus shear displacement curves of rock fractures under different lateral stresses. The peak dilatancy angles are listed in Table 4. In cases 2 and 4, for the second case with different normal stresses, the dilatancy angle shows an increasing tendency with the increasing normal stress. Except for the two above cases, it can be found that under the same lateral stress, the dilatancy angle follows the tendency of decreasing with the increasing normal stress. This is because when the lateral stress is applied, along with the shear process and the increase in lateral stress, the rock fracture will climb and produce normal displacement, that is, shear dilatancy.

4. Normal Loading and Shear Strength Model of Rock Fracture Considering the Lateral Stress

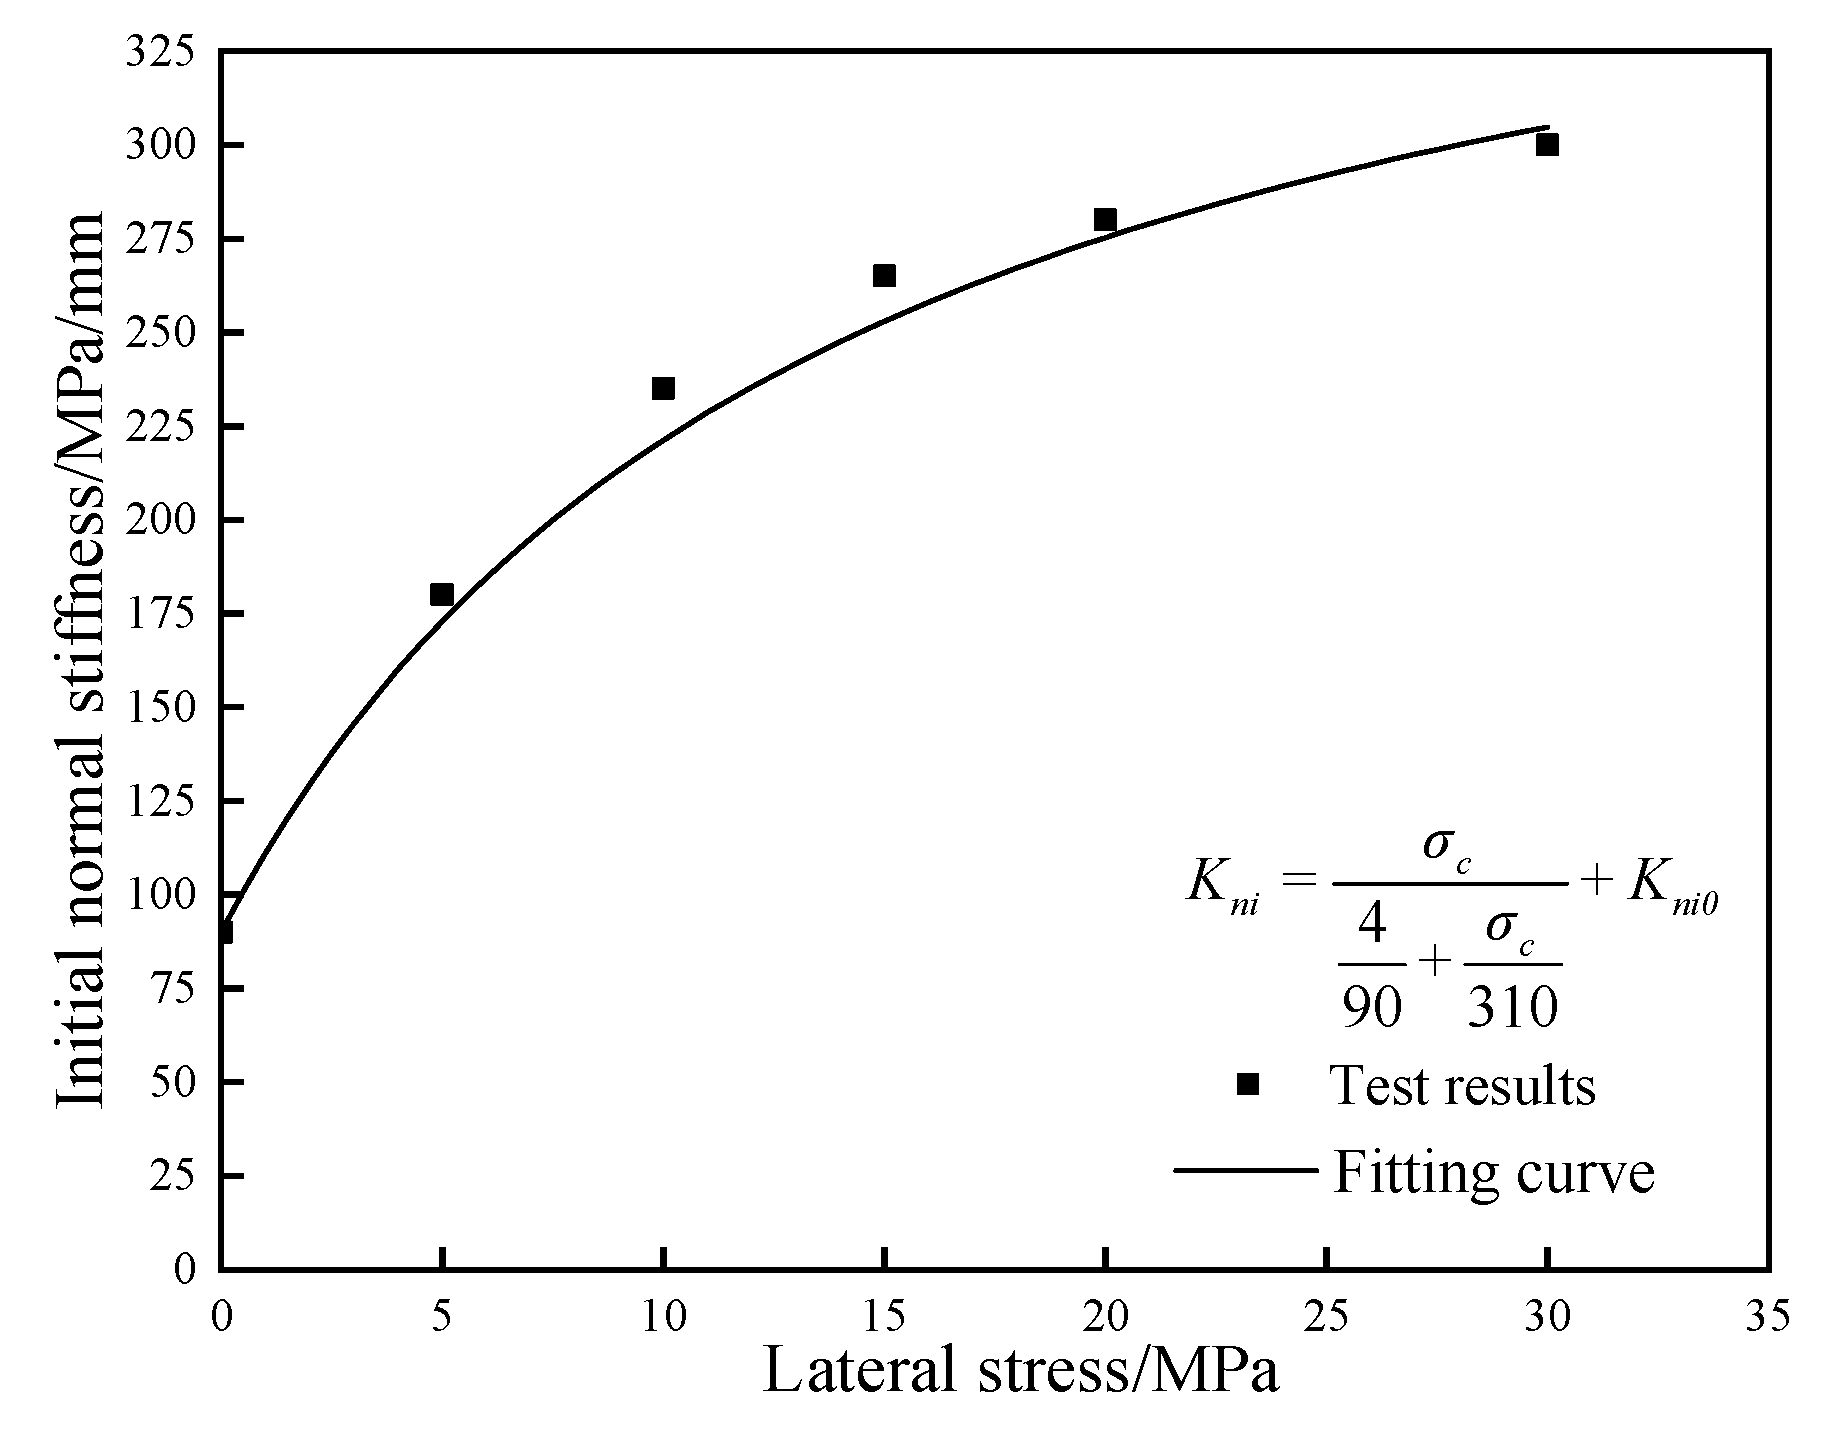
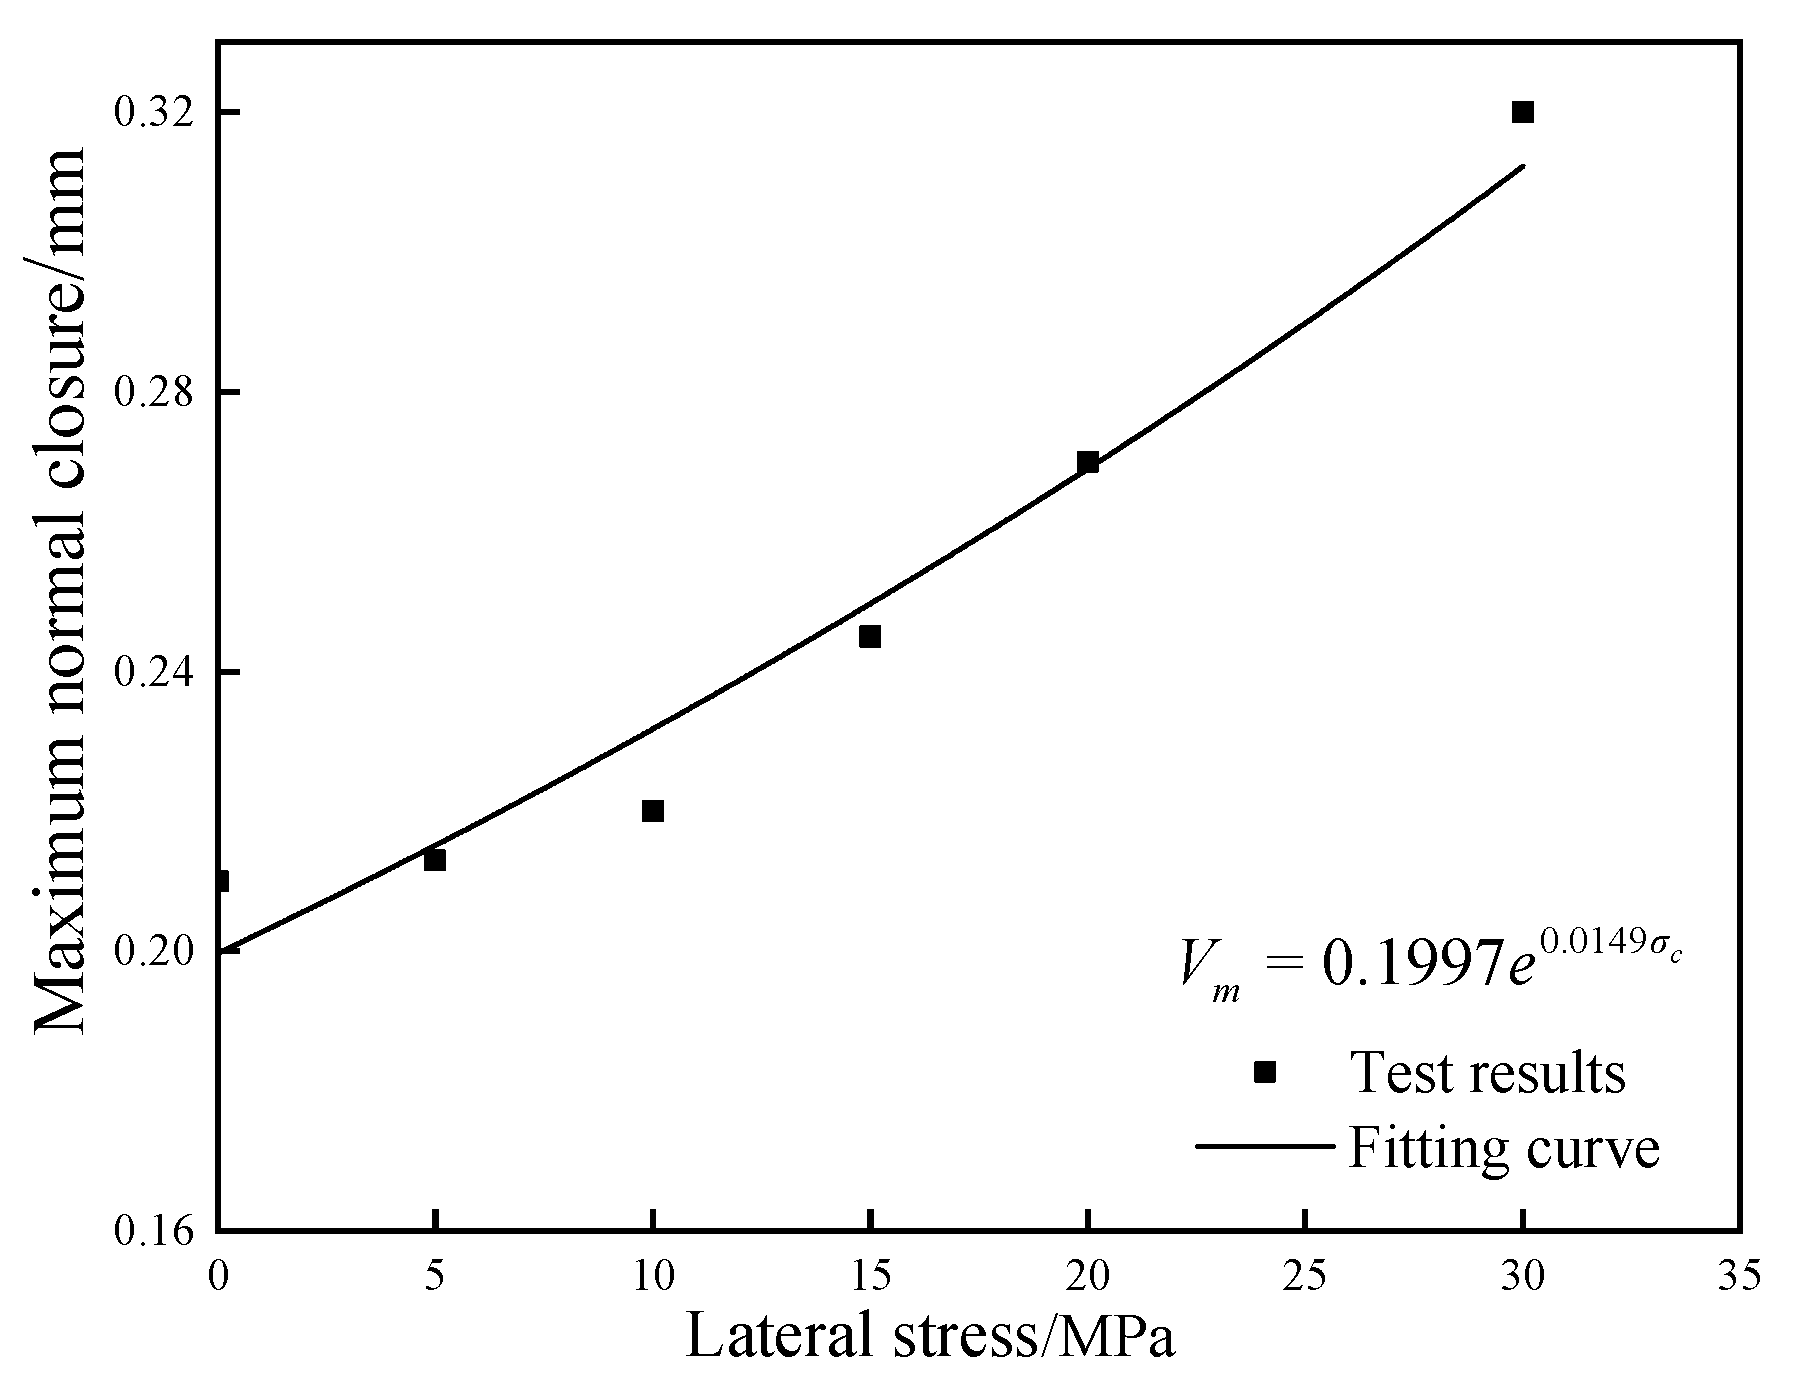
4.1. Normal Loading Model of Rock Fracture

Bandis et al. [1] carried out a series of normal loading tests of rock fractures, studied the nonlinear relationships between normal stress and normal displacement of rock fractures, and proposed the following normal loading constitutive relation of rock fractures:
σ n = K n i V 1 - V V m
where, σ n is the normal stress, K n i is the initial normal stiffness, V is the normal closure of rock fracture, and V m is the maximum normal closure of rock fracture.
The normal loading test results under different lateral stresses were fitted by Equation (3). The fitting results are shown in Figure 11, and the parameters are listed in Table 5. It can be seen that the initial normal stiffness increases quickly with the increase of lateral stress at first, and the initial normal stiffness with the lateral stress of 5 Mpa is twice as much as that of 0 Mpa. When the lateral stresses increase from 10 to 30 Mpa, the initial normal stiffnesses are 2.61, 2.94, 3.11, and 3.33 times that without lateral stress, respectively. On the contrary, the maximum normal closure increases slowly with the increase of lateral stresses at first, and the maximum normal closure with the lateral stress of 5 Mpa is only 0.003 mm larger than that of 0 Mpa. When the lateral stresses increase from 10 to 30 Mpa, the maximum normal closures are 0.01, 0.035, 0.06, and 0.11 mm larger than that without lateral stress, respectively.
By analyzing the relationship between the initial normal stiffness, the maximum normal closure of rock fracture and the lateral stress, the relationship expressions of the initial normal stiffness and the maximum normal closure considering the lateral stress were obtained. The relationship of the initial normal stiffness and the lateral stress can be expressed as:
K n i = σ c 4 K n i 0 + σ c K n i m + K n i 0
where, K n i 0 is the initial normal stiffness with the lateral stress of 0, σ c is the lateral stress, and K n i m is the maximum initial normal stiffness with different lateral stresses.
The relationship between the maximum normal closure and the lateral stress can be expressed as:
V m = V m 0 e 0.0149 σ c
where, V m 0 is the maximum normal closure of rock fracture with the lateral stress of 0.
The comparison of the test and fitting results of the relationship between the initial normal stiffness and the maximum normal closure versus the lateral stress are shown in Figure 12 and Figure 13, respectively. Owing to the effect of the lateral stress, the hanging and footwall of rock fracture becomes closer, and the normal displacement is further constrained. The initial normal stiffness increases obviously with the increase of lateral stress, whereas the normal closure also increases with the increase of lateral stress. To sum up, the relationship between the normal stress and normal displacement considering the lateral stress can be expressed as follows, substituting Equations (4) and (5) into Equation (3) finally produces Equation (6):
σ n = K n i 0 K n i m 4 + σ c + K n i 0 2 σ c V 4 K n i m + K n i 0 σ c 1 - V V m 0 e 0.0149 σ c

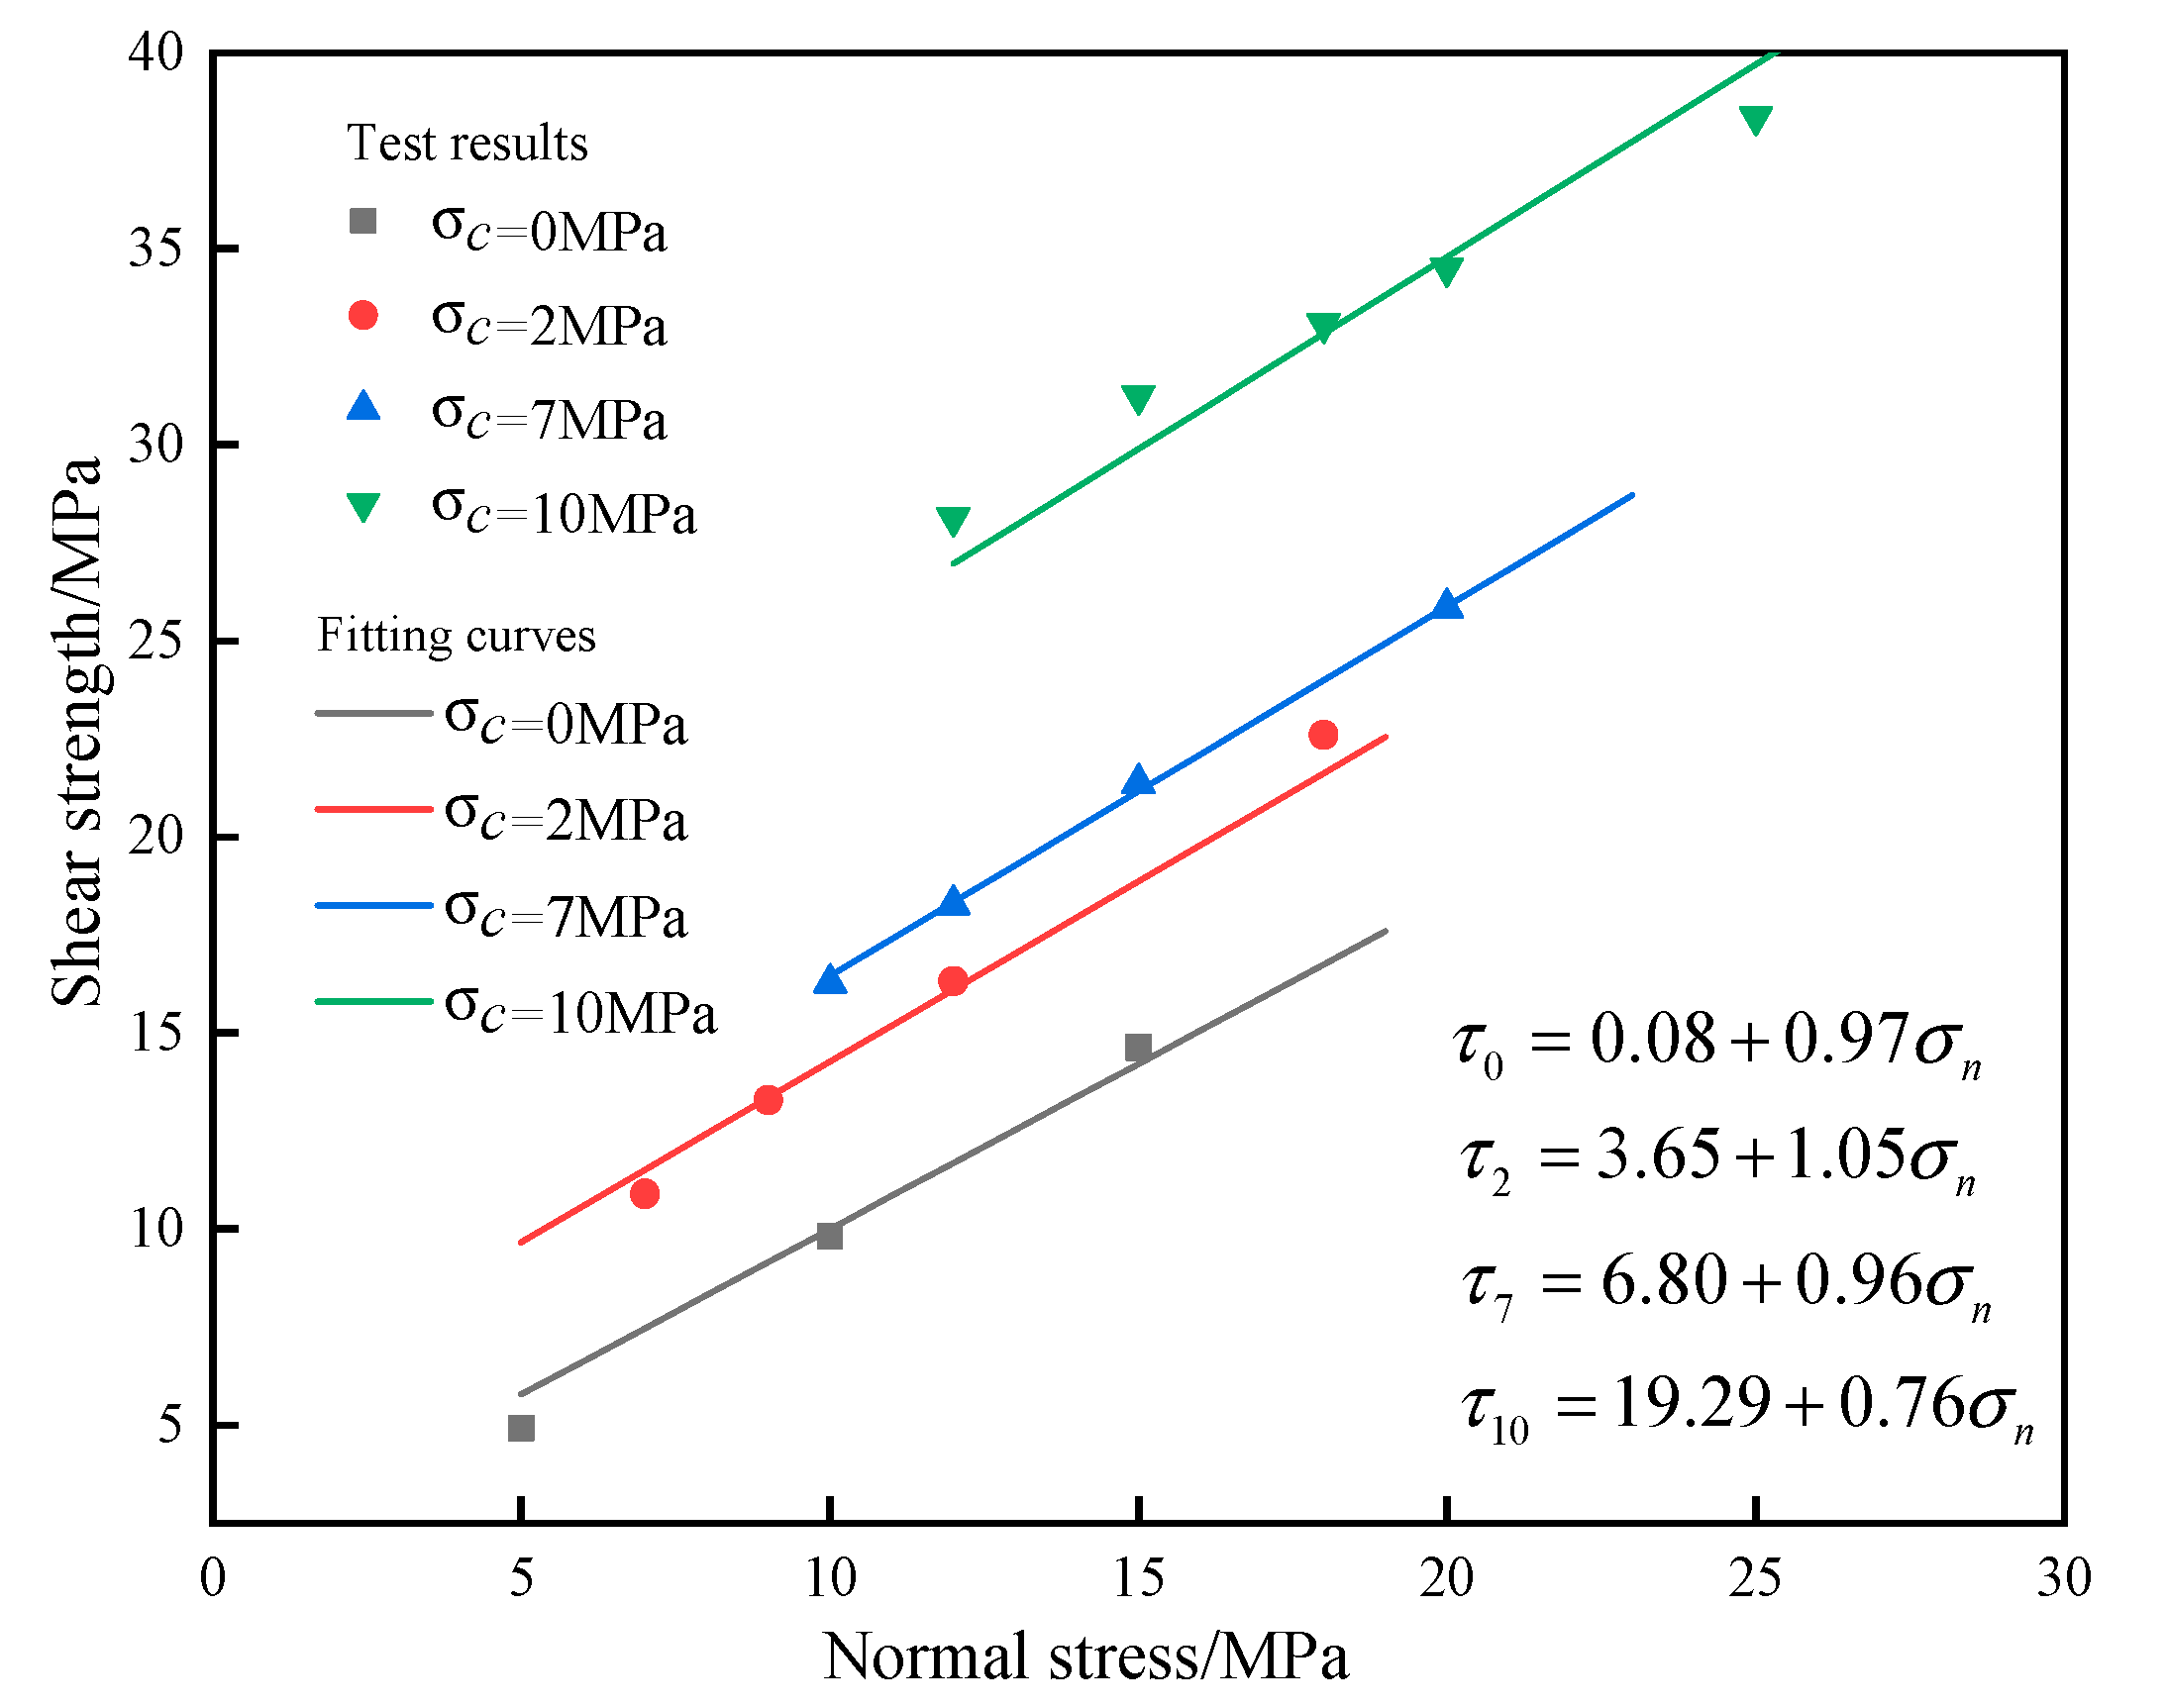
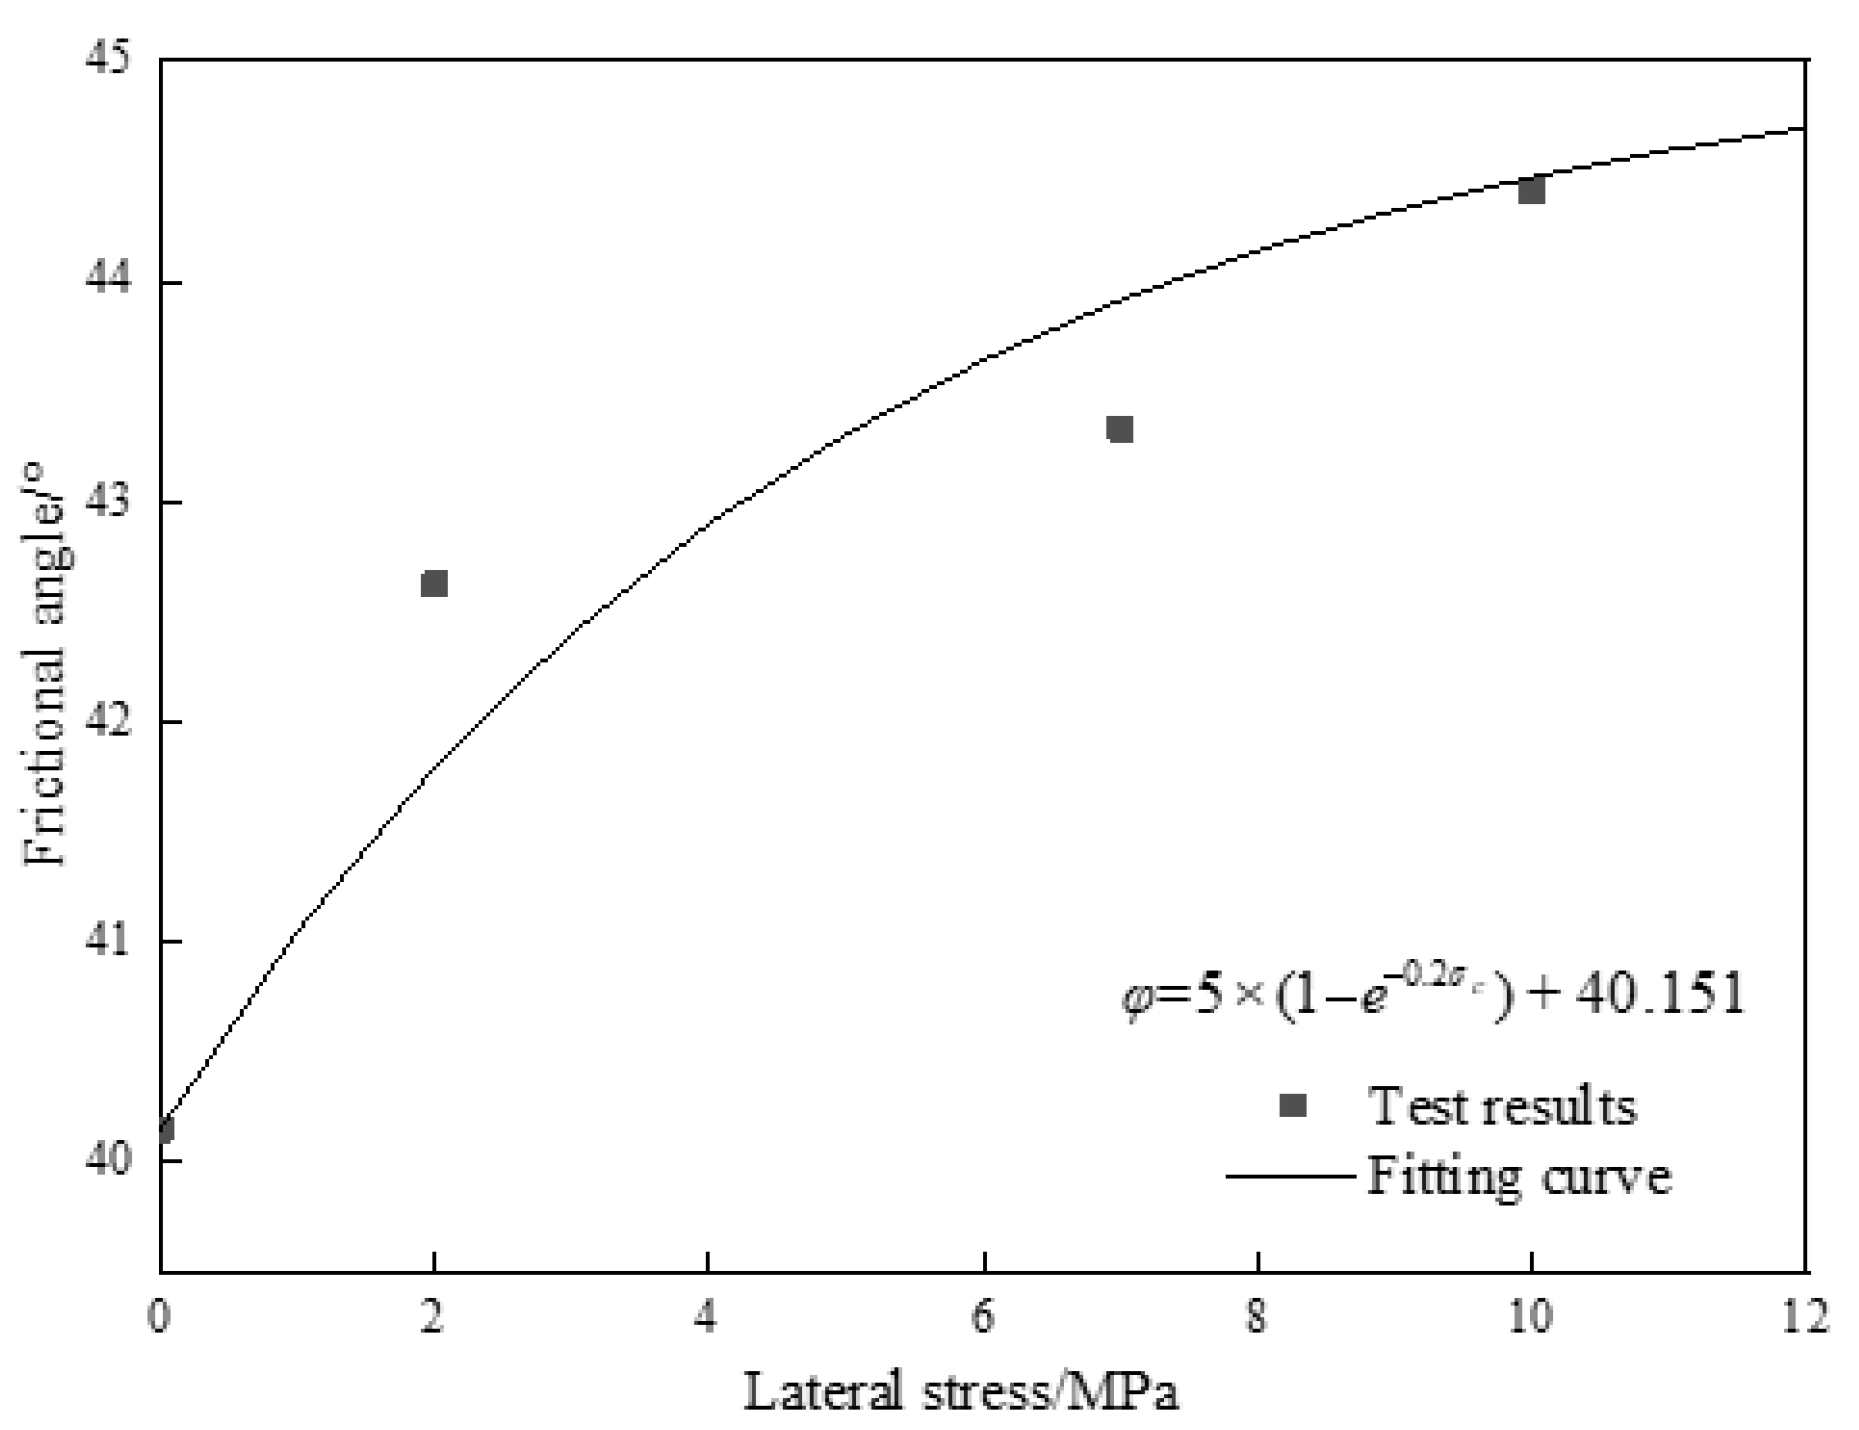
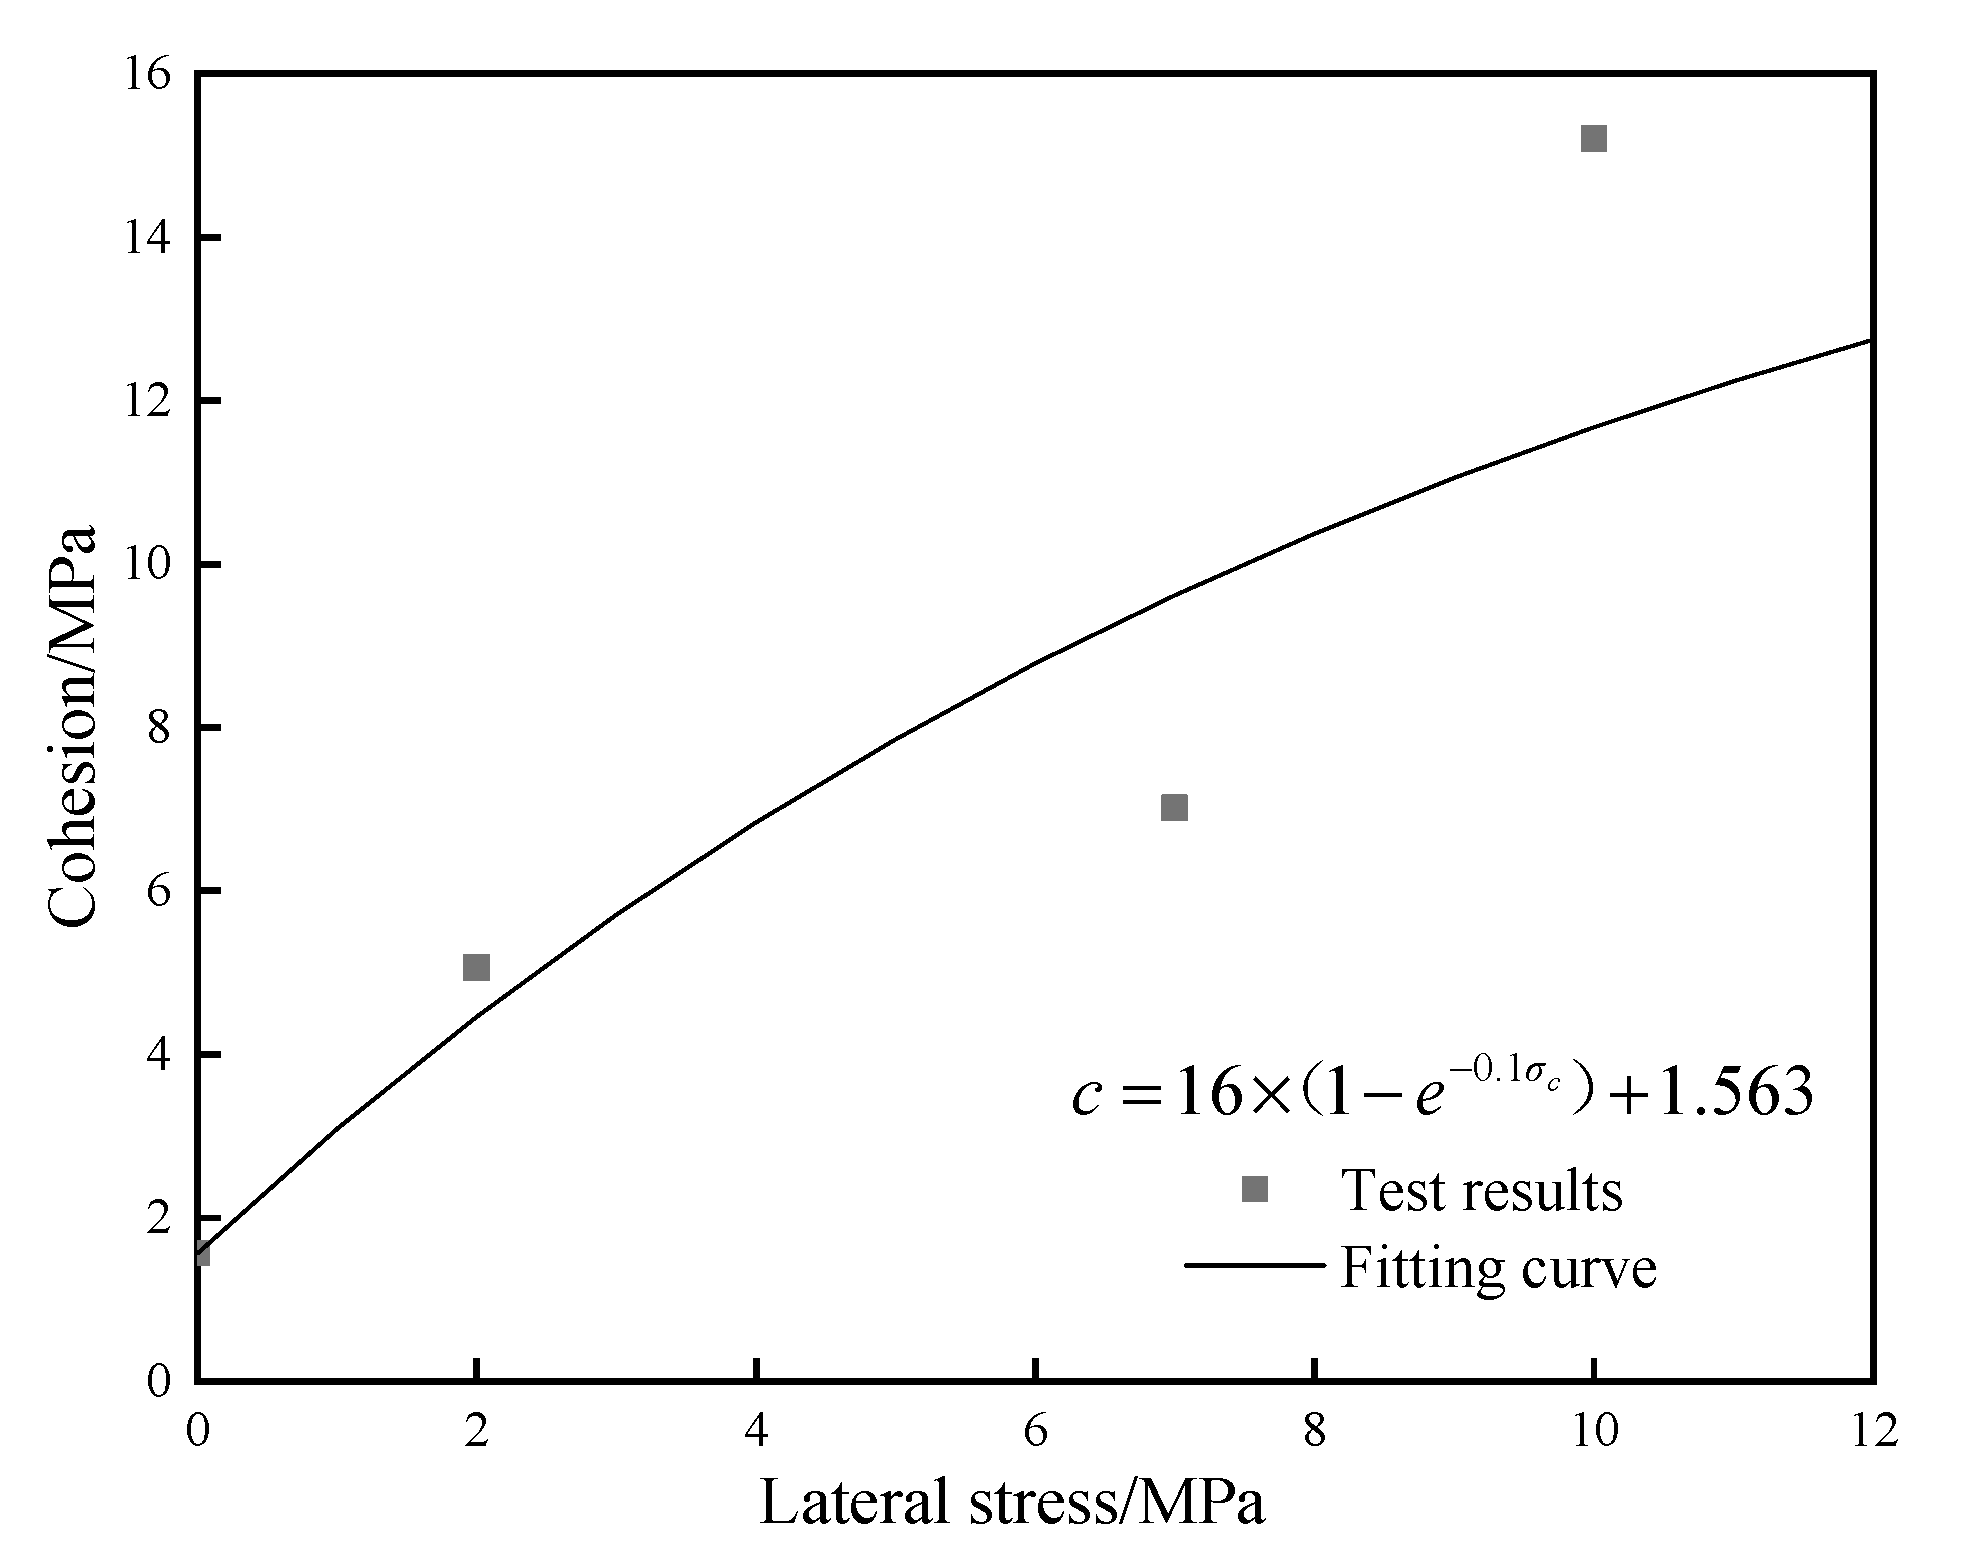
4.2. Peak Shear Strength Model of Rock Fracture

Following the Mohr-Coulomb law, the shear strength versus normal stress curves considering different lateral stress is shown in Figure 14. The point data represent the test results under different cases, and the curves are the fitting results using the Mohr-Coulomb shear strength model as follows:
τ = c + σ n tan φ
where, τ is the shear stress, c is the cohesion, and φ is the friction angle.
The comparison of the test and fitting results of friction angle and cohesion under different lateral stress are shown in Figure 15 and Figure 16, respectively. It can be seen that the friction angle and cohesion increase with the increase of lateral stress. The following expressions are used to fit the test results of friction angle and cohesion, respectively:
φ = φ m - φ 0 × ( 1 - e - A σ c ) + φ 0
c = c m - c 0 × ( 1 - e - B σ c ) + c 0
where, φ m and c m are the maximum friction angle and cohesion considering the lateral stress, φ 0 and c 0 are the friction angle and cohesion with the lateral stress of 0, and A and B are constant parameters.
In Equations (8) and (9), when there is no lateral stress, φ = φ 0 , c = c 0 . On the other hand, when the lateral stress increases and the exponential term becomes 0, the friction angle and cohesion reach the maximum φ m and c m , respectively.
The relationship between the friction angle and lateral stress can be expressed as:
φ = 5 × ( 1 e 0.2 σ c ) + 40.151
and the relationship between the cohesion and lateral stress can be expressed as:
c = 16 × ( 1 e 0.1 σ c ) + 1.563

4.3. Peak Shear Dilatancy Model

Schneider [29] proposed the peak dilatancy angle model as follows:
i p = i p 0 e - k 3 σ n
where, i P is the dilatancy angle, i P 0 is the initial dilatancy angle, and k 3 is the fitting parameter.
Based on the above peak dilatancy angle model, except for the lateral stress of 2 Mpa, the test and fitting results of peak dilatancy angle under different lateral stresses are shown in Figure 17. It can be seen that under the constant lateral stress, the peak shear dilatancy angle decreases with the increase of normal stress, and under the constant normal stress the peak shear dilatancy angle increases with the increase of lateral stress. The functional expression of the peak dilatancy angle and the normal stress under the lateral stresses of 0 Mpa, 7 Mpa, and 10 Mpa are as follows, respectively:
i p = 33.65 e 0.093 σ n ( σ c = 0 ) i p = 24.489 e 0.0423 σ n ( σ c = 7 ) i p = 22.65 e 0.0211 σ n ( σ c = 10 )
With the increase of lateral stress, the initial peak shear dilatancy angle and k 3 decrease, which meets the linear function relationship, as shown in Equations (14) and (15).
i p 0 = 1.23 σ c + 34.3
k 3 = 0.0072 σ c + 0.093
The peak shear dilatancy model considering the lateral stress can be modified as:
i p = ( - 1.23 σ c + i p 0 0 ) e - ( - 0.0072 σ c + k 30 ) σ n
where, i p 0 0 is the initial peak dilatancy angle when the lateral stress is 0 and k 30 is the fitting parameter when the lateral stress is 0.

5. Engineering Application

5.1. Project Overview

The engineering project is an underground water sealed oil storage cavern in South China. Each cavern has a design length of 923 m, a design width of 20 m, and a design height of 30 m. The cross section consists of two straight walls and a vault ceiling. The design distance between two caverns is 40 m. The top of the cavern is 80 m away from the ground, and the buried depth of groundwater level is 12 m.
The fracture geometry parameters obtained from the geological investigation report are listed in Table 6. The fractures in the reservoir area are divided into four groups. Three groups have a steep dip angle and one group has a relatively slow dip angle. The trace lengths of the four groups of fractures range from 29 m to 52 m, and the trace length spacing ranges from 5 m to 10 m.

5.2. Analysis Method

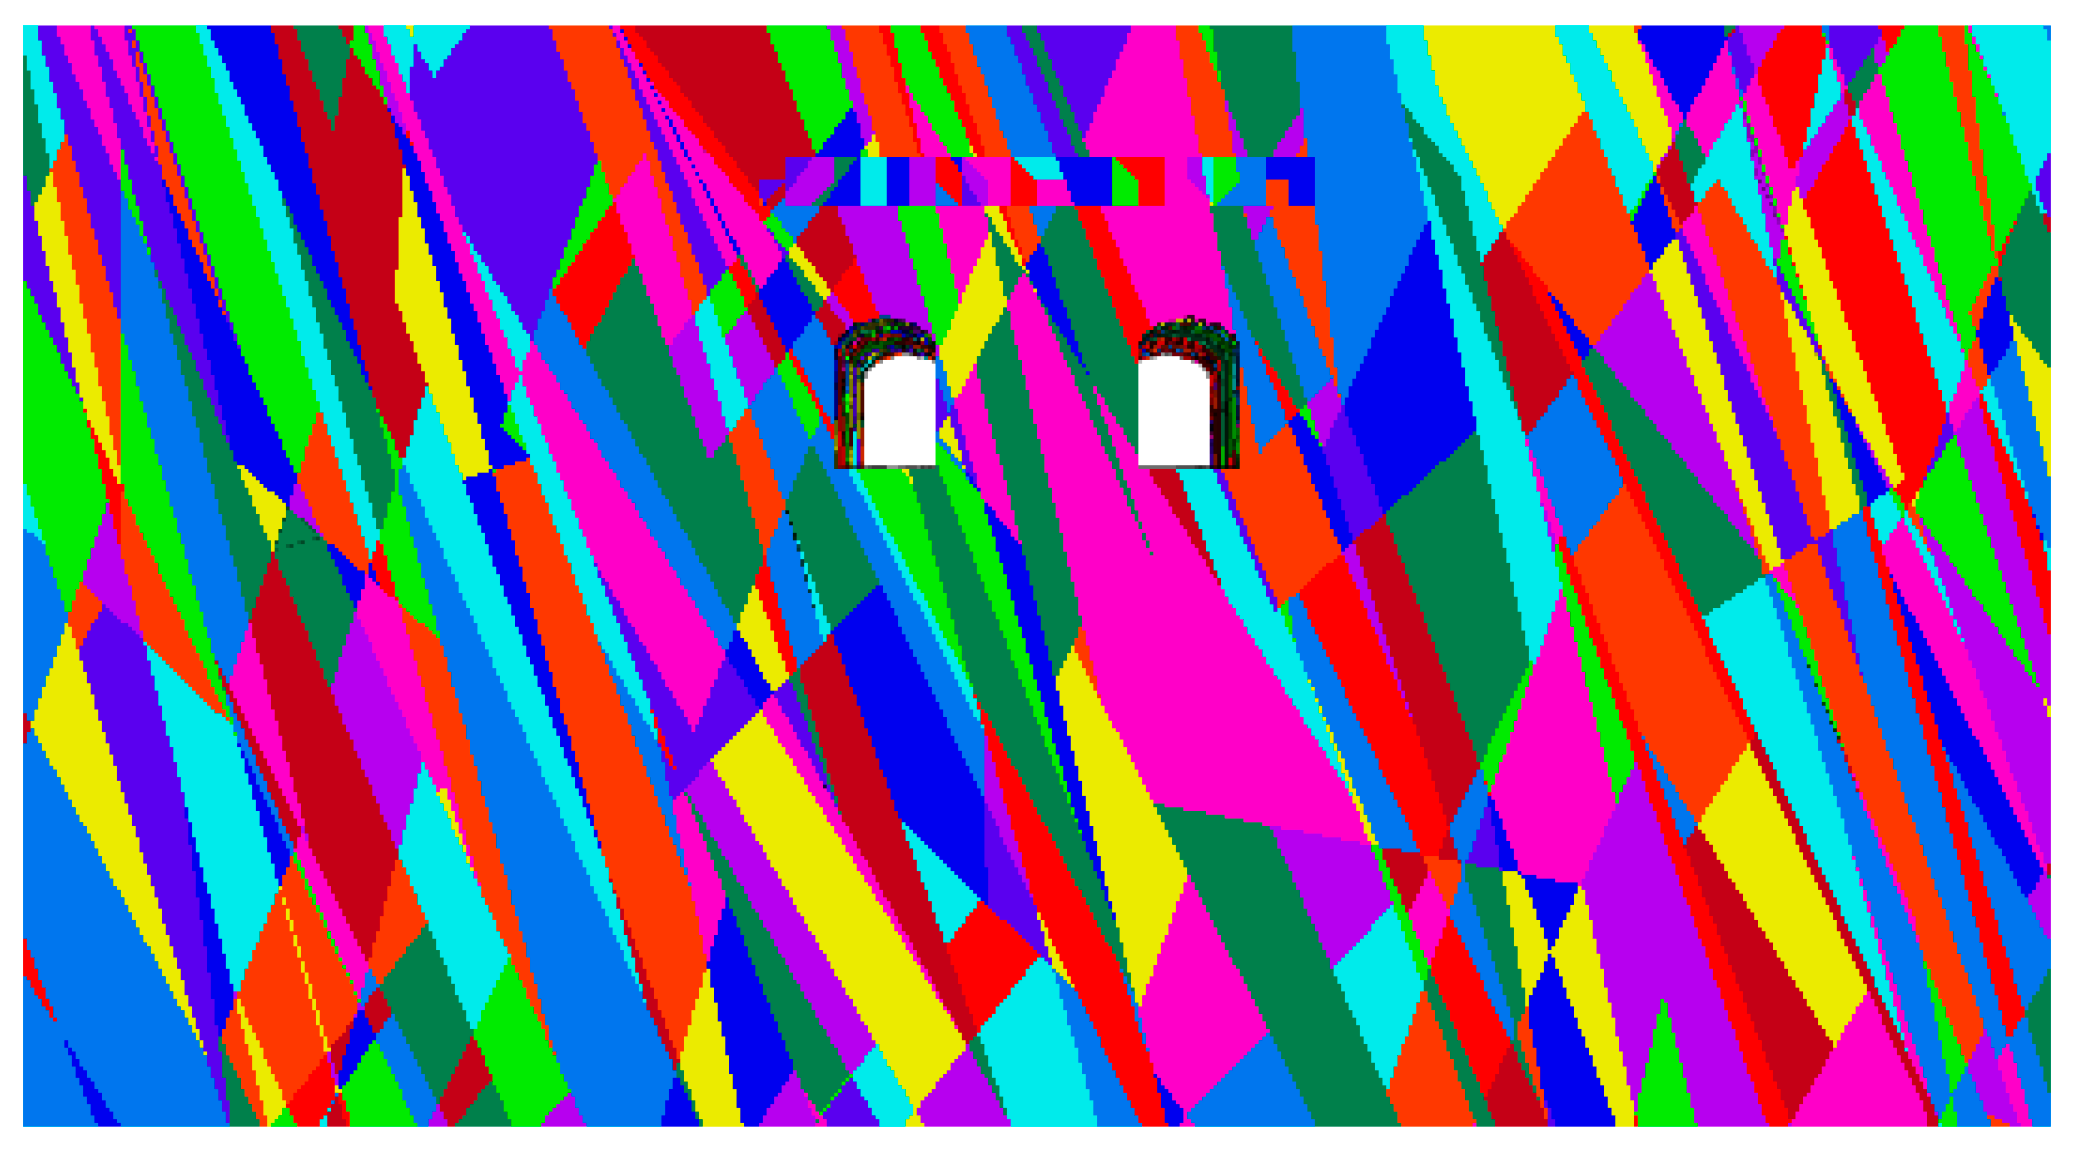
5.2.1. Geometric Model

By using the numerical simulation software 3DEC, the influence of lateral stress on the stability of the surrounding rock of the underground cavern under hydro-mechanical coupling are studied by using the equivalent parameter method. As shown in Figure 18, the left and right boundaries of the geometric model are eight times the excavation width from the side wall of the cavern, and the lower boundary is four times the excavation height from the bottom of the cavern floor. That is, the model length is 400 m and the height is 228 m.

5.2.2. Initial Condition and Parameters

According to the field investigation, the initial geo-stress field was set as the vertical geo-stress Szz, which was 2.89 Mpa at the storage cavern floor, and the ratio of the principal stress in three directions was Sxx:Syy:Szz = 2.5:1.5:1. The upper boundary of the model is the location of groundwater depth, where the flow and hydrostatic pressure are 0, and the stress is 0.601 Mpa. The bottom surface of the model is impermeable. The hydrostatic pressure is applied to the surrounding boundary. The horizontal displacement of the left and right boundary of the model is 0, the vertical displacement of the bottom boundary is 0, and the top of the model is free boundary.
In this study, four cases were carried out to study the effect of lateral stress on the stability of the surrounding rock of the underground cavern. The linear elastic model is adopted in the block constitutive model, and the relevant parameters of the model are given in Table 7. The constitutive model of rock fracture is the Coulomb slip model, and the equivalent parameters of rock fracture under different lateral stresses are given in Table 8. The seepage obeys Cubic law.

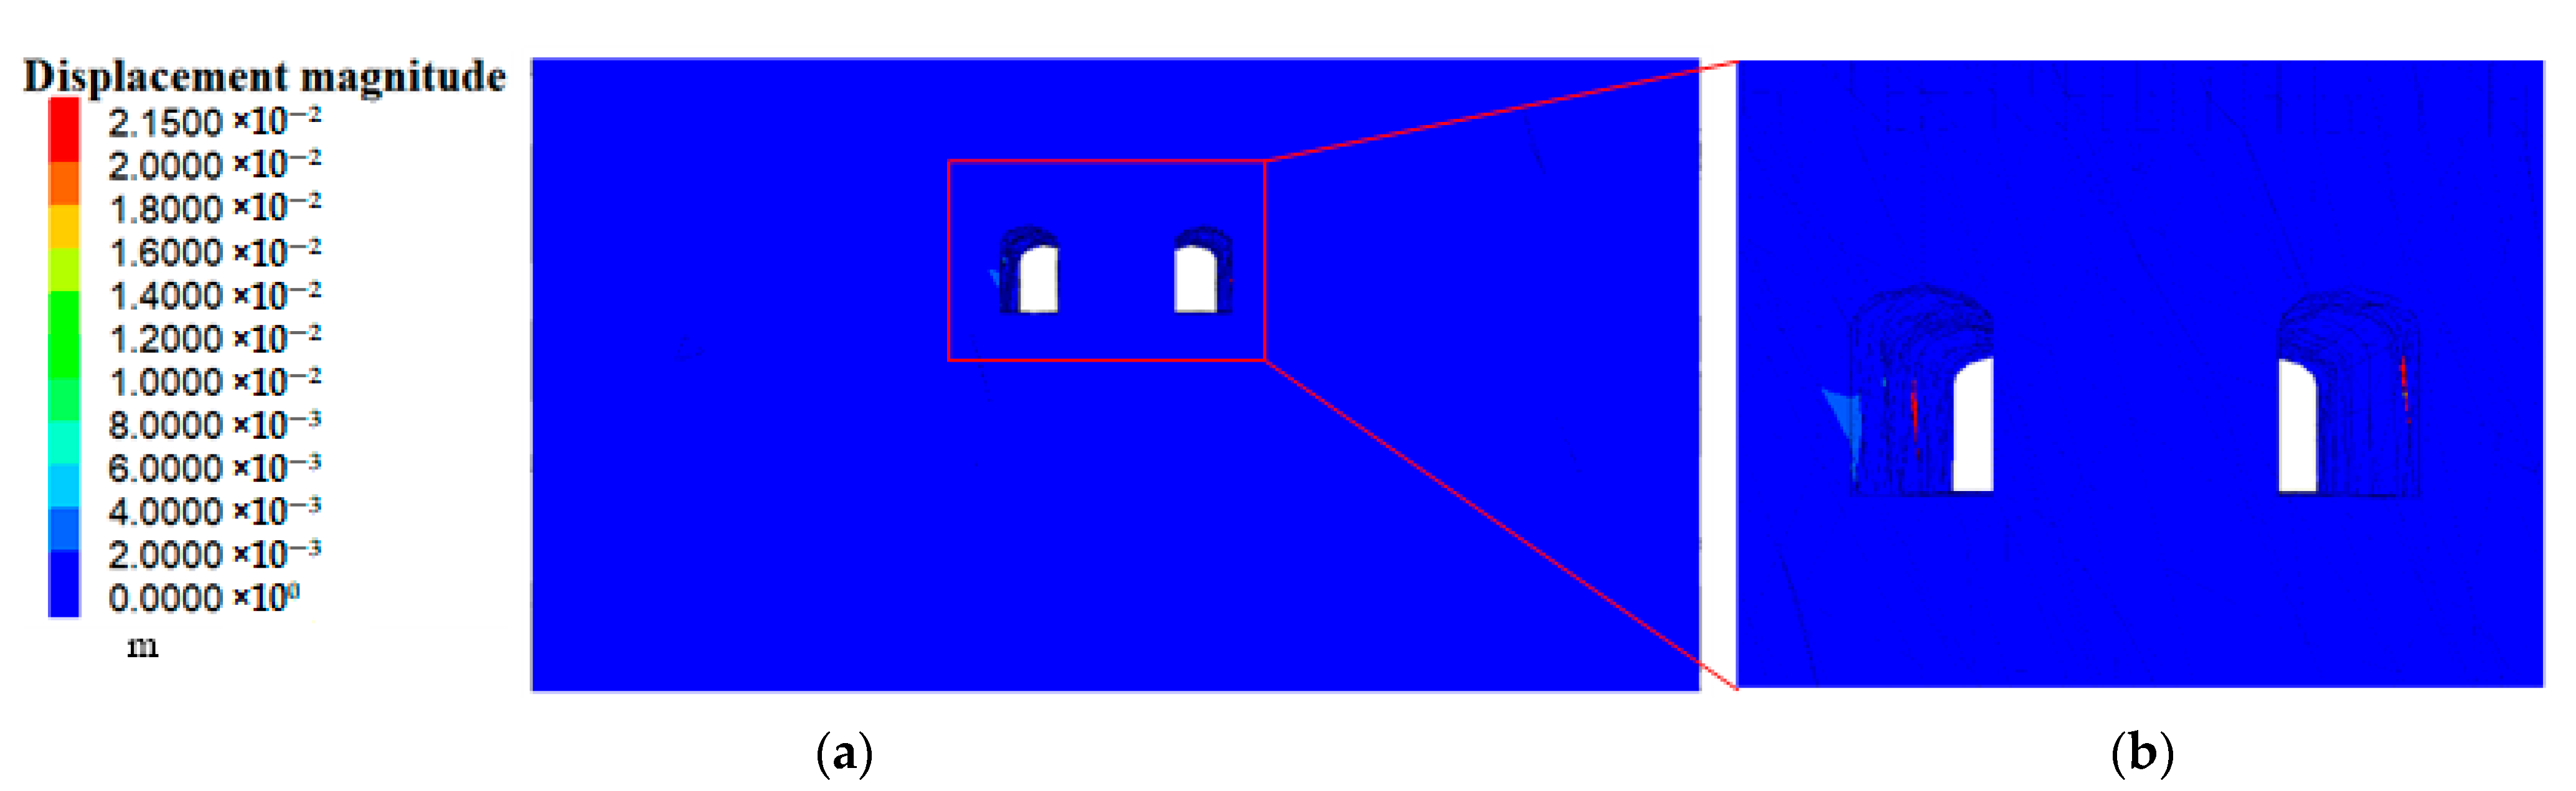
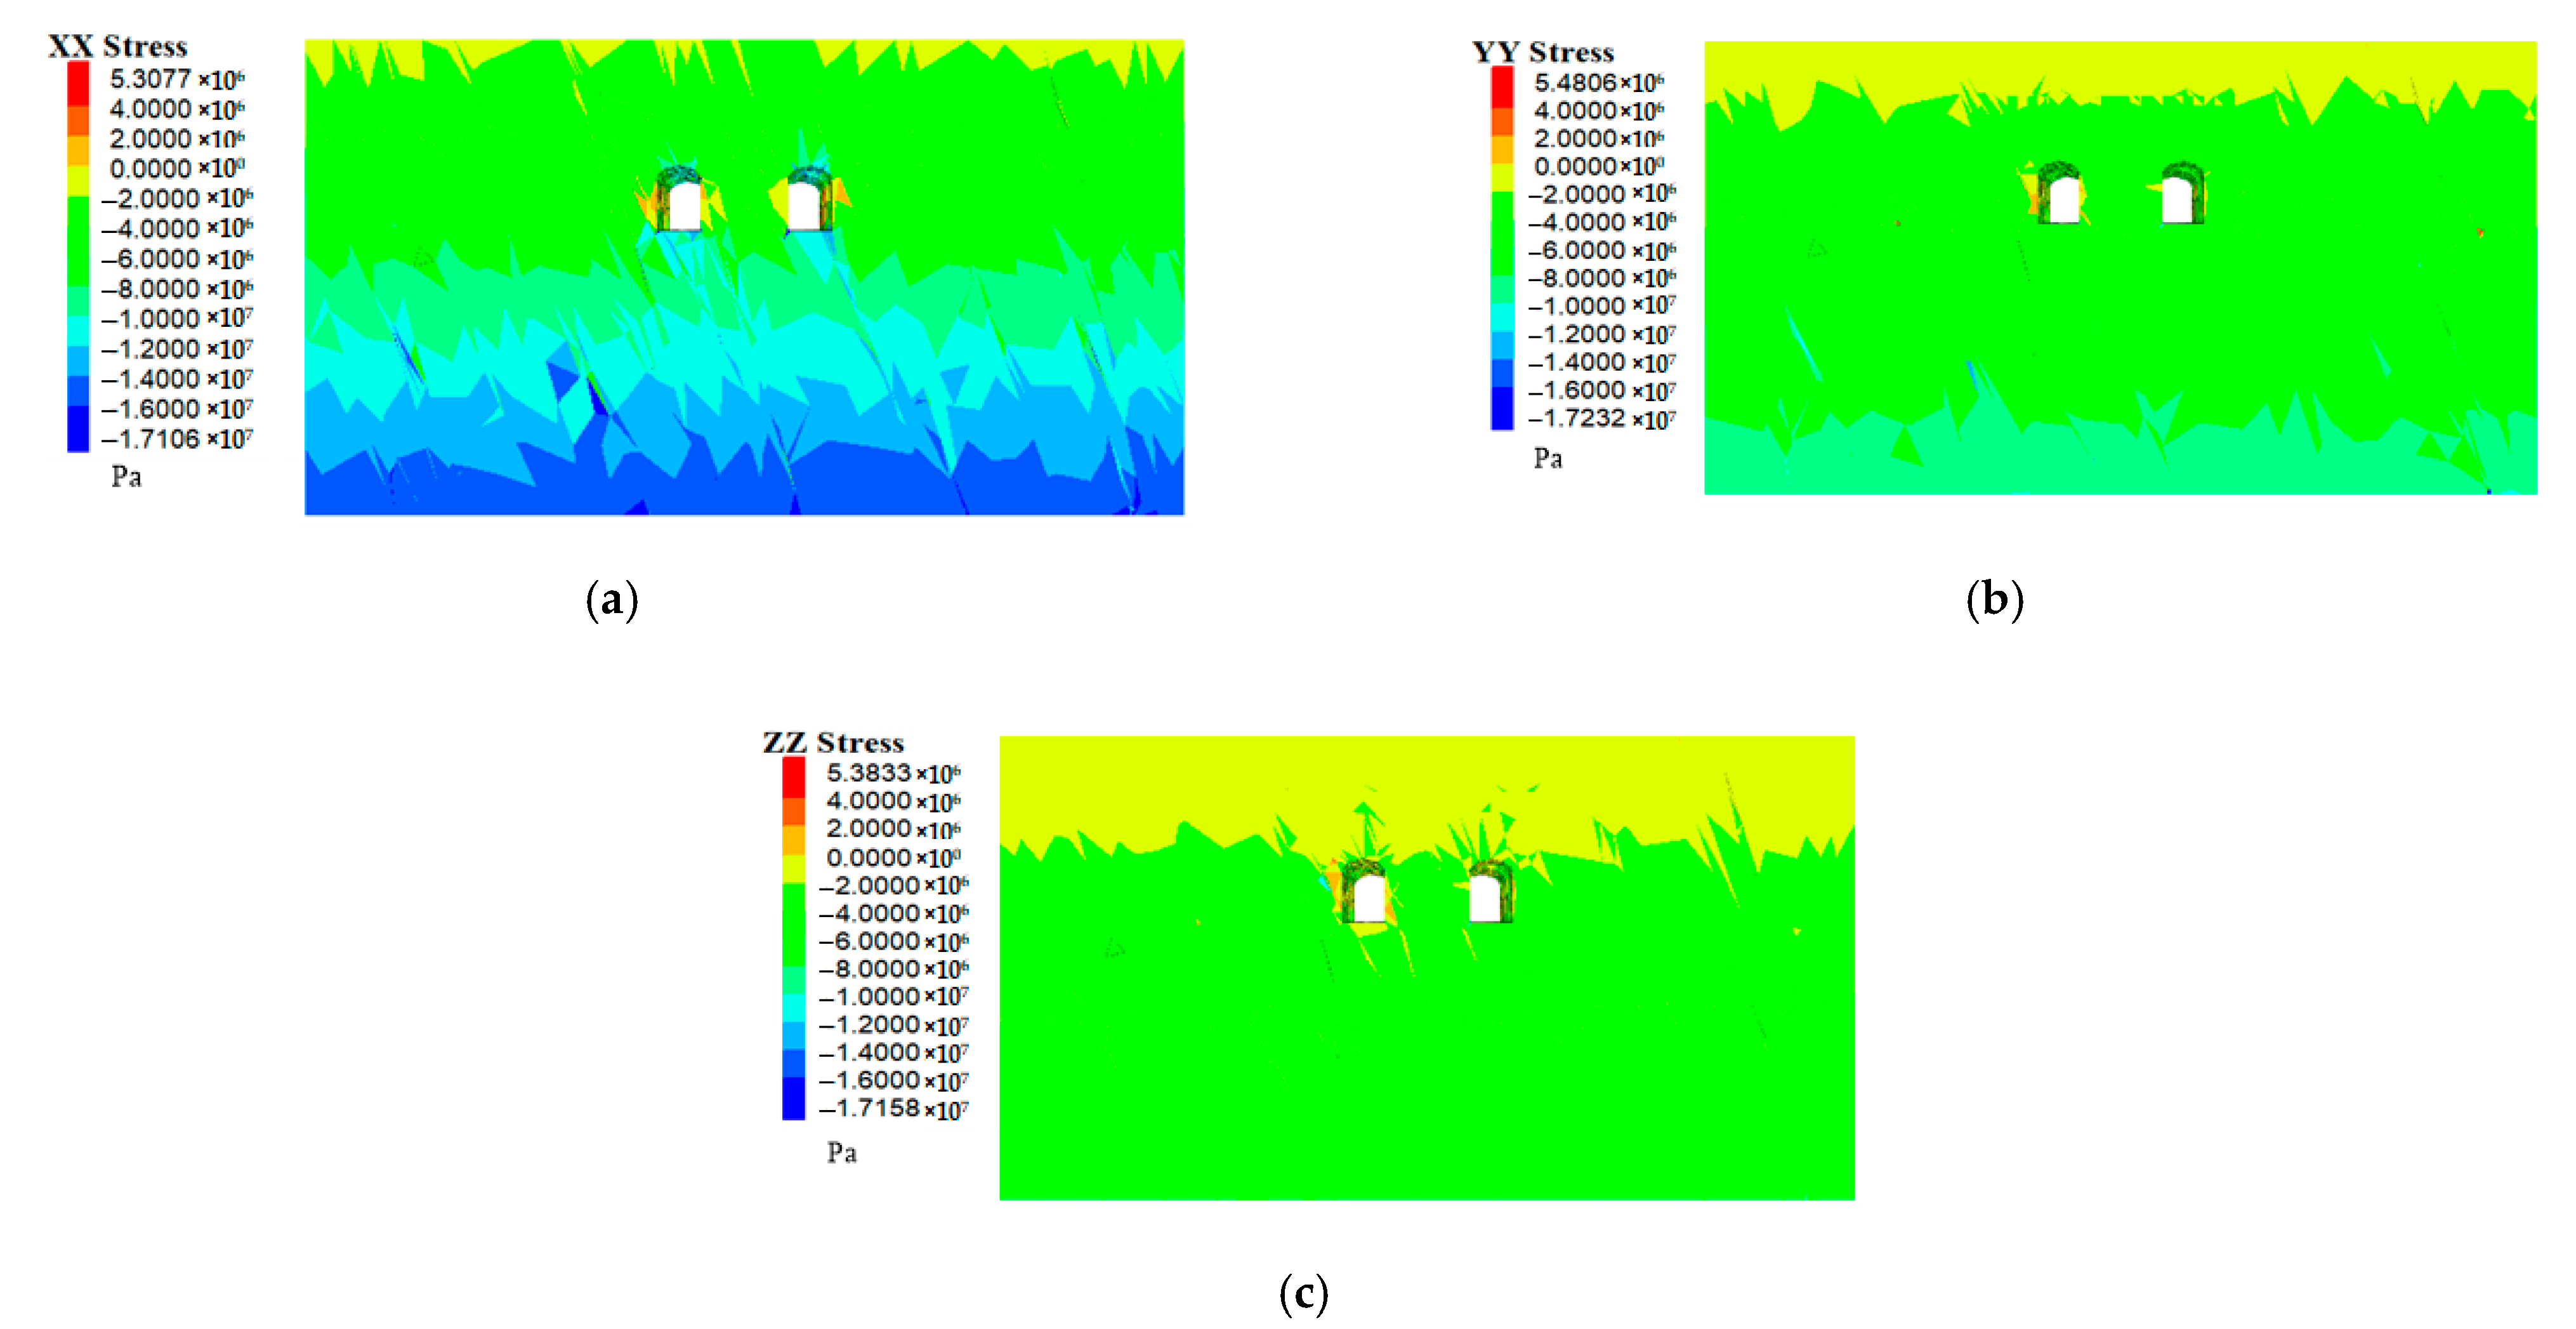
5.3. Effect of Lateral Stress on the Stability of Surrounding Rock

As shown in Figure 19, there are four monitoring points of surrounding rock for each cavern, including two side walls, crown, and base plate. For each cavern, the displacements of the monitoring points are analyzed.
The lateral stress of the underground cavern project is 7.22 Mpa, so the effect of the lateral stress on the stability of the surrounding rock of the underground cavern is analyzed based on the lateral stress of 7 Mpa. Figure 20 shows the displacement contours of the surrounding rock of the cavern in the case of lateral stress of 7 Mpa. The maximum displacement of the surrounding rock occurs at the side wall and points to the free face. For the left cavern, the maximum displacement at the left side wall is 21.5 mm, the maximum displacement at the crown of the cavern is 2.1 mm, and the maximum displacement at the base plate is 1.1 mm. For the right cavern, the maximum displacement at the left side wall is 20.9 mm, the maximum displacement at the crown of the cavern is 1.5 mm, and the maximum displacement at the base plate is 0.8 mm.
The displacements of the monitoring points of surrounding rock under different lateral stresses are listed in Table 9. It can be seen that the displacement of surrounding rock decreases gradually with the increase of lateral stress, and the surrounding rock tends to be more stable. For the two caverns, the maximum displacement at the side walls is greater than the displacement at the crown of the cavern and that at the base plate. The survey of the geo-stress field in the actual project demonstrated that the horizontal principal stress is greater than the vertical principal stress (self-weight stress), resulting in such a displacement distribution. Figure 21 shows the stress distribution of the storage caverns. Note that there were obvious tensile stress zones on the left and right walls of the storage caverns. However, the area of compressive stress zones was greater than that of the tensile stress zones. The compressive stress was dominant in the rock surrounding the entire storage cavern. The other cases also presented the same conclusions as this case.

6. Conclusions

A series of normal compression and shear tests of rock fracture were conducted on the self-developed true triaxial test apparatus. The lateral stress effect on the normal compression and shear properties and the corresponding mechanical model and parameters of rock fracture were investigated. The hydro-mechanical coupling analysis considering lateral stress was carried out for an underground water sealed oil storage cavern project, using the equivalent parameters of rock fracture based on the test. The influence of lateral stress on the stability of the surrounding rock of the underground oil storage cavern were investigated. The main conclusions are as follows:
(1)
The normal displacement decreases with the increase of lateral stresses, whereas the normal stiffness of rock fracture increases with the increase of lateral stress.
(2)
Under the same normal stress, the shear strength increases with the increase of lateral stress. Except for the case of lateral stress of 10 MPa, the peak shear displacements decrease with the increase of lateral stress. It can be considered that under high lateral stress, the bulge on the rock fracture surface was cut off, which led to the increase of the peak shear displacement of the rock fracture. The friction angle and cohesion increase with the increase of lateral stress.
(3)
Considering the effect of lateral stress, the improved normal loading model, peak shear strength model and peak dilatancy angle model were established.
(4)
Considering the increase of lateral stress, the displacement of surrounding rock decreases, and the surrounding rock tends to be more stable.

Author Contributions

Conceptualization, L.Q.; methodology, L.Q. and Z.W.; software, W.L. and L.Y.; validation, L.Q., H.L. and Z.W.; formal analysis, H.L. and L.Y.; investigation, H.L. and L.Y.; resources, L.Q. and Z.W.; data curation, L.Q. and Z.W.; writing—original draft preparation, L.Q. and H.L.; writing—review and editing, L.Q. and W.L.; visualization, L.Q. and L.Y.; project administration, L.Q. and Z.W.; funding acquisition, L.Q. and Z.W. All authors have read and agreed to the published version of the manuscript.

Funding

This research was funded by “the National Natural Science Foundation of China (No. 42177157)”, “CRSRI Open Research Program (CKWV2019744/KY)”, “Fundamental Research Funds for the Central Universities (No. N2101005, N2001026)”, and Distinguished Middle-Aged and Young Scientist Encourage and Reward Foundation of Shenyang (No. RC210405).

Institutional Review Board Statement

Not applicable.

Informed Consent Statement

Not applicable.

Data Availability Statement

The data presented in this study are available on request from the corresponding author upon reasonable request.

Acknowledgments

We would like to acknowledge the reviewers and the editor for their valuable comments and suggestions.

Conflicts of Interest

The authors declare no conflict of interest.

Nomenclature

AConstant parameter
BConstant parameter
cCohesion
cmMaximum cohesion considering lateral stress
c0Cohesion with the lateral stress of 0
ErElastic Modulus
ipDilatancy angle
ip0Initial dilatancy angle
i p 0 0 Initial peak dilatancy angle when the lateral stress is 0
JRCJoint roughness coefficient
JCSJoint wall compressive strength
k3Fitting parameter
k30Fitting parameter when the lateral stress is 0
KniInitial normal stiffness
KnimMaximum initial normal stiffness with different lateral stresses
Kni0Initial normal stiffness with the lateral stress of 0
l1Trace length
LLength of rock fracture in x direction
MTotal number of sampling intervals of the rock fracture
sTrace length spacing
vrPoisson’s ratio
VNormal closure of rock fracture
VmMaximum normal closure of rock fracture
Vm0Maximum normal closure of rock fracture with the lateral stress of 0
Z2Root mean square of the roughness profile curve
α1Dip angle
ΔxSampling interval along the x direction
ρrDensity
σcLateral stress
σfShear strength
σnNormal stress
τShear stress
φFriction angle
φmMaximum friction angle considering lateral stress
φ0Friction angle with the lateral stress of 0

References

  1. Bandis, S.C.; Lumsden, A.C.; Barton, N.R. Fundamentals of rock joint deformation. Int. J. Rock Mech. Min. Sci. Geomech. Abstr. 1983, 20, 249–268. [Google Scholar] [CrossRef]
  2. Barton, N.R.; Bandis, S.C.; Bakhtar, K. Strength deformation and conductivity coupling of rock joints. Int. J. Rock Mech. Min. Sci. Geomech. Abstr. 1985, 22, 121–140. [Google Scholar] [CrossRef]
  3. Shehata, W.M. Geohydrology of Mount Vernon Canyon Area. Ph.D. Thesis, Colorado School of Mines, Golden, CO, USA, 1971. [Google Scholar]
  4. Malama, B.; Kulatilake, P. Models for normal fracture deformation under compressive loading. Int. J. Rock Mech. Min. Sci. 2003, 40, 893–901. [Google Scholar] [CrossRef]
  5. Saeb, S.; Amadei, B. Modelling rock joints under shear and normal loading. Int. J. Rock Mech. Min. Sci. Geomech. Abstr. 1992, 29, 267–278. [Google Scholar] [CrossRef]
  6. Yin, X.J.; Wang, G.L. Study of constitutive model for rock interfaces and joints under normal cyclic loading. Chin. J. Rock Mech. Eng. 2005, 24, 1158–1163. [Google Scholar]
  7. Zhang, Y.; Ding, X.; Wu, A.; Lu, B. Deformation characteristics of natural structural planes with certain thickness under normal cyclic loading condition. Rock Soil Mech. 2017, 28, 2865–2872. (In Chinese) [Google Scholar]
  8. Qiao, L.P.; Li, Q.; Wang, Z.C.; Yang, L. Normal deformation behavior of rock joint with deformable rock wall. J. Northeast. Univer. 2016, 37, 1479–1484. [Google Scholar]
  9. Özvan, A.; Dinçer, İ.; Acar, A.; Özvan, B. The effects of discontinuity surface roughness on the shear strength of weathered granite joints. Bull. Eng. Geol. Environ. 2014, 73, 801–813. [Google Scholar] [CrossRef]
  10. Ban, L.; Zhu, C.; Qi, C.; Tao, Z.; Jiang, K.; Li, J. The shear stiffness criterion for rock joints considering rock wear behavior. Q. J. Eng. Geol. Hydroge. 2020, 53, 266–275. [Google Scholar] [CrossRef]
  11. Patton, F.D. Multiple modes of shear failure in rock. In Proceedings of the 1st ISRM Congress, Lisbon, Portugal, 25 September–1 October 1966; ISRM: Lisbon, Portugal, 1966; Volume 1, pp. 509–513. [Google Scholar]
  12. Barton, N.R.; Choubey, V. The shear strength of rock joints in theory and practice. Rock Mech. 1977, 10, 1–54. [Google Scholar] [CrossRef]
  13. Zhao, J. Joint surface matching and shear strength part B: JRC-JMC shear strength criterion. Int. J. Rock Mech. Min. Sci. 1997, 34, 179–185. [Google Scholar] [CrossRef]
  14. Li, Y.; Oh, J.; Mitra, R.; Hebblewhite, B. A constitutive model for a laboratory rock joint with multi-scale asperity degradation. Comput. Geotech. 2016, 72, 143–151. [Google Scholar] [CrossRef]
  15. Fathi, A.; Moradian, Z.; Rivard, P.; Ballivy, G. Shear mechanism of rock joints under pre-peak cyclic loading condition. Int. J. Rock Mech. Min. Sci. 2016, 83, 197–210. [Google Scholar] [CrossRef]
  16. Liu, X.; Kou, M.; Lu, Y.; Liu, Y. An experimental investigation on the shear mechanism of fatigue damage in rock joints under pre-peak cyclic loading condition. Int. J. Fatigue 2017, 106, 175–184. [Google Scholar] [CrossRef]
  17. Liu, Y.; Wu, W.; Tang, C.; Liu, B. Predicting the shear characteristics of rock joints with asperity degradation and debris backfilling under cyclic loading conditions. Int. J. Rock Mech. Min. Sci. 2019, 120, 108–118. [Google Scholar] [CrossRef]
  18. Ladanyi, B.; Archambault, G. Simulation of shear behaviour of a fractured rock mass. In Proceedings of the 11th U.S. Symposium on Rock Mechanics, Berkeley, CA, USA, 16–19 June 1969; pp. 105–125. [Google Scholar]
  19. Souley, M.; Homand, F.; Amadei, B. An extension to the Saeb and Amadei constitutive model for rock joints to include cyclic loading paths. Int. J. Rock Mech. Min. Sci. Geomech. Abstr. 1995, 32, 101–109. [Google Scholar] [CrossRef]
  20. Jafari, M.K.; Hosseini, K.A.; Pellet, F.; Boulon, M.; Buzzi, O. Evaluation of shear strength of rock joints subjected to cyclic loading. Soil Dyn. Earthq. Eng. 2003, 23, 619–630. [Google Scholar] [CrossRef]
  21. Wang, G.; Zhang, X.P.; Jiang, Y.J.; Zhang, Y.Z. New shear strength criterion for rough rock joints considering shear velocity. Chin. J. Rock Mech. Eng. 2015, 37, 1399–1404. [Google Scholar]
  22. Tian, Y.C.; Liu, Q.S.; Ma, H.; Liu, Q.; Deng, P.H. New peak shear strength model for cement filled rock joints. Eng. Geol. 2018, 233, 269–280. [Google Scholar] [CrossRef]
  23. Feng, X.T.; Zhao, J.; Zhang, X.W.; Kong, R. A novel true triaxial apparatus for studying the time-dependent behaviour of hard rocks under high stress. Rock Mech. Rock Eng. 2018, 51, 2653–2667. [Google Scholar] [CrossRef]
  24. Barton, N. Review of a new shear strength criterion for rock joints. Eng. Geol. 1973, 7, 287–332. [Google Scholar] [CrossRef]
  25. Tse, R.; Cruden, D.M. Estimating joint roughness coefficients. Int. J. Rock Mech. Min. Sci. Geomech. Abstr. 1979, 16, 303–307. [Google Scholar] [CrossRef]
  26. Zhao, L.; Zhang, S.; Huang, D.; Zuo, S.; Li, D. Quantitative characterization of joint roughness based on semivariogram parameters. Int. J. Rock Mech. Min. Sci. 2018, 109, 1–8. [Google Scholar]
  27. Du, S.; Lin, H.; Yong, R.; Liu, G. Characterization of joint roughness heterogeneity and its application in representative sample investigations. Rock Mech. Rock Eng. 2022, 1–25. [Google Scholar] [CrossRef]
  28. Ge, Y.F. Research on roughness and peak shear strength for rock discontinuities based on brightness area percentage. Chin. J. Rock Mech. Eng. 2015, 34, 1399–1404. [Google Scholar]
  29. Schneider, H.J. The friction and deformation behavior of rock joints. Rock Mech. 1976, 8, 169–185. [Google Scholar] [CrossRef]
Figure 1. Self-developed true triaxial test apparatus [23].
Jmse 10 00677 g001
Figure 2. Granite specimens with the size of 70 mm × 70 mm × 70 mm.
Jmse 10 00677 g002
Figure 3. Rock fractures prepared by Brazilian splitting test.
Jmse 10 00677 g003
Figure 4. 3D topography point cloud images of rock fracture: (a) Initial image; (b) Reconstructed image.
Jmse 10 00677 g004
Figure 5. The sealed specimen prepared for the test.
Jmse 10 00677 g005
Figure 6. Loading diagram of normal compression test.
Jmse 10 00677 g006
Figure 7. Loading diagram of shear test.
Jmse 10 00677 g007
Figure 8. Normal loading and unloading stress versus normal displacement curves of rock fractures under different lateral stresses: (a) Whole process curves; (b) Amplified loading process curves.
Jmse 10 00677 g008
Figure 9. Shear stress versus shear displacement curves of rock fractures under different lateral stresses.
Jmse 10 00677 g009
Figure 10. Normal displacement versus shear displacement curves of rock fractures under different lateral stresses: (a) σ c = 0 MPa; (b) σ c = 2 Mpa; (c) σ c = 7 Mpa; (d) σ c = 10 Mpa.
Jmse 10 00677 g010
Figure 11. Comparison of the test and fitting results of the relationship of normal stress and normal displacement: (a) σ c = 0 , 5 , 10 , 15 , 20 , 30 MPa, (b) σ c = 15 , 20 , 30 Mpa.
Jmse 10 00677 g011
Figure 12. Comparison of the test and fitting results of the relationship between initial normal stiffness and lateral stress.
Jmse 10 00677 g012
Figure 13. Comparison of the test and fitting results of the relationship between maximum normal closure and lateral stress.
Jmse 10 00677 g013
Figure 14. Comparison of the test and fitting results of the relationship between shear strength and normal stress.
Jmse 10 00677 g014
Figure 15. Comparison of the test and fitting results of the relationship between friction angles and lateral stress.
Jmse 10 00677 g015
Figure 16. Comparison of the test and fitting results of the relationship between cohesion and lateral stress.
Jmse 10 00677 g016
Figure 17. Comparison of the test and fitting results of the relationship between peak dilatancy angle and normal stress.
Jmse 10 00677 g017
Figure 18. Numerical model of the engineering project.
Jmse 10 00677 g018
Figure 19. Monitoring points schematic diagram of surrounding rock.
Jmse 10 00677 g019
Figure 20. Displacement contours of surrounding rock of cavern: (a) Displacement of the study area, (b) Magnified displacement of surrounding rock (7 MPa).
Jmse 10 00677 g020
Figure 21. Stress contours of surrounding rock of cavern in different directions: (a) X-axis direction, (b) Y-axis direction, (c) Z-axis direction (7 MPa).
Jmse 10 00677 g021
Table 1. JRC of rock fractures along x and y directions.
Specimen No.X DirectionY Direction
#110.0510.87
#210.9210.54
#310.1511.32
#410.7012.33
#59.2511.96
Table 2. The normal compression test loading scheme.
CasesNormal Stress
σ n   ( MPa )
Lateral Stress
σ c   ( ( MPa )
#5-135 + 00
#5-230 + 55
#5-325 + 1010
#5-420 + 1515
#5-515 + 2020
#5-65 + 3030
Table 3. The shear test loading scheme.
CasesNormal Stress
σ n   ( MPa )
Lateral Stress
σ c   ( MPa )
#15–10–150
#27–9–12–182
#310–12–15–207
#412–15–18–20–2510
Table 4. The shear strength, peak shear displacement, and peak dilatancy angle under different cases.
CasesNormal Stress
σ n   ( Mpa )
Shear Strength
σ f   ( Mpa )
Peak Shear
Displacement (%)
Peak Dilatancy
Angle (°)
#154.9200.13921.6
109.8010.19111.99
1514.6090.2629.46
#2710.9010.10211.1
913.2880.10511.39
1216.3130.11610.59
1822.5910.13810.48
#31016.2800.10116.09
1218.2800.10514.80
1521.3710.11212.74
2025.8510.12110.64
#41228.1470.14916.72
1531.1540.17518.37
1832.8000.17214.75
2034.1680.17713.94
2538.3540.18613.79
Table 5. Fitting parameters of normal compression test.
CasesInitial Normal Stiffness
K n i   ( Mpa / mm )
Maximum Normal Closure
V m   ( mm )
R 2
#5-1900.210.9873
#5-21800.2130.9980
#5-32350.220.9991
#5-42650.2450.9920
#5-52800.270.9937
#5-63000.320.9807
Table 6. Rock fracture parameters of the engineering project.
No.Dip Angle
α 1   ( ° )
Trace Length
L1 (m)
Trace Length Spacing S (m)
#180–9529–475.0–7.0
#279–8530–405.1–7.4
#386–9139–525.1–6.0
#476–8143–525.0–10.0
Table 7. Rock block parameter.
Density
ρ r   ( g · cm 3 )
Elastic Modulus
Er (Gpa)
Poission’s Ratio
υ r
2.6821.60.27
Table 8. Equivalent parameters of rock fracture under different lateral stresses.
Lateral Stress
σ c   ( Mpa )
Shear Stiffness
K s   ( Gpa / m )
Normal Stiffness
K n   ( Gpa / m )
Friction Angle
φ
Cohesion
c
Dilatancy Angle
(°)
0479040.21.611.4
3.516915242.66.312.6
720919443.99.615.2
10.523322444.211.917.4
Table 9. Displacement of caverns under different lateral stresses.
Lateral Stress
(MPa)
Displacement of Left Cavern(mm)Lateral Stress
(MPa)
Displacement of Right Cavern (mm)
Side WallCrownBaseSide WallCrownBase
028.33.52.2026.23.11.9
3.524.92.71.53.523.61.91.1
721.52.11.1720.91.50.8
10.519.61.40.510.518.50.90.2
Publisher’s Note: MDPI stays neutral with regard to jurisdictional claims in published maps and institutional affiliations.

