Article

Research on the Depth Control Strategy of an Underwater Profiler Driven by a Mixture of Ocean Thermal Energy and Electric Energy

1
State Key Laboratory of Fluid Power and Mechatronic Systems, Ningbo Research Institute, College of Mechanical Engineering, Zhejiang University, Hangzhou 310027, China
2
Faculty of Science and Engineering, University of Nottingham, Ningbo 315154, China
*
Author to whom correspondence should be addressed.
J. Mar. Sci. Eng. 2022, 10(5), 640; https://doi.org/10.3390/jmse10050640
Submission received: 5 April 2022 / Revised: 5 May 2022 / Accepted: 6 May 2022 / Published: 8 May 2022
(This article belongs to the Special Issue Frontiers in Deep-Sea Equipment and Technology)

Abstract

:
Marine resources are rich and contain an enormous amount of energy. The exploration of marine resources and the effective use of ocean energy have gradually become the research focus of scholars all over the world. A profiler driven by ocean thermal energy can monitor the vertical profile of the surrounding sea area for a long time. To realize the levitation at a fixed water depth on the premise of saving energy, in this paper, a new buoyancy regulation system driven by the mixture of ocean thermal energy and electric energy is designed, and a new depth control strategy for the hybrid drive is proposed. Compared with the traditional profiler, the new profiler, in which the main energy required for buoyancy regulation is provided by ocean thermal energy, can reduce electrical energy consumption. Simulations of SMC (sliding mode control) and conventional PID control were conducted, and the results showed that the SMC method has advantages in terms of response speed, overshoot, and energy saving. A lake test was conducted and the results showed that the new control method can make the equipment reach the fixed water depth position; however, due to the complex water flow environment, the precision and stability of the controller need to be improved in the future.

1. Introduction

A profiler is an unmanned ocean mobile observation platform, which is also known as a profile float. One of the primary missions of a profiler is to acquire data on the vertical profile of the ocean while floating and sinking. With the development of marine science, the demand for marine data has become more diversified. It requires not only spatially continuous data at different depths, but also temporally continuous data at fixed depths. Therefore, a depth control function is required for the profiler. A traditional profiler is driven by electric energy stored in the battery. However, the short battery lifespan is the most limiting factor to prevent a profiler from completing long-range and long-term marine operations [1].
The ocean contains abundant renewable energy, which has great potential to solve the energy consumption problem [2,3,4]. Ocean thermal energy refers to the heat energy formed by the temperature gradient between the warm surface water and the cold deep water. With the concern of up-and-down motion modes, such as with a profiler and underwater glider, ocean thermal energy becomes the most suitable energy for mobile observation platforms [5]. The Slocum thermal glider is the first ocean mobile observation platform driven by ocean thermal energy with phase-change material (PCM) [6]. PCM utilizes the volume difference between solid and liquid state to harvest ocean thermal energy and turn it into mechanical energy through a buoyancy regulation system. The Petrel thermal glider of Tianjin University and Slocum thermal glider have the same principle [7]. They convert the ocean thermal energy directly into mechanical energy to change the volume of the external bladder. Some researchers focus on converting the ocean’s thermal energy into electric energy and then converting it into mechanical energy to drive ocean mobile observation platforms such as SOLO-TREC [8], Slocum-TREC [9], and OTEC-PCM [10]. This indirect method avoids the impact of one or more periodic phase change faults on the operation. However, this method decreases the utilization efficiency of ocean thermal energy. Although many researchers study the PCM heat transfer model [11,12,13] and the maximum efficiency power generation algorithm [14], to improve the conversion efficiency, most of the platforms driven by the indirect method are still difficult to meet their electricity demand. Another hybrid method is to combine the direct method and the indirect method. The Petrel II thermal glider [15] is not only driven by ocean thermal energy but also by electric energy when the ocean thermal energy is unstable. The hybrid method solves the problem of the unreliability of the ocean thermal energy drive and the problem of the high energy consumption and low efficiency of the electric energy drive, which also has contributed to the application of a depth-control algorithm.
The depth-control algorithm is widely used in unmanned ocean mobile observation platforms that are driven by a thruster, because it can achieve fast output responses. Hyun-Sik Kim and Yong-Ku Shin [16] designed an expanded adaptive fuzzy sliding mode controller to solve the problem of the multi-input multi-output system, robustness, continuous control input, and the speed dependency of the controller parameters’ in-depth control. Jong-Yong Park et al. [17] adopted an adaptive control method based on the neural network and PID used in a depth controller, considering the uncertainty of hydrodynamic maneuvering coefficients and environmental loads. However, the high adaptation rates of adaptive control can lead to instabilities and actuator fatigue due to high-frequency oscillations in the control signal. Charita D. Makavita et al. [18] designed a command governor adaptive depth controller to solve this problem. Other non-adaptive control strategies also show good performance. Lei Qiao et al. [19] proposed a robust H2 optimal control strategy for the depth-plane motion of an autonomous underwater vehicle (AUV) in the presence of output disturbances and time delay. Huanyin Zhou et al. [20] developed a control scheme that combines the state feedback control and rules-based supervision for depth control of the unmanned semi-submersible vehicle. These methods consume more electric energy and are not suitable for long-term ocean observation.
The profiler and underwater glider are different from an AUV, and they achieve depth control through a variable buoyancy system (VBS) that uses the pump to change the volume of the external bladder. Brij Kishor Tiwari et al. [21] presented a state feedback controller for VBS to achieve hovering control at the desired depth. Hexiong Zhou et al. [22] proposed an adaptive robust control scheme based on sliding mode control with a nonlinear disturbance observer to solve the problems of parametric uncertainty and unknown time-varying external disturbances in virtual mooring. Weilei Wu et al. [23] proposed an improved double PD control method to realize the depth control of profiling buoy under low power consumption through sparse sampling and depth prediction. Zurong Qiu et al. [24] proposed a finite-time, boundedness depth-control strategy based on over-shoot estimation during the pole placements method to achieve the rejection of the ocean current disturbances and fast convergence of the depth control of a deep-sea self-holding intelligent buoy. Some researches focus on the depth control and path tracking of hybrid underwater gliders with a thruster and variable buoyancy systems that are essentially driven by electric energy [25,26,27]. The pump of the buoyancy regulation system is the main energy-consuming part of the profiler. The current depth control method needs to control the pump frequently to achieve a rapid response and accuracy, which will consume a lot of energy. Although the thermal energy driven profile can reduce energy consumption, the control effect is not ideal. The depth-control strategies for hybrid ocean thermal and electrical energy drives can overcome these shortcomings.
In this paper, an efficient depth-control strategy is developed to apply to the profiler driven by ocean thermal energy and electric energy. Compared with the existing work, this study puts forward the following contributions. First, a new fluid control system for the buoyancy regulation with a depth-control function is presented. Second, a new depth-control strategy combined with ocean thermal energy and electric energy hybrid drive is proposed. The hydraulic energy converted from the ocean thermal energy makes the buoyancy regulation system reach neutral buoyancy quickly at the target depth. Then, a pump is used to adjust the neutral buoyancy accurately. Third, a prototype of the profiler driven by ocean thermal energy and electric energy is designed, which has a fast response and robustness with low energy consumption of the depth-control process.

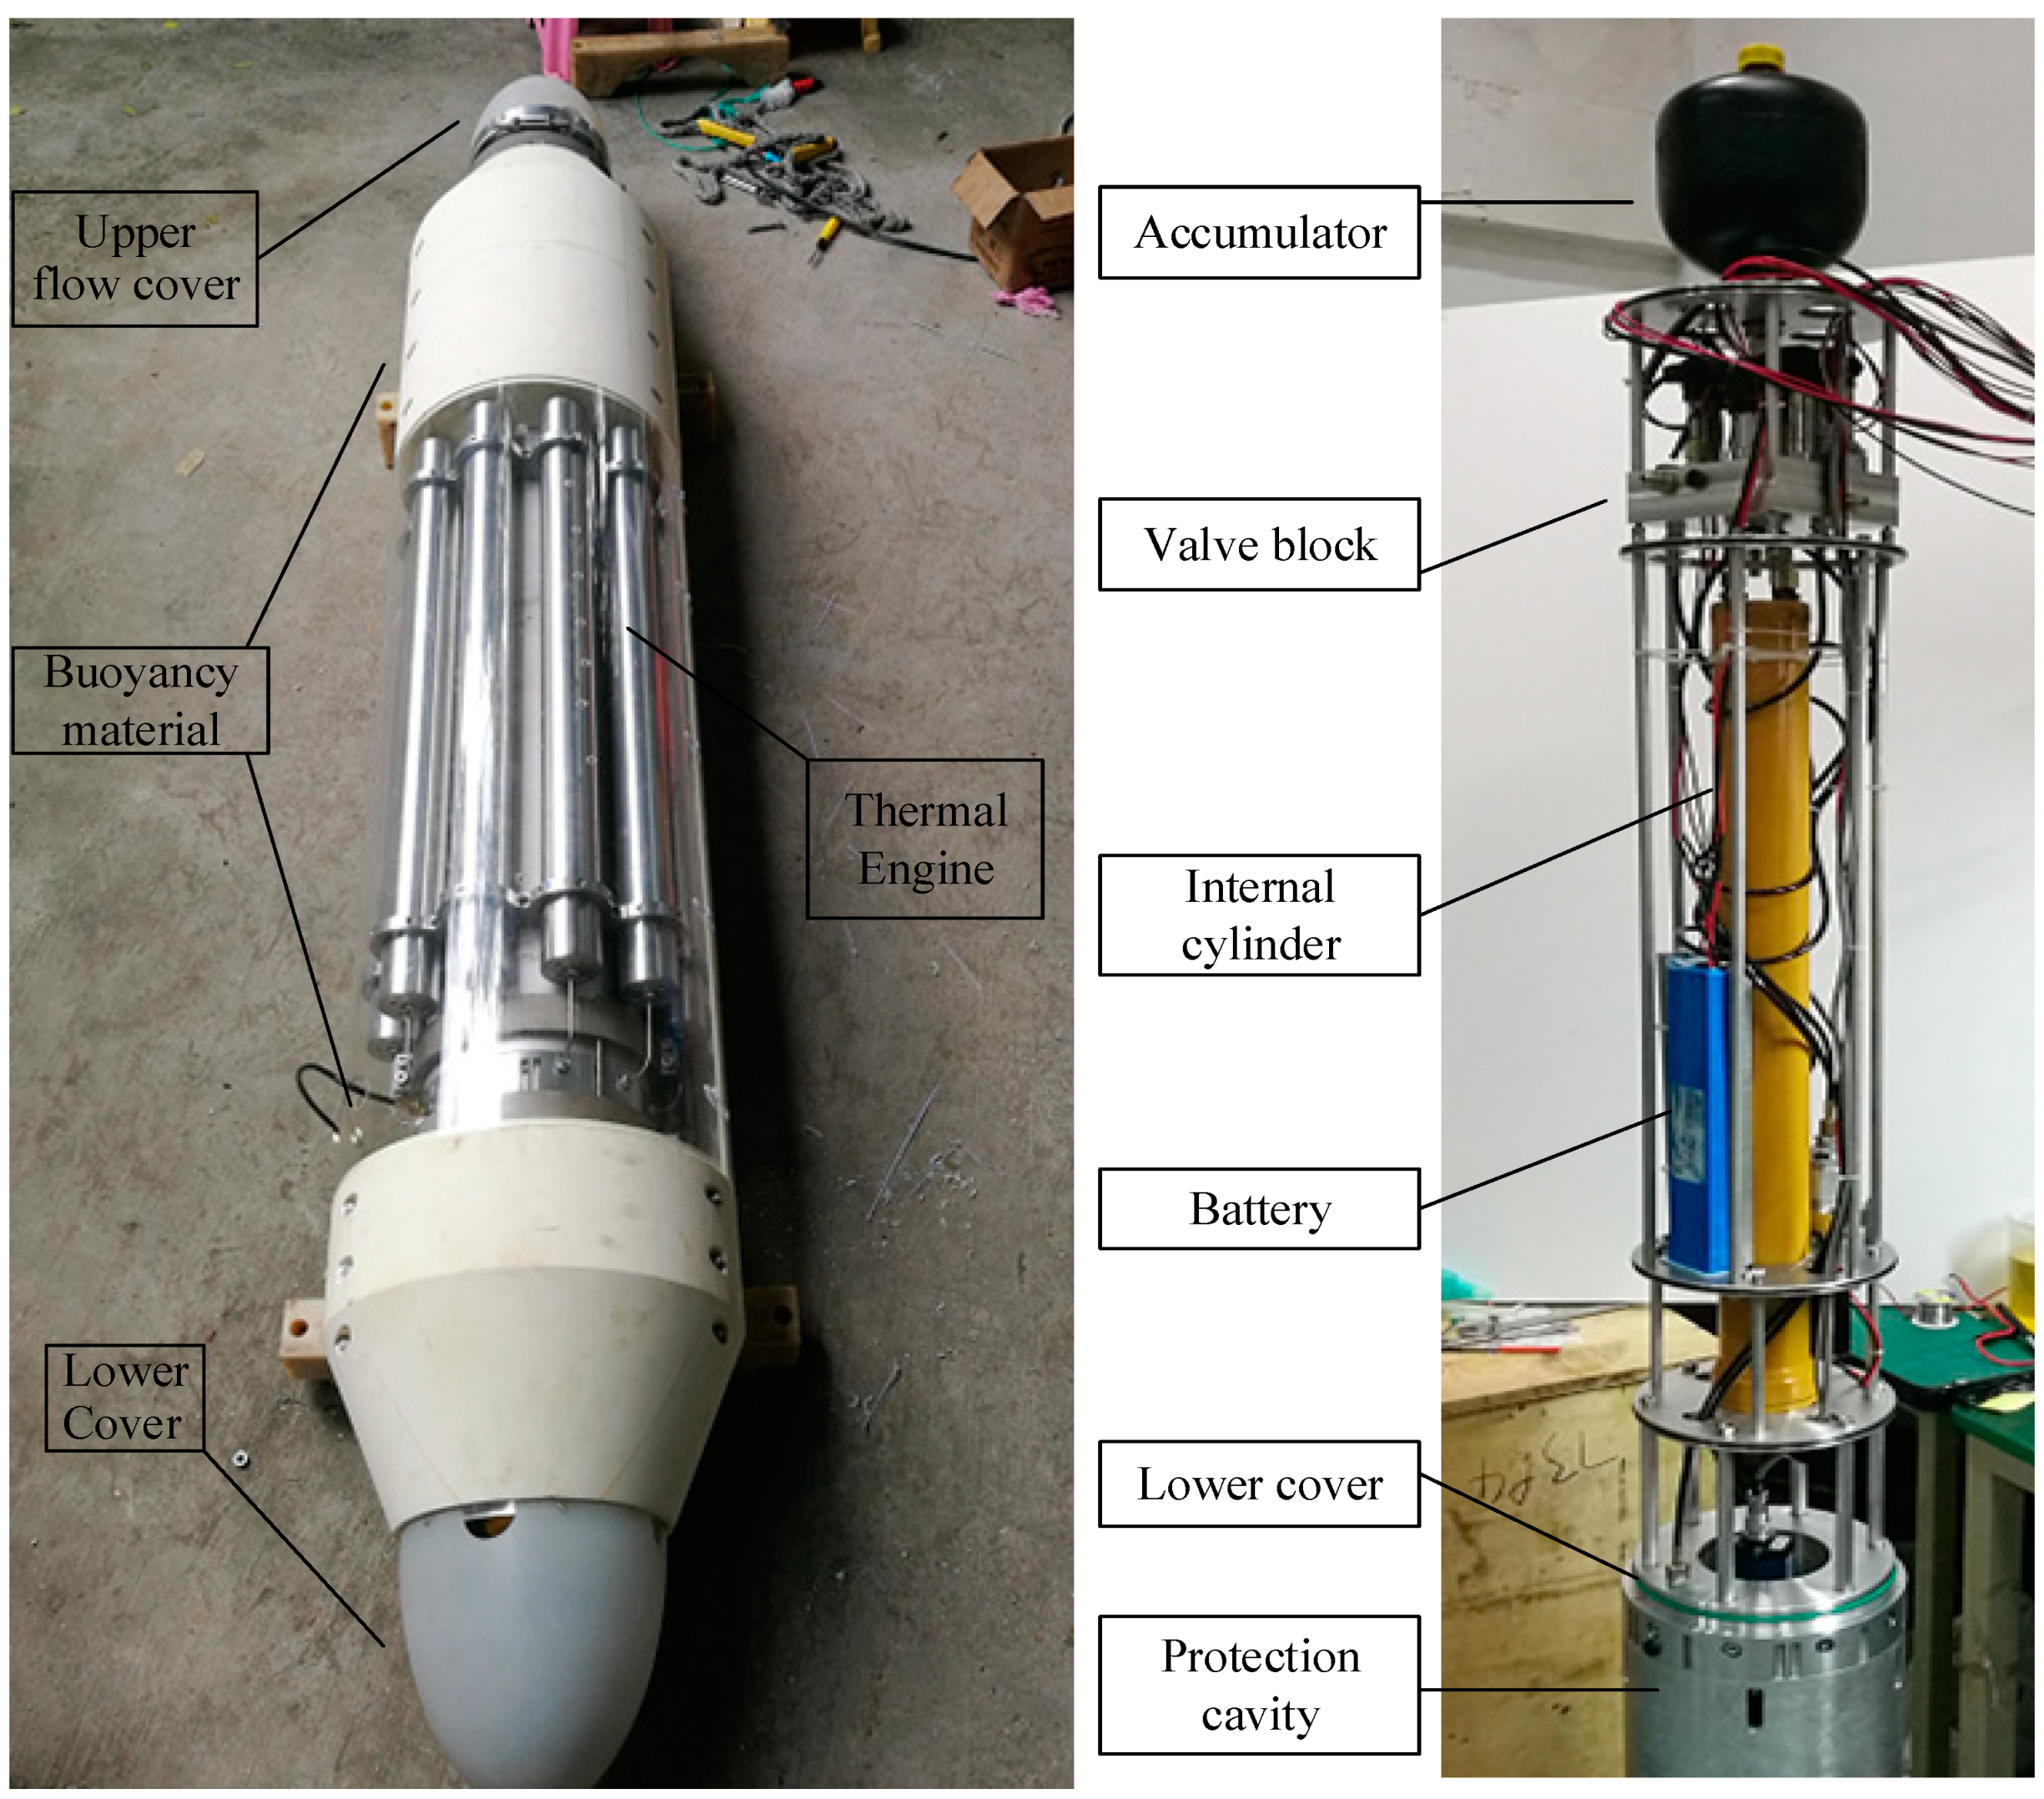
2. Buoyancy Regulation System

In this paper, a new fluid control system that relies on ocean thermal energy and electric energy for buoyancy drive is designed. Compared with other profilers or Argo buoys, this new fluid control system owns huge electricity energy-saving advantages because it mainly uses ocean thermal energy for driving. The principle diagram of the new fluid control system for the buoyancy adjustment system and the movement process in the ocean is shown in Figure 1.
The system is mainly composed of a thermal engine with PCM (e.g., n-hexadecane whose phase transition temperature is 18 °C), an accumulator, pressure sensors, solenoid valves, internal cylinder, spring 1, displacement sensor for the internal cylinder, external cylinder, spring 2, magnetostrictive displacement sensor for the external cylinder, and check valves. The PCM melts and expands when the seawater temperature is higher than the phase-transition temperature of the PCM, and the oil flow into the accumulator and causes the pressure to rise. When the pressure of the accumulator increases to the set value, the solenoid valve 2 opens, and the oil in the external cylinder discharged into the internal cylinder under the action of spring 2, so the volume of the external bladder is reduced, which leads to buoyancy reducing and the profiler starts to sink. The PCM solidifies and contracts when the profiler reaches the water zone with a lower temperature (for example, the bottom water temperature is 4 °C). The oil in the internal cylinder is discharged into the PCM bladder under the action of the internal cylinder spring 1. When the piston displacement of the internal cylinder reaches the set value, which represents the volume reduced because of PCM solidification, solenoid valve 1 will open and the oil in the accumulator will enter the external cylinder and lead the profiler floats. The displacement sensor for the internal cylinder and the magnetostrictive displacement sensor for the external cylinder enable precise buoyancy control of the profiler.
Meanwhile, the existence of a hydraulic pump and solenoid valve 2 makes the two-way adjustment of buoyancy become a reality. Therefore, the profiler that uses this principle has the function of fixed-depth suspension control. Compared with other devices driven by ocean thermal energy, this equipment is more efficient because the elastic potential energy of spring 1 and spring 2 also comes from ocean thermal energy.

3. Depth Control Strategy of Profiler

In a specific operation, the profiler is required to collect ocean data at a certain depth; the profiler’s function of suspending at a specific depth range of water is very useful. However, due to the impact of the water currents and changes in seawater density, the profiler cannot maintain a fixed position for a long time. Therefore, the strategy of combining thermal energy and electric energy for depth control is studied in this paper. In Section 3.1, the depth-control algorithm of the profiler driven by ocean thermal energy is studied. In Section 3.2, the depth-control algorithm of the profiler driven by electric energy is studied. In Section 3.3, a new method combining the above two schemes is studied.

3.1. Depth Control Algorithm That Profiler Driven by Ocean Thermal Energy

Ocean thermal energy is used to convert the negative buoyancy state of the profiler to a neutral buoyancy state, and the ideal result is that when the profiler reaches the target point, the velocity is zero, and the buoyancy is just neutral buoyancy. In order to achieve this goal, the opening time of the solenoid valve 1 must be calculated accurately, which depends on the distance between the profiler and the target position, the vertical velocity of the profiler, and the flow rate of oil from the accumulator to the external bladder. The algorithm, which is shown in Figure 2, is used to judge whether the solenoid valve 1 needs to be opened during the sinking process of the profiler, and this algorithm is executed by the profiler microcontroller. Δ t is the time step of the simulation of the microcontroller operation, F r is the initial net buoyancy of the profiler, er is the distance between the profiler and target position, vr is the speed of the profiler, a is the acceleration of the profiler, F is the net buoyancy, Δ F is the buoyancy change, c is the hydrodynamic secondary damping coefficient, v is the calculation speed, m is the mass of the profiler, mf is the additional mass of the profiler, which is only related to the shape of the profiler and has nothing to do with the state of motion, d is the dive distance of the profiler in the simulation, and e , δ , ε are the distance threshold, velocity threshold, and net buoyancy threshold, respectively.
During the descending process of the profiler, the velocity of the profiler and position deviations data are collected every 1 s. According to these input data, the microcontroller performs simulation operations to determine whether the solenoid valve should be turned on. In the simulated operation, it is assumed that solenoid valve 1 is opened, the high-pressure oil in the accumulator enters the external bladder, and the net buoyancy of the profiler gradually decreases to neutral buoyancy, and the velocity gradually decreases to zero due to the resistance of water. The movement distance of the profiler from the opening time of solenoid valve 1 to zero speed is d. If the profiler could reach the predetermined target position before the speed drops to 0, it will turn on. If it cannot reach the target position, it continues to wait for the next input. To reduce the number of loop calculations, a larger time step value such as Δ t = 1   s is used. If a more accurate simulation value wants to be obtained, a smaller time step value such as Δ t = 0.1   s is required. The values such as d , v , F will be treated as 0 if they are less than e , δ , ε . These thresholds are set as e = 0.1   m , δ = 0.01   m / s , ε = 0.1   N in the experiment. When the speed of the profiler drops to zero, d is the maximum value, and it represents the distance that the profiler can continue to dive. d < e means that the profiler cannot reach the predetermined depth if the solenoid valve is turned on at this time, so the profiler should continue to dive, and the microcontroller of the profiler waits for the next input.

3.2. Depth Control Algorithm That Profiler Driven by Electric Energy

The motion of a profiler is usually affected by water currents and the buoyancy changes caused by seawater density. However, the flow direction of energy driven by thermal energy is unidirectional; buoyancy can only increase but not decrease because the high-pressure oil in the accumulator can only enter the outer oil bladder with relatively low pressure. Therefore, besides the ocean thermal energy drive control algorithm, the electric energy drive control algorithm in which the buoyancy can be increased or decreased by the transfer of the oil between internal cylinder and external cylinder should also be carried out to maintain the profiler at a fixed depth range. Through the analysis and comparison of different control algorithms, the sliding mode variable structure control algorithm is finally selected as the electric energy drive control algorithm of the profiler because it has better robustness.
Sliding mode control is a nonlinear control technology that can use discontinuous control signals to adjust the nonlinear system. In the control, the system state will reach the sliding surface in a finite time, and then the system state will be constrained on the sliding surface, and finally reaches a stable state.
(1)
Sliding mode control method
The motion of the profiler in the water can be expressed by the following equation:
{ ( m p + m f ) x ¨ + c x ˙ | x ˙ | + d = u u = ρ g V o + F o
Among them, m p is the profiler mass, m f is the additional mass of the profiler, x is the profiler displacement, x ˙ is the velocity, x ¨ is the acceleration, c is the hydrodynamic secondary damping coefficient, d is the disturbance force, including the change of buoyancy caused by water density and force caused by waterflow. Assume | d ( t ) 1   N | , according to the movement of the profiler in the water. ρ is the density of water, g is the acceleration of gravity, V o is the volume of the external oil bladder, Fo is the initial net buoyancy of the equipment, and u is the net buoyancy of the profiler in seawater. When V o changes, the net buoyancy changes immediately without delay.
Since the above additional mass, m f , and the hydrodynamic secondary damping coefficient, c , cannot be obtained accurately, the following provisions are made here:
m min m = m p + m f m max
c min c c max
Among them, mmin is the smallest possible mass of the profiler, and mmax is the largest possible mass. cmin is the smallest possible hydrodynamic secondary damping coefficient, and cmax is the largest possible hydrodynamic secondary damping coefficient.
Introduce a new variable s ( e , e ˙ ) , where e ( t ) = x ( t ) x d ( t ) represents the deviation of the profiler’s real-time displacement x from the target position x d . e ˙ ( t ) is the derivative of e ( t ) . To define that the sliding mode surface, s satisfies the following equation:
s ( e , e ˙ ) = e ˙ ( t ) + λ e ( t ) = 0
where λ is a positive number, and e e ˙ < 0 . Therefore, when t + , e 0 , e ˙ 0 , and the system state can slide to zero state from the sliding mode surface.
In order to ensure that the system can slide to the sliding mode surface at any state point, the Lyapunov equation V = 0.5   s 2 is used, and the following equation is derived:
V ˙ = s s ˙ = s [ ( u c x ˙ | x ˙ | d ) / m + λ e ˙ x ¨ d ]
The control input u satisfies the following equation:
u = u e q + u c
Define ueq as:
u e q = m ^ ( x ¨ d λ e ˙ ) + c ^ x ˙ | x ˙ | + d ^
Define uc as:
u c = K s a t ( s H ) = { K s > H K s H | s | < H K s < H
where u e q is the equivalent control input, which can maintain the system state on the sliding mode surface, and u c is the switching function, which can make the system state slide and vibrate along the sliding mode surface. H is a positive number, which represents the thickness of the slip boundary layer. m ^ is the estimated value of mass, c ^ is the estimated value of hydrodynamic secondary damping coefficient, and d ^ is the estimated value of disturbance force.
Substituting Formulas (6)–(8) into Formula (5), the following equation can be obtained:
V ˙ = s [ ( m ^ m ) ( x ¨ d λ e ˙ ) + ( c ^ c ) x ˙ | x ˙ | + ( d ^ d ) K s a t ( s / H ) m ]
To ensure V ˙ η | s | , where η is positive, it represents the speed at which the state approaches the sliding mode surface. It can be derived from the above formula that the coefficient K satisfies the equation:
K | m ^ m | | x ¨ d λ e ˙ | + m η + | c ^ c | x ˙ 2 + | d ^ d |
Define τ = m max / m min , therefore τ 1 m ^ / m τ . Definition | c ^ c | σ .
Choose K to satisfy the following equation:
K m ^ ( τ 1 ) | x ¨ d λ e ˙ | + m ^ τ η + σ x ˙ 2 + | d ^ |
According to the volume change of PCM carried by the profiler, the theoretically calculated buoyancy adjustment range of the profiler is ±3.5 N, so the control output u should be limited to this range, and the sliding mode control output u can be obtained to satisfy the equation:
u = { 3.5 u > 3.5   N m ^ ( x ¨ d λ e ˙ ) + c ^ x ˙ | x ˙ | + d ^ K s a t ( s / H ) | u | 3.5   N 3.5 u < 3.5   N
(2)
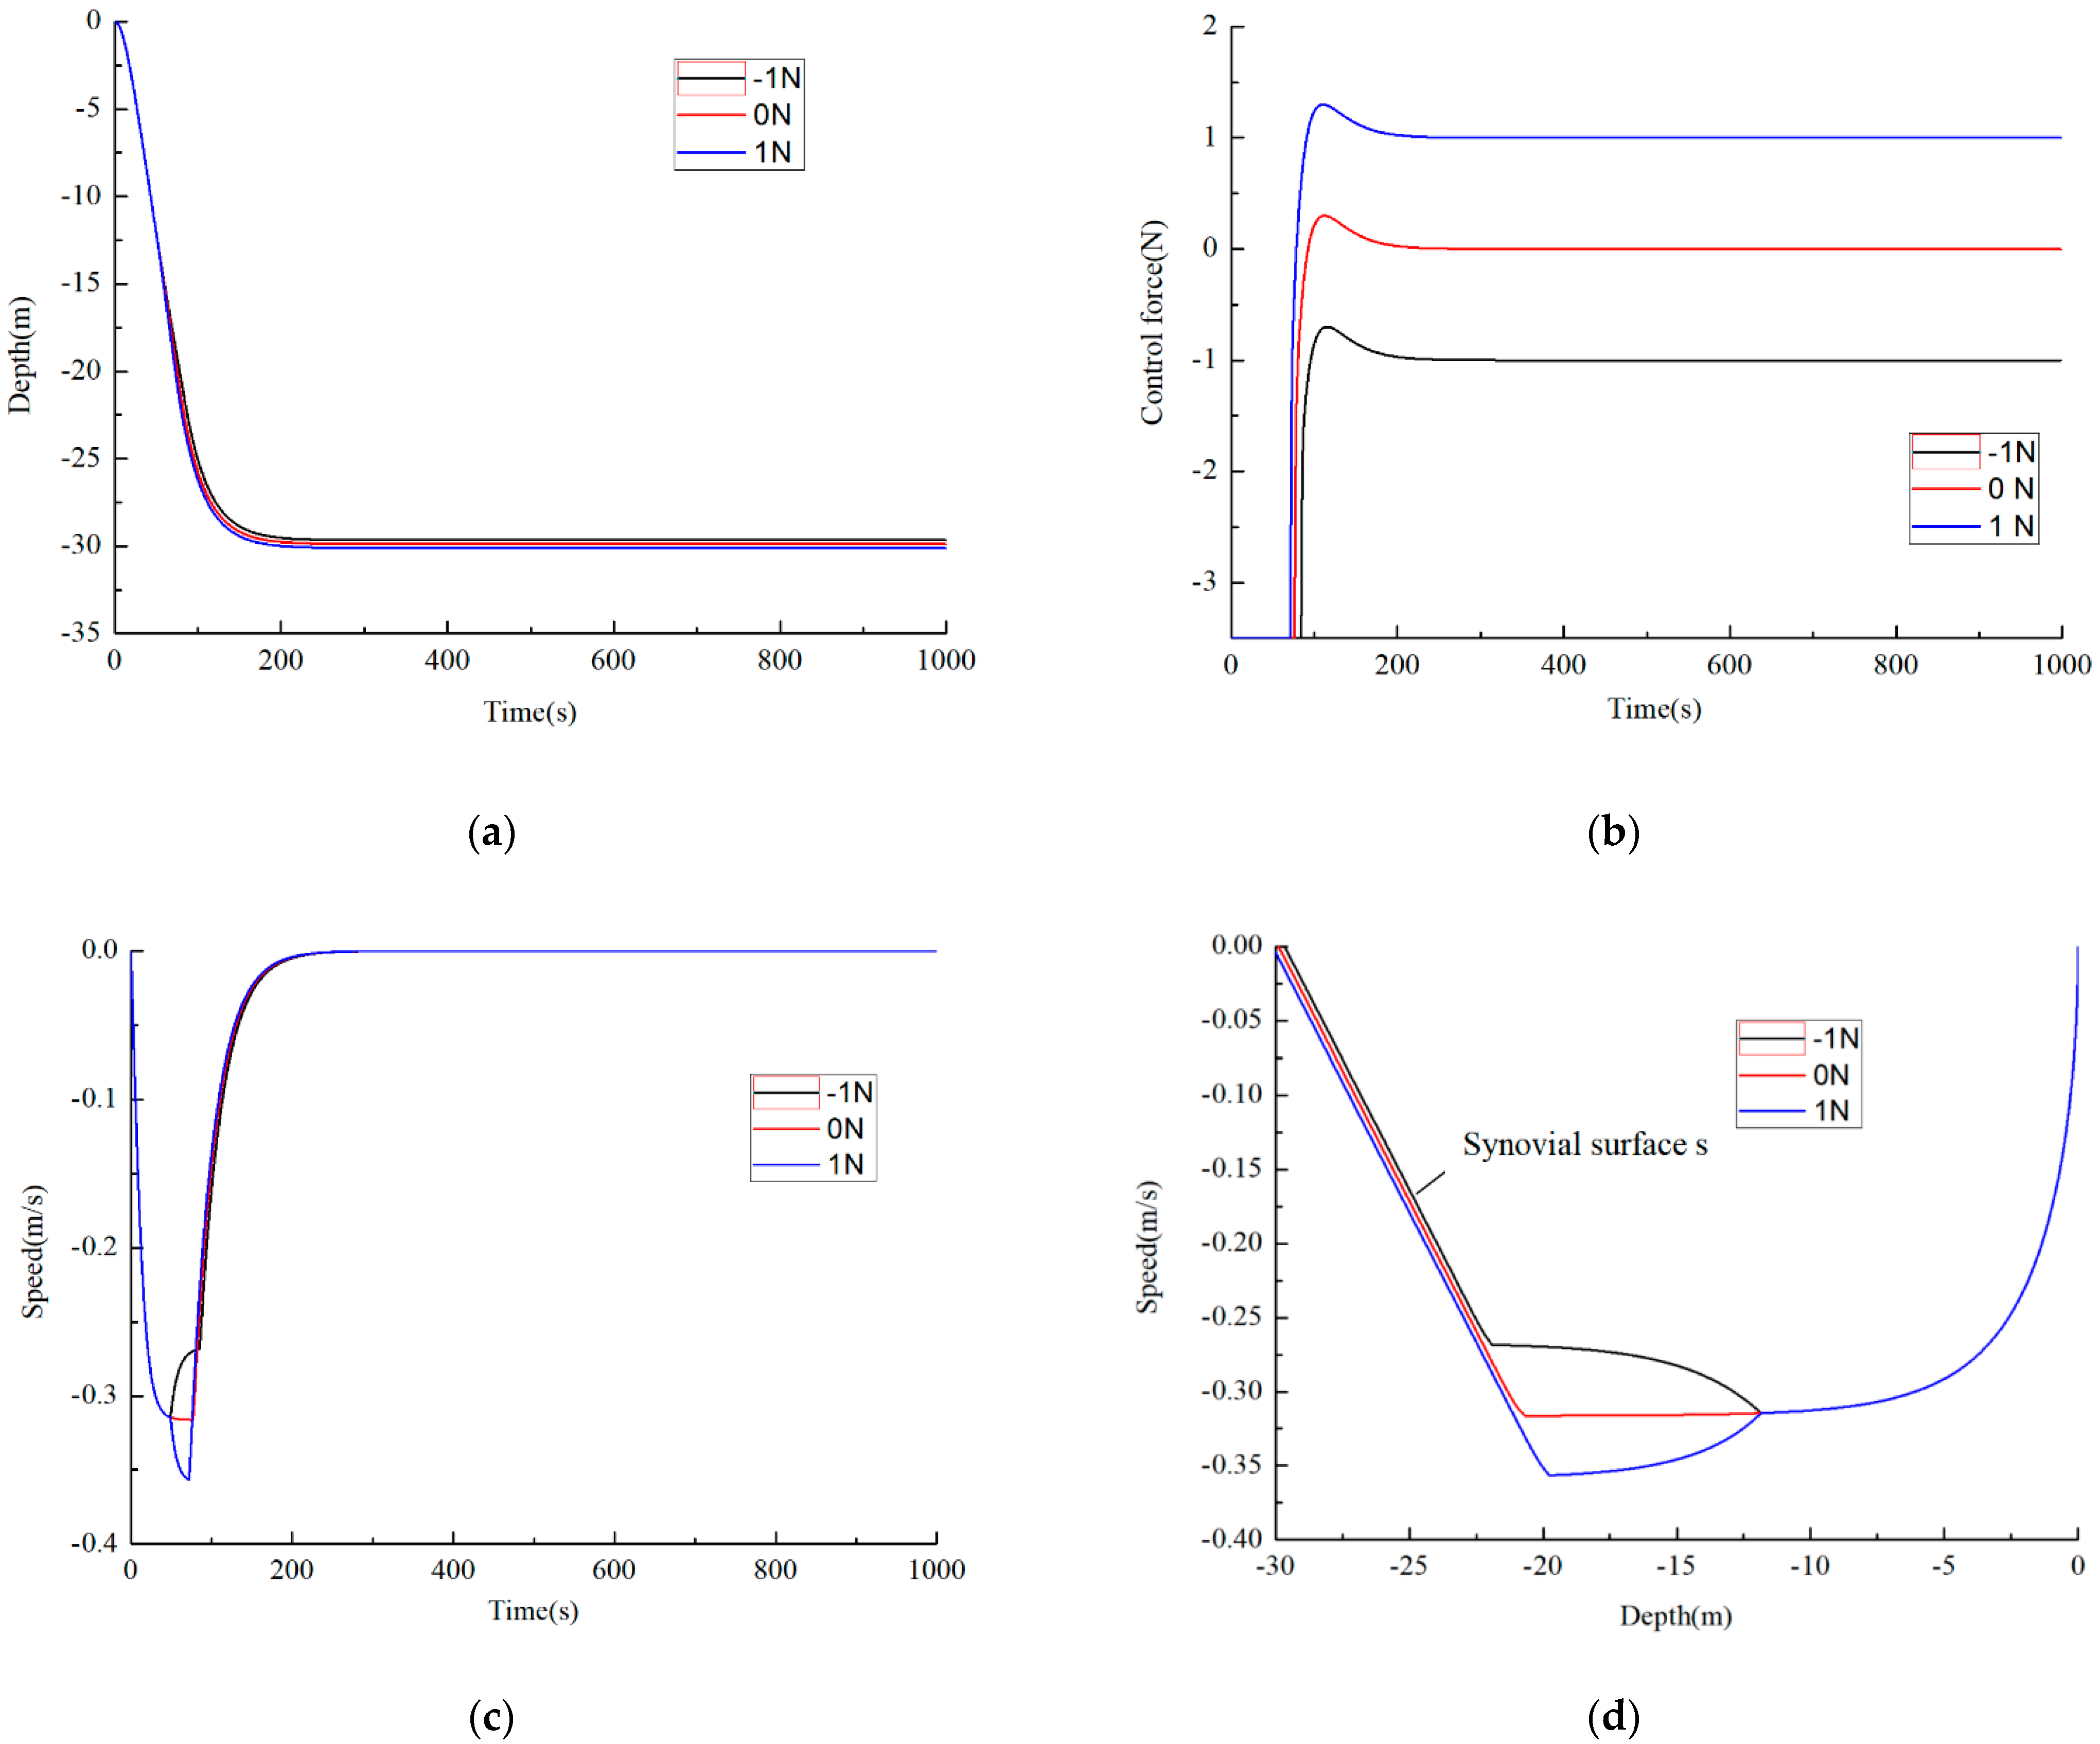
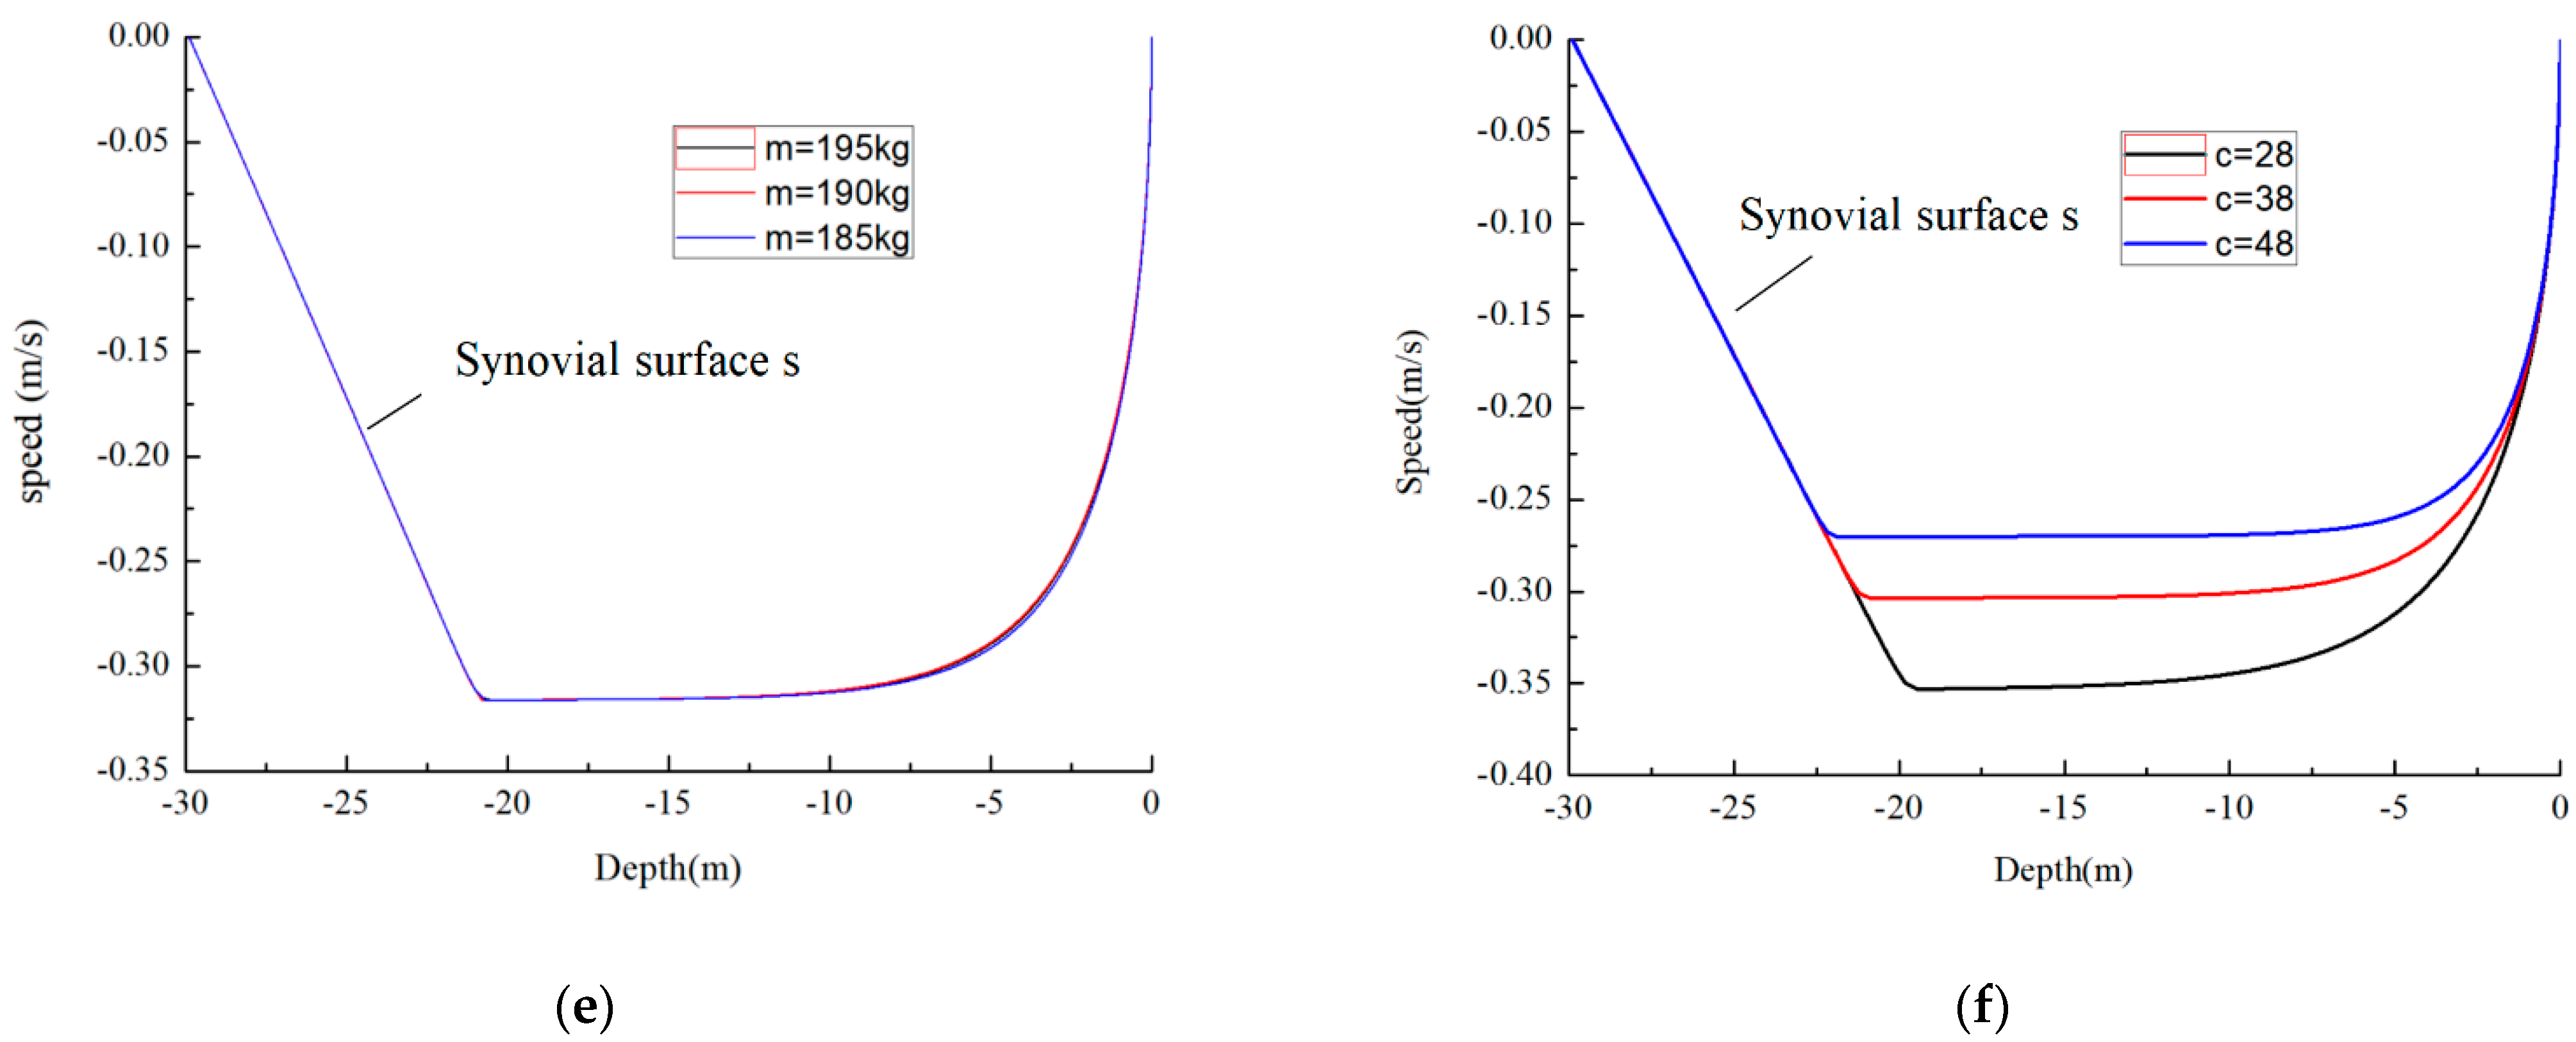
Simulation analysis of the sliding mode control
The simulation curve of the sliding mode control is shown in Figure 3. When the profiler was dived to the water depth of −12 m (about 50 s), 1 N, 0 N, and −1 N disturbance force was added, respectively, and the response results are shown in Figure 3a–d. As shown in Figure 3a, it can be seen that the profiler can dive and stabilize at a depth of about −30 m under different disturbance forces. The control force will change automatically according to the disturbance force, which is shown in Figure 3b. As shown in Figure 3c, the diving speed of profiler increases when a force of 1N is added on, and decreases when the force is −1 N. After adjustment, the speed drops to 0. The trajectory-tracking phase diagram (Figure 3d) shows clearly how the state changes when the different disturbance forces are added. After a period of adjustment, the state came to the synovial surface and eventually reached the origin (‘0, 0’). So, the controller has good disturbance-rejection ability. Figure 3e is the trajectory-tracking phase diagram of a different mass, which shows the states of the parameters during the control process. There is minor change in the system state (speed and location) after changing the mass. The system state can reach the synovia surface at a water depth of −22 m when the mass changes, so the controller has good robustness. The trajectory-tracking phase diagram of the different damping coefficients is shown in Figure 3f. Increasing the damping coefficients will slow down the speed to reach the synovial surface, but the state will eventually reach the surface, and then moves along the synovial surface until the velocity drops to 0. The simulation results prove that the controller has good robustness.
The simulation curve of the conventional PID depth controller is shown in Figure 4. The response time is about 300 ms, which is much larger than the 200 ms of SMC; the water depth overshoot is 2.5 m, and there is no overshoot when SMC is used, the control force overshoot is about 0.9 N, and it is about 0.3 N when using SMC, which means more energy needs to be consumed when using the PID controller. Therefore, compared with the PID controller, the SMC method has significant advantages in terms of response speed, overshoot, and energy saving.

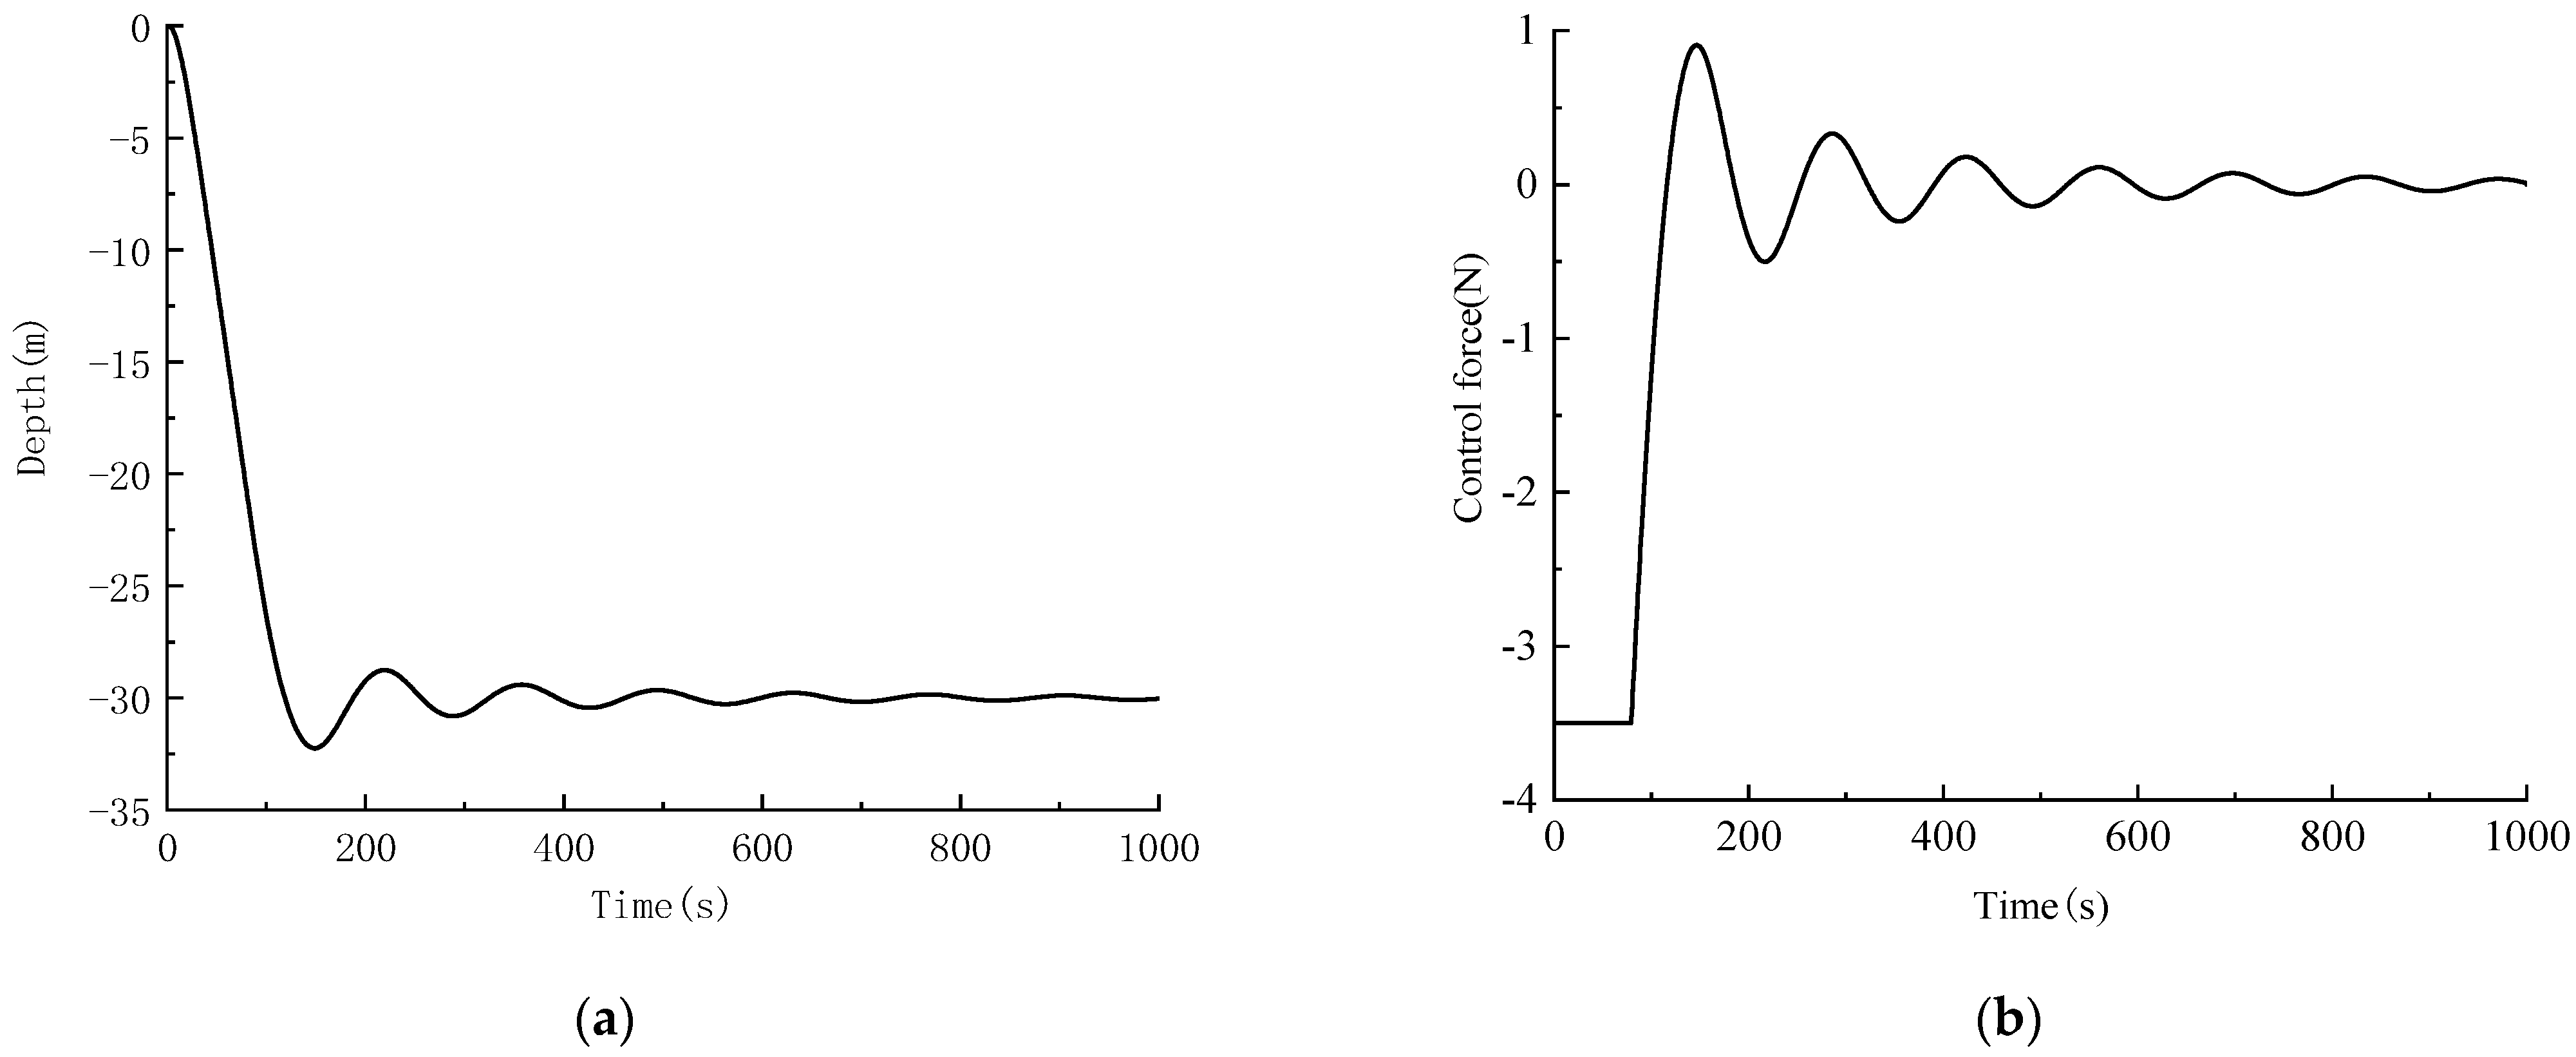
3.3. Depth Control Algorithm That Profiler Driven by Electric Energy and Ocean Thermal Energy

In this profiler, the ocean thermal energy is converted into hydraulic energy, which is stored in the accumulator through the melting and expansion of the PCM. Ideally, the accumulator releases the half volume of the oil to the external cylinder to switch the profiler from negative buoyancy to neutral buoyancy and maintain the profiler at a fixed depth for a long time. However, due to the impact of water currents and changes in seawater density, the profiler cannot maintain a fixed position for a long time. Therefore, the strategy of combining thermal energy and electric energy for depth control is studied. The depth control strategy of the profiler is shown in Figure 5. The depth-control algorithm of the profiler driven by ocean thermal energy, which is shown in Section 3.1, is used first in this strategy, and then the algorithm driven by electric energy, which is shown in Section 3.2, is used. The piston displacement of the external cylinder, which is used to measure the change in buoyancy, depth deviation, and velocity data of the profiler, are collected for depth control. In this algorithm, the mechanical energy stored in the accumulator, which is the primary energy source for depth control, is responsible for the conversion of the profiler from a negative buoyancy state to a neutral buoyancy state. Electrical energy stored in the battery is responsible for the fine adjustment of buoyancy to ensure that the profiler does not escape the wanted water depth range.

4. Experimental Results

The profiler adopts the principle of the new fluid control system for the buoyancy adjustment system, which is shown in Figure 1, and the main parameters are shown in Table 1. Figure 6 shows the profile and internal structure of the profiler. Solid buoyancy materials are installed on the profiler to make buoyancy equal to gravity, and demos are equipped with diversion covers to reduce flow resistance. The upper flow cover is equipped with a depth sensor and a temperature sensor. The lower cover is equipped with the external cylinder and external bladder. Ten thermal engines are evenly arranged on the outside of the main cavity for thermal energy capture. The thermal engines are connected to the lower end cover of the profiler through titanium alloy tubes, and then connected to the hydraulic manifold block, which is composed of pressure sensors, solenoid valves, check valves, and other hydraulic components. By installing the pull wire displacement sensor in the inner cylinder and magnetostrictive displacement sensor in the external cylinder, it is possible to accurately measure the oil absorption volume from the internal cylinder to the thermal engines and the oil discharge volume from the accumulator to the external cylinder.
In applications, the function of staying in a certain depth for long-term monitoring is needed. Therefore, the depth-control mechanism is designed for this profiler, and the depth-control performance evaluation test was carried out based on the aforementioned research.
(1)
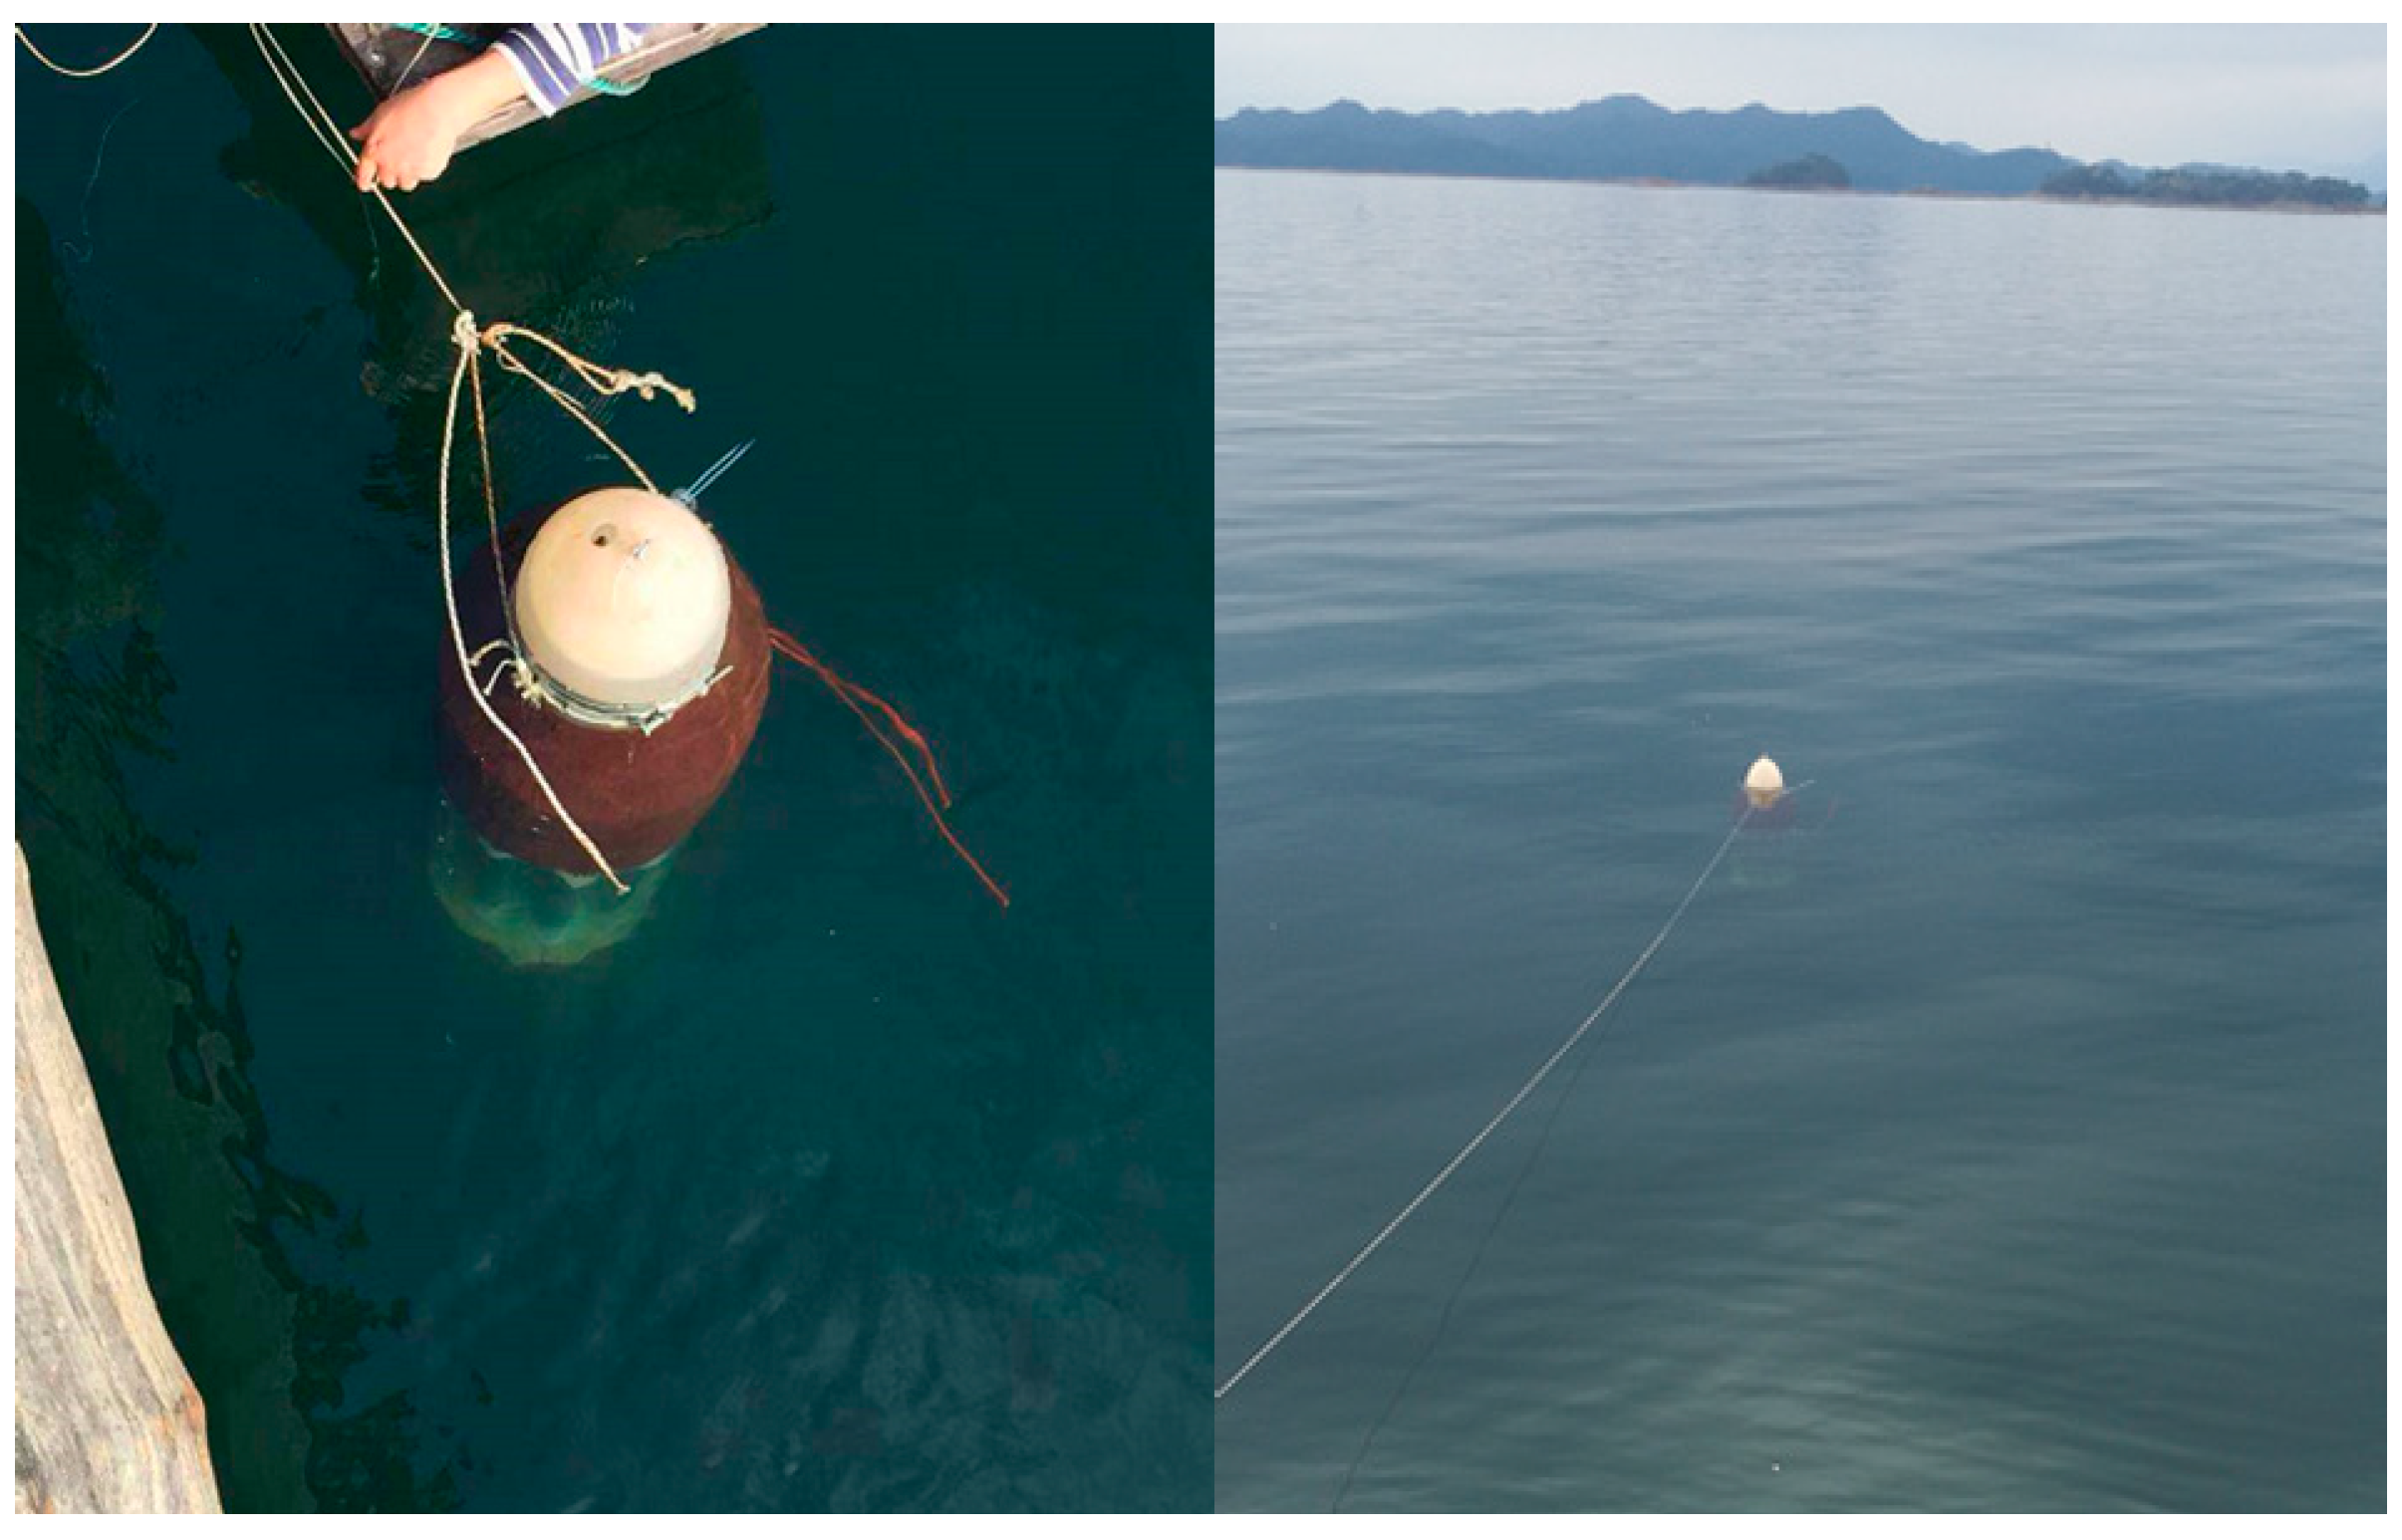
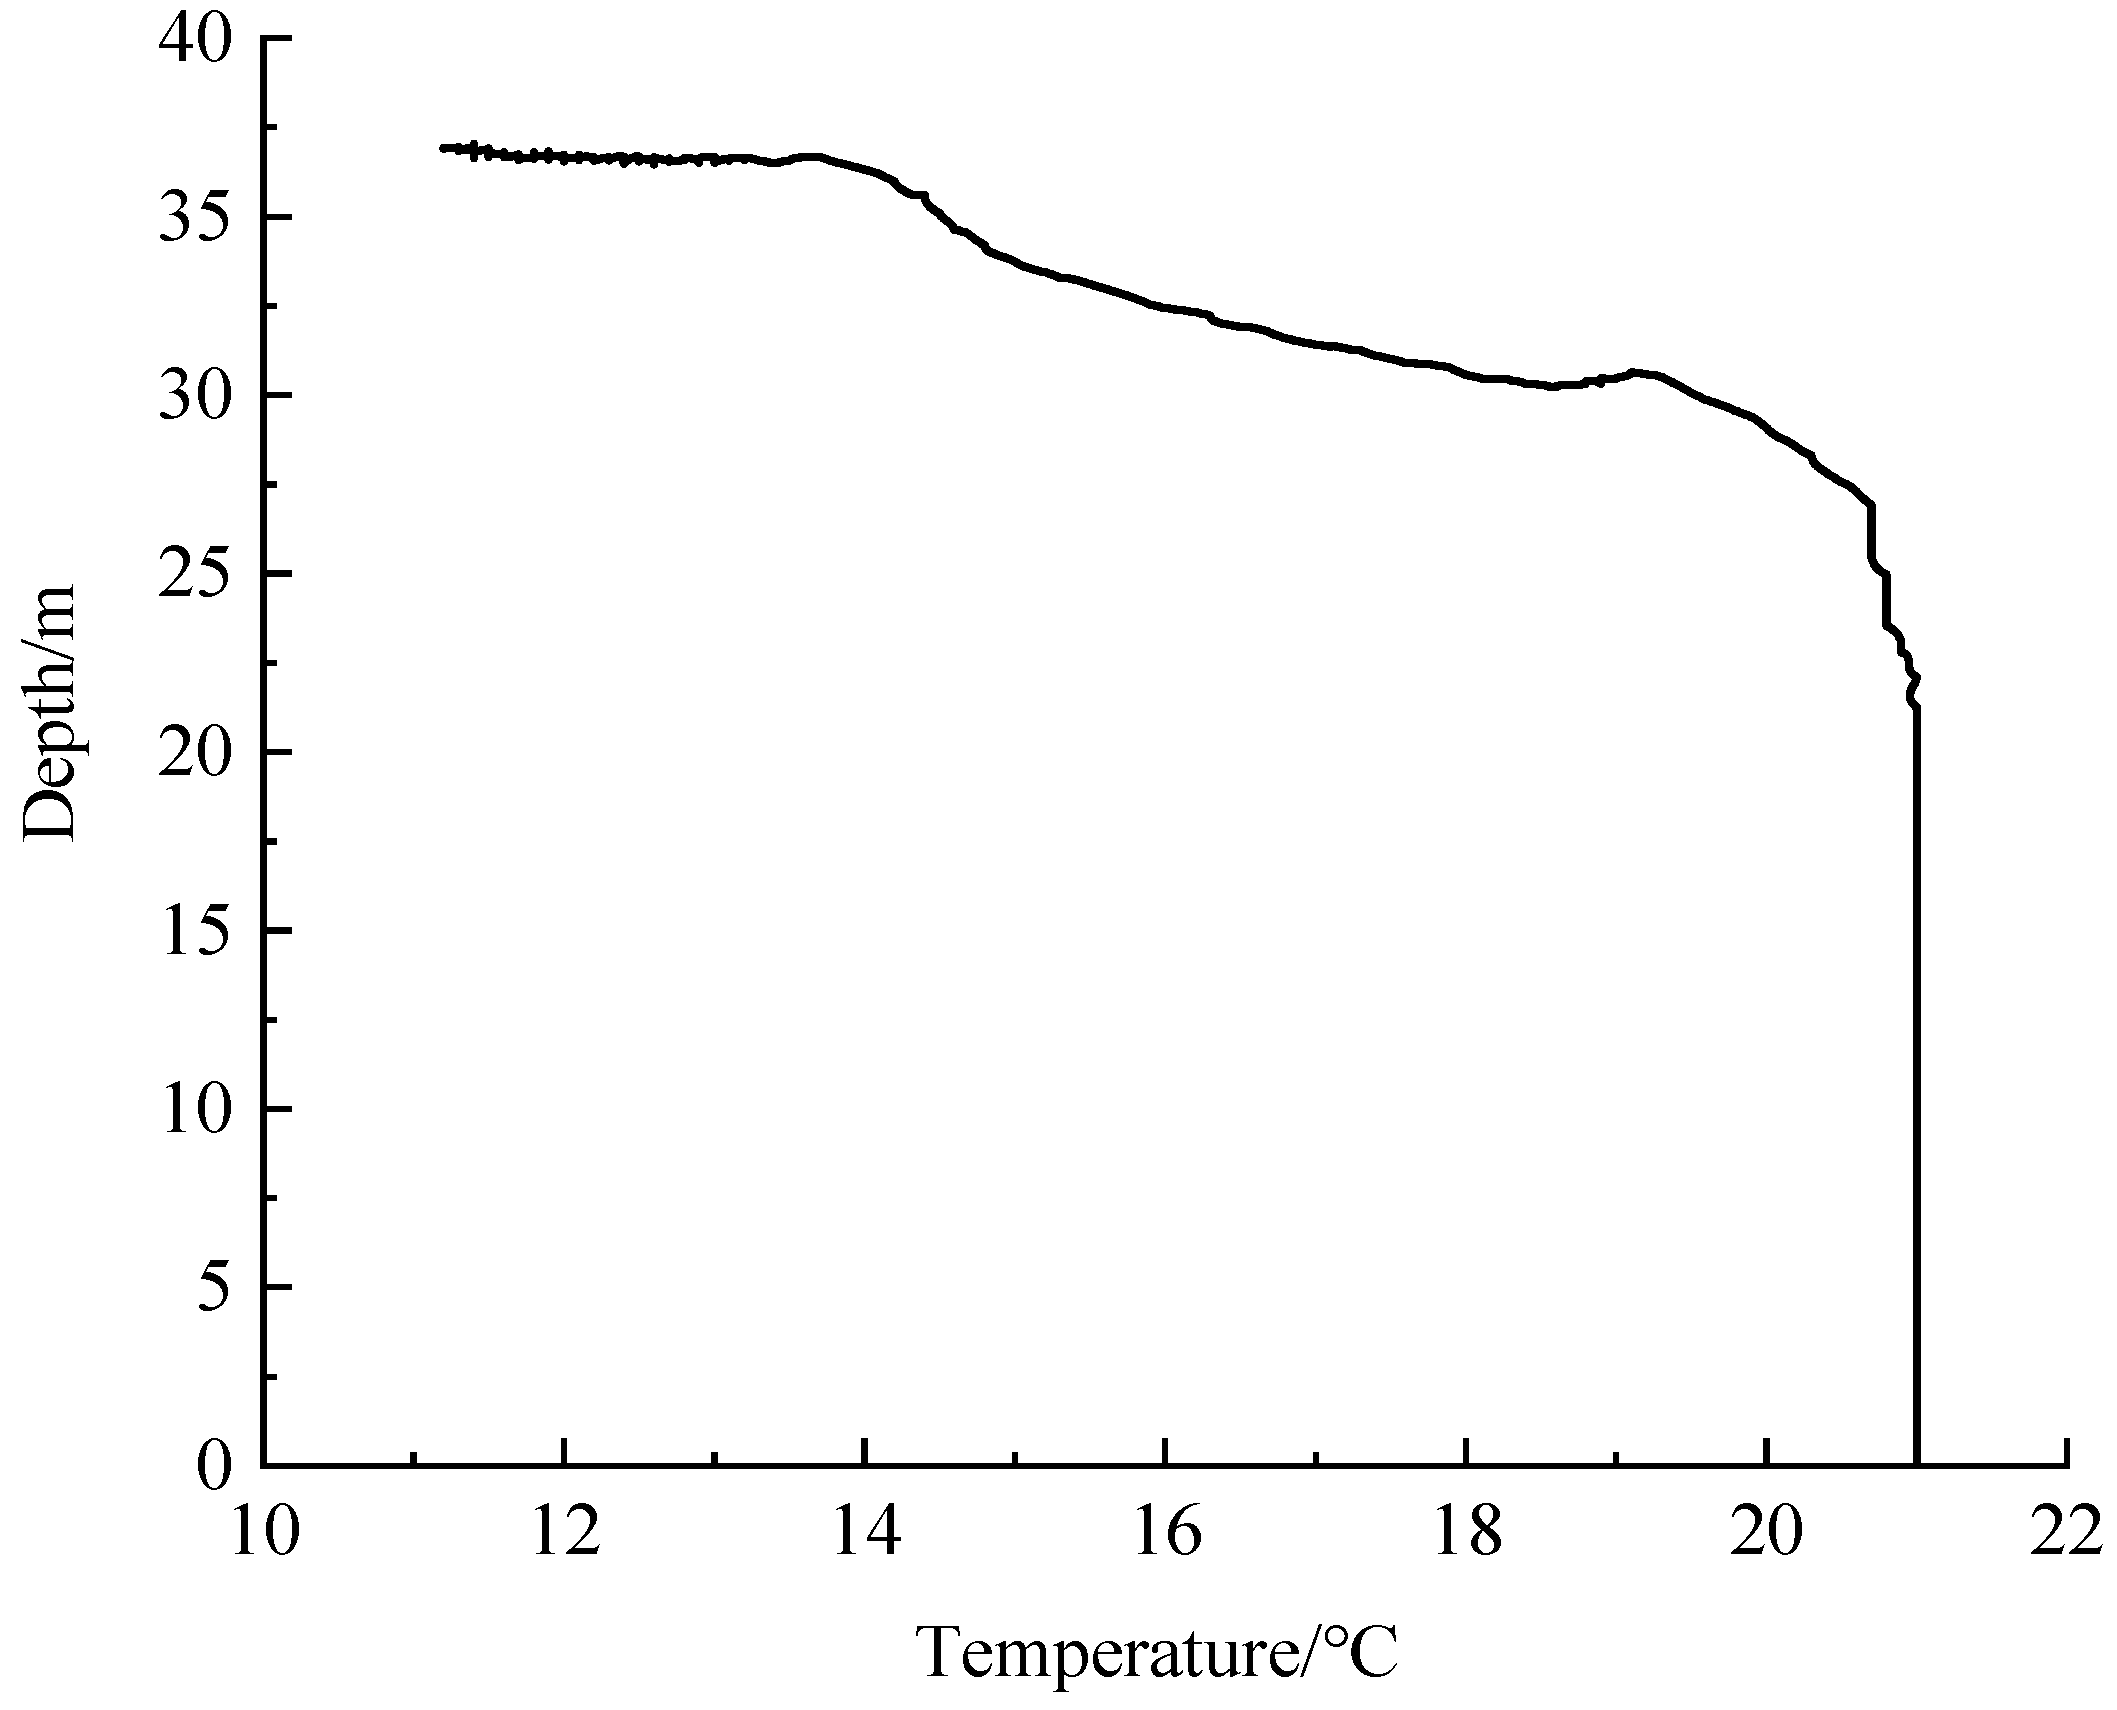
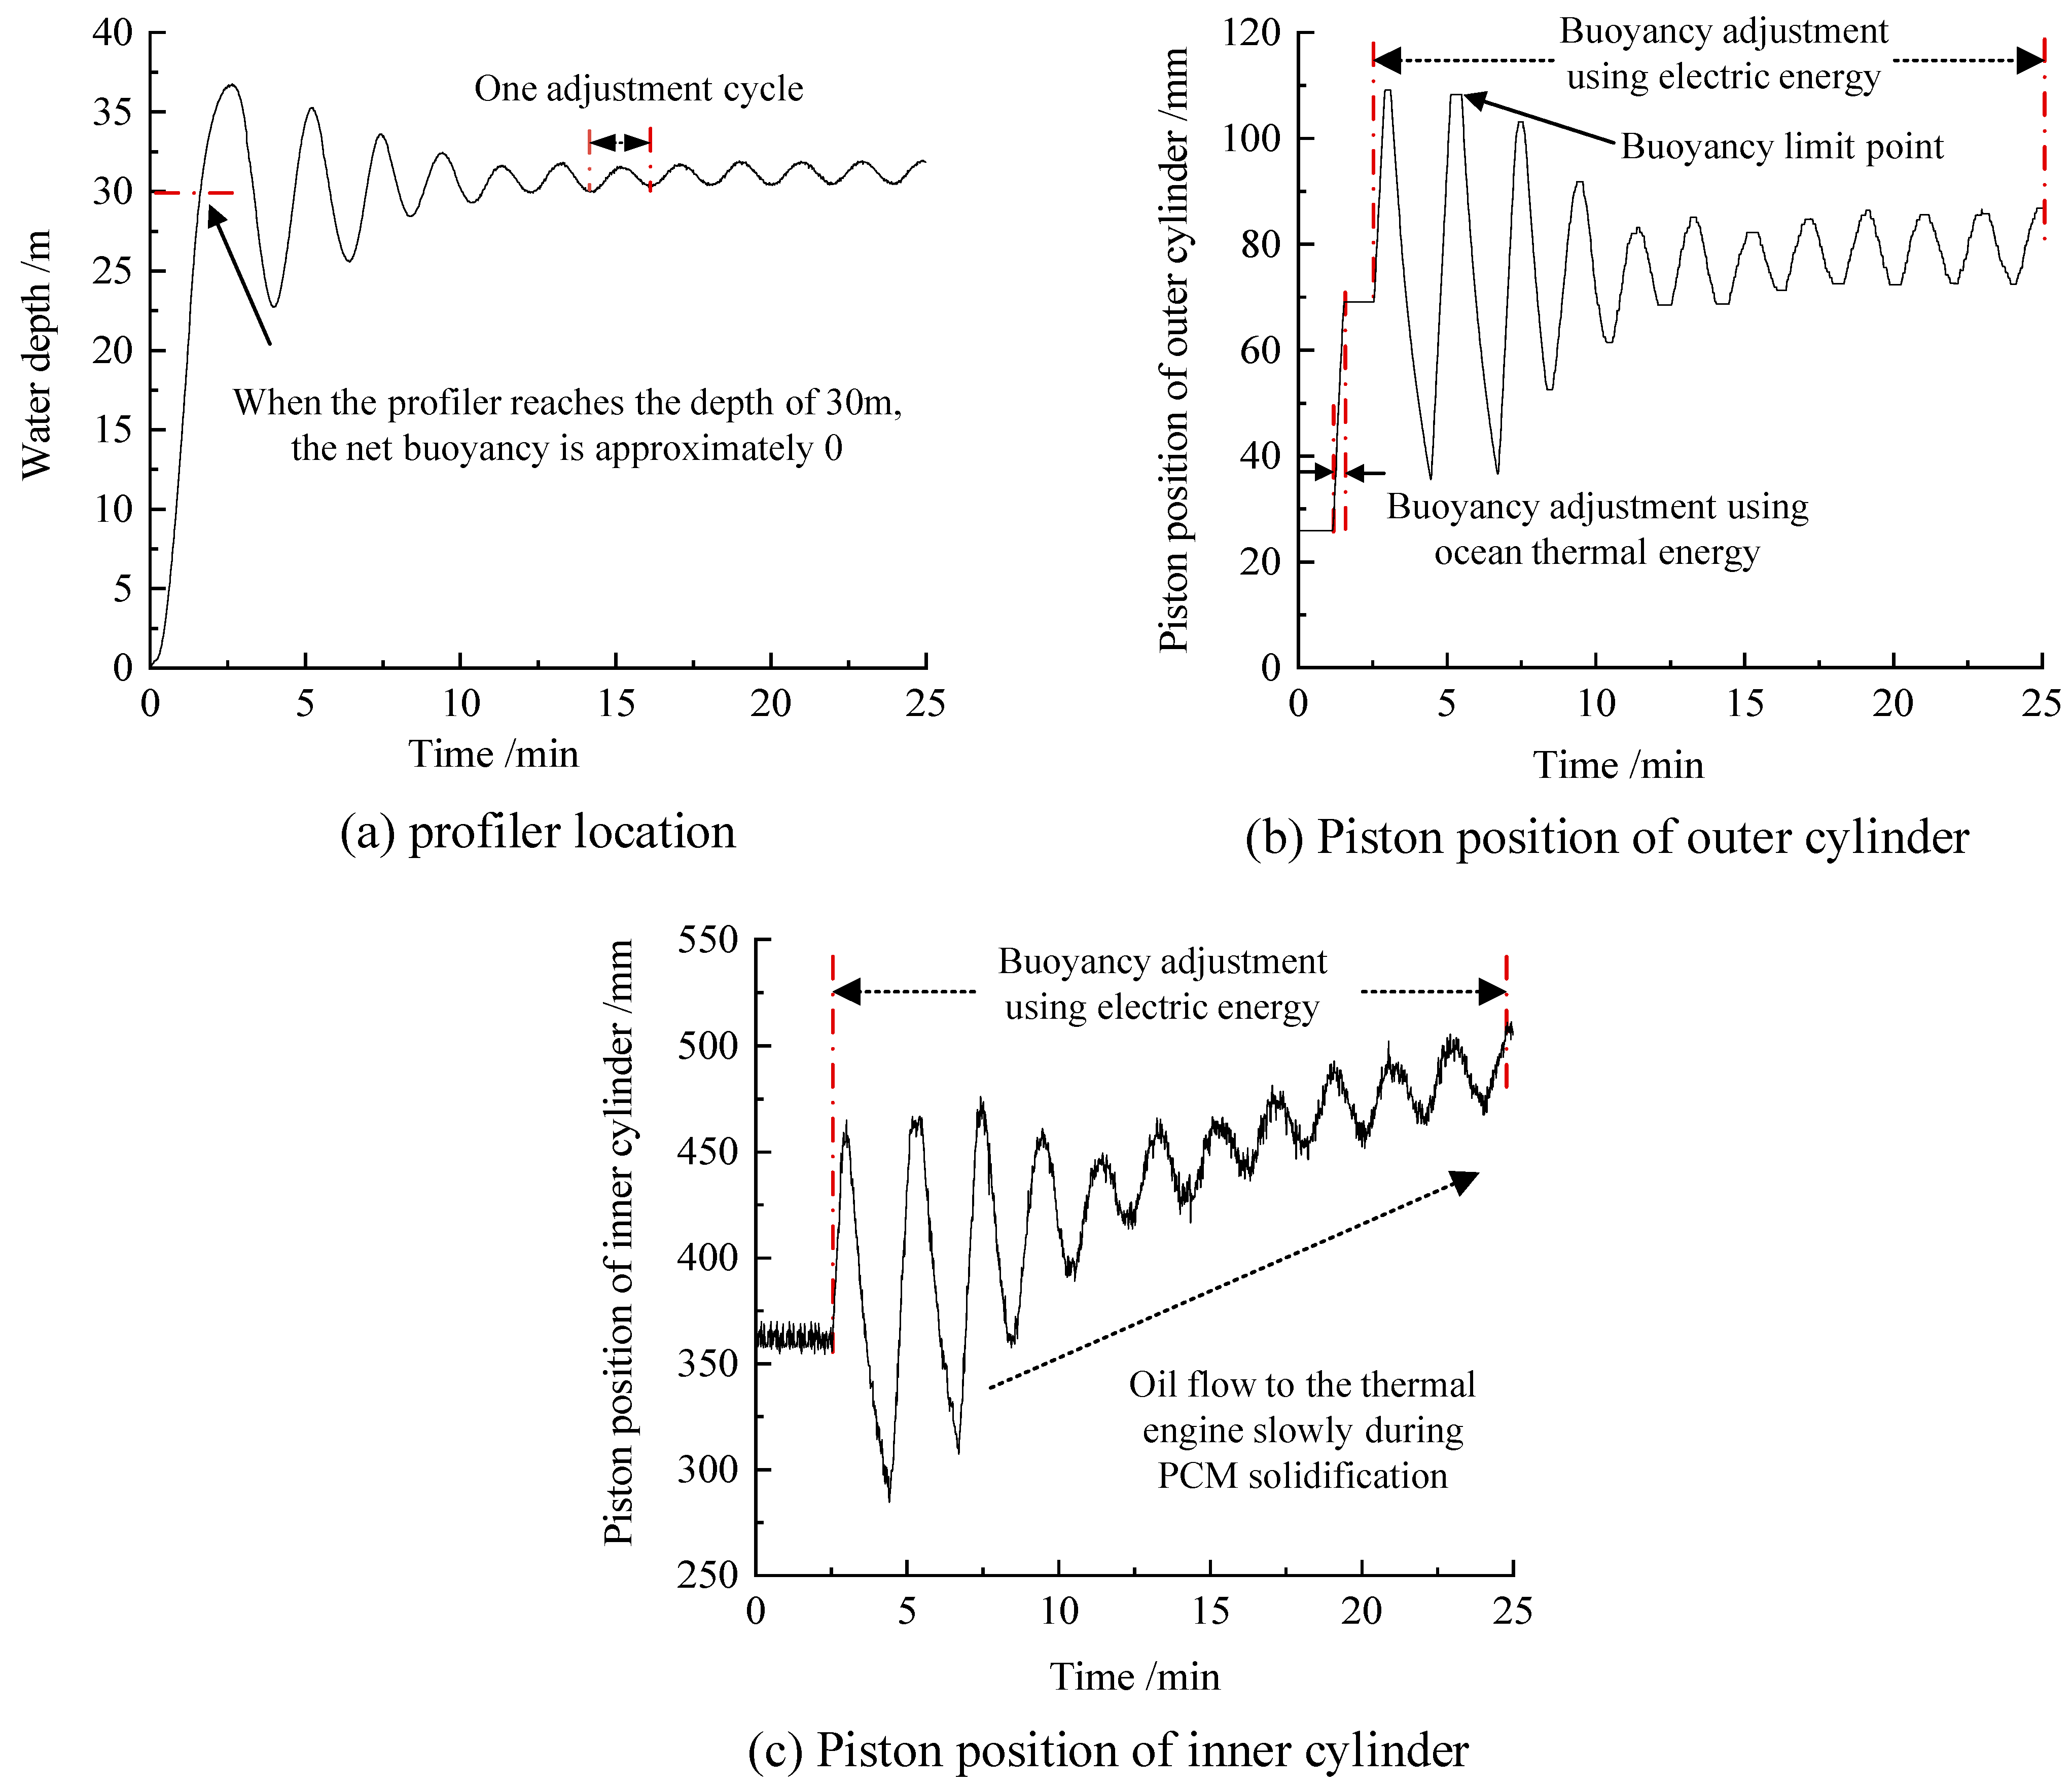
Fixed-depth-control test in the lake
The fixed-depth-control experiment site was selected to be Qiandao Lake, and the water depth of the experimental site was 48 m. In order to prevent bottoming, the water depth of 30 m was set for the fixed-depth control. To avoid the loss of the profiler, a zero-buoyancy rope was fastened on the profiler. To minimize the influence of the tension of the rope on the movement of the profiler, the rope was designed to be long enough to drift with the profiler without causing traction on the profiler. The lake test site is shown in Figure 7:
Before the depth-control experiment, we first use the profiler to obtain the temperature information alongside the depth profiles of the lake; the result is shown in Figure 8. In the depth range of 0–20 m, the temperature is basically maintained at 21 °C. The depth range of 20–36 m is the thermocline of the lake, where the water temperature decreases from 21 °C to 11 °C. The temperature conditions of the lake meet the phase-transition conditions of the PCM, and the thermal energy can normally drive the profiler.
In the lake test, the depth-control strategy shown in Section 3.3 was applied. The data of the lake test is shown in Figure 9. Figure 9a shows the curves of the profiler location. The profiler can finally be stabilized within a depth of 30.8 ± 1 m area after the initial shock. Because the net buoyancy of the profiler in the water is nearly zero, a small fluctuation such as a current shock can cause the profiler to oscillate. As shown in Figure 9b, the piston of the external cylinder (closely related to buoyancy) starts to move at 1.25 min and end at 1.56 min; during this process, 350 milliliters of fluid were injected into the external oil bladder and maintain the profiler in a state of approximately neutral buoyancy. The driving energy of this process is the thermal energy captured by PCM instead of electric energy. According to the external pressure (0.3 MPa) and the volume change of the external oil bladder (350 mL), electric energy of 105 J was saved. The saved energy is related to the water depth and volume. In the subsequent time, according to the water depth position of the profiler, the pump and the solenoid valve 2, which are driven by electric energy, operate alternately. The buoyancy increases when the pump operates and the buoyancy decreases when the valve opened, and the piston position of the external cylinder changes alternately. As shown in Figure 9c, the piston position of the inner cylinder changes in the same trend as that of the outer cylinder, except it gradually increases. Because the temperature in the deep-water area is lower than the phase-change temperature, the oil flows from the internal cylinder to the thermal engine as the phase-change material solidifies, so the oil volume of the inner cylinder decreases and the piston position increases gradually. Due to the flow of the lake water, the profiler cannot be completely stationary at a certain depth. To stop the variation, there is an oscillation of the piston, which is used to regulate the buoyancy at the steady-state in the experiment. Taking into account the influence of the lake-bottom current, the large profiler mass (185 kg), and the small buoyancy adjustment (±3.5 N), the depth control strategy achieves relatively satisfactory results.
(2)
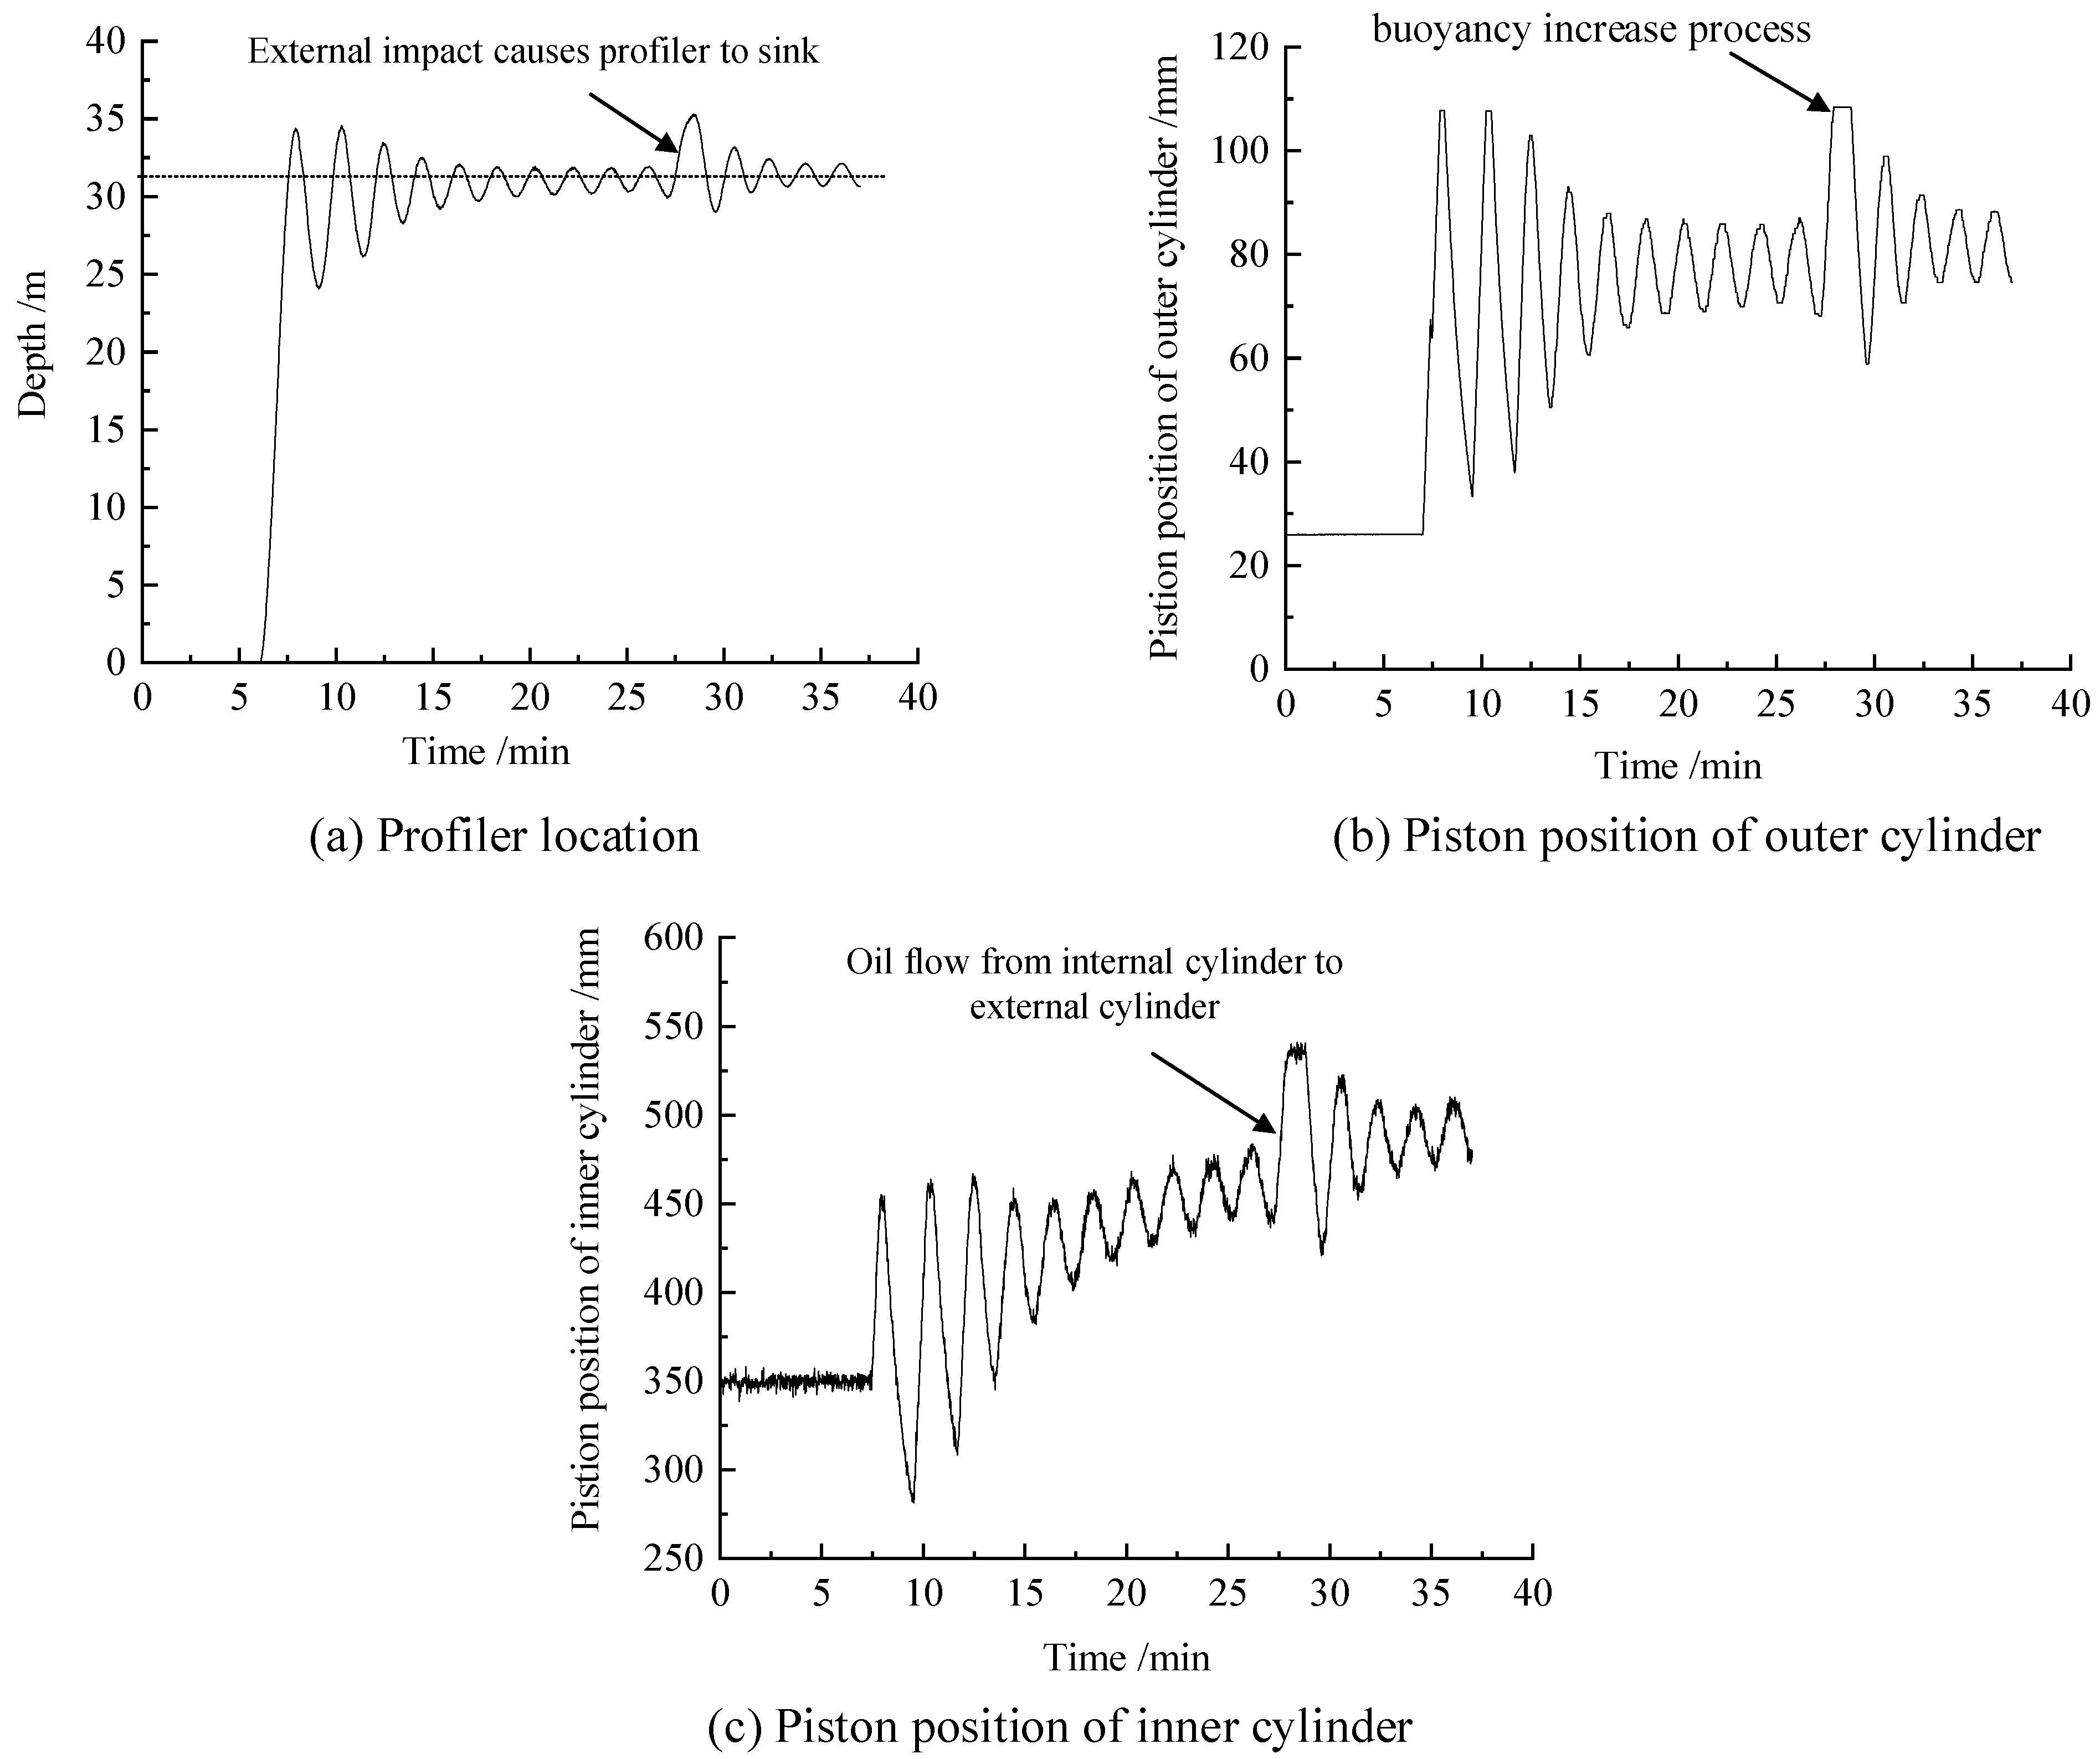
Fixed-depth-control disturbance experiment
Various conditions, such as upwelling and downstream in the ocean, changes of seawater density, etc., will affect the motion of the profiler. In order to verify the depth control ability of the profiler under interference, a 1 N weight is placed along the rope to produce an impact on the profiler after the profiler reaches a steady state. As shown in Figure 10, the profiler took a hit at 28 min and deviated from the stable point; the piston position of the external cylinder increases, which means the buoyancy increases. After five minutes of adjustment, the position returned to a steady state.

5. Conclusions

In order to get ocean monitoring data at a fixed water depth, a new fluid control system for buoyancy regulation was designed and a hybrid-actuator depth control algorithm was studied in this paper. The fluid control system with depth control function were driven by temperature difference energy and electrical energy. The depth-control algorithm consists of two parts: a new depth-control algorithm used for ocean thermal energy driving and the sliding mode variable structure depth-control algorithm used for electric energy driving. Ocean thermal energy is responsible for the profiler’s state switching from a negative buoyancy state to neutral buoyancy state, and the electric energy is responsible for fine-tuning near the neutral buoyancy point. Simulations of the SMC and conventional PID control were conducted, and the results showed that the SMC method has advantages in terms of response speed, overshoot, and energy saving. In the experiment, the profiler, with a mass of 185 kg, was driven by a force of ±4 N and achieved a constant depth suspension at a water depth of 30.8 m with an oscillation of ±1 m, and it can return to a stable state even after a shock. The experiment results showed that the new control method can make the equipment reach the fixed water depth position, However, due to the complex waterflow environment, the precision and stability of the controller need to be further improved. The main application of profilers is to monitor the water quality on a water-body profile. For example, the future profiler is able to monitor a certain range of water depth, i.e., from 100 m to 150 m, not at a fixed water depth. Therefore, a specific algorithm needs to be investigated in the future to improve the control ability of energy saving within a particular range of water depths.

Author Contributions

Conceptualization, Q.X.; methodology, Q.X.; software, B.C. and S.Z.; validation, B.C. and X.S.; formal analysis, Q.X.; investigation, Q.X. and B.C. and X.S.; resources, C.Y. and Y.C.; data curation, B.C. and X.S.; writing—original draft preparation, Q.X. and B.C.; writing—review and editing, B.C. and X.S. and S.Z.; visualization, X.S.; supervision, C.Y. and Y.C.; project administration, Q.X.; funding acquisition, C.Y. and Y.C. All authors have read and agreed to the published version of the manuscript.

Funding

This work was supported by Natural Science Foundation of Zhejiang Province of China (No.LQ20E090008), the National Natural Science Foundation of China (51879232, 51979246), Ningbo Science and Technology Innovation 2025 Major Special Project (2021Z095, 2021E008).

Institutional Review Board Statement

Not applicable.

Informed Consent Statement

Not applicable.

Data Availability Statement

Not applicable.

Conflicts of Interest

The authors declare no conflict of interest.

References

  1. Kim, H.; Choi, J.Y.; Park, J.; Ruda, M.; Prasad, R.; Chao, Y.; Choi, S. Towards the optimal operation of a thermal-recharging float in the ocean. Ocean. Eng. 2018, 156, 381–395. [Google Scholar] [CrossRef]
  2. Wang, Z.; Carriveau, R.; Ting, D.S.-K.; Xiong, W.; Wang, Z. A review of marine renewable energy storage. Int. J. Energy Res. 2019, 43, 6108–6150. [Google Scholar] [CrossRef]
  3. Khan, N.; Kalair, A.; Abas, N.; Haider, A. Review of ocean tidal, wave and thermal energy technologies. Renew. Sustain. Energy Rev. 2017, 72, 590–604. [Google Scholar] [CrossRef]
  4. Tian, B.; Yu, J. Current status and prospects of marine renewable energy applied in ocean robots. Int. J. Energy Res. 2019, 43, 2016–2031. [Google Scholar] [CrossRef]
  5. Wang, G.; Yang, Y.; Wang, S. Ocean thermal energy application technologies for unmanned underwater vehicles: A comprehensive review. Appl. Energy 2020, 278, 115752. [Google Scholar] [CrossRef]
  6. Webb, D.C.; Simonetti, P.J.; Jones, C.P. SLOCUM: An underwater glider propelled by environmental energy. IEEE J. Ocean. Eng. 2001, 26, 447–452. [Google Scholar] [CrossRef]
  7. Zhang, H.W.; Wang, Y.H.; Shu, H.C.; Wu, Y.Q.; Liu, D. Application and Improvement of the Interlayer Thermal Engine Powered by Ocean Thermal Energy in an Underwater Glider [C]. In Proceedings of the 2009 Asia-Pacific Power and Energy Engineering Conference, Wuhan, China, 27–31 March 2009; pp. 1–4. [Google Scholar]
  8. Chao, Y. Autonomous Underwater Vehicles and Sensors Powered by Ocean Thermal Energy; IEEE: Piscataway Township, NJ, USA, 2016. [Google Scholar]
  9. Haldeman, C.D.; Schofield, O.; Webb, D.C.; Valdez, T.I.; Jones, J.A. Implementation of Energy Harvesting System for Powering Thermal Gliders for Long Duration Ocean Research; IEEE: Piscataway Township, NJ, USA, 2015. [Google Scholar]
  10. Wang, G.; Yang, Y.; Wang, S.; Zhang, H.; Wang, Y. Efficiency analysis and experimental validation of the ocean thermal energy conversion with phase change material for underwater vehicle. Appl. Energy 2019, 248, 475–488. [Google Scholar] [CrossRef]
  11. Xia, Q.; Chen, Y.; Yang, C.; Zhang, T.; Zang, Y. A new model of phase change process for thermal energy storage. Int. J. Energy Res. 2018, 42, 3877–3887. [Google Scholar] [CrossRef]
  12. Ma, Z.; Wang, Y.; Wang, S.; Yang, Y. Ocean thermal energy harvesting with phase change material for underwater glider. Appl. Energy 2016, 178, 557–566. [Google Scholar] [CrossRef]
  13. Wang, G.; Yang, Y.; Wang, S.; Zhang, H.; Wang, Y. Modification of the phase change transfer model for underwater vehicles: A molecular dynamics approach. Int. J. Energy Res. 2020, 44, 11323–11344. [Google Scholar] [CrossRef]
  14. Xia, Q.; Chen, Y.; Yang, C.; Chen, B.; Muhammad, G.; Ma, X. Maximum efficiency point tracking for an ocean thermal energy harvesting system. Int. J. Energy Res. 2020, 44, 2693–2703. [Google Scholar] [CrossRef]
  15. Yang, Y.; Wang, Y.; Ma, Z.; Wang, S. A thermal engine for underwater glider driven by ocean thermal energy. Appl. Therm. Eng. Des. Processes Equip. Econ. 2016, 99, 455–464. [Google Scholar] [CrossRef]
  16. Kim, H.S.; Shin, Y.K. Expanded adaptive fuzzy sliding mode controller using expert knowledge and fuzzy basis function expansion for UFV depth control. Ocean. Eng. 2007, 34, 1080–1088. [Google Scholar] [CrossRef]
  17. Park, J.Y.; Kim, N.; Yoon, H.K.; Cho, H. Adaptive depth controller design for a submerged body moving near free surface. Appl. Ocean. Res. 2016, 58, 83–94. [Google Scholar] [CrossRef]
  18. Makavita, C.D.; Jayasinghe, S.G.; Nguyen, H.D.; Ranmuthugala, D. Experimental Study of a Command Governor Adaptive Depth Controller for an Unmanned Underwater Vehicle. Appl. Ocean. Res. 2019, 86, 61–72. [Google Scholar] [CrossRef]
  19. Qiao, L.; Ruan, S.; Zhang, G.; Zhang, W. Robust H2 Optimal Depth Control of an Autonomous Underwater Vehicle with Output Disturbances and Time Delay. Ocean. Eng. 2018, 165, 399–409. [Google Scholar] [CrossRef]
  20. Zhou, H.; Liu, K.; Xu, H.; Feng, X. Experimentally Verified Depth Control of an Unmanned Semi-submersible Vehicle. IEEE Access 2019, 7, 94254–94262. [Google Scholar] [CrossRef]
  21. Tiwari, B.K.; Sharma, R. Design and Analysis of a Variable Buoyancy System for Efficient Hovering Control of Underwater Vehicles with State Feedback Controller. J. Mar. Sci. Eng. 2020, 8, 263. [Google Scholar] [CrossRef] [Green Version]
  22. Zhou, H.; Wei, Z.; Zeng, Z.; Yu, C.; Yao, B.; Lian, L. Adaptive robust sliding mode control of autonomous underwater glider with input constraints for persistent virtual mooring. Appl. Ocean. Res. 2020, 95, 102027. [Google Scholar] [CrossRef]
  23. Mu, W.; Zou, Z.; Liu, G.; Yang, Y.; Shi, L. Depth Control Method of Profiling Float Based on an Improved Double PD Controller. IEEE Access 2019, 7, 43258–43268. [Google Scholar] [CrossRef]
  24. Qiu, Z.; Wang, Q.; Li, H.; Yang, S.; Li, X. Depth Control for a Deep-Sea Self-Holding Intelligent Buoy Under Ocean Current Disturbances Based on Finite-Time Boundedness Method. IEEE Access 2019, 7, 114670–114684. [Google Scholar] [CrossRef]
  25. Nguyen, N.D.; Choi, H.S.; Jin, H.S.; Han-Sol, J.; Huang, J.; Lee, J.H. Robust Adaptive Depth Control of Hybrid Underwater Glider in Vertical Plane. Adv. Technol. Innov. 2020, 5, 135–146. [Google Scholar] [CrossRef]
  26. Yang, Y.; Liu, Y.; Wang, Y.; Zhang, H.; Zhang, L. Dynamic modeling and motion control strategy for deep-sea hybrid-driven underwater gliders considering hull deformation and seawater density variation. Ocean. Eng. 2017, 143, 66–78. [Google Scholar] [CrossRef]
  27. Zhou, H.; Fu, J.; Liu, C.; Zeng, Z.; Yu, C.; Yao, B.; Lian, L. Dynamic modeling and endurance enhancement analysis of deep-sea gliders with a hybrid buoyancy regulating system. Ocean. Eng. 2020, 217, 108146. [Google Scholar] [CrossRef]
Figure 1. Principle diagram of the buoyancy adjustment system and the movement process.
Jmse 10 00640 g001
Figure 2. Flow chart of the depth control algorithm driven by ocean thermal energy.
Jmse 10 00640 g002
Figure 3. Simulation curves of the sliding mode control. (a) Depth curves at different external forces. (b) Control force curves at different external forces. (c) Speed curves at different external forces. (d) Trajectory−tracking phase diagram at different external forces. (e) Trajectory−tracking phase diagram at different mass. (f) Phase diagram at different damping coefficients.
Jmse 10 00640 g003aJmse 10 00640 g003b
Figure 4. Simulation curves of a PID controller. (a) Depth curves. (b) Control force curves.
Jmse 10 00640 g004
Figure 5. Schematic diagram of the profiler depth control strategy.
Jmse 10 00640 g005
Figure 6. The profiler prototype.
Jmse 10 00640 g006
Figure 7. The lake test site.
Jmse 10 00640 g007
Figure 8. The temperature information alongside the depth profiles of the lake.
Jmse 10 00640 g008
Figure 9. Depth control state curve of the profiler.
Jmse 10 00640 g009
Figure 10. Response curve of the profiler under vertical impact.
Jmse 10 00640 g010
Table 1. Main parameters of the profiler.
Parameter NameValue/Introduction
Length2.6 m
Diameter0.4 m
Weight185 kg
Operating depth range200 m
Buoy-driven modeOcean thermal energy and electricity
SensorPressure sensors, six-axis attitude sensors, thermometers, depth sensors, displacement sensors
Maximum buoyancy regulation force8 N
FunctionalAutonomous profile movement, fixed deep suspension
Typical speed0.35 m/s
Publisher’s Note: MDPI stays neutral with regard to jurisdictional claims in published maps and institutional affiliations.

