
Barcelona Coastal Monitoring with the “Patí a Vela”, a Traditional Sailboat Turned into an Oceanographic Platform

 , , ,
, , ,  , , and
Abstract
:1. Introduction
2. Patí Científic Project
3. Materials and Equipment
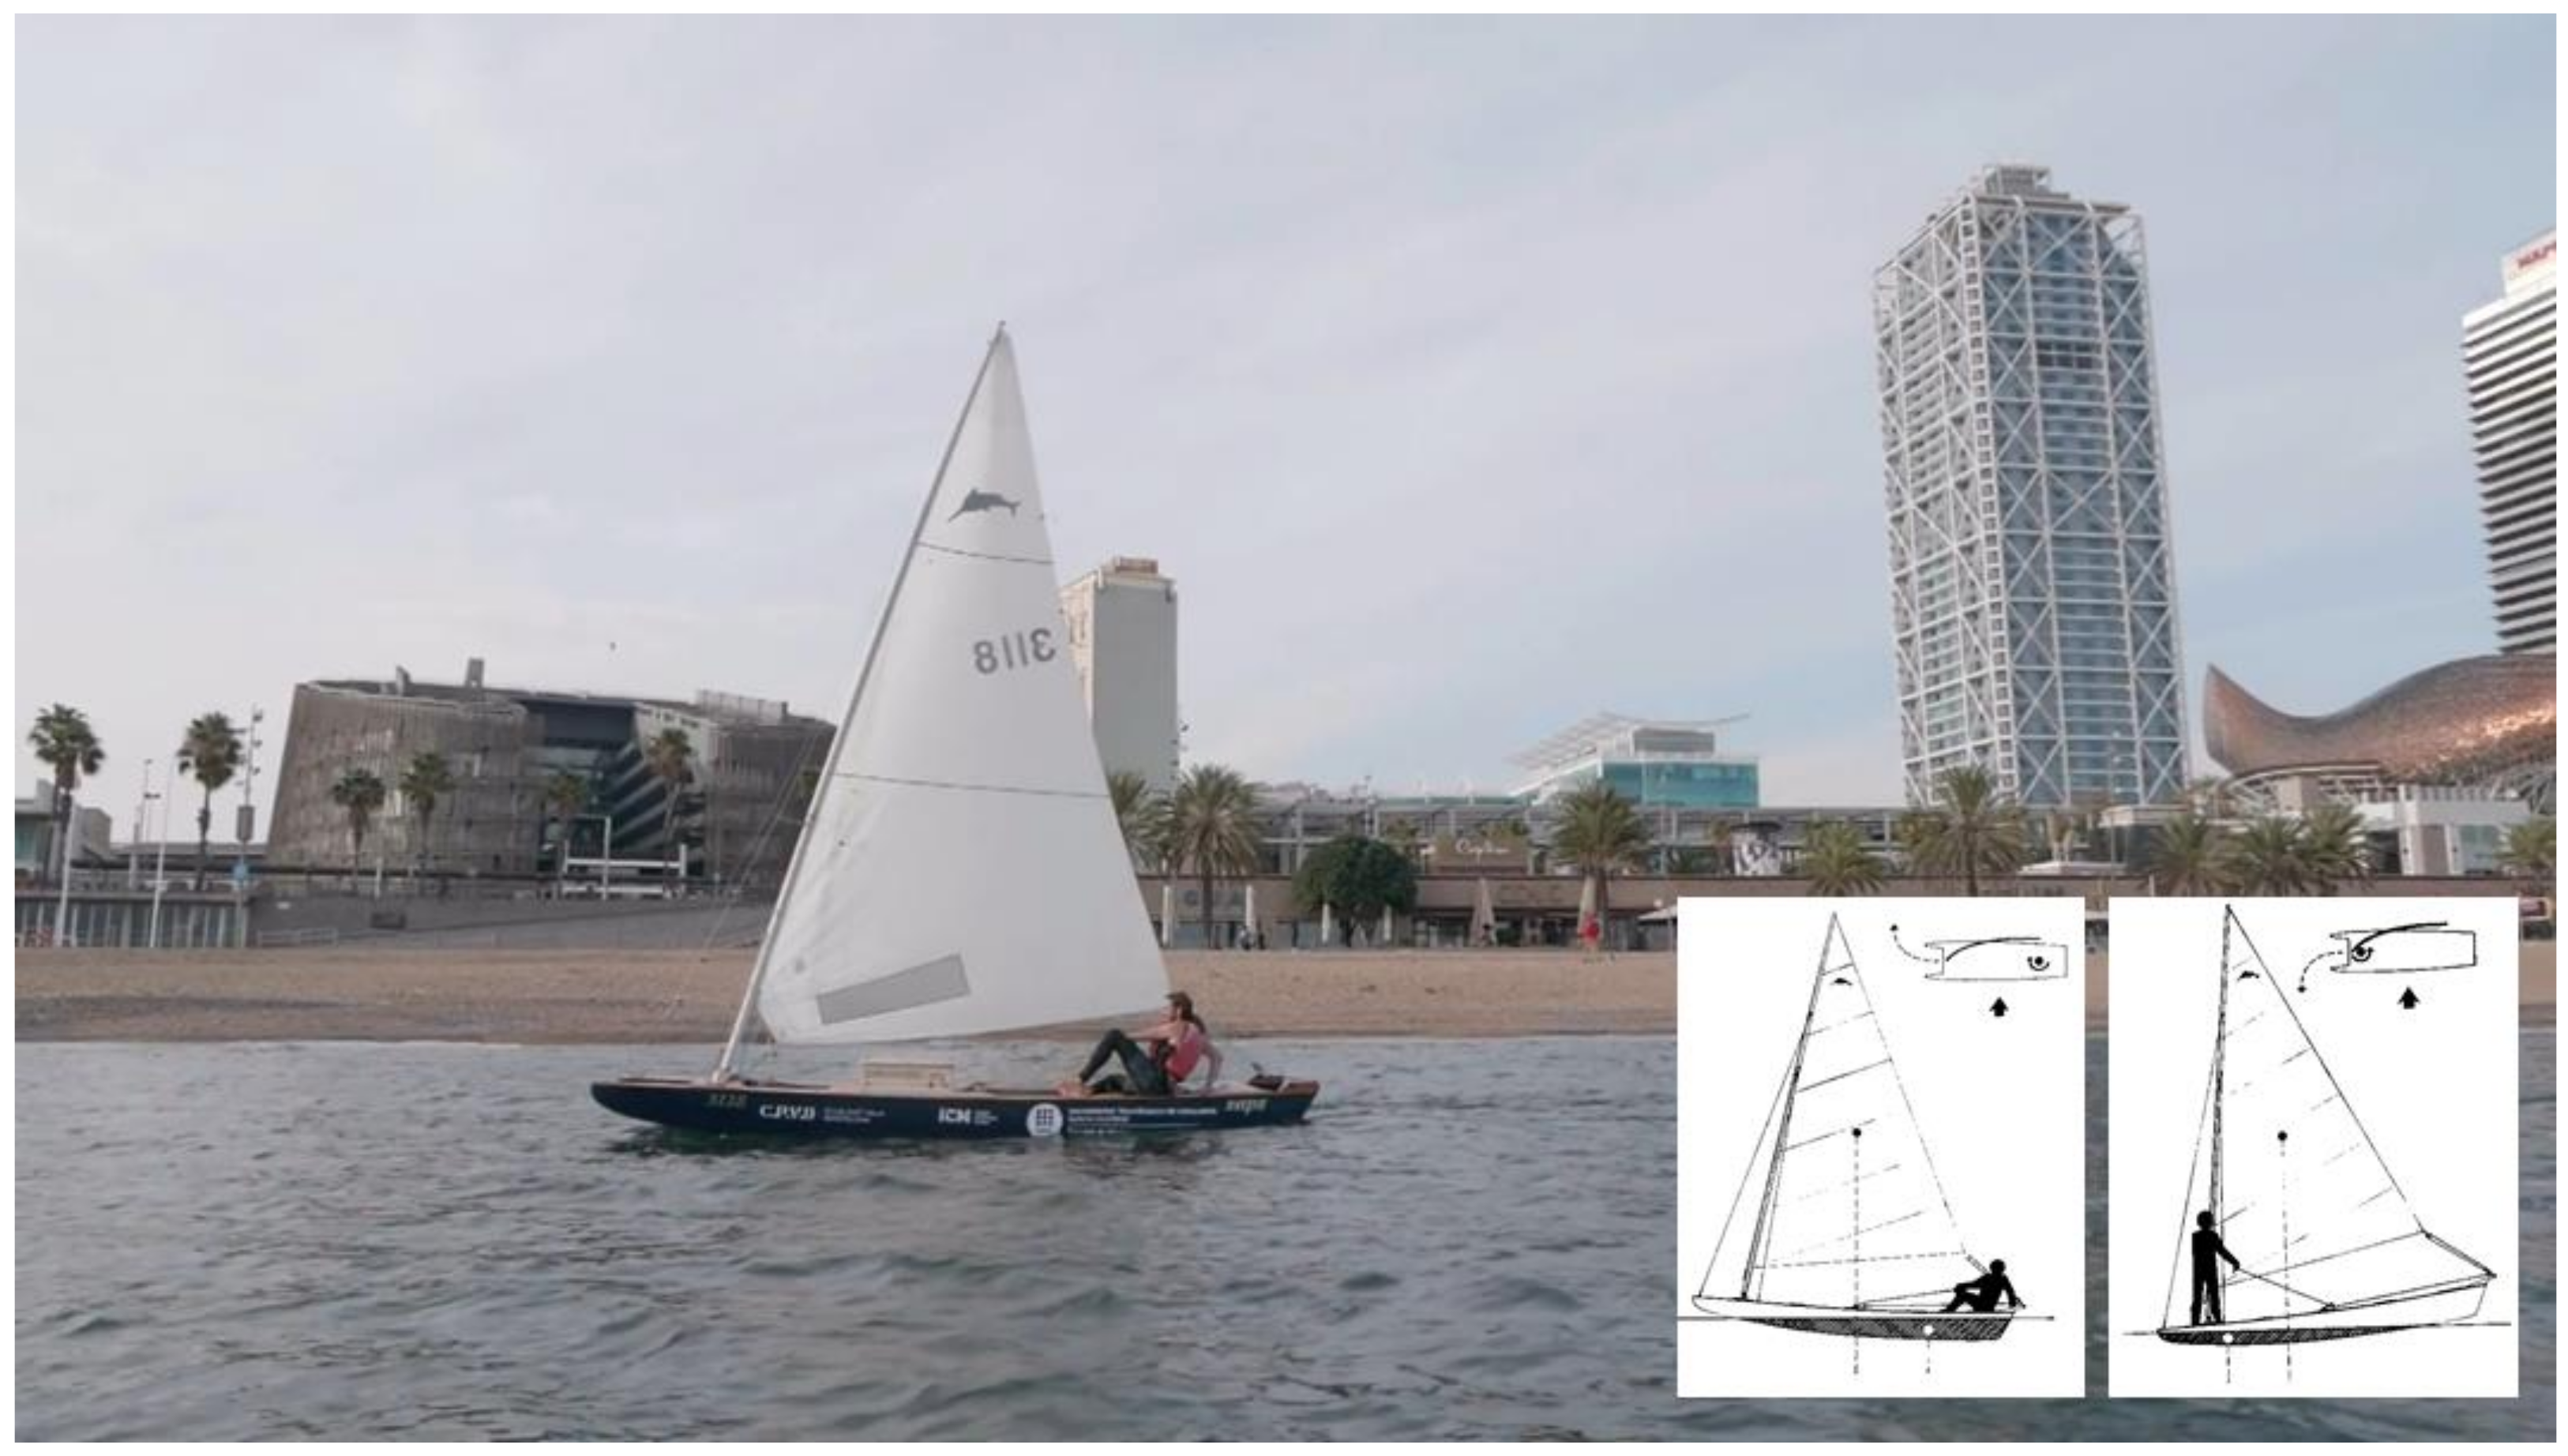
3.1. Scientific Patí a Vela Description
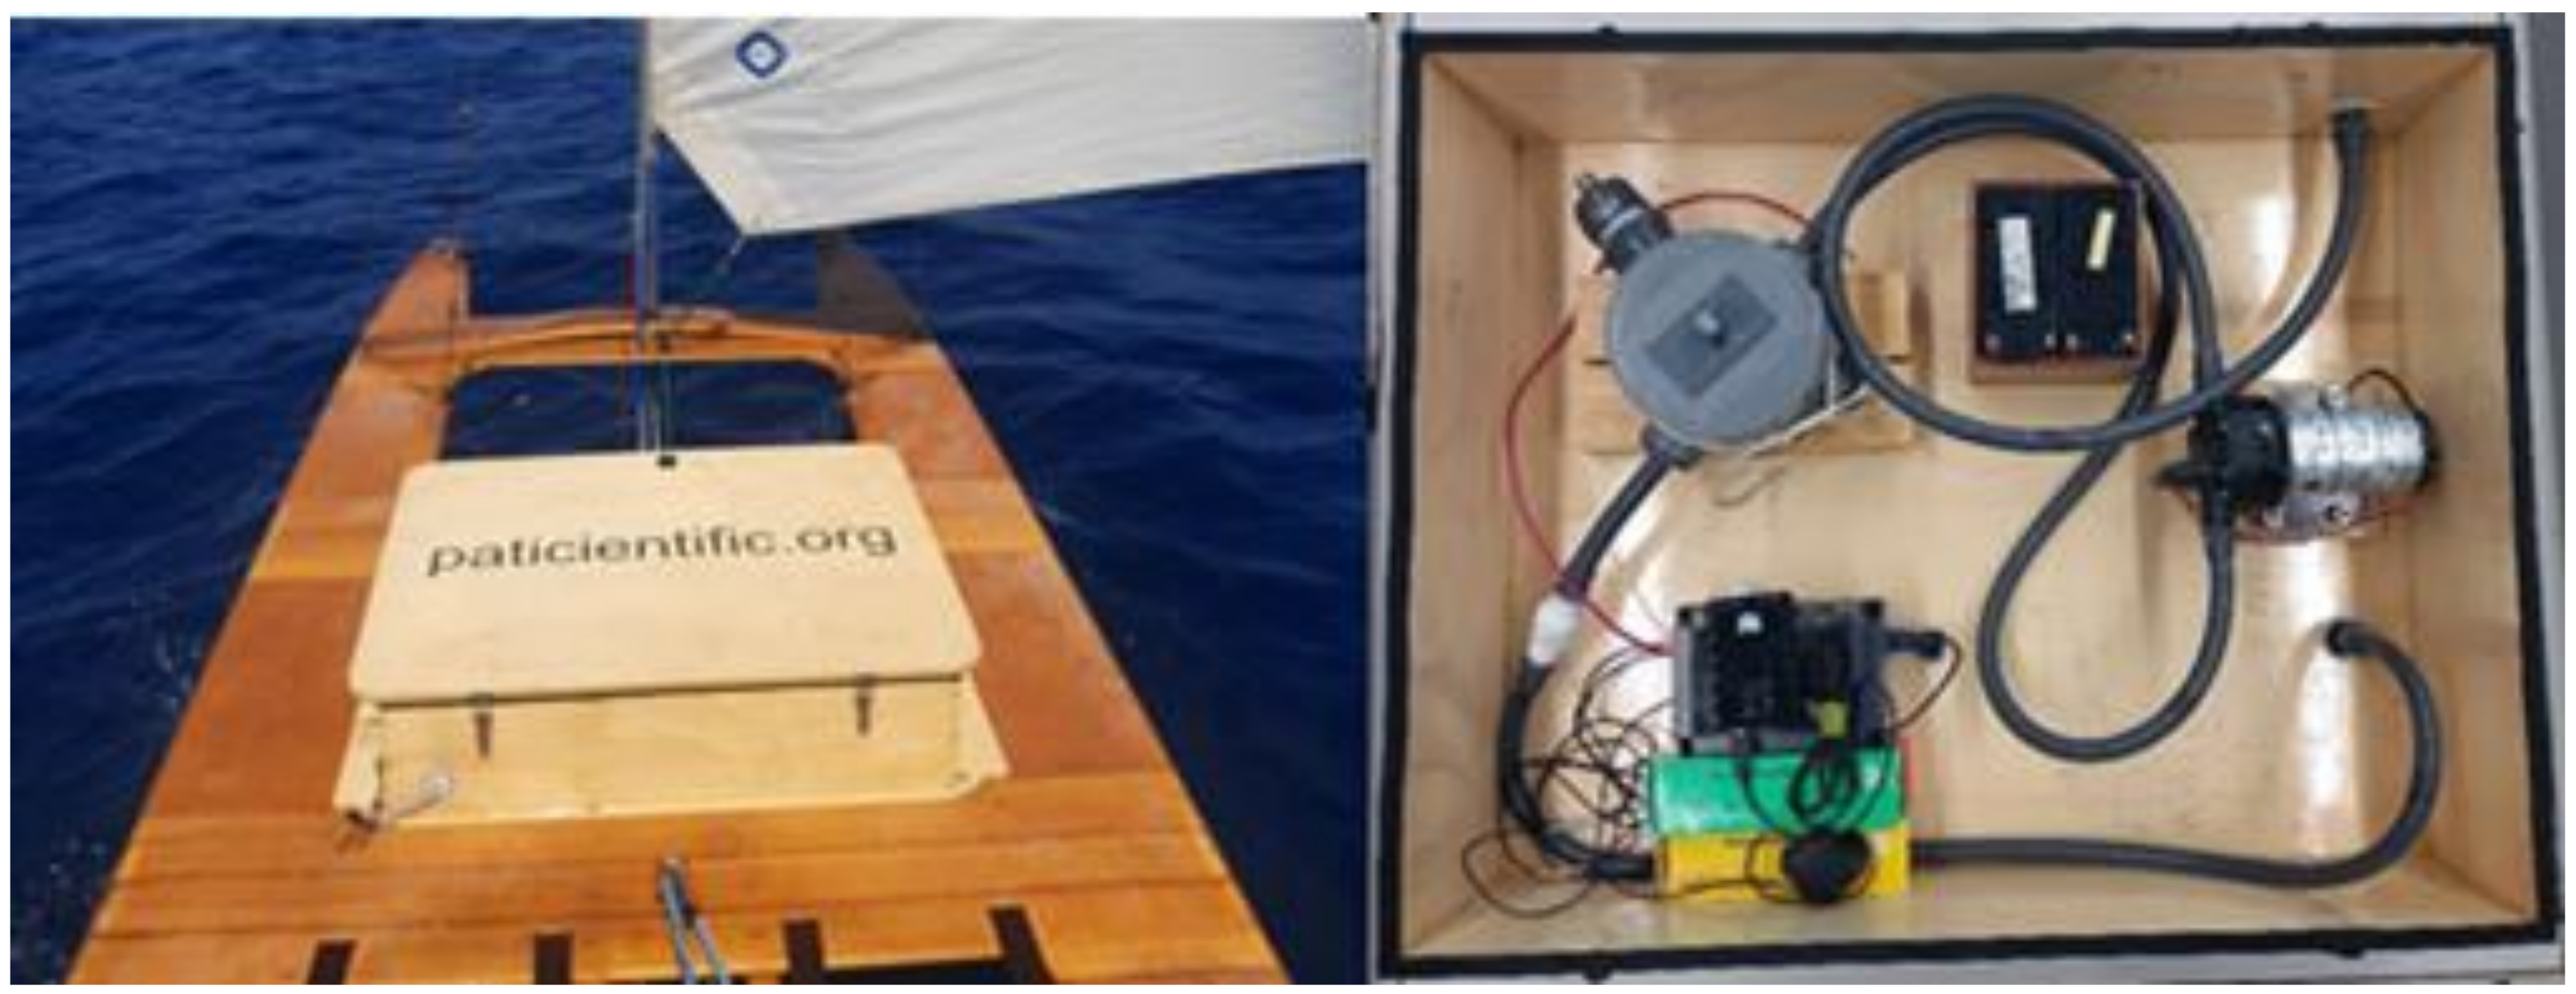
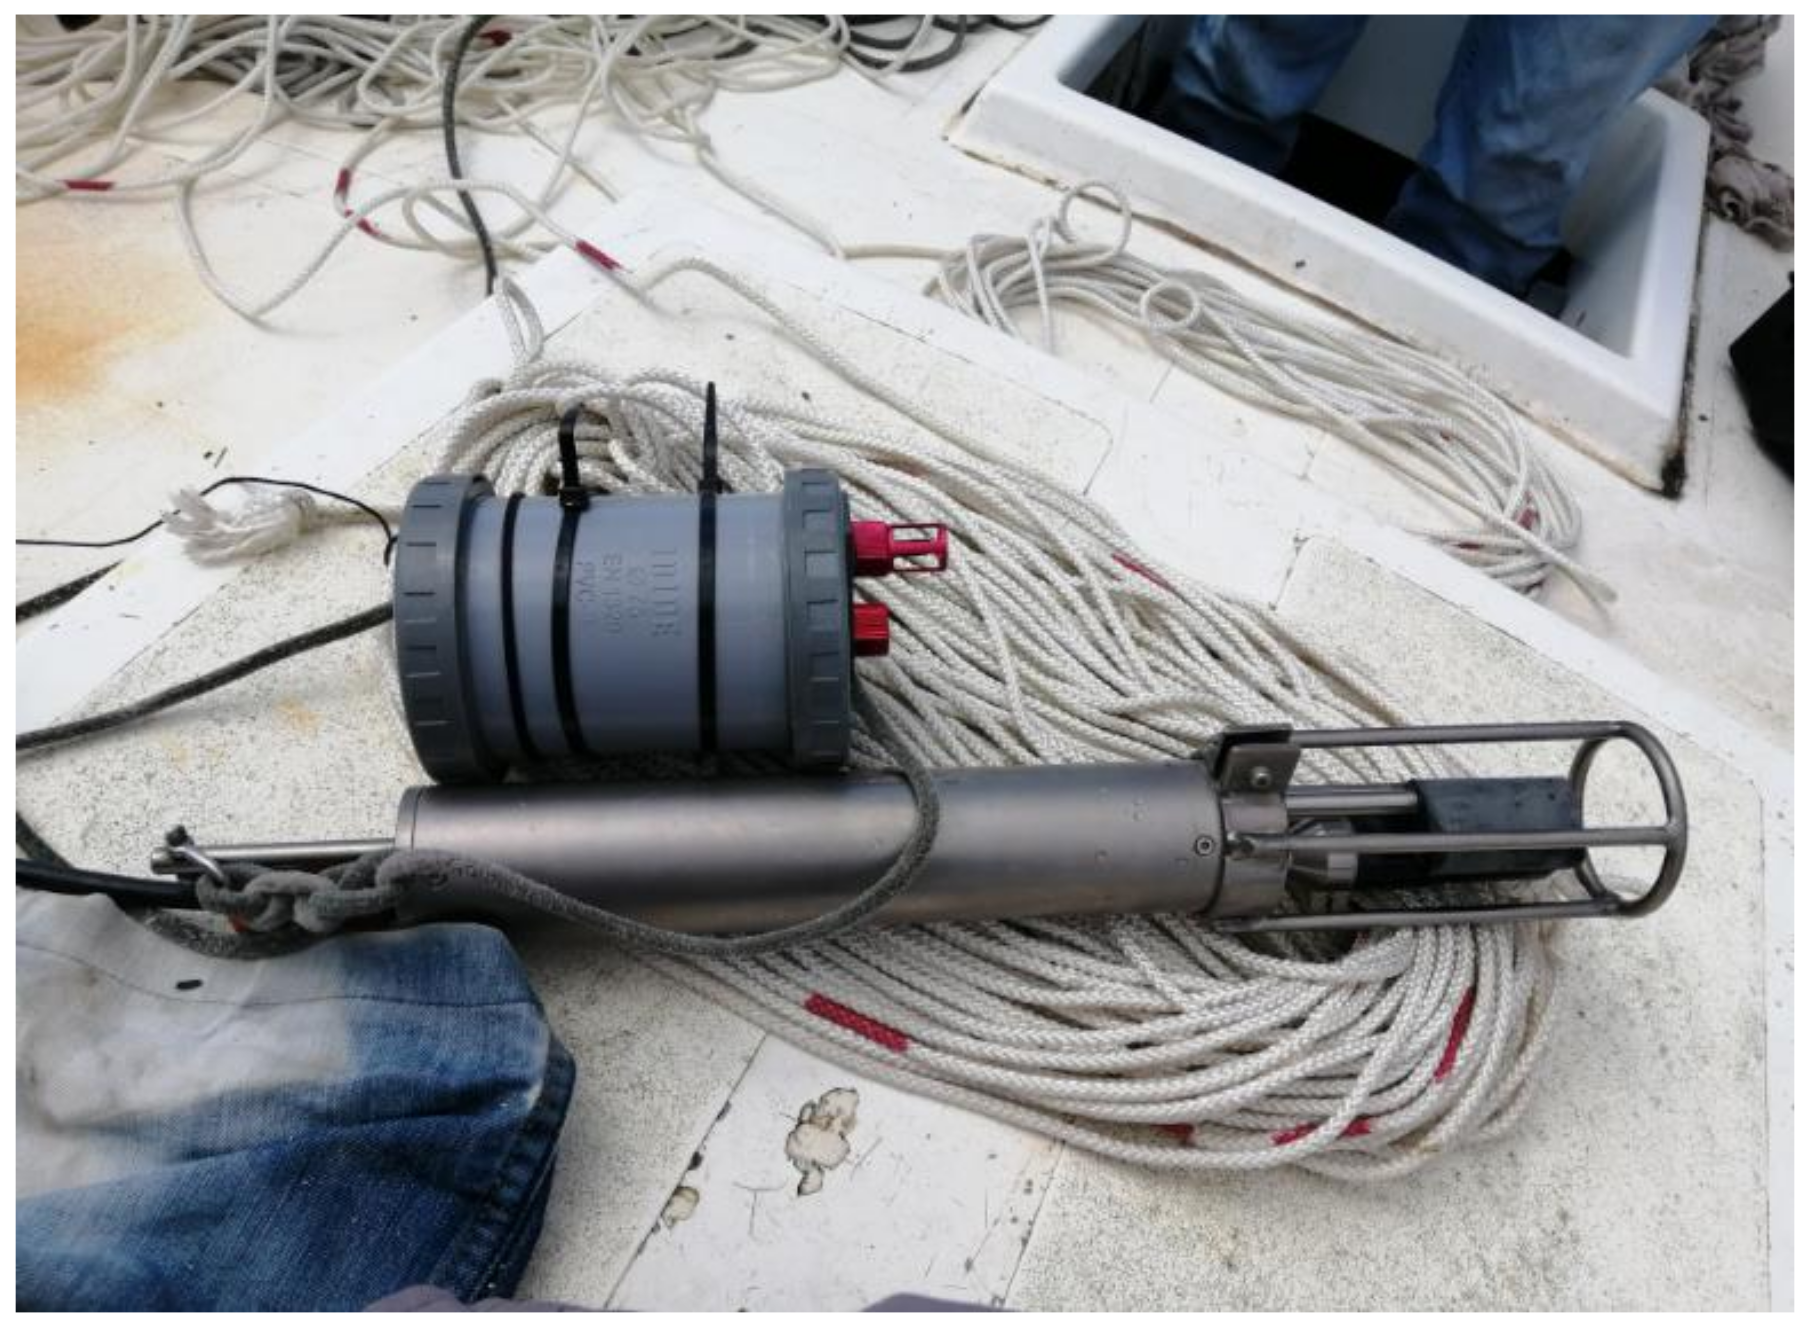
3.2. SPV TD Instrument and Sensors
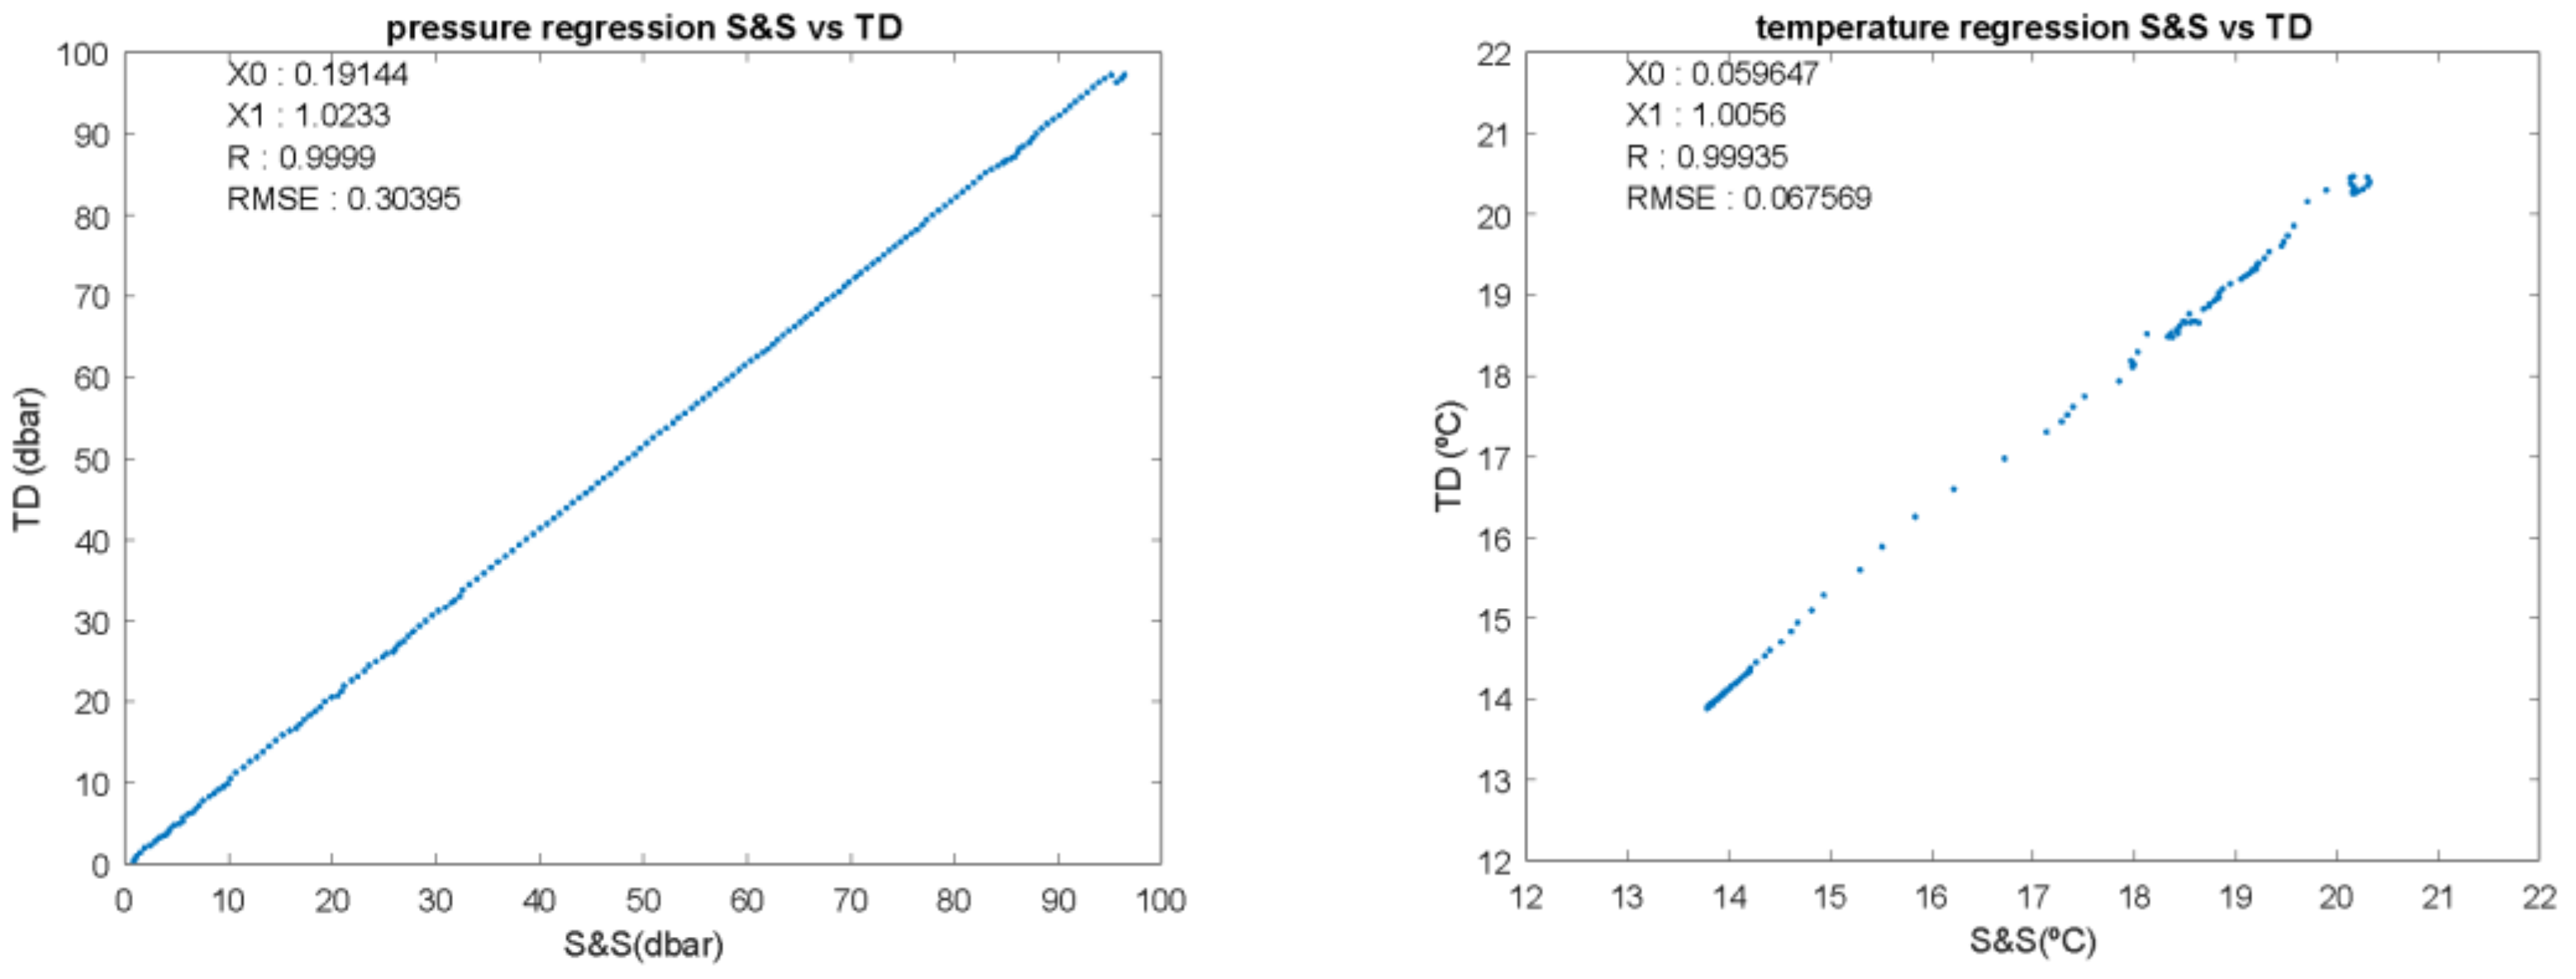
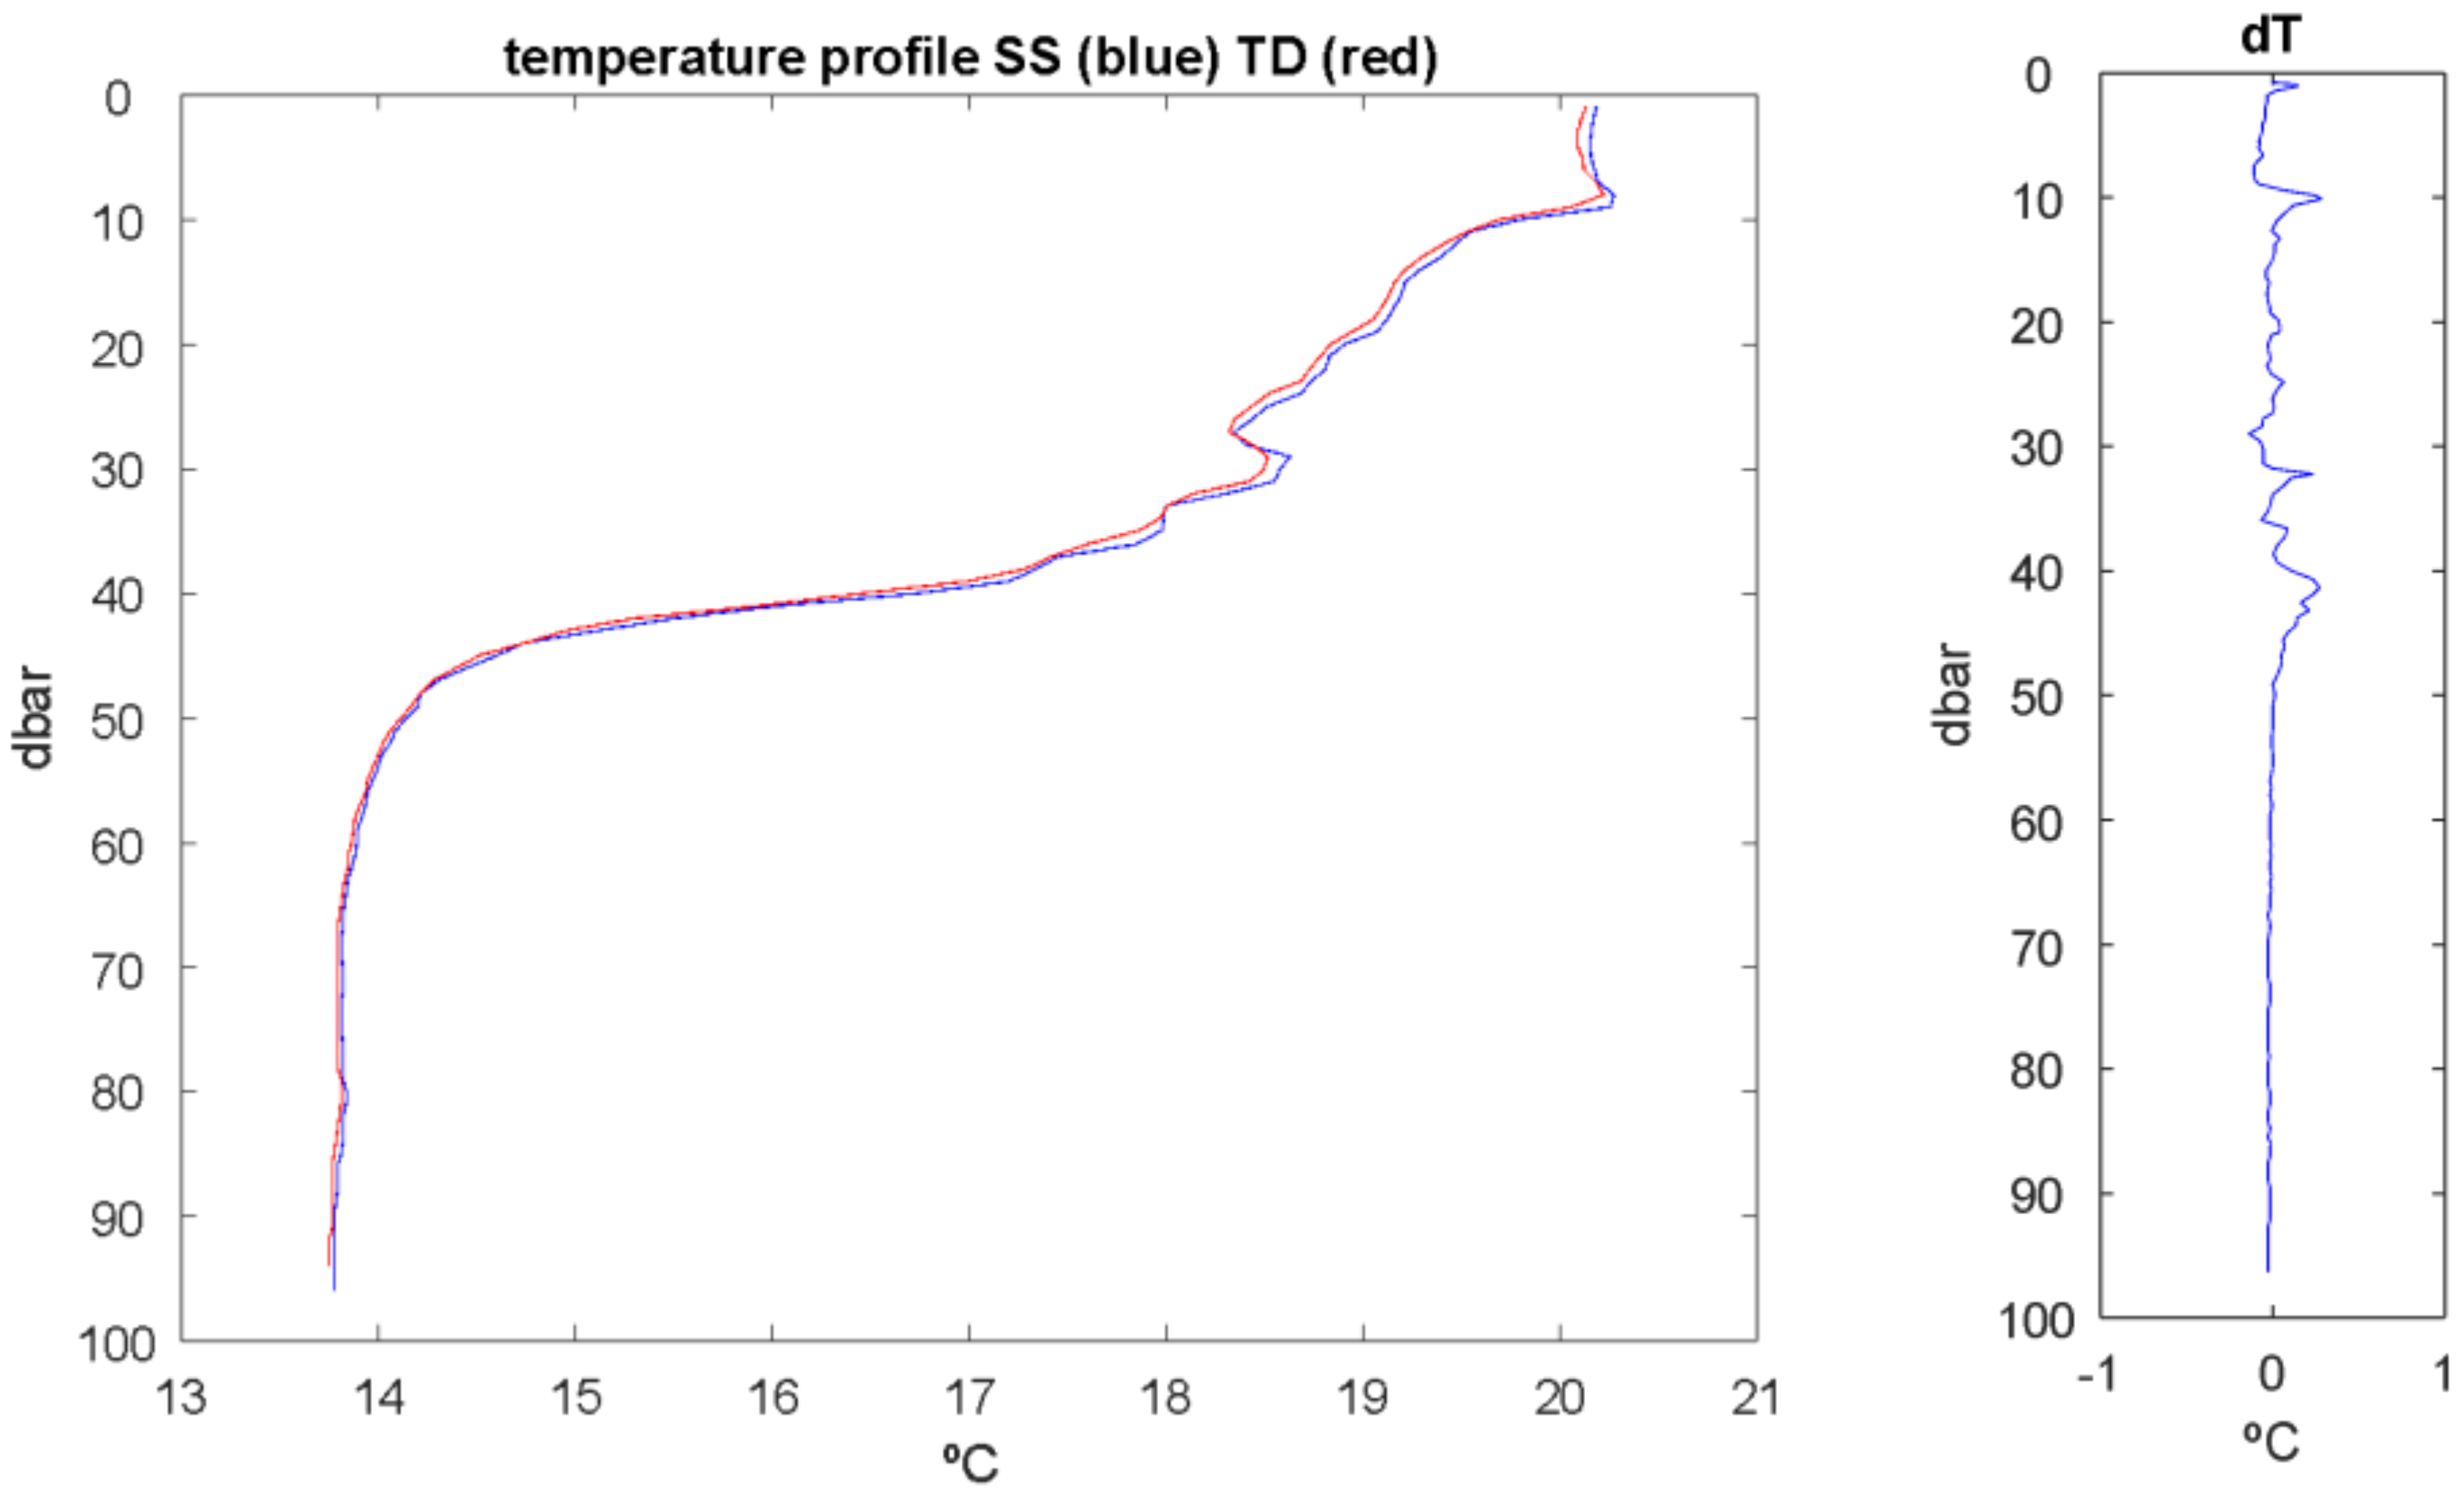
3.3. SPV TD Sensors Validation
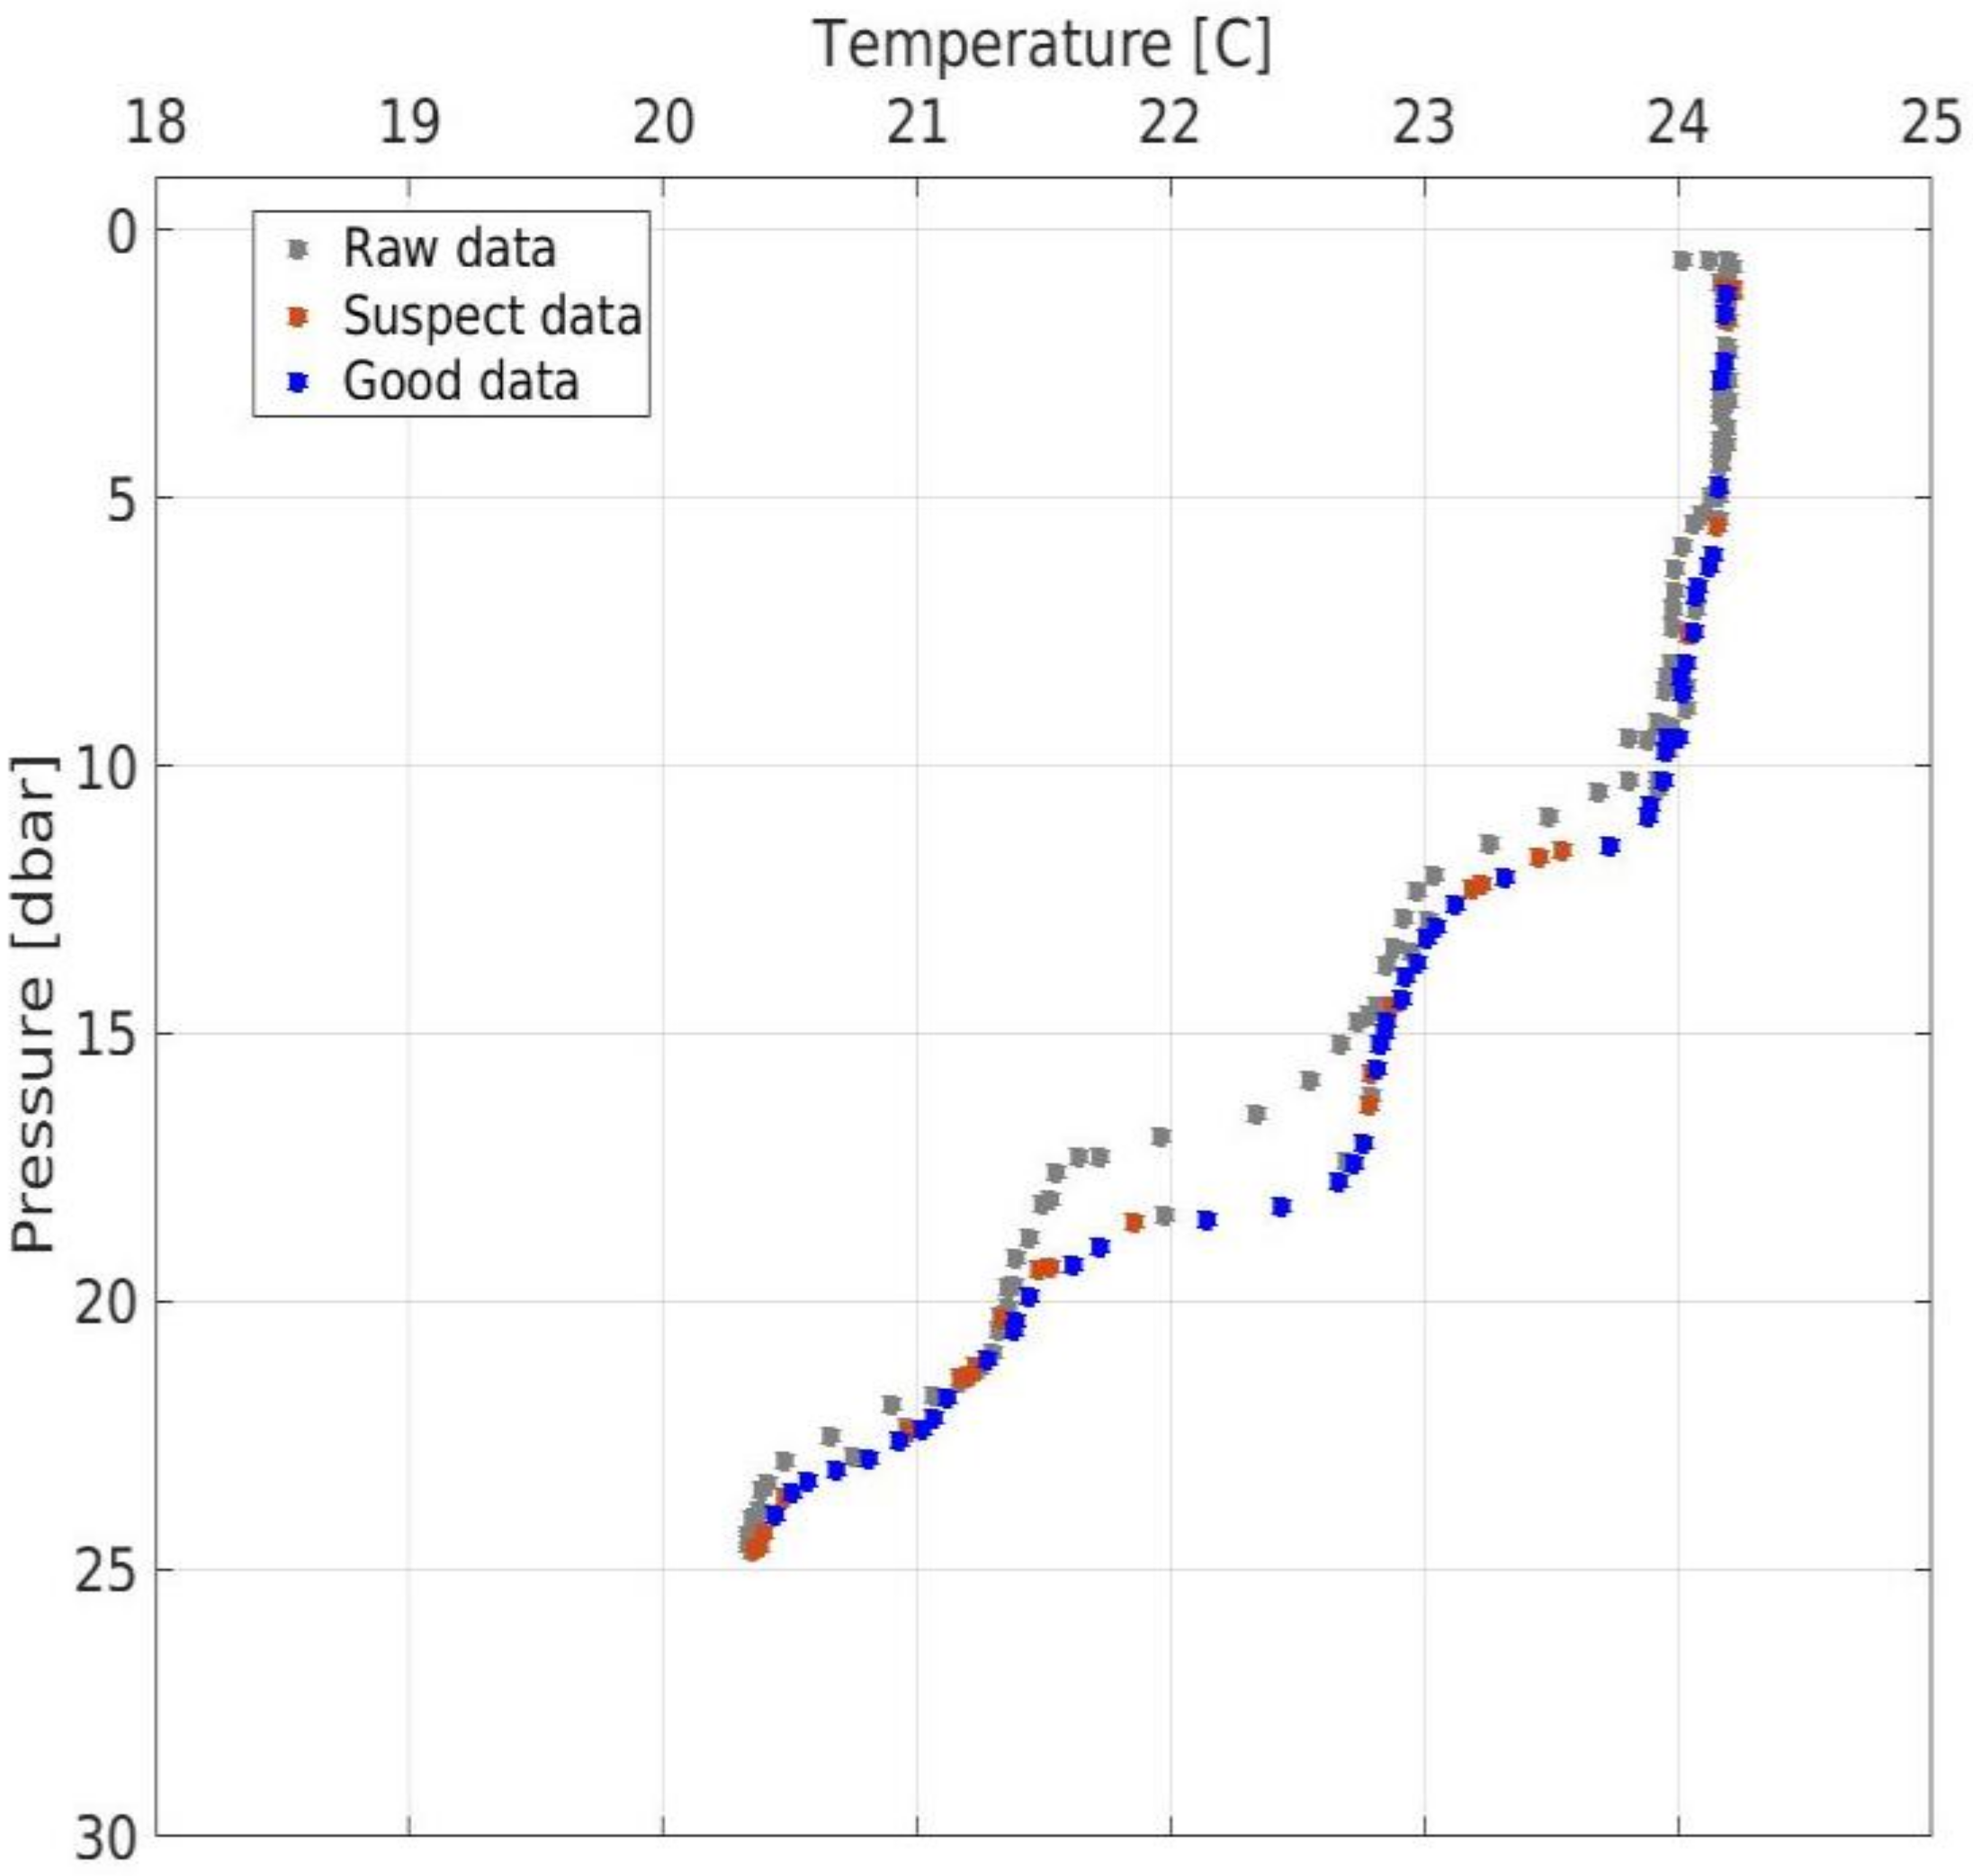
3.4. Data Acquisition and Quality Control in the SPV Surveys
4. Methods
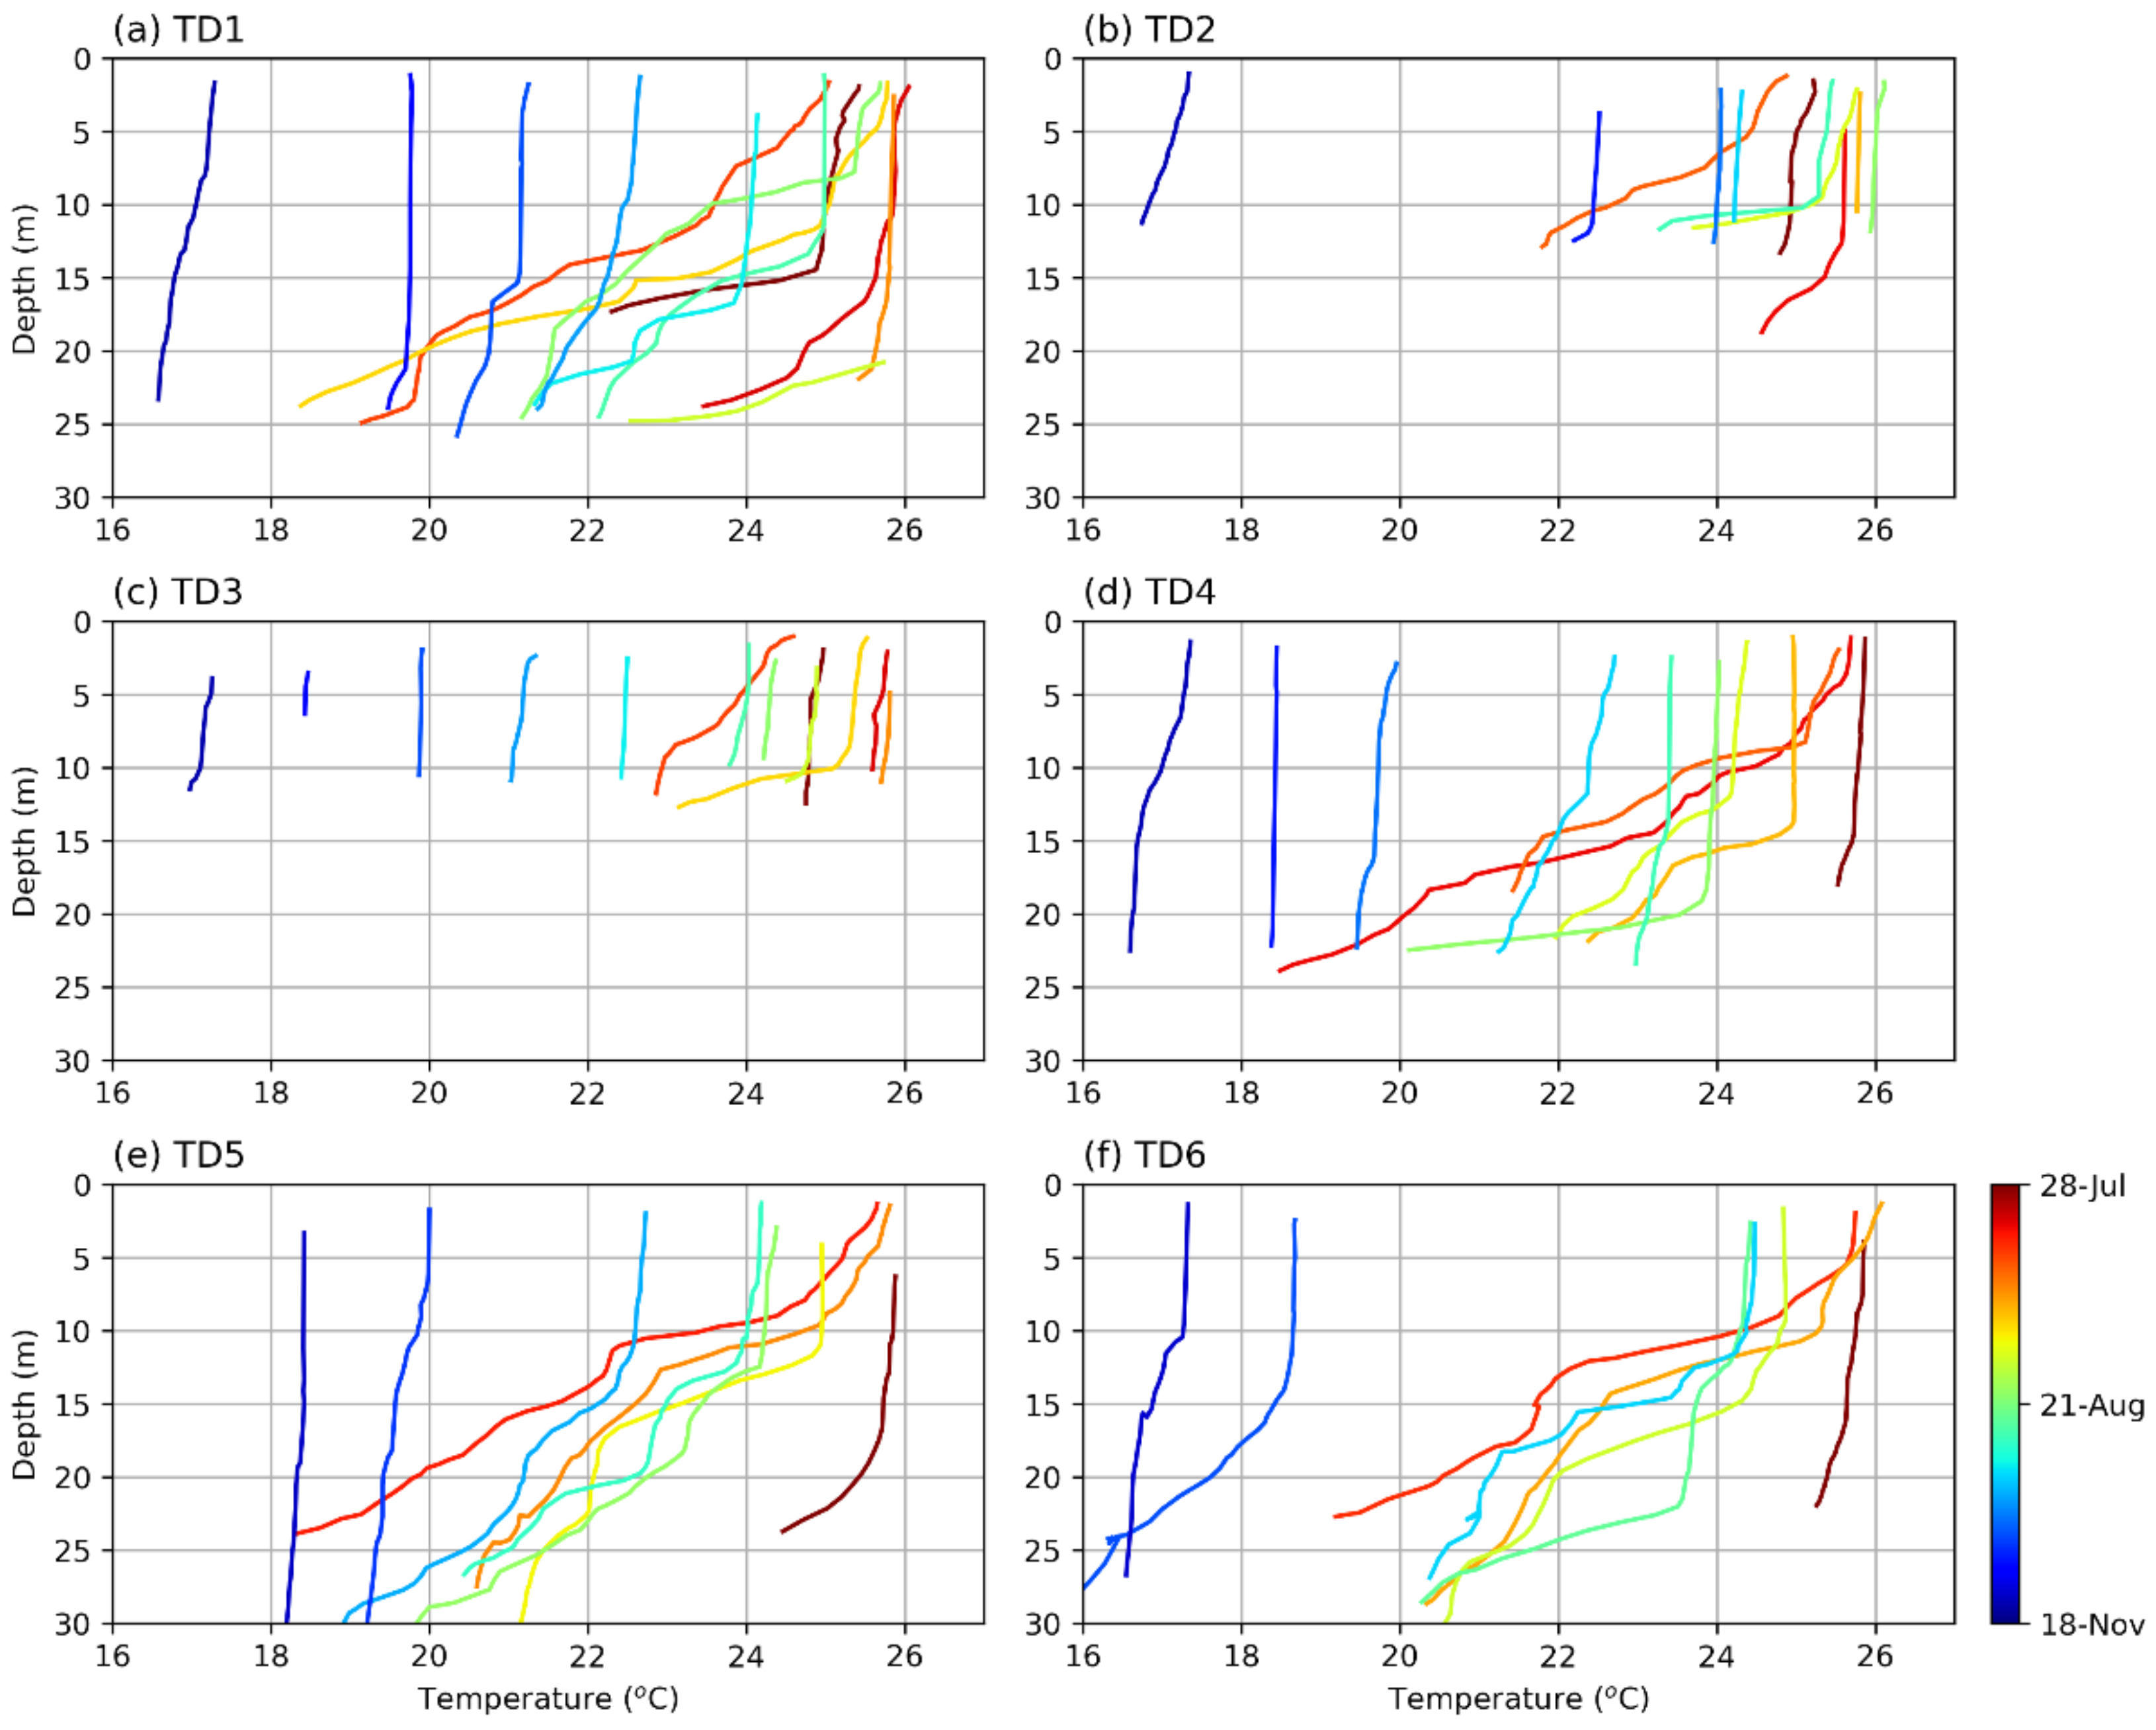
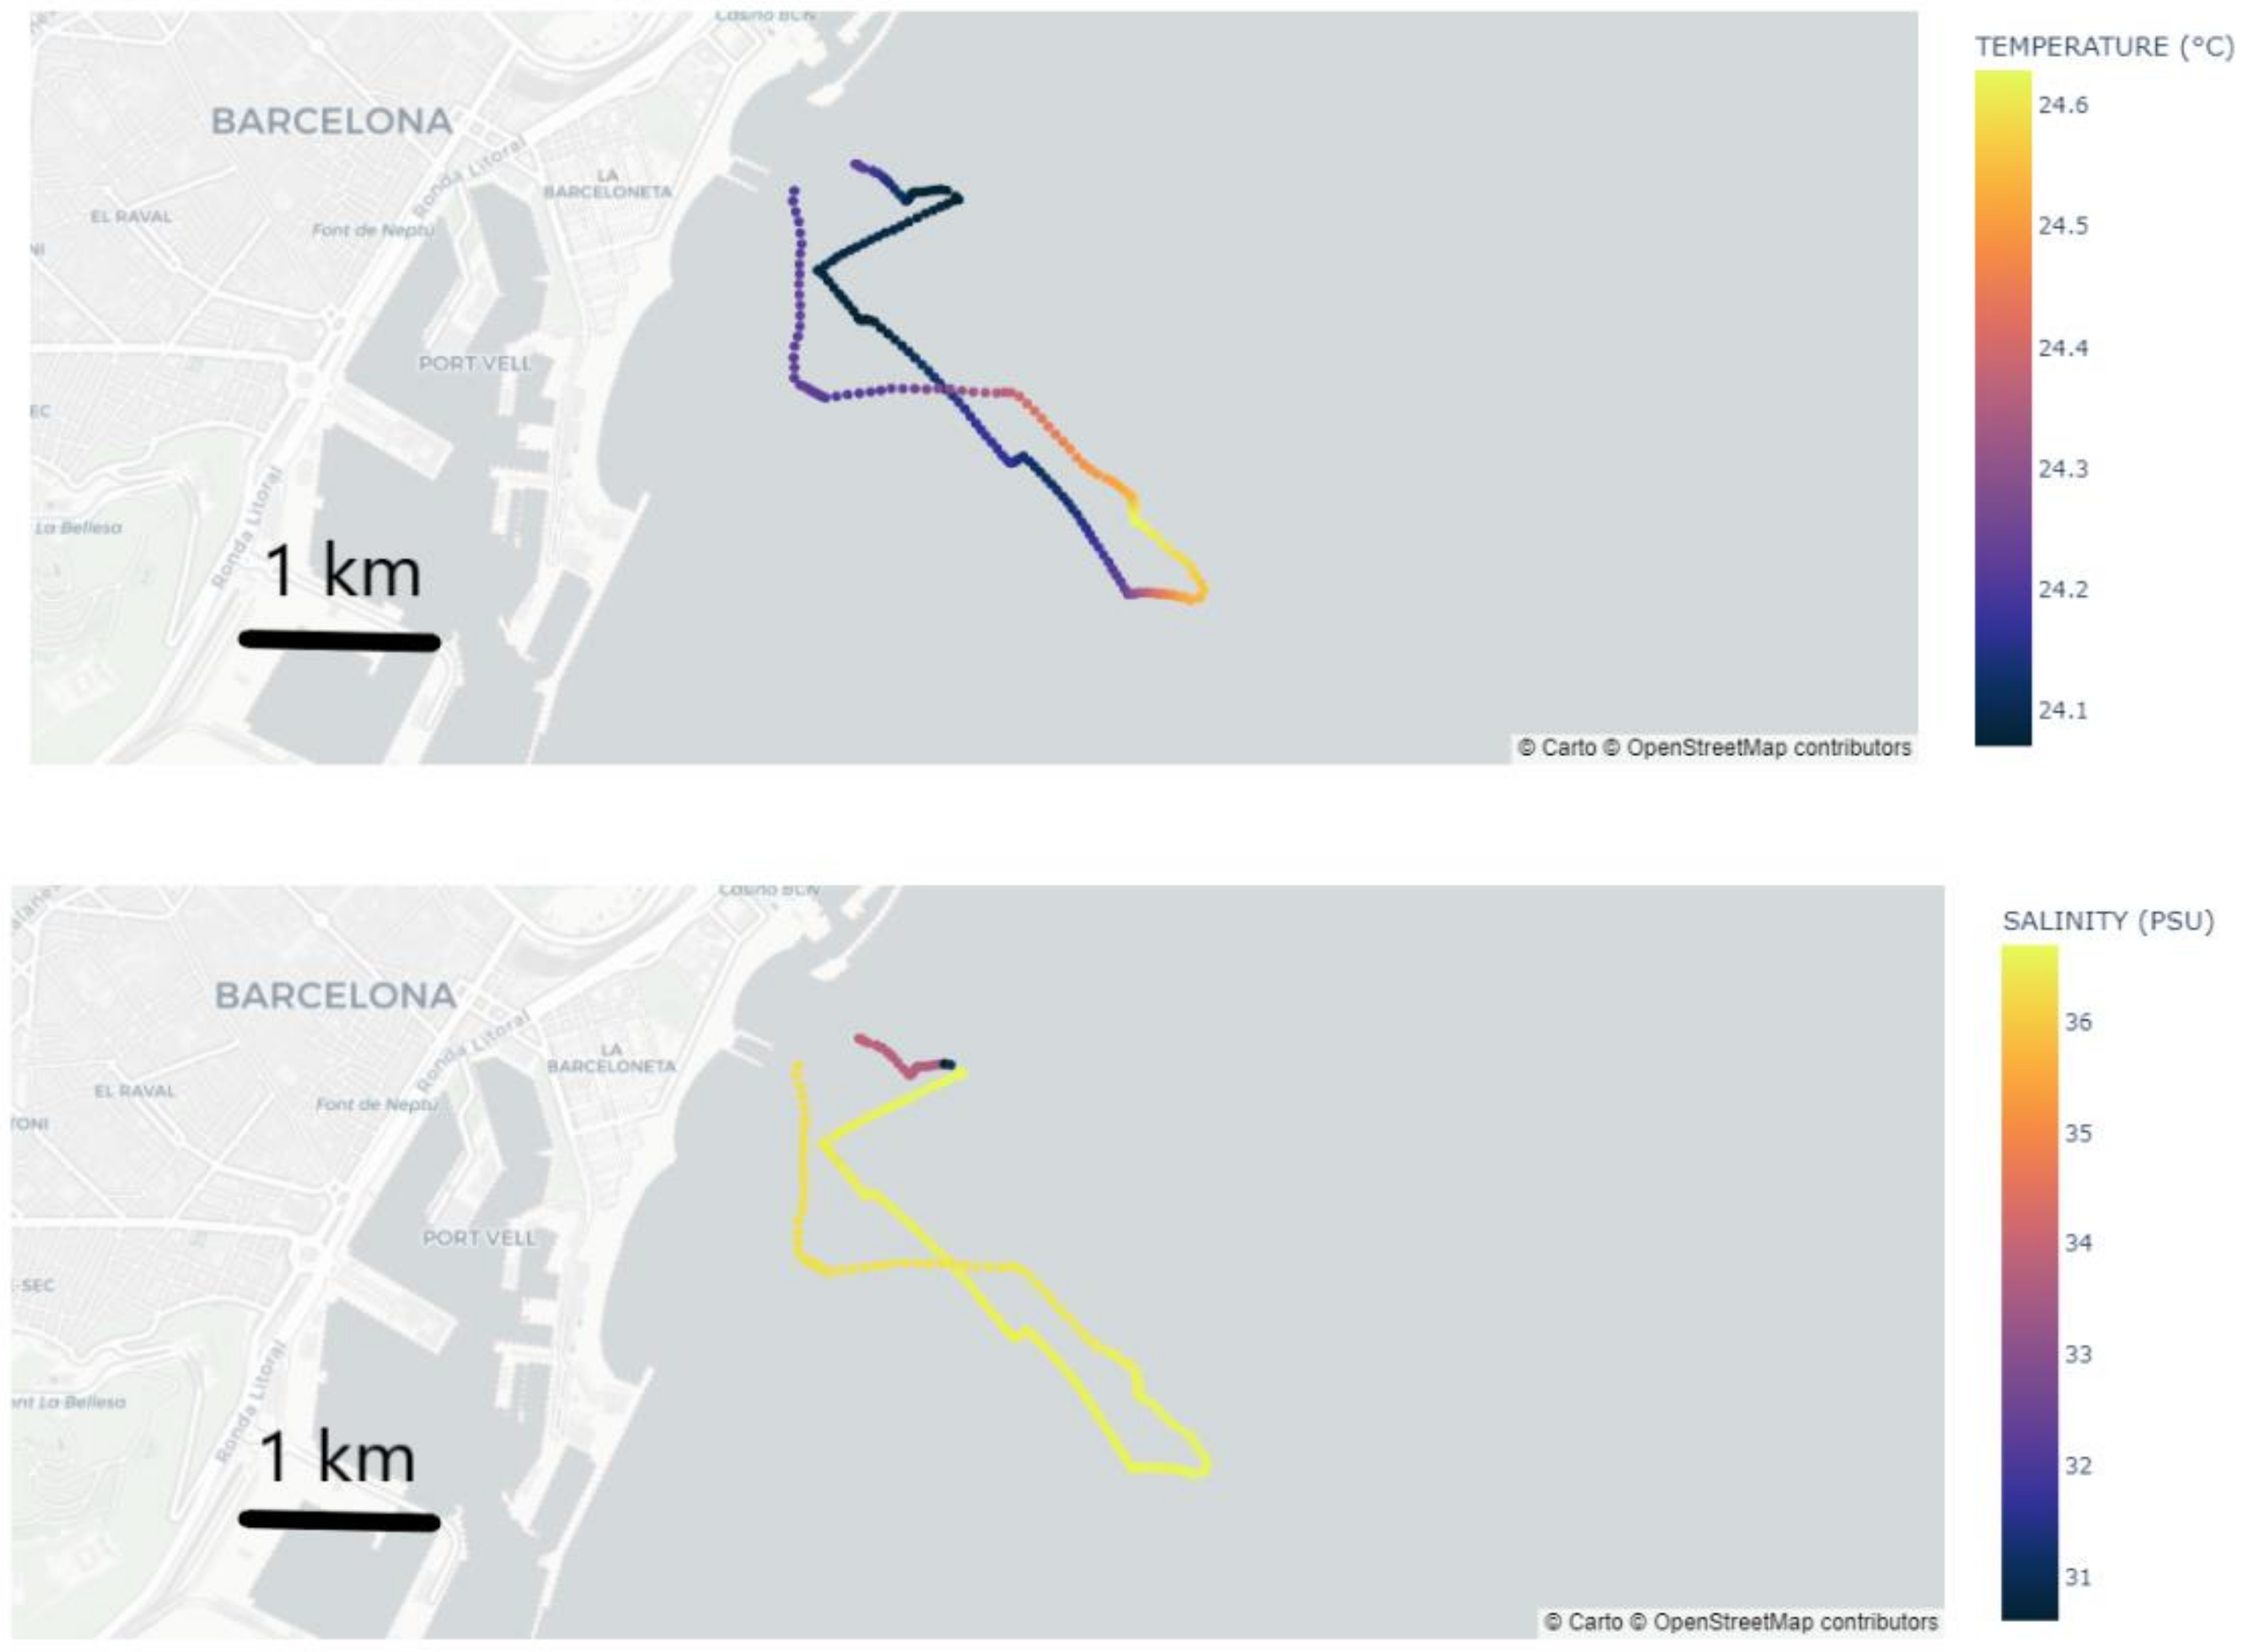
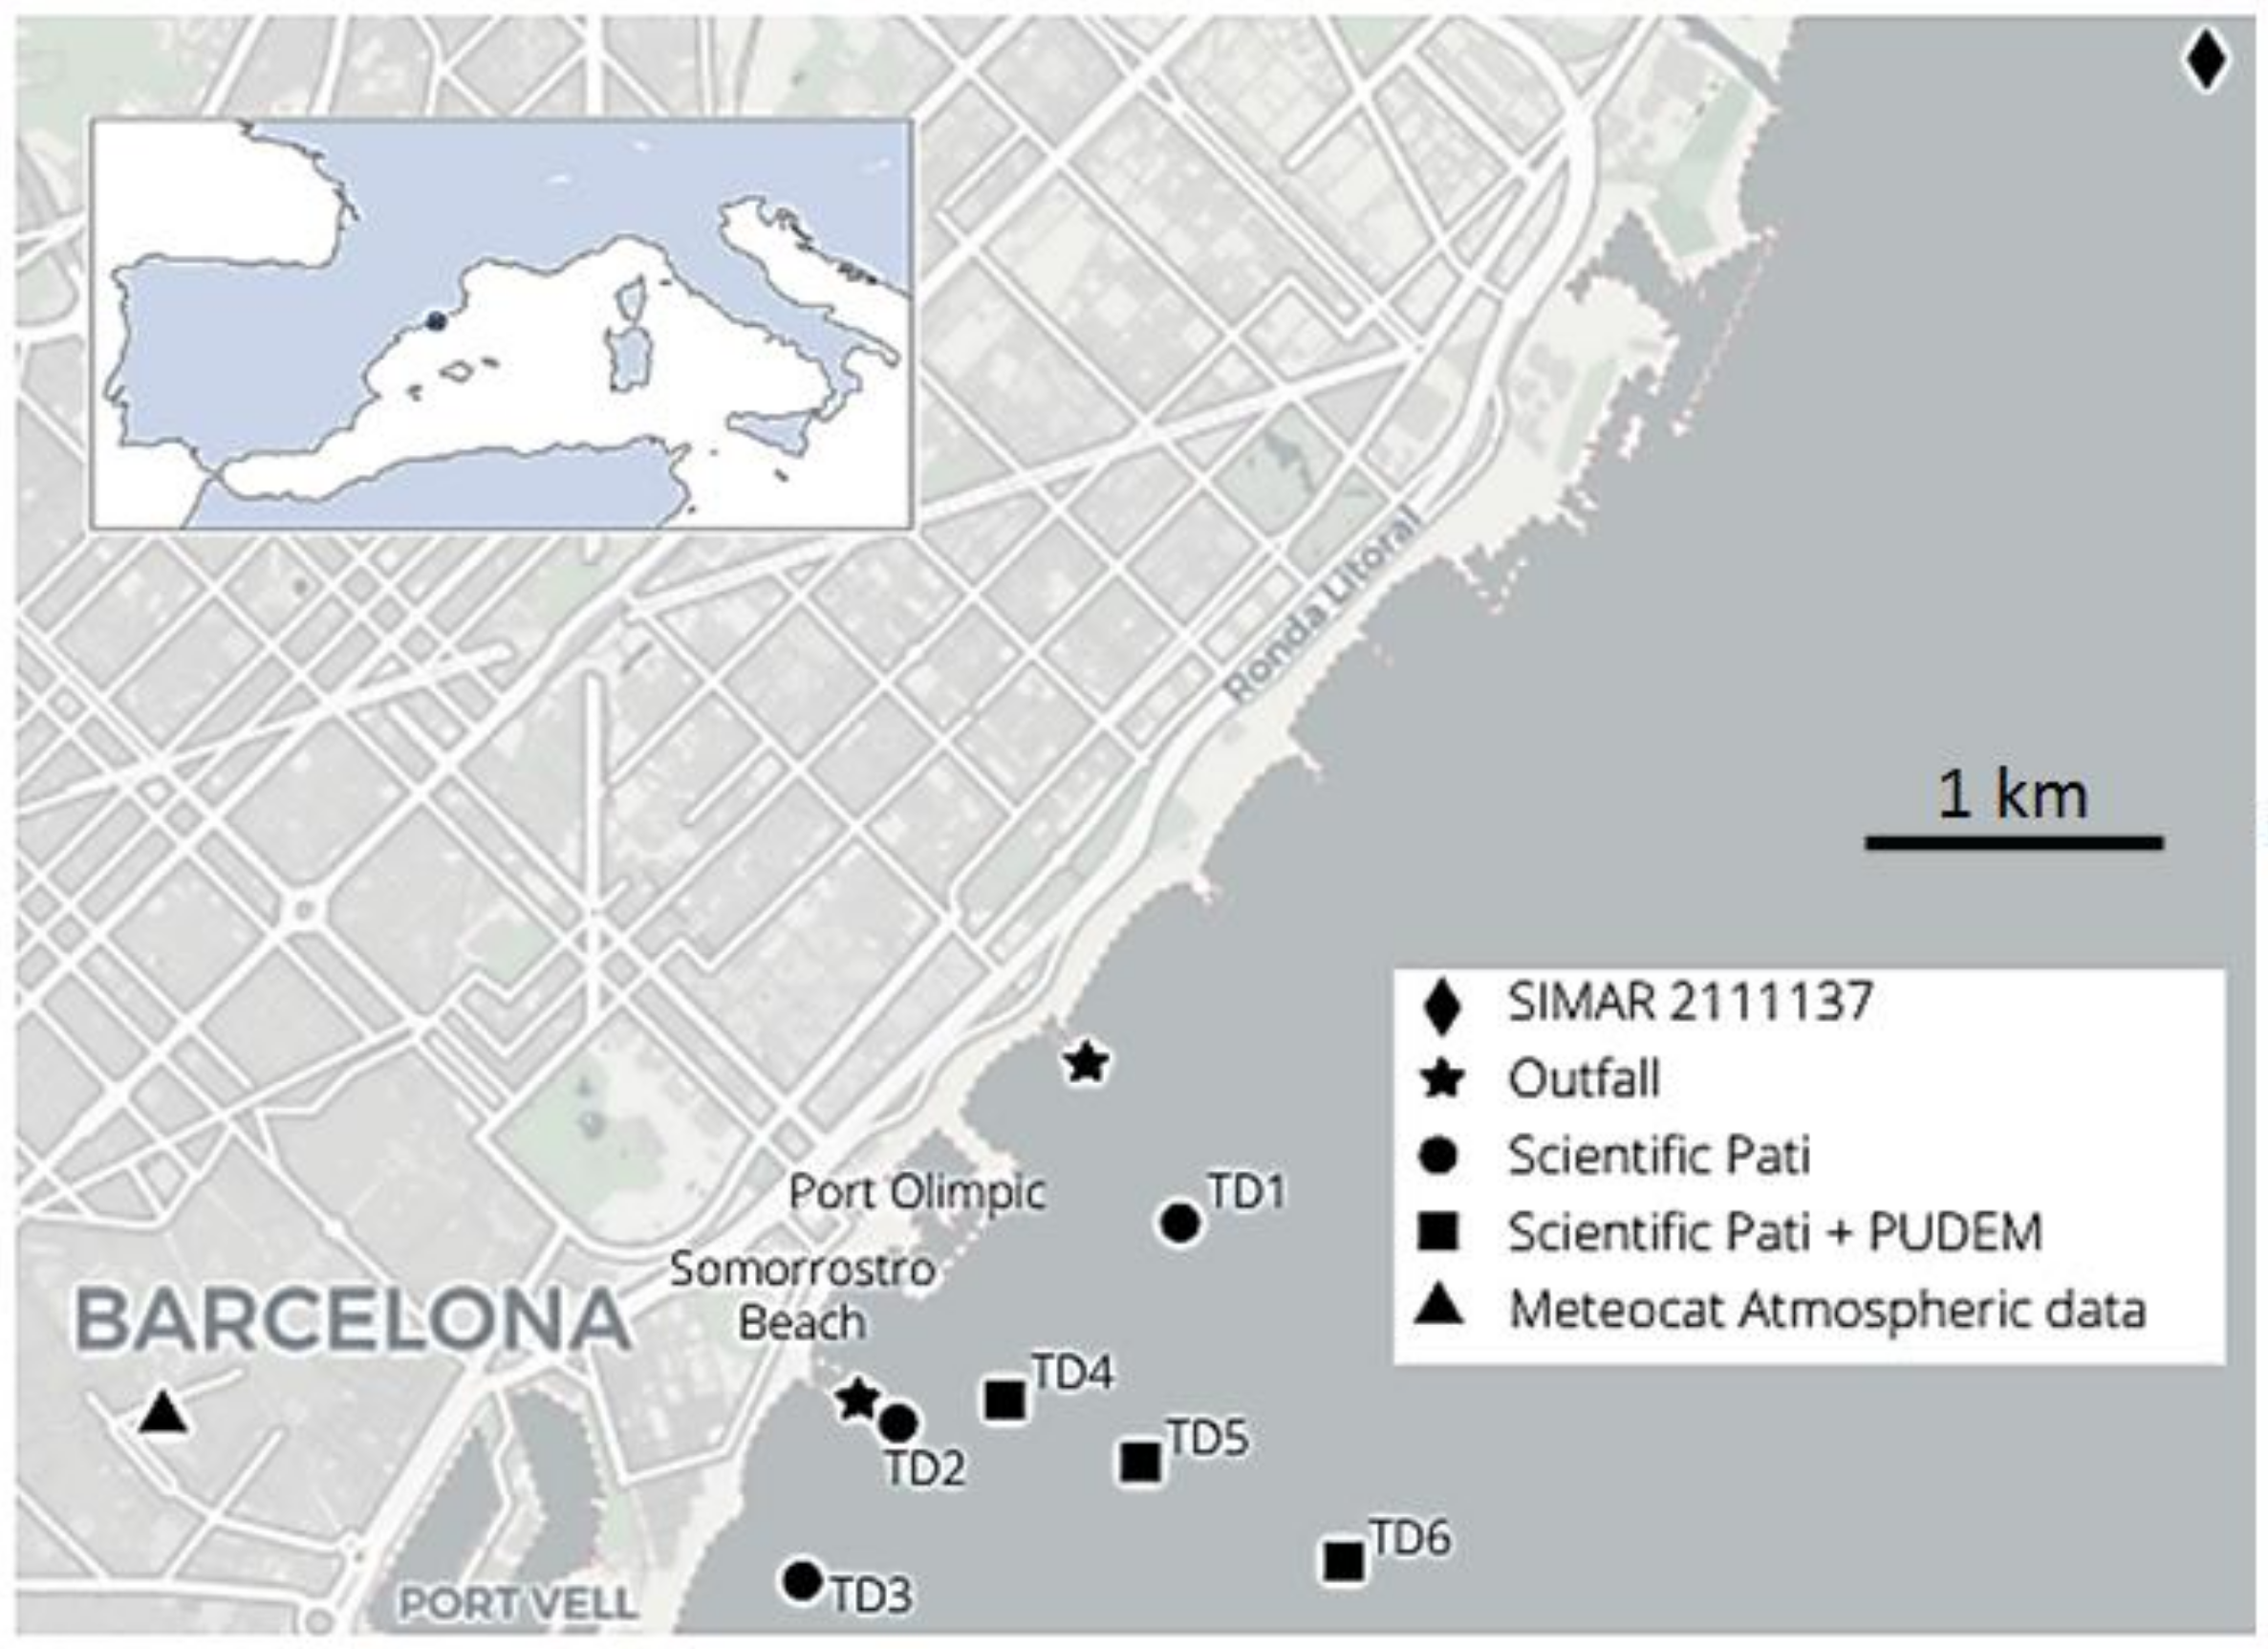
4.1. Study Area
4.2. Period of Study
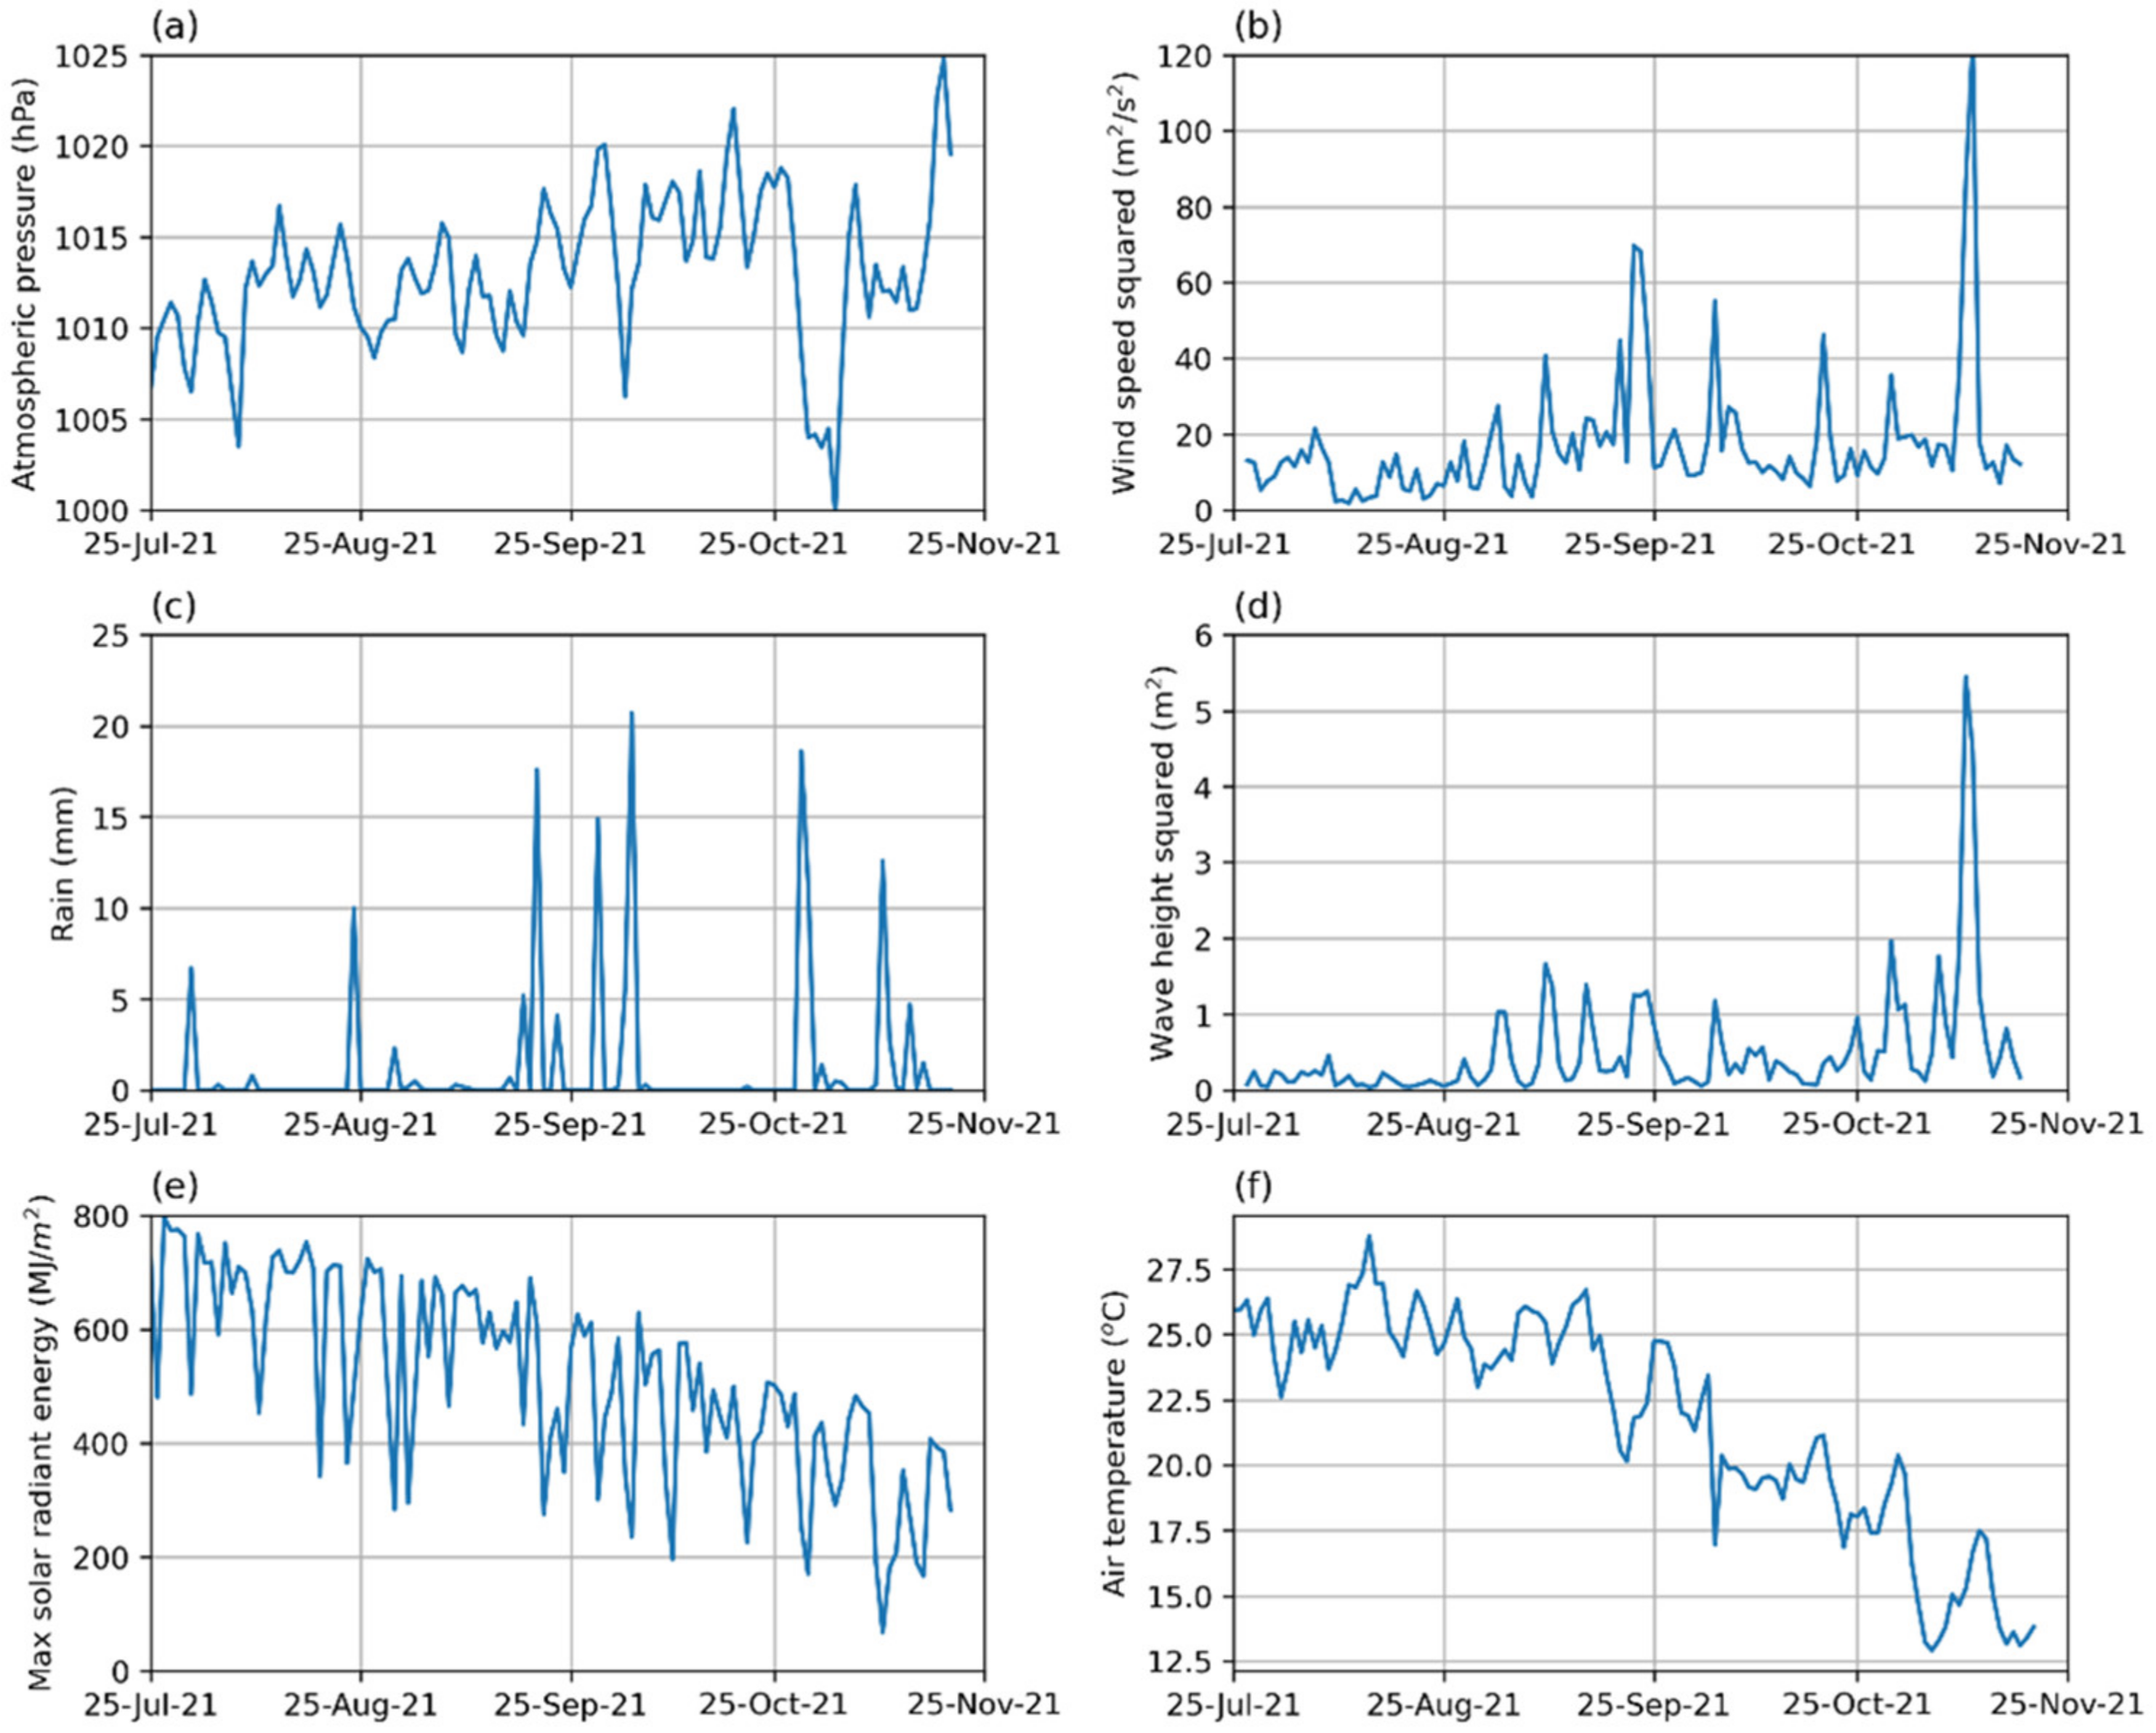
4.3. Other Datasets
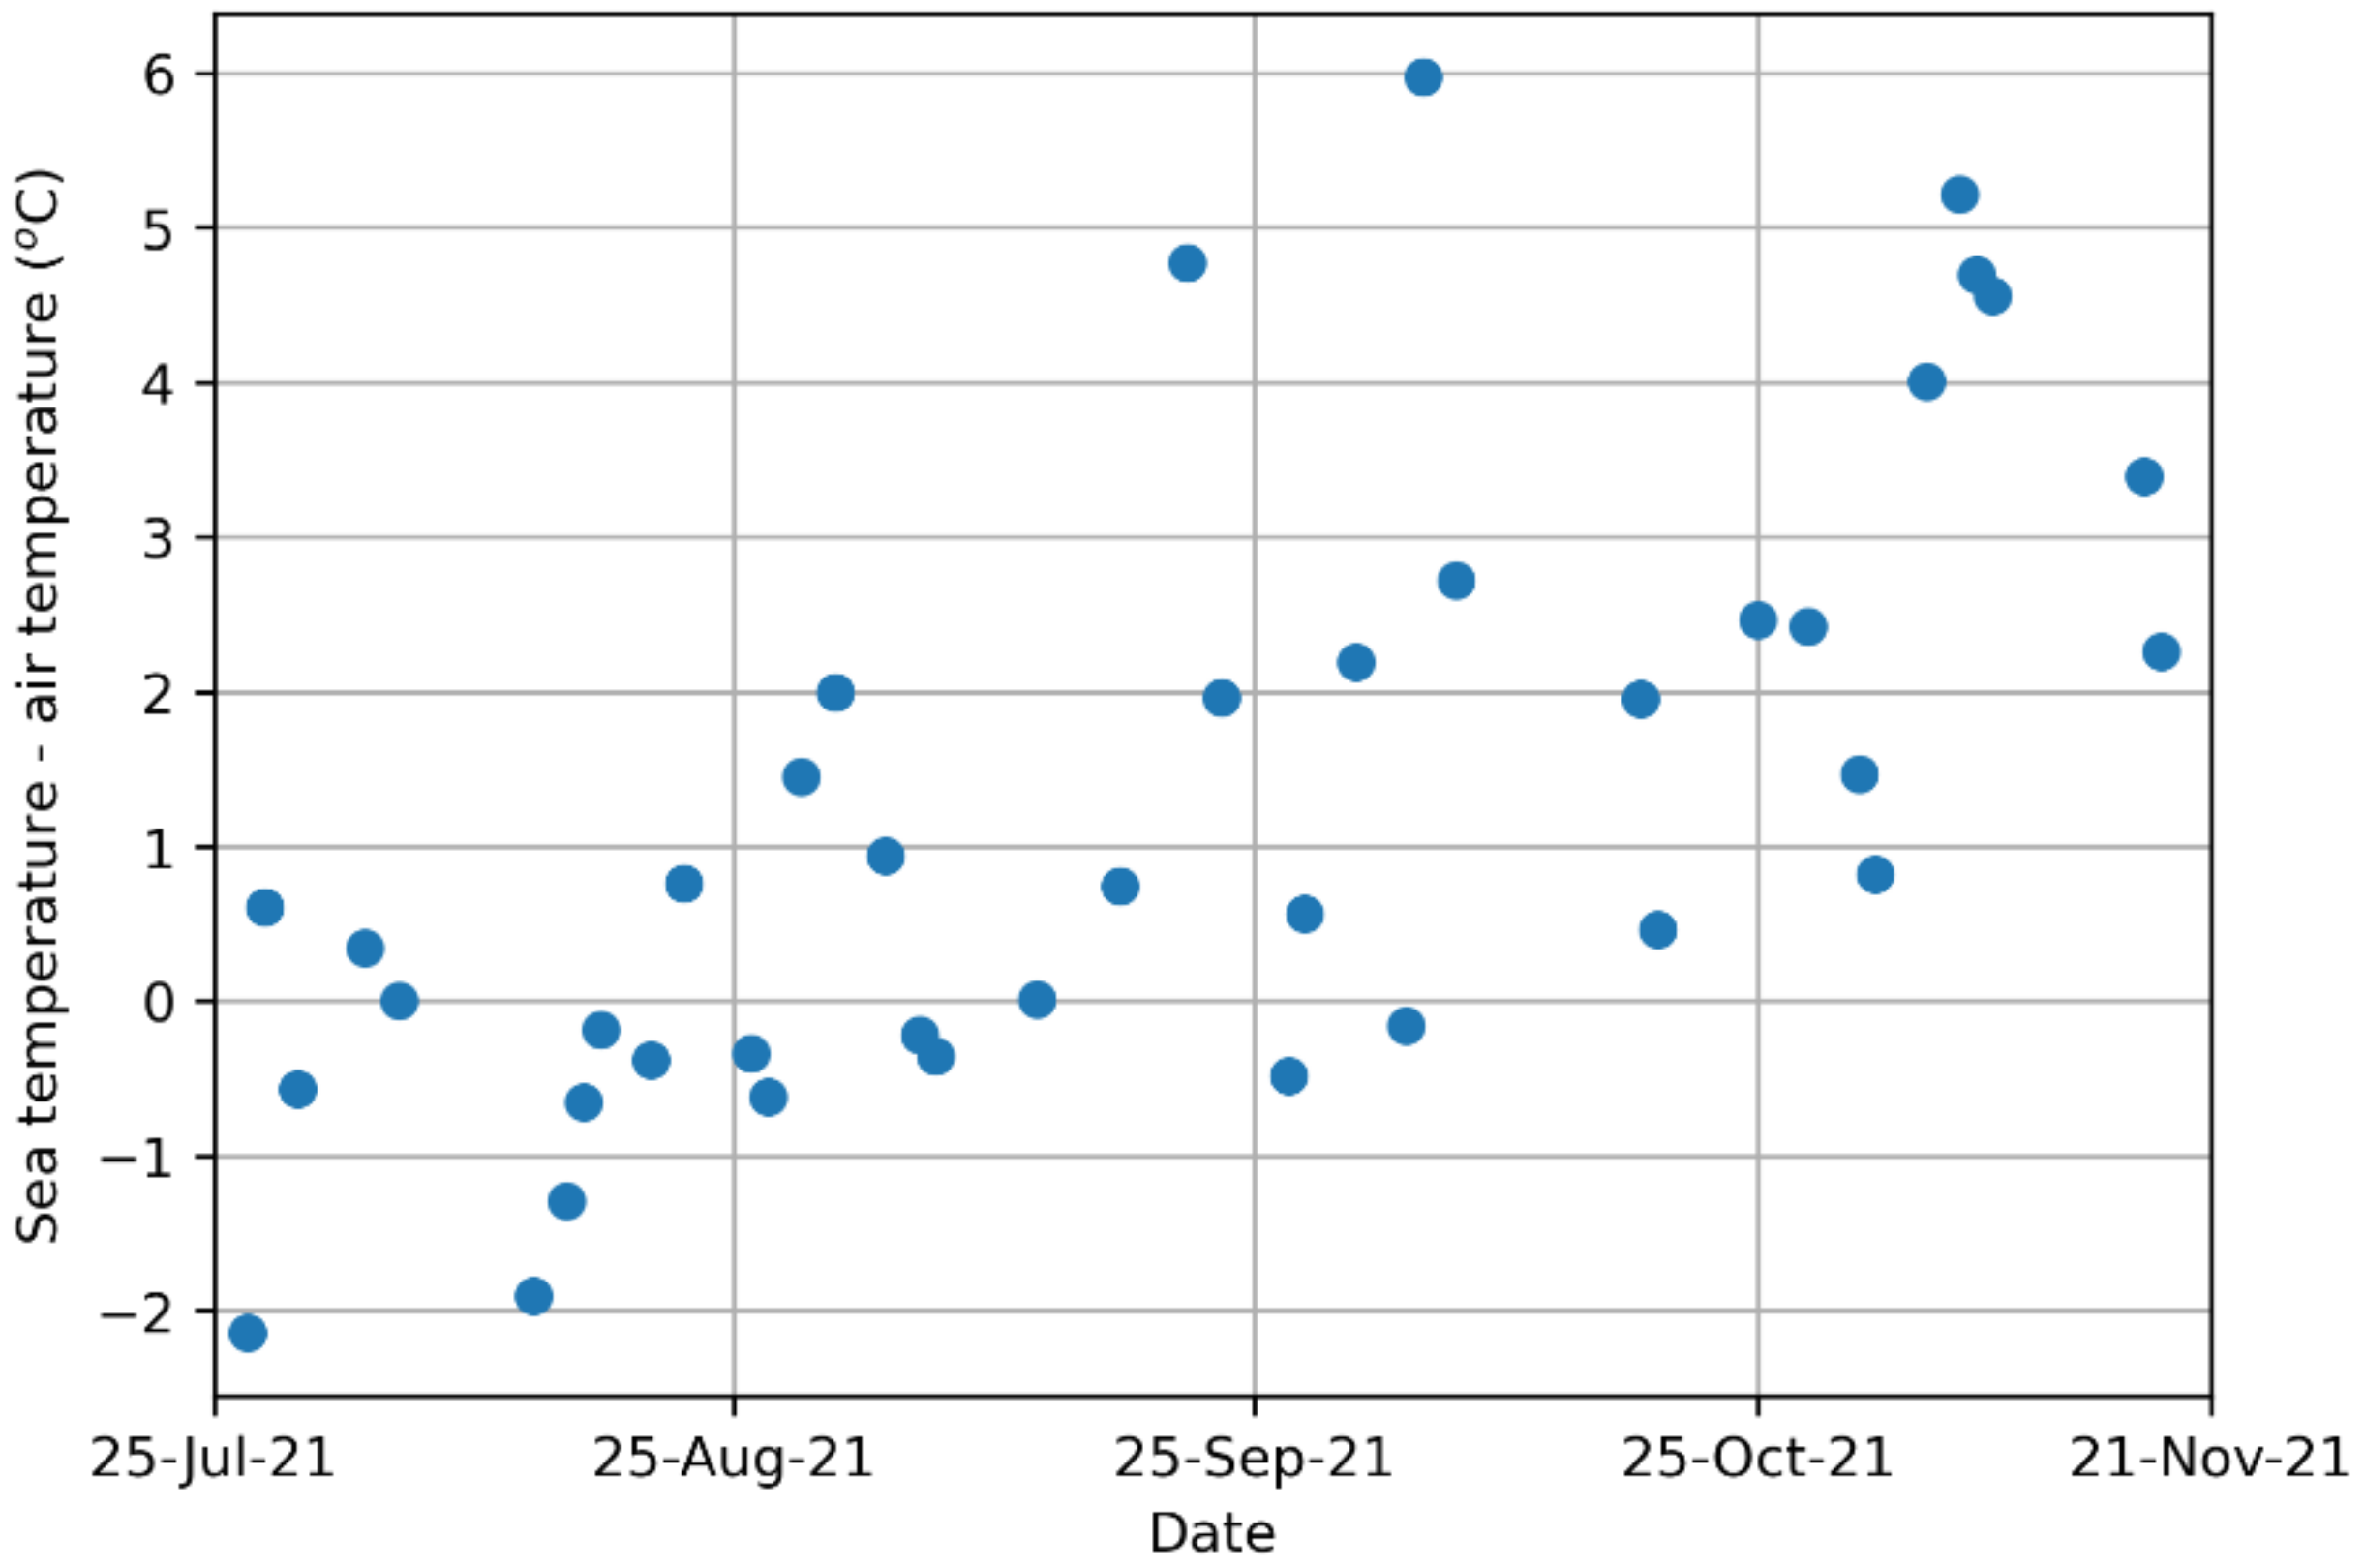
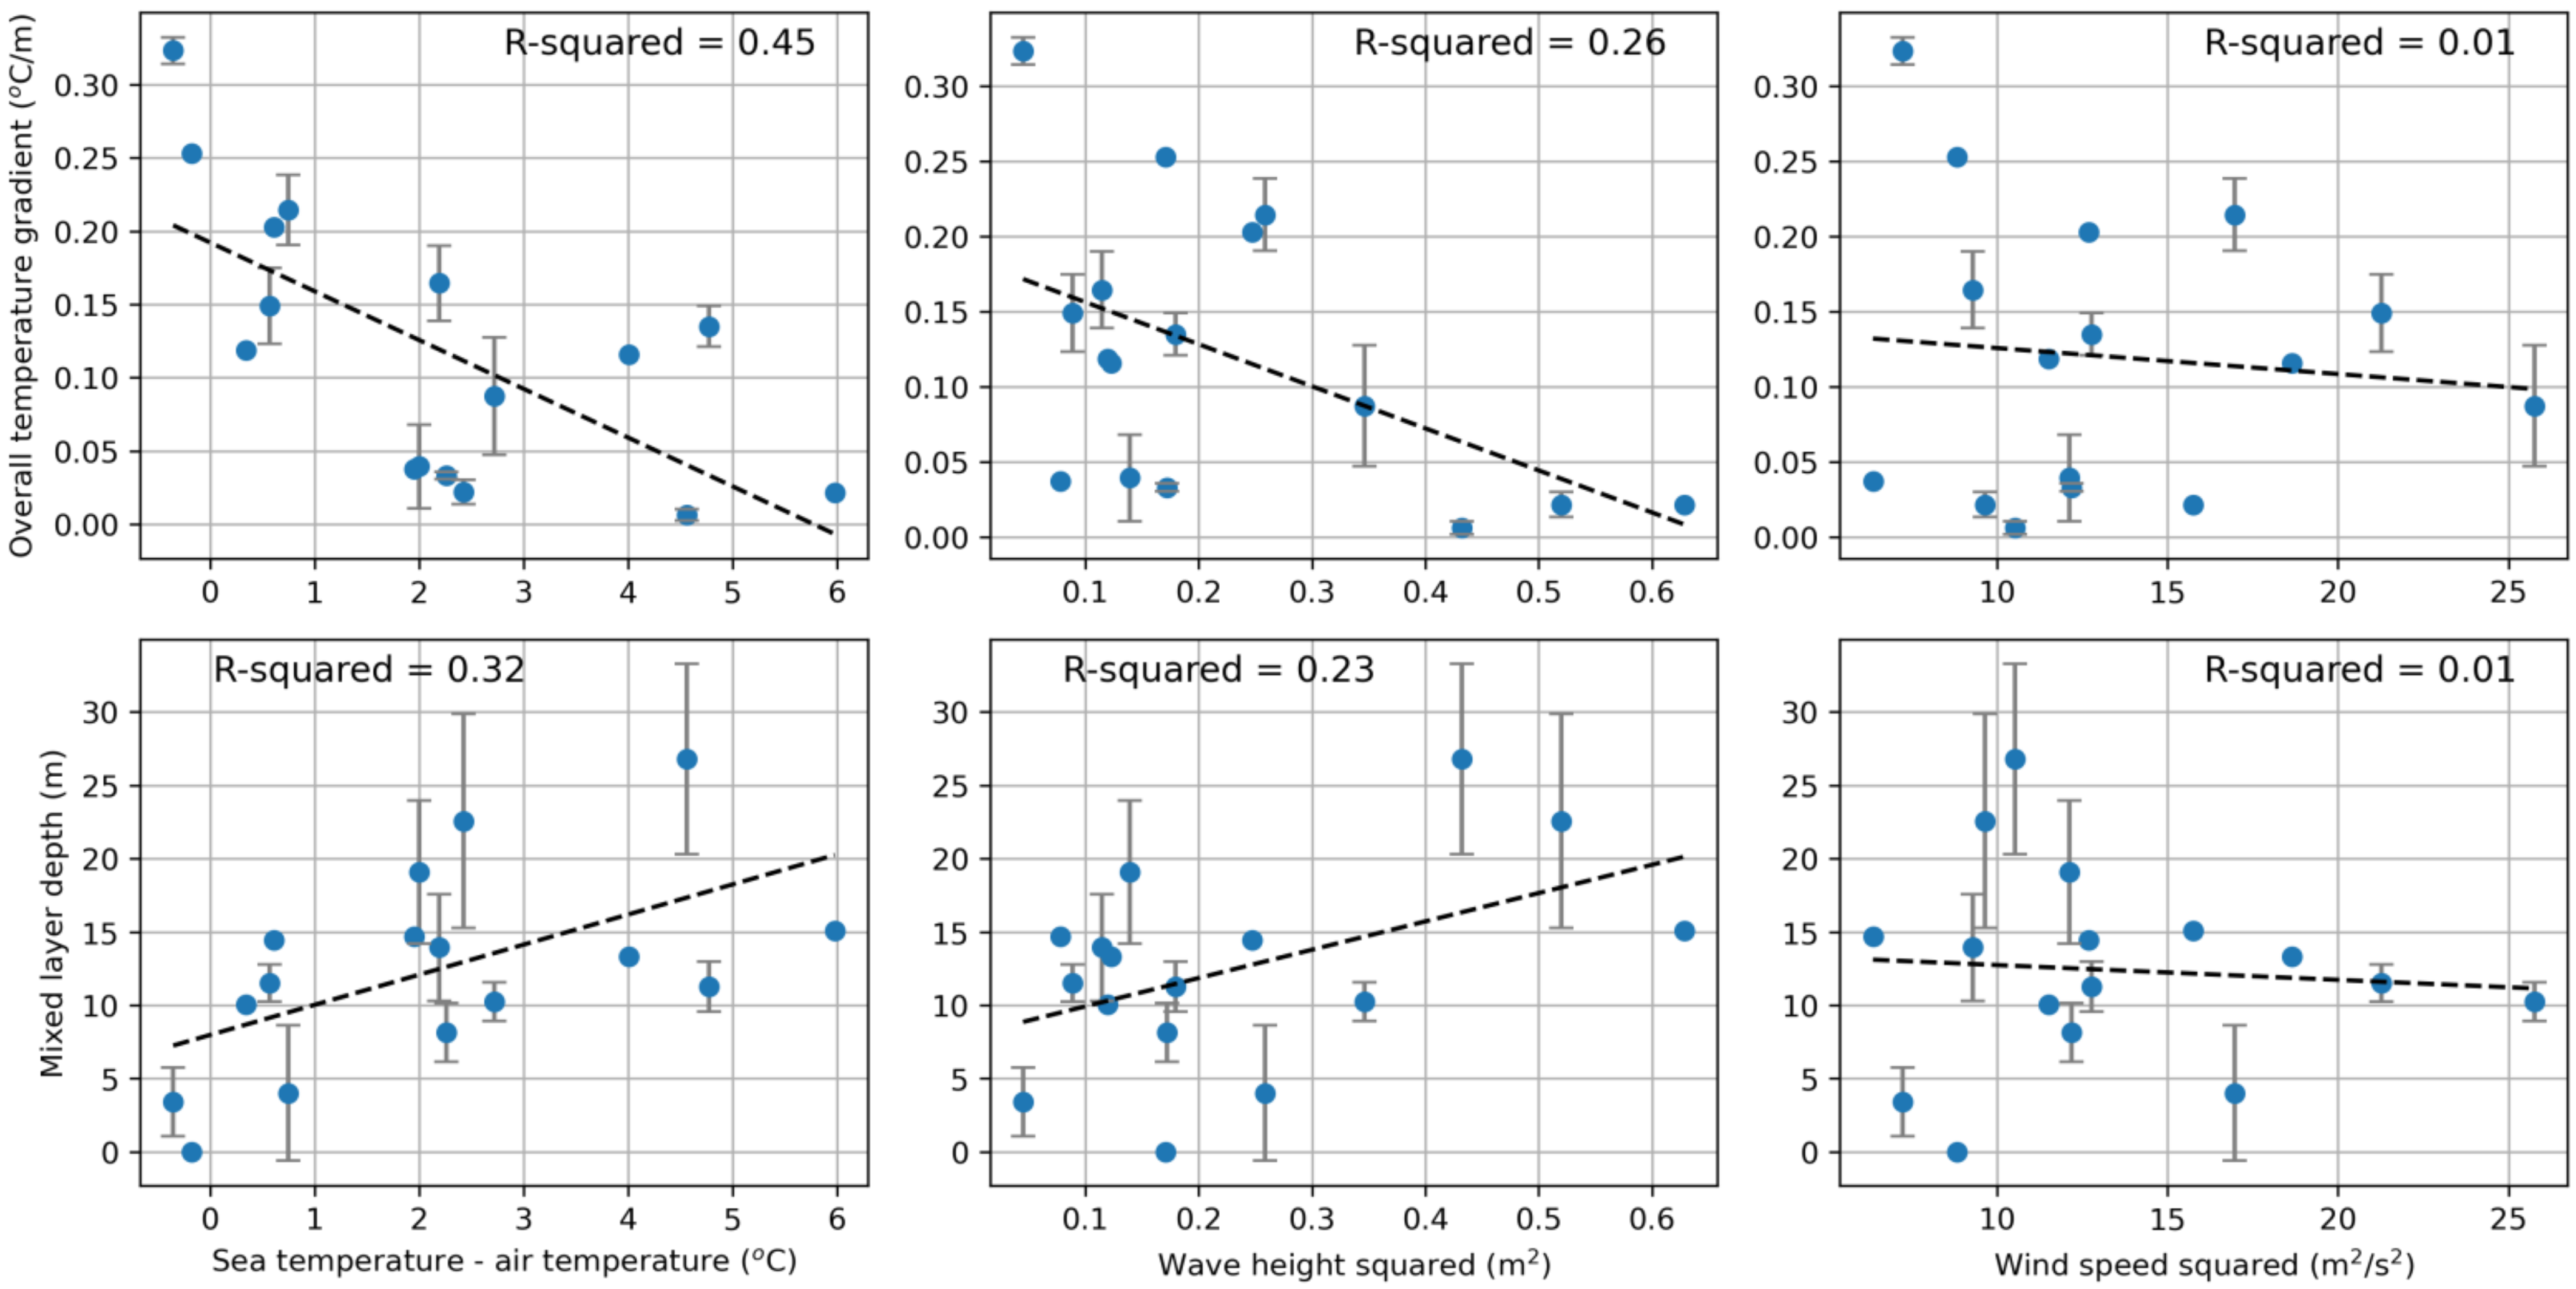
5. Results and Discussion
6. Conclusions
Author Contributions
Funding
Institutional Review Board Statement
Informed Consent Statement
Data Availability Statement
Acknowledgments
Conflicts of Interest
References
- Harley, C.D.G.; Hughes, A.R.; Hultgreen, K.M.; Miner, B.G.; Sorte, C.J.B.; Thornber, C.S.; Rodriguez, L.F.; Tomanek, L.; Williams, S.L. The impacts of climate change in coastal marine systems. Ecol. Lett. 2006, 9, 228–241. [Google Scholar] [CrossRef] [PubMed] [Green Version]
- Amores, A.; Marcos, M.; Carrió, D.S.; Gómez-Pujol, L.L. Coastal Impacts of Storm Gloria (January 2020) over the Northwestern Mediteranean. Nat. Hazards Earth Syst. Sci. 2020, 20, 1955–1968. [Google Scholar] [CrossRef]
- Alverson, K.; Baker, D.J. Taking the pulse of the oceans. Science 2006, 314, 1657. [Google Scholar] [CrossRef] [PubMed] [Green Version]
- Brewin, R.J.W.; Hyder, K.; Andersson, A.J.; Billson, O.; Bresnahan, P.J.; Brewin, T.G.; Cyronak, T.; Dall’Olmo, G.; de Mora, L.; Graham, G.; et al. Expanding aquatic observations through recreation. Front. Mar. Sci. 2017, 4, 351. [Google Scholar] [CrossRef] [Green Version]
- Brewin, R.J.W.; de Mora, L.; Jackson, T.; Brewin, T.G.; Shutler, J. On the Potential of Surfers to Monitor Environmental Indicadtors in The Coastal Zone. PLoS ONE 2015, 10, e0127706. [Google Scholar] [CrossRef] [PubMed]
- Wright, S.; Hull, T.; Sivyer, D.B.; Pearce, D.; Pinnegar, J.K.; Sayer, M.D.J.; Mogg, A.O.M.; Azzopardi, E.; Gontarek, S.; Hyder, K. SCUBA divers as oceanographic samplers: The potential of dive computers to augment aquatic temperature monitoring. Sci. Rep. 2016, 6, 30164. [Google Scholar] [CrossRef] [PubMed] [Green Version]
- Bresnahan, P.J.; Wirth, T.; Martz, T.R.; Andersson, A.J.; Cyronak, T.; D’Angelo, S.; Pennise, J.; Melville, W.K.; Lenain, L.; Statom, N. A sensor package for mapping pH and oxygen from mobile platforms. Methods Oceanogr. 2016, 17, 1–13. [Google Scholar] [CrossRef] [Green Version]
- ACA. Quality of the Beaches and Swimming Areas of Catalonia. Available online: https://aplicacions.aca.gencat.cat/platgescat2/app.php/en/playa/157# (accessed on 21 October 2021).
- BCN, Bany i Platges, Ajuntament de Barcelona. Available online: https://www.barcelona.cat/ca/que-pots-fer-a-bcn/banys-i-platges (accessed on 1 August 2019).
- ICM, Estació Litoral de Barcelona, Institut de Ciències del Mar. Available online: http://coo.icm.csic.es/site-page/stations#Barcelona-ELB (accessed on 1 August 2019).
- ICM, PUDEM SOS Application, Institut de Ciències del Mar. Available online: http://ide.cmima.csic.es/sos-js/web/examples/sos-apptest (accessed on 1 August 2019).
- ICM. Oceanographic Data - Coastal Ocean Observatory. Available online: http://coo.icm.csic.es/site-page/oceanographic-data (accessed on 21 October 2021).
- Arin, L.; Guillén, J.; Segura-Noguera, M.; Estrada, M. Open sea hydrographic forcing of nutrient and phytoplankton dynamics in a Med. coastal ecosystem. Est. Coastal Shelf Sci. 2013, 133, 116–128. [Google Scholar] [CrossRef]
- Romero, E.; Peters, F.; Arin, L.; Guillén, J. Decreased seasonality and high variability of coastal plankton dynamics in an urban location of the NW Mediterranean. J. Sea Res. 2014, 88, 130–143. [Google Scholar] [CrossRef]
- Guillén, J.; Arin, L.; Salat, J.; Puig, P.; Estrada, M.; Palanques, A.; Simarro, G.; Pascual, J. Coastal oceanographic signatures of heat waves and extreme events of dense water formation during the period 2002–2012 (Barcelona, NW Mediterranean). Scientia Marina 2018, 82, 189–206. [Google Scholar] [CrossRef]
- ADIPAV. Reglamento de la Disciplina Patín a Vela. Clase: Patín a Vela. Available online: http://adipav.org/node/1503 (accessed on 31 January 2022).
- Depoorter, G. El Patín a Vela; Editorial Hispano Europea: Sitges, Spain, 1974; p. 328. [Google Scholar]
- Ortigosa, I.; Castells-Sanabra, M.; Llevadot, J.M.; Bardaji, R.; Hoareau, N.; Simon, C.; Pelegrí, J.; Casanova, I.V. Adapting the existing coastal Patí a vela fleet for scientific purposes. J. Maritime Res. 2020, 17, 88–94. [Google Scholar]
- Beddows, P.A.; Mallon, E.K. Cave Pearl Data Logger: A Flexible Arduino-Based Logging Platform for Long-Term Monitoring in Harsh Environments. Sensors 2018, 18, 530. [Google Scholar] [CrossRef] [PubMed] [Green Version]
- SeaDataNet. Quality Quality Control Procedures. &th Framework of Ec Dg Research, V2.0, May 2010. Available online: https://www.seadatanet.org/content/download/596/3118/file/SeaDataNet_QC_procedures_V2_(May_2010).pdf (accessed on 20 November 2021).
- Software Manual Seasoft V2: SBE Data Processing. CTD Data Processing & Plotting Software for Windows. Sea-Bird Scientific. Available online: https://www.seabird.com/asset-get.download.jsa?code=251446 (accessed on 9 December 2017).
- Grifoll, M.; Aretxabaleta, A.; Espino, M.; Warner, J. Along-shelf current variability on the Catalan inner-self (NW Mediterranean). J. Geophys. Res. 2012, 117, c09027. [Google Scholar] [CrossRef] [Green Version]
- Gómez, M.J.C. Carretero. Wave Forecasting at the Spanish Coasts. J. Atm. Ocean Sci. 2005, 10, 389–405. [Google Scholar] [CrossRef]
- Measurements of the Meteorological Stations of the City of Barcelona, Open Data BCN, Servei Meteorològic de Catalunya. Available online: https://opendata-ajuntament.barcelona.cat/data/ca/dataset/mesures-estacions-meteorologiques (accessed on 20 November 2021).
- Sentinel 3, EUMETSAT. Dedicated Copernicus Satellite Mission Delivering a Variety of High-Quality Ocean Measurements. Available online: https://www.eumetsat.int/sentinel-3 (accessed on 20 November 2021).
- Babanin, A.V. Breaking and Dissipation of Ocean Surface Waves; Cambridge Univ. Press: Cambridge, UK, 2011. [Google Scholar]


| LOA | Beam | Displacement (Hull) | Sail Area | Hull Type |
|---|---|---|---|---|
| 5.60 m | 1.60 m | 89 kg | 12.60 m2 | Catamaran |
| Flag Value | Definition Term | Abbreviated Term |
|---|---|---|
| 0 | No quality control procedures have been applied to the data value. This is the initial status for all data values entering the working archive. | No quality control |
| 1 | Good quality data value that is not part of any identified malfunction of the instrument and has been verified as consistent with real phenomena during the quality control process. | Good |
| 2 | This value has been derived by interpolation from other values in the data object. | Interpolated |
| 3 | Data value is recognized as unusual during quality control, possibly inconsistent with real phenomena. | Suspect |
| 4 | An obviously erroneous data value | Bad |
| 9 | The data value is missing. | Missing |
| Latitude (N) | Longitude (E) | Mdepth (m) | |
|---|---|---|---|
| TD1 | 41.3856° | 2.2099° | 23 |
| TD2 | 41.3798° | 2.1986° | 12 |
| TD3 | 41.3749° | 2.1951° | 11 |
| TD4 | 41.3806° | 2.2029° | 20 |
| TD5 | 41.3785° | 2.2084° | 28 |
| TD6 | 41.3757° | 2.2162° | 28 |
| Date | TD1 | TD2 | TD3 | TD4 | TD5 | TD6 |
|---|---|---|---|---|---|---|
| 28 July | X | X | X | |||
| 3 August | X | X | X | |||
| 17 August | X | X | X | |||
| 31 August | X | X | X | |||
| 6 September | X | X | X | |||
| 17 September | X | X | X | X | X | X |
| 21 September | X | X | X | X | X | X |
| 28 September | X | X | X | X | X | X |
| 1 October | X | X | X | X | X | X |
| 5 October | X | X | X | |||
| 7 October | X | X | X | X | X | X |
| 18 October | X | X | X | |||
| 28 October | X | X | X | X | X | X |
| 8 November | X | X | X | X | X | X |
| 18 November | X | X | X |
Publisher’s Note: MDPI stays neutral with regard to jurisdictional claims in published maps and institutional affiliations. |
© 2022 by the authors. Licensee MDPI, Basel, Switzerland. This article is an open access article distributed under the terms and conditions of the Creative Commons Attribution (CC BY) license (https://creativecommons.org/licenses/by/4.0/).
Share and Cite
Ortigosa, I.; Bardaji, R.; Carbonell, A.; Carrasco, O.; Castells-Sanabra, M.; Figuerola, R.; Hoareau, N.; Mateu, J.; Piera, J.; Puigdefabregas, J.; et al. Barcelona Coastal Monitoring with the “Patí a Vela”, a Traditional Sailboat Turned into an Oceanographic Platform. J. Mar. Sci. Eng. 2022, 10, 591. https://doi.org/10.3390/jmse10050591
Ortigosa I, Bardaji R, Carbonell A, Carrasco O, Castells-Sanabra M, Figuerola R, Hoareau N, Mateu J, Piera J, Puigdefabregas J, et al. Barcelona Coastal Monitoring with the “Patí a Vela”, a Traditional Sailboat Turned into an Oceanographic Platform. Journal of Marine Science and Engineering. 2022; 10(5):591. https://doi.org/10.3390/jmse10050591
Chicago/Turabian StyleOrtigosa, Inmaculada, Raul Bardaji, Albert Carbonell, Oriol Carrasco, Marcella Castells-Sanabra, Rafel Figuerola, Nina Hoareau, Jordi Mateu, Jaume Piera, Joan Puigdefabregas, and et al. 2022. "Barcelona Coastal Monitoring with the “Patí a Vela”, a Traditional Sailboat Turned into an Oceanographic Platform" Journal of Marine Science and Engineering 10, no. 5: 591. https://doi.org/10.3390/jmse10050591