Article

Decision-Making on the Selection of Clean Energy Technology for Green Ships Based on the Rough Set and TOPSIS Method

1
Sanya Science and Education Innovation Park, Wuhan University of Technology, Sanya 572004, China
2
School of Transportation and Logistics Engineering, Wuhan University of Technology, Wuhan 430063, China
3
School of Finance and Economics, Kaifeng University, Kaifeng 475004, China
*
Author to whom correspondence should be addressed.
J. Mar. Sci. Eng. 2022, 10(5), 579; https://doi.org/10.3390/jmse10050579
Submission received: 22 March 2022 / Revised: 21 April 2022 / Accepted: 22 April 2022 / Published: 25 April 2022
(This article belongs to the Topic Marine Renewable Energy)

Abstract

:
In the context of the decarbonization of the shipping industry, the application of clean energy technologies is a catalyst for decarbonization. With the number of potential clean energy technologies expanding, the uncertainties in terms of technology maturity, policy regulation, and economics make clean energy technologies decision much more difficult. Therefore, it is urgent to establish a clean energy technology selection scenario for the green ship industry to assist shipowners in decision-making. Based on this, a technology selection model based on rough set (RS) and approximate ideal solution ranking (TOPSIS) is constructed. Using RS to reduce the evaluation index and calculate the weight can avoid the one-sidedness of subjective weighting. Using the TOPSIS method to rank alternatives. This paper selects seven clean energy technology alternatives, namely LNG power, LPG power, methanol power, HVO power, pure battery power, hydrogen fuel cell, and ammonia fuel cell, respectively, as the evaluation objects. Taking two types of vessels as examples, it is concluded that LNG power technology is suitable for large coastal ro-ro passenger vessels, and pure battery power technology is suitable for small inland river short-distances vessels. The results are in line with reality, which verifies the scientificity and validity of the proposed model.

1. Introduction

With the development of the global trade and shipping industry, global shipping fuel consumption is increasing year by year. Fuel consumption is closely related to the emission of greenhouse gases and pollutants. It is estimated that greenhouse gas emissions from shipping fuel consumption account for about 3% of global CO2 emissions [1], while CO2 from ship exhaust emissions accounts for about 2% of global emissions [2]. We can see that ship emissions are major sources of pollution in the shipping industry. In recent years, relevant organizations such as the International Maritime Organization (IMO) have issued a series of regulations and measures to deal with navigation pollution caused by ships. In April 2018, the 72nd session of the Marine Environmental Protection Committee (MEPC) adopted “the initial IMO strategy on the reduction of greenhouse gas emission from Ships”, which, for the first time, proposed a reduction target for the global shipping industry: the carbon emissions of the fleet by at least 40% by 2030 and 50% by 2050 compared to 2008, and will gradually move towards a zero-carbon goal. It has been found that decarbonization has been the future development direction of the shipping industry [3].
In the process of the decarbonization of shipping, academia and industry have started to focus on measures to reduce ship pollution from the aspects of speed control, hull design, and the application of emission reduction technologies [4]. Among many initiatives, the application of clean energy technologies is considered a key factor affecting the decarbonization of shipping [5,6,7]. Clean energy includes renewable energy that produces no or very little pollutants, such as wind energy, solar energy, biomass energy, hydro energy, geothermal energy, hydrogen energy, ocean energy, etc., as well as the use of low-emission fossil energy (e.g., LNG, LPG) and nuclear energy, etc. [8]. The ship’s clean energy technology refers to the application of one or more forms of clean energy in the ship power system to improve the level of energy conservation and reduce the emission of ships as well as improve the working environment of vessels. According to the type of energy, the green ship clean energy technology mainly includes LNG fuel technology, battery power technology, solar energy technology, hydrogen fuel technology, ammonia fuel technology, wind energy technology, nuclear energy technology, etc. [9,10,11].
With the continuous breakthrough of clean energy technology and the continuous expansion of application scenarios, the application of clean energy technologies on ships is becoming more and more complicated because the potential clean energy technologies types are increasing, and the differences in the types of clean energy in terms of technical, economic and environmental criteria, which makes the selection of clean energy technologies for ships more difficult [6]. Under the double pressure of tightening environmental protection policies and ship renewal, how to choose the suitable clean energy technology for different ships is an urgent problem to be solved in the shipping industry.
In terms of the decarbonization path of the shipping industry, the direction of the technical means of improvements in ship energy efficiency and the transition to clean alternative energy has been determined. Although all parties have basically reached an agreement on the direction of emission reduction, the viewpoints of each subject in the implementation path of international shipping emission reduction are different or even have a large difference, which determines that the path to net-zero emissions in the shipping industry will be full of uncertainties. Some scholars have started to pay attention to the decision-making of technology selection for emission reduction in the shipping industry under uncertain information, mainly focusing on the aspect of low-sulfur control technology, the alternative fuels selection, energy efficiency improvement, etc.
Qualitative evaluations based on the literature and industry experience are commonly used methods of analysis. Martin Viktorelius [12] used the literature analysis method to discuss the application of energy-powered technologies in ships and determined how the technology is implemented by analyzing the relationship between technology, organization, and energy efficiency. DNV GL [13] conducted a qualitative comparison of alternative fuel technologies, including hydrogen, ammonia, methanol, LPG, hydrogenated vegetable oil (HVO), Li-ion batteries, and other alternative clean energy sources for ships, concluding that there are no clear-cut options for alternative marine energy for future shipping. Hui Xing et al. [14] summarized the potential alternative marine fuel options through a literature review. The relevant properties of zero-carbon or carbon-neutral fuels were analyzed, and the options of potential marine fuel options were ranked qualitatively.
In addition to this, some scholars have used quantitative evaluation methods to assess different emission reduction technologies, such as Jingzheng Ren, Marie Lützen, et al. [15] extracted nine indicators from four major aspects: technology, economy, sociopolitical and environment, and evaluated the sustainability of three low-sulfur abatement technologies (scrubber tower, low-sulfur fuel, and LNG) using AHP and VIKOR methods. The results showed that LNG technology had the best effect. However, only technical maturity indicators were considered in the technical attributes—the indicators were too single. Jingzheng Ren et al. [16] improved the indicator system in a subsequent study. In terms of technical attributes, in addition to technical maturity, this study also included reliability and energy storage efficiency. This paper further constructed a fuzzy hierarchical analysis (FAHP) and DS evidence theory selection decision model to evaluate alternative energy options for shipping and verified the validity of the model through case studies, but there is also the disadvantage that the index weight acquisition is too subjective. Bui, K.Q., and Olcer et al. [17] focused on the three major criteria (social, economic, and environmental) of the sustainable development of shipping by using AHP and TOPSIS methods to analyze and evaluate four alternatives (low-sulfur fuel, methanol, scrubber, and LNG) for low-sulfur emissions from ships and concluded that low-sulfur fuel was the best alternative under the current maritime regulations, followed by methanol, scrubbers, and LNG. AR Kim et al. [18] aimed to reduce sulfur emissions in the shipping industry by evaluating the response direction of Korean shipping companies to SOx regulations, and taking three alternatives: switching to low-sulfur fuels, installing scrubbers, and the application of LNG-powered ships, it was found that the response direction differed for different ship ages and tonnages. Seddiek, I.S. and Elgohary [19], and Z.L. Yang [20], etc., took SOx and NOx reduction as the perspective and analyzed the technical strategies of ship emission reduction through the literature analysis method and AHP-TOPSIS method, respectively. Christian Haehl et al. [21] proposed a real option regime from the perspective of a regulatory uncertainty transformation model for determining the optimal investment and technology choice for ships by using two-stage modeling to characterize market demand and introducing environmental regulations as a stochastic component; the results demonstrate that regulatory uncertainty can influence investment patterns and decision-making in ship operation technology.
Bekir Sahin [22] used an improved Gaussian fuzzy analytic hierarchy process (IG-FAHP) to analyze and evaluate four alternatives for ship emission reduction (new ship design, energy efficiency technology, clean energy technology, and automation technology), it was found that Gaussian fuzzy numbers have advantages over triangular or trapezoidal fuzzy numbers, which verified the applicability of the model. Omer Berkehan Inal [23] used AHP hierarchical analysis to evaluate four fuel cell types in terms of eight criteria: safety, emissions, efficiency, cost, lifetime, power output, fuel type, and cell size to evaluate the options. Some scholars such as Gilbert [24], Maja Percic [25,26], and Ailong Fan [27], etc., have used the whole life cycle approach, taking different waters and ship types as objects, to develop the environmental and economic assessment of shipping fuels and power.
The above literature analysis shows that the research on the application of clean energy technologies from the decarbonization perspective has just started, and the comparative analysis and economic evaluation of clean energy technologies are mainly conducted from the qualitative perspective and the whole life cycle perspective. Most of the studies are still from the sulfur-emission reduction perspective, carrying out the comparative analysis of different shipping green technologies (such as installation of desulfurization tower, low-sulfur fuel, LNG technology, etc.).
In summary, it was found that the following shortcomings exist in the above research: (1) The study on the selection of clean energy technologies for ships is mainly carried out with the objective of the economy and environmental protection. There is a lack of research on the selection of clean energy technologies for ships of different tonnages and voyages under multiple criteria. (2) Bibliometrics, AHP, or group decision-making methods are mostly used in the evaluation models for the selection and decision-making of shipping emission reduction technologies, which have the problems of strong subjectivity and insufficient mining of sample data information.
Given the uncertain environment, the selection of clean energy technologies is often a process involving multiple criteria and evaluating multiple alternatives. To address this issue, this paper establishes a multi-dimensional decision support framework for clean energy technologies for the green ship industry to make supplementary decisions for ship-owners. The main contributions of this paper are as follows: (1) Taking the decarbonization of the shipping industry as the perspective, we comprehensively analyze the application characteristics of different clean energy technologies, construct a multi-dimensional evaluation index system considering the technicalities, economy, environment, and safety, and take specific routes and ship types as examples to excavate the key indicators that affect the selection decision-making of clean energy technology. (2) To address the problems of strong subjectivity of the current shipping emission reduction technology selection evaluation model and inadequate information mining of the sample data by the model, the RS method, which does not require a priori information, is introduced and combined with the TOPSIS method to help shipowners and operators make decisions on the selection of clean energy technologies under uncertain information.

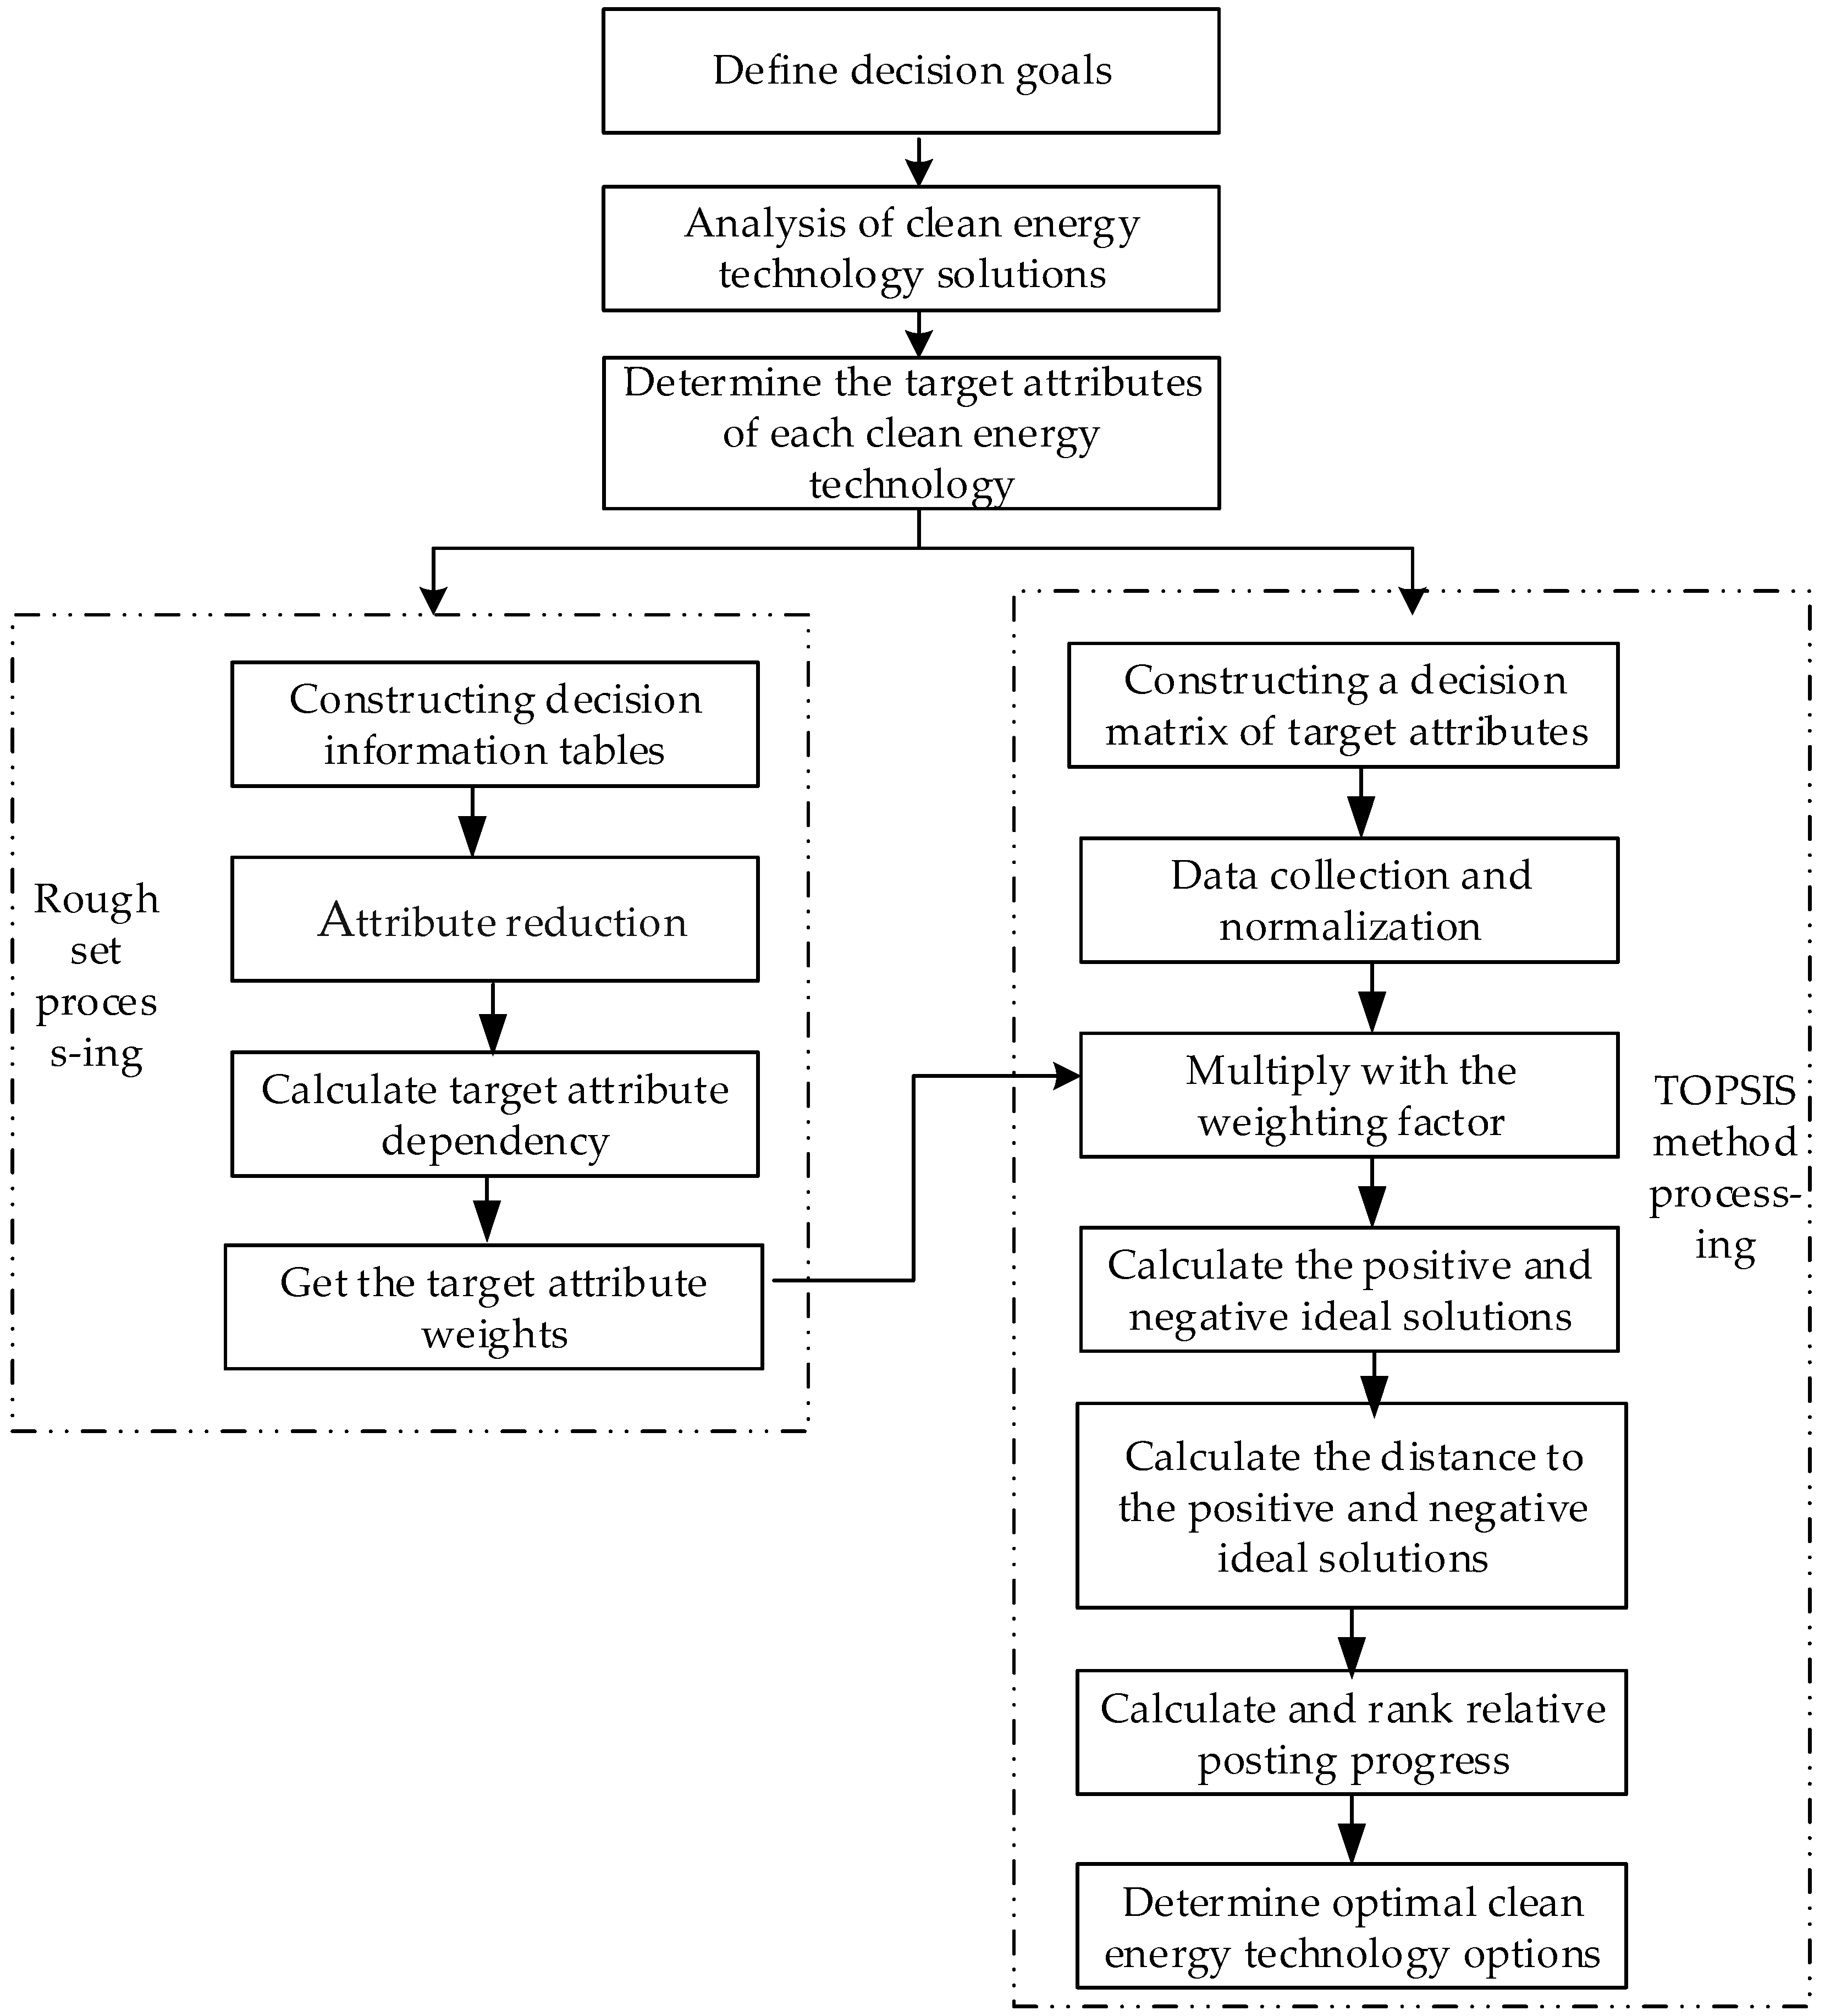
2. Clean Energy Technology Selection Method

The decision of clean energy technology selection for the green ship industry belongs to a typical multi-criteria decision-making (MCDM) problem, which mainly portrays the prioritization and ranks the alternatives according to multiple objectives in the shipowner’s decision-making process [28]. The TOPSIS method can handle multi-constrained decision criteria. It is an effective method to solve the multi-program selection problem. However, the TOPSIS method is more subjective in constructing the standardized matrix, where the determination of weights is generally derived from expert experience. It is especially when new technologies are generated, and experts cannot accurately predict the relevant indicators of the technologies that rely on expert scores that will produce a particular bias.
Compared with subjective weight determination methods such as AHP, the RS method does not require a priori information—the solution process is driven by actual samples, which is highly operable. The RS method can approximate the training data, find the minimum set of attributes, and obtain effective decision rules. Thus, this paper establishes a RS-TOPSIS-based decision-making model to improve the accuracy and scientificity of a ship’s clean energy technology selection decision. By analyzing the application solutions of clean energy technology in different ship types, it will make the transition of green ships to clean energy more accessible and reduce the risk of making the relevant ships become stranded assets, which can provide a reference and basis for shipowners to carry out the transition of green ships.
The decision framework of this study is shown in Figure 1. This paper combines RS theory with the TOPSIS method to evaluate clean energy technology alternatives. Firstly, the RS method is used to approximate the target attributes and calculate the weights of each target attribute; secondly, the TOPSIS method is used to standardize the constructed initial decision matrix, and the matrix is multiplied by the target attribute weight of the RS processing to obtain a positive, the negative ideal solution and their distances; finally, the relative closeness of different green ship clean energy technology alternatives are calculated and ranked to obtain the selection decision result of green ship clean energy.

2.1. Identification of Clean Energy Technology Alternatives

Through a literature review and analysis of research reports, it was found that the available clean energy technologies can be classified into the following types (see Table 1).
Among many clean energy technologies, nuclear power technology has obvious advantages, such as no-exhaust emissions, no need for frequent fuel replenishment, high propulsion efficiency, etc. However, barriers such as low public acceptance and low effectiveness limit its wide application in the shipping industry. Renewable energy technologies such as wind assist and solar propulsion can only be used as an auxiliary energy source for ships due to their low conversion rate and limited availability on ship types. In addition, the application of battery power technology in deep-sea shipping is limited due to low energy density and short-range. This paper offers a literature review combined with the results of multiple comparisons, such as the handheld orders for clean energy ships and the research and development of clean energy ships released by platforms such as Clarkson, DNV GL, ABS, etc. In addition, this paper mainly selects LNG fuel power, LPG fuel power, methanol (from fossil energy) fuel power, biofuel power (HVO), ammonia fuel cell, hydrogen fuel cell, and pure battery power technologies as samples noted as U = { T 1 , T 2 , T 4 , T 5 , T 6 , T 7 } . The proposed method will evaluate and analyze the seven clean energy technology alternatives for green ships.

2.2. Determination of Target Attributes of Clean Energy Technology Program

The choice of clean energy technology solutions in the green ship industry is affected by many factors. Acciaro et al. [29] and Rojon and Dieperink et al. [30] attribute it to organizational factors, shipowner behavior factors, market factors, etc. The International Renewable Energy Agency (IRENA) [31] has further sorted out these factors, and the organizational factors are attributed to the formulation of politics and related norms. The behavior of shipowners is mainly affected by economic factors, such as investment costs and operating costs. Market factors mainly include market incentives, benefits, etc. In addition, non-market factors mainly refer to the complexity of clean energy’s own characteristics, such as technological uncertainty and security.
At present, various clean energy technologies show great differences in terms of economy, technology maturity, technology adaptability, emission reduction effect, safety, etc. For example, LNG fuel performs well in terms of technology maturity and economy, but the carbon emission reduction effect is average. Hydrogen fuel and ammonia fuel perform better in emission reduction effects, but the economy and safety are relatively poor and technically immature. The technology of pure electric ships has matured, but the limitation of volumetric energy density leads to the limitation of its application in long-distance and large-tonnage ships. At the same time, the chemical properties of each clean energy are different, resulting in different environmental hazards in the event of leakage. For example, ammonia fuel has higher toxicity and is less harmful to the environment. HVO fuel has lower toxicity and is less harmful to the environment. These influencing factors can be further categorized as technical, safety, economic, political, social, and environmental factors.
The selection of clean energy technologies for green ships is a complex and comprehensive issue. Decision-makers usually face several conflicting criteria when selecting the most sustainable clean energy technology with the best overall benefits. Currently, economic, technical, environmental, social, and political standards are mainly used to select emission reduction technologies for shipping [15,16,17]. These criteria correspond to the influencing factors in the previous section. Under each standard, there are the corresponding sub-criteria. For example, technical maturity and technology application readiness are technical criteria. Energy costs and engine retrofit costs are economic criteria, and CO2 emissions, NOx emissions, etc., are environment-based criteria. According to the findings of previous studies, technological, environmental, and economic standards are the critical criteria that influence the choice of a particular alternative clean energy source [14]. Andersson et al. [32] also obtained similar findings in their study: when the clean energy technology path is unclear, policy support has little impact on the technology decision-making process.
In this paper, considering that in the early stages of clean energy technology development, the degree of policy support is often influenced by emission reduction effect, technology maturity, safety, and other indicators. At present, there is no clear direction for countries to support different clean energy policies for ships. Based on this, this paper does not consider the influence of policy factors but only the characteristics of the technology itself to make a decision on the selection of clean energy technologies. According to the analysis results of different influencing factors and the characteristics of each clean energy technology, the four dimensions of economic, technical, environmental, and safety are evaluated comprehensively. The corresponding secondary index system is constructed (see Table 2).
Different clean energy technologies have different indicator performance. In order to explore the path of clean energy technology development, different maritime agencies such as DNVGL, ABS, IRENA, etc., have carried out studies on the performance of each clean energy technology to help shipowners understand the direction of clean energy technology development in the shipping industry. Considering that the application of clean energy technologies is in its early stages, the performance of many indicators lacks real-ship verification and is more dependent on expert experience. The performances of the indicators are all analyzed qualitatively, such as the reports [6,13] on maritime fuels issued by DNVGL institutions are all based on the 1–5 quantitative scoring method, and the relevant data are obtained through expert questionnaire research from shipyards, universities, shipping authorities, etc. Through the comparative data analysis of reports and papers of multiple institutions, it was found that the scores of each sample data were consistent. There is not much difference in the implementation progress of each clean energy technology in each country at present. Therefore, this paper uses the above sample information to carry out research.
According to the relevant reports published by DNVGL [6,13], the qualitative analysis results of various clean energy technology attributes by Ampah [33], combined with the analysis of different clean energy technology attributes by ABS institutions [34,35], the critical attribute performances of each clean energy technology were obtained as shown in Table 3. Among them, the investment cost, energy cost, and technical application readiness of electric ships have different performances in different waters, different voyages, and different ship types [25,26,27]. These three indicators are used as variables.

2.3. RS Method to Determine Attribute Weights

The concept of RS was introduced by the Polish mathematician Pawlak [36] in 1982, and is one of the most important tools in soft computing, which is currently studied in applications in medical diagnosis [37], machine learning [38], pattern recognition [39], and data mining [40]. RS has advantages in dealing with decision systems with uncertain and incomplete information, with strong real-time, and is easily operable. In this paper, we adopted RS theory to establish the attribute sets and constructed a decision system of clean energy technology for green ships. Furthermore, this method can carry out attribute reduction based on data discretization results, and calculate the weights of each attribute [41]. The specific process is as follows:
Step 1. Construct the information table for decision-making of clean energy technology options. Set S = { U , C , F , d } as the knowledge expression system of clean energy technology options for green ships, where, U = { T 1 , T 2 , T 3 , , T i } is the set of options, and the constituent element T i ( i n ) in U is called the evaluation object. C = { C 1 , C 2 , C 3 , , C i } represents the set of all necessary clean energy attributes, the associated element C i ( i m ) in C represents the corresponding attribute. F is the attribute value. d is the information function.
For any C i C , if i n d ( C i ) = i n d ( C ) and C i is independent, then C i is a simplification of C , denoted as r e d ( C i ) .
i n d ( C ) = { ( x , y ) U × U | c C , c ( x ) = c ( y ) }
The relation i n d ( C ) forms a classification of U , denoted by U / i n d ( C ) .
Step 2. S = { U , C , F , d } as a set of knowledge expression systems for clean energy technology solutions for C i C , U / i n d ( C i ) = { C 1 , C 2 , C 3 , , C i } , the amount of information of the knowledge C i is as follows:
I ( C i ) = i = 1 n | C i | | U | | 1 C i U | = 1 i = 1 n C i 2 | U | 2
where, | C i | denotes the base of C , C i U denotes the probability of occurrence of the equivalence relation C i in U .
Step 3. Calculate the importance of the target attributes of each evaluation alternative as:
S G F C C i = I C I C C i
Step 4. Weight of the target attributes of each evaluation alternative can be calculated with the formula below:
w ( C i ) = S C C i / i = 1 n S C C i
Through the above process, the weight of each attribute of the green ship clean energy technology alternatives can be obtained.

2.4. TOPSIS Method to Determine Alternatives Ranking

The TOPSIS method is mainly used to solve multicriteria decision-making problems [42]. Multiple alternatives are ranked by detecting the distance between the optimal solution and the worst solution (i.e., positive and negative ideal reference points). If the evaluation alternatives are close to the optimal solution and the distance from the worst solution is the farthest, the alternative is the optimal alternative; otherwise, it is the worst. The specific steps are as follows.
Step 1. Construction of initial evaluation matrix.
Construct an initial evaluation matrix for different clean energy technology evaluation alternatives X = ( x i j ) u × v , where X i j denotes the vth target attribute corresponding to the uth option ( i = 1 , 2 , 3 , 4 , , u ; j = 1 , 2 , 3 , 4 , , v ) .
X = ( x i j ) = [ x 11 x 1 v x u 1 x u v ]
Step 2. Establish a standardized decision matrix.
Considering the different measurement units and scales, it is necessary to normalize the target attributes in the matrix X to make different variables comparable—that is, to determine the type of each target attribute in the matrix X . For the benefit criteria in clean energy technology, the larger the value is, the better it is—Equation (6) can be used to calculate this value:
y i j = x i j min j x i j max j x i j min j x i j
For cost attributes, the smaller the attribute value, the better, and it is normalized according to Formula (7):
y i j = max j x i j x i j max j x i j min j x i j
Step 3. Establish a weighted standardized decision matrix.
The R matrix, after normalizing the matrix, X is further weighted by multiplying the values of each column in the normalized decision matrix R with the weights wj calculated by the RS to obtain the following weighted normalized decision matrix Z :
Z = ( z i j ) m n = [ z 11 z 1 n z m 1 z m n ] = ( w j × y i j ) m n
where, w j 0 , and i = 1 n w j = 1 .
Step 4. Calculation of the degree of closeness of each evaluation alternative
Firstly, compute the positive Z + and negative ideal solutions Z of Z :
Z + = [ max ( z i j ) ] = [ z 1 + , z 2 + , z 3 + , , z n + ]
Z = [ min ( z i j ) ] = [ z 1 , z 2 , z 3 , , z n ]
Further calculate the distance between each evaluation alternative and the positive and negative ideal solutions R i + and R i :
R i + = j = 1 n z i j z i j +
R i = j = 1 n z i j z i j
Finally, calculate the relative closeness coefficients σ i + of the evaluation programs to the positive ideal solution:
σ i + = R i / ( R i + + R i ) 0 σ i + 1
The closeness coefficients σ i + reflect the degree to which the clean energy technology decision-making program is close to the positive ideal solution, and the larger the value, the better. The relative closeness coefficient of the general evaluation alternatives is between 0 and 1. Clean energy technology options can be sorted according to the closeness coefficients.

3. Case Studies

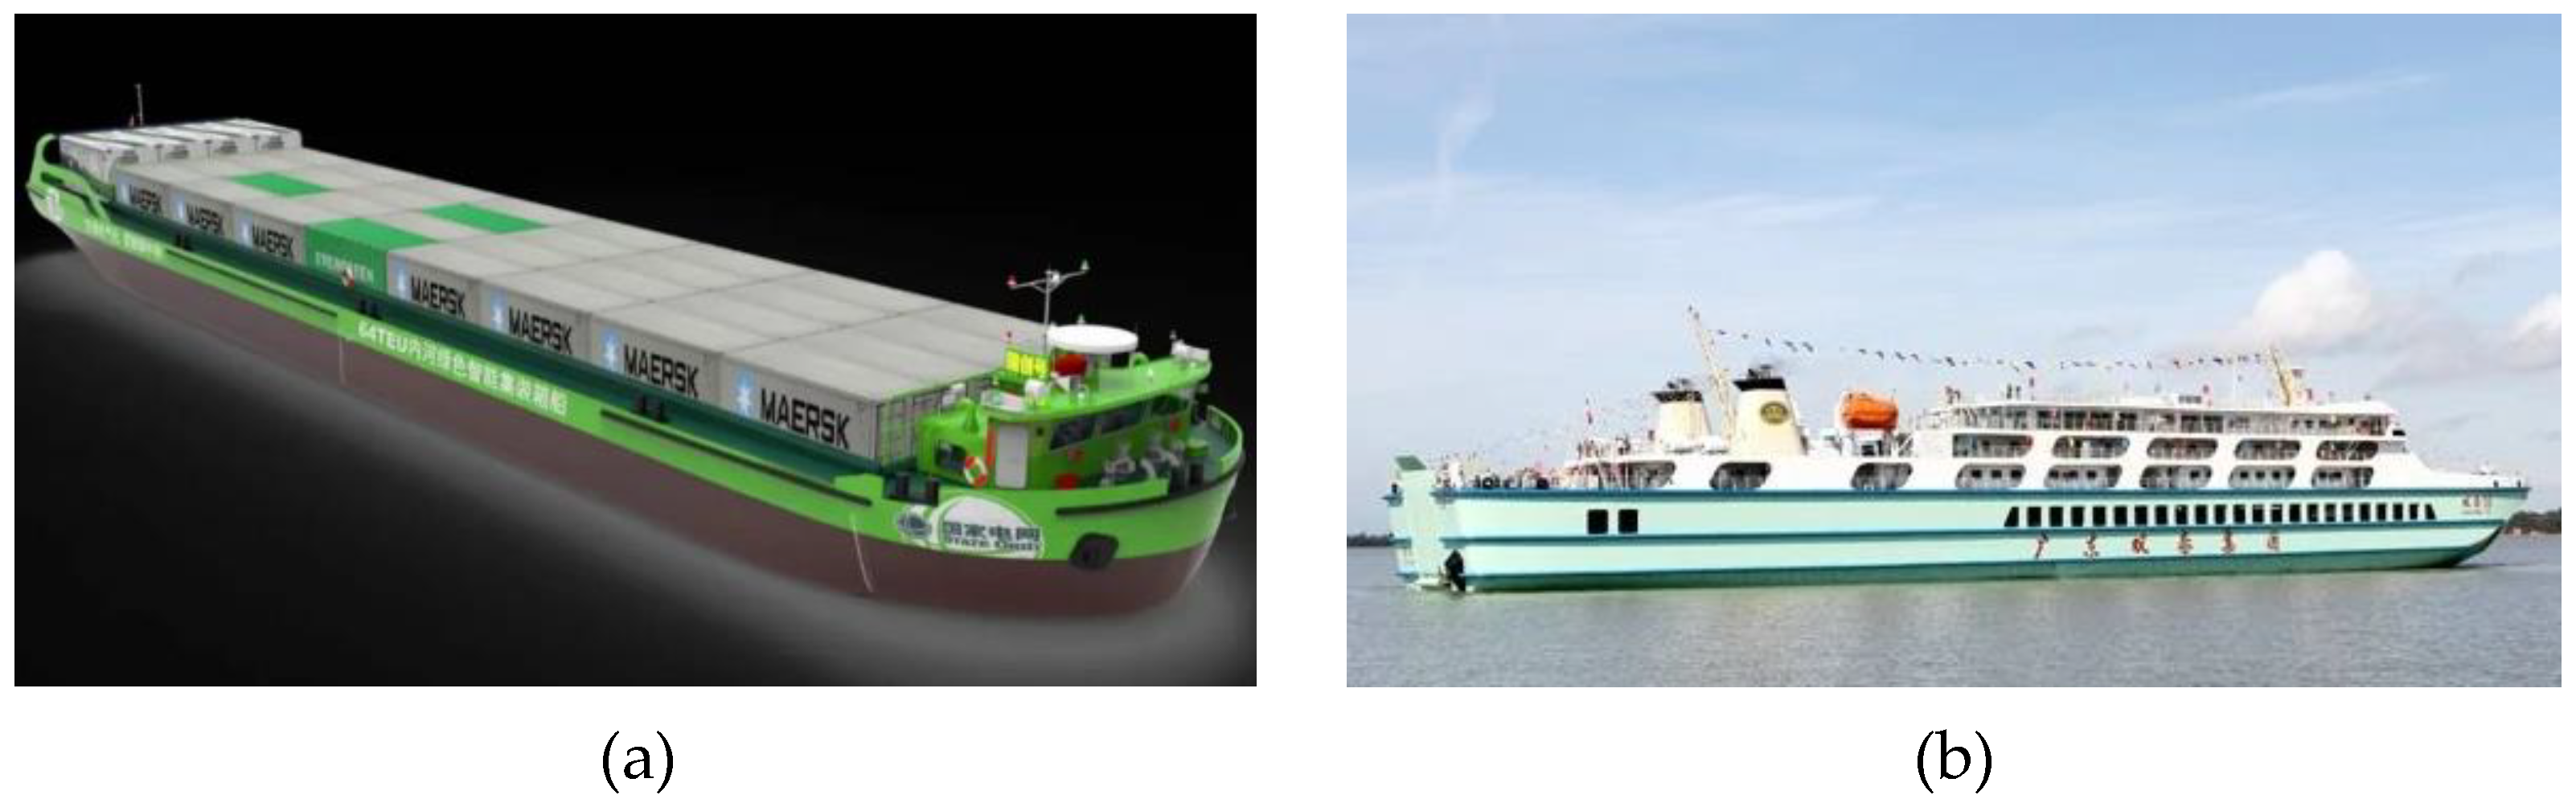
3.1. Data Collection

To carry out the study, two different types of ships, namely, small inland river ships and large coastal ro-ro passenger ships, respectively, were selected as case studies where the vessels navigating in the inland waterways are relatively small, with an average tonnage of about 800 t. The selected inland river ship is a 64 TEU container ship in the Yangtze River system with a route of 250 km at a time from Zhejiang to Shanghai, this type of vessel has been completed as an electric demonstration vessel in China (Figure 2a). The coastal ship is a Qiongzhou Strait ro-ro passenger ship (Figure 2b). At present, the Qiongzhou Strait ro-ro passenger ship route has formed a ferry route with Xuwen port as the main port on the north shore and a ferry route connecting Haikou New Seaport and Xiuying Port on the south shore, where the distance between Haikou New Seaport and Xuwen Port is only 12 nautical miles, and the average tonnage of ships is 10,275 t. With the opportunity to build a clean energy island in Hainan, the Qiongzhou Strait is also actively promoting the application of clean energy for ro-ro passenger vessels. Table 4 shows details the parameters of the two case study vessels.
The literature [25,26,27] uses the whole life cycle method to make an economic analysis of different ship types; this paper draws on the calculation process and results of the literature and compares it with the economic performance of each clean energy obtained in Table 3, the evaluation data of investment cost and energy cost can be obtained, which is shown in Table 5. Using the proposed evaluation method of green ship clean energy in this study, the application of different clean energy technologies on different ship types is evaluated.

3.2. Clean Energy Technology Choice Decision Results

3.2.1. Weight Calculation

Combined with RS theory, the target attributes of clean energy for ship type 1 can be obtained as follows:
U / i n d ( C ) = { 1 , 2 , 3 , 4 , 5 , 6 , 7 } U / i n d ( C 1 ) = { ( 1 , 2 , 3 ) , ( 4 , 7 ) , 5 , 6 } U / i n d ( C 2 ) = { ( 1 , 2 , 7 ) , 3 , 4 , ( 5 , 6 ) } U / i n d ( C 3 ) = { ( 1 , 2 , 3 ) , 4 , 5 , 6 , 7 } U / i n d ( C 4 ) = { ( 1 , 4 ) , 2 , ( 3 , 7 ) , 5 , 6 } U / i n d ( C 5 ) = { ( 1 , 2 ) , 3 , ( 4 , 6 ) , ( 5 , 7 ) } U / i n d ( C 6 ) = { ( 1 , 7 ) , ( 2 , 4 ) , 5 , 6 , 7 } U / i n d ( C 7 ) = { ( 1 , 2 , 3 ) , 4 , ( 5 , 6 , 7 ) } U / i n d ( C 8 ) = { ( 1 , 2 , 3 , 4 ) , ( 5 , 6 ) , 7 ) } U / i n d ( C 9 ) = { ( 1 , 2 , 3 , 5 , 6 , 7 ) , 4 } U / i n d ( C 10 ) = { ( 1 , 2 , 3 , 5 , 6 , 7 ) , 4 } U / i n d ( C 11 ) = { ( 1 , 6 ) , ( 2 , 5 ) , 3 , ( 4 , 7 ) } U / i n d ( C 12 ) = { ( 1 , 2 , 4 , 6 , 7 ) , 3 , 5 }
Combined with Formula (1), the relationship between the target attributes of clean energy of ship type 1 is further obtained as follows:
U / i n d ( C C 1 ) U / i n d ( C ) U / i n d ( C C 2 ) U / i n d ( C ) U / i n d ( C C 3 ) U / i n d ( C ) U / i n d ( C C 4 ) U / i n d ( C ) U / i n d ( C C 5 ) U / i n d ( C ) U / i n d ( C C 6 ) U / i n d ( C ) U / i n d ( C C 7 ) U / i n d ( C ) U / i n d ( C C 8 ) U / i n d ( C ) U / i n d ( C C 9 ) = U / i n d ( C ) U / i n d ( C C 10 ) = U / i n d ( C ) U / i n d ( C C 11 ) U / i n d ( C ) U / i n d ( C C 12 ) U / i n d ( C )
According to the calculation results of the relationship between the target attributes, we can see that the two indicators of the C9 “Effect on SOx reduction” and C10 “Effect on PM reduction” are the reduced attributes in the decision system. It indicates that these two indicators will not impact the outcome of the choice of clean energy at this stage. Through further analysis of the two indicators, we can see that the performance of each clean energy technology in terms of “Effect on SOx reduction” and “Effect on PM reduction” is relatively good from Table 5. The performance of each clean energy source on both indicators meets the requirements of long-term environmental regulation. Therefore, these two indicators are reasonable as reduced indicators.
Furthermore, according to Formula (2), the importance of the indicators is calculated by using the knowledge information in the RS as follows:
S G F C i = = i = 1 m | C i | | U C i | | U | | U 1 | = 3 × 4 + 2 × 5 + 6 + 6 7 × 6 = 0.81 ; and the importance of the other indicators can be obtained in the same way: S G F C 2 = 0.81 ; S G F C 3 = 0.86 ; S G F C 4 = 0.90 ; S G F C 5 = 0.86 ; S G F C 6 = 0.90 ; S G F C 7 = 0.71 ; S G F C 8 = 0.67 ; S G F C 11 = 0.86 ; S G F C 12 = 0.52 .
According to the formula w ( C i ) = S C C i / i = 1 n S C C i , the attribute values of each index are calculated as follows:
w ( C 1 ) = w ( C 2 ) = 0.81 / 7.90 = 0.102 ; w ( C 3 ) = w ( C 5 ) = w ( C 11 ) = 0.86 / 8.00 = 0.108 ; w ( C 4 ) = w ( C 6 ) = 0 . 114 ; w ( C 7 ) = 0 . 090 ; w ( C 8 ) = 0 . 084 ; w ( C 12 ) = 0 . 066 .
In the same way, the indicator weights of each clean energy alternative of ship type 2 can be obtained. The indicator weights’ results of each clean energy alternative of ship type 1 and ship type 2 are shown in Table 6.
It can be revealed in Table 7 that the indicators of C4 and C6 have the largest weights; that is, the technical maturity and technical application readiness indicators are the most critical indicators for the selection of the ship type 1 solutions. Secondly, volumetric energy density, energy availability, and probability of risk occurrence are also critical indicators determining if the clean energy technology option of ship type 1 is selected. Investment cost, energy cost, and effect on CO2 reduction ranked third in importance. When choosing a clean energy technology solution for ship type 2, C4 technical maturity is a rigid indicator that affects if the alternative is selected, followed by energy cost, volumetric energy density, energy availability, application readiness, and probability of risk occurrence.
From the ranking of the indicators of the two types of ships, we can see that although the values of the indicator weights are slightly different, the technical maturity, technical application readiness, energy cost, energy availability, and probability of risk occurrence are all key indicators for the two ship types to determine if the alternative solution is selected.

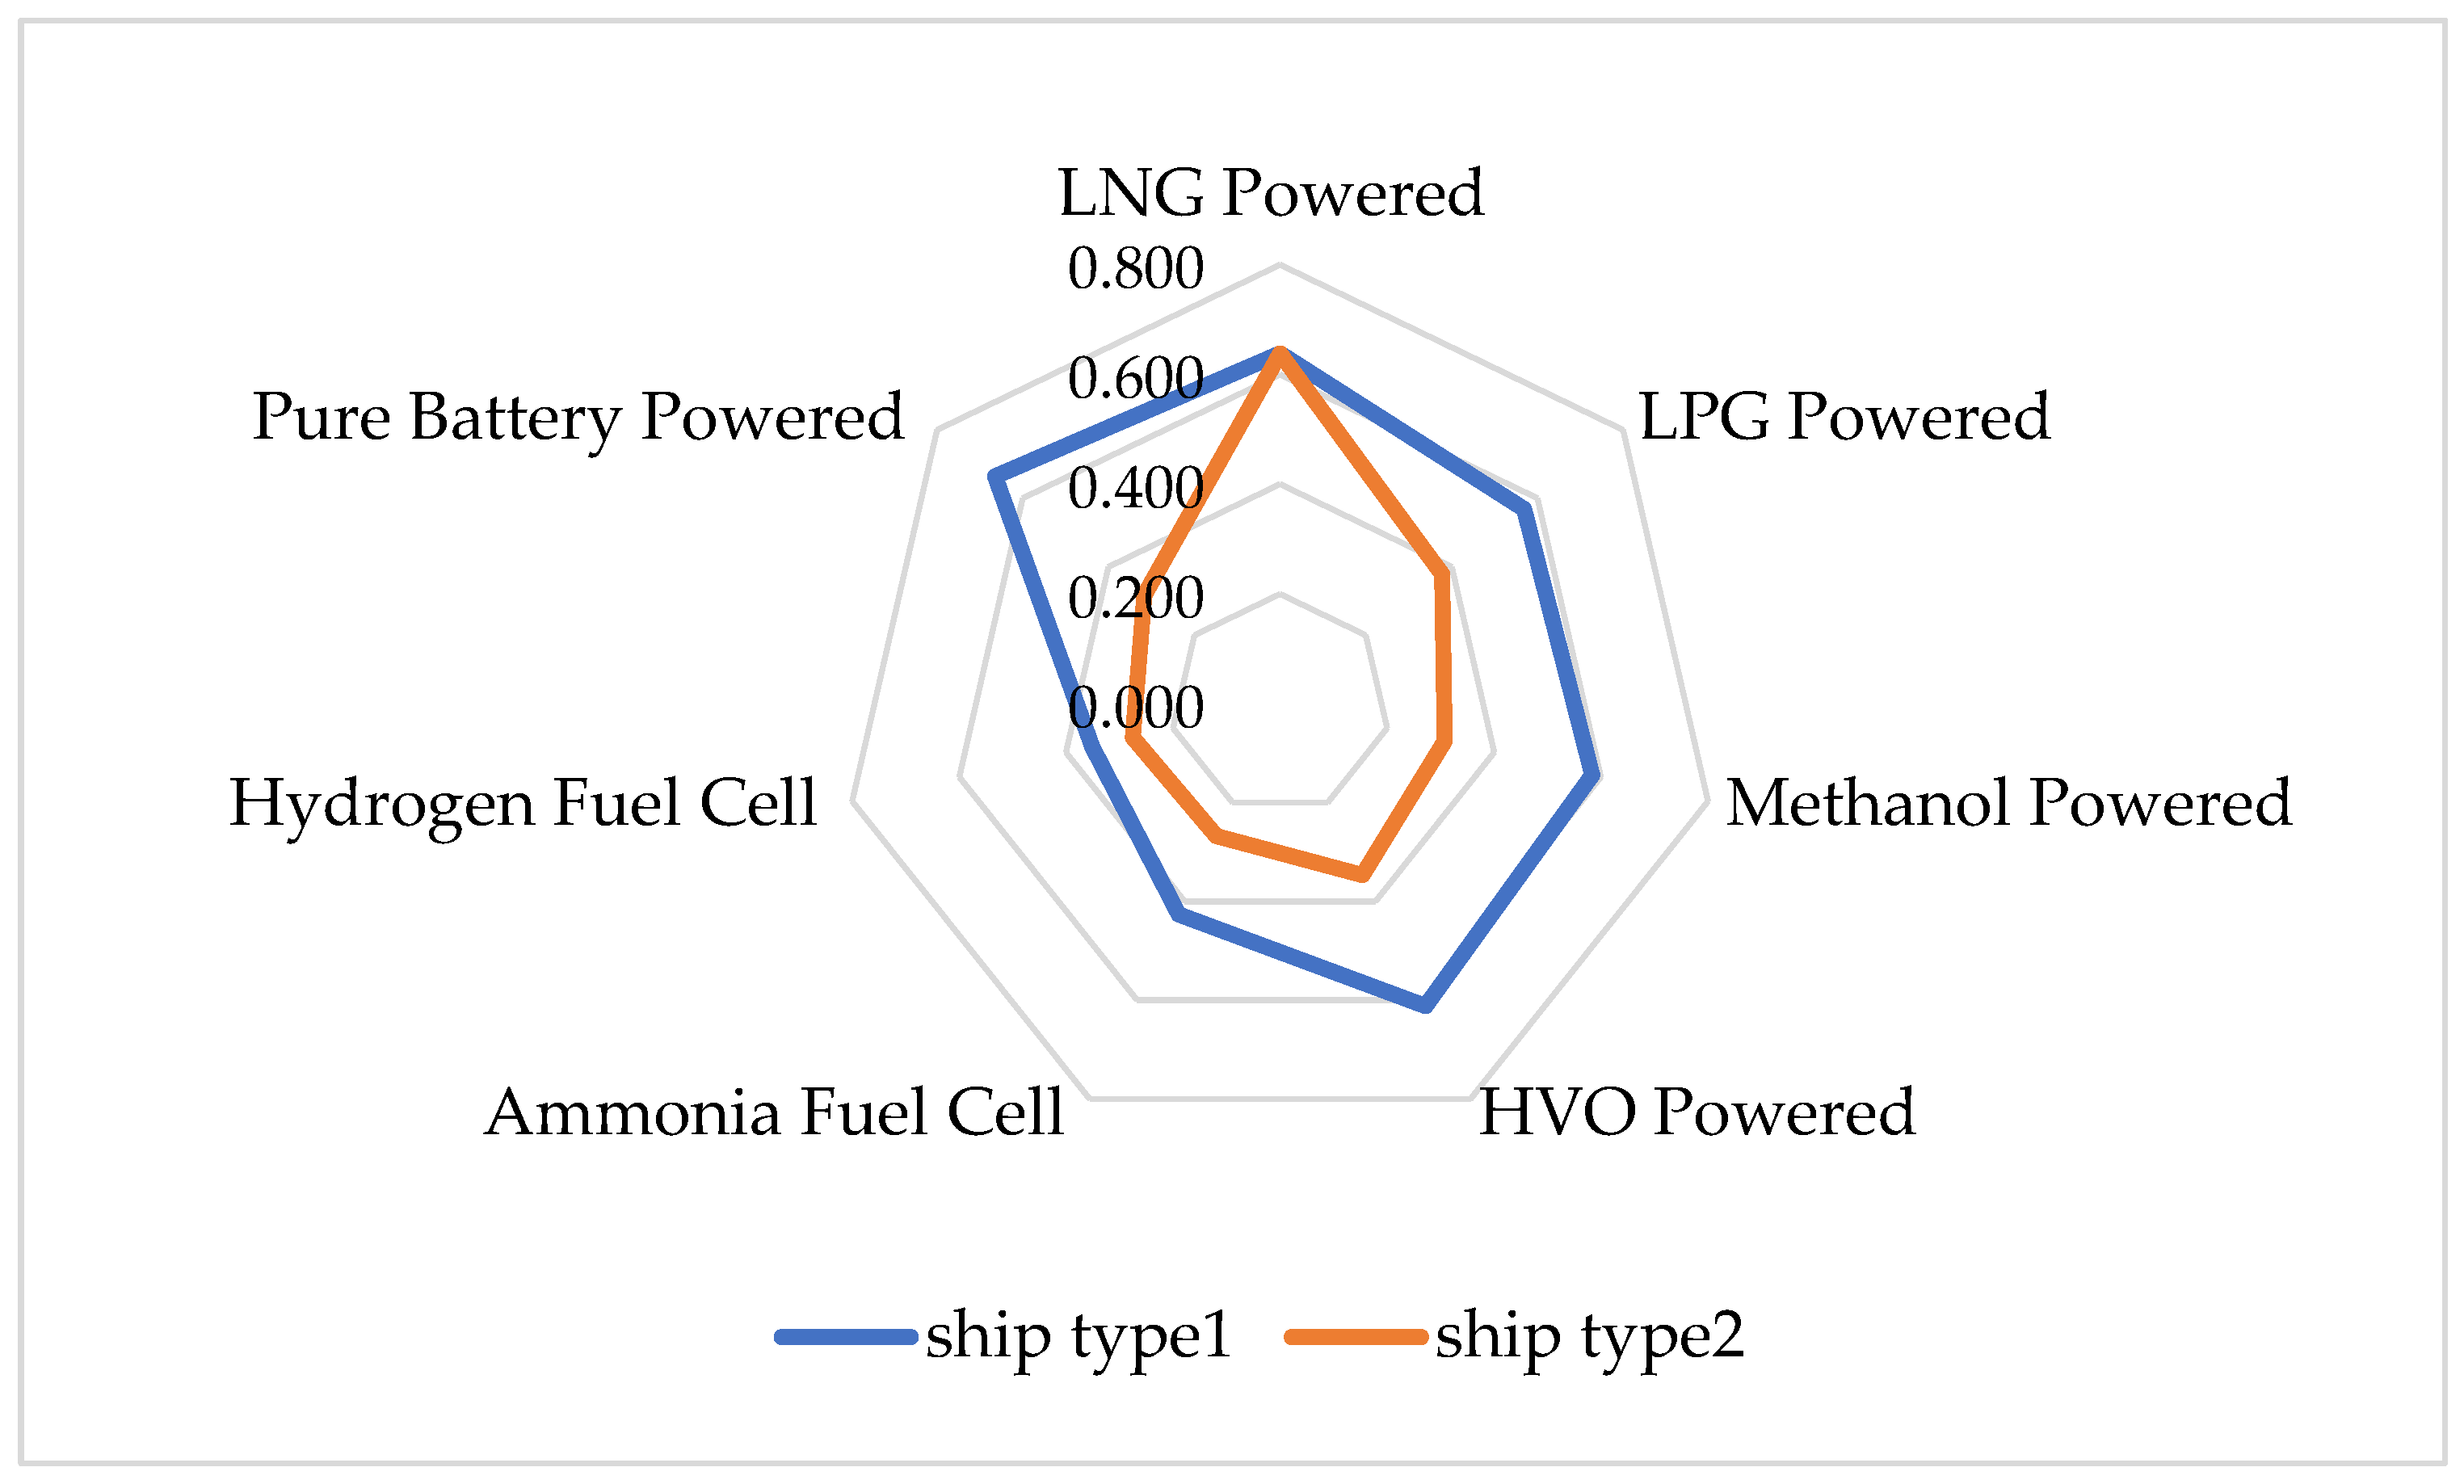
3.2.2. Ranking of Clean Energy Technology Alternatives

According to Formula (4), the initial evaluation matrix is constructed from the screening indicators in Table 7.
    C 1 C 2 C 3 C 4 C 5 C 6 C 7 C 8 C 11 C 12   X = [ 4 4 4 5 3 1 5 5 5 3 2 1 1 5 4 4 4 5 3 2 1 5 4 3 5 2 1 3 4 4 3 1 2 1 2 5 3 4 3 2 1 5 1 1 1 3 5 5 5 5 1 3 1 1 5 5 1 2 4 5 2 1 5 5 5 3 5 1 5 5 ]
According to Formula (1), the initial evaluation matrix X is constructed from the screening indicators and original data in Table 2. Since the indicators in this paper use quantitative scores, the attribute indicators in the evaluation matrix X are standardized according to Formula (6). Find the normalized decision matrix R:
    C 1 C 2 C 3 C 4 C 5 C 6 C 7 C 8 C 11 C 12   R = [ 0.75 0.75 0.75 1.00 0.50 0.00 1.00 1.00 1.00 0.50 0.25 0.00 0.00 1.00 0.75 0.75 0.75 1.00 0.50 0.25 0.00 1.00 0.75 0.50 1.00 0.25 0.00 0.50 0.75 0.75 0.50 0.00 0.25 0.00 0.25 1.00 0.50 0.75 0.50 0.25 0.00 1.00 0.00 0.00 0.00 0.50 1.00 1.00 1.00 1.00 0.00 0.50 0.00 1.00 1.00 1.00 0.00 0.25 0.75 1.00 0.25 0.00 1.00 1.00 1.00 0.50 1.00 0.00 1.00 1.00 ]
According to Formula (8), the standard matrix R is multiplied by the weight w processed by RS, and then the weighted standardized decision matrix Z is obtained:
    C 1 C 2 C 3 C 4 C 5 C 6 C 7 C 8 C 11 C 12   Z = [ 0.08 0.08 0.08 0.10 0.05 0.00 0.10 0.10 0.10 0.05 0.03 0.00 0.00 0.10 0.08 0.08 0.08 0.11 0.05 0.03 0.00 0.11 0.09 0.06 0.11 0.03 0.00 0.06 0.08 0.08 0.05 0.00 0.03 0.11 0.21 0.11 0.06 0.09 0.06 0.03 0.00 0.11 0.00 0.00 0.00 0.05 0.09 0.09 0.09 0.08 0.00 0.04 0.00 0.08 0.08 0.08 0.00 0.03 0.08 0.11 0.03 0.00 0.11 0.07 0.07 0.03 0.07 0.00 0.07 0.07 ]
According to Formulas (9) and (10), the positive and negative ideal solutions of each clean energy technology evaluation alternative of ship type 1 are calculated, respectively, as:
Z + = { 0.10 , 0.10 , 0.11 , 0.11 , 0.08 , 0.11 , 0.09 , 0.08 , 0.11 , 0.07 } Z = { 0.00 , 0.00 , 0.00 , 0.00 , 0.00 , 0.00 , 0.00 , 0.00 , 0.00 , 0.00 }
Calculate the distances of the positive ideal R i + and negative solutions R i corresponding to each alternative by Formula (11). According to Formula (12), the closeness coefficients σ i + of each alternative relative to Z + can be obtained, and the alternatives can be sorted according to the order of closeness coefficients. Similarly, the clean energy evaluation alternatives of ship type 2 can be sorted. The model evaluation results are shown in Table 7.
According to the relative progress of each clean energy technology alternative solution, the radar chart of the clean energy technology alternatives scores of ship type 1 and ship type 2 can be obtained, as shown in Figure 3.

4. Discussion

As seen in Table 7 and Figure 3, pure battery-powered and LNG-powered technologies are the best clean energy technology solutions suitable for inland short-distance small cargo ships and coastal ro-ro passenger ships at this stage, respectively. The result is consistent with the statistics of the maritime sector (As shown in Figure 4, the data is as of December 2021). According to the Clarksons 2021 report, LNG-powered vessels account for nearly 30% of handheld order tonnage. By ship type, the most used LNG-powered technology is for tankers, followed by ferries, container ships, and offshore vessels. Although LNG fuel technology performs better in various index attributes for green vessels, and it is a clean energy technology that is currently used more in the field of green ships, it is clear from the performance of various indexes of LNG fuel technology that the technology is deficient in terms of emission reduction effect compared with other clean energy sources. With the strict implementation of decarbonization regulations, the LNG fuel technology will not have advantages.
The performance of emission reduction effect of pure battery power technology is relatively good, but its low volume energy density and short-range limit the application in large long-distance vessels, and it is currently more suitable for small vessels in close proximity such as small car/passenger ferries, offshore supply ships, and other active boats. Considering the different advantages of different clean energy technologies and so on. The development of a hybrid vessel by combining different fuels and power is a hotspot in green ship development at present.
In addition, from the performance of each clean energy technology attribute, we can see that in the trend of decarbonization of the shipping industry, with the continuous development and progress of clean energy technology, hydrogen fuel technology, and ammonia fuel technology, which have advantages in emission reduction effect, will be the key clean energy technologies in the future. From the results of the model runs, it is clear that this method can help shipowners to choose the most suitable clean energy technology alternative in an uncertain environment.

5. Conclusions

In recent years, the process of environmental protection regulation in the shipping market has continued to accelerate, and the road to low-carbon and zero-carbon transformation is imminent. Ocean-going ships, coastal ships, and inland river ships are quite different in terms of voyage distance, ship size, and ship layout. Therefore, when choosing clean energy technology, the specific ship types in ocean, coastal and inland waters should be comprehensively considered from the perspectives of technical feasibility, energy availability, and economic, etc. and form a differentiated clean energy technology plan based on the size and range of the vessels. Through theoretical analysis and empirical research, the following main conclusions are drawn:
(1)
Under uncertain conditions, this paper constructed a clean energy technology selection model and established a clean energy technology evaluation index system for green ships, containing 12 indicators in four dimensions, including economic, technical, environment, and safety. The key indicators that affect the selection of clean energy technology solutions are extracted from the two types of ro-ro passenger ships and short-distance small ships in inland rivers. The assessment results show that technical maturity, volumetric energy density, technical application readiness, energy cost, investment cost, effect on CO2 reduction, and probability of risk occurrence are the key factors affecting the choice of clean energy technology options; the results are in line with reality. The paper provides a measure for the selection of clean energy technology solutions for different ship types in different waters.
(2)
Seven clean energy technology alternatives such as LNG power, LPG power, methanol power, pure battery power, hydrogen fuel cell, ammonia fuel cell, and biofuel power are considered for different ship types. It is found that LNG power technology is the best solution for the decarbonization transition of large coastal ro-ro passenger ships at this stage, and pure battery power technology is the best clean energy technology for small short-distance inland river ships. The results obtained are in line with reality.
(3)
The RS theory and TOPSIS method are combined to effectively determine the selection alternatives of clean energy technologies for green ships. This method converts the qualitative description of the applicability of existing clean energy technologies into a quantitative expression, which enhances the objectivity and scientificity of the evaluation results. The proposed method provides new insights in the field of clean energy technologies selection problems. Therefore, the proposed method is feasible and can be used to select the best clean energy technology option from multiple alternatives under uncertainty.
In addition, this paper has the following shortcomings in the research:
(1)
The application of clean energy technology for green ships is an emerging research field. Based on the limitation of data availability, the quantification of indicators in this paper has certain restrictions, and the current data comes from secondary information. Subsequently, with the expansion of the application scenario of green ship clean energy technology and the enrichment of relevant indicator data, it is intended to extract the relevant indicators and data of clean energy technology of different ship types in different waters, and apply them to the model to make the decision-making results more accurate.
(2)
Furthermore, the research methods proposed in this paper will be extended and applied to more ship types and different waters. Meanwhile, other multi-criteria selection decision-making methods will be explored and compared with the model results of existing research.

Author Contributions

Conceptualization, H.X. and Q.L.; methodology, H.X., L.W. and L.Y.; software, H.X. and L.Y.; validation, H.X., L.W. and L.Y.; formal analysis, H.X.; resources, H.X.; data curation, H.X.; writing—original draft preparation, H.X.; writing—review and editing, H.X. and L.W.; supervision, Q.L.; project administration, Q.L. and L.W.; funding acquisition, Q.L. and H.X. All authors have read and agreed to the published version of the manuscript.

Funding

This research was supported by the Hainan Special Ph.D. Scientific Research Foundation of Sanya Yazhou Bay Science and Technology City (Grant number: HSPHDSRF-2022-03-019), and the Green Intelligent Inland Ship Innovation Programme (Grant number: 2019 (358)), and Consulting Research Project of the Wuhan Branch of the Hubei Research Institute of China Engineering Science and Technology Development Strategy “Green and Intelligent Shipping Development Strategy Research in Hubei Province” (Grant number: HB2021-B09).

Institutional Review Board Statement

Not applicable.

Informed Consent Statement

Not applicable.

Data Availability Statement

Not applicable.

Acknowledgments

The authors wish to express their special appreciation to all participants joining this study. We also thank the anonymous reviewers for their constructive comments on the manuscript of this paper.

Conflicts of Interest

The authors declare no conflict of interest.

References

  1. Andreas, B.; Klaus, M. Standing up for the Paris Agreement: Do global climate targets influence individuals’ greenhouse gas emissions? Environ. Sci. Pol. 2019, 99, 72–79. [Google Scholar]
  2. Mersin, K. Review of Total Emission of Transit Ships in the Dardanelle. Therm. Sci. 2020, 24 (Suppl. S1), S391–S398. [Google Scholar] [CrossRef]
  3. IMO. Fourth IMO GHG Study 2020—Final Report; International Maritime Organization: London, UK, 2020. [Google Scholar]
  4. Paulauskas, V.; Filina-Dawidowicz, L.; Paulauskas, D. The Method to Decrease Emissions from Ships in Port Areas. Sustainability 2020, 12, 4374. [Google Scholar] [CrossRef]
  5. Yuan, Y.; Wang, J.; Yan, X.; Shen, B.; Long, T. A review of multi-energy hybrid power system for ships. Renew. Sustain. Energy Rev. 2020, 132, 110081. [Google Scholar] [CrossRef]
  6. DNV GL (2020a). Maritime Forecast to 2050—Energy Transition Outlook 2020, DNV GL. Available online: https://eto.dnv.com/2020/Maritime/ (accessed on 16 April 2021).
  7. Akerman, P.; Cazzola, P.; Christiansen, E.S.; Van Heusden, R.; Kolomanska-van Iperen, J.; Christensen, J.; Crone, K.; Dawe, K.; De Smedt, G.; Keynes, A.; et al. Reaching Zero with Renewables; International Renewable Energy Agency: Abu Dhabi, United Arab Emirates, 2020. [Google Scholar]
  8. Li, Y. The future direction of green ships. China Ship Surv. 2013, 12, 70–74. [Google Scholar]
  9. Jeon, H.; Park, K.; Kim, J. Comparison and Verification of Reliability Assessment Techniques for Fuel Cell-Based Hybrid Power System for Ships. J. Mar. Sci. Eng. 2020, 8, 74. [Google Scholar] [CrossRef] [Green Version]
  10. Yan, X.P. Progress Review of New Energy Application in Ship. Ship Ocean. Eng. 2010, 39, 111–115, 120. [Google Scholar]
  11. Qin, Q.; Wang, Y.-z. Global new energy (clean) ship and related intelligent technology development. Ship Boat 2018, 29 (Suppl. S1), 29–41. [Google Scholar]
  12. Viktorelius, M. Adoption and use of energy-monitoring technology in ship officers’ communities of practice. Cogn. Technol. Work 2019, 22, 459–471. [Google Scholar] [CrossRef] [Green Version]
  13. DNV GL, 2019a. Alternative Fuels Narrative. Available online: https://globalmaritimehub.com/wp-content/uploads/2019/11/SEALNG_Alternative_fuels_narrative_V22.pdf (accessed on 7 April 2021).
  14. Xing, H.; Stuart, C.; Spence, S.; Chen, H. Alternative fuel options for low carbon maritime transportation: Pathways to 2050. J. Clean. Prod. 2021, 297, 126651. [Google Scholar] [CrossRef]
  15. Ren, J.; Lützen, M. Fuzzy multi-criteria decision-making method for technology selection for emissions reduction from shipping under uncertainties. Transp. Res. Part D Transp. Environ. 2015, 40, 43–60. [Google Scholar] [CrossRef]
  16. Ren, J.Z.; Lutzen, M. Selection of sustainable alternative energy source for shipping: Multi criteria decision-making under incomplete information. Renew. Sustain. Energy Rev. 2017, 74, 1003–1019. [Google Scholar] [CrossRef]
  17. Bui, K.Q.; Olcer, A.I.; Kitada, M.; Ballini, F. Selecting technological alternatives for regulatory compliance towards emissions reduction from shipping: An integrated fuzzy multi-criteria decision-making approach under vague environment. Proc. Inst. Mech. Eng. Part M-J. Eng. Marit. Environ. 2021, 235, 272–287. [Google Scholar] [CrossRef]
  18. Kim, A.R.; Seo, Y.J. The reduction of SOx emissions in the shipping industry: The case of Korean companies. Mar. Policy 2019, 100, 98–106. [Google Scholar] [CrossRef]
  19. Seddiek, I.S.; Elgohary, M.M. Eco-friendly selection of ship emissions reduction strategies with emphasis on SOx and NOx emissions. Int. J. Nav. Arch. Ocean Eng. 2014, 6, 737–748. [Google Scholar] [CrossRef] [Green Version]
  20. Yang, Z.; Zhang, D.; Caglayan, O.; Jenkinson, I.; Bonsall, S.; Wang, J.; Huang, M.; Yan, X. Selection of techniques for reducing shipping NOx and SOx emissions. Transp. Res. Part D Transp. Environ. 2012, 17, 478–486. [Google Scholar] [CrossRef]
  21. Haehl, C.; Spinler, S. Technology Choice under Emission Regulation Uncertainty in International Container Shipping. Eur. J. Oper. Res. 2019, 284, 383–396. [Google Scholar] [CrossRef]
  22. Sahin, B.; Yip, T.L. Shipping technology selection for dynamic capability based on improved Gaussian fuzzy AHP model. Ocean. Eng. 2017, 136, 233–242. [Google Scholar] [CrossRef]
  23. Inal, O.B.; Deniz, C. Assessment of fuel cell types for ships: Based on multi-criteria decision analysis. J. Clean. Prod. 2020, 265, 121734. [Google Scholar] [CrossRef]
  24. Gilbert, P.; Walsh, C.; Traut, M.; Kesieme, U.; Pazouki, K.; Murphy, A. Assessment of full life-cycle air emissions of alternative shipping fuels. J. Clean. Prod. 2018, 172, 855–866. [Google Scholar] [CrossRef]
  25. Perčić, M.; Vladimir, N.; Fan, A. Life-cycle cost assessment of alternative marine fuels to reduce the carbon footprint in short-sea shipping: A case study of Croatia. Appl. Energy 2020, 279, 115848. [Google Scholar] [CrossRef]
  26. Perčić, M.; Vladimir, N.; Fan, A. Techno-economic assessment of alternative marine fuels for inland shipping in Croatia. Renew. Sustain. Energy Rev. 2021, 148, 111363. [Google Scholar] [CrossRef]
  27. Fan, A.; Wang, J.; He, Y.; Perčić, M.; Vladimir, N.; Yang, L. Decarbonising inland ship power system: Alternative solution and assessment method. Energy 2021, 226, 120266. [Google Scholar] [CrossRef]
  28. Riberio, F.; Ferreira, P.; Araújo, M. Evaluating future scenarios for the power generation sector using a Multi-Criteria Decisions Analysis (MCDA) tool: The Portuguese case. Energy 2013, 52, 126–136. [Google Scholar] [CrossRef] [Green Version]
  29. Acciaro, M.; Hoffmann, P.N.; Eide, M.S. The energy efficiency gap in maritime transport. J. Shipp. Ocean. Eng. 2013, 3, 1. [Google Scholar]
  30. Rojon, I.; Dieperink, C. Blowin’in the wind? Drivers and barriers for the uptake of wind propulsion in international shipping. Energy Policy 2014, 67, 394–402. [Google Scholar] [CrossRef]
  31. IRENA. Renewablenenergy Options for Shipping—A Technology Brief; The International Renewable Energy Agency: Abu Dhabi, United Arab Emirates, 2015. [Google Scholar]
  32. Andersson, K.; Brynolf, S.; Hansson, J.; Grahn, M. Criteria and Decision Support for a Sustainable Choice of Alternative Marine Fuels. Sustainability 2020, 12, 3623. [Google Scholar] [CrossRef]
  33. Ampah, J.D.; Yusuf, A.A.; Afrane, S.; Jin, C.; Liu, H. Reviewing two decades of cleaner alternative marine fuels: Towards IMO’s decarbonization of the maritime transport sector. J. Clean. Prod. 2021, 320, 128871. [Google Scholar] [CrossRef]
  34. ABS. Decarbonization of the Inland Water Sector in the United States. American Bureau of Shipping. September 2021. Available online: https://absinfo.eagle.org/acton/media/16130/decarbonization-of-the-inland-waterway-sector-in-the-united-states (accessed on 12 January 2022).
  35. ABS. Setting the Course to Low Carbon Shipping. American Bureau of Shipping. September 2021. Available online: https://absinfo.eagle.org/acton/media/16130/setting-the-course-to-low-carbon-shipping-outlook-i (accessed on 23 December 2021).
  36. Pawlak, Z. Rough set. Int. J. Inf. Comput. Sci. 1982, 11, 341–356. [Google Scholar] [CrossRef]
  37. Pattaraintakorn, P.; Cercone, N. Integrating rough set theory and medical applications. Appl. Math. Lett. 2008, 21, 400–403. [Google Scholar] [CrossRef] [Green Version]
  38. Hong, T.; Tseng, L.; Wang, S. Learning rules from incomplete training examples by rough sets. Expert Syst. Appl. 2002, 22, 285–293. [Google Scholar] [CrossRef]
  39. Wang, H.; Wang, S. Discovering patterns of missing data in survey databases: An application of rough sets. Expert Syst. Appl. 2009, 36, 6256–6260. [Google Scholar] [CrossRef]
  40. Lingras, P.J.; Yao, Y. Data mining using extensions of the rough set model. J. Am. Soc. Inf. Sci. 1998, 49, 415–422. [Google Scholar] [CrossRef]
  41. Pawlak, Z. Rough Sets: Theoretical Aspects of Reasoning about Data; Springer Science & Business Media: Berlin, Germany, 1991. [Google Scholar]
  42. Tzeng, G.H.; Huang, J.J. Multiple Attribute Decision Making: Methods and Applications; CRC Press: Boca Raton, FL, USA, 2011. [Google Scholar]
Figure 1. The selection process of clean energy technology for green ships.
Jmse 10 00579 g001
Figure 2. Selected ships. (a) 64TEU container ship in the Yangtze River; (b) Qiongzhou Strait ro-ro passenger ship.
Jmse 10 00579 g002
Figure 3. Radar chart of clean energy technology solutions for different ship types.
Jmse 10 00579 g003
Figure 4. Green ships in hand and in operation. Data source: Based on data published on Clarkson’s website and the DNV GL website.
Jmse 10 00579 g004
Table 1. Classification of clean energy technologies.
TechnologiesTechnology ClassificationTechnology Name
Clean Energy TechnologiesAlternative Fuels TechnologiesLow-carbon fuel technologies: LNG fuel, LPG fuel, dual-fuel, methanol, HVO, etc.
Zero-carbon fuel technologies: hydrogen fuel, ammonia fuel, biofuel (bio-LNG, bio-methanol), etc.
Electric Power TechnologiesPure battery power technology, fuel cell technology, supercapacitor, hybrid power
Renewable EnergySolar energy technology, wind-assisted propulsion technology, bioenergy technology, hydro energy technology, wave energy technology
Nuclear Energy TechnologyNuclear propulsion technology
Table 2. Green ship clean energy technology selection index.
Guideline LevelIndicator LevelDefinition
EconomicInvestment Cost (C1) [15,16] The cost of retrofitting and new construction of clean energy propulsion systems and supporting infrastructure increases or decreases compared to fuel oil ships
Energy Cost (C2) [15,16]The degree of increase or decrease in the fuel cost of clean energy ships compared to fuel oil ships
TechnicalVolumetric Energy density (C3) [13,14]The energy contained in a unit volume, the higher the value, the smaller the required fuel tank volume, and the better the ship’s endurance
Technical Maturity (C4) [13,14]The maturity level of energy application technologies and power systems
Energy Availability (C5) [13,14]The shipping industry belongs to the downstream end-use of the energy industry chain and depends on the supply capacity of the upstream energy industry
Technical Application Readiness (C6) [13,14]Specific requirements of the technology application, such as the difficulty of the technology in terms of vessel type, supporting infrastructure layout, and considering the maturity and availability of the technology and energy
EnvironmentEffect on CO2 Reduction (C7) [15,16]Reduction of CO2 emissions after fuel oil substitution
Effect on NOx Reduction (C8) [15,16]Reduction of NOx emissions after fuel oil substitution
Effect on SOx Reduction (C9) [15,16]Reduction of SOx emissions after fuel oil substitution
Effect on PM Reduction (C10) [15,16]Reduction of PM missions after fuel oil substitution
SafetyProbability of Risk Occurrence (C11) [14]In the process of energy filling, storage, and supply, the probability of energy leakage depends on the characteristics of fuel, such as auto-ignition point and flashpoint. In this paper, the flammability and explosiveness of fuel represent the probability of risk occurrence.
The severity of Consequences (C12) [14]In the event of energy leakage, the harm to the environment and the human body is characterized by the fuel toxicity in this paper.
Table 3. Performance of target attributes of different clean energy technologies.
CriteriaLNG Powered (T1)LPG Powered (T2)Methanol Powered (T3)HVO Powered (T4)Ammonia Fuel Cell (T5)Hydrogen Fuel Cell (T6)Pure Battery Powered (T7)
Investment Cost (C1)444531V a
Energy Cost (C2)553211V a
Volumetric Energy Density (C3)4445321
Technical Maturity (C4)5435213
Energy Availability (C5)4431212
Technical Application Readiness (C6)534321V
Effect on CO2 Reduction (C7)1113555
Effect on NOx Reduction (C8)5131555
Effect on SOx Reduction (C9)5554555
Effect on PM Reduction (C10)5553555
Probability of Risk Occurrence (C11)1245215
Severity of Consequences (C12)5535155
Note: 1–5 indicates the status level, 1 is very poor and 5 is excellent. V: Varies, not applicable for deep-sea shipping. a Needs to be evaluated case by case, with large regional variations.
Table 4. Two case study ship parameters.
Ship Type ParametersLength
(m)
Breadth (m)Depth (m)Tonnage
(t)
Design Speed (km/h)Distance (km)
Inland River Ship (type 1)71.412.63.3116514.8250
Coastal Ship (type 2)119.8820.36896513.833
Table 5. Evaluation data of different clean energy technologies for two types of ships.
CriteriaT1T2T3T4T5T6T7
Investment Cost (C1)4445315 (3) *
Energy Cost (C2)5532115 (3)
Volume Energy Density (C3)4445321
Technical Maturity (C4)5435213
Energy Availability (C5)4431212
Technical Application Readiness (C6)5343215 (3)
Effect on CO2 Reduction (C7)1113555
Effect on NOx Reduction (C8)5131555
Effect on SOx Reduction (C9)5554555
Effect on PM Reduction (C10)5553555
Probability of Risk Occurrence (C11)1245215
Severity of Consequences (C12)5535155
Note: * The data in () represents the index performance of coastal ro-ro passenger ships.
Table 6. Importance and weight of each target attribute of ship type 1 and ship type 2.
Ship TypeAttributesC1C2C3C4C5C6C7C8C11C12
Type 1Importance0.810.810.860.900.860.900.710.670.860.52
Weights0.1020.1020.1080.1140.1080.1140.0900.0840.1080.066
Type 2Importance0.810.860.860.900.860.860.710.670.860.52
Weights0.1020.1080.1080.1140.1080.1080.0900.0840.1080.066
Table 7. Analysis of model evaluation results.
Ship TypeShip Type 1 (Small Inland River
Short-Distance Cargo Ship)
Ship Type 2 (Large Coastal Ro-Ro
Passenger Ship)
Programs R i σ i + sort R i + R i σ i + sort
LNG Powered T10.150.260.63820.150.260.6381
LPG Powered T20.160.210.56950.350.220.3782
Methanol Powered T30.140.200.58440.440.190.3085
HVO Powered T40.150.240.61230.450.240.3473
Ammonia Fuel Cell T50.210.150.42760.420.150.2677
Hydrogen Fuel Cell T60.260.140.35170.380.140.2756
Pure Battery Powered T70.130.260.66410.450.210.3174
Publisher’s Note: MDPI stays neutral with regard to jurisdictional claims in published maps and institutional affiliations.

