Article

Full-Field Deformation-Aided Compressive Failure Evaluation of Seawater Concrete Using Digital Image Correlation Technique

1
College of Ocean Science and Engineering, Shanghai Maritime University, Shanghai 201306, China
2
School of Mechanical Engineering, Shanghai Jiao Tong University, Shanghai 200240, China
*
Author to whom correspondence should be addressed.
J. Mar. Sci. Eng. 2022, 10(4), 518; https://doi.org/10.3390/jmse10040518
Submission received: 9 March 2022 / Revised: 4 April 2022 / Accepted: 7 April 2022 / Published: 8 April 2022
(This article belongs to the Section Coastal Engineering)

Abstract

:
Seawater-based concrete has been increasingly employed in offshore construction engineering, especially where the construction materials and freshwater are inconvenient to access. In this paper, a full-field compressive deformation evaluation scheme was constructed by introducing the digital image correlation (DIC) technique in the uniaxial compression test for four kinds of seawater concrete fabricated by ordinary Portland cement (OPC) and calcium aluminate cement (CAC) when cured in freshwater and seawater conditions for 28 days, respectively. Digital speckle image sequences of the decorated concrete samples were simultaneously recorded during the compression test process, and thus, displacement fields of concrete cubes were mathematically obtained by way of correlation registration algorithms. On this basis, the normal strain, shear strain, and volumetric strain fields all over the front surface of the concrete samples were calculated with the aid of strain window method. In addition, compressive load-induced cracks were quantitatively tracked from the volumetric strain data. Subsequently, the full-field deformation-aided volumetric strain histogram percentage was computed to comparatively evaluate the failure behavior of four groups of seawater concretes. It was revealed that both the OPC and CAC-based seawater concretes gained enhanced strength under the seawater curing condition, but the OPC-S exhibited larger and more concentrated local deformation compared with OPC-F whereas the deformation of CAC-S was adversely widely spread in comparison with CAC-F.

1. Introduction

Due to the scarcity of freshwater and the high cost of transporting construction materials, seawater concretes are increasingly being used to replace traditional freshwater concretes in offshore infrastructure, port and wharf construction [1,2]. Besides, the use of seawater-based concrete has been considered as an effective approach to sustainable development in construction engineering where the construction materials and freshwater are inconvenient to access [1,2,3]. In this regard, the mechanical properties of newly developed seawater-based concrete in specific service conditions have become a source of concern due to the fact that some inorganic ions in seawater cause remarkable changes to the microstructure of concrete [3,4,5,6]. It has been reported that the introduction of seawater could lead to gains in early strength and shortening of solidification time of seawater-mixed concrete, which is probably caused by the accelerated hydration process induced by the presence of chloride ions in seawater [7,8]. Simultaneously, some dissolved salts such as chloride, sulfate and magnesium contained in the seawater-based concrete would probably result in physical changes and chemical attacks on the microstructure of the concrete, and the mechanical response of the matrix would be significantly changed [7,9]. Combining the mechanical test and chemical analysis, it was also concluded that the high presence of salt could contribute to the cracking and eventual spalling of concrete elements in marine environment [10,11,12]. Therefore, it was necessary to focus on the mechanical performance as well as the resultant local cracking and sometimes failure of concrete in practical service conditions.
Generally, compressive strength was taken as one of the critical parameters to represent the service performance of seawater concrete [2,13,14,15]. Due to the widespread application of OPC (ordinary Portland cement)-based concrete, investigations on the mechanical performance of OPC-based seawater concrete have been developed in recent years [16,17]. However, it was found that using seawater might inconsistently produce nearly no impact or cause serious adverse effects on the compressive strength of the concrete [16]. In contrast, CAC (calcium aluminate cement)-based seawater concrete offered good resistance to the sulfate attack [16,18]. It should be pointed out that the experimental studies mentioned above were implemented by compression testing machine according to some test standards [19]. In fact, concrete is essentially a kind of heterogeneous material, which means that mechanical responses in different local regions of the concrete to external load are complicated and various. Hence, it is not sufficient to characterize the deformation property by a single value of compressive loading or overall displacement alone, especially in the process of crack propagation. In this situation, mechanical responses to environmental loading and the long-term strength development of seawater concrete were essentially inconclusive in the long service period due to the introduction of seawater in the mixing and curing process. Some contact measurement devices such as linear variable displacement transducers (LVDTs) or strain gauges have previously been employed to give local deformation data of the concrete, by which the displacement or strain data of some selected locations on the tested specimen could be monitored [2,7,8,20,21]. However, it should be noted that it was not easy—or even impossible—to arrange detection devices in the exact locations where larger deformation or cracks appeared [18,22,23]. Increasingly, it has been realized that the full-field deformation characterization of the newly developed concrete is critical to its mechanical behavior evaluation. In recent decades, the noncontact digital image correlation (DIC) technique has been gradually utilized to obtain full-field deformation data of the concrete. It was reported that the full-field deformation of the concrete surface was quantitatively determined by mathematically matching the corresponding digital speckle images of the cube concrete before and after loading based on some correlation criterion [23,24,25,26]. Because of the unique advantages of noncontact full-field measurement, such as accurate results and easy operation, the DIC technique was introduced to calculate displacement or strain fields of concrete [27,28,29]. It has been demonstrated that the DIC technique was capable of constructing deformation fields all over the concrete surface [25,30,31]. Based on the full-field measurement results of displacement and strain by DIC, cracks on the concrete were easily found, and crack propagation could be accordingly evaluated, through which, the failure process could be investigated [28,32,33,34].
In this study, the DIC technique was adopted to evaluate the compressive deformation behavior of four groups of seawater concrete samples prepared with ordinary Portland cement (OPC) and calcium aluminate cement (CAC) cured in freshwater and seawater conditions, respectively. The noncontact full-field deformation measurement scheme for seawater concretes was constructed with the aid of the uniaxial compression experiment and DIC-based optical image capturing system. The correlation registration algorithm was established to calculate the time-series displacement data of the seawater concretes during the compression process. On this basis, normal strain, shear strain and volumetric strain fields were obtained by way of the strain window method. Moreover, cracks propagation and volumetric strain histogram percentage were analyzed to comparatively evaluate the failure behavior of four groups of seawater concretes.

2. Materials and Methods

2.1. Materials and Component Design of the Seawater Concrete

The commonly used OPC-based concretes in construction engineering were prepared as a typical group of tested specimens to evaluate the uniaxial compressive deformation and crack propagation characteristics of seawater concretes in this experiment. As a comparison, the CAC-based concretes were simultaneously prepared due to their better seawater corrosion resistance ability. The local and full-field deformation, as well as crack propagation performance of these samples, would be quantitatively analyzed. Considering the inherent differences in the mechanical properties of the two kinds of cement adopted in construction engineering, ordinary Portland cement (OPC) and calcium aluminate cement (CAC) were utilized to prepare the tested samples with the same mix proportion in the framework of design code of concrete structures [35]. Specimens employed in this experiment consisted of cement, mixing water, coarse aggregate, fine aggregate and water reducer, the mix proportion of which is shown in Table 1. It should be noted that the aggregate included gravel as the coarse aggregate and medium-coarse sand with good grading as the fine aggregate. The percentage of the gravel ranged from 5 mm to 15 mm and 15 mm to 25 mm were 50%, respectively.
According to the chemical analysis standard for cement [36], the contents of two sets of cement were accordingly obtained, which were given in Table 2. Particularly, in this experiment, simulated seawater was prepared with the contents of NaCl (31.23 g/L), MgSO4 (3.25 g/L) and CaCl2 (1.53 g/L). Based on the design principle of concrete structures, water/cement ratio of the specimen was designed as 0.40, in accordance with the maximum value of the water/cement ratio for concrete structures employed in marine environment.

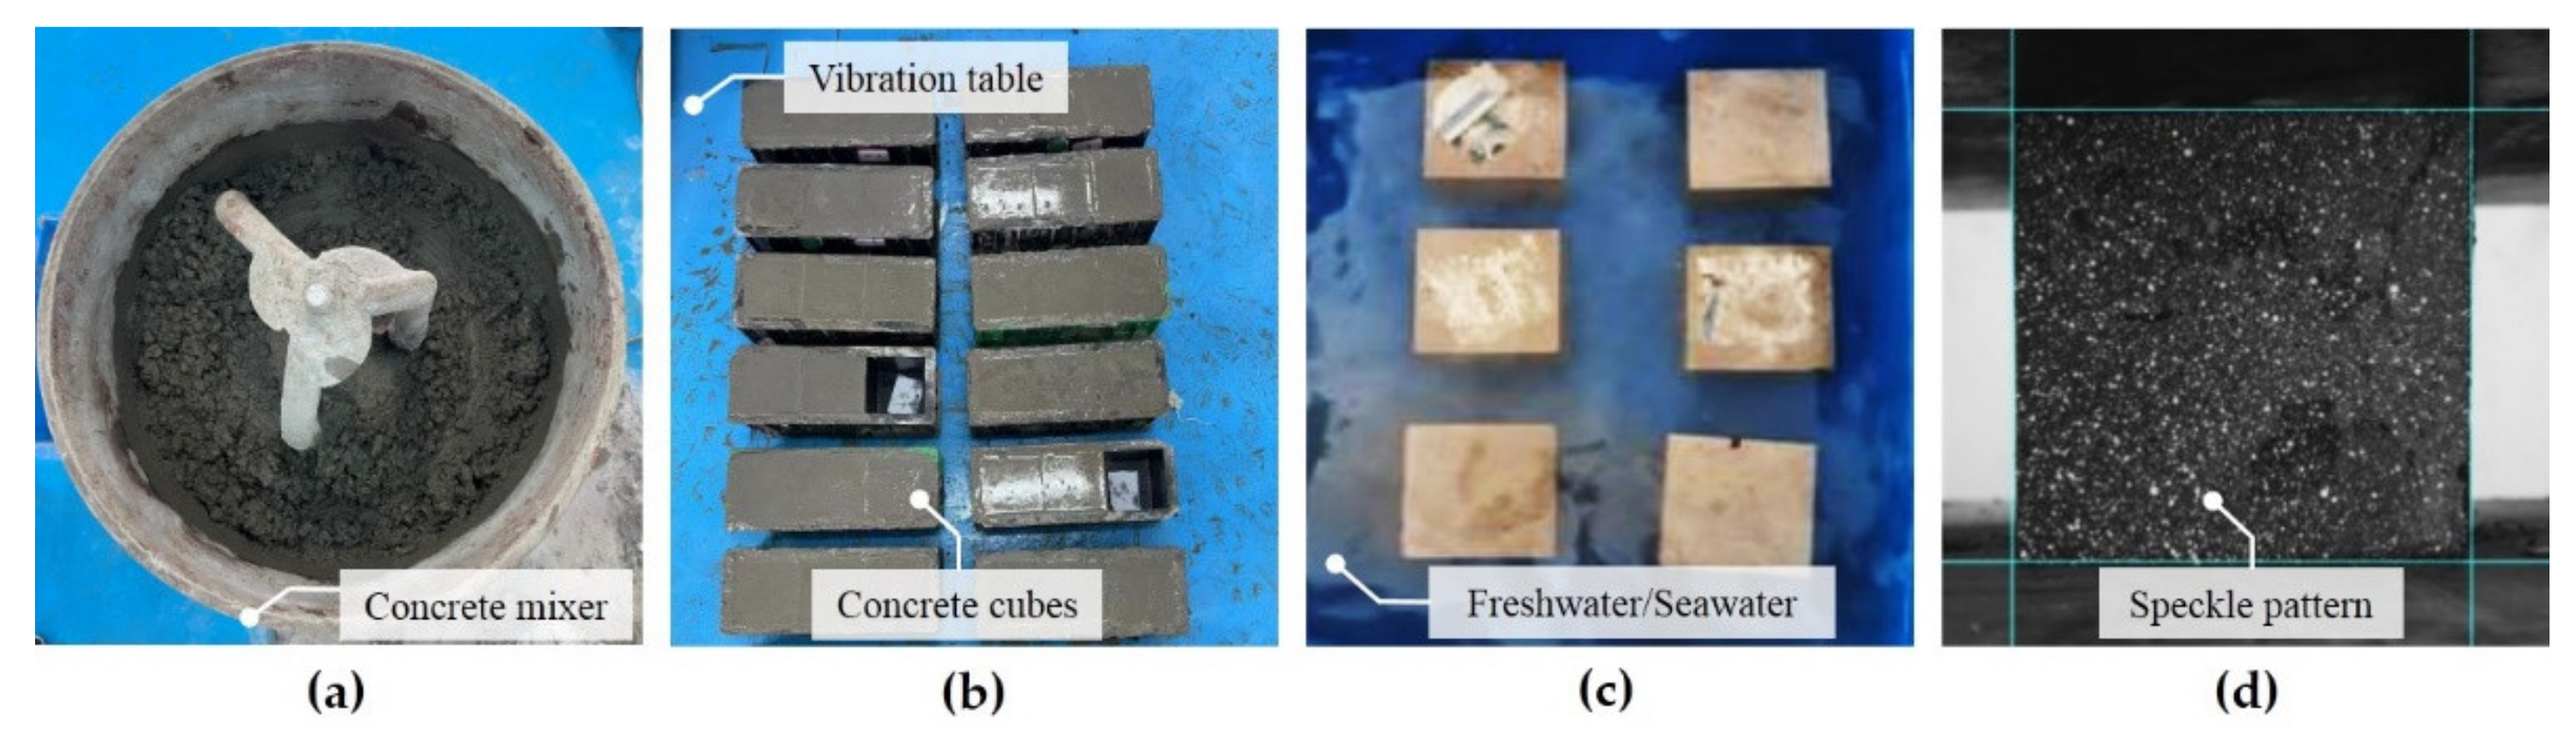
2.2. Preparation of the Specimen

As shown in Figure 1, the cube concrete specimens were fabricated and prepared for further speckle imaging. Firstly, the above-mentioned materials were fully stirred and poured into a mold sized of 100 mm × 100 mm × 100 mm, which was brushed with stripping oil beforehand. Then, the mixture was vibrated thoroughly by a vibrating table. After being stored in a room maintained at 20 °C and about 95% relative humidity for 24 h, the cube specimens were demolded. Each group of cube specimens was divided into two sets by being cured in freshwater and seawater conditions, respectively, which were labeled as OPC-F (OPC-based seawater concrete cured in the freshwater condition), OPC-S (OPC-based seawater concrete cured in the seawater condition), CAC-F (CAC-based seawater concrete cured in the freshwater condition), CAC-S (CAC-based seawater concrete cured in the seawater condition). In this experiment, ten specimens were prepared for each tested case, and they were cured at room temperature of 20 °C for 28 days. After being air-dried in the air, these cube samples would be used for full-field deformation measurement under compressive loads using the DIC technique.
Before the compression experiment, the concrete surface was carefully polished, especially for the front, upper and lower sides, to keep the smoothness of the concrete surface. In this way, external loading would be uniformly applied on the cubes of concrete by full contact between two working plates of the compression-testing machine and the upper and lower sides of the specimen. Besides, in order to generate high-quality speckle patterns on the front surface of seawater concrete specimens for DIC registration, matte black oil paint was sprayed all over the cube surface as background with randomly distributed white speckles decorated by white oil paint, as shown in Figure 1d.

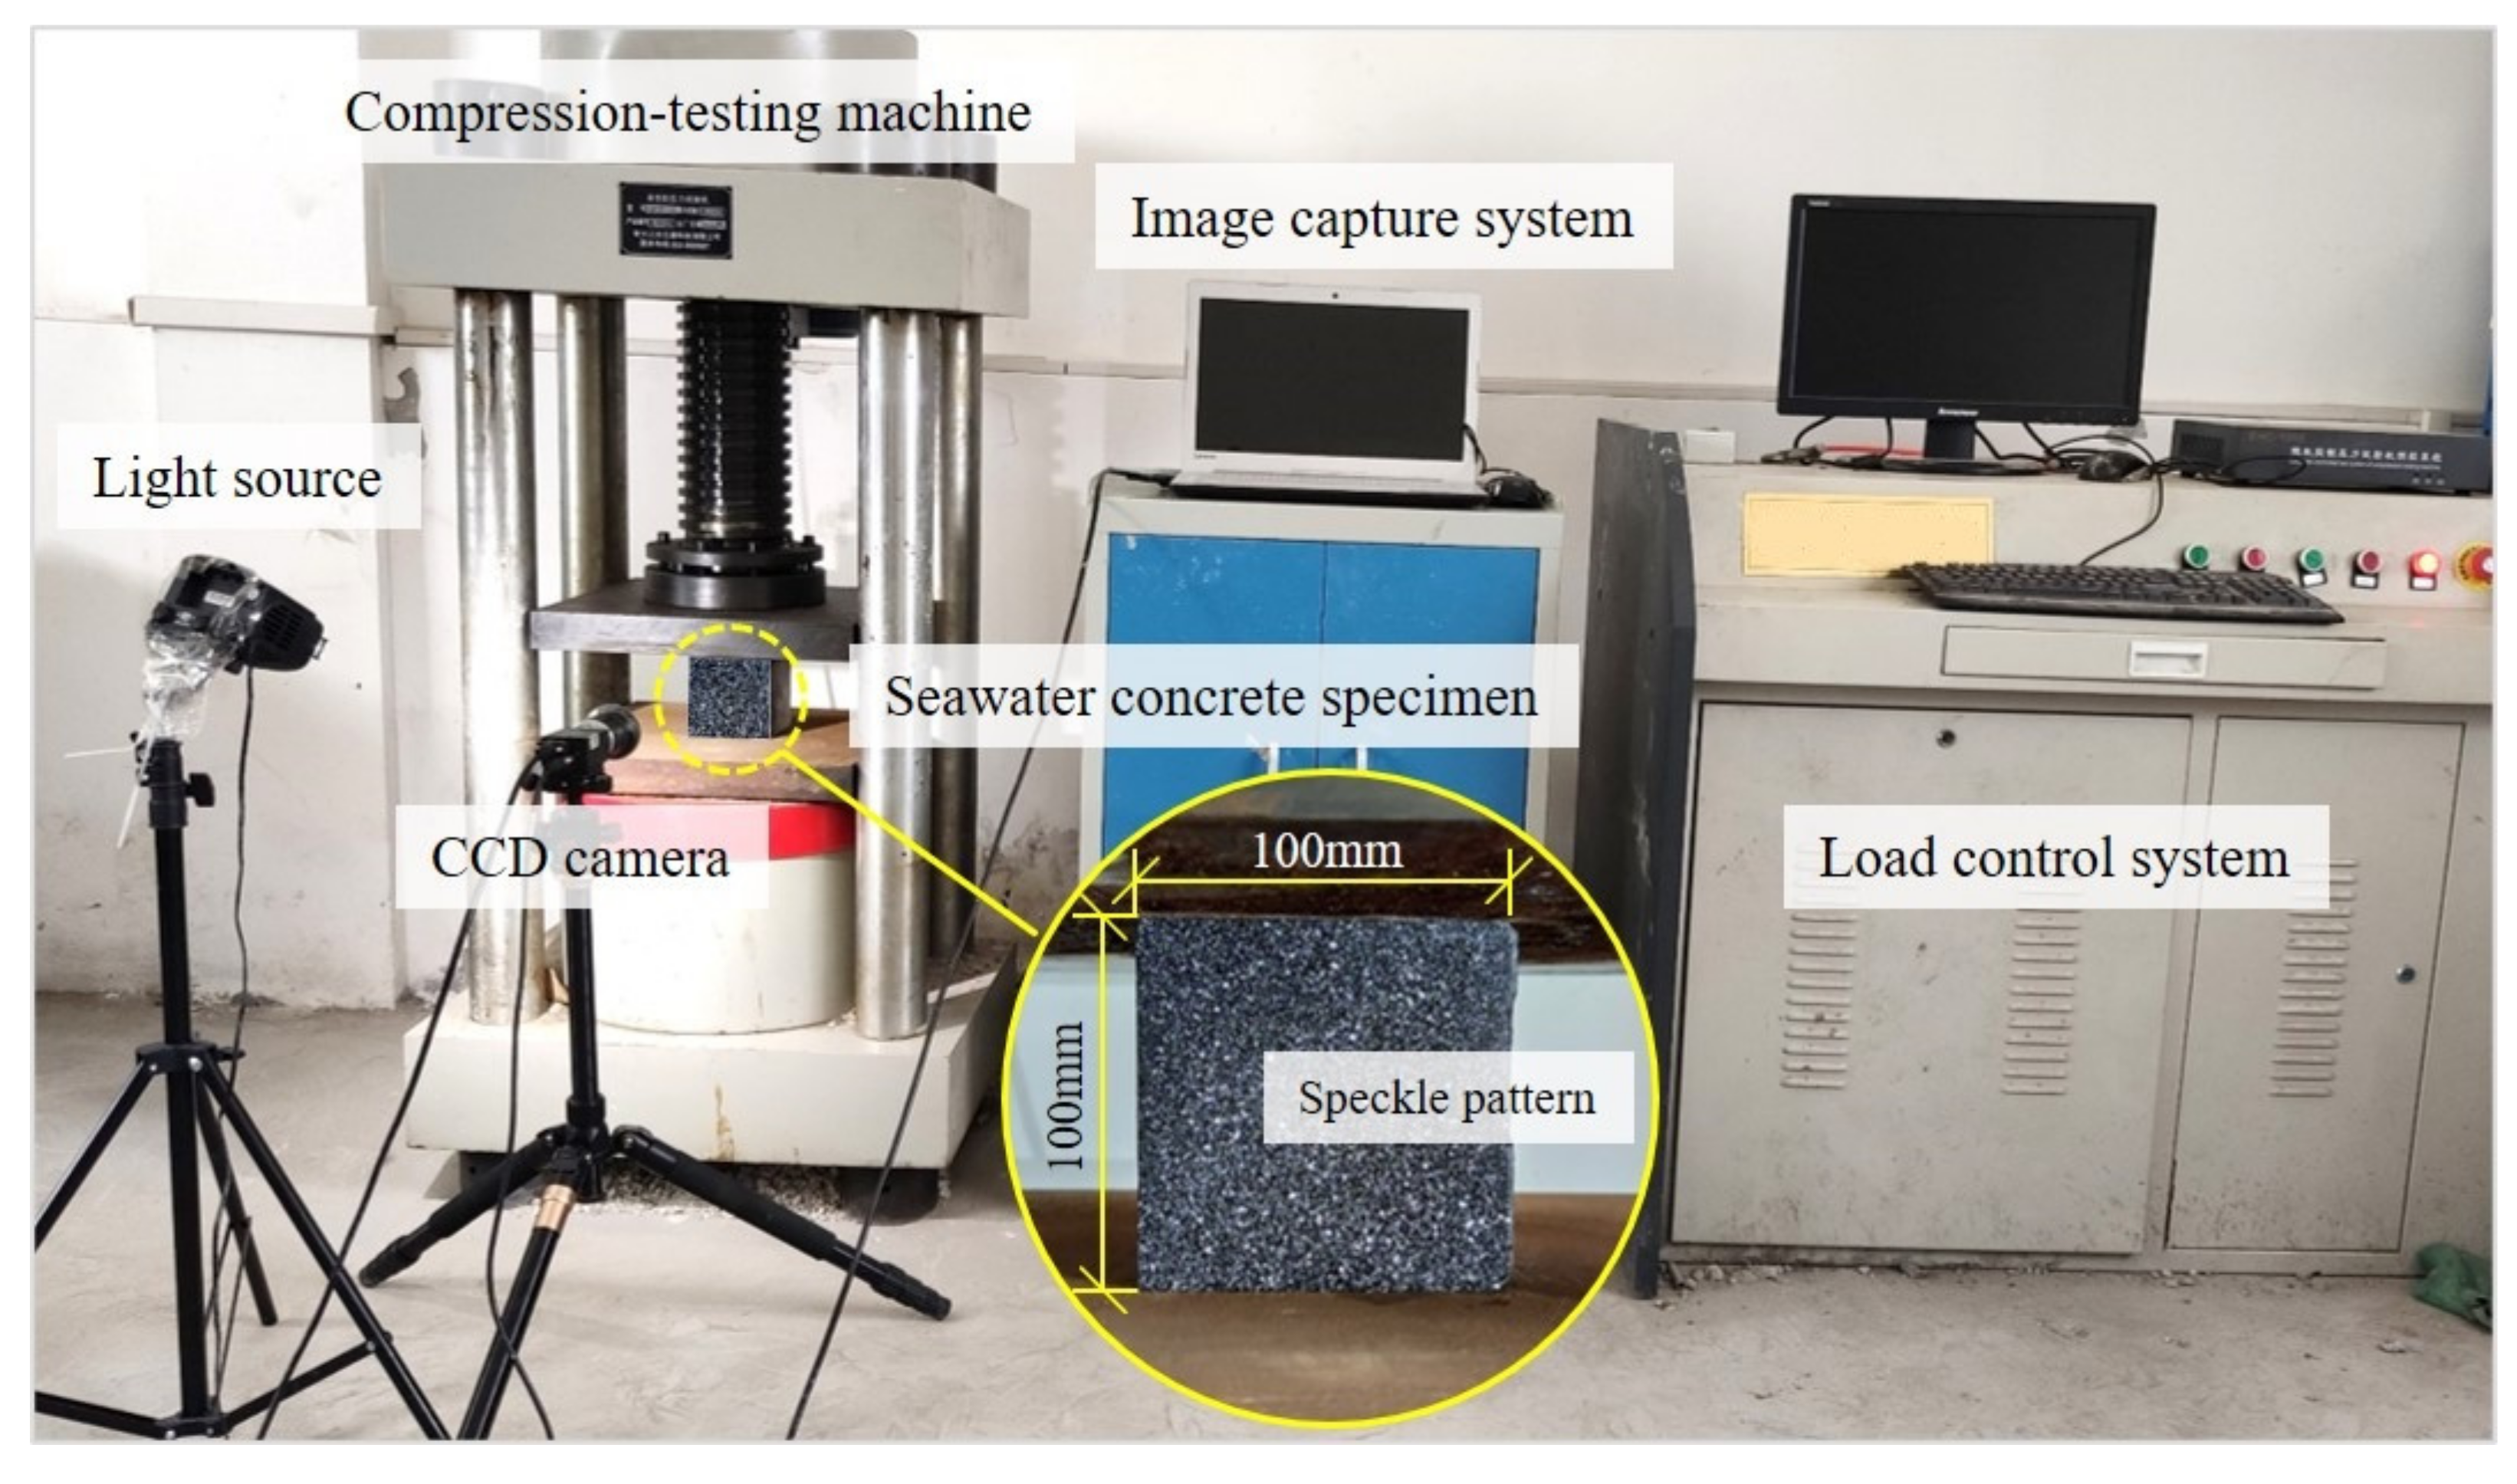
2.3. Uniaxial Compression Test and Digital Speckle Image Capturing

In this study, the compressive deformation measurement experiment was conducted by dynamically recording image sequences on concrete surface during the whole process of uniaxial compression loading. As illustrated in Figure 2, the tested cube sample should be placed on the central region of the working table of the compression-testing machine (SF-YAW-3000 D with capacity of 5000 kN) in order to guarantee strict axial compressive load on the concrete. In order to comprehensively obtain the deformation of concrete samples under uniaxial compressive loading, the full-field optical deformation measurement system with the aid of the widely used DIC technique was constructed in this experiment. As shown in Figure 2, imaging system for deformation measurement in DIC consisted of an industrial CCD camera (Pointgrey®, Point Grey Research® Inc., Richmond, BC, Canada, GS3-PGE-91S6, pixel format of mono8, CCD sensor sized of 1″ (i.e., 12.8 × 9.6 mm), resolution of 3376 × 2704 pixels, temporal dark noise of 8.71~8.76) and a prime optical lense (Tokina®, KCM-1216UMP5, F1.6–22, 12 mm, Kenko Tokina Co., Ltd. KT Nakano Building, Tokyo, Japan). The digital camera was mounted on a tripod and positioned in front of the loading machine at a distance of 50 cm. In addition, four vertical facades of the concrete should be perpendicular to the working table of the compression-testing machine, and the front side surface should be simultaneously perpendicular to the optical axis of imaging system of DIC.
With the cooperative work of loading machine and the imaging system, digital speckle images on the front surface of the cube concretes were continuously captured by the camera at an imaging rate of nine frames per second, while the concrete was gradually compressed with a constant uniaxial loading rate of 0.5 MPa/s under the loading control mode by the compression-testing machine, as shown in Figure 3a. As illustrated in Figure 3b, the full-field displacement information throughout the compression process could be accordingly calculated by mathematically comparing those speckle image sequences according to DIC algorithms. Consequently, the loading process would stop until the failure of the concrete, and the corresponding loading value at this moment would also be recorded as the peak load of the specimen.

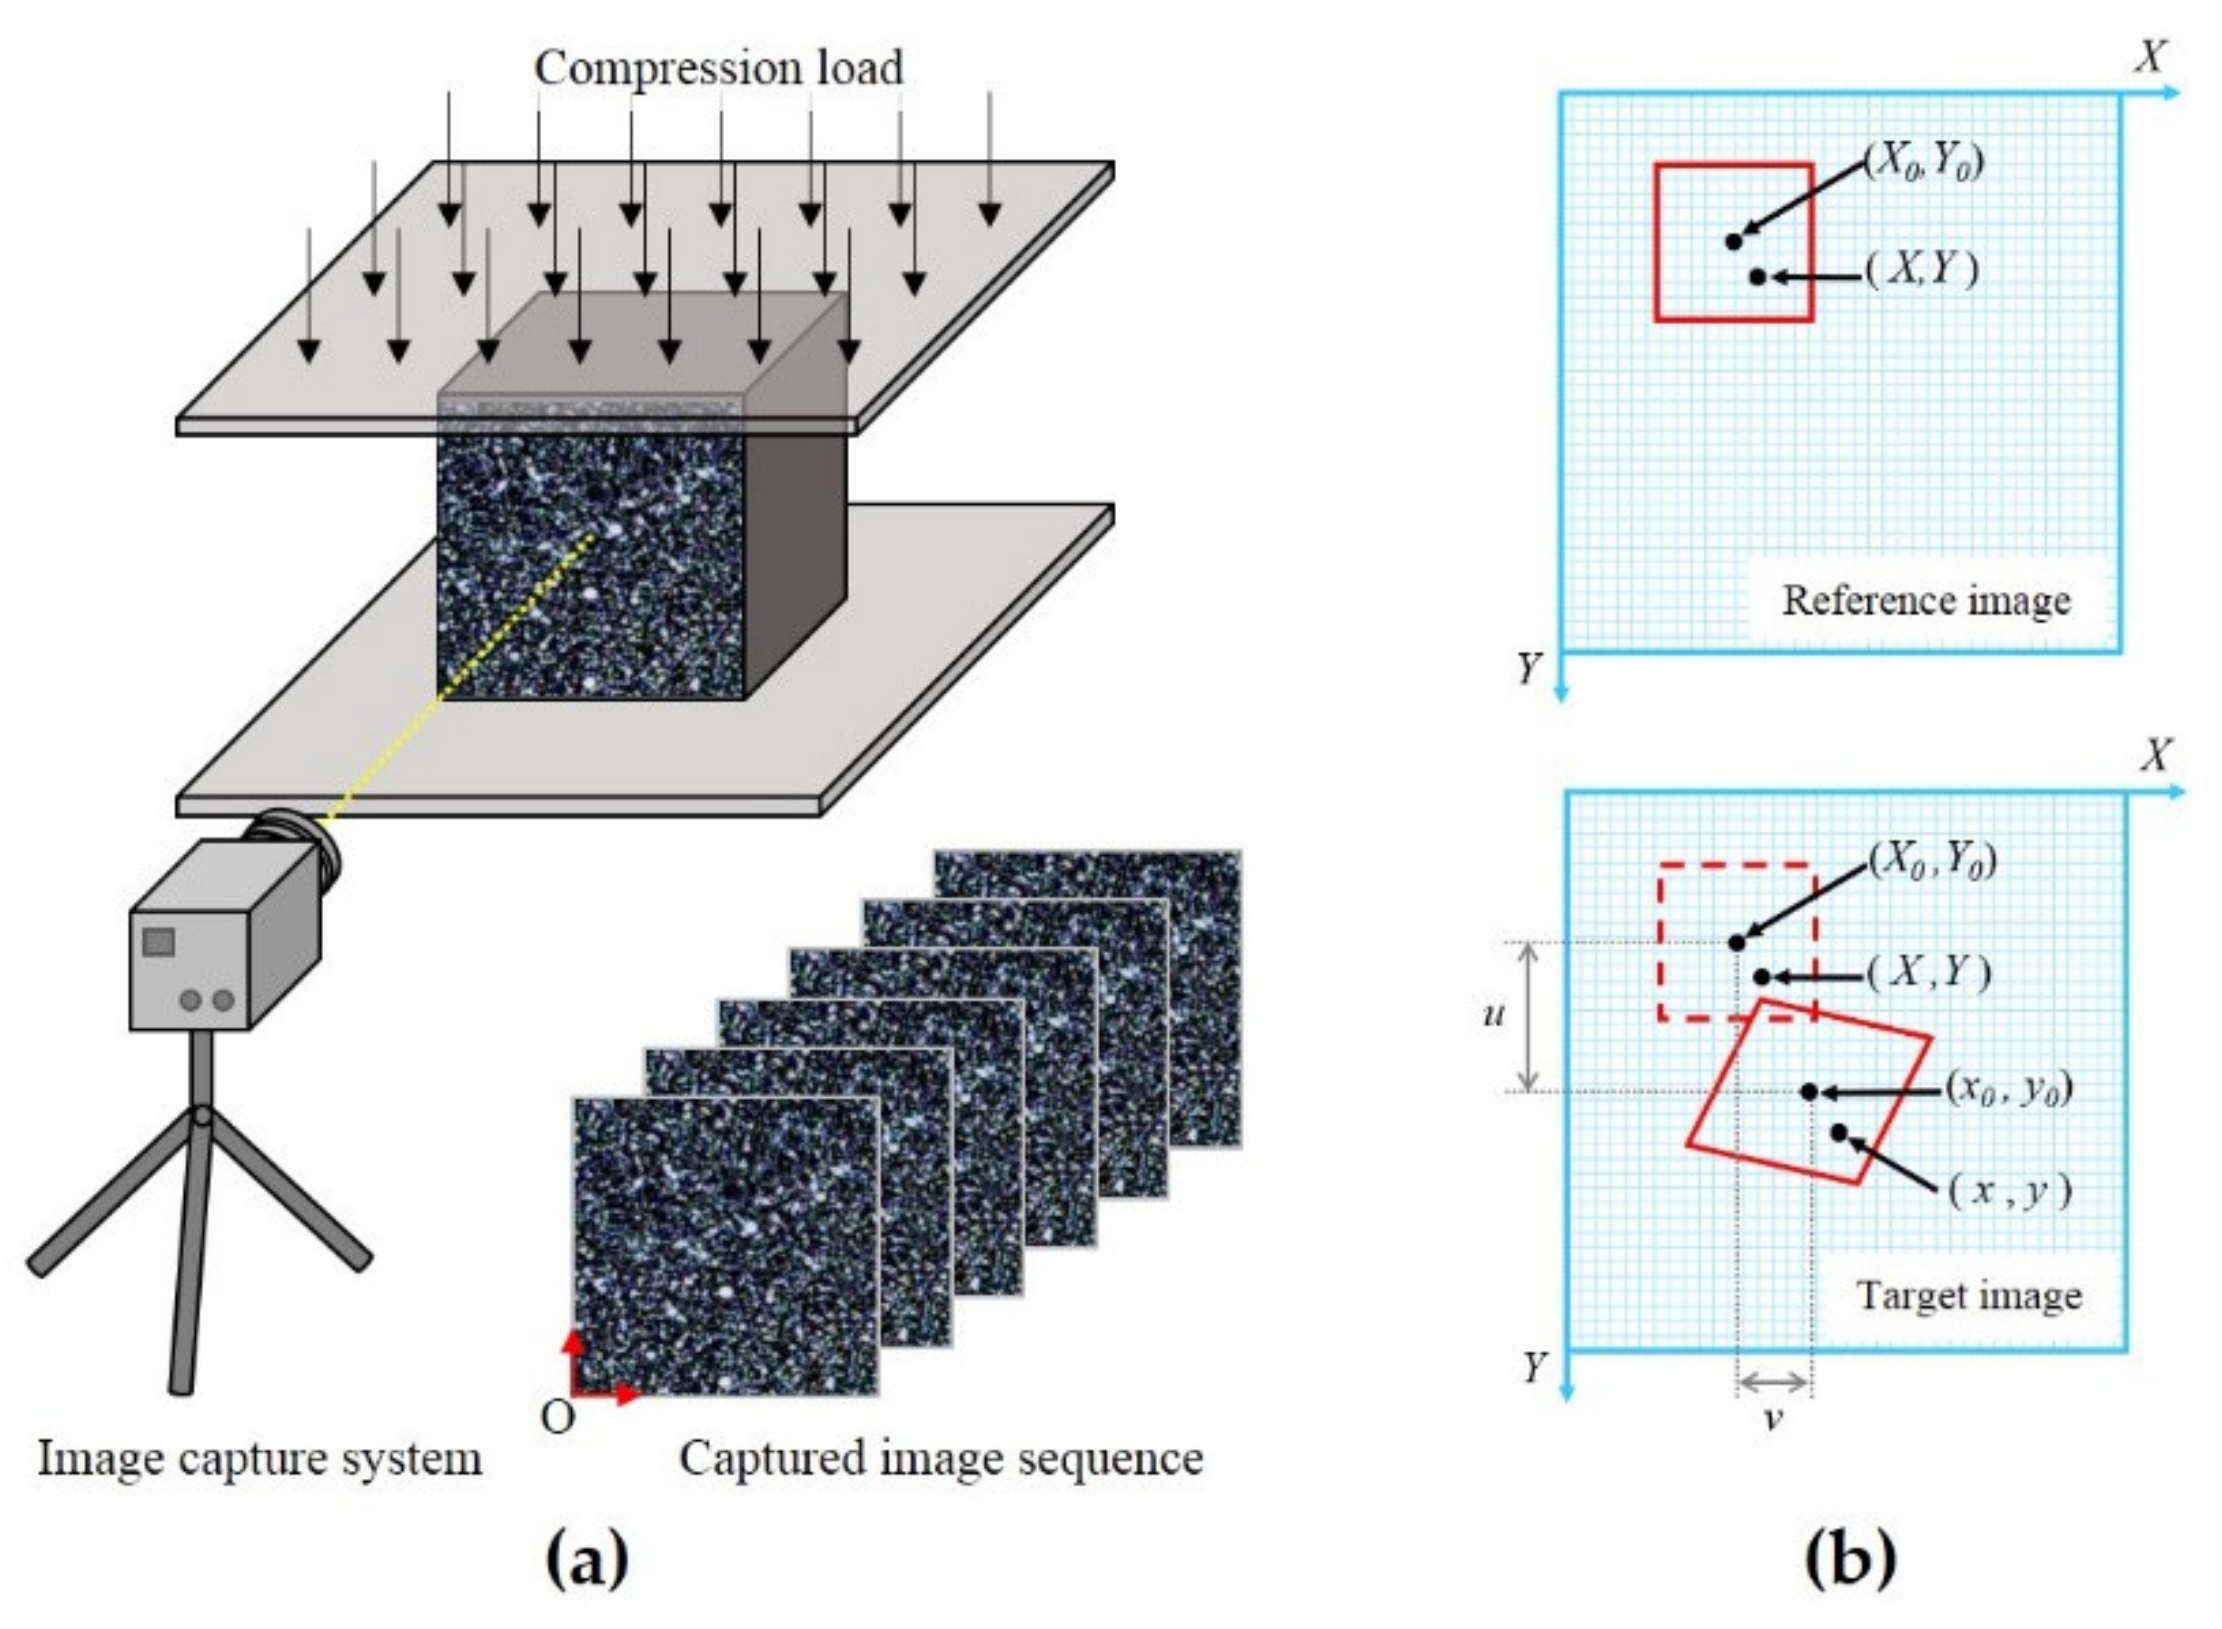
2.4. Digital Image Correlation Algorithm

Based on the recorded speckle image sequences of tested specimens, displacement fields of the seawater concretes could be constructed with the aid of the DIC correlation registration algorithm. Here, the captured digital speckle images to be compared before and after deformation were called reference image and target image, respectively. In the reference image, a series of so-called subsets centered on the selected sampling points with the size of (2M + 1) × (2M + 1) pixels were selected. These subsets were taken as templates to find the corresponding deformed subsets in the target image. In DIC algorithm, a set of correlation criteria were introduced to mathematically evaluate the similarity between two selected subsets [19,20,21]. Considering the possible imaging noise and varying illumination involved in this experiment, the commonly-used zero-mean normalized sum of squared difference (ZNSSD) correlation criterion was employed in this paper [21], which was presented as
C p = i = M M j = M M f x i , y j f m i = M M j = M M f x i , y j f m 2 g x i , y j g m i = M M j = M M g x i , y j g m 2 2
where f (xi, yj) and g (xi′, yj′), respectively, denoted the grayscale intensities at (xi, yj) and (xi′, yj′) in the reference and target subsets, and fm and gm were the corresponding mean values of grayscale intensities. It should be pointed out that the vector p = [u, v, ux, uy, vx, vy]T denoted the displacement and strain components between reference and target subsets, which could be related by the affine shape function:
x = x + u + u x Δ x + u y Δ y y = y + v + v x Δ x + v y Δ y
in which Δ x and Δ y meant the distance of arbitrary point (xi, yj) in the reference subset to the subset center (x0, y0), as shown in Figure 3b. Based on Equation (1), peak value of the correlation coefficients C calculated between the reference subset and the possible target subsets could be found, which corresponded to the exact location of the selected point after the deformation of the concrete. Repeating this procedure for all of the sampling points all over the front surface of seawater concrete, full-field displacement and strain could be accordingly constructed. In this paper, the displacement was calculated with step size of 30 pixels on the concrete surface, and the typical size of the subset was 25 × 25 pixels.

3. Full-Field Deformation Measurement

3.1. Compressive Displacement Measurement of OPC-Based Concrete

In Figure 4, full-field displacement on the front surface of the OPC-based seawater concretes at four sets of loading grades (i.e., 30%, 70%, 90% and 100% of peak load (denoted as fu)) were respectively illustrated as typical examples to establish the performance of the DIC-based method in this paper. It was indicated that the adopted DIC technique was capable of constructing displacement fields of the seawater concrete at each loading stage. Generally speaking, values of displacements for both OPC-F and OPC-S concretes (shown in Figure 4) increased with the applied compressive load, while the spatial distribution of the displacement became various with the increase of load. As shown in Figure 4a,e, at the beginning of compressive load (f = 30% fu), displacement on the top region of both cubes was firstly generated and increased uniformly with axial load, which meant that concretes experienced elastic deformation in this stage. When the compressive loads exceeded 30% fu, spatial distribution of displacement began to became heterogeneous, which could be seen in Figure 4b–d,f–h. Although both the spatial distribution of displacement and corresponding gradient were basically similar for the two groups of specimens, it could be realized that the absolute values of displacement for OPC-F were smaller at 30% fu but gradually much larger than those of OPC-S at each loading stage. Considering the influence of the curing condition on the OPC-based concretes, it could be found out that values of the displacement of OPC-S was initially larger in elastic deformation process, but gradually increased slower than those of OPC-F during the crack propagation process.
Particularly, the heterogeneous displacement fields were closely related to the development of cracks generated in OPC-S and OPC-F concretes. It was remarkable that a peak-shape region (as labeled with red dotted lines in Figure 4b,f) of inhomogeneous deformation appeared along the vertical direction with the increase of loads, implying the propagation of cracks in the concrete. In fact, the shape of peak region also indicated the direction of generated cracks in the cubes, which was consistent with the loading direction of concretes. In addition, when the loads of two groups of concrete increased to 90% fu, the main directions of the displacement gradients tended to change from only vertical to both horizontal and vertical, which could be taken as a significant characteristic of concrete failure caused by uniaxial compression load. Consequently, as shown in Figure 4d, it was obvious that the pyramidal displacement field of OPC-F at 100% fu indicated the cyclo-hoop effect. On the contrary, only a small region of larger displacement was found on the left side of OPC-S, as shown in Figure 4h, implying the increased lateral bonding strength in the concrete cube under seawater curing conditions. As reported in existing literature, the effect of seawater on the strength development of cementitious composite was complex [16], which could be observed in the displacement maps shown in Figure 4. In this sense, it was possible that the adopted DIC method might help to profoundly reveal the underlying reasons for the strength development by exhibiting full-field deformation of the seawater concretes during the whole compression loading process. Furthermore, details of local deformation characteristics and failure patterns of concretes at each loading stage could also be found and further analyzed.

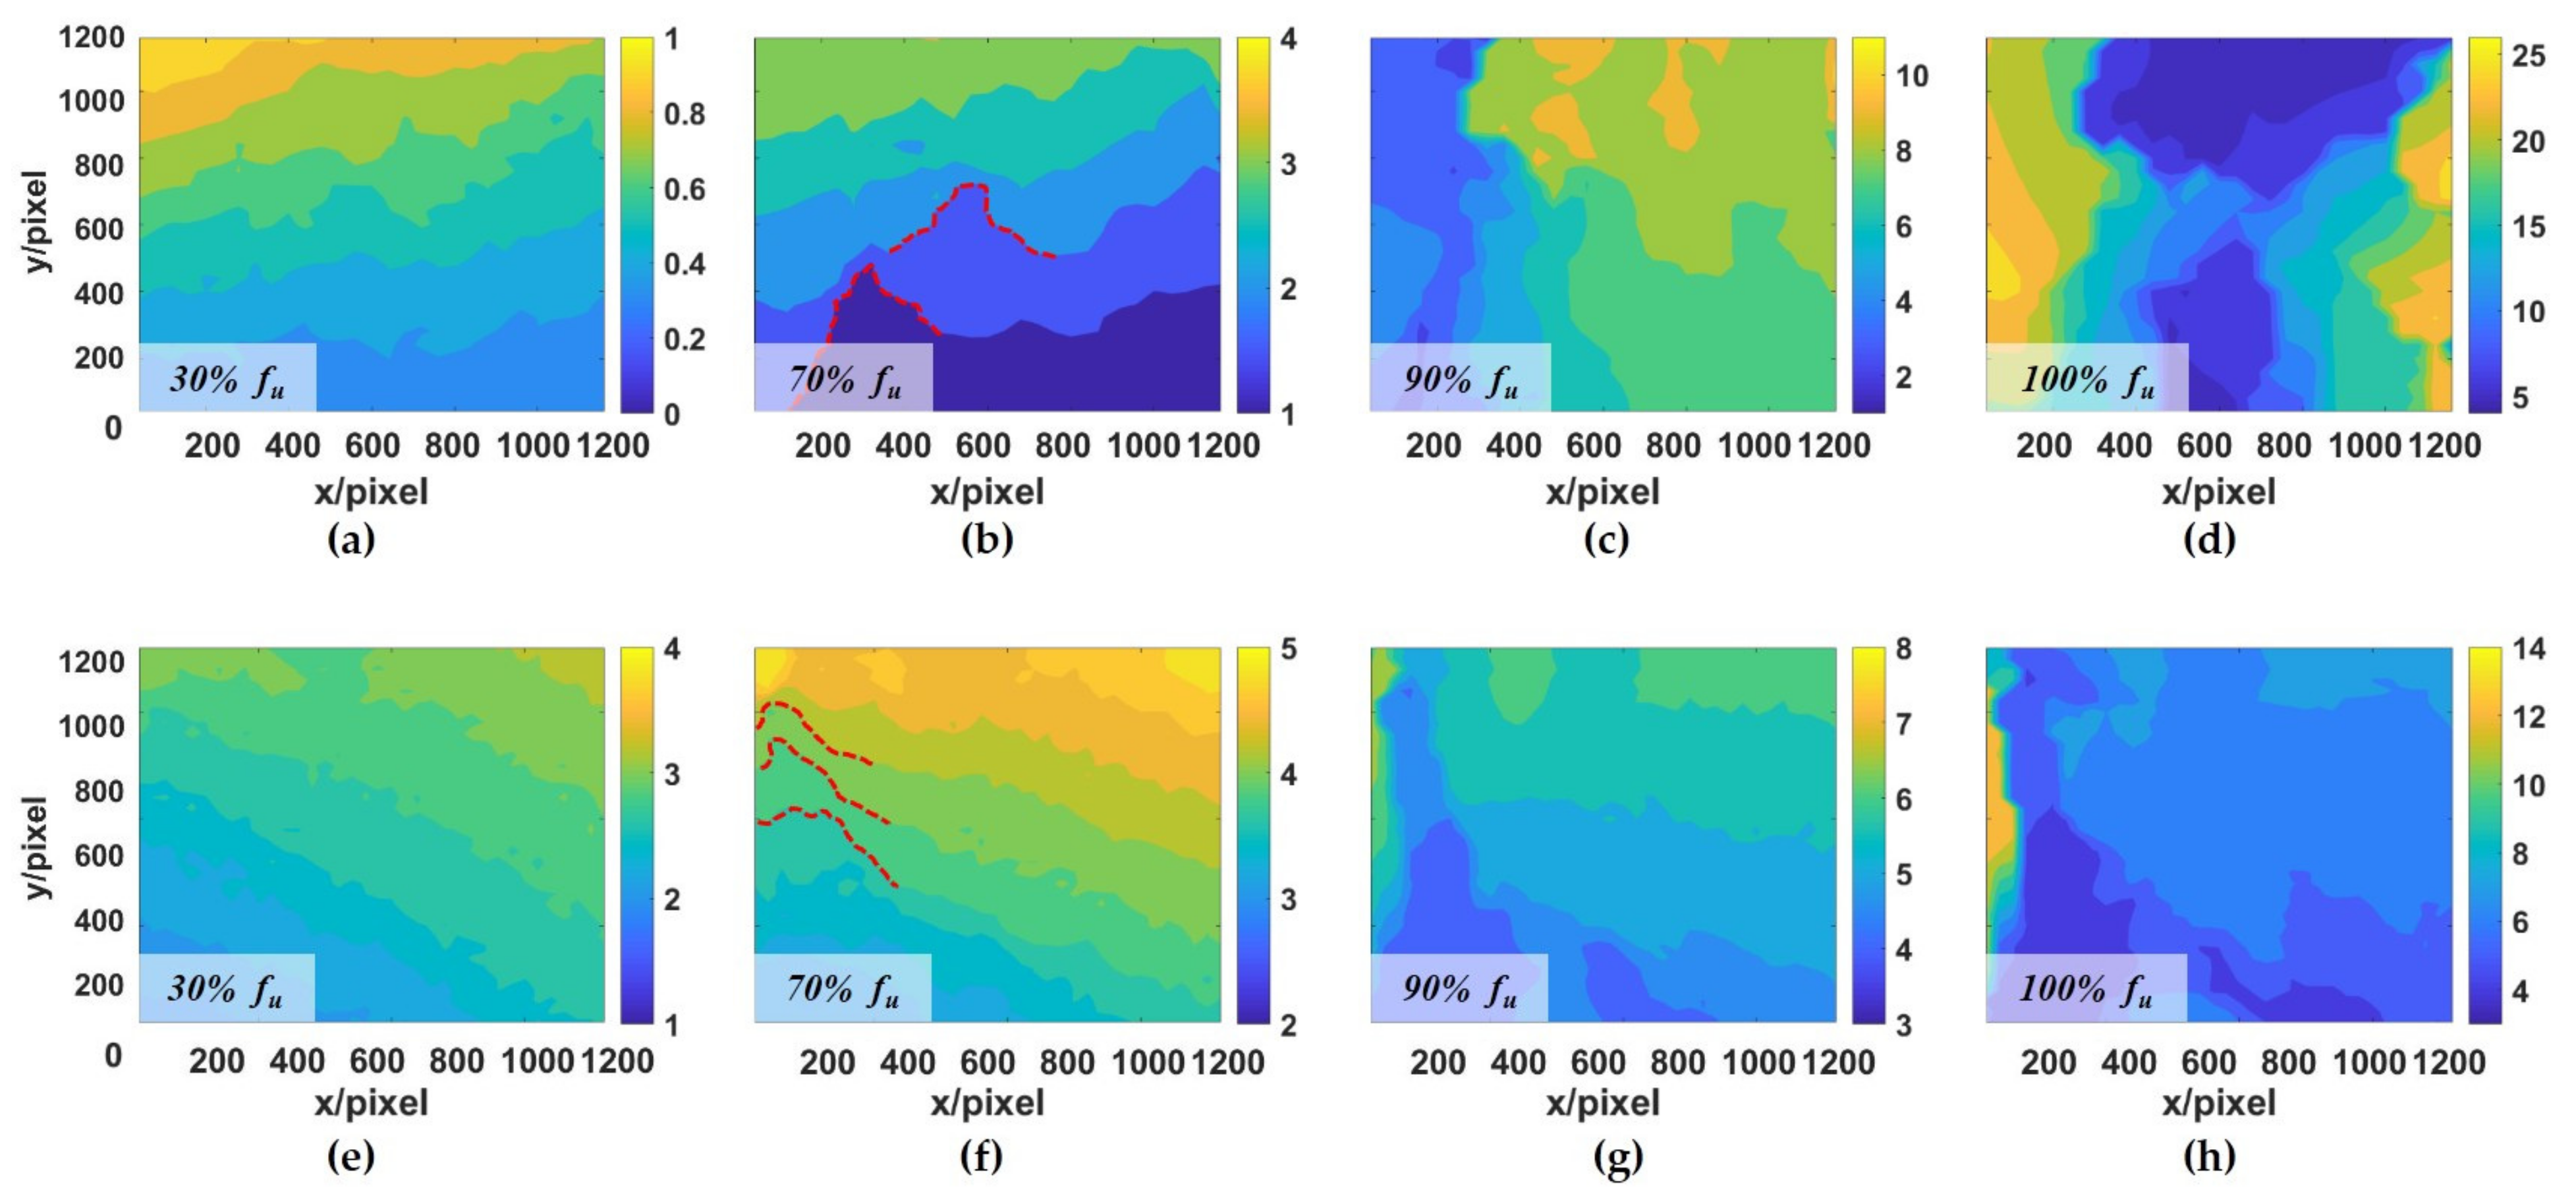
3.2. Strain Field Analysis of OPC-Based Concrete

By way of the strain window method [24], normal and shear strain on the front surface of the concrete could be calculated based on displacement data obtained by DIC. Here, the sampling step for displacement calculation was set as 5 pixels, and the strain window size was 5 × 5. Subsequently, volumetric strain εV was calculated based on both normal strain components εx, εy in X and Y directions, respectively, which was expressed as
ε V = ε x + ε y
The normal strain εx, εy, shear strain γxy and volumetric strain εV of two groups of OPC-based seawater concrete (i.e., OPC-F and OPC-S) at the peak loads were presented in Figure 5. It should be noted that, due to the limitation of DIC in surface deformation measurement, the thickness strains were not included in this paper. Although it was reported that the thickness strain should not be ignore [37], it was believed that it would not influence the comparison evaluation between concrete samples in this paper.
Comparing normal strain εx and εy for both specimens in Figure 5a,b,e,f, it could be found that values of εx were relatively larger than those of εy in most regions of the concrete surface, indicating that the OPC-based seawater concrete mainly experienced latitudinal strains. However, for εy of the OPC-S sample in Figure 5f, there were also relatively smaller strains of εy with both positive and negative values, which meant that both tensile and compressive longitudinal deformation also occurred in the OPC-S concrete. On the contrary, this phenomenon was not that conspicuous for OPC-F. Besides, the spatial distribution of shear strains for OPC-S in Figure 5g was consistent with normal strain in Figure 5e,f, whereas the shear strain could only be seen on the right bottom region in Figure 5c for OPC-F sample. It was possible that the lateral motion near the top and bottom regions of OPC-F was constrained due to the cyclo-hoop effect in OPC-F, which resulted that the longitude deformation was relatively limited. Consequently, the volumetric strain fields of OPC-F and OPC-S were illustrated in Figure 5d,h, which could be used to analyze the volume change of the seawater concrete. As for the spatial distribution of the volumetric strain, they were distributed on two boundary regions of OPC-F while it was concentrated in the local region of OPC-S, which might have been caused by the enhanced bonding strength introduced by seawater in OPC-S. Comparing the values of the volumetric strain for OPC-F and OPC-S, it was found that the major difference of volumetric strain lied in that there existed obvious negative values in the volume strain field of OPC-S, implying that the OPC-S concrete presented both expansion and contraction under the peak load condition.
In particular, it could be noticed that the spatial distribution of two groups of OPC-based concrete was significantly different. For the OPC-F specimen, as presented in Figure 5a, regions with relatively larger absolute values (hereafter referred to as peak regions) of normal strain εx could be found on the left side and lower-right corner of the cube concrete. But, a small area of normal strain εy and shear strain γxy only appeared on the lower-right corner of the surface in Figure 5b,c. It indicated that deformation generated in the OPC-F concrete was mainly latitudinal tensile strain. In contrast, as shown in Figure 5e–g, peak regions of both normal strain and shear strain for OPC-S concrete were almost consistent, which meant that the OPC-S concrete experienced biaxial and shear deformation under uniaxial compressive load.

4. Failure Behavior Evaluation

4.1. Compressive Deformation Analysis

In order to comparatively analyze the compressive deformation of different cement-based seawater concrete, deformation data of four groups of seawater concretes, including OPC-F, OPC-S, CAC-F and CAC-S, were obtained. The peak loads of four groups of tested samples were shown in Table 3, whose mean values and standard deviations were calculated by ten tested specimens for each group of concrete after the aberrant data were eliminated if the deviation was 15% larger than the mean value. Furthermore, the coefficients of variation and S/F ratios of OPC- and CAC-based concretes were obtained. Here, the coefficient of variation was represented by the ratio of the standard deviation to the mean value of peak load. According to the relatively small values of coefficient of variation, it was believed that the dispersion of peak loads of each group of tested samples was low. The S/F was used to calculate the ratio of peak load of concretes in seawater to freshwater curing conditions. It was found that value of S/F for both OPC and CAC groups were close to 1, but a little larger than 1, indicating that the seawater curing condition could improve the compressive strength of two kinds of seawater concretes. Meanwhile, it should be noted that the S/F ratio of the OPC-based specimens was smaller than that of CAC-based concretes, implying that the CAC-based concrete gained more compressive strength in seawater curing condition. However, it should be noticed that the full-field deformation and spatial distribution of the cracks for OPC-F and OPC-S concrete were obviously distinct although values of peak load between two groups of OPC-based concrete were similar, which could be found in Figure 4 and Figure 5. According to the compressive strength data reported in previous studies [16,18], it was also found that the effect of seawater curing condition on the compressive strength was still inconclusive even caused serious adverse effects. It was deduced that the complex deformation behavior in the seawater concrete could not be well reflected by the compressive strength alone. That was to say, the estimation of the compressive behavior of concretes with a single value of peak load alone was insufficient in compression test.
Therefore, the development of displacement on the front surface of concrete specimens was carefully tracked during uniaxial compressive loading, where nine points labeled as Pi (i = 1,2,…,9) and two typical points with larger displacement values labeled as P10 and P11 were selected. As shown in Figure 6, displacement-loading curves of eleven points Pi (i = 1,2,…,11) for four groups of concretes were plotted based on displacement data calculated by DIC. It was obvious that displacement values of these points on various locations of each cube surface were not always synchronized, especially when the load increased to a certain value. In fact, an inflection point always existed for curves of four groups of concrete samples, where trends of displacement curves for 11 points would significantly increase or decrease. For instance, for the OPC-F concrete in Figure 6a, displacement at P1, P4, P6, P7, P9, P10 and P11 would substantially increase, and other points adversely decrease when the load exceeded 450 kN. It could thus be seen that those increased points were mainly located near left and right boundaries of the concrete, which should be the exact regions of generated cracks. However, in fact, it was difficult to predict local deformation of these concretes beforehand due to their statistically randomly-distributed characteristics. Particularly, it was found out that gradients of displacement-loading curves for those 11 points differed with the increase of compressive load. Therefore, it seemed to be a good idea to adopt full-field deformation measurement method to assist us in learn the deformation details all over the region of interest on the concrete surface.
Based on the displacement curves of selected typical points for four groups of concretes, variation trends of local displacement on the seawater concrete could be accordingly analyzed. As shown in Figure 6, it was noted that the corresponding load values at inflection point for both OPC-based concretes cured in freshwater and seawater were smaller than those of CAC-based concretes, revealing that the compressive strength of OPC-based concrete was smaller than that of CAC-based concrete, which was consistent with the results obtained in Table 3. In addition, it was found that displacement range of 11 points at a certain load for CAC-based concrete was wider than those of OPC-based concrete before the inflection point. However, on the other hand, the ranges of displacement curves for OPC-F and OPC-S were similar and smooth, whereas the range of CAC-F was wider at first and decreased more rapidly than that of CAC-S, which indicated that the failure of the OPC-based concrete should be ductile but the CAC-based concrete should be brittle. It could be seen that the displacement-loading curves of the sampling points on the concretes obtained according to the full-field measurement results based on DIC could provide knowledge of compressive deformation and failure mode for the seawater concretes.

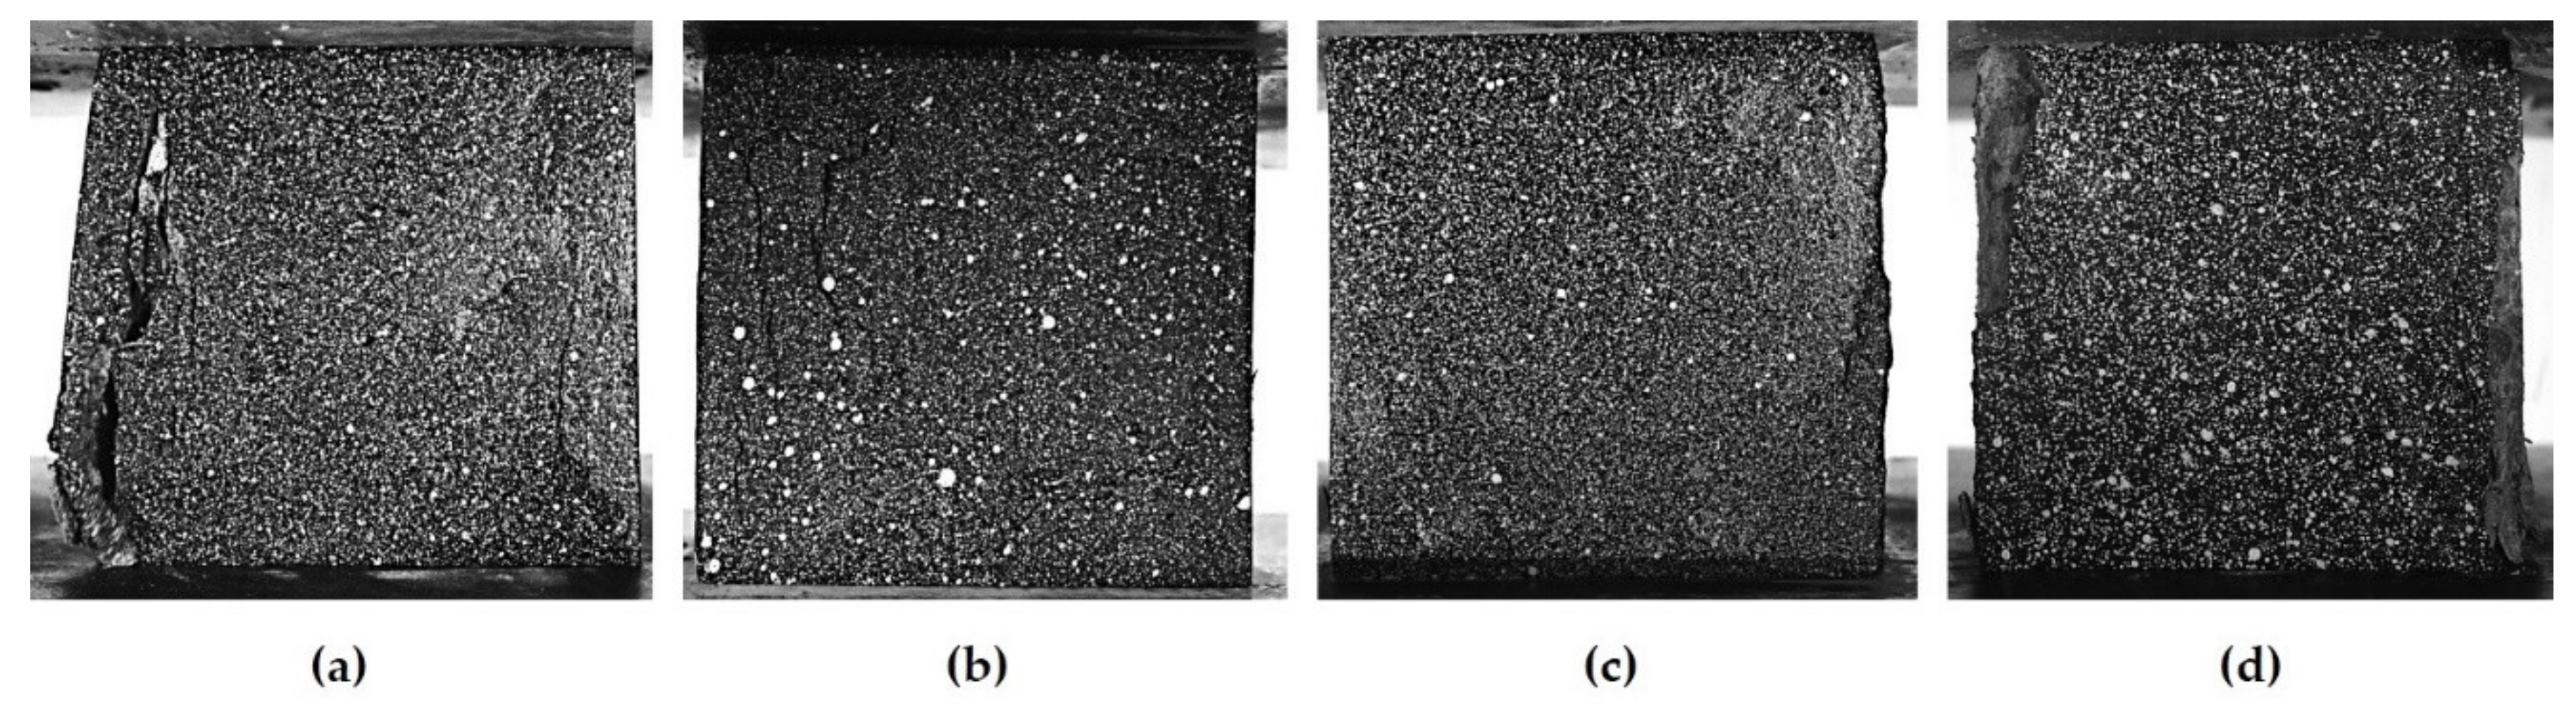
4.2. Crack Propagation Analysis

Volumetric strain fields of four groups of seawater concretes were constructed based on DIC, which could be used to analyze the exact locations and scales of cracks on the concrete. In Figure 7, the three-dimensional contours of volumetric strain of four groups of tested specimens (i.e., OPC-F, OPC-S, CAC-F and CAC-S) at peak load were presented. It was observed that the main direction of OPC-based cracks was longitudinal, while the CAC-based concrete was both longitudinal and latitudinal. Besides, scales of volumetric strain for the CAC-based concretes were smaller than those of OPC-based concretes on the whole, implying that the compressive load-induced cracks of CAC-based concretes were relatively smaller. In fact, it was possible that two types of cementing material (i.e., OPC and CAC) adopted in tested samples influenced the bonding strength of aggregates. Therefore, it was most likely to find cracks in the OPC-based concretes, while the cracks in CAC-based concretes would extend difficultly with smaller scale. In fact, as shown in Figure 7a,b, it was seen that most of the longitudinal cracks in the OPC-based concretes were continuous and extended along the loading direction up to the boundary of cube samples. In contrast, it seemed that propagation of cracks in the CAC-based concretes was difficult, resulting in the longitudinal cracks changing to latitudinal cracks, as shown in Figure 7c,d. As mentioned in previous investigations [16,20], interior pores in the seawater concrete almost disappeared, due to the precipitation of ettringite, Friedel salt, and sulphate under seawater curing conditions. Both the porosity and the average pore size of the OPC-S and CAC-S would simultaneously increase in comparison with OPC-F and CAC-F, respectively. Particularly, the interior pores in the OPC-F concrete were much larger than those in OPC-S, indicating that the generated cracks in OPC-F were widely spread while the cracks in the OPC-S would be more concentrated. However, the interior pores of CAC-S were a little larger than those of CAC-F. Besides, continuous spatial network was gradually formed in OPC-S concrete due to the hydration products under seawater curing condition, which would significantly enhance the compressive strength of OPC-S concrete. Therefore, the cracks generated in OPC-S would be distributed all over the concrete surface while the cracks in OPC-F were located in a local region of the concrete. It could be found out that the results illustrated in Figure 7 exactly could give evidence of the conclusion in the investigations mentioned above.
In terms of the influence of curing condition on the distribution of cracks in seawater concrete, pictures of four fractured concrete cubes were illustrated in Figure 8. Combing with the counters of cracks illustrated in Figure 7, it could be found that scales of volumetric strain for both the OPC-based concretes cured in seawater conditions were much larger than the corresponding samples cured in freshwater conditions. It meant that the concretes cured in seawater conditions were able to resist larger load in comparison with those concretes curing in freshwater condition. Therefore, it was obvious that the compressive-load-induced cracks in Figure 8a were relatively larger and widespread than Figure 8b. Besides, in Figure 7a,b, it was obvious that spatial distribution of volumetric strain for OPC-S was concentrated and the scales were relatively larger than those of OPC-F sample, indicating that the seawater curing condition would actually introduce failure risk of the concrete, which could not be concluded in Table 3. In Figure 7c,d, there were remarkable cracks with larger scales distributed in CAC-S concrete, while cracks of CAC-F could only be found in a small local region, revealing that the seawater curing condition might lead to lower bonding of CAC and aggregates to some extent. Obviously, it was hard to be found either in Table 3 or the fractured pictures illustrated in Figure 8c,d. On this basis, the local deformation map was of great significance to analyze the scales and spatial distribution of generated cracks in seawater concretes during the whole process of compressive load.

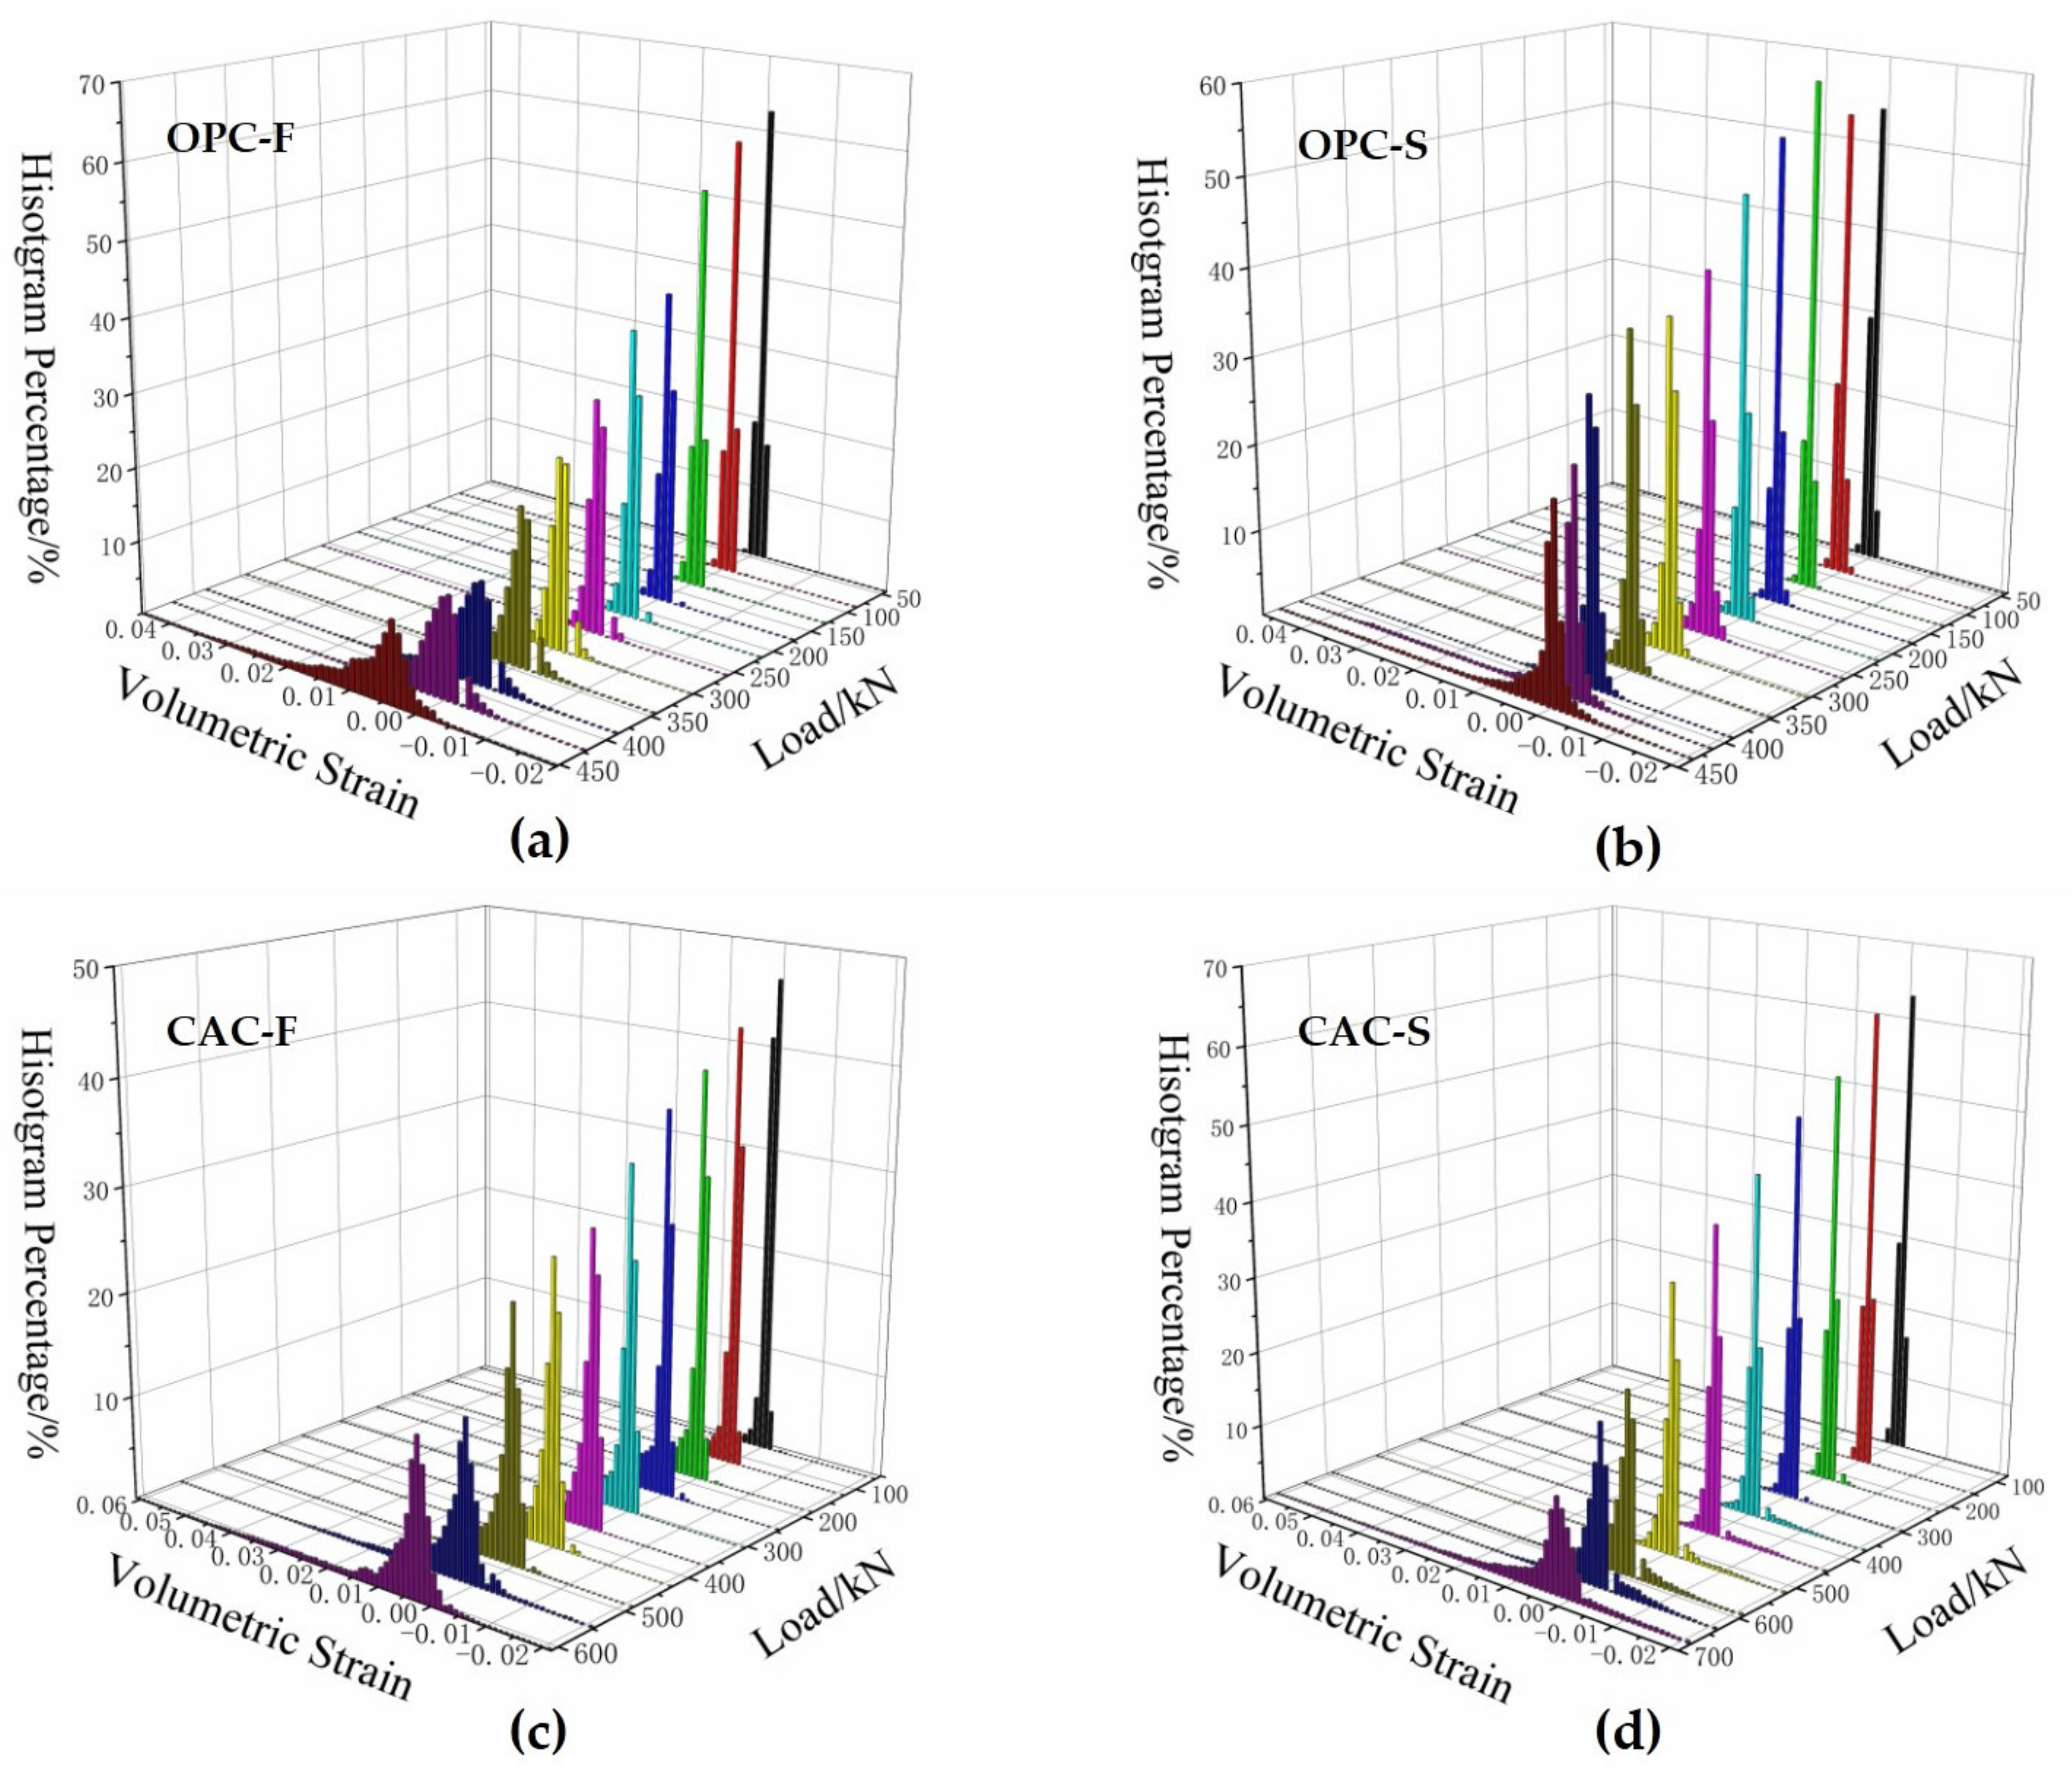
4.3. Volumetric Strain Histogram Evaluation

Failure behavior of the concrete was not only associated with its time-dependent deformation performance but also related to the spatial distribution of local deformation. In order to quantitatively estimate spatial distribution of local deformation during the whole loading process, volumetric strain histogram of OPC and CAC-based seawater concretes were calculated based on the full-field volumetric strain data, where strain frequency within a certain interval was counted. As illustrated in Figure 9, ten groups of time-series of volumetric strain histograms were illustrated for each individual seawater concrete sample during the whole compressive loading process, in which the load began from 10% fu and increased by 10% until to the peak load fu. In general, it was observed that volumetric strain was small and distributed near zero at the beginning, but gradually, it tended to increase in positive direction. That was because the cube concrete was compacted at the initial loading stage and then expanded due to the generation of local cracks under compressive loading. In particular, as shown in Figure 9a, it should be noticed that a larger percentage of strains were negative for OPC-F at the beginning of loading, while most of the volumetric strains were positive for the other three groups of samples, which was probably related to its higher porosity. In contrast, for OPC-S concrete shown in Figure 9b, it was found that volumetric strain was distributed in a smaller range, which actually denoted the higher compressive strength of OPC-S. Compared with the measured data in Table 3, it could be found that strains of a large percentage of points in the OPC-F concrete were relatively smaller than those of OPC-F, although the peak loads of two groups of specimen were close. Similarly, the histogram range for the CAC-S concrete was smaller than that of CAC-F, which also indicated the increased compressive strength under seawater curing condition. But the percentage of smaller volumetric strain of CAC-S was lower than that of CAC-F, indicating that the volume of CAC-S expanded in a widely distributed regions, which could be found in Figure 7d. In this way, the failure characteristics of seawater concretes could be quantitatively tracked by estimating the volumetric strain histogram during the whole compressive loading process.
On the other hand, it should be noted that there was distinct negative volumetric strain distribution with the increase of load for those concretes in Figure 9. It was because the negative volumetric strain was closely related to the generation and spatial distribution of local cracks induced by uniaxial compressive load. Particularly, volumetric strain histogram in Figure 9a,c,d exhibited local peak distribution for the negative values. However, for the negative volumetric strain of OPC-S in Figure 9b, it could be found that the spatial distribution of volumetric strain was concentrated in the boundary region of the cube specimen, which was illustrated in Figure 7b. So, the influence of local volume change for the OPC-S concrete was limited. As shown in Figure 9c,d, although most of the volumetric strains were positive, a certain percentage of negative strain values existed before peak load. It was concluded that histogram percentage of the CAC-F concrete was smaller than that of CAC-S, revealing that the compressive-loading induced cracks of CAC-F were relatively concentrated, which could be found in Figure 7c. In this sense, it was suggested that the failure behavior of the seawater concretes should be investigated by estimating both the full-field distribution and histogram of volumetric strain during the whole loading process.

5. Conclusions

In this paper, compressive failure behavior evaluation scheme for seawater concrete was established with the combination of the compression testing machine and optical deformation measurement instrument based on the DIC technique. The full-field displacement, normal strain, shear strain and volumetric strain of four groups of seawater concretes (OPC-F, OPC-S, CAC-F and CAC-S) were obtained based on correlation registration and strain window algorithms, respectively. The main conclusions of the presented study are summarized as follows:
(1)
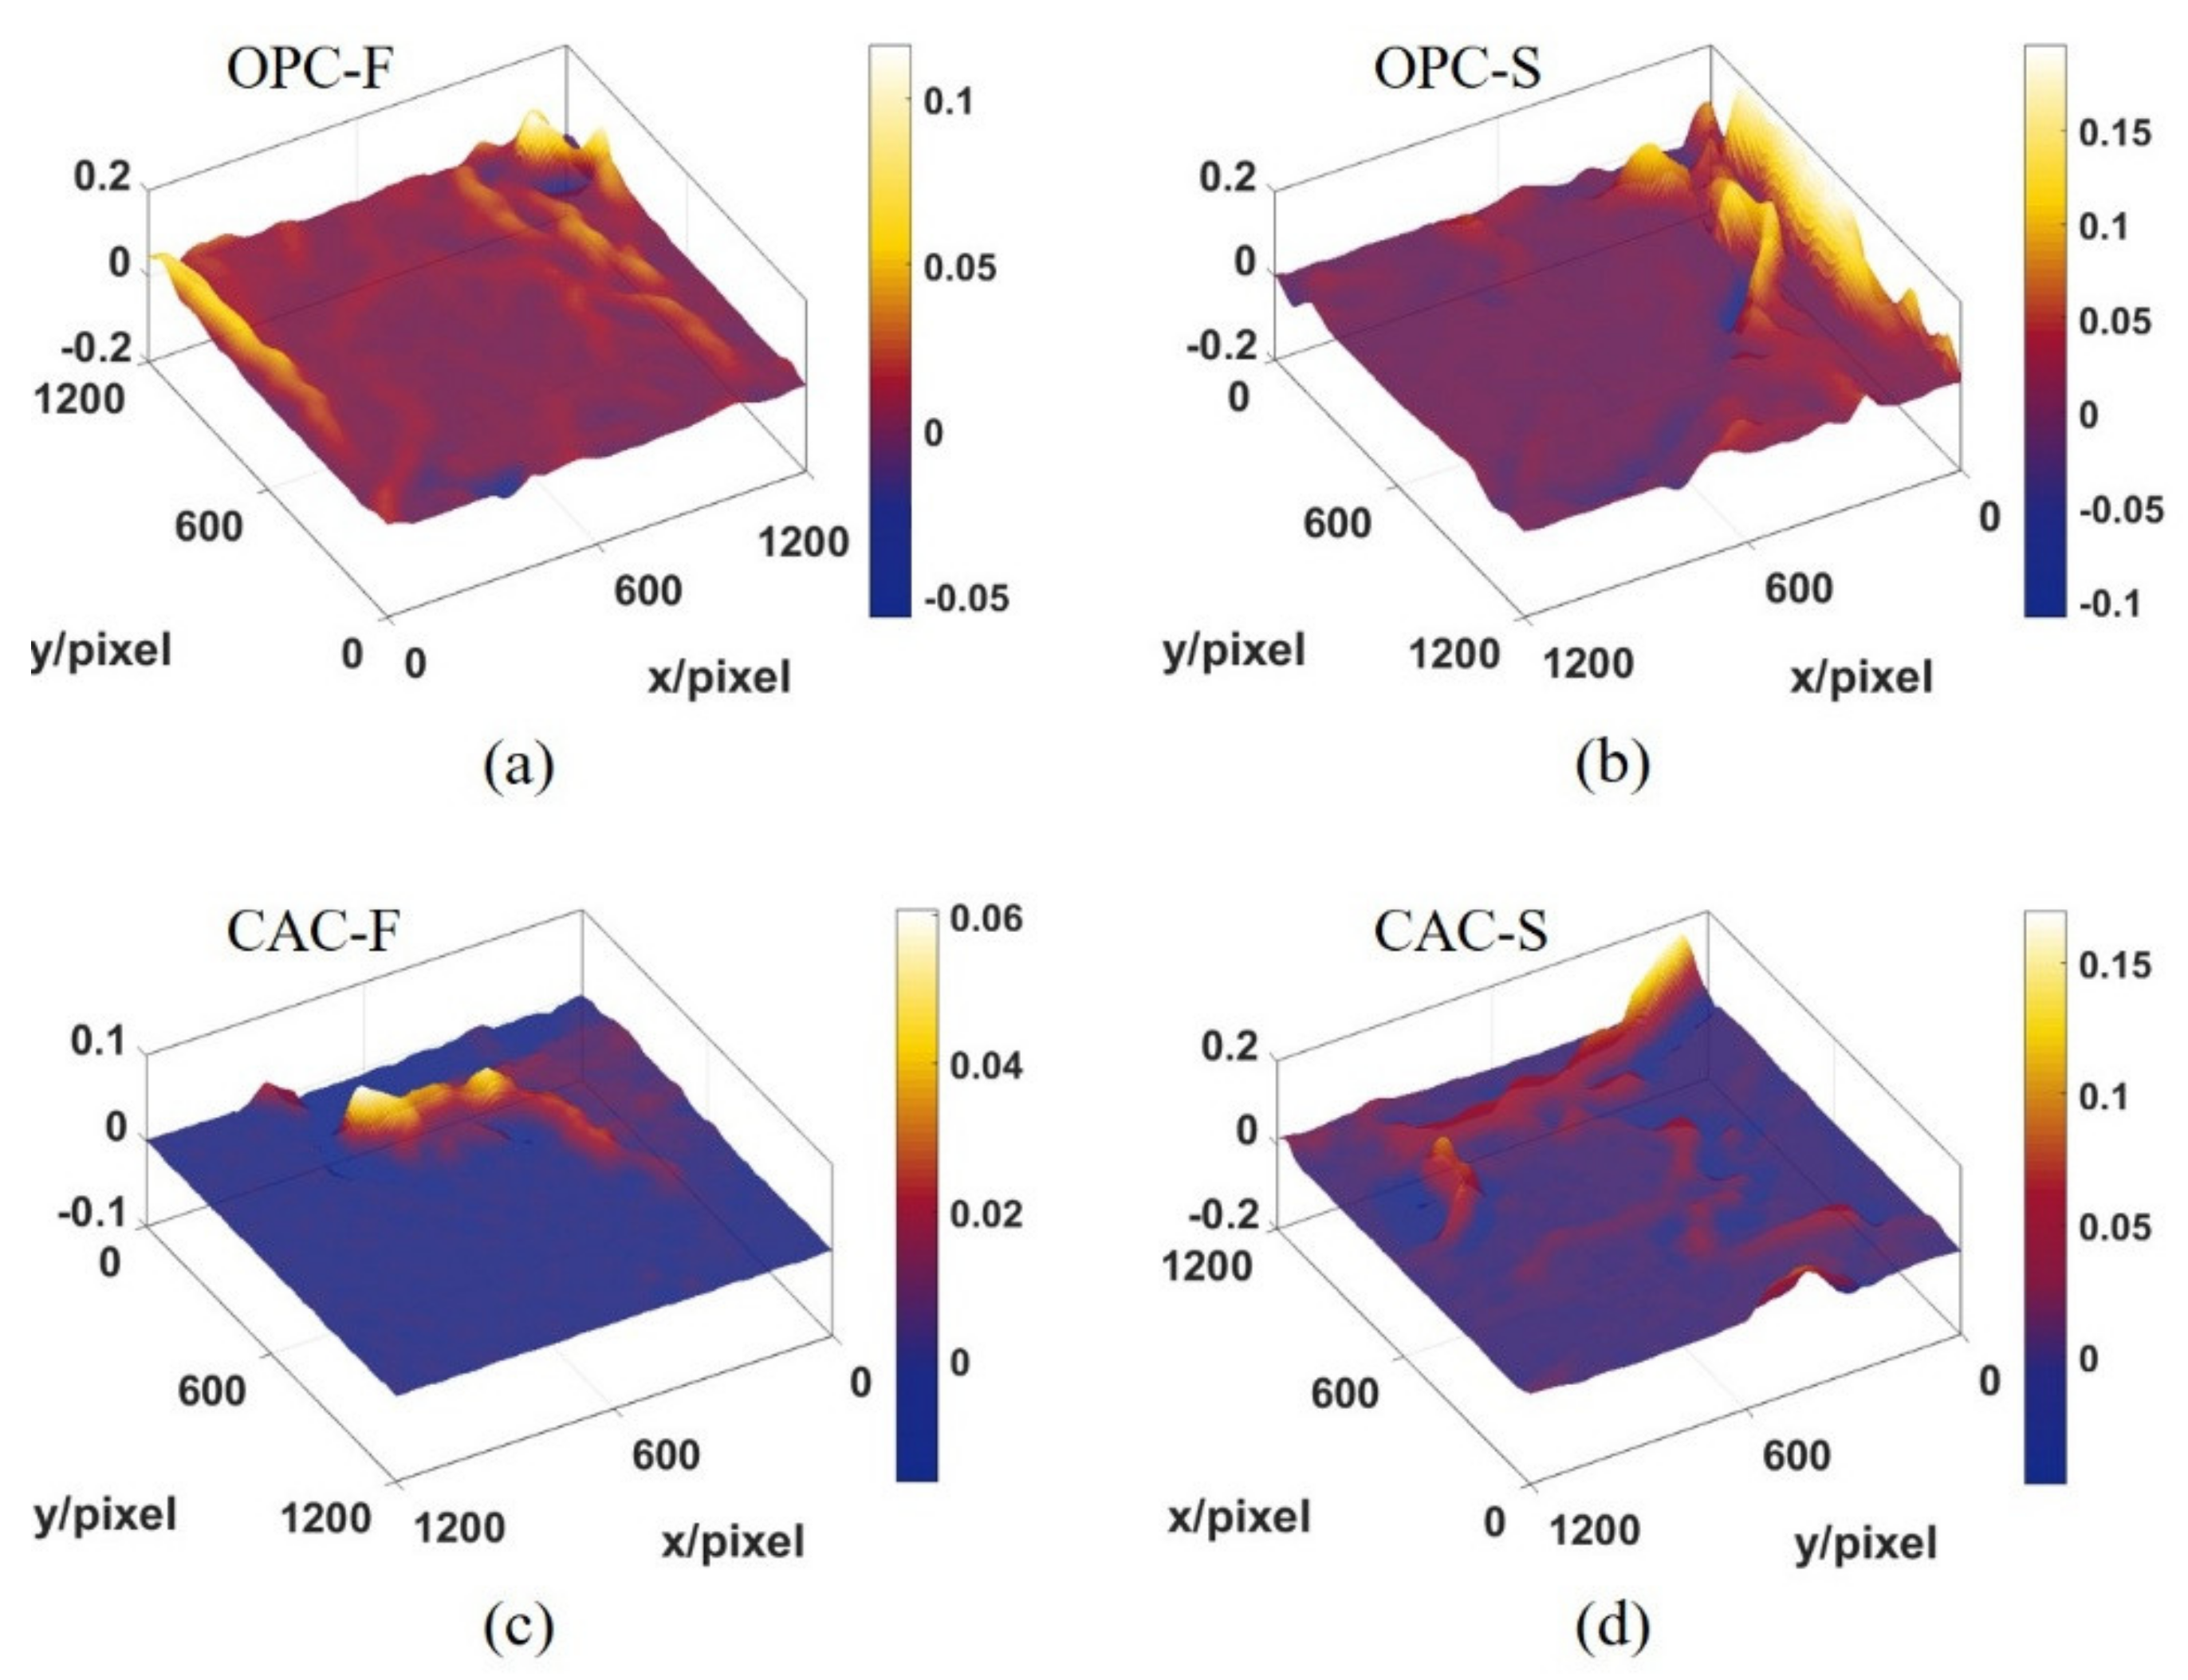
The DIC technique could be employed to obtain displacement fields of seawater concretes during the whole compressive loading process, by which the failure behavior of the samples at different loading stages could be recorded. The peak-shape region observed in the displacement field indicated the initiation of the cracks, and the displacement gradients could be used to predict the failure of concrete. The cyclo-hoop effect was observed in the displacement field of OPC-F but not found in OPC-S.
(2)
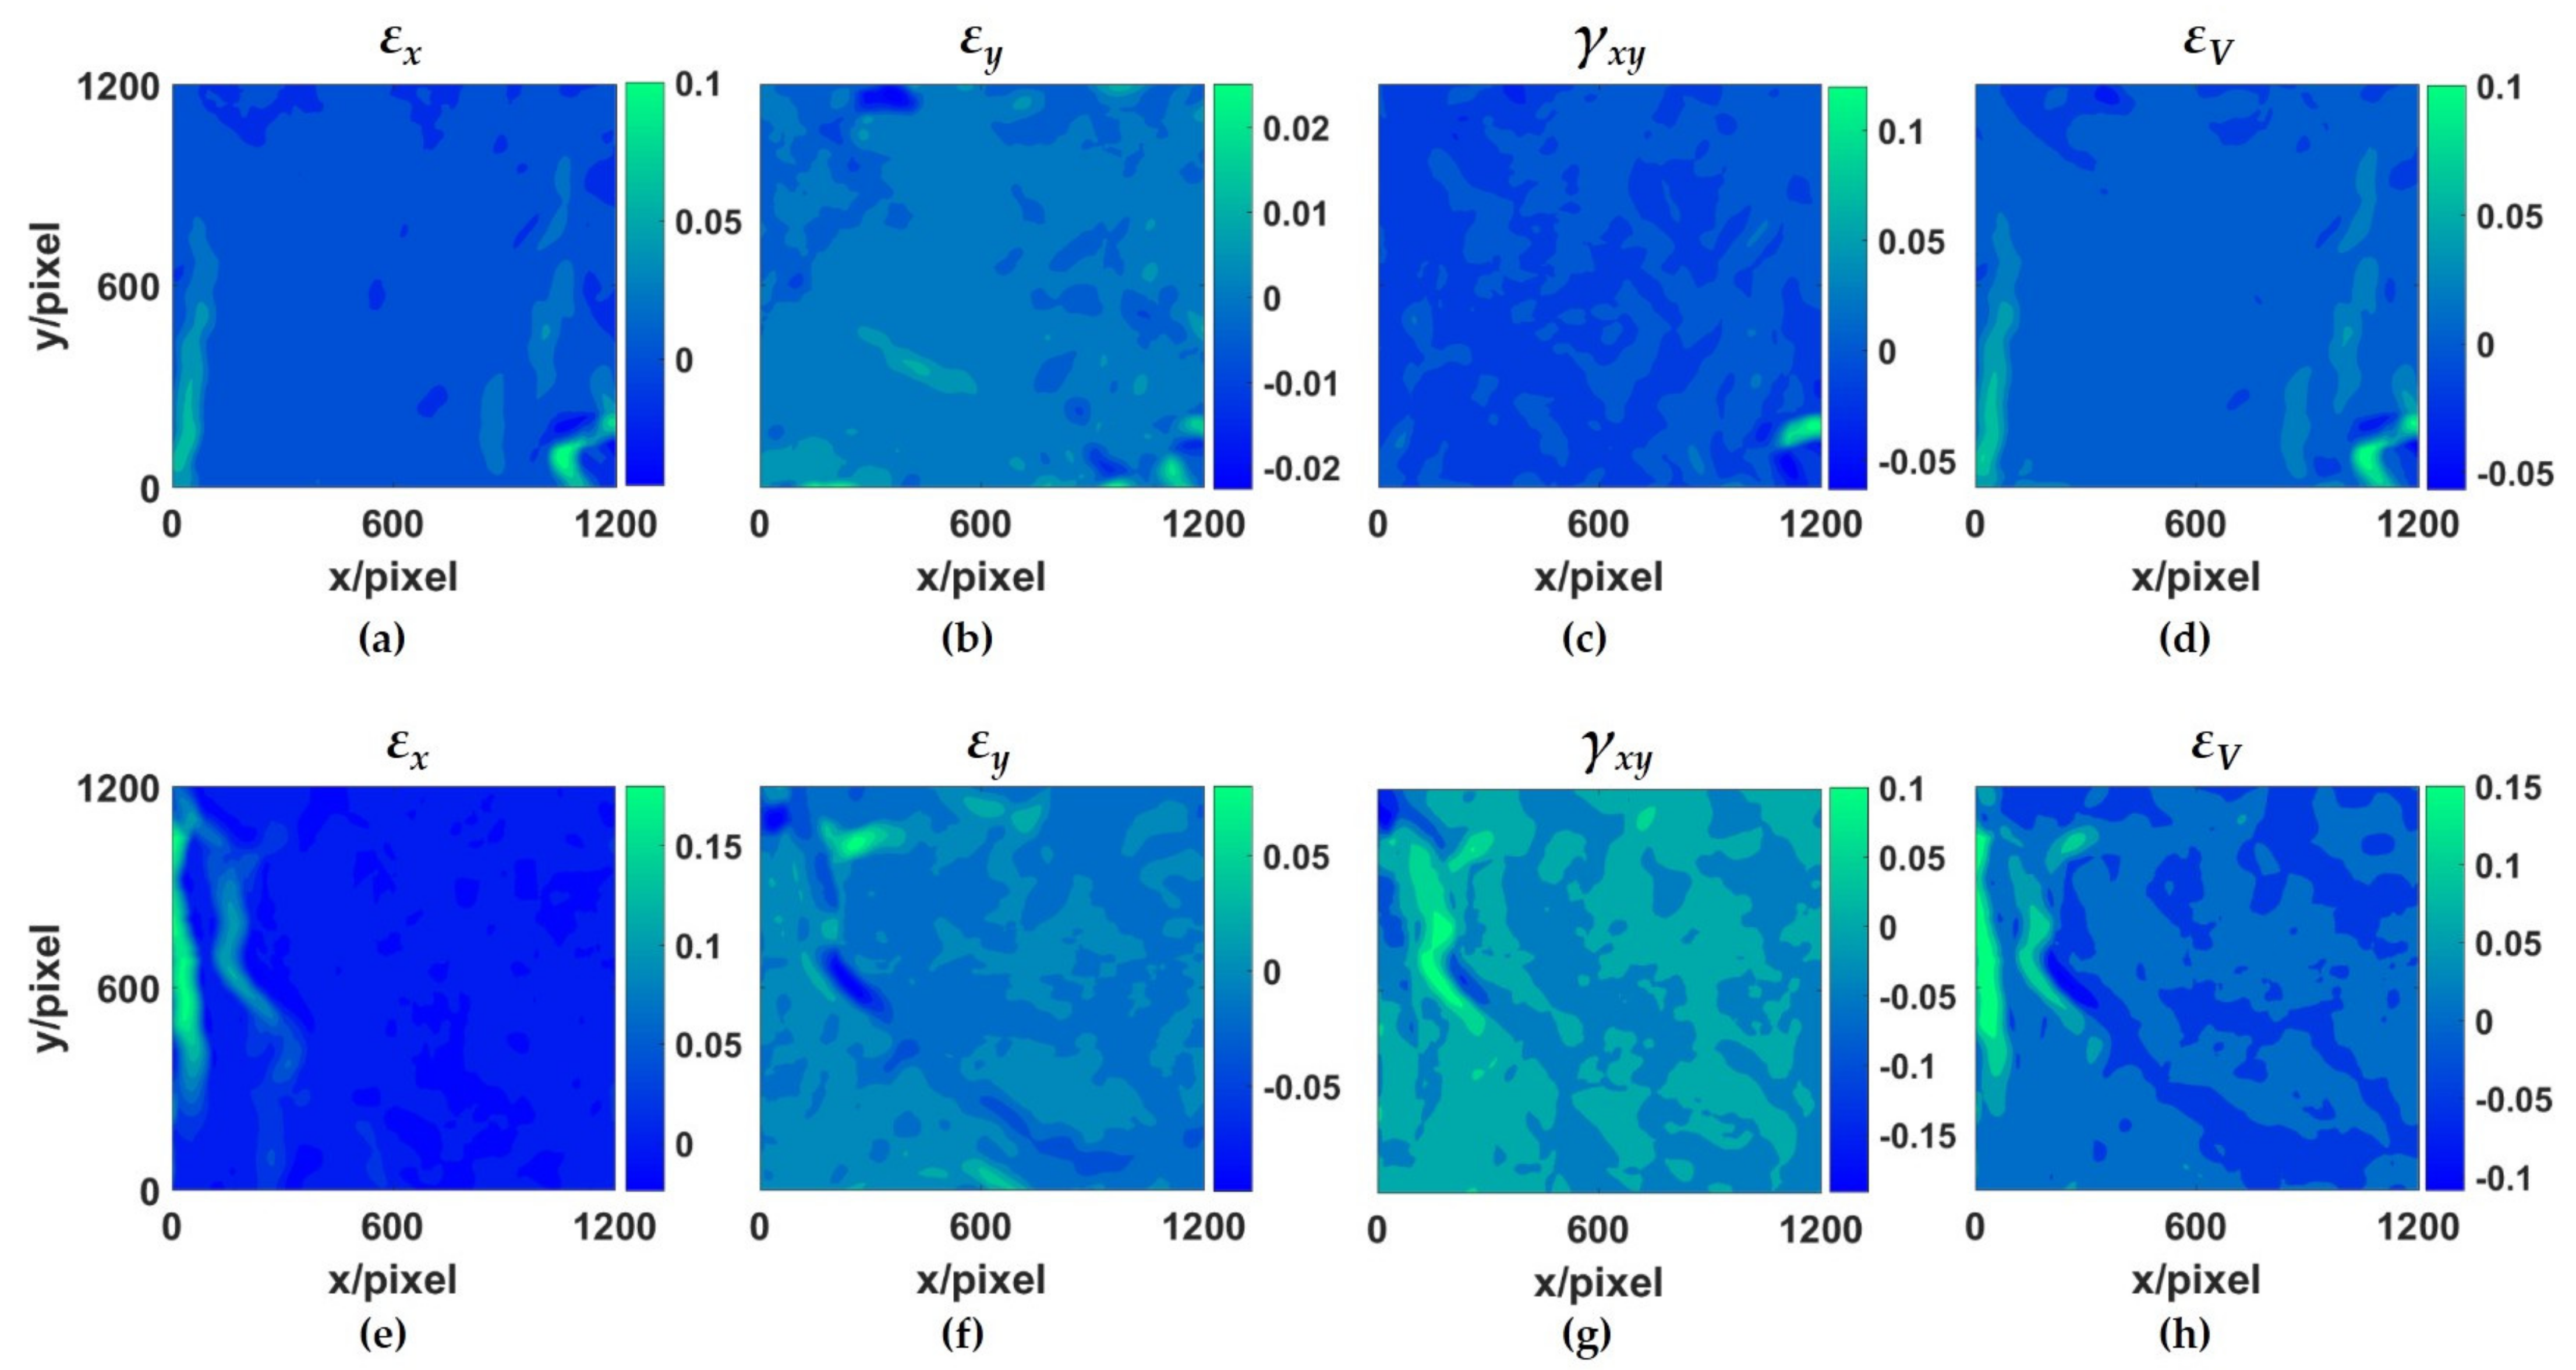
The spatial distribution of strains on the cube concrete indicated the deformation characteristics of OPC-based concretes. It was revealed that the OPC-S concrete experienced biaxial and shear deformation under uniaxial compressive load whereas the OPC-F concrete mainly experienced latitudinal tensile deformation. The OPC-S concrete presented higher compressive strength in comparison with the OPC-F concrete.
(3)
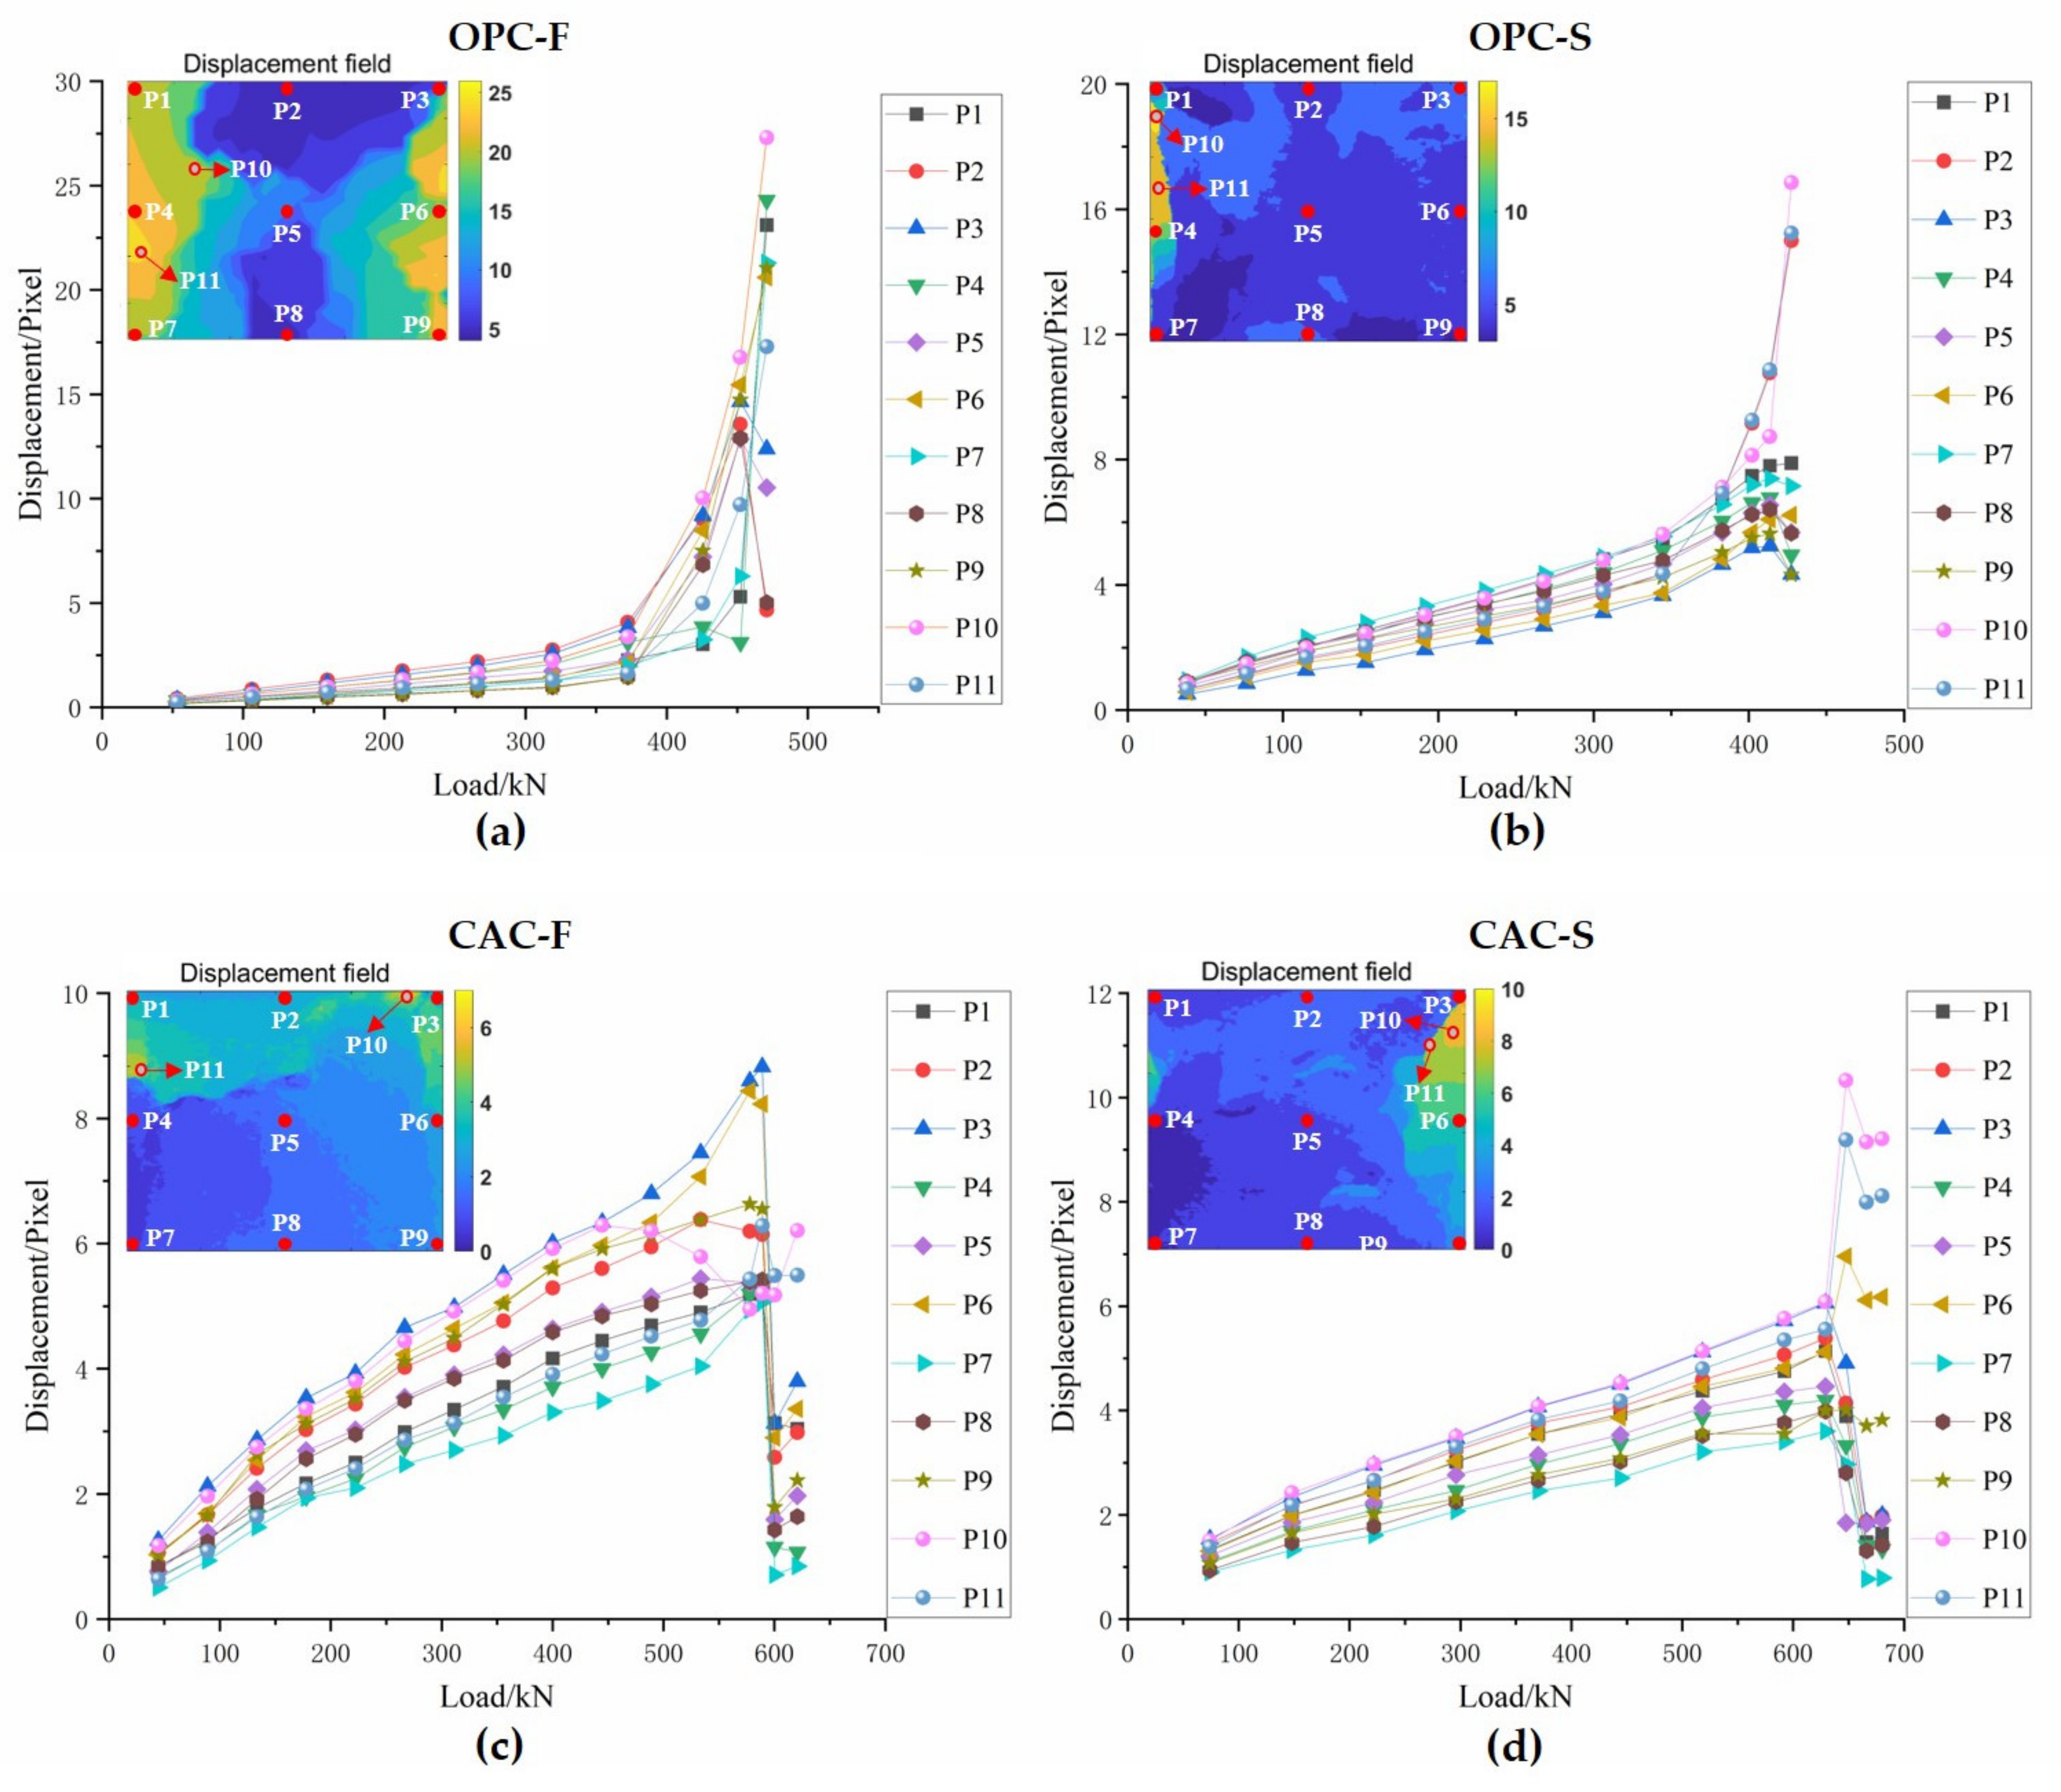
Displacement-loading curves were plotted based on the displacement data of selected points all over the concrete surface of OPC- and CAC-based concretes, indicating that the failure of the OPC-based concrete was ductile but the CAC-based concrete was brittle.
(4)
The volumetric strain fields of seawater concretes could be constructed based on the DIC strain data, by which the spatial distribution and scales of compressive-load-induced cracks could be clearly exhibited. It was demonstrated that cracks generated in OPC-S were larger and distributed more concentrated in a local region compared with OPC-F. On the contrary, cracks in CAC-S were adversely widely-spread in comparison with CAC-F.
(5)
The volumetric strain histogram percentage was introduced to quantitatively evaluate the failure behavior of four groups of seawater concrete. The distribution and percentage of volumetric strain histogram revealed that the volume change of OPC-F was much larger and had a wide distribution whereas the OPC-S presented smaller expansion. Comparatively, failure of the CAC-F concrete behaved local fracture while a larger area in CAC-S concrete expanded under the uniaxial compressive load.

Author Contributions

Conceptualization, Y.Y. and X.W.; Data curation, Y.Y. and L.W.; Funding acquisition, Y.Y.; Investigation, X.F. and J.L.; Methodology, Y.Y. and L.W.; Software, L.W. and X.F.; Supervision, Y.Y. and X.W.; Validation, L.W., Z.W. and W.M.; Visualization, W.M. and X.Y.; Writing—original draft, Y.Y.; Writing—review & editing, Y.Y. and Z.W. All authors have read and agreed to the published version of the manuscript.

Funding

This research was funded by National Natural Science Foundation of China (Grant no. 11802172), “Chenguang Program” supported by Shanghai Education Development Foundation and Shanghai Municipal Education Commission (Grant no. 18CG55), and Open Project Foundation of Shanghai Key Laboratory of Network Manufacture and Enterprise Informatization (Grant no. KT20190601).

Institutional Review Board Statement

Not applicable.

Informed Consent Statement

Not applicable.

Data Availability Statement

Not applicable.

Conflicts of Interest

The authors declare no conflict of interest.

References

  1. Ebead, U.; Lau, D.; Lollini, F.; Nanni, A.; Suraneni, P.; Yu, T. A review of recent advances in the science and technology of seawater-mixed concrete. Cem. Concr. Res. 2022, 152, 106666. [Google Scholar] [CrossRef]
  2. Khatibmasjedi, M.; Ramanathan, S.; Suraneni, P.; Nanni, A. Compressive strength development of seawater-mixed concrete subject to different curing regimes. ACI Mater. J. 2020, 117, 3–12. [Google Scholar] [CrossRef]
  3. Chen, M.; Geng, J.; Xiong, H.; Shang, T.; Xue, C.; Abbas, M. Effect of curing on mechanical properties of cement-stabilized coral sand in marine environment. Adv. Mater. Sci. Eng. 2020, 2020, 4678376. [Google Scholar] [CrossRef]
  4. Hossain, K.M.A. Pumice based blended cement concretes exposed to marine environment: Effects of mix composition and curing conditions. Cem. Concr. Compos. 2008, 30, 97–105. [Google Scholar] [CrossRef]
  5. Camba, C.; Mier, J.L.; Carral, L.; Lamas, M.I.; Alvarez, J.C.; Diaz-Diaz, A.M.; Tarrio-Saavedra, J. Erosive degradation study of concrete augmented by mussel shells for marine construction. J. Mar. Sci. Eng. 2021, 9, 1087. [Google Scholar] [CrossRef]
  6. Shao, W.; Shi, D. Numerical simulation of degradation behavior of concrete piles in sulfate saline soils. KSCE J. Civ. Eng. 2022, 26, 183–192. [Google Scholar] [CrossRef]
  7. Takahiro, N.; Nobuaki, O.; Hiroki, O.; Zoulkanel, M.G.; Tomohiro, N. Some considerations for applicability of seawater as mixing water in concrete. J. Mater. Civ. Eng. 2015, 27, B4014004. [Google Scholar]
  8. Dimri, A.; Varshney, J.K.; Verma, V.K.; Gupta, S. A review on strength of concrete in seawater. Int. J. Eng. Res. Technol. 2015, 4, 844–847. [Google Scholar]
  9. Guo, M.; Hu, B.; Xing, F.; Zhou, X.; Sun, M.; Sui, L.; Zhou, Y. Characterization of the mechanical properties of eco-friendly concrete made with untreated sea sand and seawater based on statistical analysis. Constr. Build. Mater. 2020, 234, 117339. [Google Scholar] [CrossRef]
  10. Chen, Z.; Mo, L.; Song, C.; Zhang, Y. Investigation on compression properties of seawater-sea sand concrete. Adv. Concr. Constr. 2021, 12, 93–103. [Google Scholar]
  11. Yang, S.; Xu, J.; Zang, C.; Li, R.; Yang, Q.; Sun, S. Mechanical properties of alkali-activated slag concrete mixed by seawater and sea sand. Constr. Build. Mater. 2019, 196, 395–410. [Google Scholar] [CrossRef]
  12. Xiao, J.; Huang, Y.; Yang, J.; Zhang, C. Mechanical properties of confined recycled aggregate concrete under axial compression. Constr. Build. Mater. 2012, 26, 591–603. [Google Scholar] [CrossRef]
  13. Shan, B.; Xu, C.; Lai, D.; Xiao, Y.; Li, T. Experimental research on compressive behavior of seawater and sea sand concrete-filled RPC tubes. Eng. Struct. 2020, 222, 111117. [Google Scholar] [CrossRef]
  14. Huang, Y.; He, X.; Wang, Q.; Sun, Y. Mechanical properties of sea sand recycled aggregate concrete under axial compression. Constr. Build. Mater. 2018, 175, 55–63. [Google Scholar] [CrossRef]
  15. Da, B.; Yu, H.; Ma, H.; Wu, Z. Research on compression behavior of coral aggregate reinforced concrete columns under large eccentric compression loading. Ocean Eng. 2018, 155, 251–260. [Google Scholar] [CrossRef]
  16. Li, P.; Li, W.; Sun, Z.; Shen, L.; Sheng, D. Development of sustainable concrete incorporating seawater: A critical review on cement hydration, microstructure and mechanical strength. Cem. Concr. Compos. 2021, 121, 104100. [Google Scholar] [CrossRef]
  17. Ann, K.Y.; Cho, C.G. Corrosion resistance of calcium aluminate cement concrete exposed to a chloride environment. Materials 2014, 7, 887–898. [Google Scholar] [CrossRef] [Green Version]
  18. Li, G.; Zhang, A.; Song, Z.; Shi, C.; Wang, Y.; Zhang, J. Study on the resistance to seawater corrosion of the cementitious systems containing ordinary Portland cement or/and calcium aluminate cement. Constr. Build. Mater. 2017, 157, 852–859. [Google Scholar] [CrossRef]
  19. GB/T 50107-2010; Standard for Evaluation of Concrete Compressive Strength. National Standards Committee: Beijing, China, 2010.
  20. Mohammed, T.U.; Hamada, H.; Yamaji, T. Performance of seawater-mixed concrete in the tidal environment. Cem. Concr. Res. 2004, 34, 593–601. [Google Scholar] [CrossRef]
  21. Katano, K.T.N.; Ishizeki, Y.; Iriya, K. Properties and application of concrete made with sea water and un-washed sea sand. In Proceedings of the Third International Conference on Sustainable Construction Materials and Technologies, Kyoto, Japan, 19–21 August 2013. [Google Scholar]
  22. Jiang, Y.D.; Jin, Z.; Zhao, T.; Chen, Y.; Chen, F. Strain field of reinforced concrete under accelerated corrosion by digital image correlation technique. J. Adv. Concr. Technol. 2017, 15, 290–299. [Google Scholar] [CrossRef] [Green Version]
  23. Gencturk, B.; Hossain, K.; Kapadia, A.; Labib, E.; Mo, Y.L. Use of digital image correlation technique in full-scale testing of prestressed concrete structures. Measurement 2014, 47, 505–515. [Google Scholar] [CrossRef]
  24. Yuan, Y.; Huang, J.; Peng, X.; Xiong, C.; Fang, J.; Yuan, F. Accurate displacement measurement via a self-adaptive digital image correlation method based on a weighted ZNSSD criterion. Opt. Laser. Eng. 2014, 52, 75–85. [Google Scholar] [CrossRef]
  25. Perez, V.Q.; Prieto, D.C.; Zapata, L.E. Mechanical characterization of self-compacting steel fiber reinforced concrete using digital image correlation. Eng. Fract. Mech. 2021, 246, 107618. [Google Scholar] [CrossRef]
  26. Yuan, Y.; Zhan, Q.; Xiong, C.; Huang, J. Digital image correlation based on a fast convolution strategy. Opt. Laser. Eng. 2017, 97, 52–61. [Google Scholar] [CrossRef]
  27. Li, S.; Chen, X.; Feng, L.; Zhang, X.; Fan, X.; Lu, J. Experimental study on concrete fracture process zone using digital image correlation technique. J. Test. Eval. 2021, 49, 896–914. [Google Scholar] [CrossRef]
  28. Sharafisafa, M.; Aliabadian, Z.; Shen, L. Crack initiation and failure of block-in-matrix rocks under Brazilian test using digital image correlation. Theor. Appl. Fract. Mec. 2020, 109, 102743. [Google Scholar] [CrossRef]
  29. Gehri, N.; Mata-Falcon, J.; Kaufmann, W. Automated crack detection and measurement based on digital image correlation. Constr. Build. Mater. 2020, 256, 119383. [Google Scholar] [CrossRef]
  30. Dzaye, E.D.; Tsangouri, E.; De Schutter, G.; Aggelis, D.G. Full-Field Settlement measurement at fresh cementitious material by digital image correlation. J. Adv. Concr. Technol. 2019, 17, 168–176. [Google Scholar] [CrossRef]
  31. Yu, X.; Sun, L.; Yang, F. Study on mechanical properties of confined concrete based on digital image correlation technology. Rev. Rom. Mater. 2018, 48, 53–57. [Google Scholar]
  32. Boulekbache, B.; Hamrat, M.; Chemrouk, M.; Amziane, S. Failure mechanism of fibre reinforced concrete under splitting test using digital image correlation. Mater. Struct. 2015, 48, 2713–2726. [Google Scholar] [CrossRef]
  33. Shah, S.G.; Kishen, J.M.C. Fracture Properties of concrete-concrete interfaces using digital image correlation. Exp. Mech. 2011, 51, 303–313. [Google Scholar] [CrossRef]
  34. Xie, Z.; Zhou, H.; Lu, L.; Chen, Z. An investigation into fracture behavior of geopolymer concrete with digital image correlation technique. Constr. Build. Mater. 2017, 155, 371–380. [Google Scholar] [CrossRef]
  35. GB 50010-2010; Code for Design of Concrete Structures. National Standards Committee: Beijing, China, 2015.
  36. GB/T176-2017; Methods for Chemical Analysis of Cement. National Standards Committee: Beijing, China, 2017.
  37. Wang, X. Volume change of heterogeneous quasi-brittle materials in uniaxial compression. J. Wuhan Univ. Technol.-Mat. Sci. Edit. 2006, 21, 162. [Google Scholar]
Figure 1. Fabrication and preparation of seawater concrete specimen. (a) Stirring, (b) filling and vibration, (c) curing of the cube concrete specimens, and (d) preparation of specimen for DIC measurement with speckle pattern sprayed on the front surface of concrete.
Jmse 10 00518 g001
Figure 2. Full-field optical deformation measurement system consisted of uniaxial compressive loading and optical image capturing setup for the seawater concrete.
Jmse 10 00518 g002
Figure 3. Digital speckle image capturing and schematic of DIC method for the concrete specimen. (a) Diagram of experimental setup; (b) correlation registration schematic based on DIC technique.
Jmse 10 00518 g003
Figure 4. Full-field displacement of OPC (ordinary Portland cement)-based seawater concrete at four loading stages of 30% fu, 70% fu, 90% fu and 100% fu (fu denoted the peak load of concrete). (ad) Displacement fields of OPC-based concrete cured in freshwater condition (denoted as OPC-F); (eh) Displacement fields of OPC-based concrete cured in seawater condition (denoted as OPC-S).
Jmse 10 00518 g004
Figure 5. Normal strain (εx, εy), shear strain (γxy) and volumetric strain (εV) of OPC-based concretes at peak loads. (ad) OPC-F; (eh) OPC-S.
Jmse 10 00518 g005
Figure 6. Displacement–loading curves of 11 typical points (Pi (i = 1,2,…,9) were four corners, middle points of four edges and the whole surface; P10 and P11 were two locations with larger displacement values) selected on the front surface of (a) OPC-F, (b) OPC-S, (c) CAC-F and (d) CAC-S.
Jmse 10 00518 g006
Figure 7. Volumetric strain fields of (a) OPC-F, (b) OPC-S, (c) CAC-F and (d) CAC-S at peak load, respectively.
Jmse 10 00518 g007
Figure 8. Fractured concrete cubes. (a) OPC-F, (b) OPC-S, (c) CAC-F, and (d) CAC-S.
Jmse 10 00518 g008
Figure 9. Histogram percentage of Volumetric strain for (a) OPC-F, (b) OPC-S, (c) CAC-F and (d) CAC-S, respectively, with the increase of compressive load.
Jmse 10 00518 g009
Table 1. Mix proportion of two sets of seawater concrete.
Mix Ingredients Mix Proportion (kg/m3)
Cement (OPC/CAC)525
Coarse aggregate (gravel)1130
Fine aggregate (sand)484
Mixing water (seawater)220
Water reducer1
Table 2. Components and physical properties of cement.
CementComponentsSpecific Surface Area/(m2/kg)Density/(kg/m3)
CaOSiO2Al2O3Fe2O3MgONa2OK2OS2O3
OPC (%)55.2723.857.523.002.320.370.591.064306300
CAC (%)32.077.8452.012.821.110.280.290.403506100
Table 3. Peak loads of four sets of seawater concrete.
Seawater Concrete SamplePeak Load (kN)Coefficient of VariationS/F (%)
OPC-F411.2 ± 45.20.01631.0058
OPC-S413.6 ± 37.30.0148
CAC-F589.1 ± 57.20.01281.0681
CAC-S629.2 ± 81.60.0144
Publisher’s Note: MDPI stays neutral with regard to jurisdictional claims in published maps and institutional affiliations.

