
Deep-Sea Sediment and Water Simulator for Investigation of Methane Seeping and Hydrate Formation


Abstract
:1. Introduction
2. Apparatus and Methods
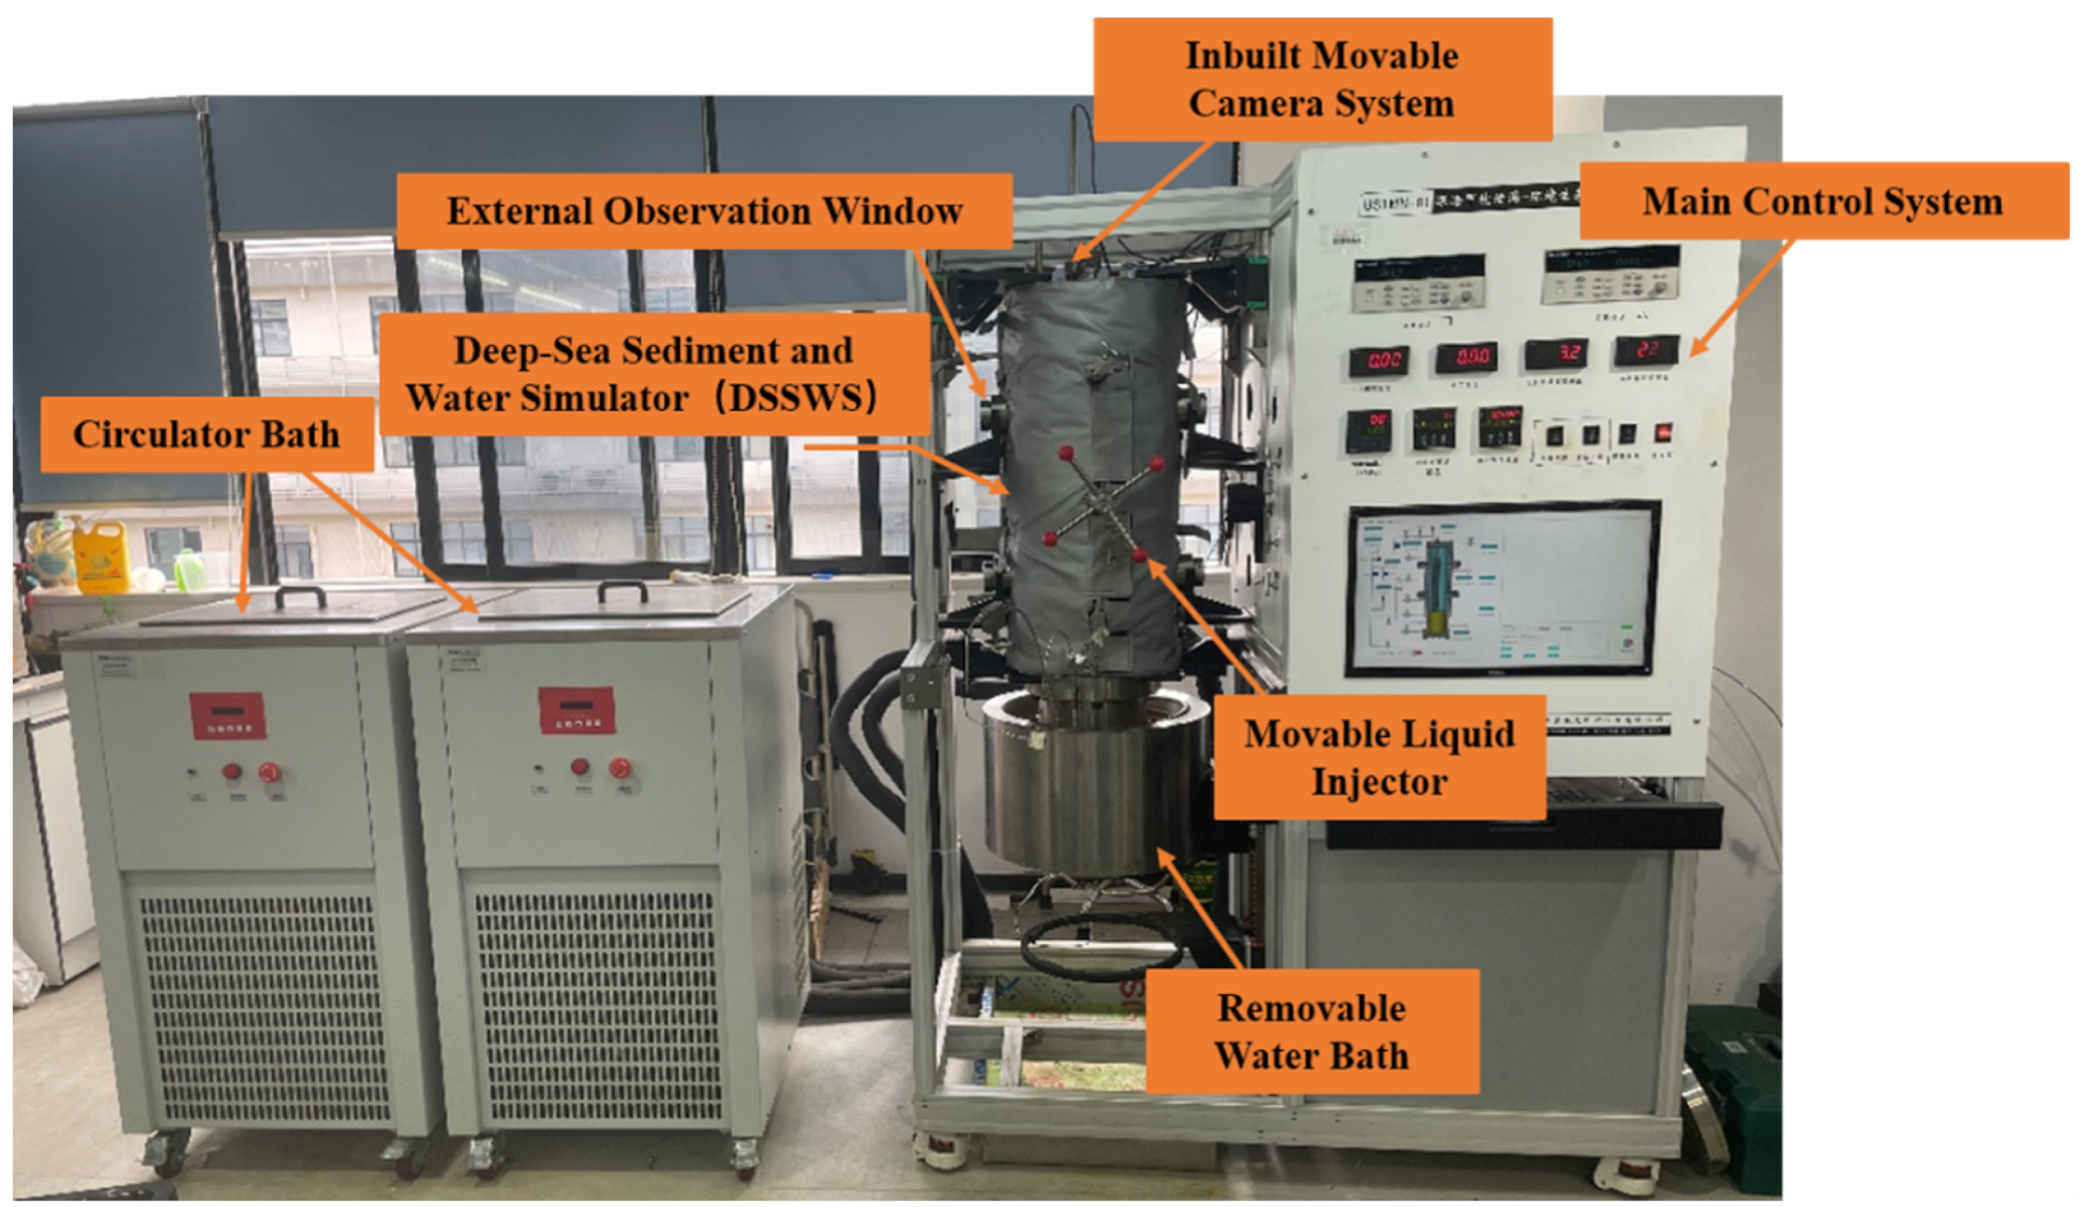
2.1. Apparatus Description
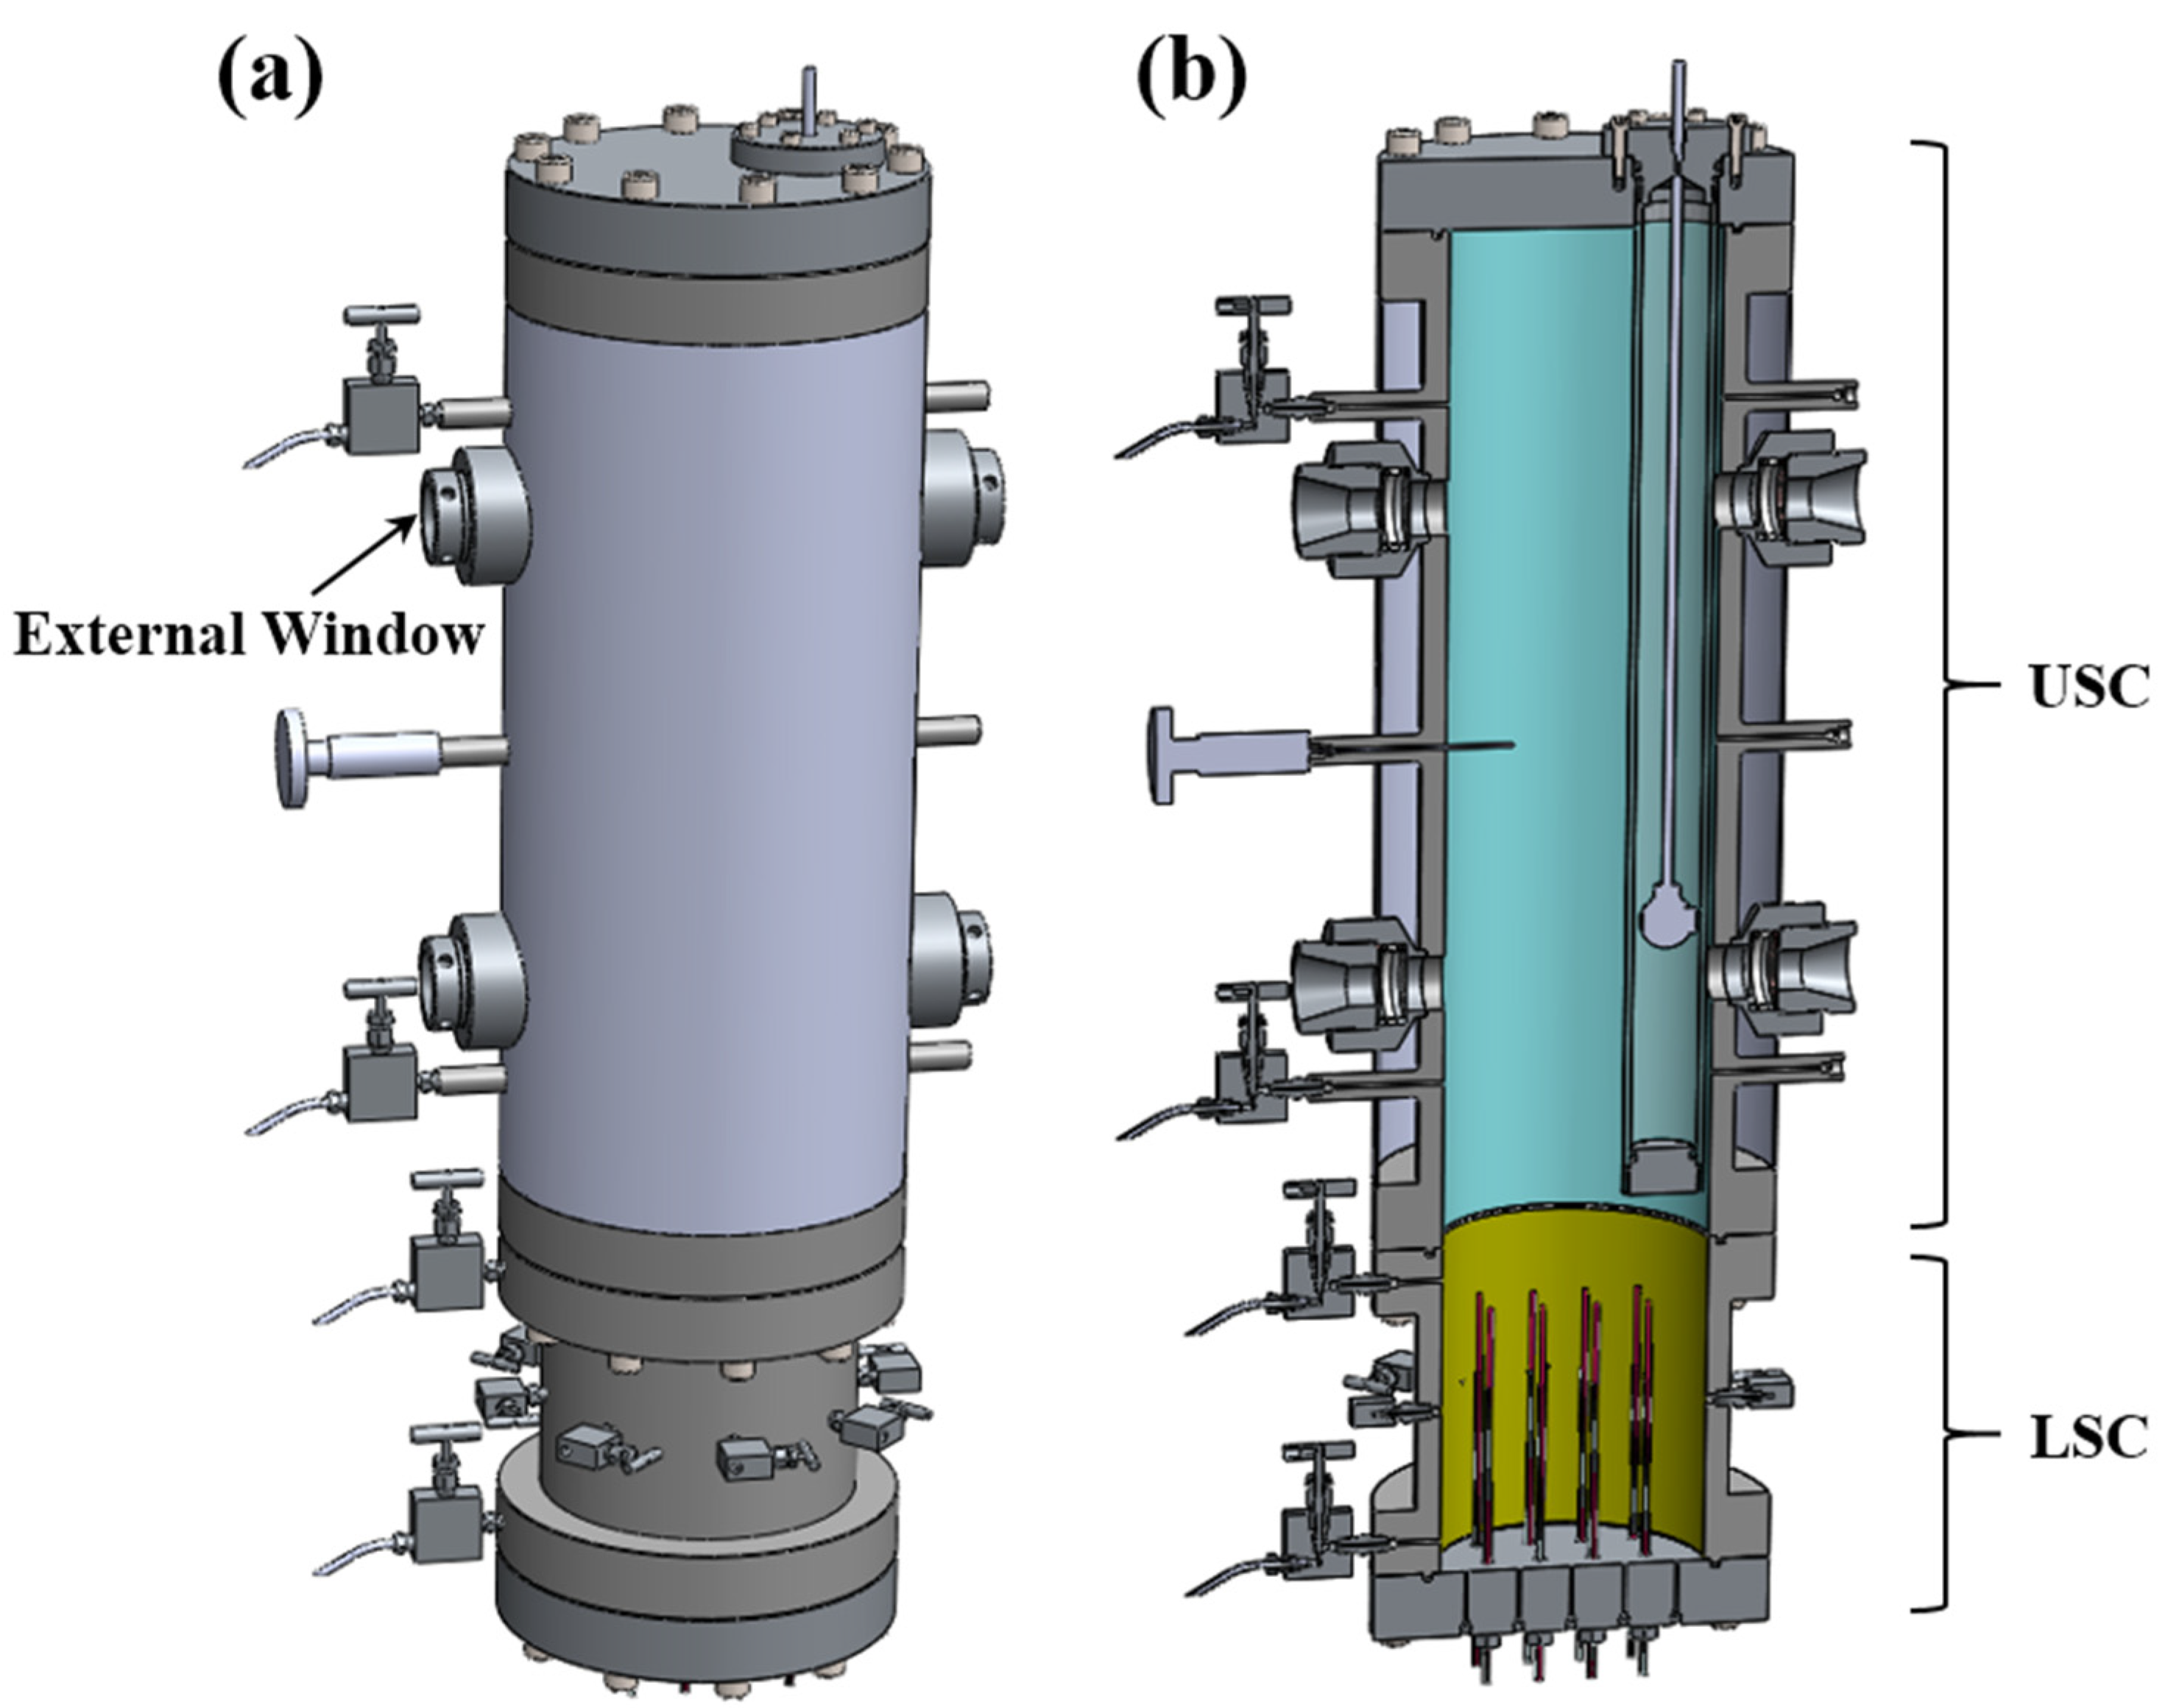
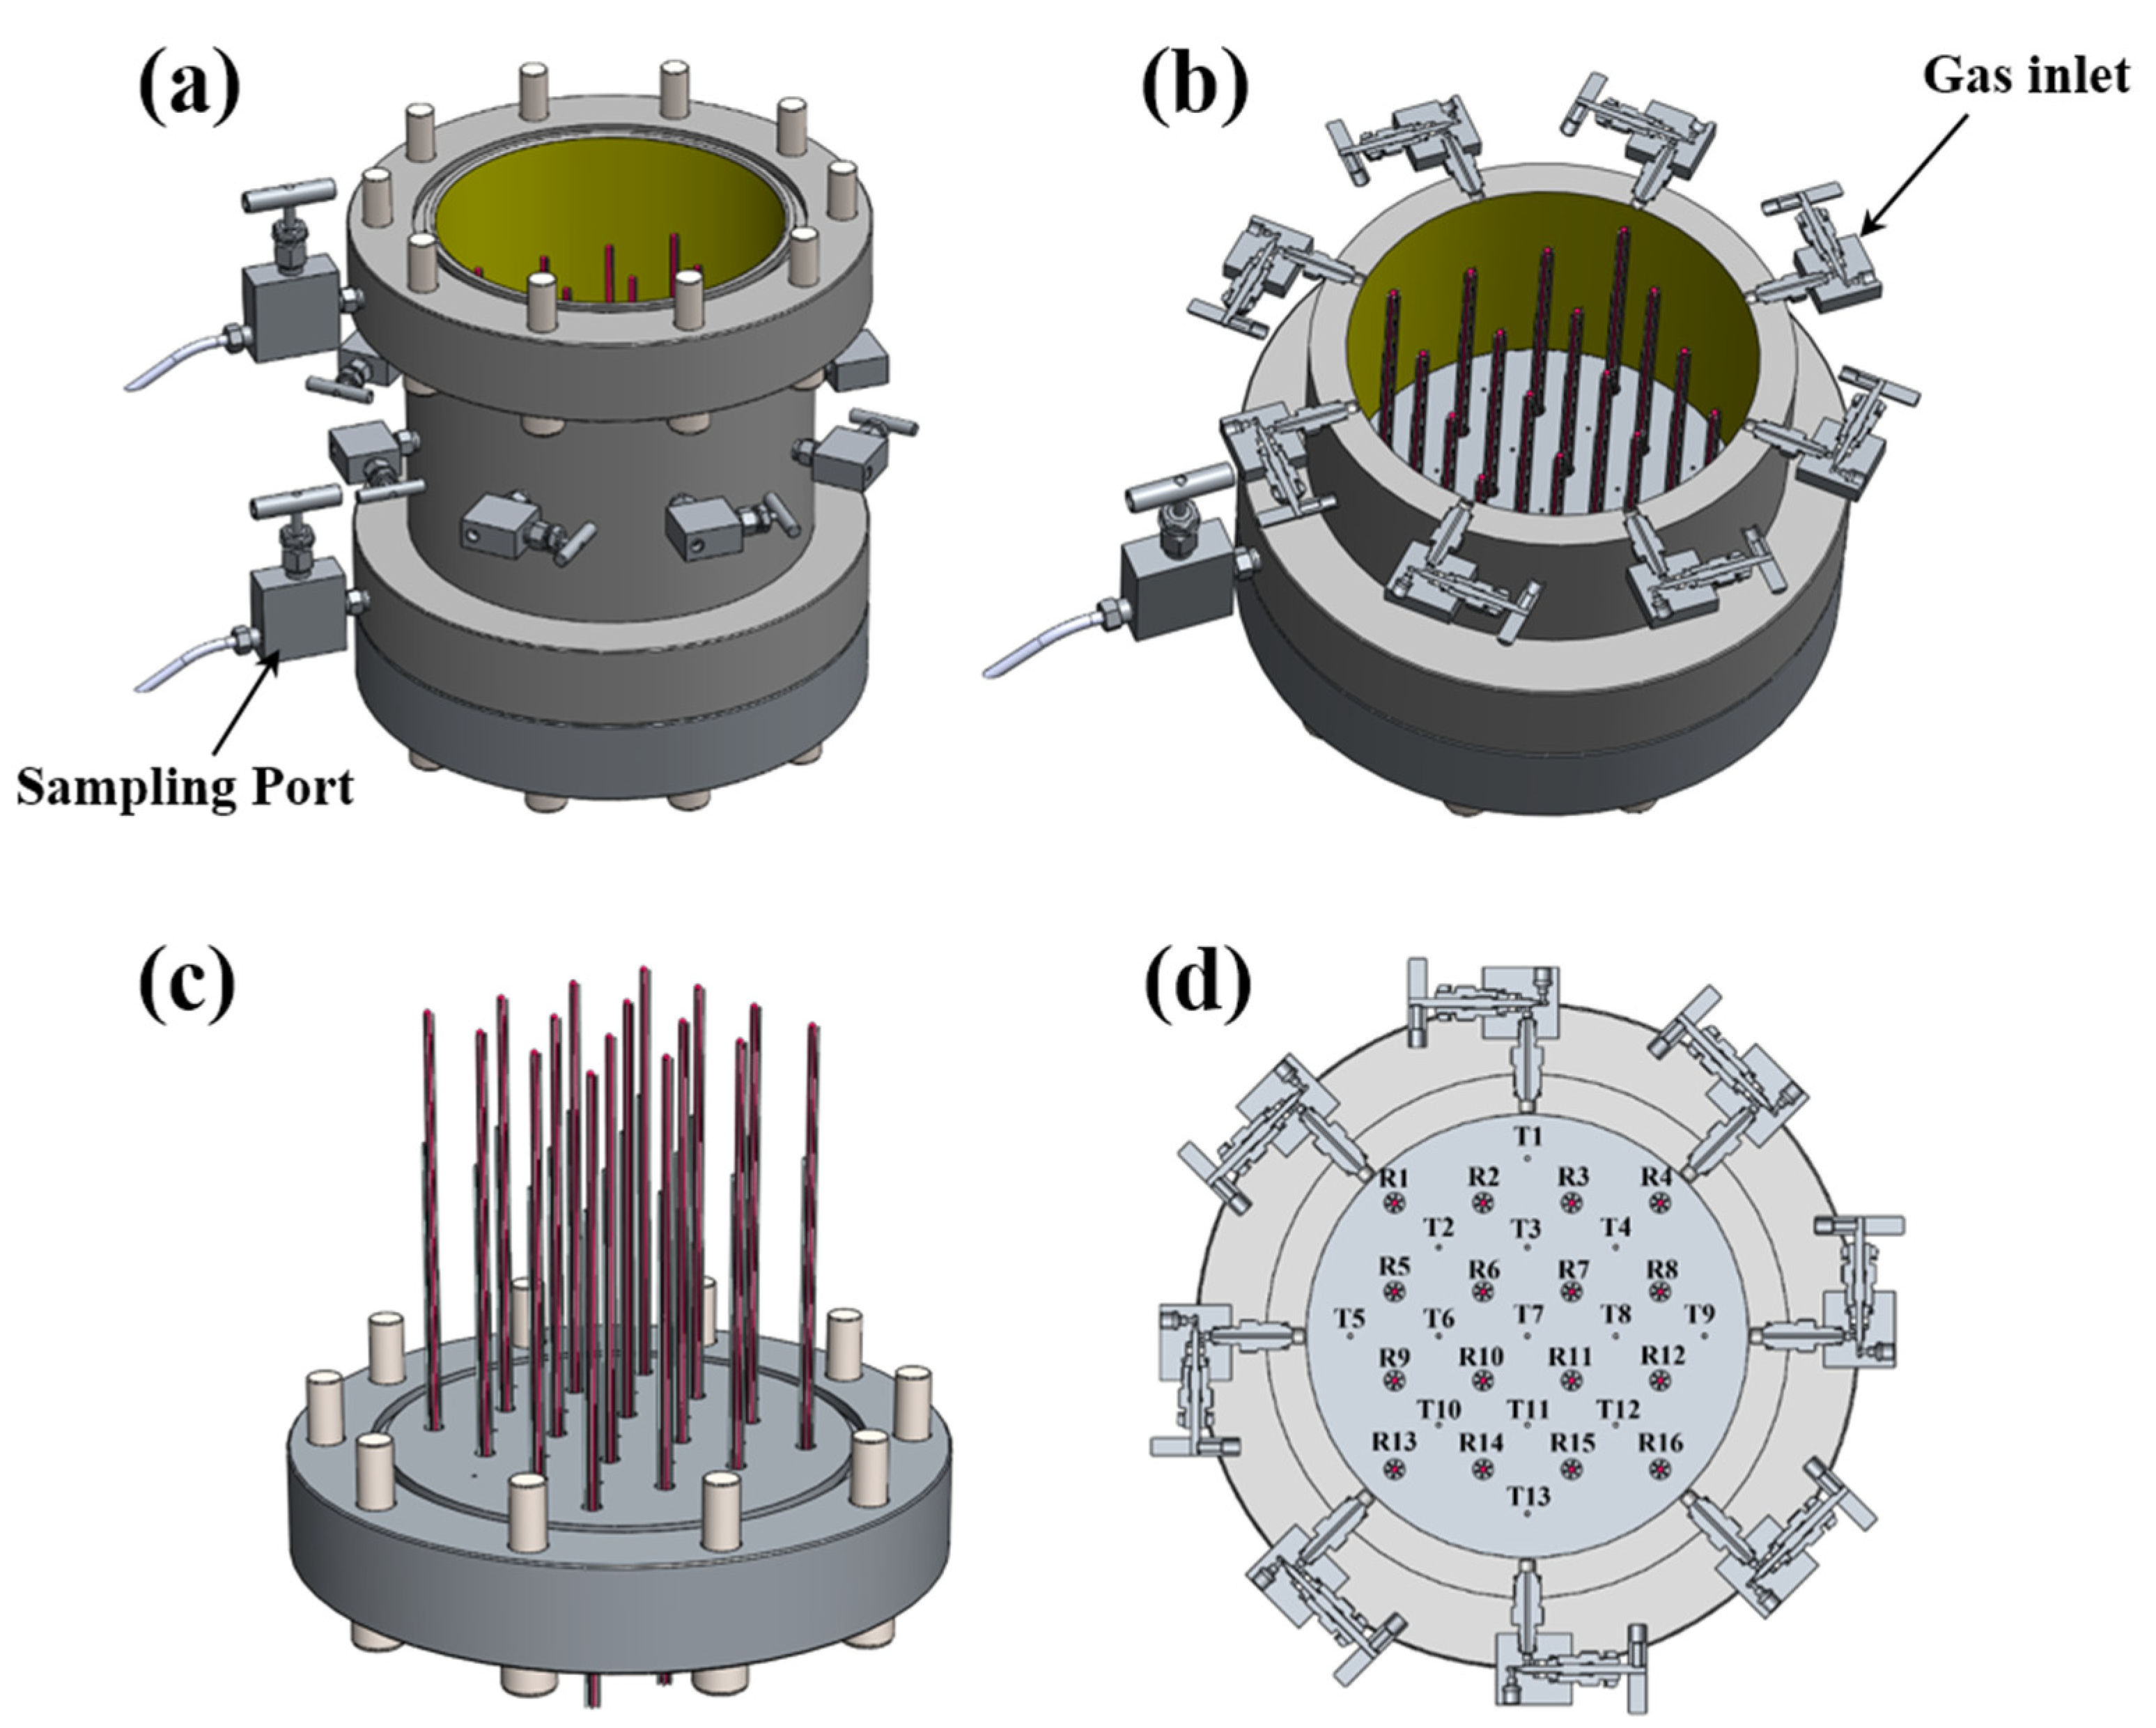
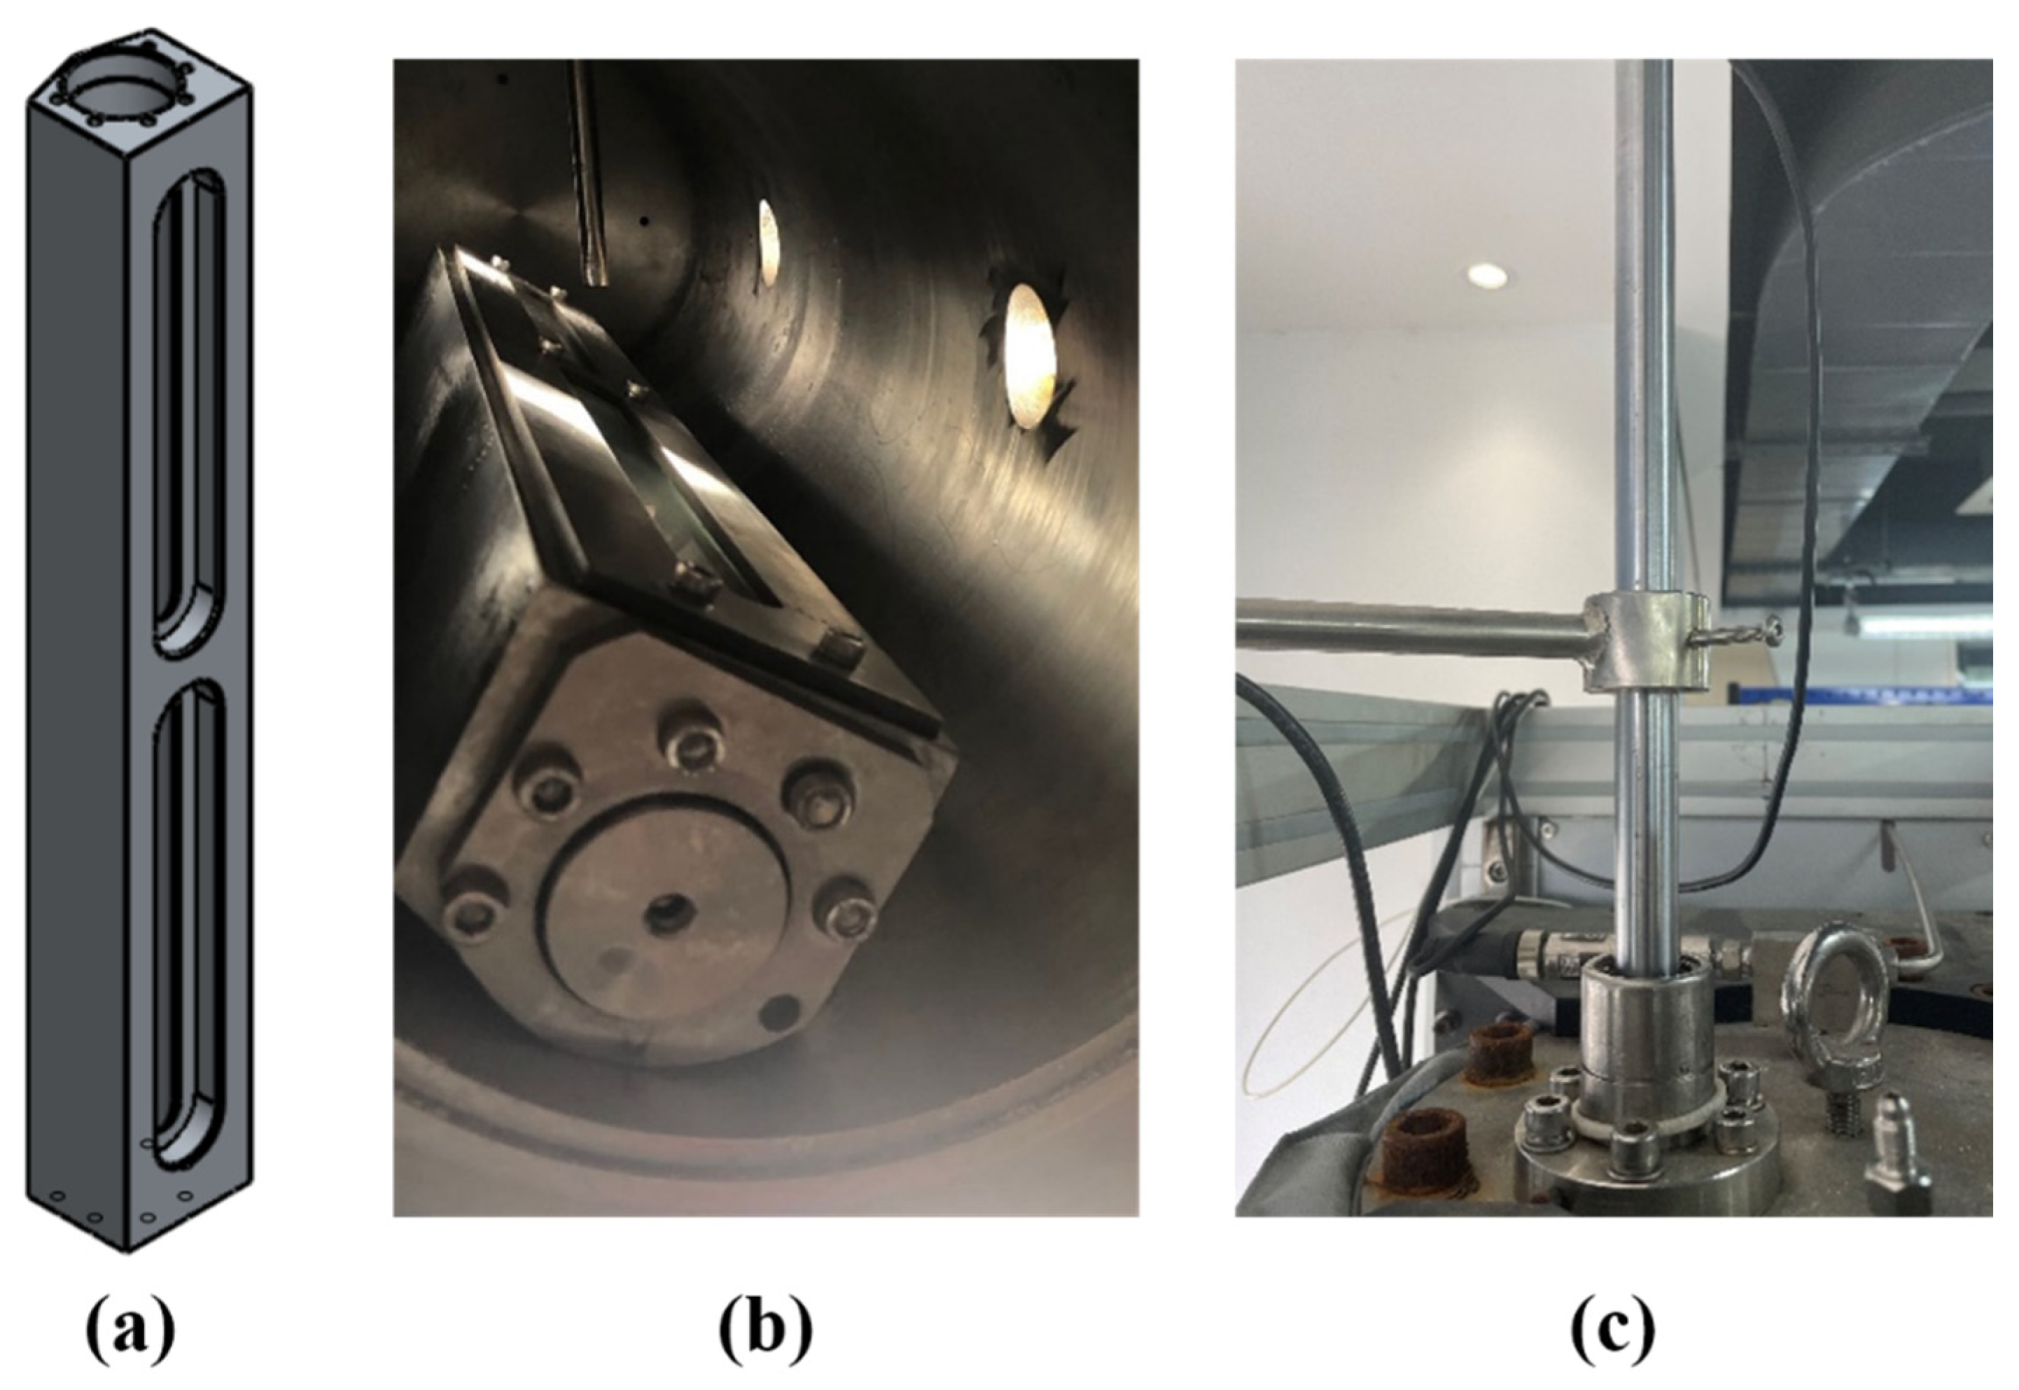
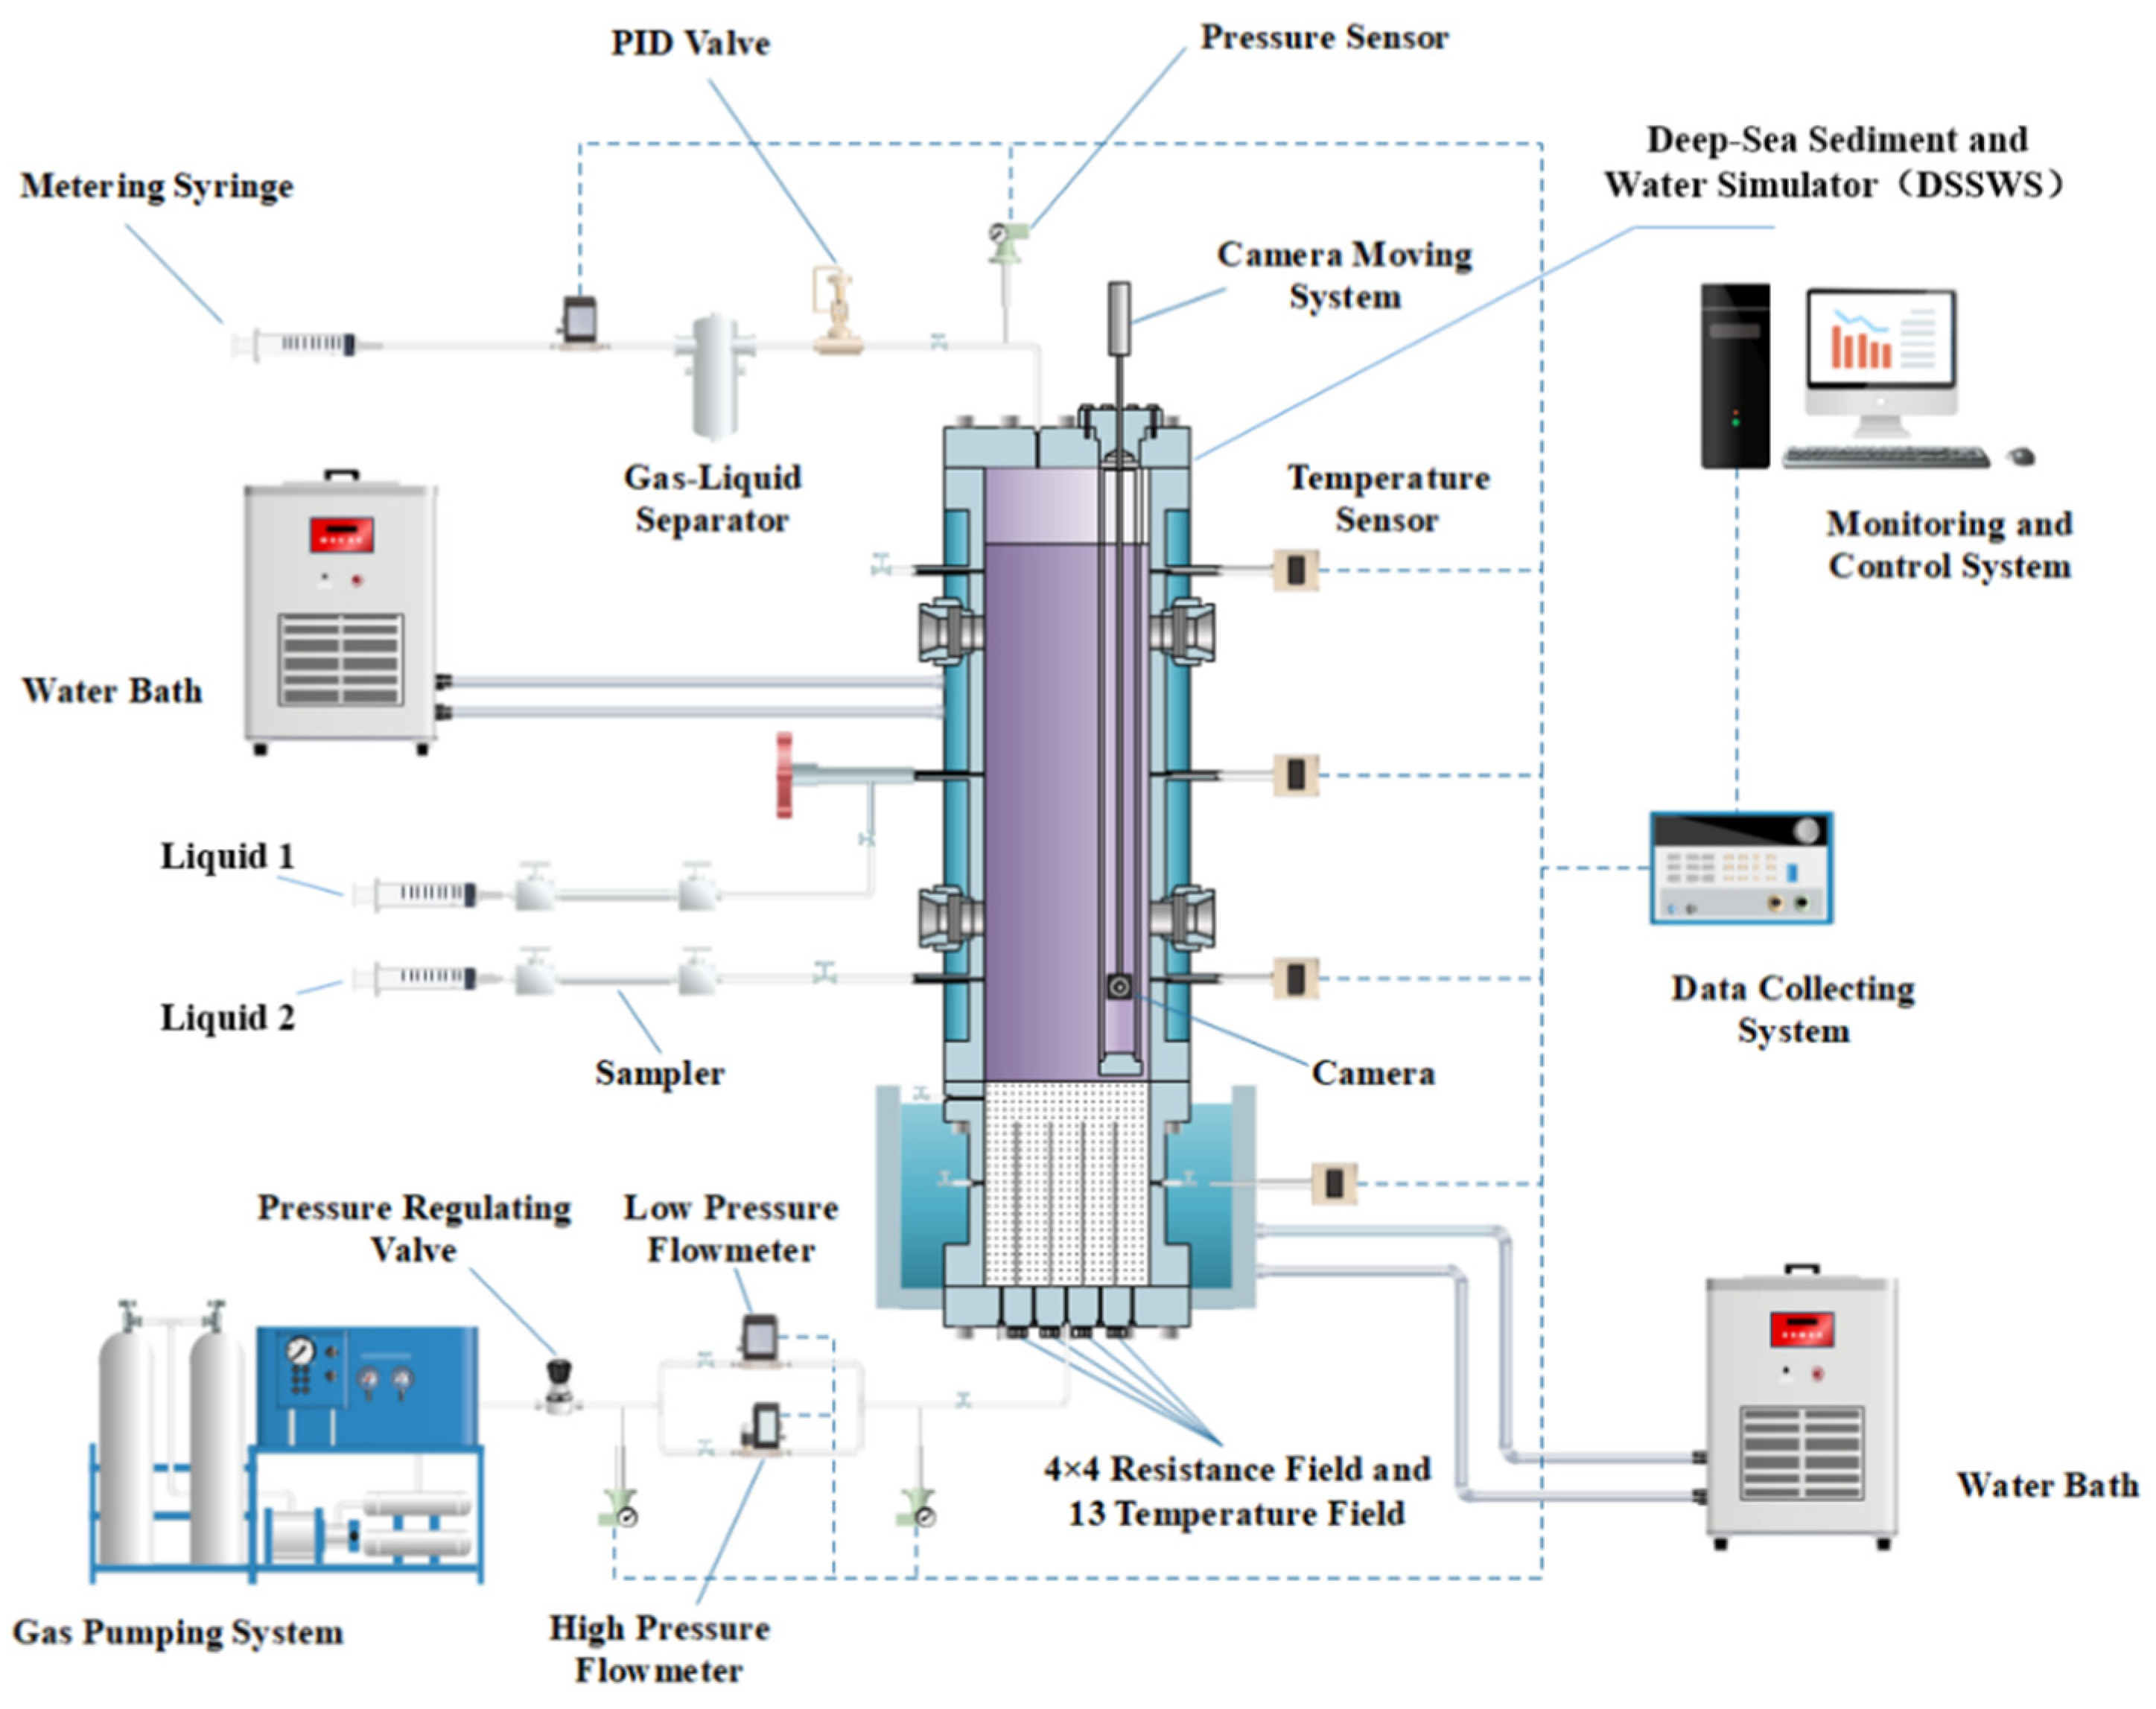
2.1.1. Deep-Sea Sediment and Water Simulator (DSSWS)
2.1.2. Temperature, Gas Flow, and Pressure Control System
3. Experimental Validation for Methane Seeping and Hydrate Formation
3.1. Experimental Methods
3.2. Experimental Results
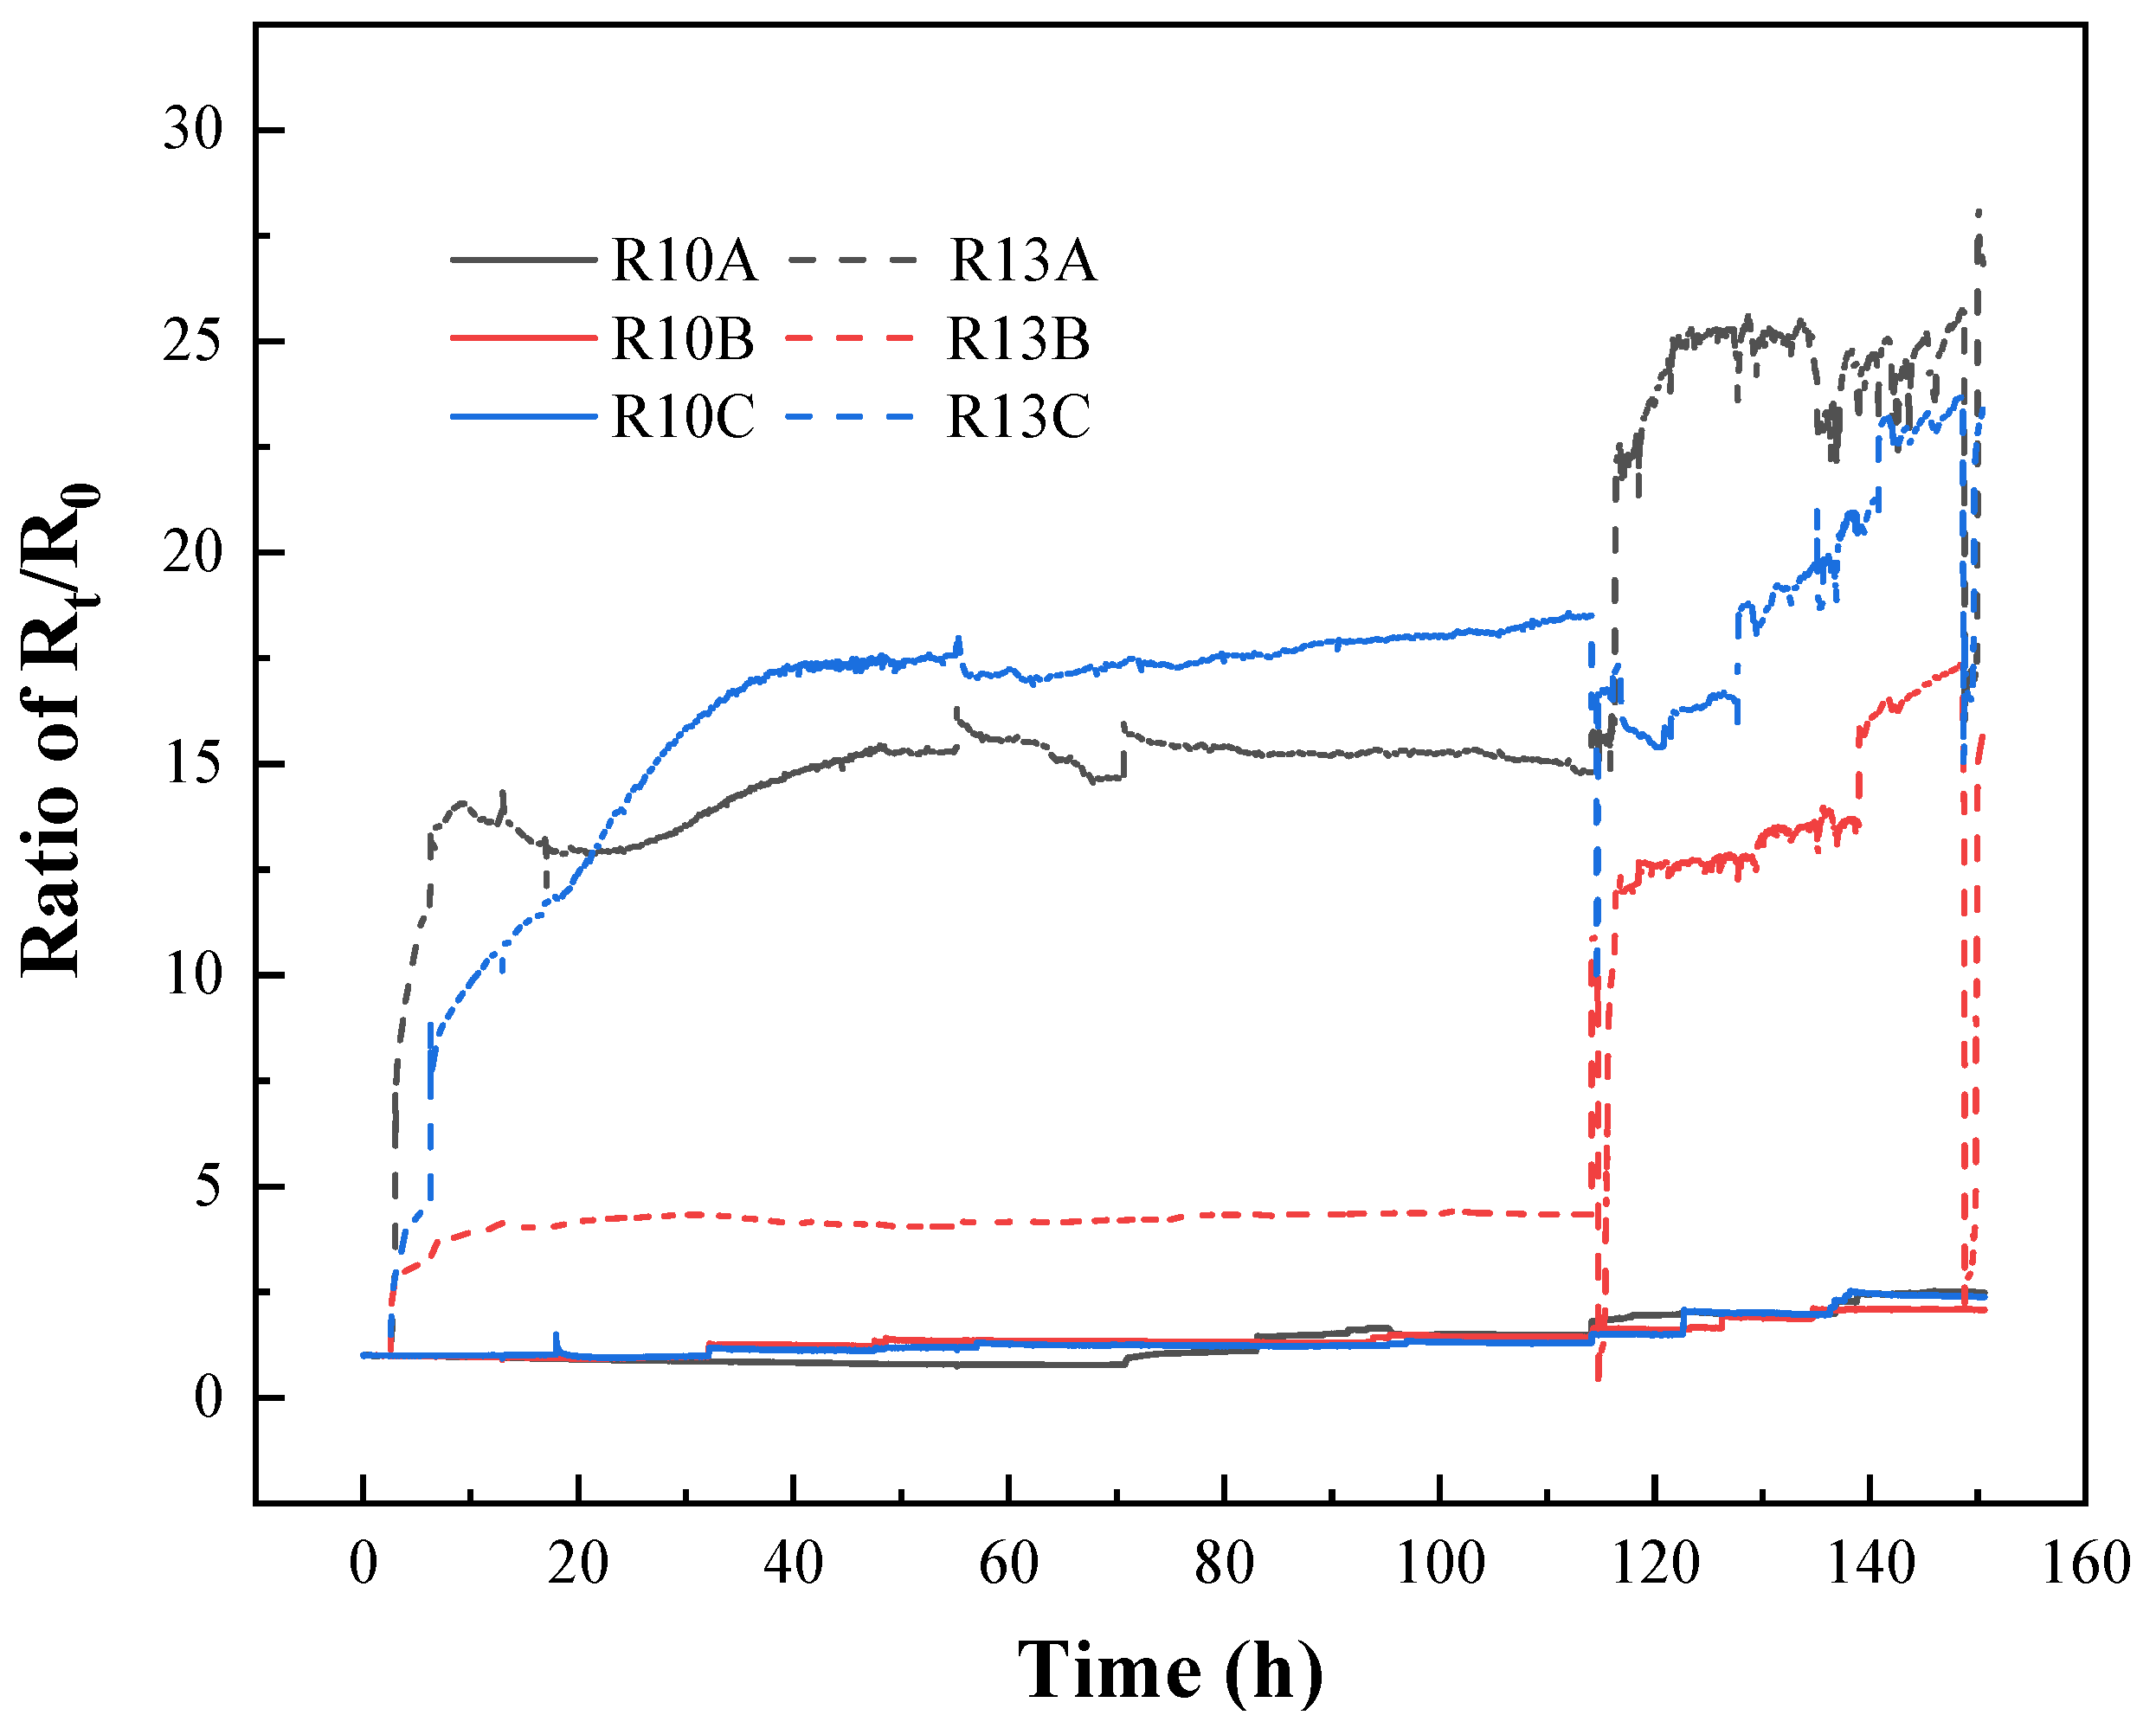
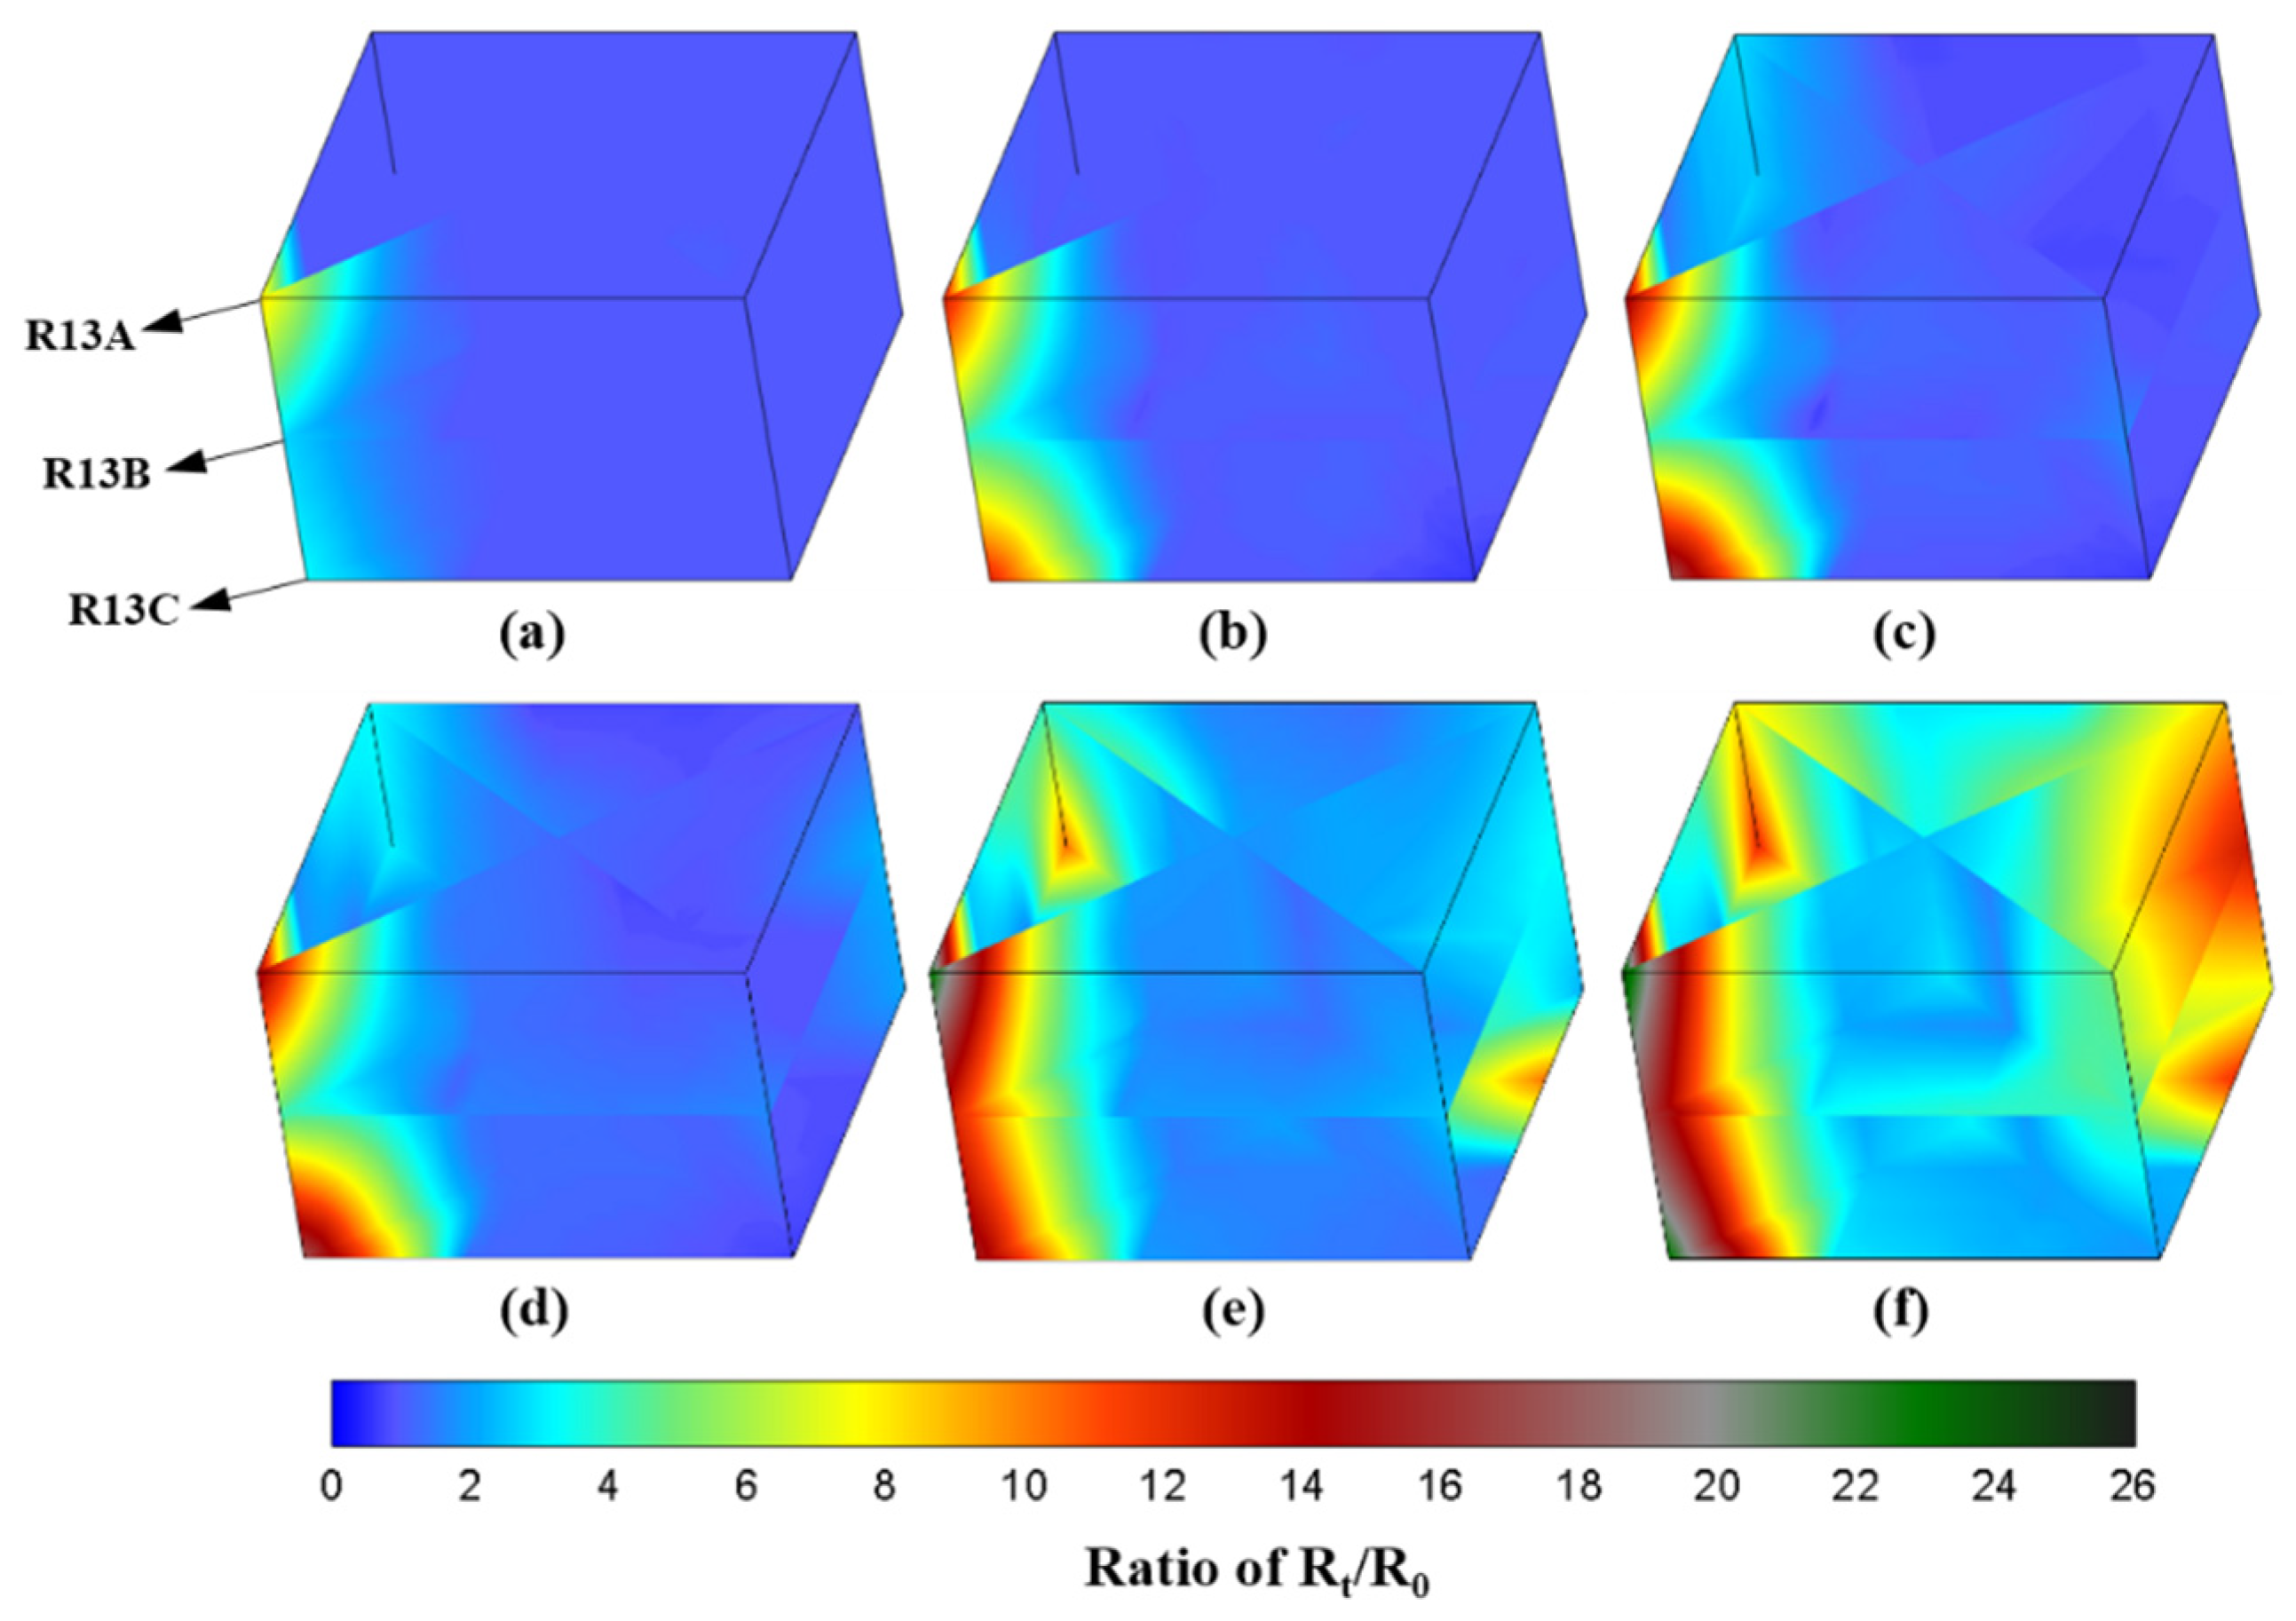
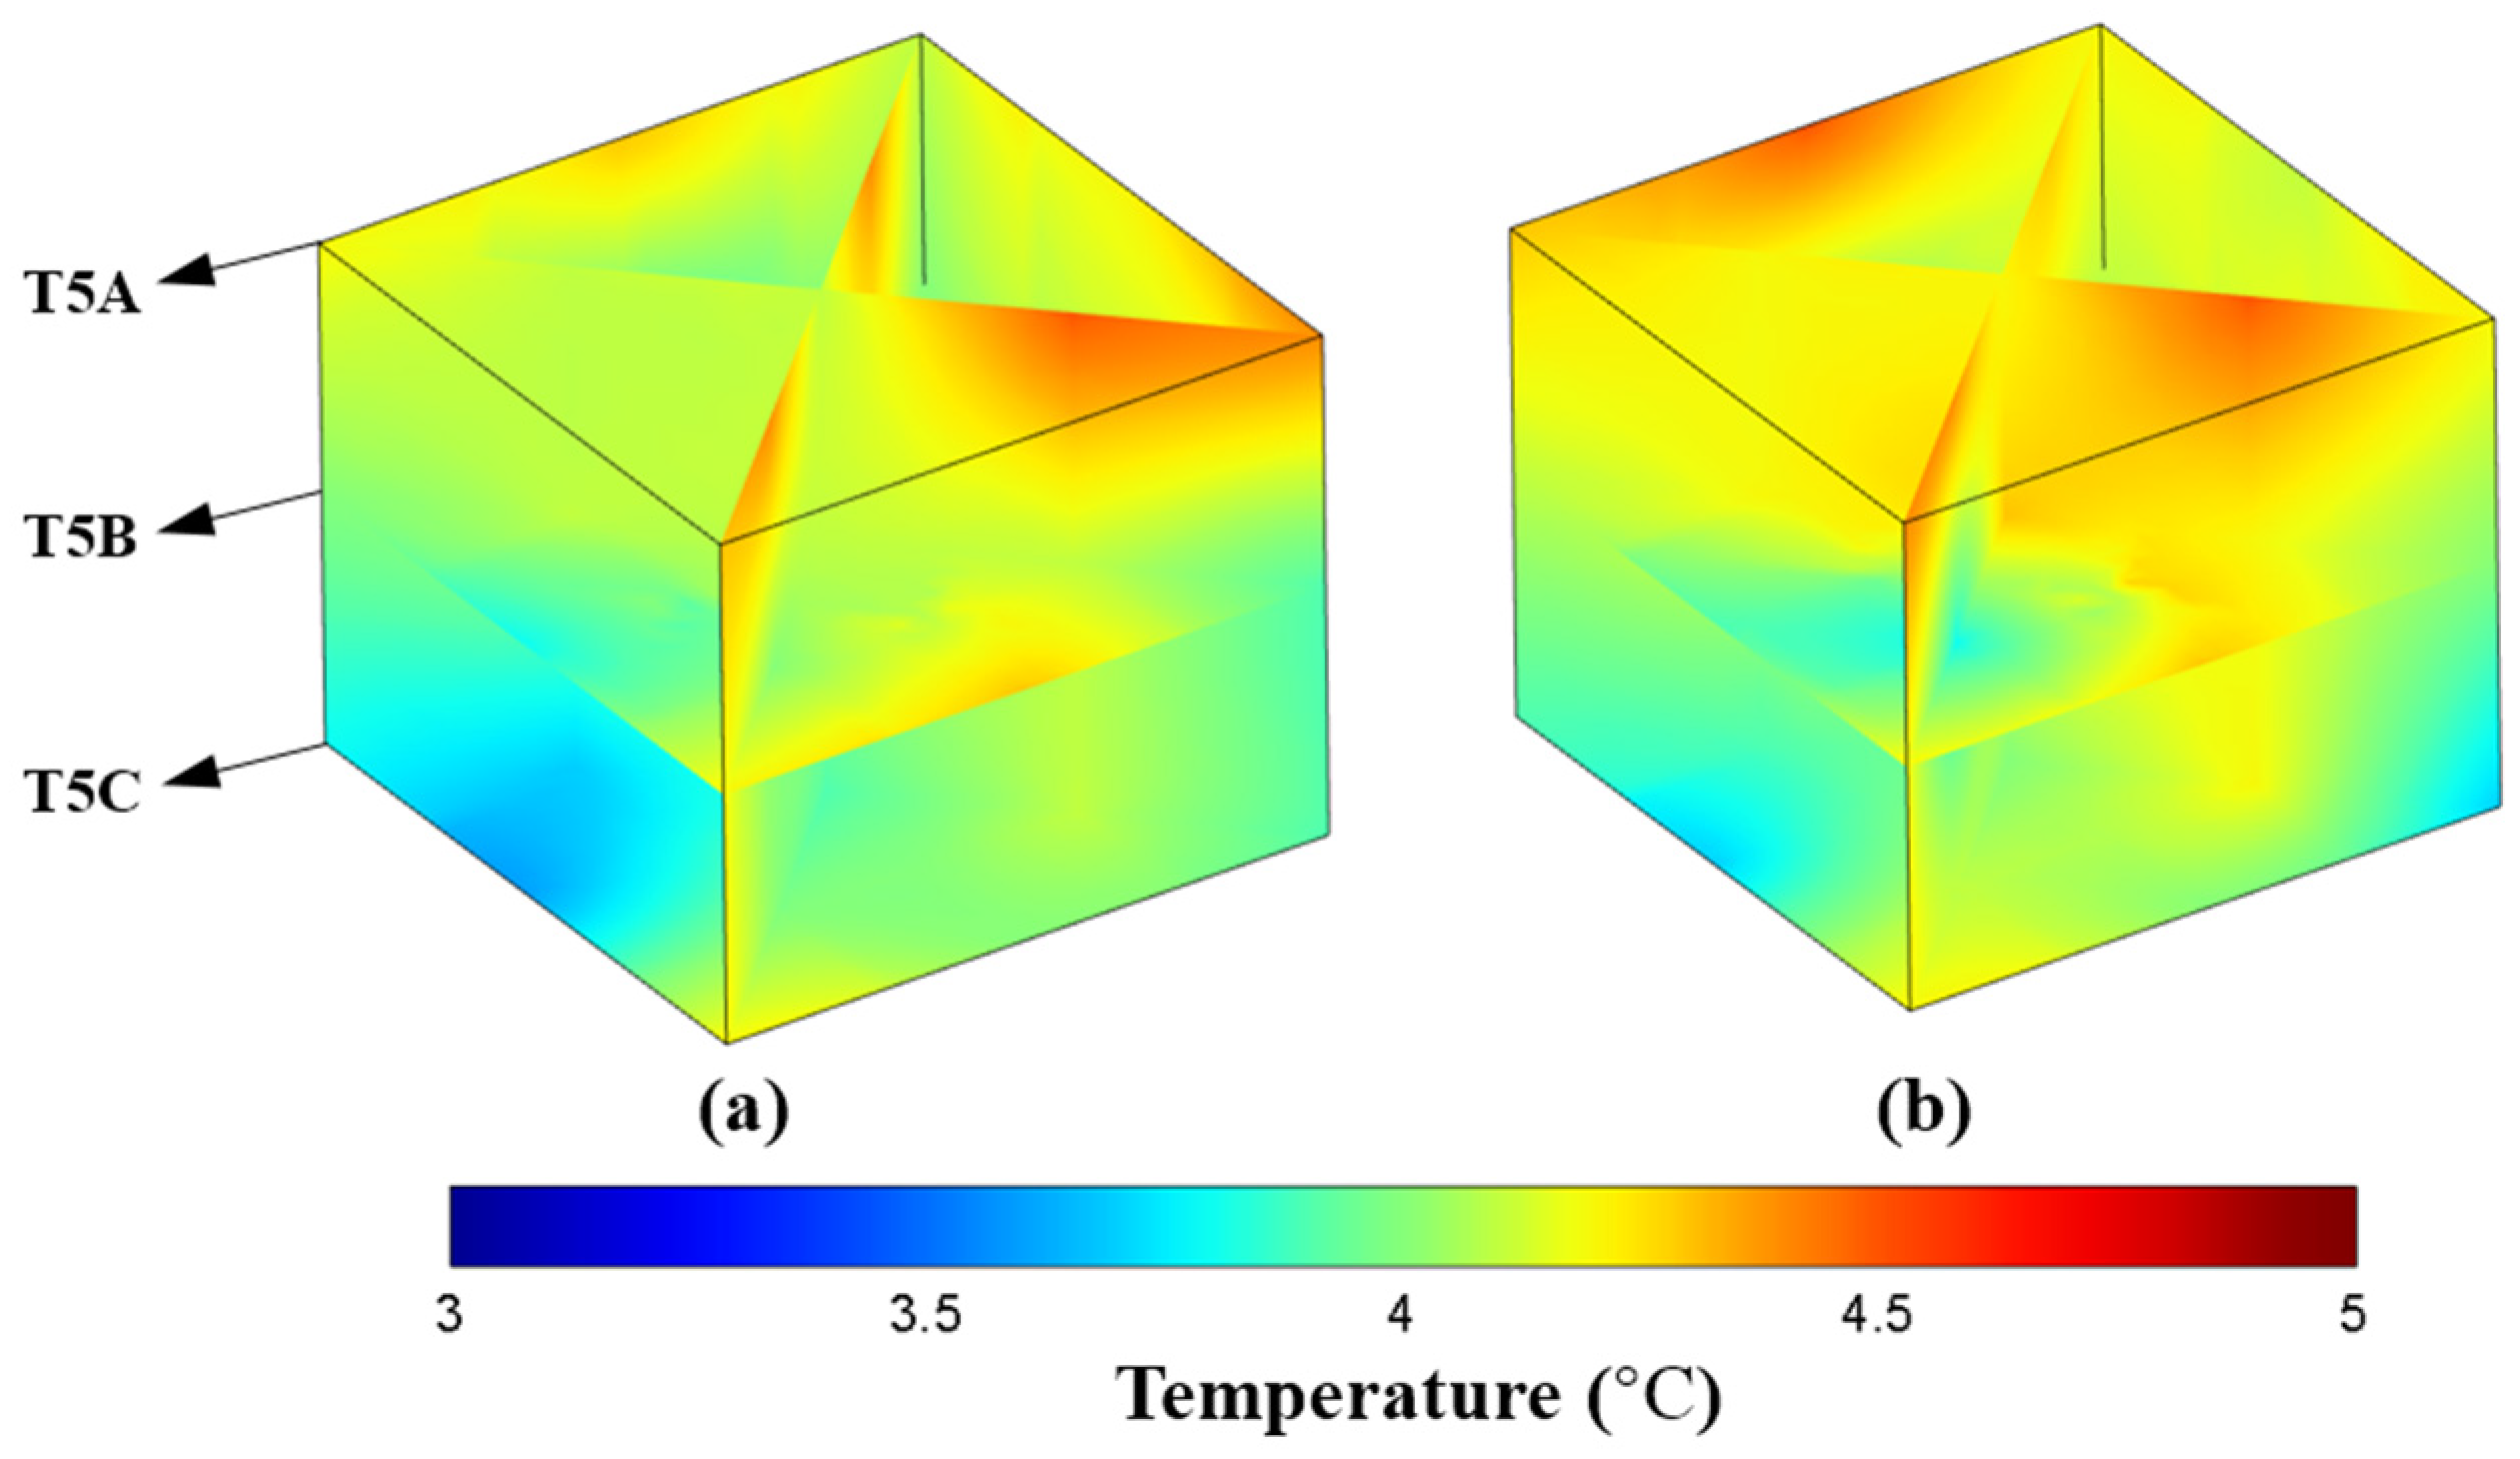
3.2.1. Electric Resistance and Temperature Evolution Characteristics
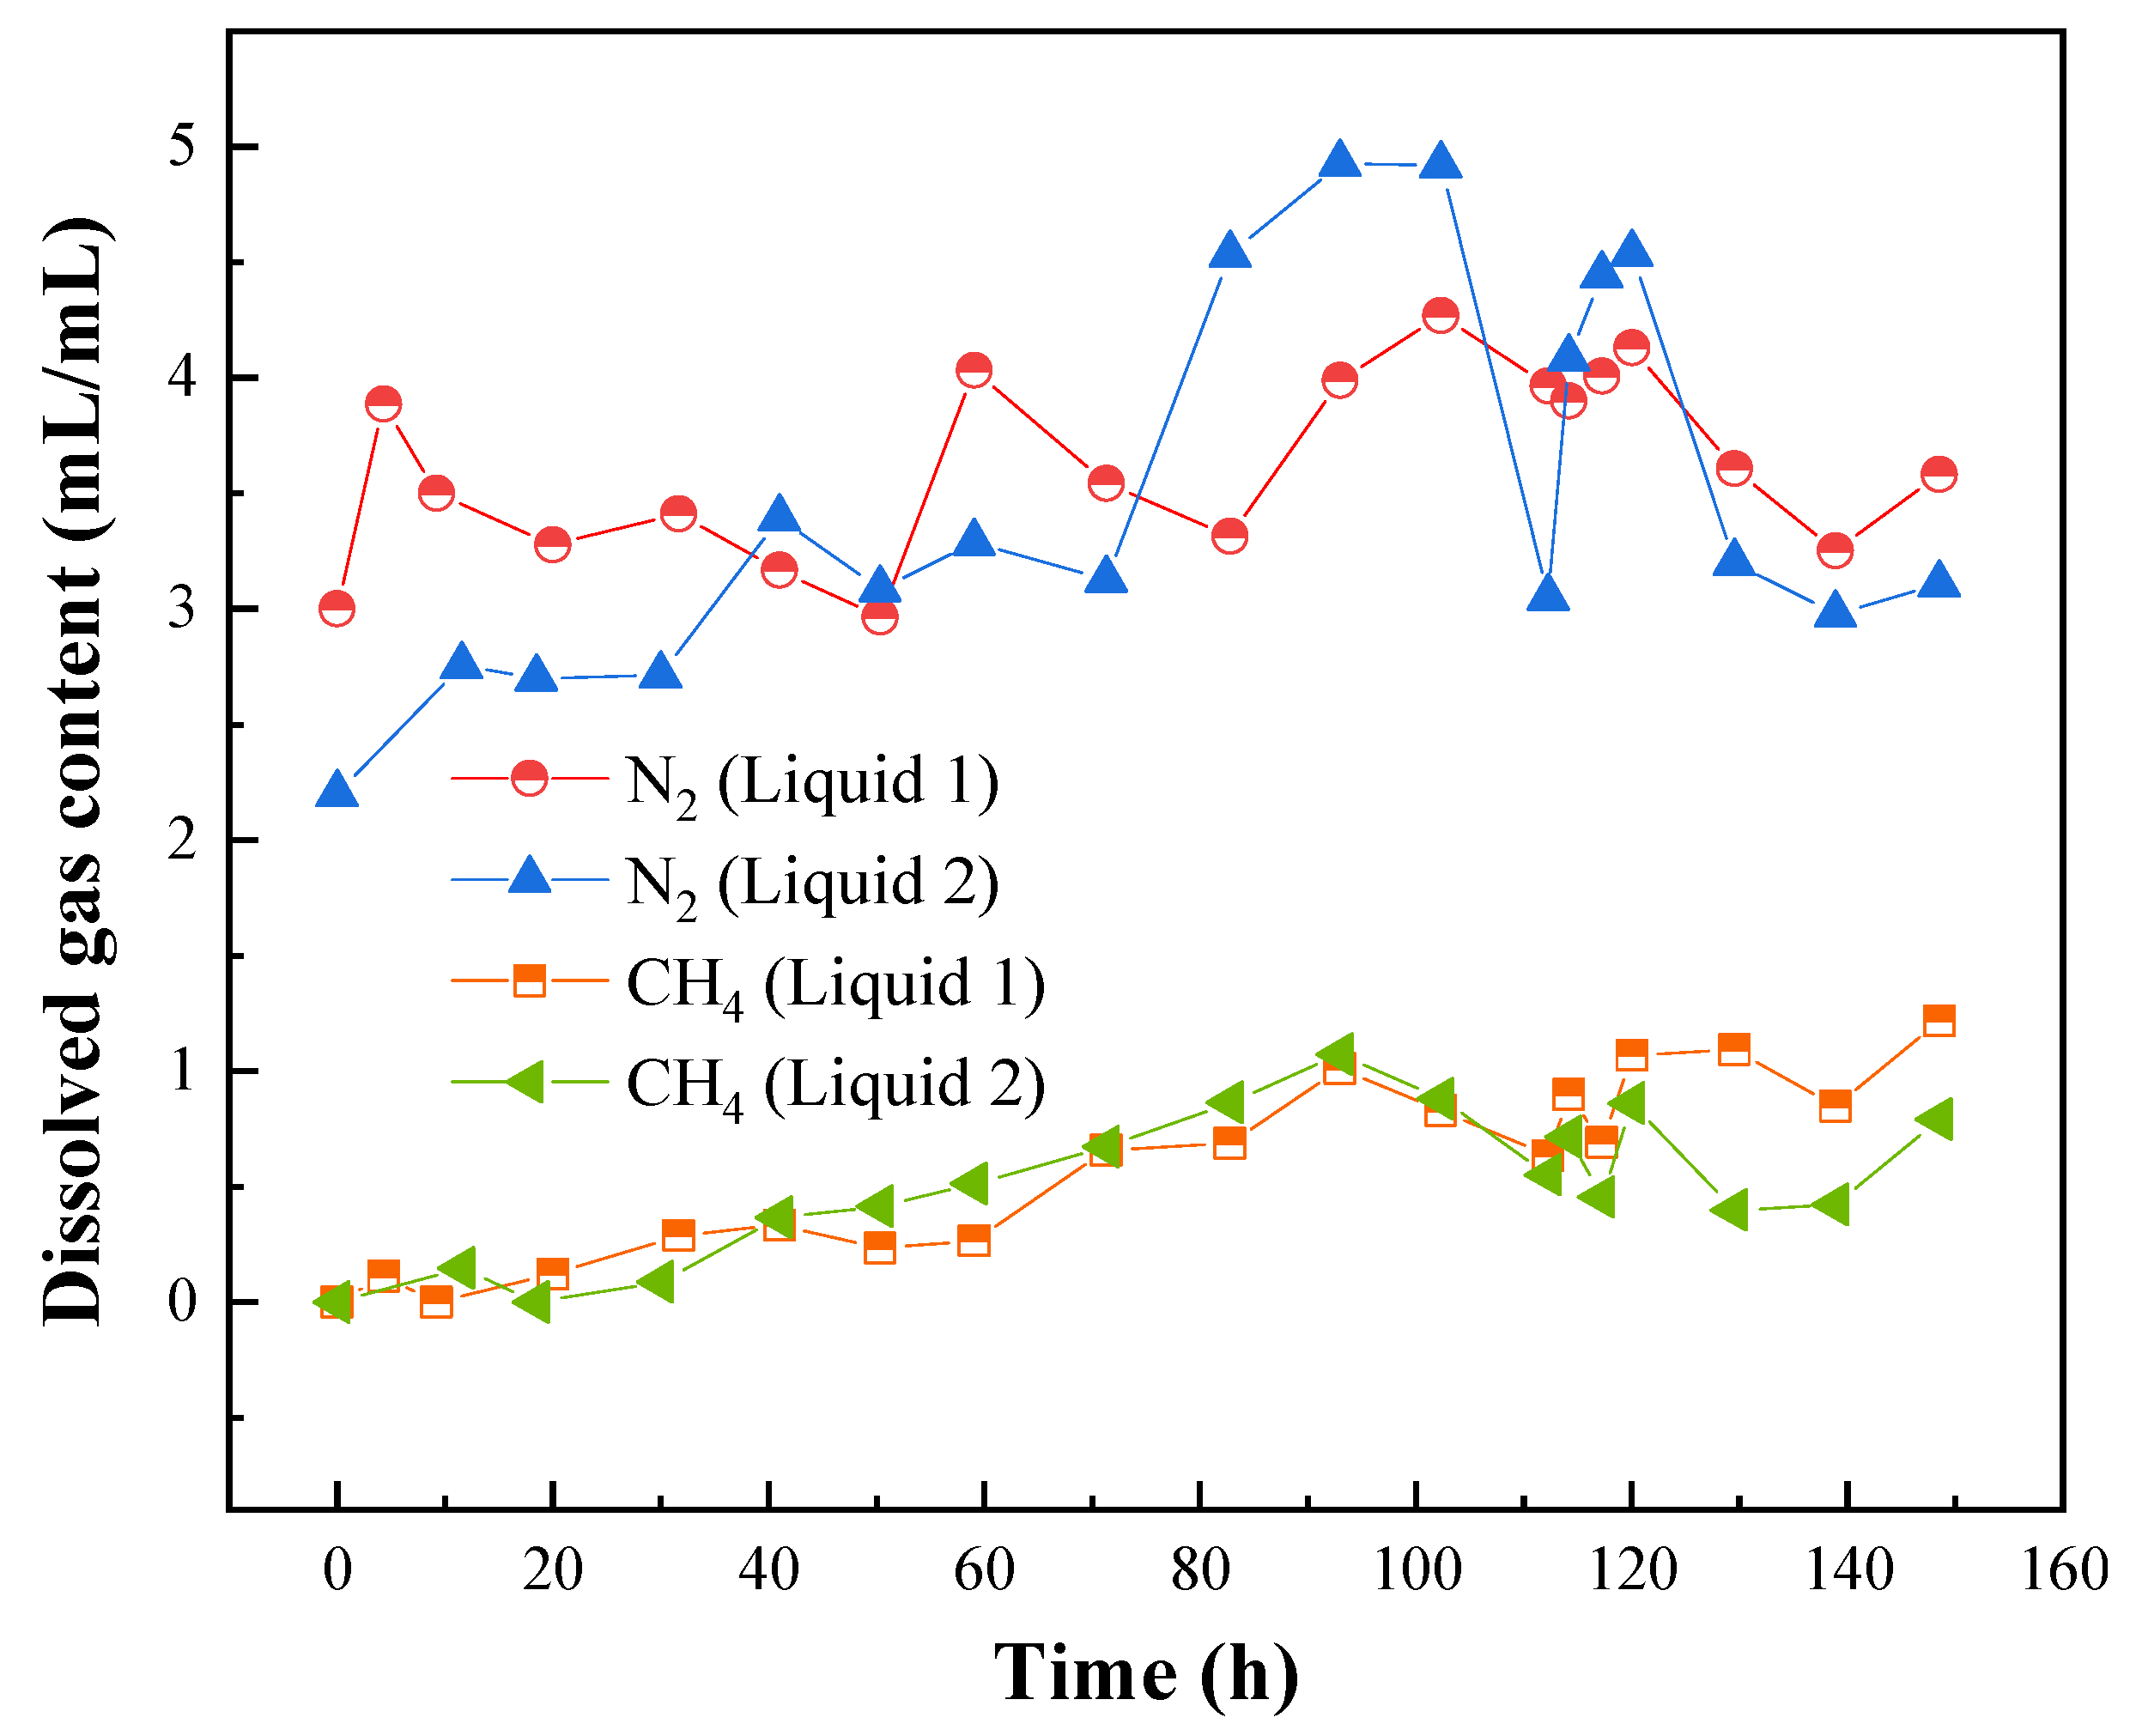
3.2.2. Gas Content Change in the Liquid and Gas Phases
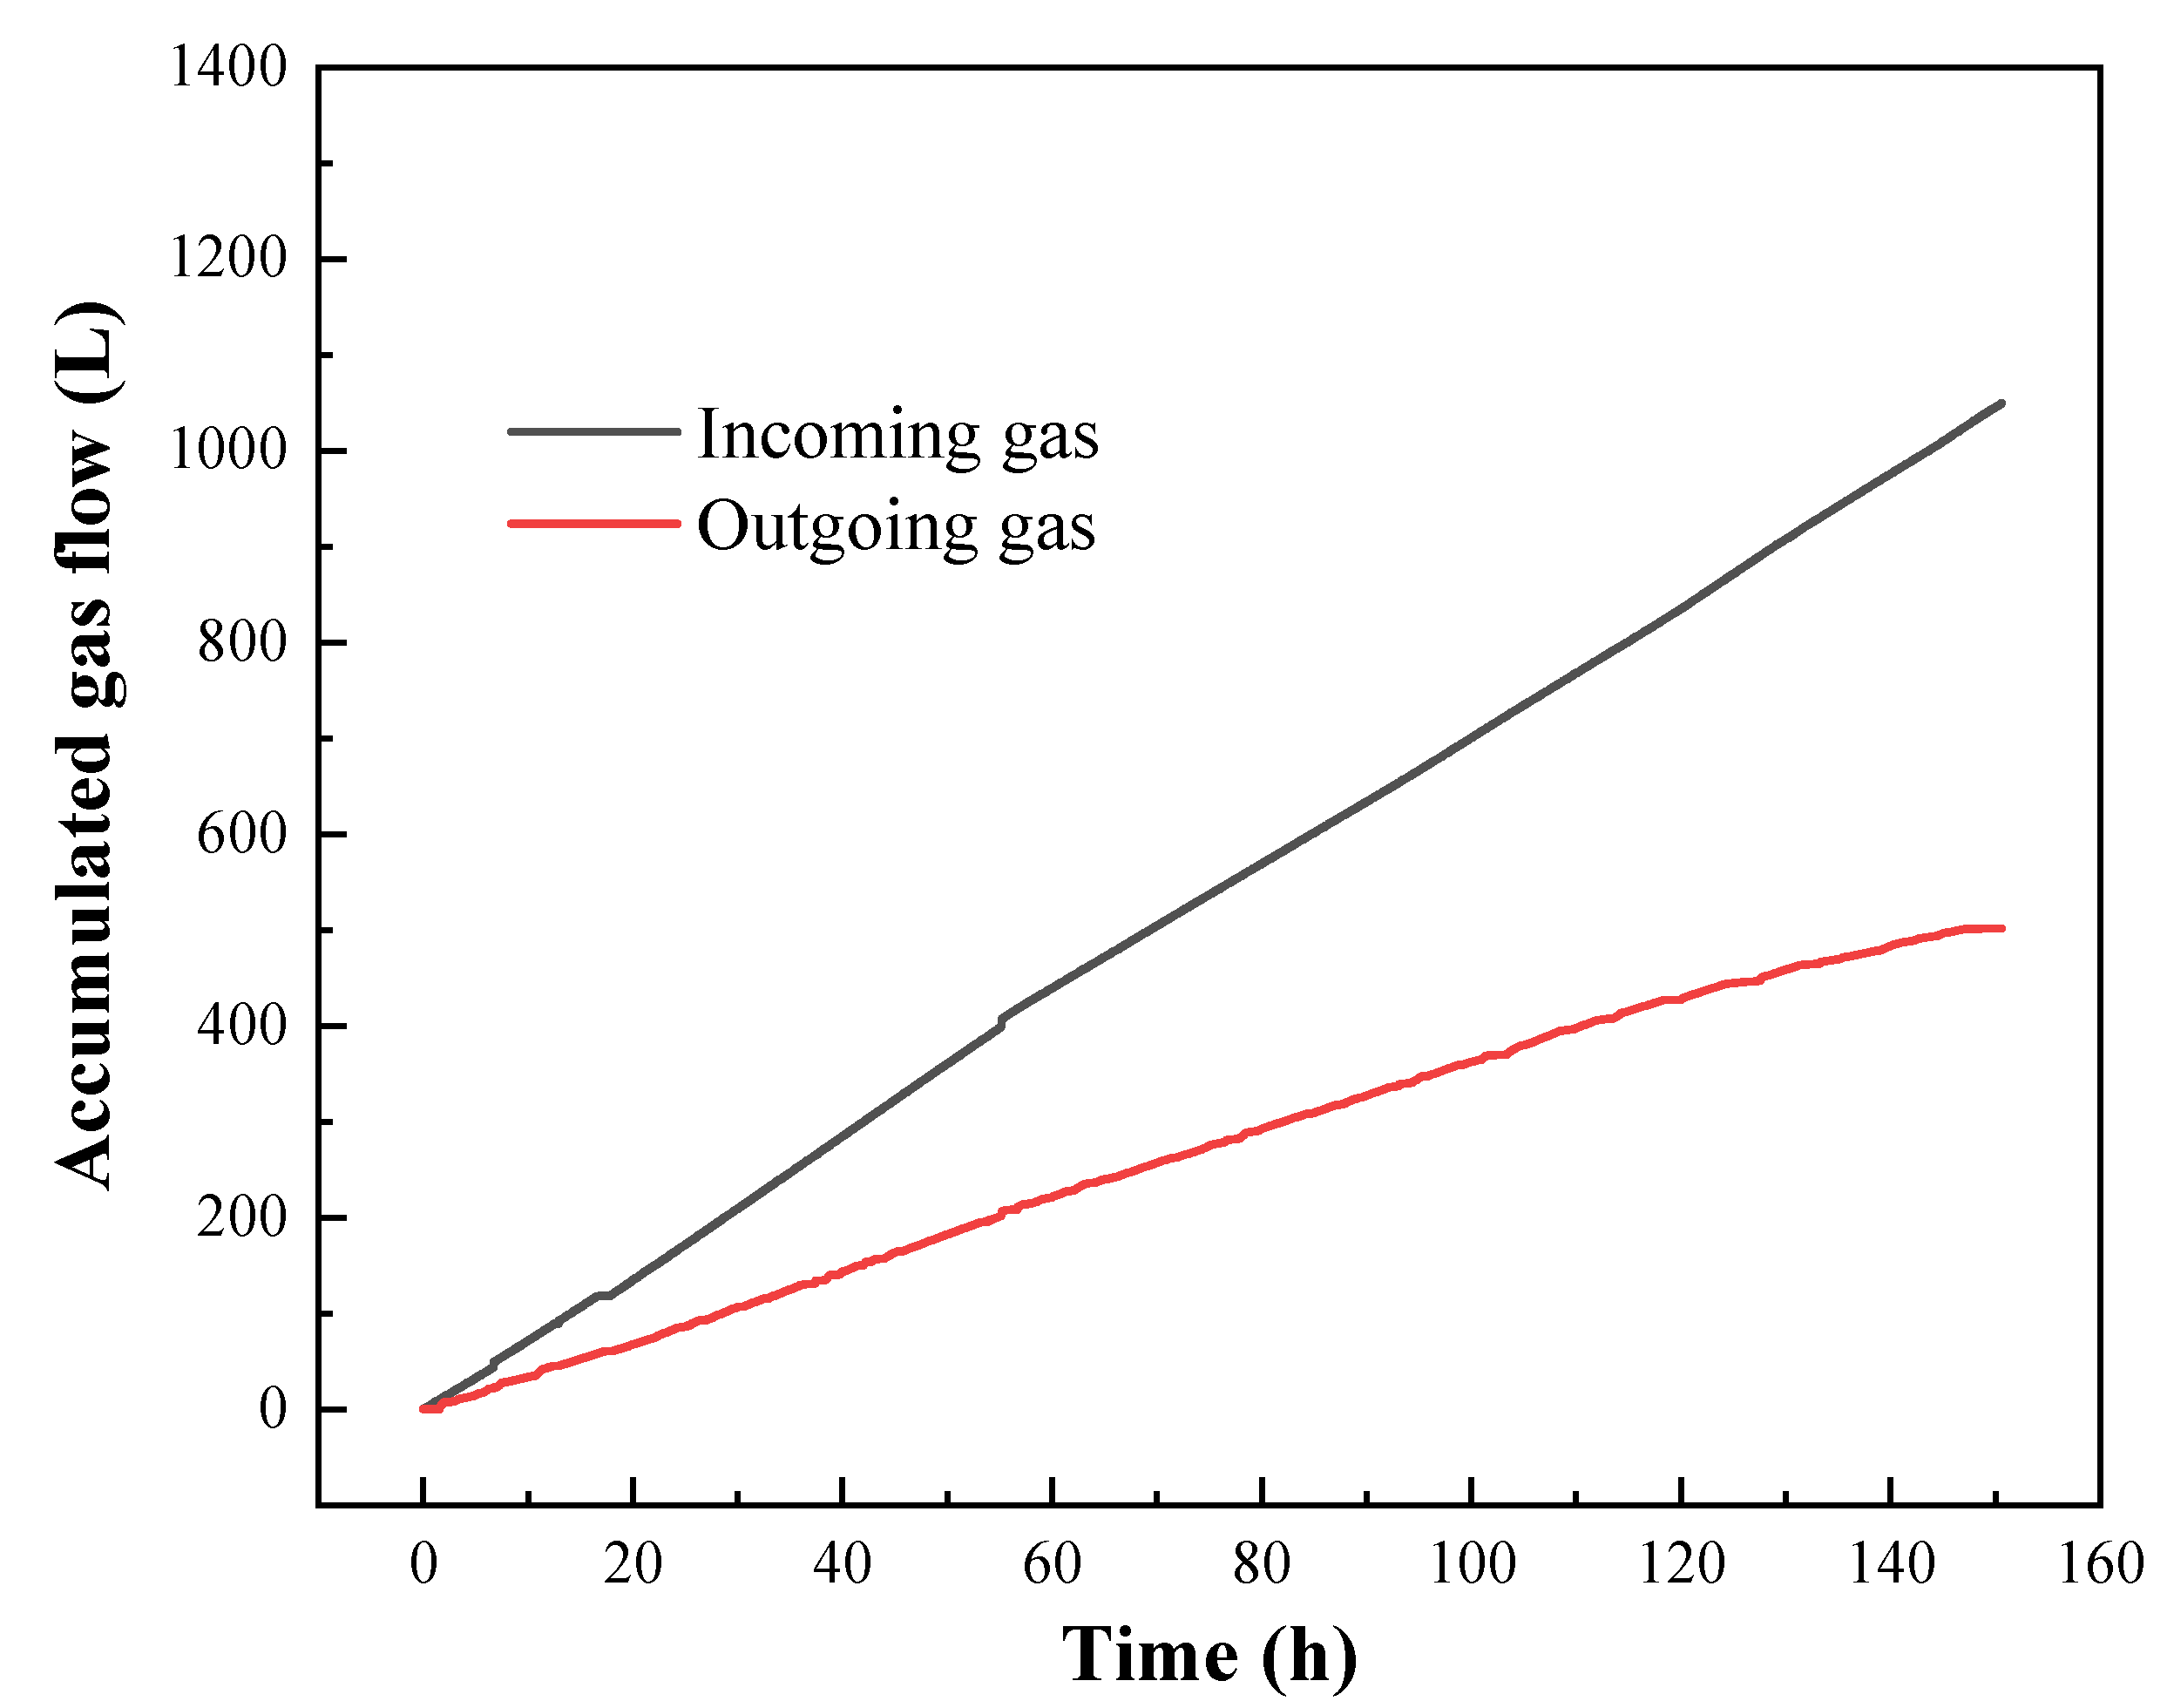
3.2.3. Cumulative Volume Changes of Incoming and Outgoing Gas
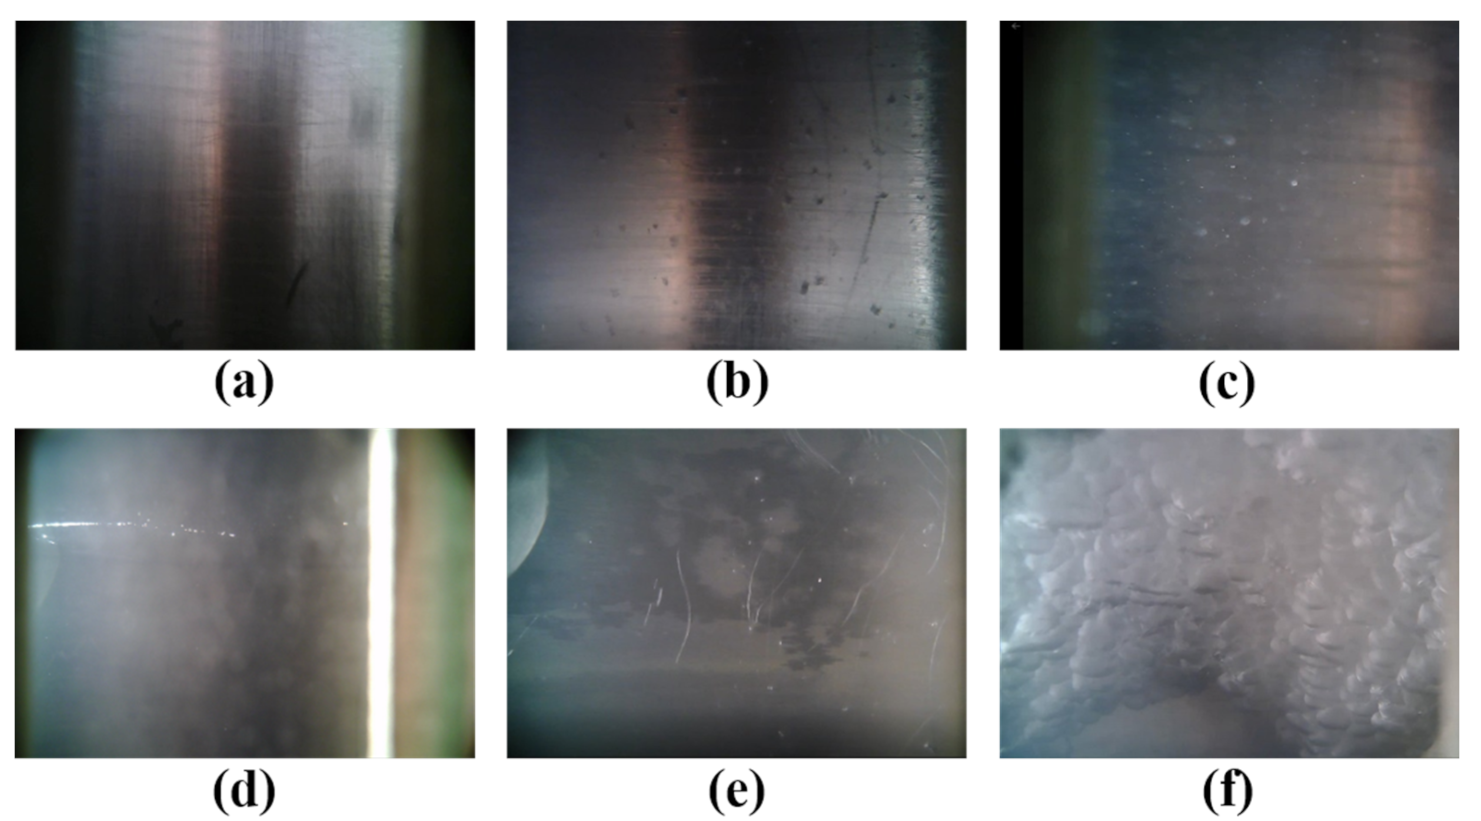
3.2.4. Visual Observation with Built-In Camera and External Windows
4. Conclusions
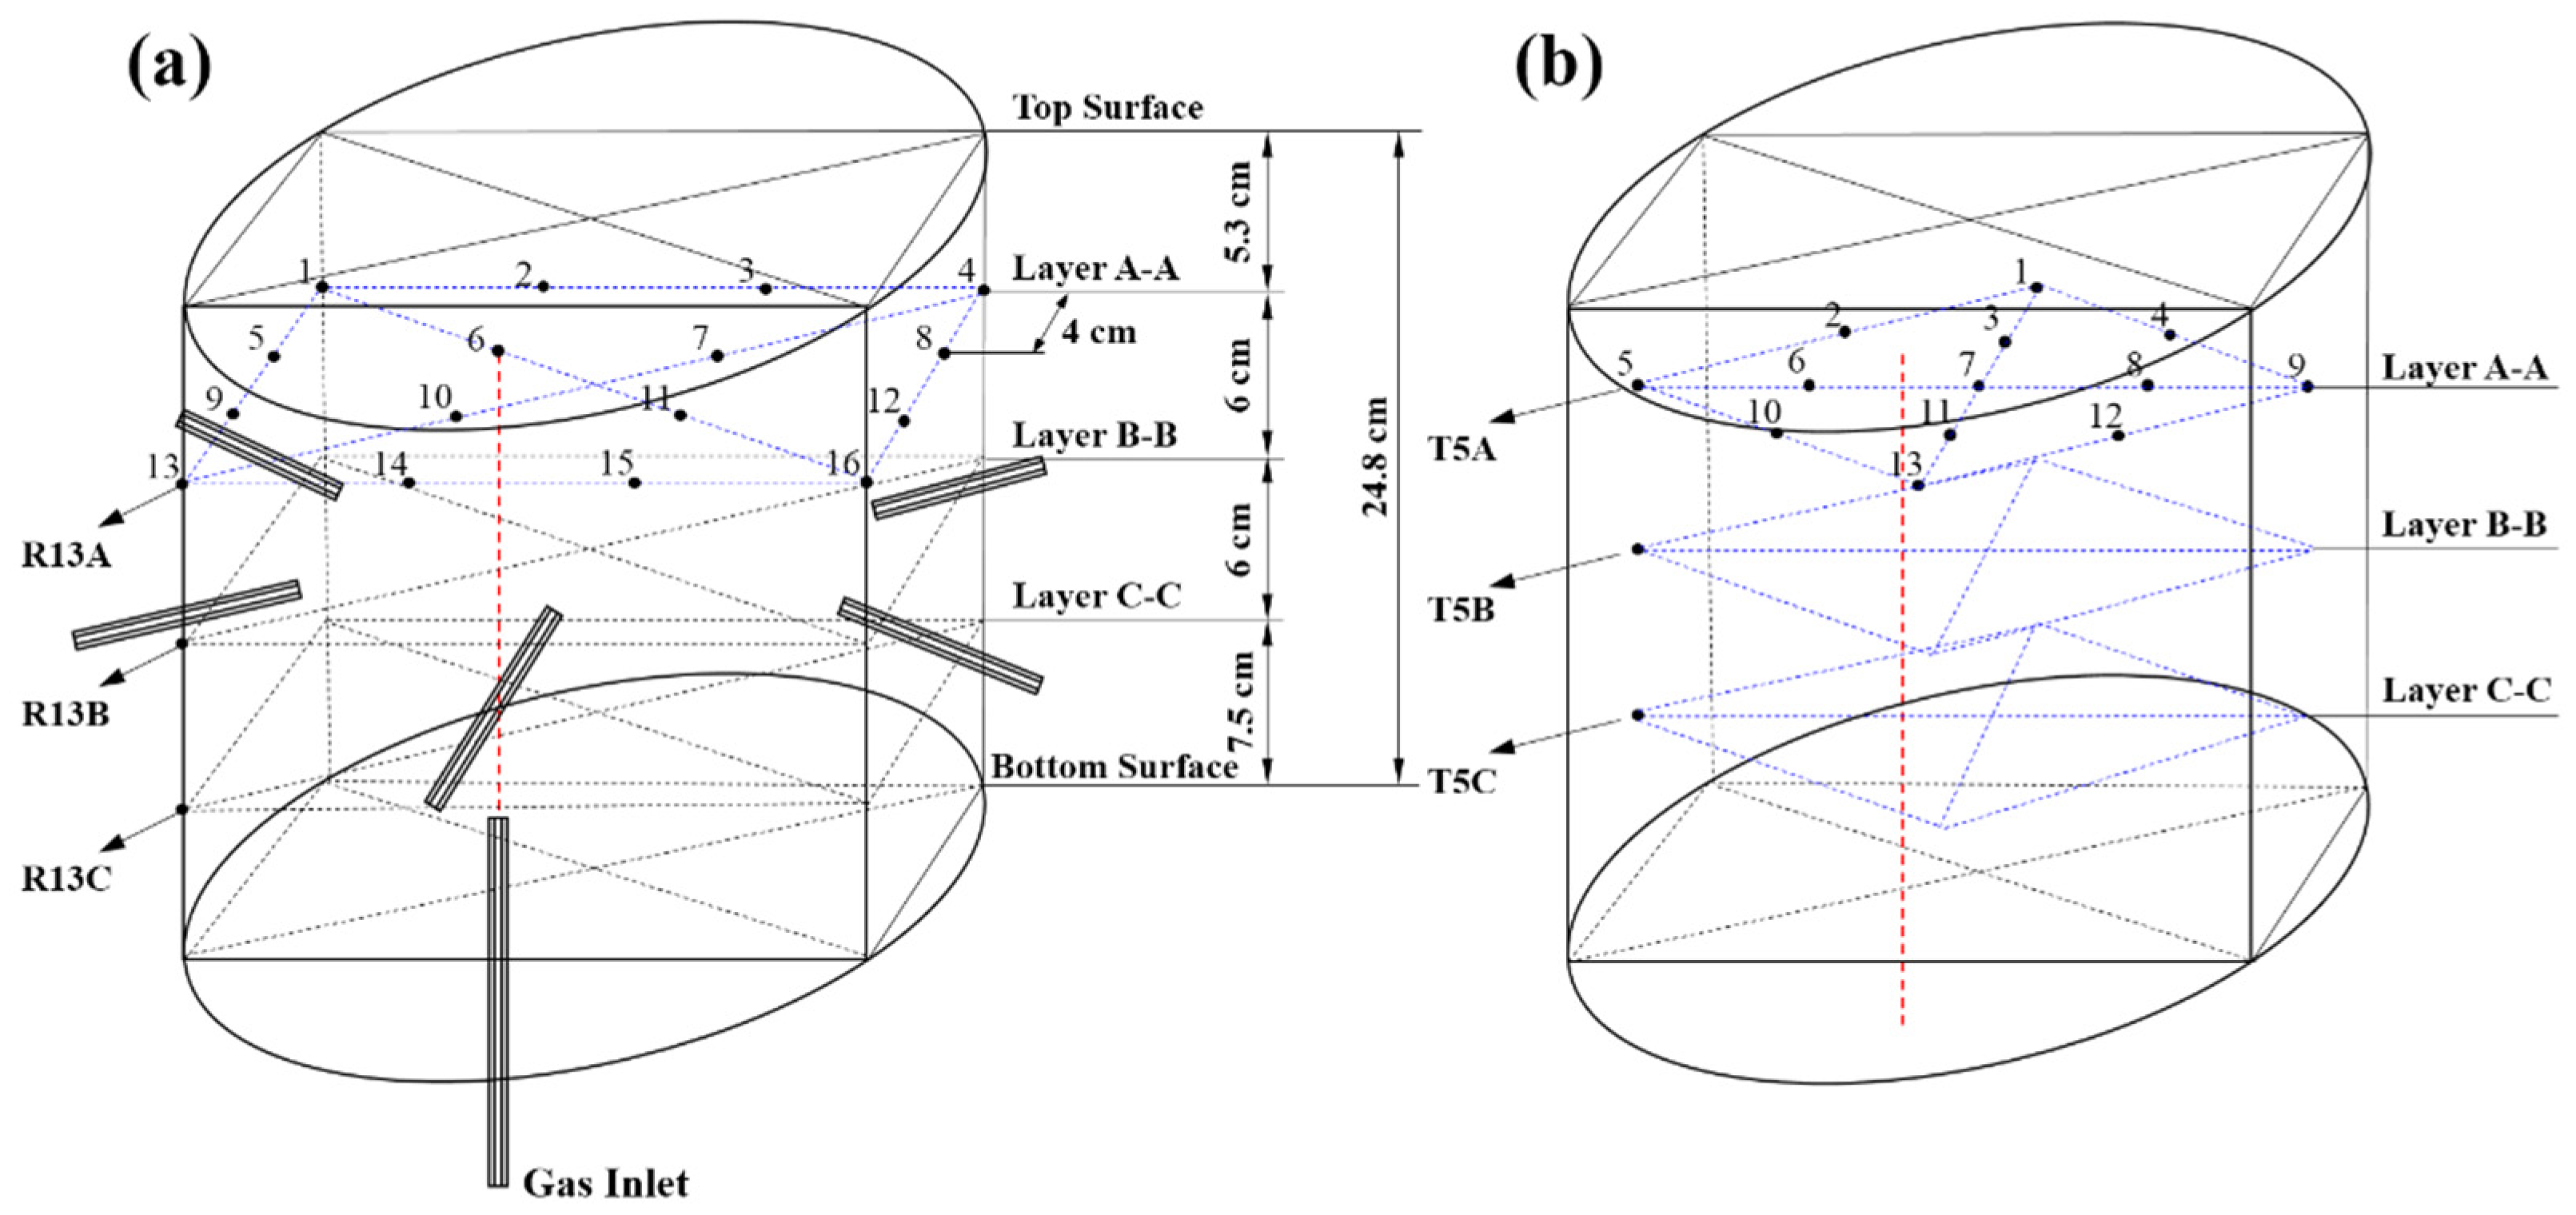
- The monitoring of the bubble migration path and hydrate transformation and aggregation in the sediment chamber could be realized, mainly through the spatial distribution of electric resistance and temperature measurement points.
- The rising characteristic and morphological evolution of gas and hydrate bubbles in seawater chamber are recorded through a built-in, movable camera and four external windows.
- The quantitative storage and escape of CH4 could be realized through the measurement of multiple gas/liquid collection ports and cumulative incoming/outgoing gas volumes.
- The effectiveness test of the experiment system showed that the local sediment resistance values increased first, and after a period of time, the sediment resistance values rose as a whole. Only the accumulative CH4 bubbles form the hydrate simultaneously, and a large amount of exothermic heat may lead to the obvious change of local temperature. In addition, the image recording and gas measurement results also presented a great regularity. The experimental results prove the good functions of the simulator.
Author Contributions
Funding
Institutional Review Board Statement
Informed Consent Statement
Data Availability Statement
Conflicts of Interest
References
- Sloan, E.D.; Koh, C.A. Clathrate Hydrates of Natural Gases, 3rd ed.; CRC Press: Boca Raton, FL, USA, 2008. [Google Scholar]
- Boswell, R.; Collett, T.S. Current perspectives on gas hydrate resources. Energy Environ. Sci. 2011, 4, 1206–1215. [Google Scholar] [CrossRef]
- Masson-Delmotte, V.P.; Zhai, H.O.; Pörtmer, D.; Roberts, J.; Skea, P.R.; Shukla, A.; Pirani, W.; Moufouma-Okia, C.; Péan, R. Summary for Policymakers, In Global Warming of 1.5 °C, An IPCC Special Report on the Impacts of Global Warming of 1.5 °C above Preindustrial Levels and Related Global Greenhouse Gas Emission Pathways, in the Context of Strengthening the Global Response to the Threat of Climate Change, Sustainable Development, and Efforts to Eradicate Poverty. IPCC, 2018; in press. [Google Scholar]
- Reeburgh, W.S. Oceanic methane biogeochemistry. Chem. Rev. 2007, 107, 486–513. [Google Scholar] [CrossRef] [PubMed] [Green Version]
- Ketzer, M.; Praeg, D.; Rodrigues, L.F.; Augustin, A.; Pivel, M.A.; Rahmati-Abkenar, M.; Miller, D.J.; Viana, A.R.; Cupertino, J.A. Gas hydrate dissociation linked to contemporary ocean warming in the southern hemisphere. Nat. Commun. 2020, 11, 3788. [Google Scholar] [CrossRef] [PubMed]
- Rutqvist, J.; Moridis, G.J. Development of a numerical simulator for analyzing the geomechanical performance of hydrate-bearing sediments. In Proceedings of the 42nd US Rock Mechanics Symposium and 2nd US-Canada Rock Mechanics Symposium San Francisco, Onepetro, San Francisco, CA, USA, 29 June–2 July 2008. [Google Scholar]
- Zhu, C.Q.; Li, Z.H.; Chen, D.X.; Li, S.Z.; Song, X.S.; Shan, H.X.; Jia, Y.G. Seafloor breathing helping forecast hydrate-related geohazards. Energy Rep. 2021, 7, 8108–8114. [Google Scholar] [CrossRef]
- Van Dover, C.L.; German, C.R.; Speer, K.G.; Parson, L.M.; Vrijenhoek, R.C. Evolution and biogeography of deep-sea vent and seep invertebrates. Sci. Justice 2002, 295, 1253–1257. [Google Scholar] [CrossRef] [Green Version]
- Pachauri, R.K.; Allen, M.R.; Barros, V.R.; Broome, J.; Cramer, W.; Christ, R.; Church, J.A.; Clarke, L.; Dahe, Q.; Dasgupta, P.; et al. Climate Change 2014: Synthesis Report. Contribution of Working Groups I, II and III to the Fifth Assessment Report of the Intergovernmental Panel on Climate Change. IPCC 2014, 9, 151. [Google Scholar]
- Hinrichs, L.R.; Hmelo, L.R.; Sylva, L.R. Molecular fossil record of elevated methane levels in late Pleistocene coastal waters. Sci. Justice 2003, 299, 1214–1217. [Google Scholar] [CrossRef]
- Suess, E.; Carson, B.; Ritger, S.D.; Moore, J.C.; Cochrane, G.R. Biological communities at vent sites along the subduction zone off Oregon. Bull. Biol. Soc. Wash. 1985, 6, 475–484. [Google Scholar]
- Paull, C.K.; Dillon, W.P. Natural gas hydrates: Occurrence, distribution, and detection. Wash. DC Am. Geophys. Union Geophys. Monogr. Ser. 2001, 15, 124. [Google Scholar]
- Ruppel, C.D.; Kessler, J.D. The interaction of climate change and methane hydrates. Rev. Geophys. 2017, 55, 126–168. [Google Scholar] [CrossRef]
- Feng, D.; Qiu, J.W.; Hu, Y.; Peckmann, J.; Guan, H.X.; Tong, H.P.; Chen, C.; Chen, J.X.; Gong, S.G.; Li, N.; et al. Cold seep systems in the South China Sea: An overview. J. Asian Earth Sci. 2018, 168, 3–16. [Google Scholar] [CrossRef]
- Su, K.H.; Sun, C.Y.; Dandekar, A.; Liu, B.; Sun, W.Z.; Cao, M.C.; Li, N.; Zhong, X.Y.; Guo, X.Q.; Ma, Q.L.; et al. Experimental investigation of hydrate accumulation distribution in gas seeping system using a large scale three-dimensional simulation device. Chem. Eng. Sci. 2012, 82, 246–259. [Google Scholar] [CrossRef]
- Wei, J.G.; Li, J.W.; Wu, T.T.; Zhang, W.; Li, J.T.; Wang, J.L.; Tao, J.; Chen, Z.H.; Wu, Z.J.; Chen, W.L. Geologically controlled intermittent gas eruption and its impact on bottom water temperature and chemosynthetic communities—A case study in the “HaiMa” cold seeps South China Sea. Geol. J. 2020, 55, 6066–6078. [Google Scholar] [CrossRef]
- Römer, M.; Sahling, H.; Pape, T.; Bohrmann, G.; Spiess, V. Quantification of gas bubble emissions from submarine hydrocarbon seeps at the Makran continental margin (offshore Pakistan). J. Geophys. Res. Ocean. 2012, 117, C10015. [Google Scholar] [CrossRef]
- Du, Z.F.; Zhang, X.; Xi, S.C.; Li, L.F.; Luan, Z.D.; Lian, C.; Wang, B.; Yan, J. In situ Raman spectroscopy study of synthetic gas hydrate formed by cold seep flow in the South China Sea. J. Asian Earth Sci. 2018, 168, 197–206. [Google Scholar] [CrossRef]
- Li, S.L.; Sun, C.Y.; Liu, B.; Li, Z.Y.; Chen, G.J.; Sum, A.K. New observations and insights into the morphology and growth kinetics of hydrate films. Sci. Rep. 2014, 4, 4129. [Google Scholar] [CrossRef] [Green Version]
- Zeng, X.Y.; Wu, G.Z.; Zhong, J.R.; Chen, D.Y.; Sun, C.Y.; Chen, G.J. Three-Scale in Situ Investigation on the Film Morphology and Mass Transfer Channels during the Thickening Growth of Hydrates on Gas Bubble. Cryst. Growth Des. 2019, 19, 3158–3165. [Google Scholar] [CrossRef]
- Zeng, X.Y.; Wu, G.; Zhang, S.; Sun, L.; Sun, C.; Chen, G.; Feng, J.C. In-situ Raman study on kinetics behaviors of hydrated bubble in thickening. Sci. Total Environ. 2022, 814, 152476. [Google Scholar] [CrossRef]
- Xie, Y.; Zheng, T.; Zhu, Y.J.; Zhong, J.R.; Feng, J.C.; Sun, C.Y.; Chen, G.J. Effects of H2-N2 on CO2 hydrate flm growth: Morphology and microstructure. Chem. Eng. J. 2022, 431, 134004. [Google Scholar] [CrossRef]
- Li, N.; Sun, Z.F.; Sun, C.Y.; Li, P.; Chen, G.J.; Ma, Q.L.; Liu, B. Simulating natural hydrate formation and accumulation in sediments from dissolved methane using a large three-dimensional simulator. Fuel 2018, 216, 612–620. [Google Scholar] [CrossRef]
- Madden, M.E.; Ulrich, S.; Szymcek, P.; McCallum, S.; Phelps, T. Experimental formation of massive hydrate deposits from accumulation of CH4 gas bubbles within synthetic and natural sediments. Mar. Pet. Geol. 2009, 26, 369–378. [Google Scholar] [CrossRef]
- Li, X.S.; Xu, C.G.; Zhang, Y.; Ruan, X.K.; Li, G.; Wang, Y. Investigation into gas production from natural gas hydrate: A review. Appl. Energy 2016, 172, 286–322. [Google Scholar] [CrossRef] [Green Version]
- Xie, Y.; Li, R.; Wang, X.H.; Zheng, T.; Cui, J.L.; Yuan, Q.; Qin, H.B.; Sun, C.Y.; Chen, G.J. Review on the accumulation behavior of natural gas hydrates in porous sediments. J. Nat. Gas Sci. Eng. 2020, 83, 103520. [Google Scholar] [CrossRef]
- Guo, X.S.; Nian, T.K.; Wang, D.; Gu, Z.D. Evaluation of undrained shear strength of surficial marine clays using ball penetration-based CFD modelling. Acta Geotech. 2021, 16, 1–17. [Google Scholar] [CrossRef]
- Guo, X.S.; Nian, T.K.; Zhao, W.; Gu, Z.D.; Liu, C.P.; Liu, X.L.; Jia, Y.G. Centrifuge experiment on the penetration test for evaluating undrained strength of deep-sea surface soils. Int. J. Min. Sci. Technol. 2021, in press. Available online: https://www.sciencedirect.com/science/article/pii/S2095268621001476 (accessed on 1 March 2022).
- Zhao, J.H.; Liu, C.L.; Li, C.F.; Zhang, Y.C.; Bu, Q.T.; Wu, N.Y.; Liu, Y.; Chen, Q. Pore-Scale Investigation of the Electrical Property and Saturation Exponent of Archie’s Law in Hydrate-Bearing Sediments. J. Mar. Sci. Eng. 2022, 10, 111. [Google Scholar] [CrossRef]
- Zhou, X.T.; Fan, S.S.; Liang, D.Q.; Wang, D.L.; Huang, N.S. Use of Electrical Resistance to Detect the Formation and Decomposition of Methane Hydrate. J. Nat. Gas Chem. 2007, 16, 399–403. [Google Scholar] [CrossRef]
- Feng, J.C.; Li, B.; Li, X.S.; Wang, Y. Effects of depressurizing rate on methane hydrate dissociation within large-scale experimental simulator. Appl. Energy 2021, 304, 117750. [Google Scholar] [CrossRef]
- Li, P.; Feng, J.C.; Yang, Z.F.; Zhang, S.; Zeng, X.Y.; Sun, L.W.; Huang, Y.Y.; Zhang, M.; Feng, X.; Yin, H. Kinetic Behaviors of Methane Hydrate Formation with Bubble Seeping at Conditions of “Haima” Cold Seep. Energy Fuels 2021, 35, 12132–12141. [Google Scholar] [CrossRef]
- Yang, X.; Sun, C.Y.; Su, K.H.; Yuan, Q.; Li, Q.P.; Chen, G.J. A three-dimensional study on the formation and dissociation of methane hydrate in porous sediment by depressurization. Energy Convers. Manag. 2012, 56, 1–7. [Google Scholar] [CrossRef]
- Xie, Y.; Zheng, T.; Zhong, J.R.; Zhu, Y.-J.; Wang, Y.F.; Zhang, Y.; Li, R.; Yuan, Q.; Sun, C.Y.; Chen, G.J. Experimental research on self-preservation effect of methane hydrate in porous sediments. Appl. Energy 2020, 268, 115008. [Google Scholar] [CrossRef]
- Arjmandi, M.; Chapoy, A.; Tohidi, B. Equilibrium data of hydrogen, methane, nitrogen, carbon dioxide, and natural gas in semi-clathrate hydrates of tetrabutyl ammonium bromide. J. Chem. Eng. Data 2007, 52, 2153–2158. [Google Scholar] [CrossRef]


| Number | Sensor Type | Test Ranges | Accuracy |
|---|---|---|---|
| 1 | Temperature | −20~280 °C | ±0.1 °C |
| 2 | Pressure | 0~25,000 KPa | ±25 KPa |
| 3 | Electric resistance | 0~1000 KΩ | ±0.1 KΩ |
Publisher’s Note: MDPI stays neutral with regard to jurisdictional claims in published maps and institutional affiliations. |
© 2022 by the authors. Licensee MDPI, Basel, Switzerland. This article is an open access article distributed under the terms and conditions of the Creative Commons Attribution (CC BY) license (https://creativecommons.org/licenses/by/4.0/).
Share and Cite
Xie, Y.; Feng, J.; Hu, W.; Zhang, M.; Wang, J.; Peng, B.; Wang, Y.; Zhou, Z.; Wang, Y. Deep-Sea Sediment and Water Simulator for Investigation of Methane Seeping and Hydrate Formation. J. Mar. Sci. Eng. 2022, 10, 514. https://doi.org/10.3390/jmse10040514
Xie Y, Feng J, Hu W, Zhang M, Wang J, Peng B, Wang Y, Zhou Z, Wang Y. Deep-Sea Sediment and Water Simulator for Investigation of Methane Seeping and Hydrate Formation. Journal of Marine Science and Engineering. 2022; 10(4):514. https://doi.org/10.3390/jmse10040514
Chicago/Turabian StyleXie, Yan, Jingchun Feng, Weiqiang Hu, Mingrui Zhang, Junwen Wang, Bo Peng, Yujun Wang, Zhenwu Zhou, and Yi Wang. 2022. "Deep-Sea Sediment and Water Simulator for Investigation of Methane Seeping and Hydrate Formation" Journal of Marine Science and Engineering 10, no. 4: 514. https://doi.org/10.3390/jmse10040514
APA StyleXie, Y., Feng, J., Hu, W., Zhang, M., Wang, J., Peng, B., Wang, Y., Zhou, Z., & Wang, Y. (2022). Deep-Sea Sediment and Water Simulator for Investigation of Methane Seeping and Hydrate Formation. Journal of Marine Science and Engineering, 10(4), 514. https://doi.org/10.3390/jmse10040514