Article

Effect of Various Mooring Materials on Hydrodynamic Responses of Turret-Moored FPSO with Emphasis on Intact and Damaged Conditions

by
Idris Ahmed Ja'e
1,
Montasir Osman Ahmed Ali
1,*,
Anurag Yenduri
2,
Zafarullah Nizamani
3 and
Akihiko Nakayama
3
1
Civil and Environmental Engineering Department, Universiti Teknologi PETRONAS, Bandar Seri Iskandar, Seri Iskandar 32610, Perak, Malaysia
2
Global Engineering Centre, Subsea Engineering, TechnipFMC, Chennai 600032, India
3
Department of Environmental Engineering, Universiti Tunku Abdul Rahman (UTAR), Kampar 31900, Perak, Malaysia
*
Author to whom correspondence should be addressed.
J. Mar. Sci. Eng. 2022, 10(4), 453; https://doi.org/10.3390/jmse10040453
Submission received: 31 December 2021 / Revised: 23 February 2022 / Accepted: 24 February 2022 / Published: 23 March 2022
(This article belongs to the Special Issue Mooring of Floating Offshore Structures)

Abstract

:
The behavior of different mooring line materials has a significant influence on the behavior of the mooring system and, consequently, the dynamic responses of the floating platform. Although there have been previous studies on FPSOs and their mooring systems, the influence of mooring line failure scenarios associated with different mooring materials has received less attention, particularly for turret-moored FPSOs with taut moorings. Thus, this paper investigates the behavior of different mooring line materials in intact, single-line, and double-line damaged conditions on the hydrodynamic responses of the FPSO, restoring behavior, mooring, and riser tensions considering wave conditions in the Gulf of Mexico. Mooring lines including Aramid, HMPE, polyester, and steel wire were considered in the middle segment, which was the segment of interest in this study. The restoring forces of the mooring system were found to increase with increasing mooring stiffness, and a higher stiffness resulted in a higher loss of restoring force in the case of single-line failure. In all cases, the submerged weight and material stiffness had a significant influence on dynamic responses, mooring tension, transient responses, riser tension, and especially on the ability of the mooring system to resist the case of single-line failure. Each material was observed to behave differently in each degree of freedom (DOF), showing the necessity to pay close attention to the selection of mooring material for specific objectives.

1. Introduction

Because of their peculiar characteristics, such as a large top working area, substantially large storage capacity, and a stable hull, FPSOs account for most offshore floating platforms successfully deployed for deep-water oil and gas production activities [1]. Depending on the environmental conditions in which the vessel is to be operated, FPSOs are moored in place using either a turret (internal or external) or spread mooring system, both having mooring lines as their principal component. The mooring lines are reported to account for about 20–30% of the overall offshore project cost [1]. Thus, the need for more reliable mooring ropes has increased as the exploration activities advance into deeper waters.
The mooring system as an integral component of the FPSO has a significant influence on its dynamic responses depending on whether a catenary, slack, or taut mooring concept is used. The catenary mooring line derives its restoring force from the weight of the hung line segments, whereas the taut mooring, which is applied in this study, derives its restoring force from the line axial stiffness. The taut mooring concept, which often uses synthetic fiber ropes as a major component of the lines, is widely adopted due to its superior mechanical properties and lower cost when compared with catenary lines [2].
The use of fiber ropes as a major segment in multicomponent mooring lines was first proposed back in the 1960s, and they have since then proven to be the most suitable alternative for steel wire ropes [3]. In the 1990s, polyester moorings were the most used for deep-water applications in the offshore industry but were first installed for a taut-wire mooring application in 1997 for Campos Basin, offshore Brazil [4]. In the past decade, polyester has been well investigated, and results from several joint industry projects (JIP) have been integrated into several offshore standards, such as API-RP-2SM [5], ABS [6], and DVNGL-RP-E305 [7].
However, as the exploration of oil and gas moves further into the ultradeep waters, several concerns have been raised about the suitability of polyester moorings in such locations. One concern was whether polyester lines can offer the requisite stiffness to maintain acceptable platform offset in deeper waters (more than 1500 m) [8,9]. Another concern was the possible influence of size and weight of larger-sized polyester lines on the stability of the platform, which may exceed the storage capacity of the platform and, consequently, the holding capacity of the anchor [10]. As a result, attention has switched to investigating high-strength mooring ropes as an alternative to polyester. Mooring ropes with a higher modulus than polyesters, such as high-modulus polyethylene (HMPE) and Aramid have been used for different platforms due to their higher strength-to-weight ratio [11]. Generally, synthetic mooring ropes have a proven record of application in harsh operating conditions. Thus, the oil and gas industry opted for these lines in permanent mooring systems because of their exceptional performance characteristics [12].
The application of synthetic fiber ropes requires an adequate understanding of their strength, stiffness, and durability against cyclic loadings [13]. They are usually used as a major component of hybrid mooring lines to reduce mooring weight and cost for deep-water applications [14]. Thus, the mechanical properties of mooring ropes have been continuously improved over the years to guarantee a balance between cost and strength, to keep up with the rising challenges in extreme environmental conditions, and to limit platform excursion within a tolerable range [3,15]. Previous studies have investigated the performance of various mooring line materials such as polyester, Aramid, HMPE, and steel wires.
Experimental studies were conducted at sea for 1 year by Utsunomiya et al. [13], in which they determined the durability and residual strength of polyester moorings of floating wind turbines. The result showed no serious deterioration in terms of fracture of the strand. However, in terms of durability, a 2.9% strength reduction in breaking strength was recorded. An experimental system to approximately simulate the practical working condition of fiber ropes was developed in [10]; using the same procedure, the dynamic stiffness of HMPE mooring line was found to increase with increasing mean load and decrease with increasing loading amplitude, highlighting it as a better alternative to polyester lines. The study also revealed that the failure time of HMPE lines is less affected by the cyclic loading period. The dynamic responses of HMPE mooring lines with damaged lines were also investigated by Lian et al. [2]. The proposed inspection and evaluation were based on their examination of the FPSO mooring system. The influence of damaged fiber ropes on the performance of a hybrid taut wire mooring system was also studied in [4].
Flory et al. [9] investigated the failure of fiber mooring ropes due to axial compression fatigue, describing some failure incidence in Aramid, HMPE, and nylon moorings. They identified the rope structure as the root cause of failure rather than the yarn fiber material but did not directly relate the cause to the service life of a particular rope design. On the other hand, Aramid lines have been found to lose strength due to fatigue failure resulting from axial compression fatigue after a few thousand low-tension cycles, whereas HMPE ropes have been found to be significantly less susceptible in this regard. Interestingly, nylon and polyester were found to demonstrate no strength loss even after thousands of cycles in the axial compression fatigue test.
Montasir et al. [16] investigated the effect of mooring line properties on the restoring behavior of offshore mooring systems. They considered steel wire, nylon, polyester, and polypropylene mooring lines with deep-water truss spar by varying the wave heading of one of the mooring groups. The results highlighted that the difference in maximum platform horizontal offset was significant in polyester, polypropylene, and nylon but insignificant in steel wire. A comprehensive review on the optimization of mooring line design parameters (azimuth angles, line length, line diameter, mooring radius, line tension) for offshore floating platforms was presented in [17].
However, since the application of mooring lines is found in areas with different environmental conditions, it is important to consider as a future scope the performance of different materials with varying metocean data to further understand their behavior. This is important because previous studies on different offshore floating platforms revealed a significant influence on their responses, which will consequently affect the performance of these lines. For example, Rudmana and Cleary [18] investigated wave impact at varying angles on a semi-submersible platform with tension leg and taut moorings. They reported an increase in cable tension of about 1.6 times as the wave impact angle increased, thus having a significant effect on the integrity of the lines. Mai et al. [19] also highlighted the influence of wave variation on maximum crest height and wave loading.
Furthermore, the possibility of plunging wave breaking occurring in deep sea has also been reported, which could cause wave impact on the structure. Thus, to further ensure the survivability of mooring lines, it is important to evaluate the interactions between the floaters and extreme waves for structural assessment [20]. The impact of breaking waves on the FPSO bow reveals a significant effect on the dynamic response [21]. Hence, exploring these cases will further reveal the behavior of different mooring materials.
It is important to note that the selection of mooring line materials, especially for deep-water operations, has a great influence in terms cost and effectiveness of the overall mooring system [22]. Most of the studies previously conducted were more focused on the fatigue performance of these lines, but the effect of various degrees of mooring failure scenarios has received less attention, particularly for the FPSO taut mooring concept, despite the recommendation of Section 2 of DNVGL-S-E301 [23], which specifically highlighted the importance of analyzing mooring lines by considering the accidental limit state to ensure that mooring system has the adequate ability to maintain platform position in the event of one mooring failure. This is important because, in the event of mooring failure, the overall stiffness and static equilibrium position of the platform will tend to vary because of the transient responses.
The dynamics of FPSO exposed to varying environmental loading has an inherent mechanism of fluid–structure interaction (FSI). The combinations of the wave, wind, and current motivate the structural motions, which in turn generate disturbance of the wave field and, consequently, alter the magnitude of the wave force and platform motions. Previous studies included a detailed review of FSI approaches for wave-current interaction with offshore platforms [24], for interactions considering focused waves and FPSO [25], and for fixed offshore structures [26,27]. It is important to note that fluid–structure interactions are also relevant to marine and coastal structures such as bridge piers, as demonstrated by Istrati [28]. The hydrodynamic analysis of floating platforms is performed using either physical model testing or numerical simulations. In shallow waters, physical model testing using a complete scaled-down model is acknowledged as the most reliable approach. However, in deeper waters, the sizes of available wave tanks pose a great limitation in accurate scaling down of the water depth and the mooring lines considering the typical scale of 1:40 to 1:100 [29]. This is a serious concern because, at such depth, the line damping and added mass become too significant to be ignored. Hence, numerical simulations using different hydrodynamic analysis software are used, which can be classified in two approaches, i.e., computational fluid dynamics (CFD) and potential flow theory. In the context of this study, we utilize the potential flow theory available in ANSYS AQWA version 2020 R1 [30]. Most available hydrodynamic analysis software, for example, WAMIT, HYDROSTAR, AQUAPLUS, and AQWA, are based on the boundary element method (BEM), also known as the panel method [31]. Other methods that have been used in offshore and marine engineering include the finite volume method (FVM) [32], arbitrary Lagrangian–Eulerian (ALE) finite element method [33,34], smoothed particle hydrodynamics [35,36], and the coupled discrete element method and smoothed particle hydrodynamics (DEM-SPH) [37] and SPH-FEM [38].
Hence, this paper aimed to investigate the influence of polyester, Aramid, HMPE, and steel wire mooring lines on the hydrodynamic responses, mooring, and riser tension in intact and damaged cases. The coupled dynamic analysis was conducted using FPSO with turret taut mooring lines exposed to non-collinear waves, wind, and current peculiar to the Gulf of Mexico. The paper is arranged as follows: Section 1 is the introduction; Section 2 is a description of the FPSO model, environmental data, and numerical model validation; fully coupled dynamic analysis is presented in Section 3; mooring materials and line failure scenarios are presented in Section 4; the results and discussion are presented in Section 5; Section 6 contains the conclusions of the study.

2. Description of FPSO Model, Environmental Data, and Numerical Model Validation
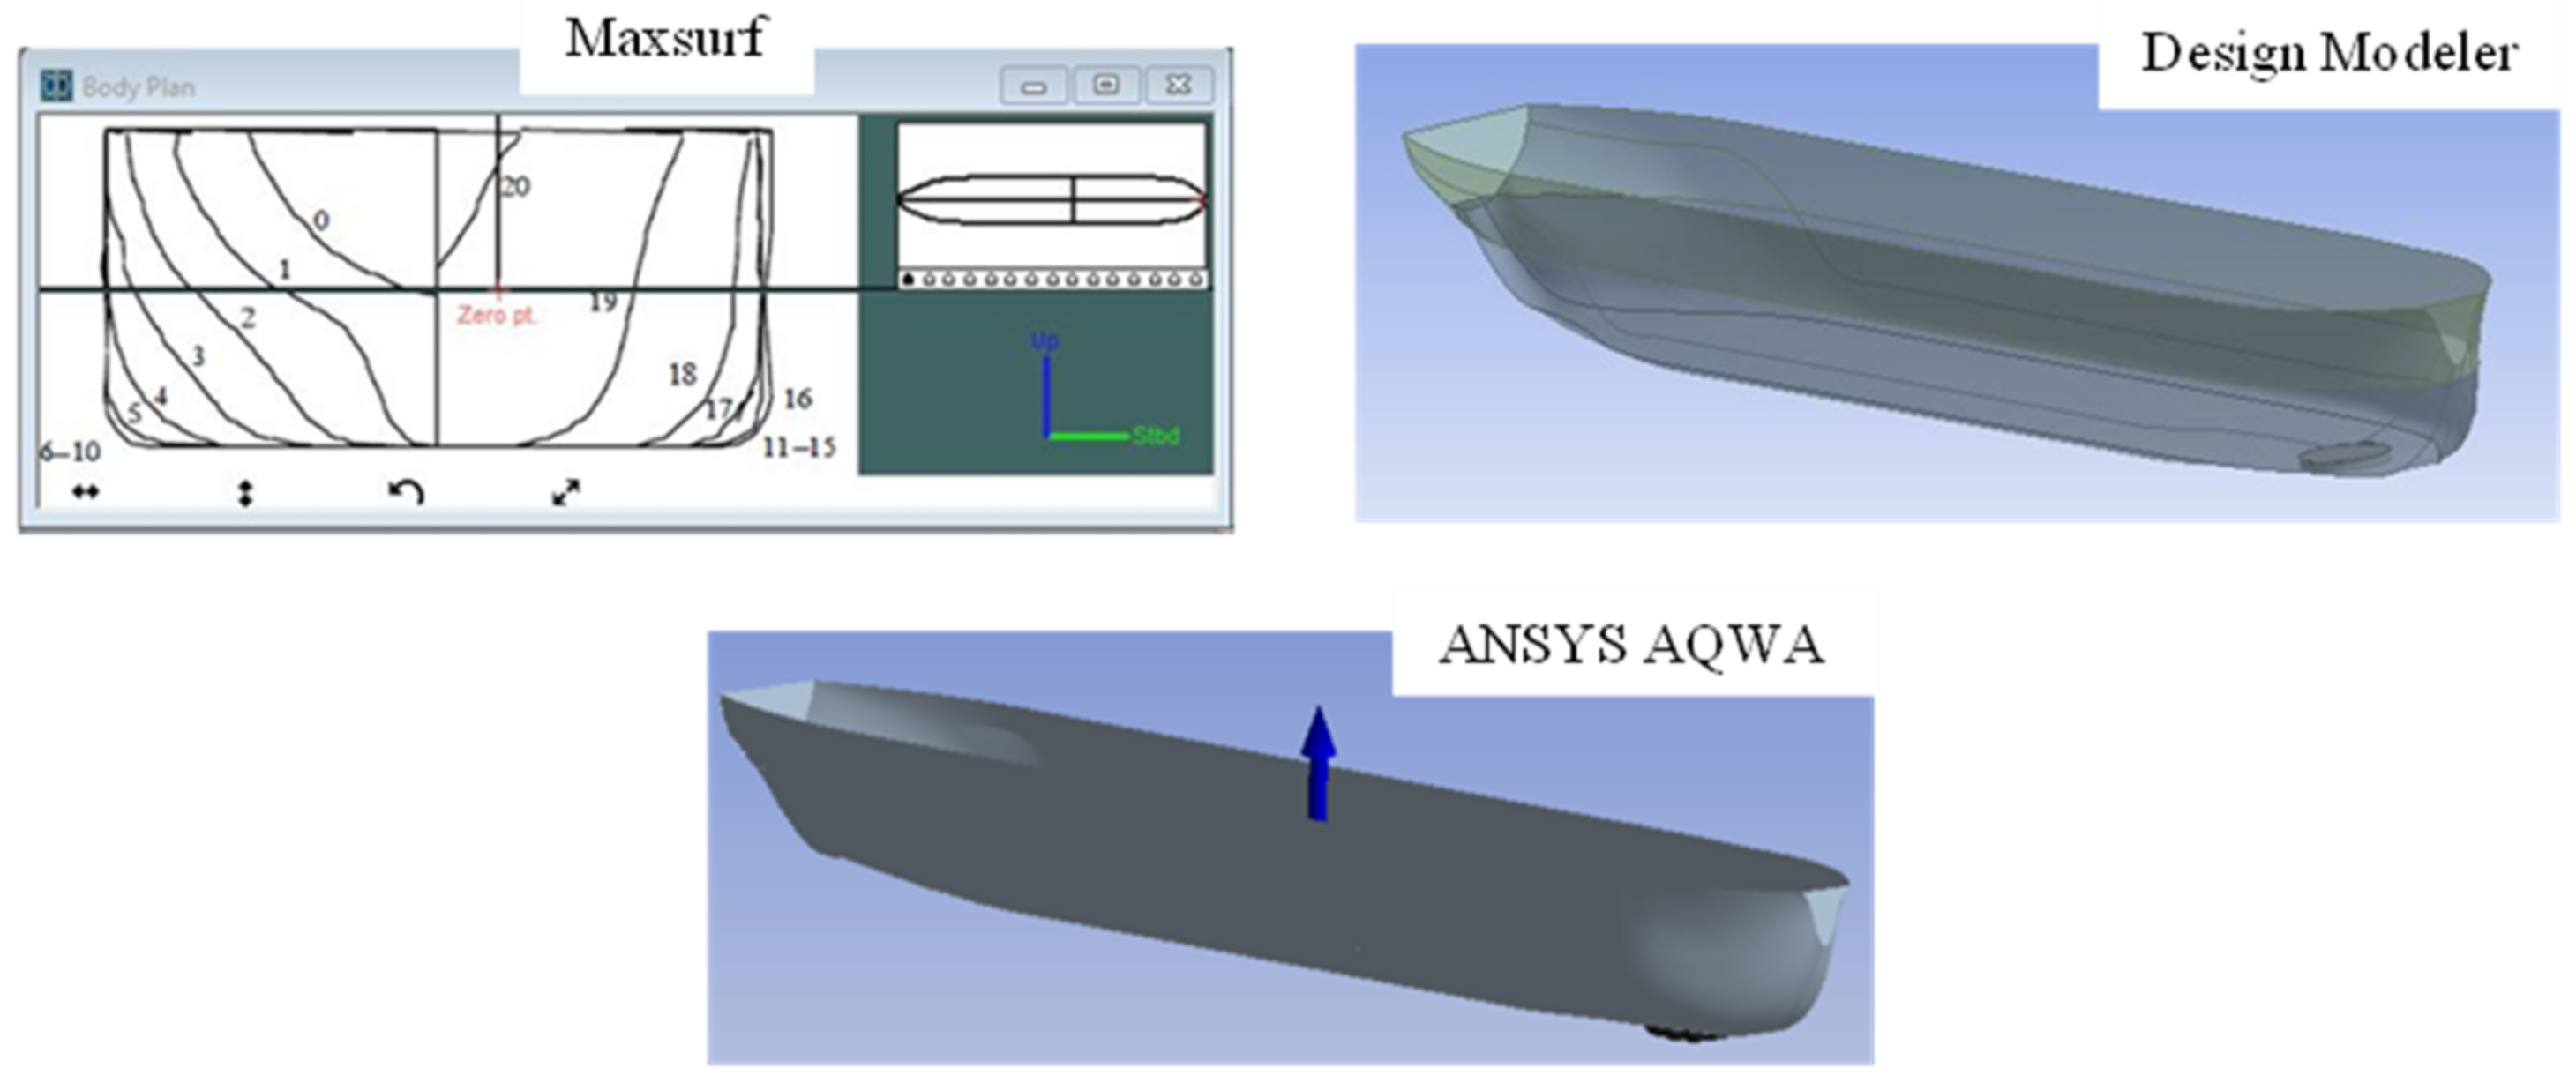
2.1. FPSO Model

The FPSO model used in this study is a turret-moored ship-shaped FPSO maintained in position by 12 multicomponent taut lines at 1829 m water depth. The FPSO together with the mooring system was adopted from [39], and the steel catenary risers (SCRs) were adapted from [40]. Table 1 shows the main parameters of the FPSO, which was very similar to that used in the DeepStar study [41].
An illustration of the numerical modeling procedure of the FPSO hull is provided in Figure 1. The hull was generated using Maxsurf software [42] and refined in the Design Modeler component of ANSYS and exported to ANSYS AQWA, where the entire validation procedure and analysis were carried out.
The hull meshing analysis was conducted with a maximum element size of 3 m and a defeaturing tolerance of 1.75 m, yielding a total number of 9295 elements, in which 6577 were considered diffracted elements. Figure 2 shows the meshed diffracted element of the hull. As part of the mesh sensitivity analysis, the 3 m mesh size was selected from five different mesh sizes used in the mesh convergence studies, ranging from 4 m to 2.8 m. Time-domain simulations were carried out for 1800 s. For all the degrees of freedom, line tensions were computed for the mesh sizes considered. The percentage difference in mean responses decreased as the mesh sizes decreased in all degrees of freedom. A general decrease in mean responses between 1% and 27% was recorded for a mesh size reduction from 3.25 m to 3 m. However, the values began to increase with a mesh size of 2.8 m.

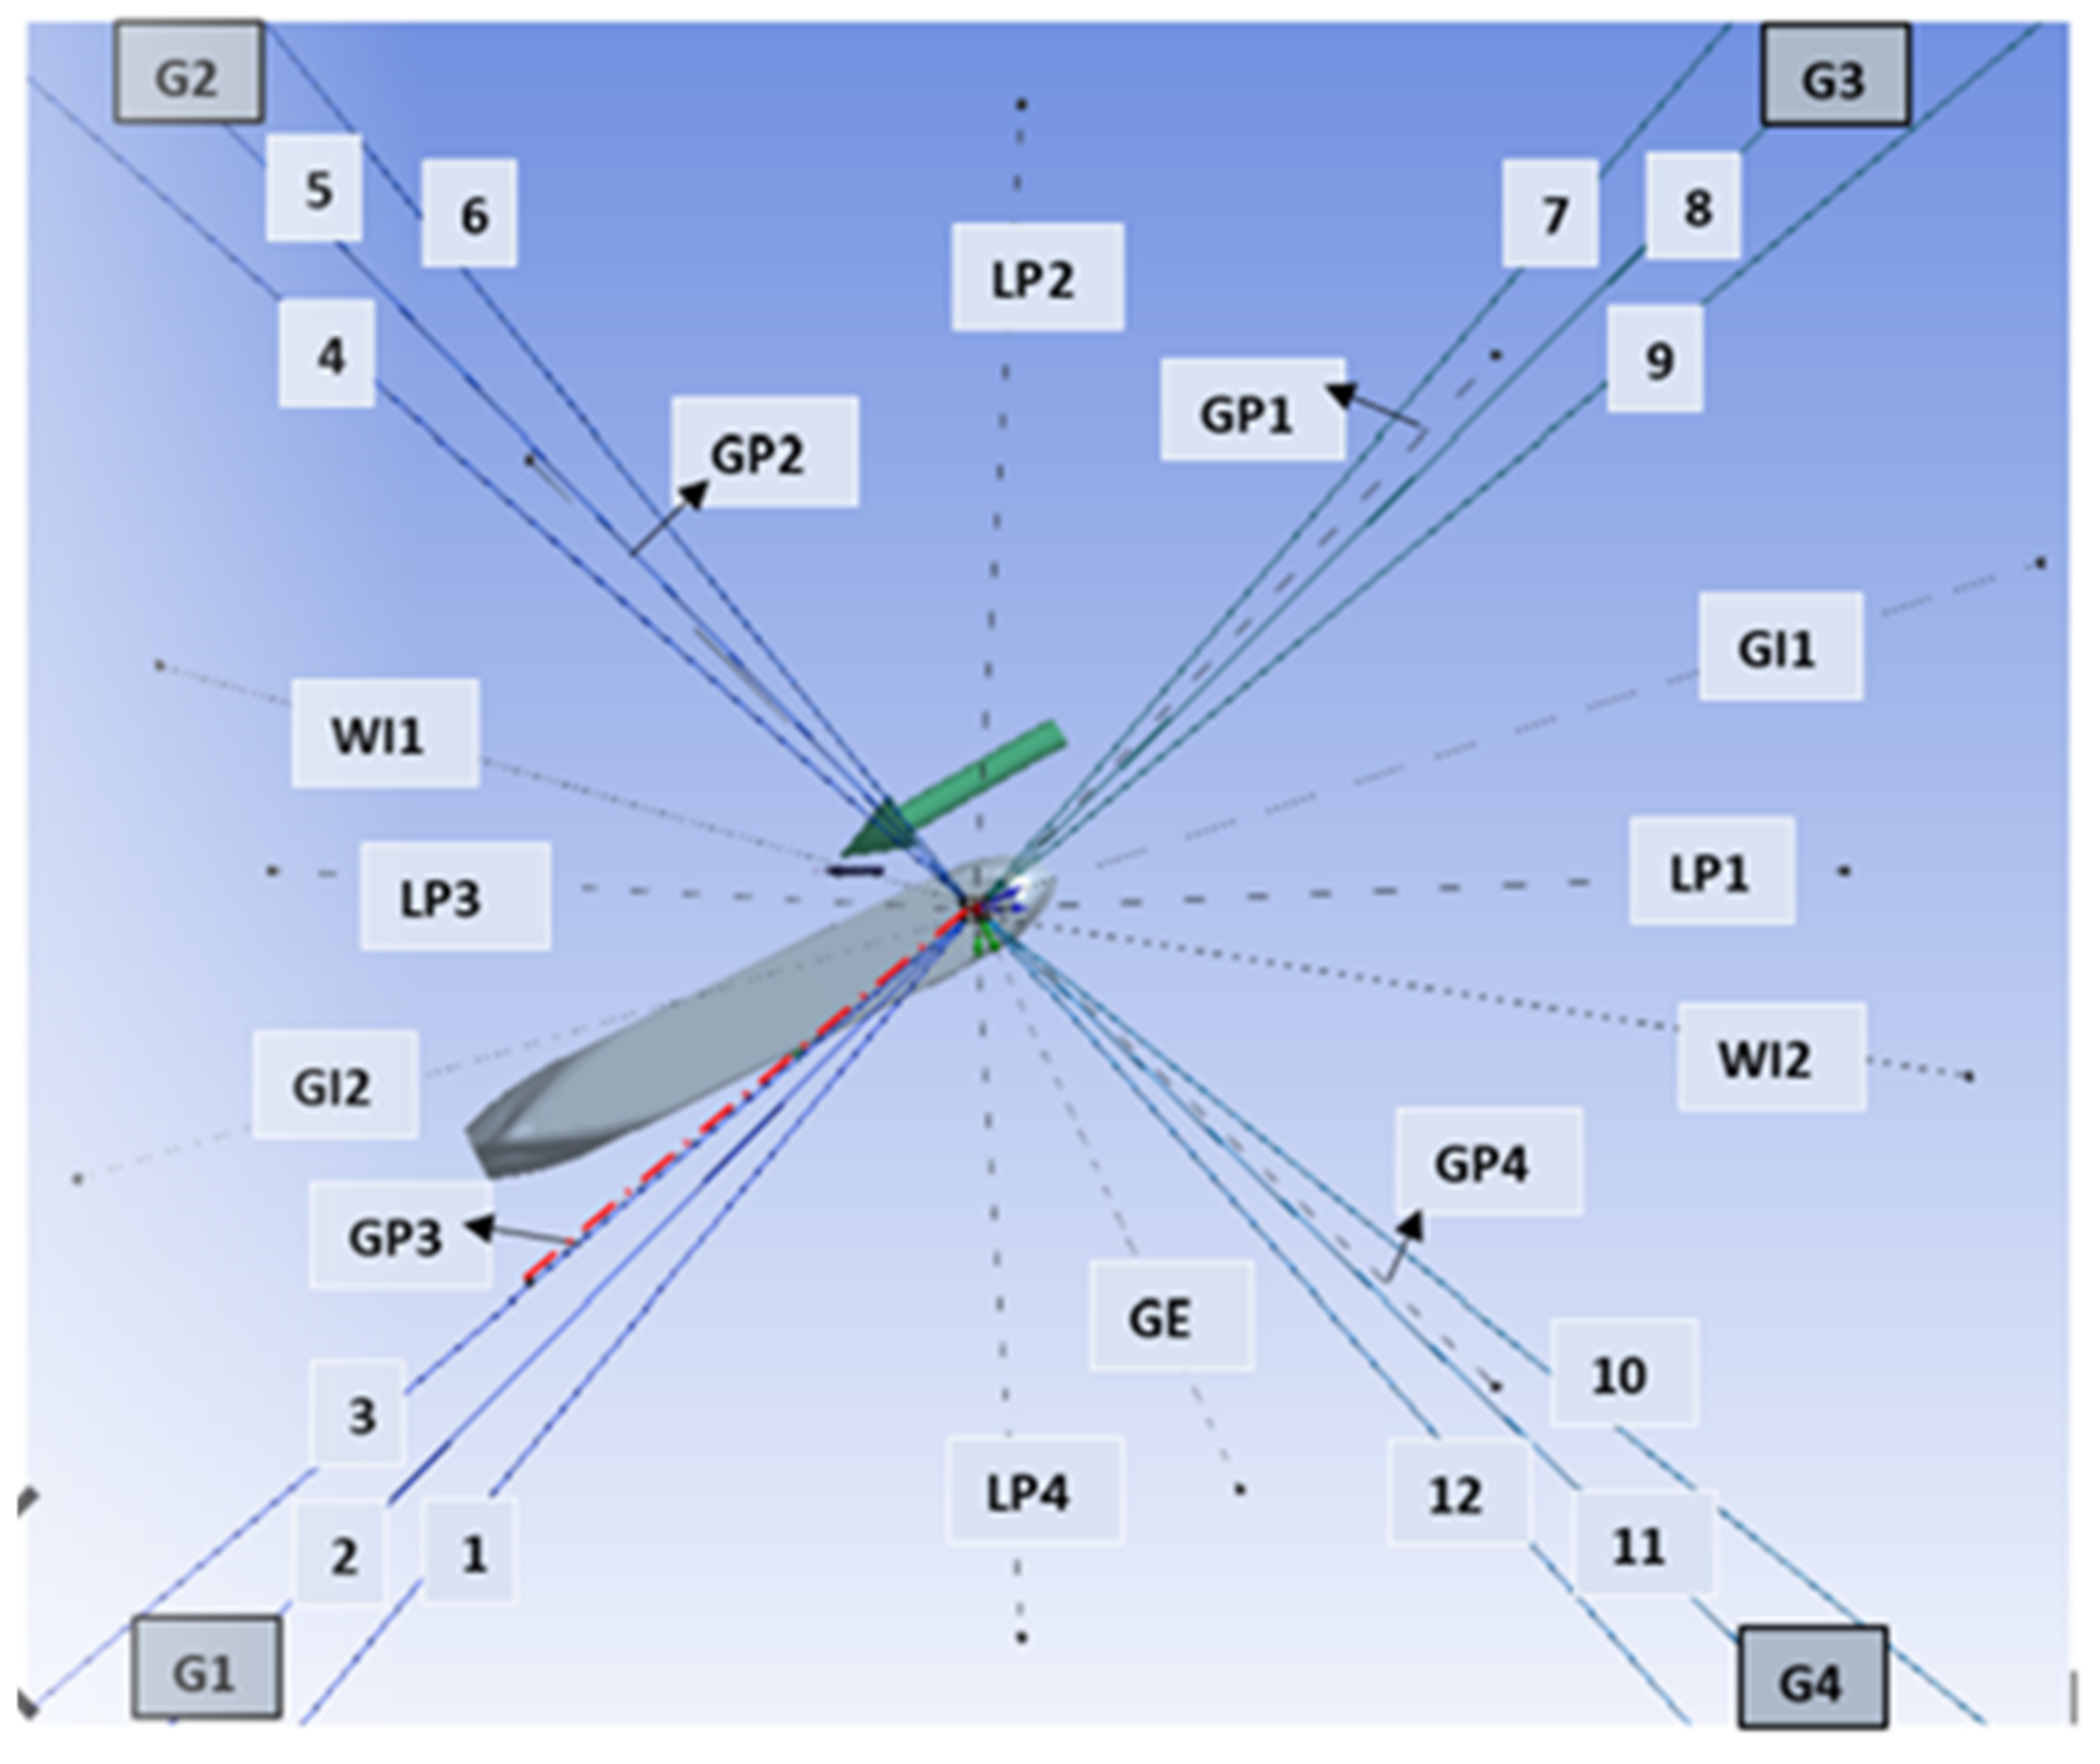
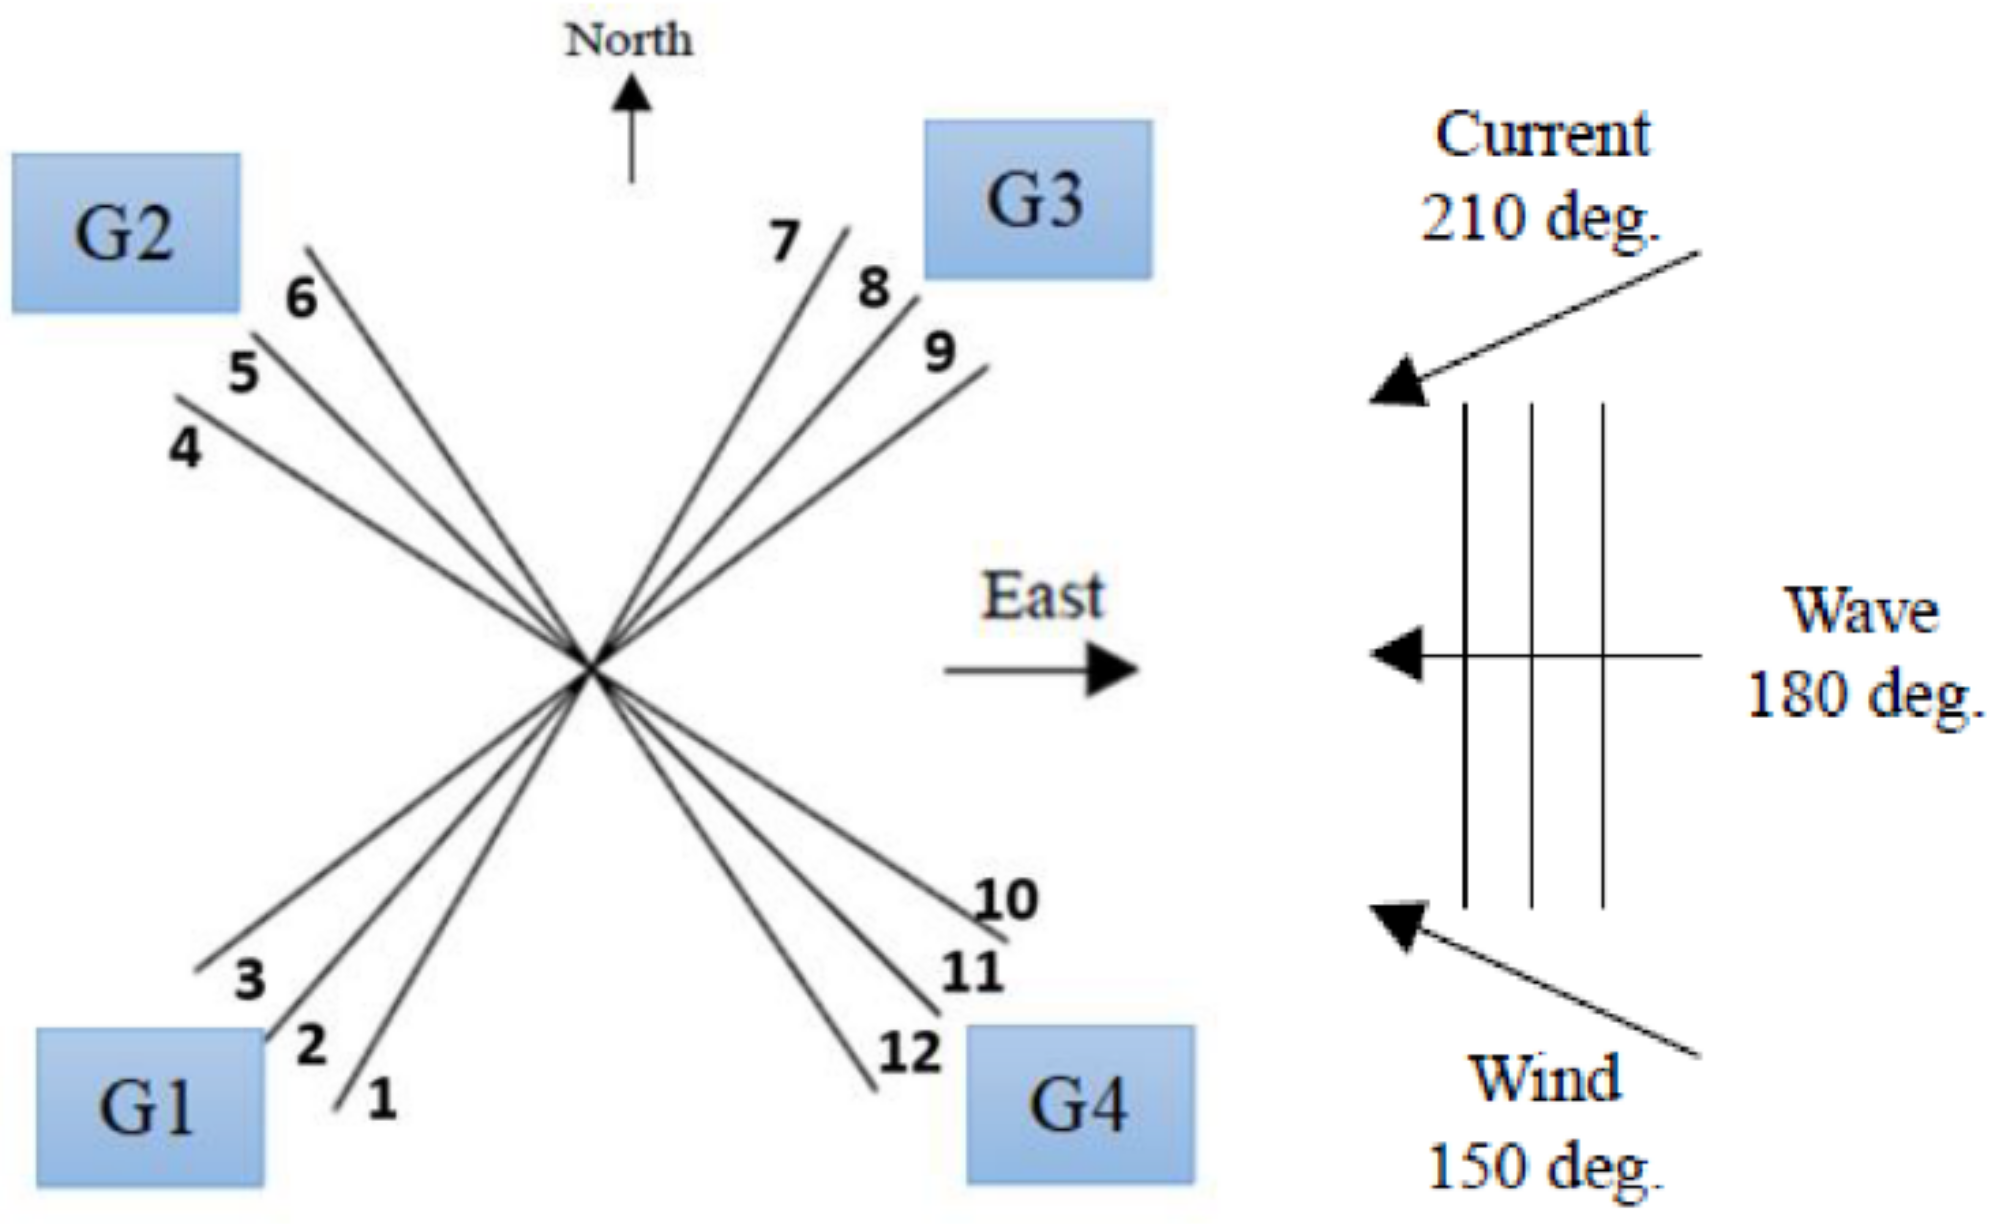
2.2. Turret Mooring System

The mooring system was an internal turret supporting 12 multicomponent mooring lines and 13 SCRs. The mooring lines were composed of three segments with chains connected at both ends to the turret bed and seabed. The lines were arranged in four groups, with each group consisting of three lines (4 × 3 configuration). The lines in each group were 5° apart. Figure 3 depicts the layout of the mooring groups (G1, G2, G3, and G4) and SRCs. The central mooring line of each group (i.e., lines 2, 5, 8, and 11 in Figure 1) was 90° away from the adjacent group.
The turret was positioned at 38.75 m from the forward perpendicular of the hull ( 12.5 %   of   L p p ), at an elevation of 1.52 m from the hull base (i.e., at an elevation equal to draft +1.52 from m.w.l).
Table 2 shows the details of the mooring lines used for the validation, while Table 3 shows the riser parameters.
As illustrated in Figure 3, the riser arrangement included four liquid productions (LP), four gas production (GP), two water injection (WI), one gas export (GE), and two gas injection (GI) elements.

2.3. Environmental Data and Prediction of Wind and Current Forces

2.3.1. Environmental Data

For both the validation and the main study, a water depth of 1829 m was used with 100-year hurricane conditions for the Gulf of Mexico. The wave spectrum used is JONSWAP with a significant wave height of 12.19 m and a peak period of 14 s acting at 180°, as illustrated in Figure 4 [39]. The wind loading was generated from the NPD spectrum at 150° with a mean velocity of 41.12 m/s acting at 10 m height. In addition, a current profile with a varying velocity of 0.941 m/s to 0.0941 m/s from mean sea level to the seabed was used.
It is important to point out here the importance of the ratio of wavelength/vessel length in the analysis of floating platforms. Previous studies on turret-moored FPSOs highlighted their inefficiency in swell-dominated long-wave conditions, whereby they lose heading control due to pitchfork bifurcation, observed to occur when the wavelength/vessel length is equal to 0.73 [44]. The result obtained by Zangeneh and Thiagarajan [45] also reiterated the occurrence of this instability at a wavelength-to-platform length ratio of 0.76. Thus, it is important to consider a wider range of metocean data to further explore the behavior of the lines.

2.3.2. Prediction of Wind and Current Forces

The wind and current force coefficients for the 80% loading condition considered were interpolated from Oil Companies International Marine Forum (OCIMF) [46] curves using Equations (1)–(3) for the resultant wind forces and moment and Equations (4)–(6) for the corresponding current forces and moment. Because these forces are expected to vary appreciably with varying yaw angles, the wind and current forces were calculated in advance in a range of −180° to 180° at 10° intervals, tabulated and used as input in AQWA. Some representative surge wind forces at 0°, −40°, −90°, −130°, and −180° angle of attack are −494.587 kN, −338.61 kN, −27.3536 kN, −317.616 kN, and 631.225 kN respectively.
F X w = 1 2 C X w ρ w V w 2 A T ,
F Y w = 1 2 C Y w ρ w V w 2 A L ,
M X Y w = 1 2 C X Y w ρ w V w 2 A T L B P ,
where F X w , F Y w , and M X Y w are the surge and sway wind forces and the yaw wind moment, respectively. C X w ,   C Y w ,   and   C X Y w are the wind coefficients to be extracted from the OCIMF curves [46]. Wind density is represented by ρ w , while V w 2   a n d   A T are the current velocity and hull transverse area, respectively. L B P is the length between perpendiculars of the FPSO.
The corresponding current/moment acting on the FPSO was calculated using the following formulas:
F X c = 1 2 C X c ρ c V c 2 L B P T ,
F Y c = 1 2 C Y c ρ c V c 2 L B P T ,
M X Y c = 1 2 C X Y c ρ c V c 2 L B P T ,
where F X c , F Y c , and M X Y c are the surge and sway current forces and the yaw current moment, respectively. C X c ,   C Y c ,   and   C X Y c are the current coefficients to be extracted from the OCIMF curves. Water density is represented by ρ c , while V c 2   a n d   T are the current velocity and draft, respectively. L B P is the length between perpendiculars of the FPSO.

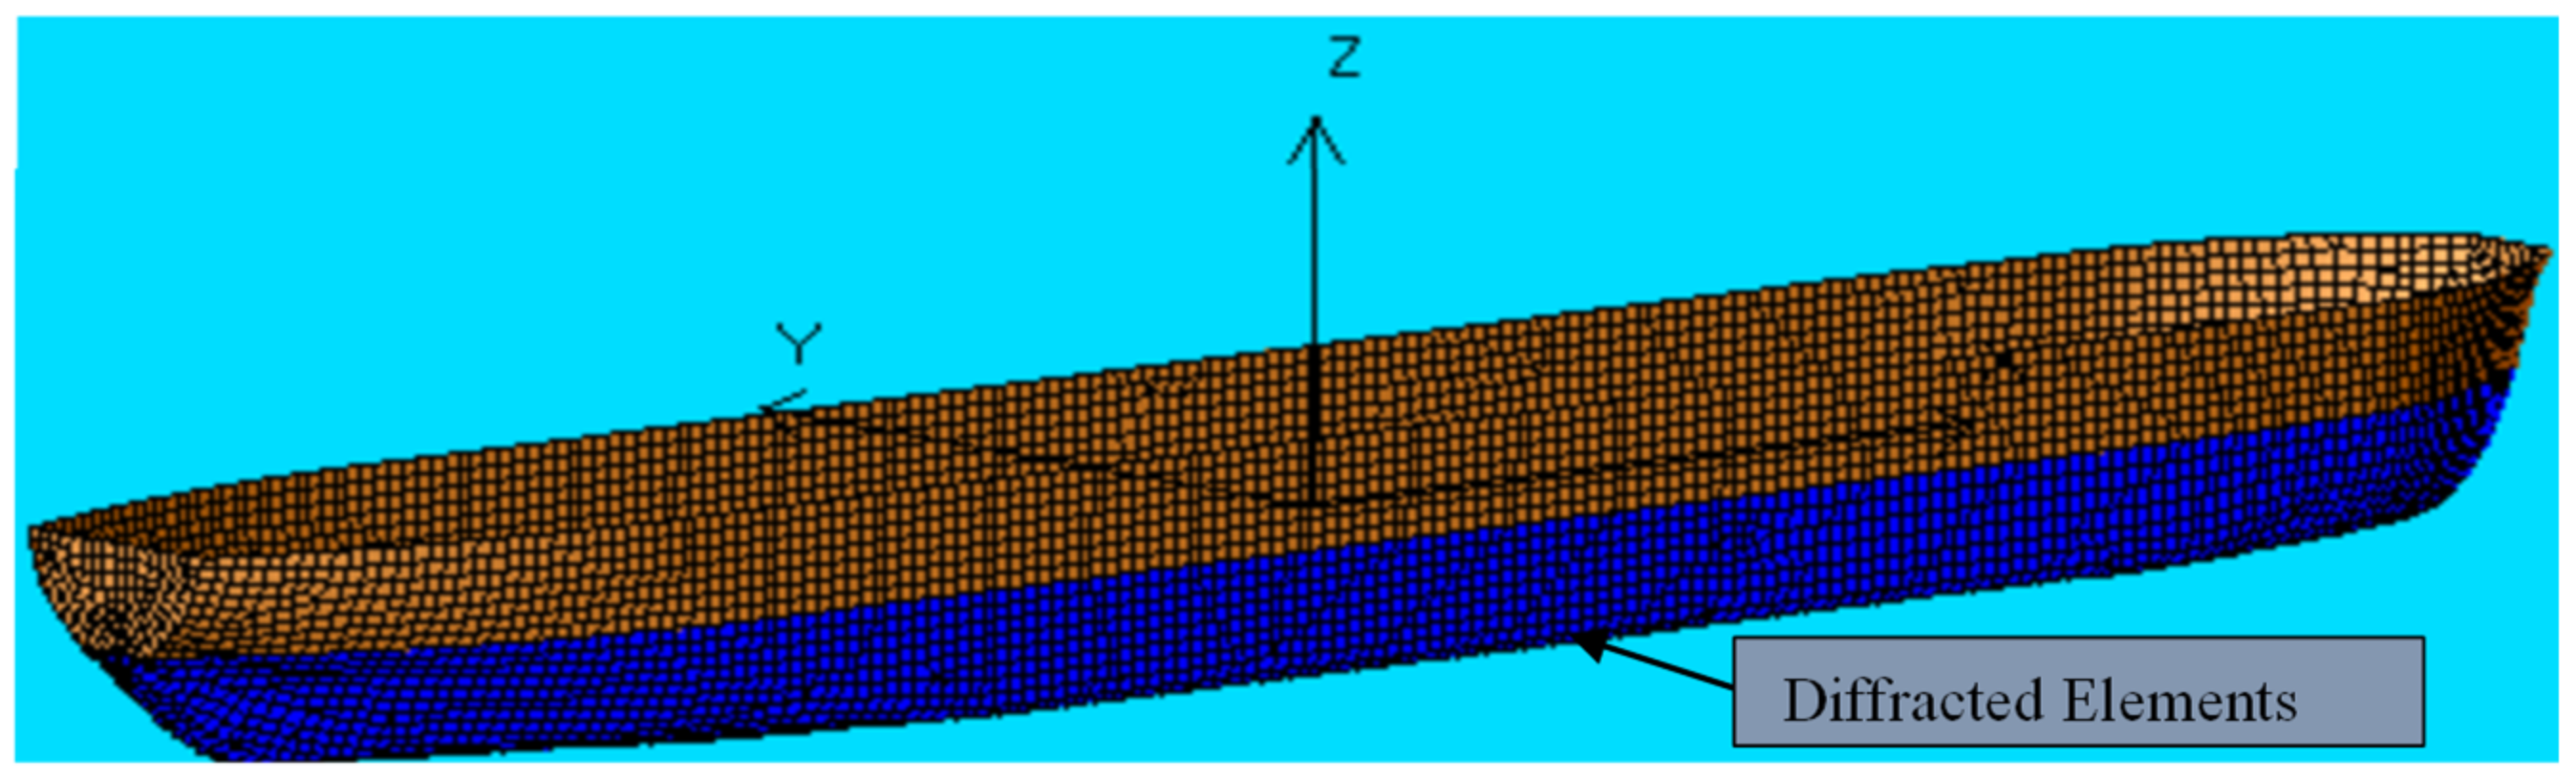
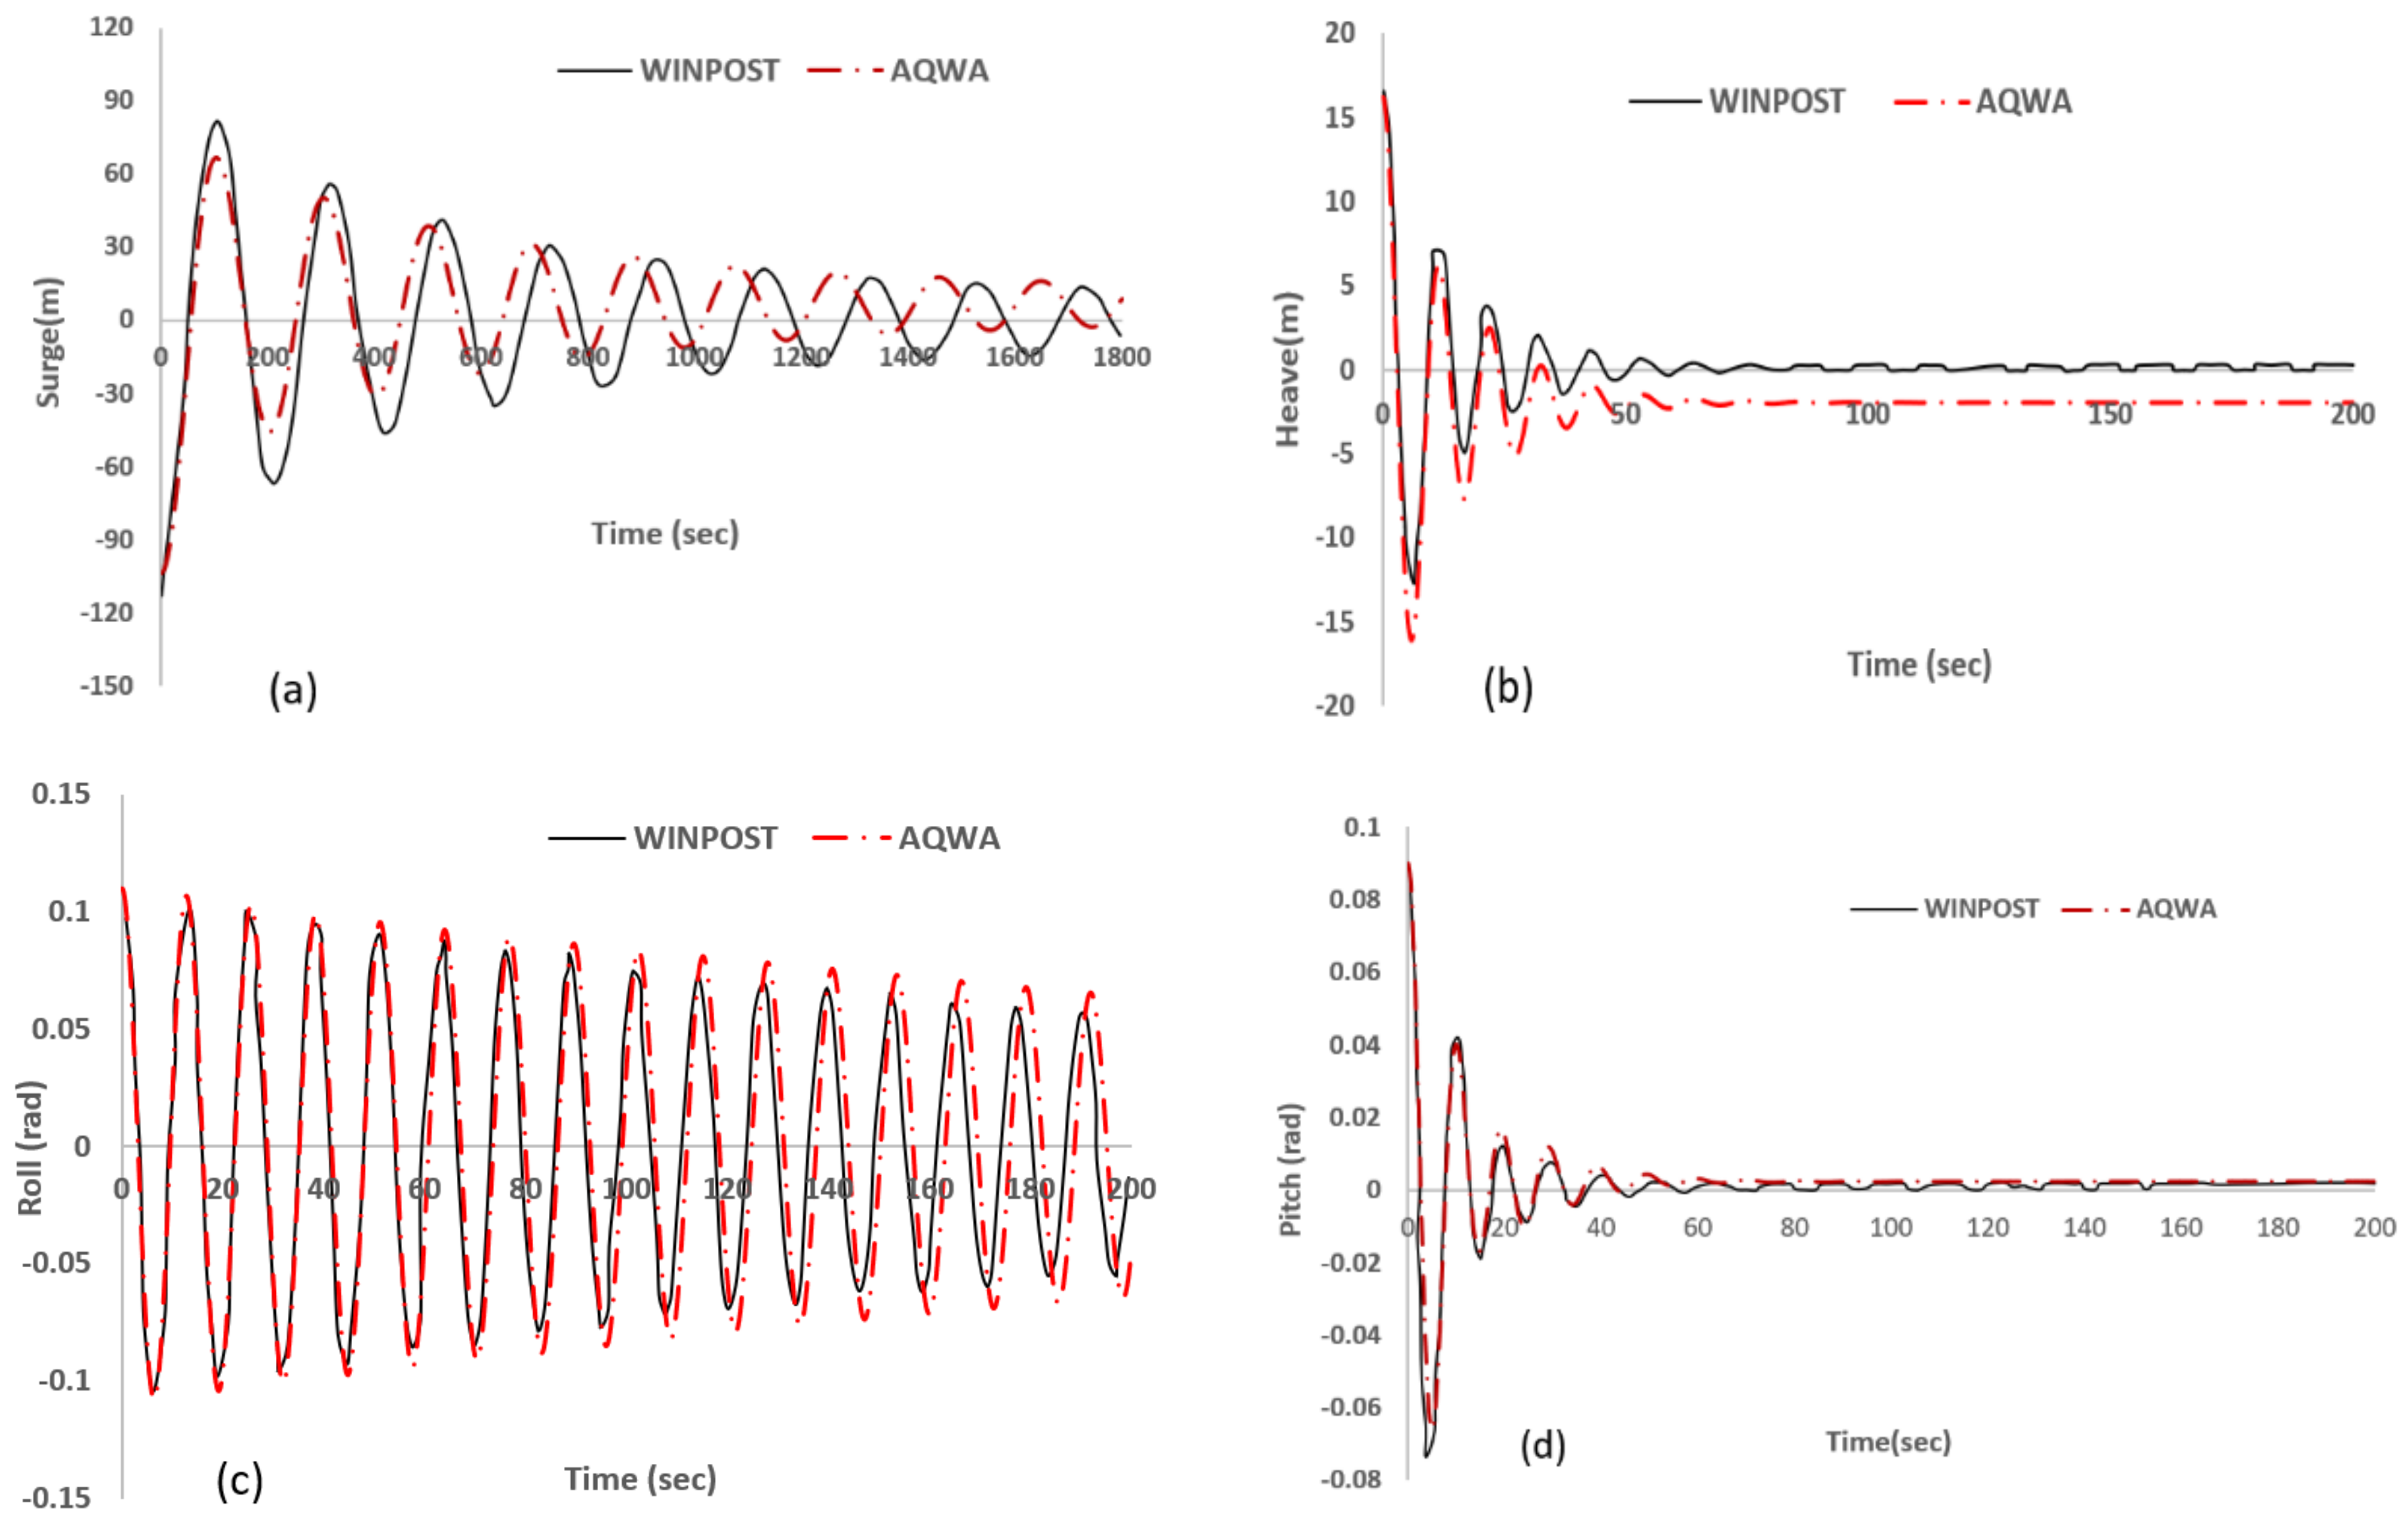
2.4. Validation of Numerical Model

Hull hydrodynamics to calculate added mass, radiation damping, and first- and second-order wave forces was implemented using the 3D radiation/diffraction method in AQWA. To allow for computation of second-order wave drift forces, the field solution was applied together with the full quadratic transfer function (QTF) matrix. Nine wave components ranging from 0.24 rad/s to 1.8 rad/s were used for the computation of force quadratic functions. This was followed by stability analysis to stabilize the model for time-domain analysis. A timestep of 0.02 s and a simulation duration of 12,000 s were used in the time-domain simulation.
For the validation procedure, the result was compared with published experimental (OTRC) and numerical (WINPOST) data [39]. The same model was then used for the main study. The validation procedure included static offset, free decay test, and fully coupled dynamic analysis.
Both static offset and free decay tests were numerically simulated in calm water.
The static offset test was performed to estimate the mooring system restoring force in the surge direction. The restoring force was obtained by incrementally displacing the FPSO in the surge direction (using the starting position tab), and the resultant horizontal force at each specified displacement was recorded and manually plotted [47].
The free decay test, on the other hand, was conducted to determine the natural periods and corresponding damping ratios of the FPSO in the surge, heave, roll, and pitch. The test was simulated in AQWA by numerically displacing the FPSO and releasing it to allow for oscillation in each of the degrees of freedom (DOF) considered. From each of the timeseries plots, the natural period was recorded by taking the average of individual time for a certain number of cycles. The logarithmic decrement formula was used for the computation of corresponding damping ratios, using Equation (7) [48].
ξ = 1 2 π .   l n a i a i + 1 ,
where ξ is the damping ratio, and a i and a i + 1 are the crest amplitude of the i -th and i + 1 -th cycles respectively.

3. Fully Coupled Dynamic Analysis

3.1. Wave Exciting and Radiation Forces

The software ANSYS AQWA uses the potential theory of diffraction and radiation to calculate wave exciting and radiation forces on a floating body [49]. Thus, the fluid flow surrounding the floating body is expressed by the velocity potential in Equation (8).
Φ X , t = a w φ X e i ω t ,
where φ X is a space-dependent potential, which may be separated into contributions of the platform responses in 6 DOF, and a w represents the incident wave amplitude.
The total velocity potential is, therefore, expressed in Equation (9) as a combination of potentials due to the incident, radiation, and diffraction.
φ X e i ω t = φ I + φ d + 6 j = 1 φ r j x j e i ω t ,
where φ I is the incident wave potential, φ d represents the corresponding diffraction wave potential, φ r j is the radiation wave potential due to motion in the j direction, and x j is the motion in the j direction, for the 6 DOF.
The incident wave potential for a unit amplitude ( a w = 1 ) is given in Equation (10).
φ 1 X e i ω t = i g a w cosh k s ω cos h k d e i ω t + k X cos χ + Y cos χ + ε ,
where d is the water depth, g is the gravitational acceleration, and ε is the wave phase. Furthermore, ω is the angular frequency, k is the wave number, and χ is the wave propagating direction, while X and Y is the water surface elevation.
The first-order hydrodynamic pressure distribution is computed using linearized Bernoulli’s equation, i.e., after the wave velocity potential is computed using Equation (11).
p 1 = ρ Φ X , t t = i ω ρ φ X e i ω t ,
where ρ is the water density, and the remaining terms are as earlier defined.
By integrating the pressure distribution over the wetted surface, various fluid forces can be calculated [49]. In addition, for forces and moments acting on the floating body, a general formulation is given in the form of a unit normal vector ( n   ) on the hull surface in 6 DOF as in Equation (12).
n 1 , n 2 , n 3 = n ,
( n 4 , n 5 , n 6 ) = r * n ,
where r is the position vector on the hull surface with respect to the center of gravity, i . e ,   r = X X g .
Using this notation relation, a generalized first-order hydrodynamic force and moment component is computed using Equation (13).
F j e i ω t = S O   p 1 n j d S = i ω ρ S 0   φ X n j d S e i ω t ,
where S O is the mean wetted surface of the platform.
Then, by substituting the velocity potential (Equation (8)) into Equation (13), a generalized equation for first-order forces on the hull is given in Equation (14).
F j = F I j + F d j + k = 1 6 F r j k x k e i ω t , j = 1 ,   6 ,
where F I j is the Froude–Krylov force due to incident wave, F d j is the diffraction force, and F r j k is the radiation force.

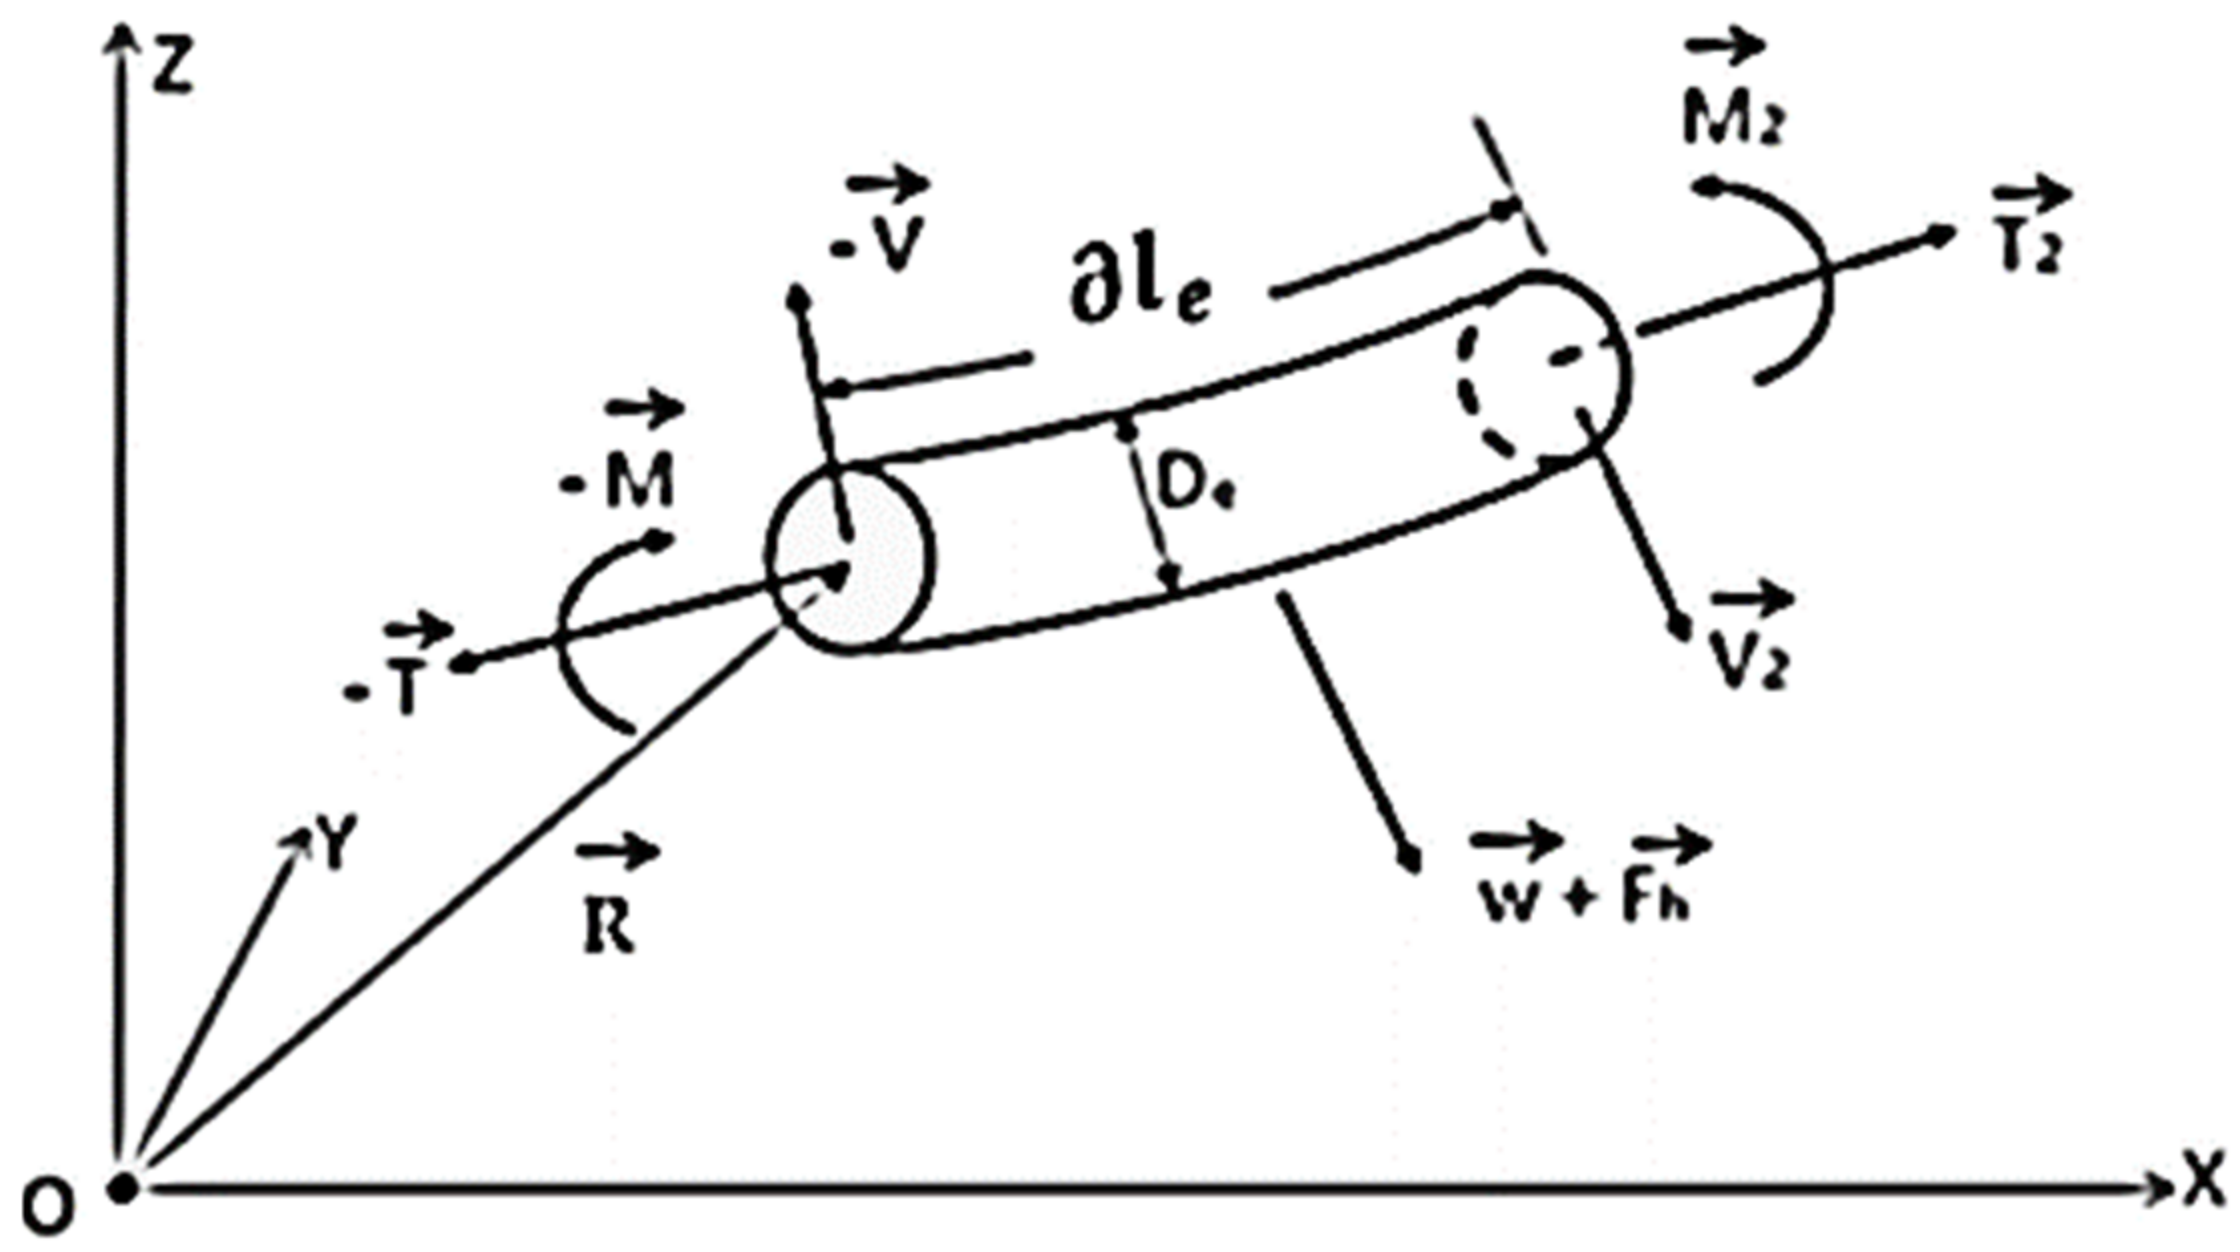
3.2. Mooring Line Dynamics

The effects of mooring mass, drag forces, inline tension, and bending moment are considered in AQWA cable motions analysis when the dynamics of the cable is included [49]. Since the mooring forces are expected to vary with time in connection to the platform motion, the lines tend to respond nonlinearly. Thus, the mooring tensions and platform responses are considered mutually interactive. The mooring dynamic responses in AQWA are solved numerically by utilizing the discrete lump-mass modeling technique as expressed in Equations (8) and (9). In this approach, the line is discretized into several finite elements where a mass of each element is concentrated into nodes and subjected to varying external forces, as illustrated in Figure 5.
When assuming no torque or twisting moment, each line segment’s motion equation is represented by Equations (15) and (16).
T l e + V l e + w + F h = m 2 Q t 2 ,
M l e + Q l e + V = q ,
where T is the element tension force vector at the first node, w is the element’s weight per unit length, and F h is the external force per unit length. Furthermore, m is the structural mass per unit length, while M is the bending moment at the first node of the element. Q represents the position vector, q is the distributed moment loading, l e and D e are the element length and diameter, respectively, and V is the element shear force vector at the first node.
The bending moment and line tension are related to the line material bending stiffness (EI) and axial stiffness (EA).
When dealing with mooring dynamics, it is important to note that wave excitation force is ignored [49]. Thus, the hydrodynamic force ( F h d ) acting on the line is the summation of the buoyant force ( F b ), drag force ( F D ), and added mass radiation force ( F a ), as shown in Equations (17)–(21).
F h d = F b + F D + F a ,
F h d = F b + F m a a j , a j + 1 T ,
where a j is the acceleration at node j, and m a is the line added mass matrix.
The element buoyant force matrix is expressed as
  F b = 0 , 0 , 1 2 ρ A c j L j g , 0 , 0 , 1 2 ρ A c j L j + M b g T ,
where A c j is the equivalent cross-sectional area, and M b is the mass of the buoy.
Equation (20) gives the time-dependent drag force of an element. This provides a simplified form of the frag force on a mooring line element.
  F d t = f d j 1 2 C d c S c ρ w U j t V j t U j t V j t f d j + 1 1 2 C d b S b ρ w U j + 1 t V j + 1 t U j + 1 t V j + 1 t ,
where C d c is the drag coefficient of clump weight, C d b is the drag coefficient of an intermediate buoy, and S c , is the surface area of the clump weight. S b represents the surface area of an intermediate buoy, while U j t is the structural velocity matrix at j , and V j (t) is the current velocity matrix at j .
In the time-domain analysis, the solution of dynamic responses of a cable at the given attachment locations can be obtained using Equation (21).
M u ¨ = F t o t a l ,
where M and F t o t a l are the assemble matrices for total mass and forces, respectively.

3.3. Equation of Motion

The positions and velocities of the floating platform are computed at each timestep by integrating the accelerations due to these forces in the time domain using the two-stage predictor–corrector numerical integration scheme [49]. In this study, irregular wave responses with slow drift were used to simulate real-time responses of the floating platform.
The motion of the floating platform is expressed using the convolution integral as expressed in Equation (22), since the sum of environmental load F t , as in the dynamic equation of motion, is not periodic with constant amplitude.
M + A a ¨ t + c a ˙ t + K a t + 0 t h t τ a ¨ τ d τ = F t ,
where M is the structural mass matrix, and A , is the added mass matrix at infinite frequency. The damping matrix is denoted by the symbol c , while K is the total stiffness matrix, h is the velocity impulse function matrix, and h(t) is the acceleration impulse function.
The time-domain equation of motion is then expressed by combining the vessel response with the mooring line equation as shown in Equation (16).
M + A a ¨ t = F 1 t + F 2 t + F c t + F w t + F m t + F W D t + F h s t c a ˙ t K a t 0 t h t τ a ¨ τ d τ ,
where F 1 is the first-order wave force, F 2 is the second-order wave force, and F c , is the current hull drag force. In addition, F w is the wind drag force, while Fm is the mooring force, and F W D is the wave drift damping force.

4. Mooring Material and Line Failure Scenarios

4.1. Mooring Material

Four different mooring line materials consisting of three synthetic lines and a steel wire were considered, i.e., polyester, high-modulus polyethylene (HMPE), Aramid, and a six-strand steel wire. Polyester lines are very compliant and lightweight with moderate strength, whereas HMPE and Aramid are lighter than polyester while having higher stiffness. On the other hand, the six-strand steel wire is moderately stiff, light, and strong.
The mooring lines are multicomponent, with the top and bottom segments consisting of chains, and synthetic materials and steel wire in the middle segment. Thus, the focus of this study was on the middle segment; each of the lines was replaced by changing the submerged weight (Sw), axial stiffness (EA), and minimum breaking load (MBL) for each material. The material properties were derived using the numerical expressions in Table 4, where d is the diameter of the line in millimeters.
Table 5 shows the compiled properties of the different mooring line materials.

4.2. Mooring Line Failure Scenarios

According to the provisions in Section 2 of DNVGL-S-E301 [23], mooring systems are to be analyzed for an accidental limit state to ensure that they can sufficiently withstand the case of one mooring line failure for an unknown reason. This is because the transient responses, the overall stiffness, and the static equilibrium position of the platform are influenced in the event of mooring failure.
Thus, to comprehensively analyze the behavior of the various mooring line materials under consideration, each material was examined in intact and damaged conditions. Cases of single- and double-line failure were thoroughly investigated. For each of the damage cases, the line with the highest tension was configured to fail at a specific time during the simulation (i.e., time corresponding to the maximum tension). In the case of single-line failure, the line with the highest tension was chosen after simulation in an intact state, whereas, in the case of double-line failure, the line with the highest tension was chosen after simulation with single-line damage. Table 6 shows the damaged lines for each material with corresponding failure times. In each case, the numerical simulation was performed for 12,000 s with a 0.02 s timestep. In addition, a static offset test was performed with each material to determine the influence of line failure on the restoring forces of the mooring system.

4.3. Selection of Representative Mooring and Risers for Tension Analysis

To investigate mooring tension for each of the mooring materials, two representative mooring lines were selected, line 7 for the synthetic lines and line 12 for steel wire. The representative lines were selected as the last remaining lines in the group after the double-line failure cases. In the case of synthetic moorings, lines 9 and 8 were selected to fail as shown in Table 6, both lines belonging to group 3 (G3 in Figure 2). Since line 7 was the only line left after the double-line failure, it was the best representative to account for the influence of both single- and double-line failure on the mooring tensions. For the steel wire, lines 10 and 11 were chosen to fail in the single- and double-line failure cases, leaving line 12 as the group’s representative.
The aim of ensuring minimum platform offset is to ensure that the integrity of the oil and gas risers are maintained. For brevity, only two representative risers, i.e., line production (LP) and gas production (GP), were selected to statistically investigate the influence of different mooring line failures on the connection point tension of risers.

5. Results and Discussion

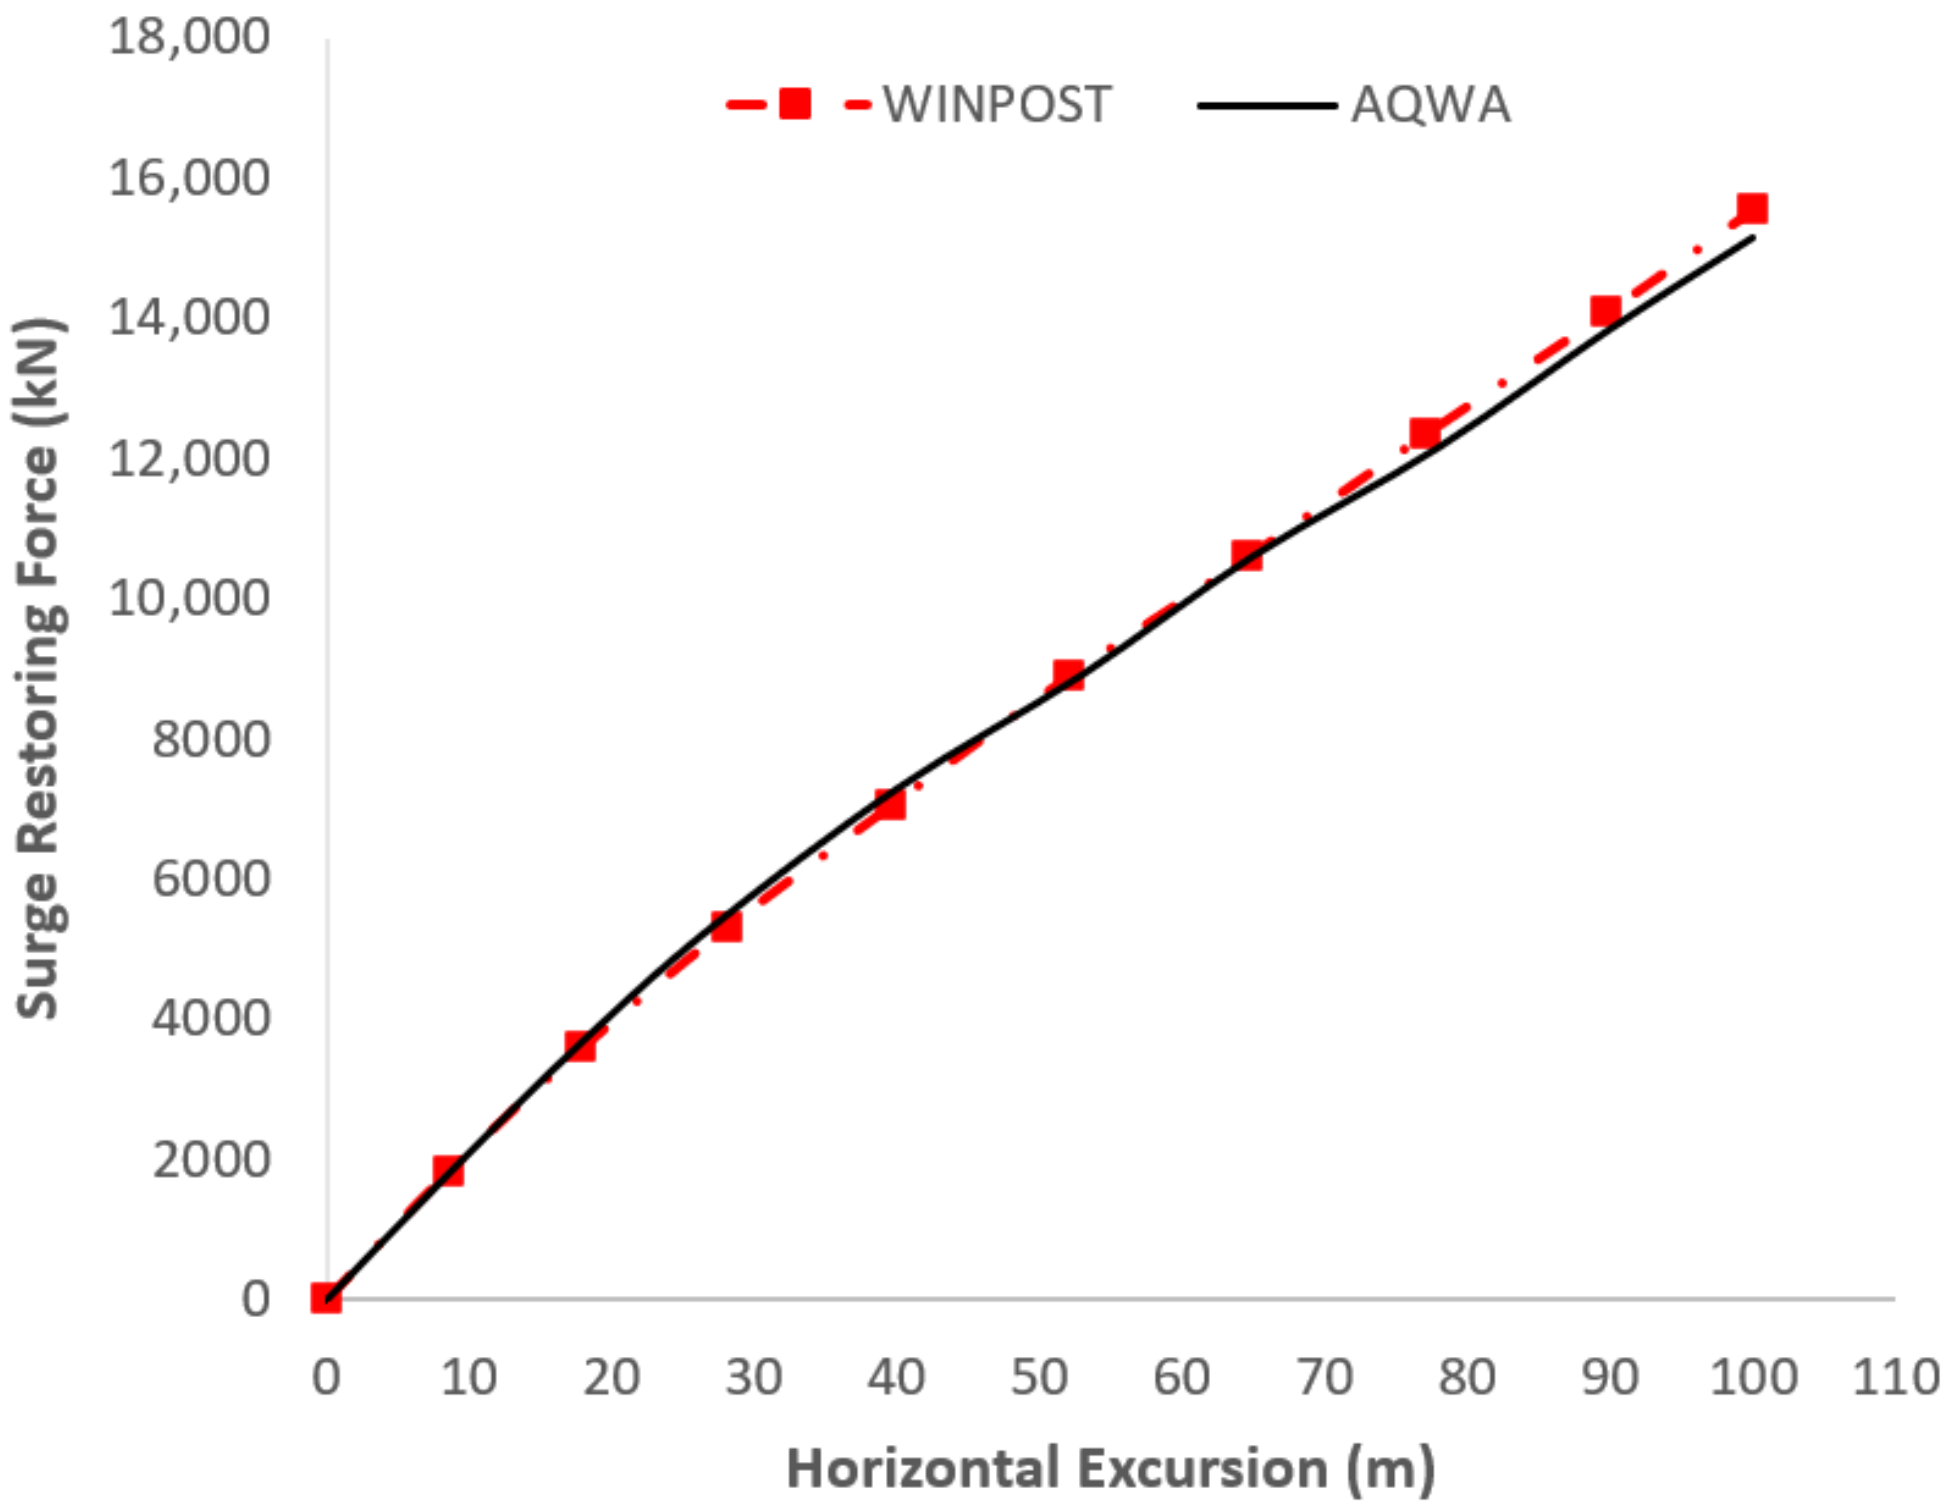
5.1. Validation of Numerical Model

Figure 6 and Figure 7a–d shows a comparison of restoring forces and free decay for AQWA and WINPOST models.
As shown in the figures, the mooring system restoring force and the free decay timeseries plot for surge, heave, roll, and pitch compare well with the published simulation results. From the free decay timeseries plots, the natural periods and corresponding damping ratios of the 4DOF as presented in Table 7 can also be observed to compare very closely with the WINPOST and OTRC experimental results.
Table 8 compares the hydrodynamic responses of AQWA in 6DOF with published responses of WINPOST and OTRC. The agreement between the results demonstrates the validity of the modeling procedure adopted.

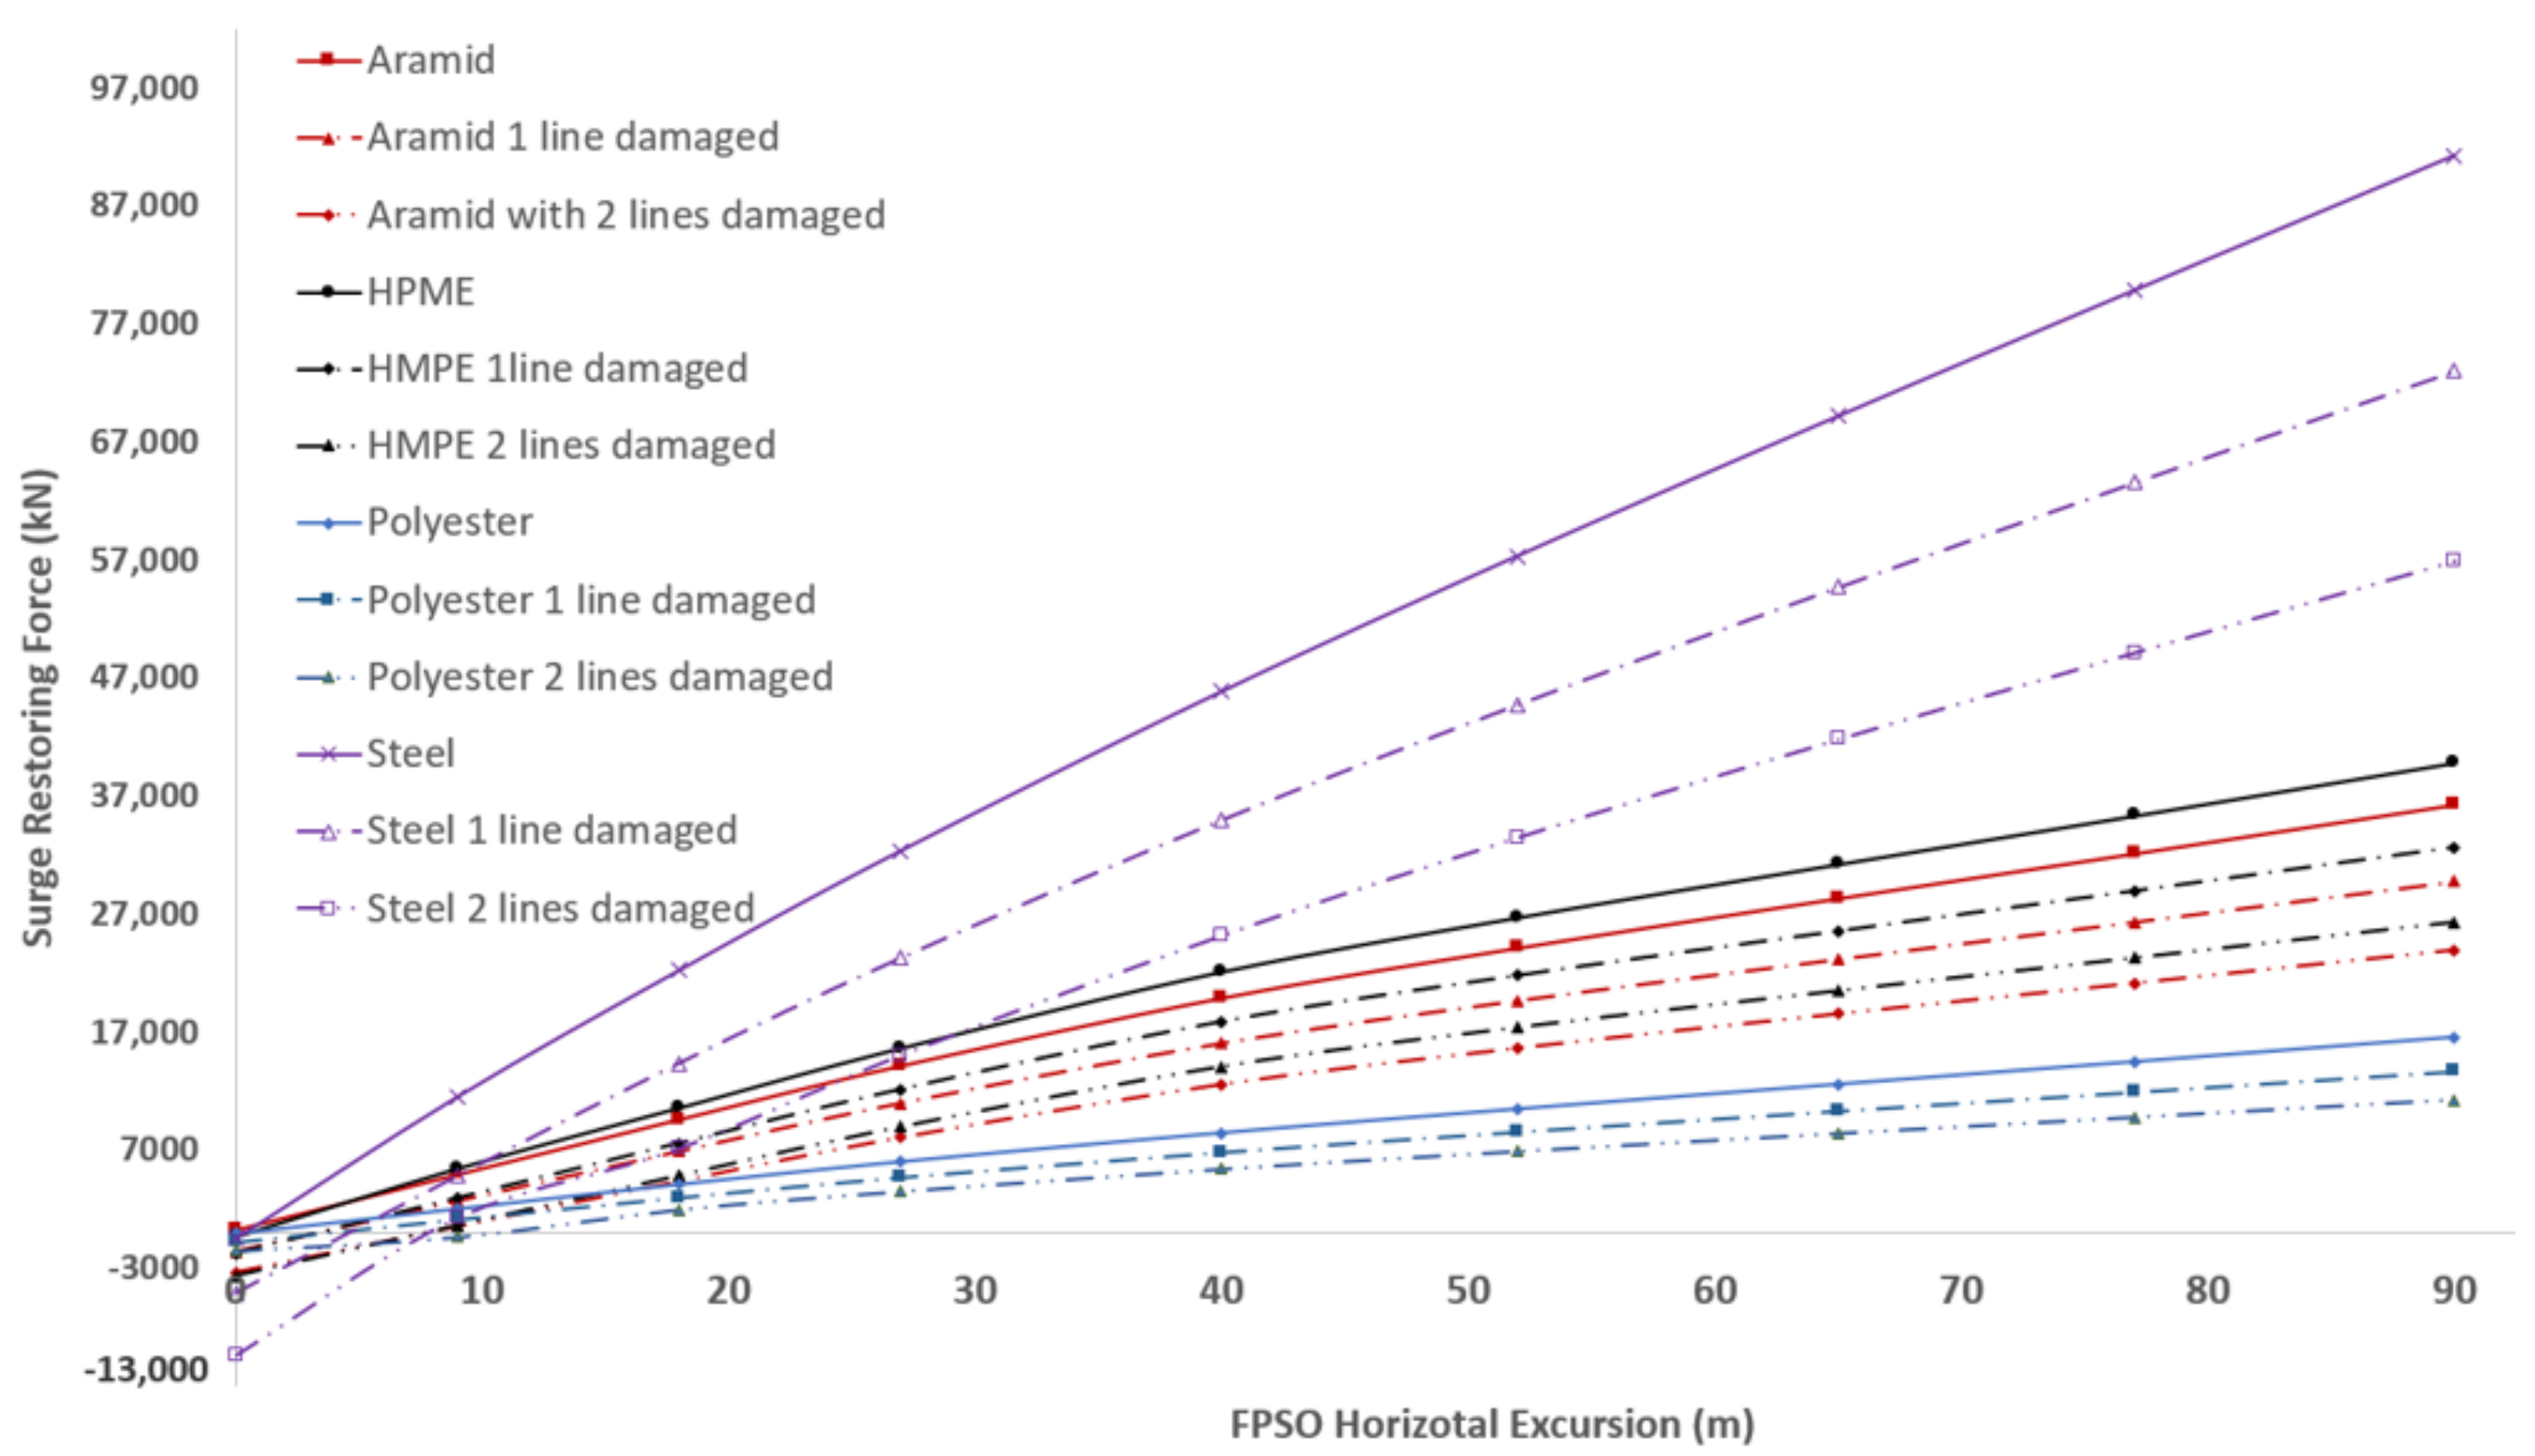
5.2. Static Offset Analysis of Different Mooring Line Materials

Figure 8 compares the surge restoring forces of FPSO mooring systems with Aramid, HMPE, polyester, and steel wire as the middle segment of each of the 12 mooring lines, considering intact, single-, and double-mooring failure scenarios.
According to the mooring layout in Figure 1, the mooring system surge restoring force in the intact condition was provided by mooring groups 1 and 2 consisting of lines 1, 2, 3, 4, 5, and 6 since the platform displacements were in the opposite direction (i.e., toward groups 3 and 4). Hence, the damaged lines were selected from these groups in the case of static offset. In the intact condition, a mooring system consisting of steel wire lines was observed to depict the highest restoring force of 91,252 kN followed by HMPE, Aramid, and polyester with corresponding restoring forces of 39,865 kN, 36,299 kN, and 16,564 kN, respectively, which is clearly in the order of increased axial stiffness of the material. For each of the failure cases, the line failure was observed to have a significant influence on the restoring force. In the case of single-line failure, the highest restoring force variation when compared with the intact condition was recorded in steel wire with a decrease of 22% followed by 19.4%, 19.36%, and 17.97% in HMPE, Aramid, and polyester, respectively. The same trend was observed for double-line failure, with 37.55%, 33.91%, 33.87%, and 31.89% reductions for steel wire, HMPE, Aramid, and polyester, respectively. The trend of reduction in restoring force due to line failure revealed that a stiffer material led to a higher reduction in mooring system restoring force in the event of failure.

5.3. Hydrodynamic Responses of FPSO in 6DOF

This section examines the hydrodynamic responses of the turret-moored FPSO with different mooring materials in intact and damaged conditions.

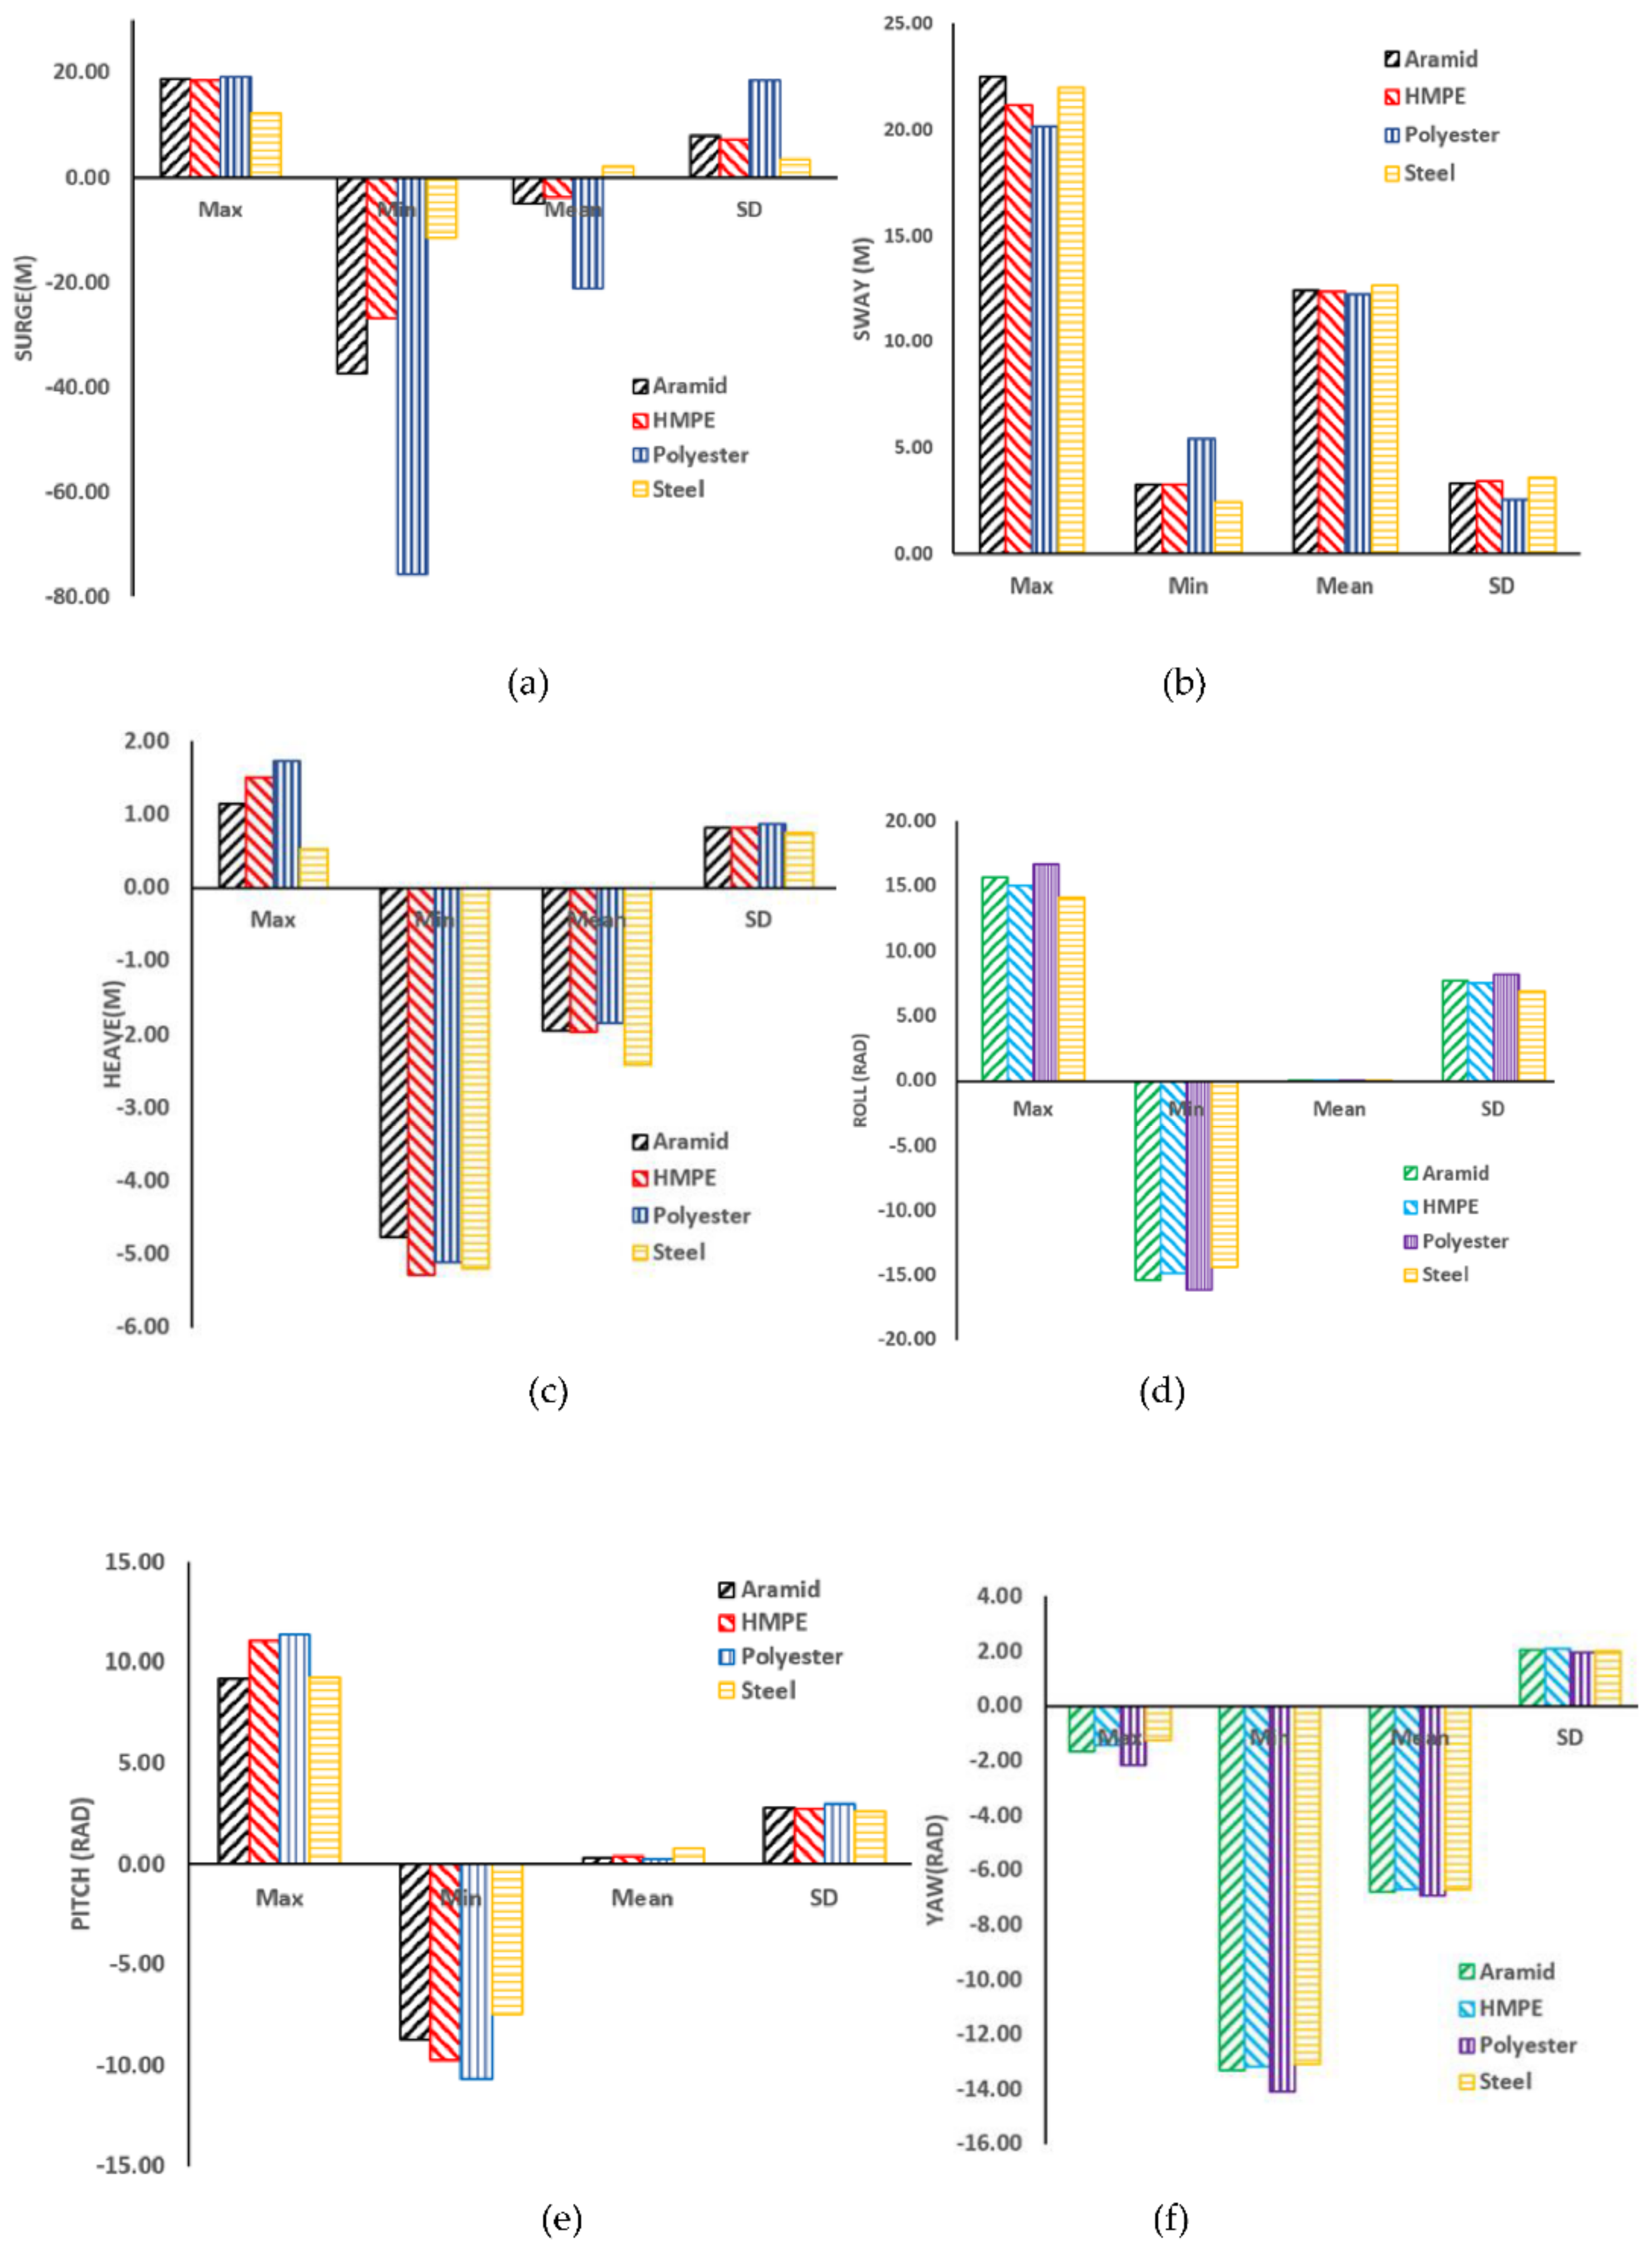
5.3.1. Dynamic Responses in Intact Condition

Figure 9 shows the statistical comparison of FPSO responses in 6DOF based on fully coupled dynamic analysis in intact conditions. The mean surge responses shown in Figure 9a were significantly higher for polyester mooring lines with −21.2 m with a standard deviation of 18.51, followed by a mean offset of −4.86 m and a corresponding standard deviation of 7.89 m for Aramid material. HMPE and Steel wire mooring lines, on the other hand, experienced mean surge displacements of −3.69 m and 2 m, respectively. In general, the axial stiffness of the lines had a great influence in dictating the surge motion. A higher material stiffness led to a lower response. The platform surge response was observed to decrease significantly with increasing material restoring force (Figure 8), in the order polyester, Aramid, HPE, and steel wire.
Figure 9b shows the sway responses in all mooring materials having almost the same mean sway offset in the range of 12 m. As presented in Figure 9c, steel wire mooring showed the highest response, while polyester had the lowest. In contrast to surge motion, where polyester lines with the lowest stiffness recorded the highest response, in heave, a higher material stiffness led to a higher response. This might be due to the line being under more tension due to its lower elasticity resulting from higher stiffness. Figure 9d,e show the roll and pitch responses; for all the mooring materials, the mean responses were below 0.3 rad. The yaw responses are presented in Figure 9f; for all mooring materials, the responses were observed to behave in the same way, with a value of approximately −6 rad.

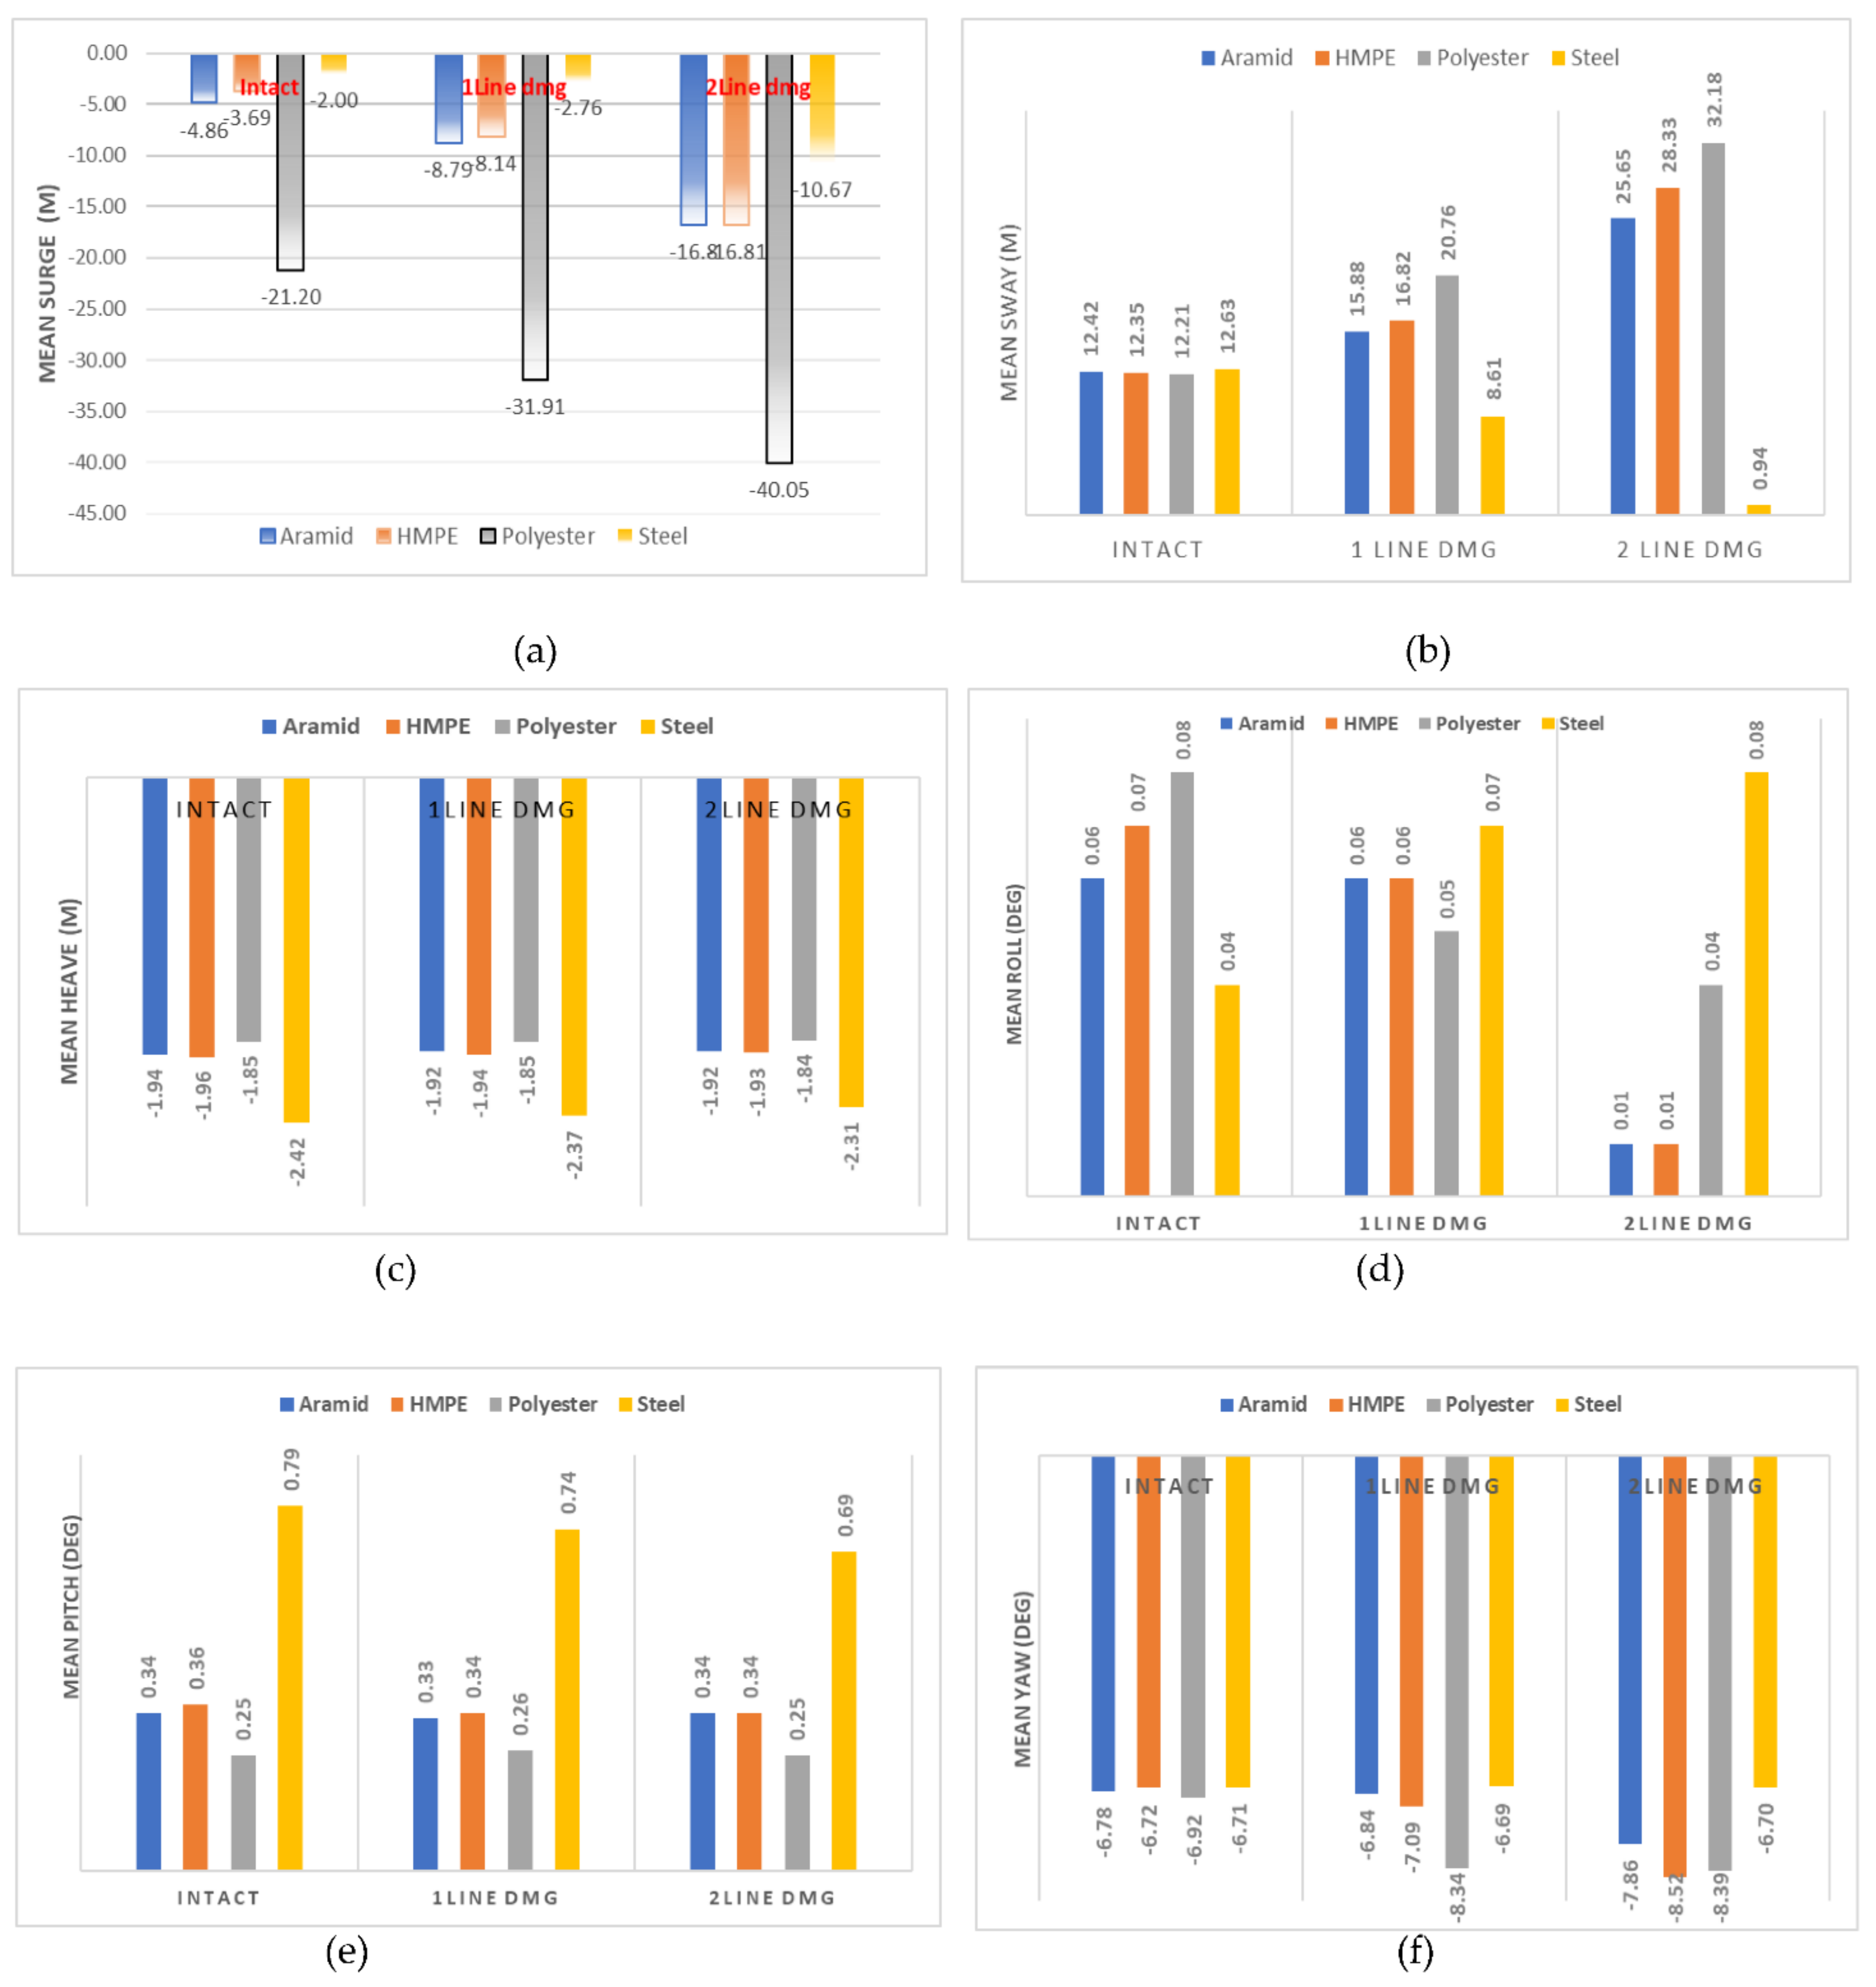
5.3.2. Mean Dynamic Responses in Intact and Damaged Conditions

Considering the analysis described earlier, the mean responses of the FPSO with different mooring materials are presented in Figure 10 for the 6 DOF considering intact, single-line, and double-line failure cases.
Figure 10a shows the mean surge platform offset of the four materials considered. For the failure cases, platform offset increases of 33.6% and 47.1% for single- and double-line failure were recorded in the mooring system with polyester mooring lines, respectively. Similarly, increases of 44.7% and 71.1% were recorded for Aramid lines in the two failure cases, while 54.6% and 78.0% increases were recorded for HMPE lines, and 27.54% and 81.26% increases were recorded for steel wire mooring lines, respectively. According to the results, HMPE had the highest increase in surge offset resulting from single-line failure, while the lowest was recorded in steel with a 27.54% increase. The synthetic materials were observed to behave differently from steel wire moorings. The increase in offset due to single-line failure was observed to increase with increasing material stiffness for the synthetic mooring materials, in the order of HMPE, Aramid, and polyester. On the contrary, the steel wire appeared to have a lower percentage increase in surge offset. However, the surge offset was observed to increase with increasing mooring stiffness in the case of double-line failure, with polyester having the least surge offset.
In both failure cases, the sway responses were observed to increase in the synthetic moorings, as shown in Figure 10b. In the case of single-line failure, polyester lines displayed the highest offset increase with 41.2%, followed by 26.6% and 21.8% for HMPE and Aramid, respectively, with 46.7% in steel wire lines. In the case of double-line failure, sway offset increased by 62.1%, 56.4%, and 51.6 % for polyester, HMPE, and Aramid, respectively, whereas steel wire was reduced by 92.6%, showing that the offset was higher in line with higher material stiffness.
Meanwhile, as seen in Figure 10c, steel wire moorings had the highest mean heave response, while polyester had the lowest. Aramid and HMPE had nearly the same responses. However, considering all materials, a maximum of 5% was recorded in steel wire for the double-line failure case.
According to the results in Figure 10d, a rather decreasing trend was recorded for single-line failure on the order of 16.67% and 60% for HMPE and polyester lines, while steel wire had an increased roll response of 42.9%. For the double-line failure, the same trend was observed for Aramid, HMPE, and polyester with decreases in roll responses of 83.3%, 85.7%, and 50%, respectively, while steel wire showed a 100% increase in roll response.
Furthermore, no significant variations in pitch responses were observed for any of the mooring materials, as shown in Figure 10e, with a maximum increase of 6% in steel wire after a single-line failure and a 12% increase after a double-line failure.
Figure 10f shows the variation of yaw responses. Polyester had the highest increase in yaw responses (17%). In the case of double-line failure, responses increased by 16%, 27%, and 21% for Aramid, HMPE, and polyester, respectively. Steel wire, on the other hand, had very little variation (less than 1%).

5.4. Mooring and Riser Tensions in Intact and Damaged Conditions

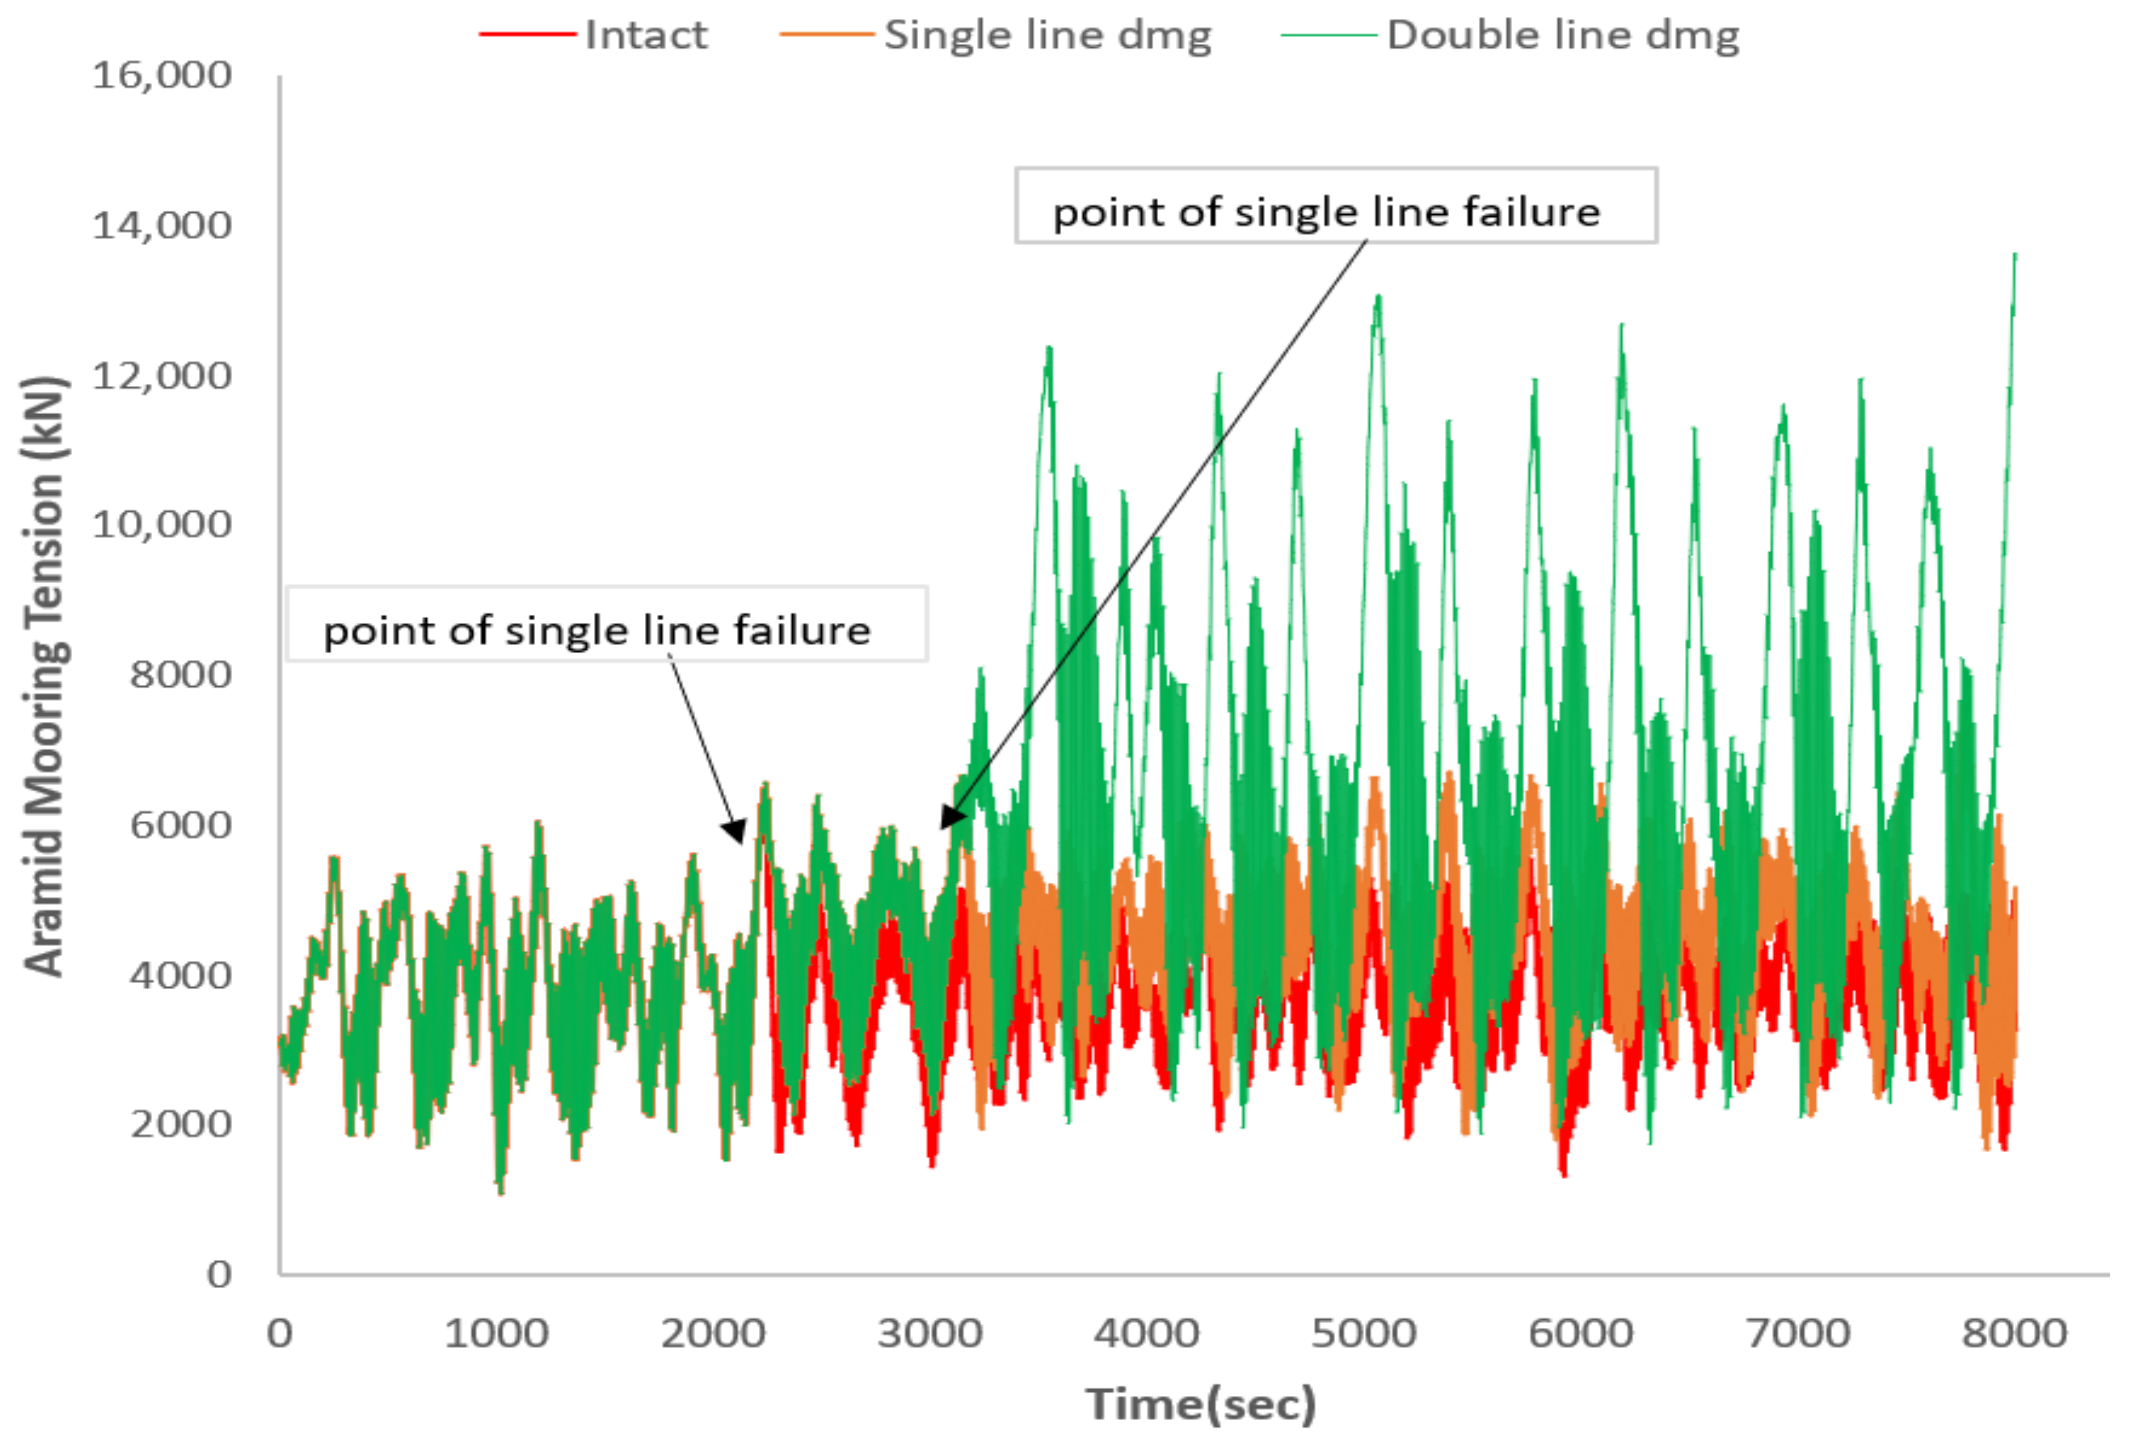
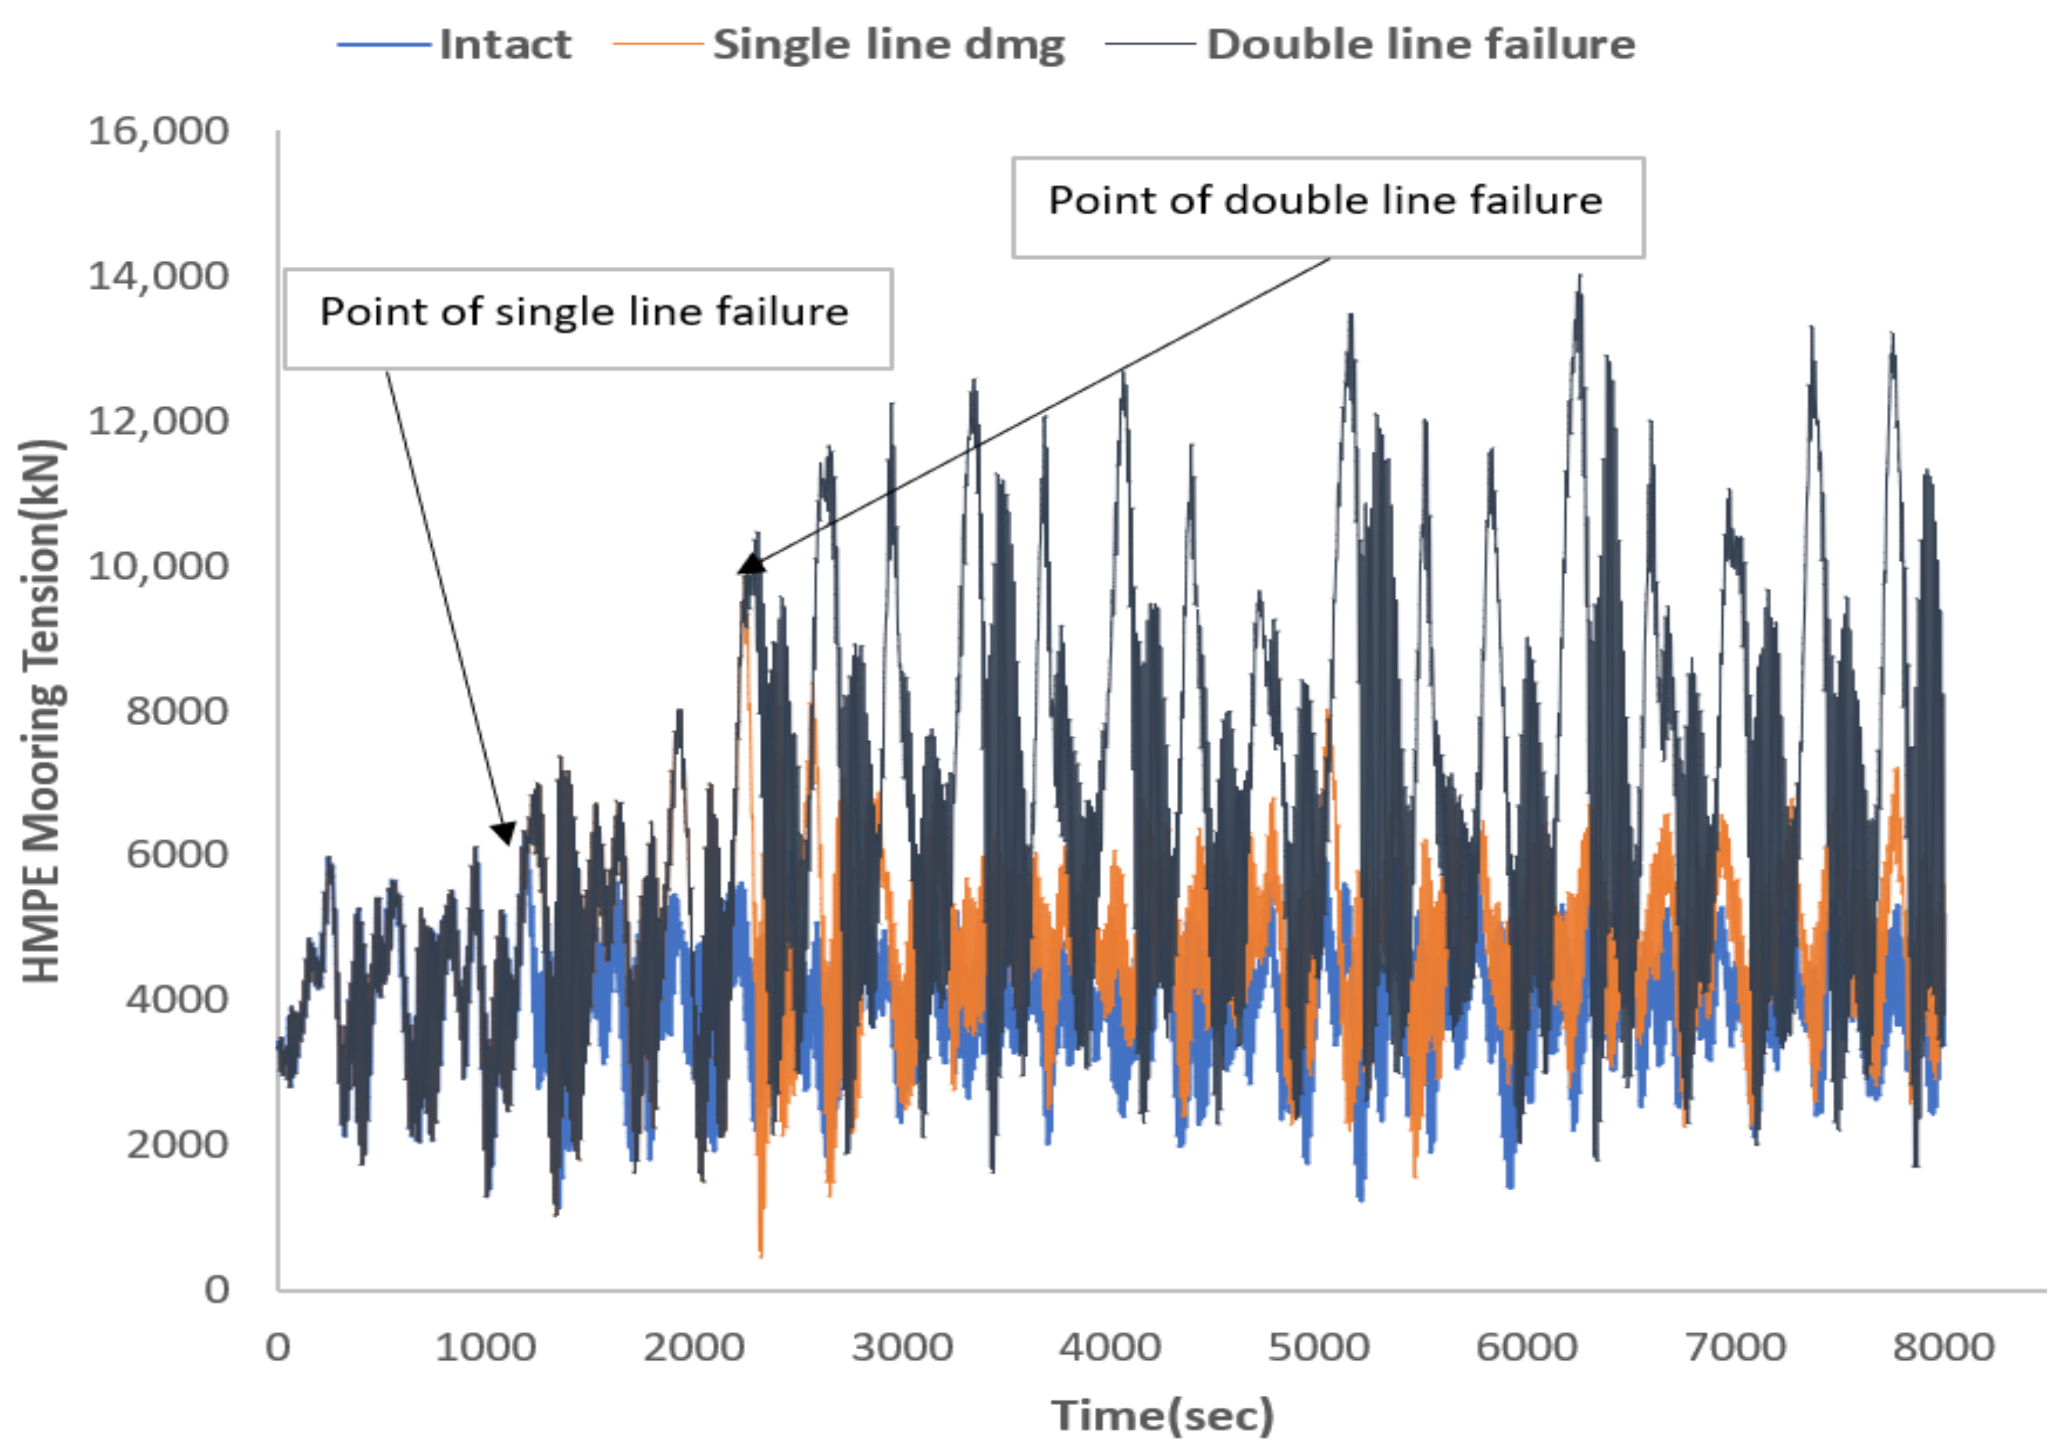
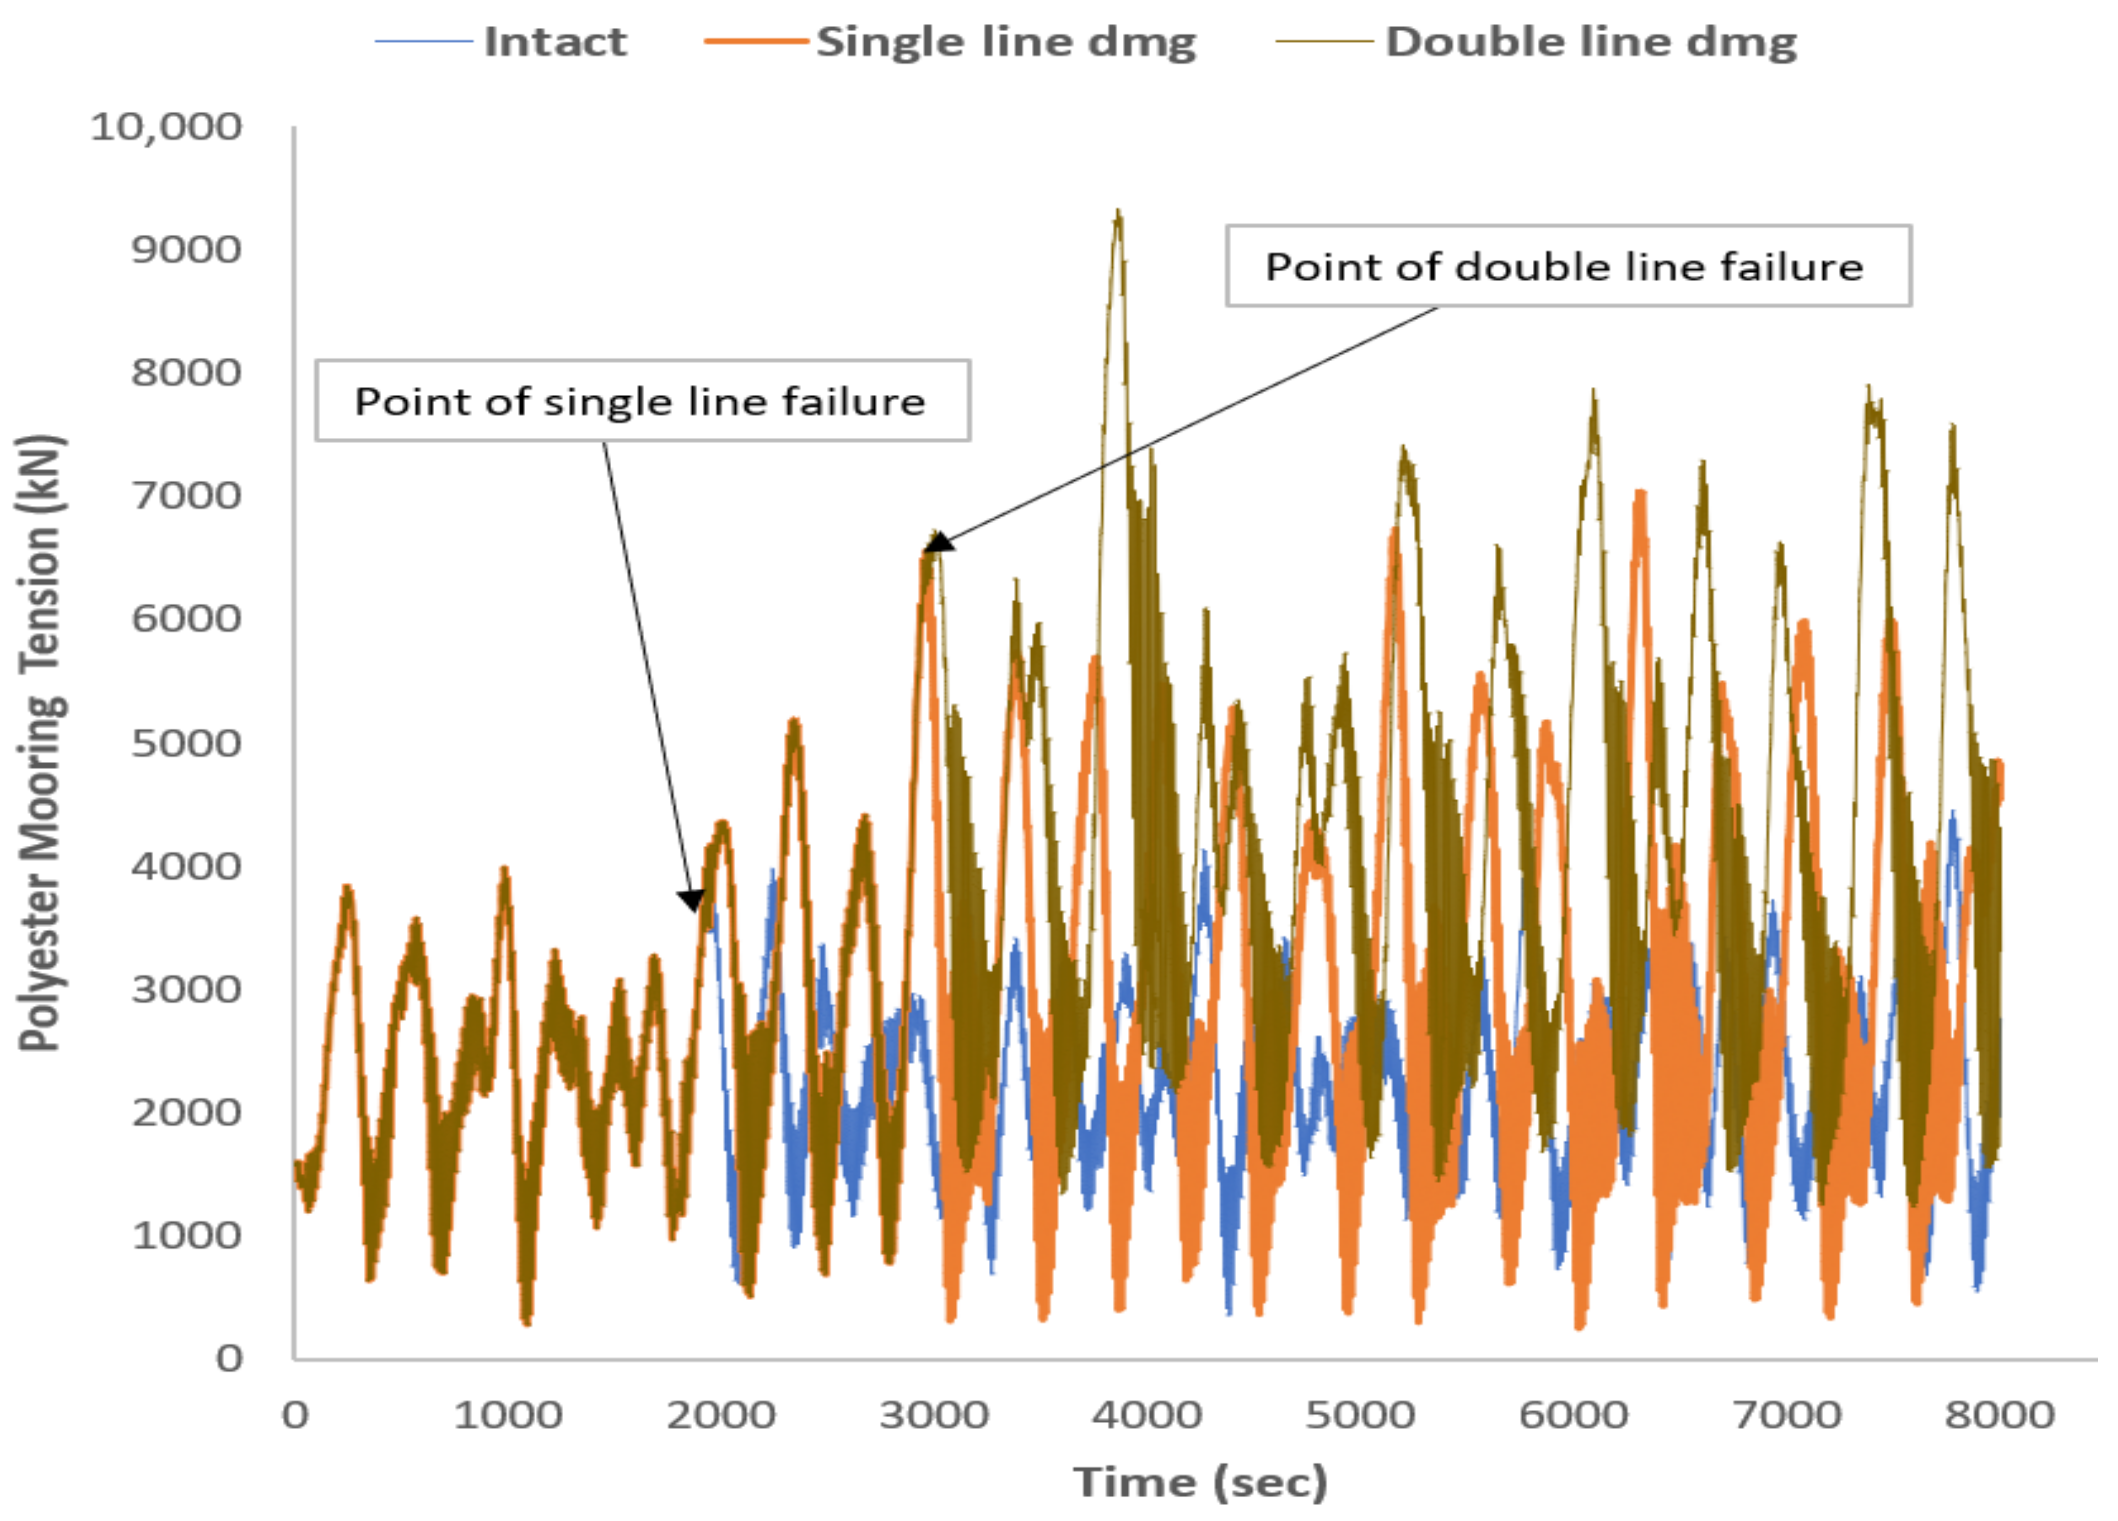
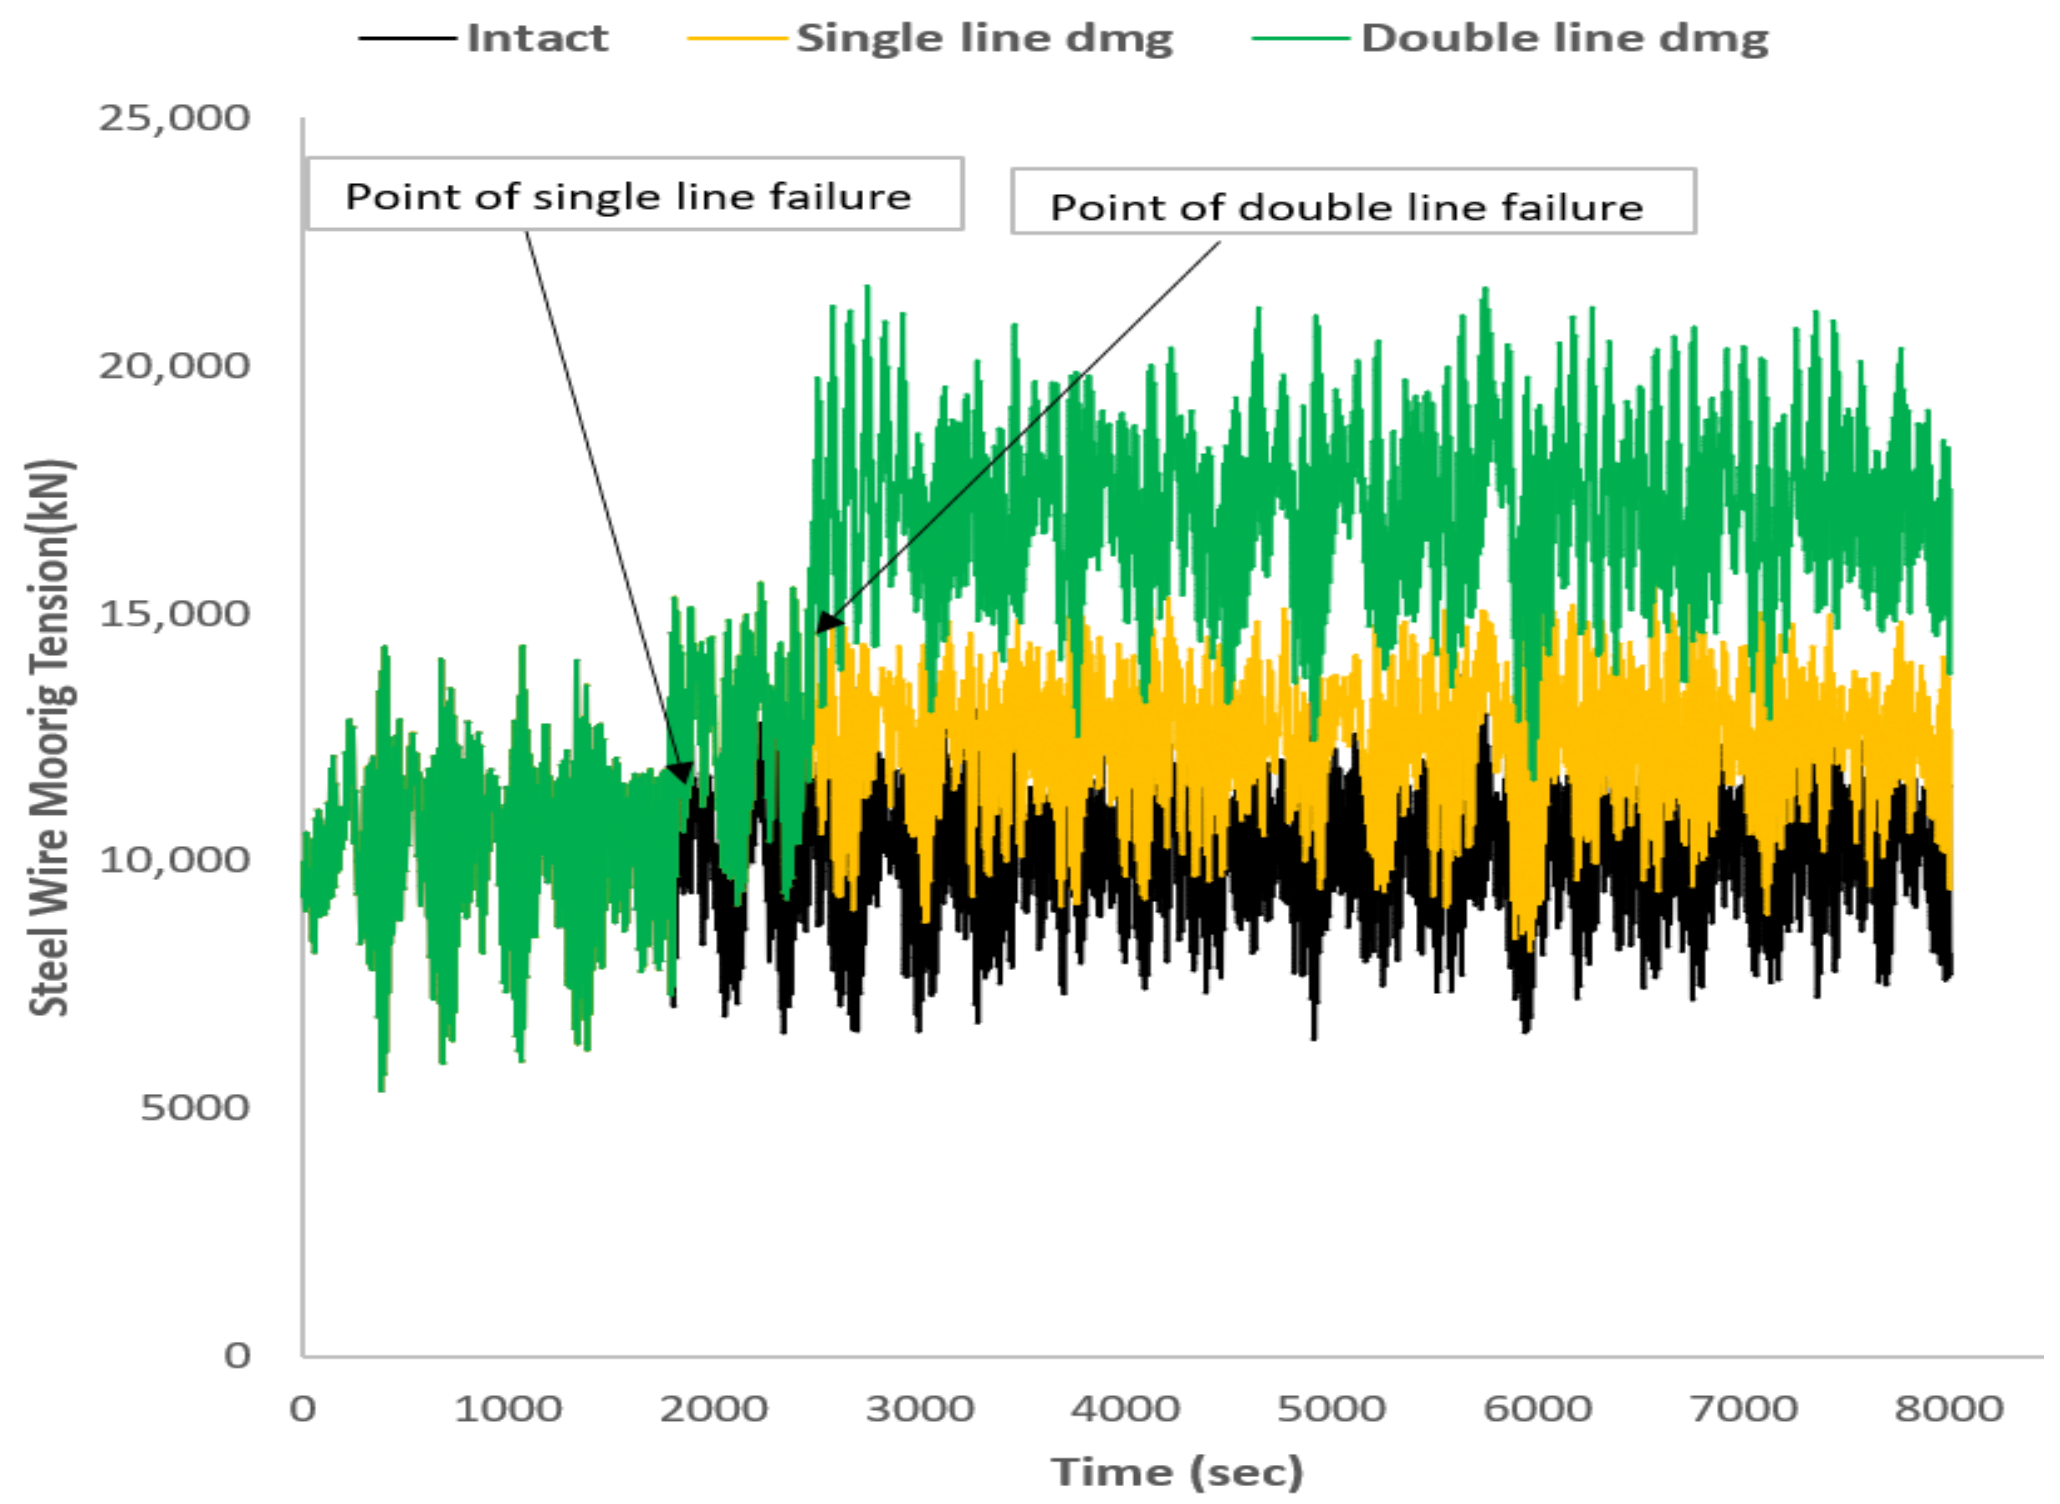
5.4.1. Mooring Line Tension

Table 9 shows a statistical comparison of representative mooring lines 7 and 12. According to the result, the highest tension in the intact condition was recorded in steel wire with 10,259 kN, followed by HMPE, Aramid, and polyester with mean tensions of 4056 kN, 3781 kN, and 2309 kN, respectively. This trend clearly shows that materials with higher stiffness had the highest mean tension. In the case of single-line failure, the reduction in line tension was observed in the following order: polyester, HMPE, steel wire, and Aramid, with percentage increases in adjacent lines of 22.5%, 15.5%, 14%, and 13.2%, respectively. However, for double-line failure cases, the percentage decrease was in the same range for all materials.
When comparing mooring tension variation for the Aramid line in Figure 11, line 7 experienced a 13% increase in mean tension after the single-line failure and a 34.5% increase after the double-line failure. A gradual build-up of mooring tension was observed after the single-line failure, while, for the double-line failure, an abrupt jump to 12,364 kN was recorded within 400 s of the line failure, which is 7% more than the MBL of the material.
In contrast to what was observed for Aramid lines, a sudden increase in mooring tension was recorded in the HMPE line with an increase to 9836 kN after 1055 s, as shown in Figure 12. In the case of double-line failure, the mooring tension increased immediately, reaching a maximum of 14,000 kN after 4007 s. When compared to the intact scenario, single- and double-line failures showed 16% and 38% increases, respectively.
Figure 13 reveals a significant increase in polyester mooring tension to 6528 kN after the single-line failure within 1078 s of line failure. On the other hand, an increase in mooring tension to 9324 kN within 900 s of the double-line failure was recorded. These variations correspond to 23% and 38% increases in mean tension for single- and double-line failure, respectively, i.e., the highest increase in tension in the single-line failure scenario.
In the case of steel wire lines, as shown in Figure 14, a gradual increase in the line tension was recorded for both single- and double-line failure. This corresponded to 14% and 32% increases in mean tension for single- and double-line failure, respectively. The gradual response compared to other line materials was attributed to the line weight.
Comparing the three synthetic materials, steel wire recorded the highest mean tension, followed by HMPE, Aramid, and polyester, which is consistent with the restoring behavior of the lines. In the case of single-line failure, the increase in mean tension was in the order polyester, HMPE, steel wire, and Aramid, whereas, for double-line failure, the behavior of the lines was in the same range.

5.4.2. Riser Tension

Table 10 compares the variation of tension of representative risers resulting from intact and damage conditions of different mooring materials.
In the case of single-mooring-line failure, considering LP riser, the highest variation in the connection point tension was recorded in polyester with an increase of 8%. HMPE and steel wire lines both had a 3% increase, while an increase of 2.4% was recorded in Aramid. The same trend was recorded in the case of double-line failure, with polyester resulting in an increase in riser tension by 13%. Increases of 10%, 9%, and 8% were recorded for HMPE, Aramid, and steel wire lines.
Comparing the variation in tension of GP riser with different mooring materials, the highest increase was recorded for polyester, with 5% and 9% increases for single- and double-line failure. In addition, 2.7%, 2%, and 1.5% increases were recorded for steel wire, HMPE, and Aramid for single-line failure, in contrast to 7%, 6%, and 5.5% increases for double-line failure, respectively. The increase was observed to increase with decreasing material stiffness.

6. Conclusions

A comprehensive investigation of the influence of mooring line materials on restoring force, dynamic response, mooring line, and connection point riser tension was conducted in both intact and damaged conditions. According to the simulation results, the following specific conclusions can be drawn:
  • The mooring system restoring force increased significantly with increasing mooring material stiffness, and a higher material stiffness led to a higher loss in restoring force in the case of single-line failure. In the case of double-line failure, the percentage reduction in restoring force was within the same range for all materials considered. Thus, in terms of percentage loss in restoring force, the polyester line was the best choice.
  • In intact conditions, material stiffness had a significant influence on the surge response for all mooring materials considered. In addition, lines with higher material stiffness had higher heave responses. In this regard, in a case where a reduction is surge and sway is the primary objective, the steel wire would be the best choice.
  • The mooring line submerged weight and material stiffness had a significant influence on the ability of the mooring systems to withstand the case of single-line failure, which is a fundamental requirement for a mooring system, as highlighted in Section 2 of DNVGL-S-E301 [6]. On this premise, in terms of surge direction, the steel wire performed best, followed by polyester, Aramid, and HMPE. In the case of double-line failure, lines with lower material stiffness performed better in maintaining the platform in position. Specifically, polyester lines performed best, followed by steel wire, HMPE, and Aramid.
  • The highest mean tension was recorded in steel wire, while the HMPE line had the highest tension among the synthetic lines, which is consistent with the restoring behavior of the lines.
  • For both failure cases, polyester lines had the highest mean tension increase, followed by HMPE, Aramid, and steel wire, showing that lines with higher material stiffness distributed tension evenly to the other lines in the same group in the event of single- and double-line failure. In this case, steel wire performed best with a minimal increase in line tension in the event of line failure.
  • Mooring lines with higher stiffness displayed better capability to withstand platform response in the event of line failure and, consequently, performed better in terms of minimizing the increasing riser tension. In both single- and double-line failure, a minimum increase in riser tension was recorded in the mooring system with steel wire, followed by the Aramid lines.
Lastly, it is important to note that the findings of this study are applicable to environmental conditions similar to the wave conditions of the Gulf of Mexico. Thus, further studies considering a wider range of metocean data with different wavelength-to-platform length ratios and breaking waves, which have been highlighted to have a significant influence, should be considered.

Author Contributions

I.A.J. and M.O.A.A. conceived and designed the numerical study; I.A.J. performed the numerical simulation; I.A.J., M.O.A.A. and A.Y., analyzed the result; Z.N. and A.N. contributed reference materials; I.A.J. wrote the paper. All authors have read and agreed to the published version of the manuscript.

Funding

This research is funded by Universiti Teknologi PETRONAS, Malaysia, under grant number YUTP 015LC0-116.

Institutional Review Board Statement

Not applicable.

Informed Consent Statement

Not applicable.

Data Availability Statement

All cited document can be found using the references provided.

Acknowledgments

The authors acknowledged the Universiti Teknologi PETRONAS, Malaysia for supporting this research under YUTP 015LC0-116.

Conflicts of Interest

The authors declare no conflict of interest.

References

  1. Ahmed, M.O.; Yenduri, A.; John, K.V. Evaluation of the Dynamic Responses of Truss Spar Platforms for Different Mooring Materials in Intact and Damaged Line Conditions. In Proceedings of the 29th International Ocean and Polar Engineering Conference, Honolulu, HI, USA, 16–21 June 2019; International Society of Offshore and Polar Engineers: Mountain View, CA, USA, 2019. [Google Scholar]
  2. Lian, Y.; Liu, H.; Zheng, J. Numerical investigation on dynamic responses of HMPE mooring system with damaged lines. In Proceedings of the 27th International Ocean and Polar Engineering Conference, San Francisco, CA, USA, 25–30 June 2017; International Society of Offshore and Polar Engineers: Mountain View, CA, USA, 2017. OnePetro. [Google Scholar]
  3. Liu, H.; Huang, W.; Lian, Y.; Li, L. An experimental investigation on nonlinear behaviors of synthetic fiber ropes for deepwater moorings under cyclic loading. Appl. Ocean Res. 2014, 45, 22–32. [Google Scholar] [CrossRef]
  4. Lian, Y.; Yim, S.C.; Zheng, J.; Liu, H.; Zhang, N. Effects of Damaged Fiber Ropes on the Performance of a Hybrid Taut-Wire Mooring System. J. Offshore Mech. Arct. Eng. 2019, 142, 1–43. [Google Scholar] [CrossRef]
  5. API RP. API RP 2SM, Recommended Practice for the Design, Manufacturer, Installation, and Maintenance of Synthetic Fiber Ropes for Offshore Moorings; API: Washington, DC, USA, 2014. [Google Scholar]
  6. ABS. ABS 90-2011; Guidance notes on the application of fiber rope for offshore mooring; American Bureau of Shipping: Houston, TX, USA, 2011. [Google Scholar]
  7. DVN GL. Design, Testing and Analysis of Offshore Fibre Ropes; Det Norske Veritas: DNV Veritasveien 1; NO-1322 Høvik; DVN GL: Oslo, Norway, 2019. [Google Scholar]
  8. Lian, Y.; Liu, H.; Hu, L. Feasibility Analysis of a New Hybrid Mooring System Applied for Deep Waters. In Proceedings of the Twenty-fifth International Ocean and Polar Engineering Conference, Kona, HI, USA, 21–26 June 2015; International Society of Offshore and Polar Engineers: Mountain View, CA, USA, 2015. ISOPE-I-15-297. [Google Scholar]
  9. Flory, J.F.; Banfield, S.J.; Ridge, I.M.L.; Carr, R. Axial Compression Fatigue in Long-Lay-Length Fiber Mooring Ropes. In Proceedings of the Offshore Technology Conference, Houston, TX, USA, 1–4 May 2017; International Society of Offshore and Polar Engineers: Mountain View, CA, USA, 2017. [Google Scholar] [CrossRef]
  10. Lian, Y.; Liu, H.; Zhang, Y.; Li, L. An experimental investigation on fatigue behaviors of HMPE ropes. Ocean Eng. 2017, 139, 237–249. [Google Scholar] [CrossRef]
  11. Ćatipović, I.; Alujević, N.; Rudan, S.; Slapničar, V. Numerical Modelling for Synthetic Fibre Mooring Lines Taking Elongation and Contraction into Account. J. Mar. Sci. Eng. 2021, 9, 417. [Google Scholar] [CrossRef]
  12. Weller, S.; Johanning, L.; Davies, P.; Banfield, S. Synthetic mooring ropes for marine renewable energy applications. Renew. Energy 2015, 83, 1268–1278. [Google Scholar] [CrossRef] [Green Version]
  13. Utsunomiya, T.; Sato, I.; Tanaka, K. At-Sea Experiment on Durability and Residual Strength of Polyester Rope for Mooring of Floating Wind Turbine. In Proceedings of the ASME 2019 38th International Conference on Ocean, Offshore and Arctic Engineering, Scotland, UK, 9–14 June 2019. [Google Scholar] [CrossRef]
  14. Pham, H.-D.; Cartraud, P.; Schoefs, F.; Soulard, T.; Berhault, C. Dynamic modeling of nylon mooring lines for a floating wind turbine. Appl. Ocean Res. 2019, 87, 1–8. [Google Scholar] [CrossRef] [Green Version]
  15. Gordelier, T.; Parish, D.; Thies, P.R.; Johanning, L. A Novel Mooring Tether for Highly-Dynamic Offshore Applications; Mitigating Peak and Fatigue Loads via Selectable Axial Stiffness. J. Mar. Sci. Eng. 2015, 3, 1287–1310. [Google Scholar] [CrossRef] [Green Version]
  16. Montasir, O.; Yenduri, A.; Kurian, V. Effect of Mooring Line Properties and Fairlead Slopes on the Restoring Behavior of Offshore Mooring System. Res. J. Appl. Sci. Eng. Technol. 2014, 8, 346–353. [Google Scholar] [CrossRef]
  17. Ja’E, I.A.; Ali, M.O.A.; Yenduri, A.; Nizamani, Z.; Nakayama, A. Optimisation of mooring line parameters for offshore floating structures: A review paper. Ocean Eng. 2022, 247, 110644. [Google Scholar] [CrossRef]
  18. Rudmana, M.; Cleary, P.W. Oblique impact of rogue waves on a floating platform. In Proceedings of the Nineteenth International Offshore and Polar Engineering Conference, Osaka, Japan, 21–26 June 2009; International Society of Offshore and Polar Engineers: Mountain View, CA, USA, 2009. OnePetro. [Google Scholar]
  19. Mai, T.; Greaves, D.; Raby, A.; Taylor, P. Physical modelling of wave scattering around fixed FPSO-shaped bodies. Appl. Ocean Res. 2016, 61, 115–129. [Google Scholar] [CrossRef]
  20. Lee, I.-H.; Moon, J.-S.; Sim, W.-S.; Lee, W.-S.; Shin, H.-S. Investigation of the Impact Pressure by Breaking Waves on FPSO Appurtenances. In Proceedings of the Twentieth International Offshore and Polar Engineering Conference, Beijing, China, 20–25 June 2010; International Society of Offshore and Polar Engineers: Mountain View, CA, USA, 2010. OnePetro. [Google Scholar]
  21. Xu, L.; Barltrop, N.; Okan, B. Bow impact loading on FPSOs 1—Experimental investigation. Ocean Eng. 2008, 35, 1148–1157. [Google Scholar] [CrossRef]
  22. Maffra, S.A.R.D.S.; Pacheco, M.A.C.; de Menezes, I.F.M.G. Genetic Algorithm Optimization for Mooring Systems. Generations 2003, 1, 3. [Google Scholar]
  23. DNV GL. DNVGL-OS-E301 Position Mooring; DNV Veritasveien 1; NO-1322 Hovik; DNV GL: Oslo, Norway, 2015. [Google Scholar]
  24. Ahmed, M.; Nizamani, Z.; Nakayama, A.; Osman, M. Some Recent Fluid-Structure Interaction Approaches for the Wave Current Behaviour with Offshore Structures. CFD Lett. 2020, 12, 15–26. [Google Scholar] [CrossRef]
  25. Li, Q.; Zhuang, Y.; Wan, D.; Chen, G. Numerical Analysis of the Interaction between a Fixed FPSO Benchmark Model and Focused Waves. In Proceedings of the 28th International Ocean and Polar Engineering Conference, Sapporo, Japan, 10–15 June 2018; International Society of Offshore and Polar Engineers: Mountain View, CA, USA, 2018. OnePetro. [Google Scholar]
  26. Anagnostopoulos, S.A. Dynamic response of offshore platforms to extreme waves including fluid-structure interaction. Eng. Struct. 1982, 4, 179–185. [Google Scholar] [CrossRef]
  27. Istrati, D.; Buckle, I.G. Effect of fluid-structure interaction on connection forces in bridges due to tsunami loads. In Proceedings of the 30th US-Japan Bridge Engineering Workshop, Washington, DC, USA, 21–23 October 2014; pp. 21–23. [Google Scholar]
  28. Istrati, D. Large-Scale Experiments of Tsunami Inundation of Bridges Including Fluid-Structure-Interaction. Ph.D. Thesis, University of Nevada, Reno, NV, USA, 2017. [Google Scholar]
  29. Ali, M.O.A.; Ja’E, I.A.; Hwa, M.G.Z. Effects of water depth, mooring line diameter and hydrodynamic coefficients on the behaviour of deepwater FPSOs. Ain. Shams. Eng. J. 2019, 11, 727–739. [Google Scholar] [CrossRef]
  30. AQWA Inc. AQWA User’s Manual. Release 14.5. ANSYS Inc.: Canonsburg, PA, USA, 2020. Available online: https://ansyshelp.ansys.com/account/secured?returnurl=/Views/Secured/corp/v201/en/wb2_help/wb2_help.html%23wb2_help (accessed on 30 December 2021).
  31. Ti, Z.; Li, Y.; Qin, Q. Numerical approach of interaction between wave and flexible bridge pier with arbitrary cross section based on boundary element method. J. Bridge Eng. 2020, 25, 04020095. [Google Scholar] [CrossRef]
  32. Liu, Z.; Zhuang, Y.; Wan, D.; Chen, G. Numerical Study on Focused Wave Interactions with a Moored Floating Structure. In Proceedings of the 29th International Ocean and Polar Engineering Conference, Honolulu, HI, USA, 16–21 June 2019; International Society of Offshore and Polar Engineers: Mountain View, CA, USA, 2019. OnePetro. [Google Scholar]
  33. Xiang, T.; Istrati, D. Assessment of Extreme Wave Impact on Coastal Decks with Different Geometries via the Arbitrary Lagrangian-Eulerian Method. J. Mar. Sci. Eng. 2021, 9, 1342. [Google Scholar] [CrossRef]
  34. He, G.; Xie, B.; Wang, W.; Liu, S.; Jing, P. Ship Loading Influence on the Slamming Impact of Typical Sections of an S-175 Container Ship. J. Mar. Sci. Eng. 2020, 8, 163. [Google Scholar] [CrossRef] [Green Version]
  35. Pan, K.; Ijzermans, R.H.A.; Jones, B.D.; Thyagarajan, A.; van Beest, B.W.H.; Williams, J.R. Application of the SPH method to solitary wave impact on an offshore platform. Comput. Part. Mech. 2015, 3, 155–166. [Google Scholar] [CrossRef] [Green Version]
  36. Lind, S.J.; Rogers, B.D.; Stansby, P.K. Review of smoothed particle hydrodynamics: Towards converged Lagrangian flow modelling. Proc. R. Soc. A Math. Phys. Eng. Sci. 2020, 476, 20190801. [Google Scholar] [CrossRef]
  37. Canelas, R.; Ferreira, R.; Crespo, A.; Domínguez, J. A generalized SPH-DEM discretization for the modelling of complex multiphasic free surface flows. In Proceedings of the 8th International SPHERIC Workshop, Trondheim, Norway, 4–6 June 2013; Smooth Particle Hydrodynamics Research and Engineering International Community Workshop: Trondheim, Norway, 2013; pp. 74–79. [Google Scholar]
  38. Hasanpour, A.; Istrati, D.; Buckle, I. Coupled SPH–FEM Modeling of Tsunami-Borne Large Debris Flow and Impact on Coastal Structures. J. Mar. Sci. Eng. 2021, 9, 1068. [Google Scholar] [CrossRef]
  39. Kim, M.; Koo, B.; Mercier, R.; Ward, E. Vessel/mooring/riser coupled dynamic analysis of a turret-moored FPSO compared with OTRC experiment. Ocean Eng. 2005, 32, 1780–1802. [Google Scholar] [CrossRef]
  40. Tahar, A.; Kim, M. Hull/mooring/riser coupled dynamic analysis and sensitivity study of a tanker-based FPSO. Appl. Ocean Res. 2003, 25, 367–382. [Google Scholar] [CrossRef]
  41. Yong, Y.; Baudic, S.; Poranski, P.; Wichers, J.; Stansberg, C.T.; Ormberg, H. Deepstar Study on Predicting FPSO Responses—Model Tests VS Numerical Analysis. In Proceedings of the Offshore Technology Conference, Houston, TX, USA, 3–6 May 2004; Offshore Technology Conference: Houston, Texas, USA, 2004. [Google Scholar] [CrossRef] [Green Version]
  42. MAXSURF Advanced; Bentley Systems Inc.: Exton, Pennsylvania, USA, 2012.
  43. Ja’e, I.A.; Ali, M.O.A.; Yenduri, A. Numerical Studies on the Effects of Mooring Configuration and line Diameter on the Restoring Behaviour of a Turret- Moored FPSO. In Proceedings of the 5th International Conference on Civil, Structural and Transportation Engineering, Niagara, ON, Canada, 12–14 November 2020. [Google Scholar] [CrossRef]
  44. Thiagarajan, K.P.; Tian, Z. Heading Instability of Moored Ships in Swell Waves. In Proceedings of the SNAME Maritime Convention 2012; SNAME Maritime Convention: Providence, RI, USA, 2012. [Google Scholar] [CrossRef]
  45. Zangeneh, R.; Thiagarajan, K.P. Heading Instability Analysis of FPSOs. In Proceedings of the Twenty-fifth International Ocean and Polar Engineering Conference, Kona, HI, USA, 21–26 June 2015; International Society of Offshore and Polar Engineers: Mountain View, CA, USA, 2015. OnePetro. [Google Scholar]
  46. OCIMF. Prediction of Wind and Current Loads on VLCCs. In Tech. Rep.; Oil Companies International Marine Forum: London, UK, 1994. [Google Scholar]
  47. Jae, I.A.; Ali, M.O.A.; Yenduri, A. Numerical Validation of Hydrodynamic Responses and Mooring Top Tension of a Turret Moored FPSO using Simulation and Experimental results. In Proceedings of the 5th International Conference on Architecture and Civil Engineering (ICACE2021), Kualar Lumpur, Malaysia, 18 August 2021. ACE21317. [Google Scholar]
  48. Montasir, O.A.A. Numerical and Experimental Studies on the Slow Drift Motions and the Mooring line Responses of Truss Spar Platform. Ph.D. Thesis, Universiti Teknologi Petronas, Seri Iskandar, Malaysia, 2012. [Google Scholar]
  49. ANSYS Inc. AQWA Theory Manual; ANSYS Inc.: Canonsburg, PA, USA, 2015. [Google Scholar]
  50. Barltrop, N. Floating Structures: A Guide for Design and Analysis; Center for Marine and Petroleum Technology (CMPT): London, UK, 1998. [Google Scholar]
Figure 1. FPSO modeling procedure.
Jmse 10 00453 g001
Figure 2. Generated mesh of numerical model.
Jmse 10 00453 g002
Figure 3. FPSO–mooring–riser layout.
Jmse 10 00453 g003
Figure 4. Illustration of wave, wind, and current directions.
Jmse 10 00453 g004
Figure 5. Illustration of forces on cable element.
Jmse 10 00453 g005
Figure 6. Comparison of restoring behavior of WINSPOST and AQWA models.
Jmse 10 00453 g006
Figure 7. Comparison of free decay timeseries for (a) surge, (b) heave, (c) roll, and (d) pitch.
Jmse 10 00453 g007
Figure 8. Comparison of mooring system surge restoring forces for different mooring materials in the intact, single-, and double-line failure conditions.
Jmse 10 00453 g008
Figure 9. Statistical comparison of FPSO motion responses in 6 DOF considering different mooring materials in intact conditions: (a) surge; (b) sway; (c) heave; (d) roll; (e) pitch; (f) yaw.
Jmse 10 00453 g009
Figure 10. Statistical comparison of FPSO mean offset in 6 DOF considering mooring systems with different mooring materials in intact and damaged conditions: (a) mean surge; (b) mean sway; (c) mean heave; (d) mean roll; (e) mean pitch; (f) mean yaw.
Jmse 10 00453 g010
Figure 11. Comparison of Aramid representative mooring line (line 7) in intact and damaged conditions.
Jmse 10 00453 g011
Figure 12. Comparison of HMPE representative mooring line (line 7) in intact and damaged conditions.
Jmse 10 00453 g012
Figure 13. Comparison of polyester representative mooring line (line 7) in intact and damaged conditions.
Jmse 10 00453 g013
Figure 14. Comparison of steel wire representative mooring line (line 12) in intact and damaged conditions.
Jmse 10 00453 g014
Table 1. FPSO main design parameters.
ParameterSymbolUnitQuantities
Vessel size kDWT200
Length between perpendicularLppm310
BreadthBm47.17
HeightHm28.04
Draft (80% loaded)TM15.121
DisplacementVMT186,051
Block coefficientCb 0.85
Surge center of gravity from the turretCGxm−109.67
Heave center of gravity from m.w.l.CGym−1.8
Frontal wind areaAFm24209.6
Transverse wind areaATm216,018.6
Roll radius of gyration at CG of the turretRxxm14.036
Pitch radius of gyration at CG of the turretRyym77.47
Yaw radius of gyration at CG of the turretRzzm79.3
Turret in center line behind FppXturm38.75
Turret diameterDturm15.85
Turret elevation below tanker base m1.52
Table 2. Mooring line details [43].
LegendTop SegmentMiddle SegmentLower Segment
TypeChainPolyesterChain
Diameter (mm)95.316095.3
Length (m)91.4243891.4
Wet weight (kg/m)164.634.5164.63
Effective modulus (kN)820,900168,120820,900
Breaking load (kN)755374297553
Normal drag coefficient, CDN2.451.22.45
Normal added inertia coefficient, CIN2.01.152.0
Table 3. Riser parameters.
DesignationTop Tension (kN)Outer Diameter (mm)EA (kN)Wet Wet (N/m)
Liquid production1112.5444.518.3 × 1061037
Gas production609.7386.110.3 × 106526
Water injection2020.0530.918.6 × 1061898
Gas injection1352.8287.031.4 × 1061168
Gas export453.9342.98.6 × 106423
Table 4. Properties of mooring lines used in the study [50].
MaterialSw (N/m)EA (N)MBL (N)
Polyester0.0067 d26567.19 d2250 d2
HMPE0.0062 d215,000 d2575 d2
Aramid0.00565 d216,567.19 d2450 d2
Steel wire0.034 d245,000 d2600 d2
Table 5. Properties of mooring materials used in the study.
Property/Mooring MaterialPolyesterHMPEAramidSteel Wire
Diameter (mm)160160160160
Length (m)2438243824382438
Wet weight (kg/m)17.484216.179414.744188.7258
Axial stiffness (kN)168,120424,120384,0001,152,000
MBL (kN)742914,72011,52015,360
Table 6. Mooring failure scenarios.
Mooring Material/CasesSingle LineDouble Lines
PolyesterLine 9 at 1937 sLine 8 at 2960 s
HMPELine 9 at 1186 sLine 8 at 2241 s
AramidLine 9 at 2229 sLine 8 at 3154 s
Steel wireLine 10 at 1794 sLine 11 at 2464 s
Table 7. Comparison of free decay test results.
Natural Periods (s)Damping (%)
AQWAWINPOSTOTRCAQWAWINPOSTOTRC
Surge205.2204.7206.83.74.43.0
Heave10.810.810.74.511.86.7
Roll12.712.712.73.20.73.4
Pitch10.710.810.57.510.58.0
Table 8. Statistical comparison of hydrodynamic responses in 6 DOF.
SourceSurge (m)Sway (m)Heave (m)Roll (°)Pitch (°)Yaw (°)
MaxAQWA4.4411.28.338.23.37−15.21
WINPOST2.2913.110.93.54.45−3.4
OTRC6.3010.99.119.574.2−8.69
MinMin−60.22−20.04−10.45−7.26−4.37−29.72
Min−61.30−21.4−11.3−3.6−4.99−24.6
Min−54.10−13.6−9.52−8.77−4.07−23.3
MeanAQWA−20.77−0.480.110.060.17−18.37
WINPOST−22.90−0.090.14−0.10.01−16
OTRC−21.10−0.64−0.06−0.080.03−16.8
SDAQWA7.974.55′2.921.451.195.03
WINPOST9.724.573.080.91.313.8
OTRC8.784.052.812.181.262.46
Table 9. Statistical comparison of mooring tension for representative lines after different failure cases.
Line 7Line 12
Cases Aramid
(kN)
HMPE
(kN)
Polyester
(kN)
Steel Wire
(kN)
Max6481.4726334.5354447.13614,606.43
Min1081.6971141.558284.48815375.512
IntactMean3781.3354056.3842309.15910,259.12
Sd790.4503813.4267700.6961307.523
Max7592.2739850.3497044.37515,883.23
Single-line damageMin1081.697460.7601253.28155380.742
Mean4358.2074801.6432979.42411,943.58
Sd1009.63912261374.1891595.16
Max13,631.8514,007.419330.23621,607.54
Double-line damageMin1081.6971032.128284.48815375.512
Mean5771.5466544.6013740.24215,187.81
Sd2507.4052676.0091730.6723299.447
Table 10. Comparison of tension variation of representative risers considering different mooring materials in intact and damaged conditions.
LP1GP4
Aramid
(kN)
HMPE
(kN)
Polyester
(kN)
Steel Wire
(kN)
Aramid
(kN)
HMPE
(kN)
Polyester
(kN)
Steel Wire
(kN)
Max1655.91735.811897.611567.572700.602789.363053.442579.80
IntactMin609.46499.47527.33605.651450.641317.801384.401435.19
Mean1169.091159.551289.261088.172123.602110.442290.402015.71
SD170.64164.12222.33148.87206.11198.09274.65178.27
Max1798.662307.532882.061567.432861.723458.934158.532594.06
Single-line damageMin633.04304.5047.55606.461479.391090.26757.131436.28
Mean1198.101195.551394.491123.322156.962152.162417.922072.43
SD185.88212.04415.48145.58224.17254.61507.08175.86
Max3000.053058.964249.341721.844275.484359.875747.682820.15
Double-line damageMin149.5582.1886.85605.65843.48775.47722.991435.19
Mean1277.871285.231479.291182.432247.092253.122505.282169.08
SD351.33388.27488.70166.50417.73461.85586.97209.34
Publisher’s Note: MDPI stays neutral with regard to jurisdictional claims in published maps and institutional affiliations.

