Article

Quality Analysis of AISI 321 Welds of Bellow Compensators Used in Shipbuilding

Mechanical Engineering Faculty in Slavonski Brod, University of Slavonski Brod, Trg Ivane Brlić Mažuranić 2, 35000 Slavonski Brod, Croatia
*
Author to whom correspondence should be addressed.
J. Mar. Sci. Eng. 2022, 10(4), 452; https://doi.org/10.3390/jmse10040452
Submission received: 17 February 2022 / Revised: 13 March 2022 / Accepted: 16 March 2022 / Published: 23 March 2022
(This article belongs to the Special Issue Strength of Ship Structures)

Abstract

:
The production of compensators (expansion joints), and especially of bellows as their most demanding elements, requires the usage of stainless materials. These stainless materials exhibit certain particularities at welding (and quality control) since they are very thin, i.e., their thickness ranges usually from 0.12 to 3.00 mm. This paper starts with the elaboration of compensators and their application, and further presents characteristics of the material selected for experimental testing. In the second part, the paper continues with a description of the experiment referring to longitudinal welding of samples without filler material. The experiment focused on the determination of accurate characteristics of radiographic recordings and their assessment based on comparison with the tensile testing (mechanical properties), FEM numerical simulation and dimensional control. The paper also presents the analysis of obtained results and conclusions made thereof. The research hypothesis was to determine in what way the welding parameters affect the mechanical properties, the geometric shape of the welds, and the exploitation possibilities of the compensator. According to the performed experimental part and the performed testing of mechanical properties, all welded joints are acceptable for use. Nevertheless, according to the standard that prescribes the acceptability criteria of defects that occur in welded joints, some of tested samples were not suitable for operating conditions. Such kinds of welded sheets must be repaired or eliminated from further processing.

1. Introduction

While in service, bellows compensators, as parts of pipelines or pressure vessels, are exposed to different stresses caused by high pressure. For marine applications, bellows are used for air ducts, engine exhaust ducts and Heating Ventilation And Cooling (HVAC) ducts. Due to high temperatures and different aggressive media (salt water), they are also exposed to different types of corrosion, such as pitting corrosion, intergranular corrosion, crevice corrosion, and stress corrosion cracking. All the above-mentioned factors make compensators the most critical elements in mechanical systems, the failure of which can cause significant damages [1].
G. Vukelic et al. showed that shipbuilding steels are exposed to outdoor factors (seawater, etc.) and indoor factors (fuel, oil, ballast water, aggressive cargo), which causes different types of corrosion [2]. Rajala P. et al. showed the effects of biofouling on coated carbon steels used in the cooling system with brackish seawater and the importance of applying coatings [3]. Since bellow compensators work in such kinds of environment, the materials used in the production of compensators, and especially of bellows, should be carefully selected and great attention needs to be paid also to manufacturing technology and welding. Bellows are produced in 1–4 layers of materials that are usually 0.12 to 3.00 mm thick. Materials used to produce compensators and bellows are stainless austenitic steels (304L, 316, 316L, 321, etc.), refractory austenitic steels (309, Incoloy 800, Incoloy 800H, etc.) and nickel alloys (Inconel 600, Inconel 625, Monel 400, etc.) [4,5,6].
Mechanical properties for AISI 321 are shown in Table 1.
AISI 321 is a Ni-Cr-Ti stainless steel widely used in the production of heat exchangers in nuclear and solar power plants, as well as in chemical industry for the production of nitric acid. This steel is characterized by excellent strength and impact toughness at room and lower temperatures, it is more resistant to corrosion and oxidation, and has a higher coefficient of thermal expansion and lower thermal conductivity than other types of stainless steel [8,9].
As presented in Figure 1, parts of the compensator are divided into four main groups [4]:
  • main parts under pressure (A),
  • pressure parts, except the main parts that are indirectly under pressure (B),
  • connectors to main parts under pressure and to pressure parts (C),
  • other parts (D),
  • pretension or shipping bars (1),
  • re-enforcing collar (Ca).
Figure 1. Axial compensator with internal pressure and categorization of material [5].
Jmse 10 00452 g001
The designing and selection of the material must follow strictly defined criteria for standardized design codes, such as section III of ASME, or the standard EN 14917:2009 I [10].
Non-destructive testing (ultrasonic testing, radiographic control, magnetic control, penetration control) and destructive testing (tensile testing, toughness, hardness, macro testing, microstructures) are performed to check the quality of welded joints. Destructive testing is far more expensive and not suitable to be carried out on finished products (positions). As per customer requirements and standard procedures, in some cases it is necessary to perform non-destructive testing (radiographic control of bellows 100%). Yet results of such testing are often not satisfactory or as expected because of various factors, such as inappropriate testing method or technique, material thickness, material properties [6]. Therefore, it is necessary to run additional tests on welded joints and to compare results obtained by non-destructive testing radiographic control with those obtained by destructive testing tensile testing, technological bending test and dimensional control.
Tungsten inert gas welding (TIG), metal inert gas welding (MIG), and friction stir welding are usually applied to weld stainless austenitic steels, refractory austenitic steels and nickel alloys [7,11,12,13,14,15,16,17,18,19]. The welding of thin metals used in the production of bellows is performed by automatic TIG welding machines in order to ensure better control of welding parameters and, consequently, a better quality of welded joint. Welding parameters have a significant influence on the quality of welded joints, on their mechanical properties and geometric shape [20,21].
In the welding process of AISI 321 steel there is also a problem with crack formatting, the formation of σ phases in the welded joint, which are controlled by monitoring the chemical composition of the filler material. Due to residual stresses, exploitation conditions and sensitive microstructure, there is a great possibility of stress corrosion cracking. Compared to other austenitic steels (i.e., AISI 304L) they have a lower quality of weld geometry, lower hardness and tensile properties, which are also consequences of martensite transformation during the welding process [8,22,23]. In the production of compensators and the welding of AISI 321 steel, there are common issues in the form of the resulting variable weld geometry, and changes in microstructure properties which could lead to weld or HAZ cracks. These problems had been investigated in the paper.

2. Materials and Methods

The experiment was carried out on AISI 321/1.4541 stainless steel of 0.5 mm thickness. Longitudinal welding was performed by automatic TIG welding procedure (TransTig 1600-Fronius) without filler material according to Figure 2.
Pre-tests were performed in order to determine the influence of welding parameters on the quality of welded joints by visual inspection. Table 2 presents an overview of pre-test parameters, of which constants were tungsten electrode ø2.4 mm and 3 bar atmospheric pressure on the bars. The spacing between bars was set according to the sheet thickness. Lower bars had grooves of 1.6 to 3.0 mm in width. Spacing of 2.5 mm was applied in this experiment.
Positioning of the sheets in the welding machine is important, since too small spacing can cause the edges to overlap, while too large spacing can result in thinning of welds or even in burn-through welds, so the spacing is initially set to zero, while at the end, it equals the thickness of welded base metal.
Welding can be also performed in two passes—the first pass achieves complete penetration and formation of the weld root, the weld face is at the level of base metal, and the second pass is applied to lift the weld face and to achieve a slight rise. Both passes are performed from the top and the direction of welding in both passes is the same. Welding conditions were maintained at constant room temperature values and strictly separated from the influence of other welding processes or other metalworking technologies. Additionally, a protective atmosphere is provided in the space to prevent the appearance of unwanted particles that can affect the quality of the welded joint.
Table 3 contains information about the visual inspection of welded joints (acceptable welded joints—A, not acceptable welded joints—NA).
Visual inspection was performed according to EN ISO 5817. That method can detect and predict the place and cause of error by the human eye, with or without aids in good light. The most important checked characteristics were: continuous undercut, shrinkage groove, excess penetration, sagging incompletely filled groove, root concavity, cracks and linear misalignment.
The weld root side in the pre-test PP1 exhibited irregular and uneven melt smear, and the weld face showed thinning with also irregular and uneven melt smear, which was not acceptable. In the pre-test PP2, weld root side and face showed central thinning and uneven width of the weld face, which proved that welded joint was also unacceptable. Compared to the pre-tests PP1 and PP2, in the pre-test PP3, the welding current was reduced from 33 A to 27 A. Visual control resulted in irregular and uneven melt smear on the weld root side, while the weld face had central thinning and irregular melt smears up to the edges. As a result, this welded joint was unacceptable. In the pre-test PP4, spacing between the tungsten electrode and the workpiece was set to 2.8 mm, yet the same defects occurred as in the pre-test PP3, thus classifying this welded joint also as not acceptable. The pre-test PP5 also exhibited irregularities at the weld face, discontinuous scratches, certain central thinning of both the weld roots and face, however, according to the acceptability criteria, this welded joint was acceptable, so the experiment referred to the parameters of the Table 1 for the pre-test PP5, where the constant parameters were welding current I = 33 A, voltage U = 9.3–9.7 V, speed v = 325 mm/min, up-flow of argon of 15 l/min, and down-flow of argon of 20 l/min. These parameters were applied in welding of the experimental samples with the aim to determine whether parameters referring to the number of passes, the cleaning of sheet edges and the spacing between tungsten electrode and workpiece have significant influence on the weld quality.
There are many metal forming processes used in manufacturing of bellows, such as semi-dieless metal bellows forming process, hydroforming as a one-step method, as well as mechanical forming, referring to cold deformation of metals [23,24]. Forming of metals should not have effect either on the sample quality or the welded joint quality [25]. In order to check the influence of cold forming on welded joints, welds Z1 and Z2 were prepared and non-standardly placed on the bellows wave peaks, so that the Z1 weld face and the Z2 weld root were both placed outside (weld face and weld root were exposed to tension during forming). The experiment was performed by applying the U4 sample parameters, and the bellows were made according to the design presented in Figure 3.
Since the visual inspection proved that central thinning was constantly appearing on the sides of weld faces and weld roots of the samples U3–U6 (Z1, Z2), the U7 sample was made on narrower bars with the welding current of I = 30 A, and with the argon down-flow of 15 l/min. By such procedure, the welded joint was obtained without central thinning. Parameters applied in the main experiment are given in Table 4. The surfaces were cleaned with sandpaper and degreased with alcohol.
The tensile test was performed on the Shimadzu AGS-X (Mechanical engineering faculty in Slavonski Brod)10 kN testing machine by using specimens, as shown on Figure 4, according to standard EN ISO 5178. The tensile test is performed to determine the actual influence of the geometric shape of the welded product and the influence of observed errors quantities of weld detected, observed by visual inspection and radiographic inspection.

3. Results and Discussion

3.1. Non-Destructive Testing

Radiographic recordings were made on welded samples. This type of testing belongs to the group of non-destructive testing that reveals defects in welded joints in a detailed, yet simple way [26,27].
Results of digital radiographic recordings are shown in Table 5 (acceptable samples—A, not acceptable samples—NA), while Figure 5 presents an example of radiographic testing of the U1 sample that exhibits an increased concentration of inclusions. Radiographic recordings showed defects that were not acceptable for pressure equipment (EN ISO 10675-1, errors: porosity, continuous undercut, excess weld metal), therefore, such welded joints were considered as of an unsatisfactory quality.
With an increased number of passes, the concentration of inclusions in the U2 sample was successfully reduced, since the second pass, even without cleaning, resulted in fewer inclusions in the welded joint. Radiographic control of the U3 and U4 samples of welded joints that were cleaned before welding showed no inclusions, however, the sample U3 exhibited central thinning at the beginning and the end of the welded joint, and the sample U4 had less central thinning because of an additional heat input that was introduced to the welded joint within the second pass.
In the U5 sample, the welded joint was made in two passes with a lower positioning of the tungsten electrode, which resulted in less evident central thinning if compared to the central thinning in the U4 sample. The samples U61 and U62 which were welded according to the same parameters as the U4 sample also exhibited central thinning, just as the U4 sample. Central thinning was also observed on cold-formed samples used for manufacturing the bellows.
Radiographic control of the U7 sample showed very small central thinning. The U7 sample was an additional sample prepared on narrower bars with the welding current set to 30 A and with an Ar down-flow of 15 l/min, so that it had a narrower weld seam with less evident central thinning when compared to the samples U3–U6 (Z1, Z2).

3.2. Mechanical Testing

The tensile test and measurements of dimensions were performed on the welded joints, all with the purpose of determining the interdependence between the radiographic control, the tensile test and the dimensional control of the welded joints.
There were two specimens of the weld metal prepared for each of the six samples. The first specimen was cut at the beginning of the weld, and the second specimen was cut at the end of the weld. 
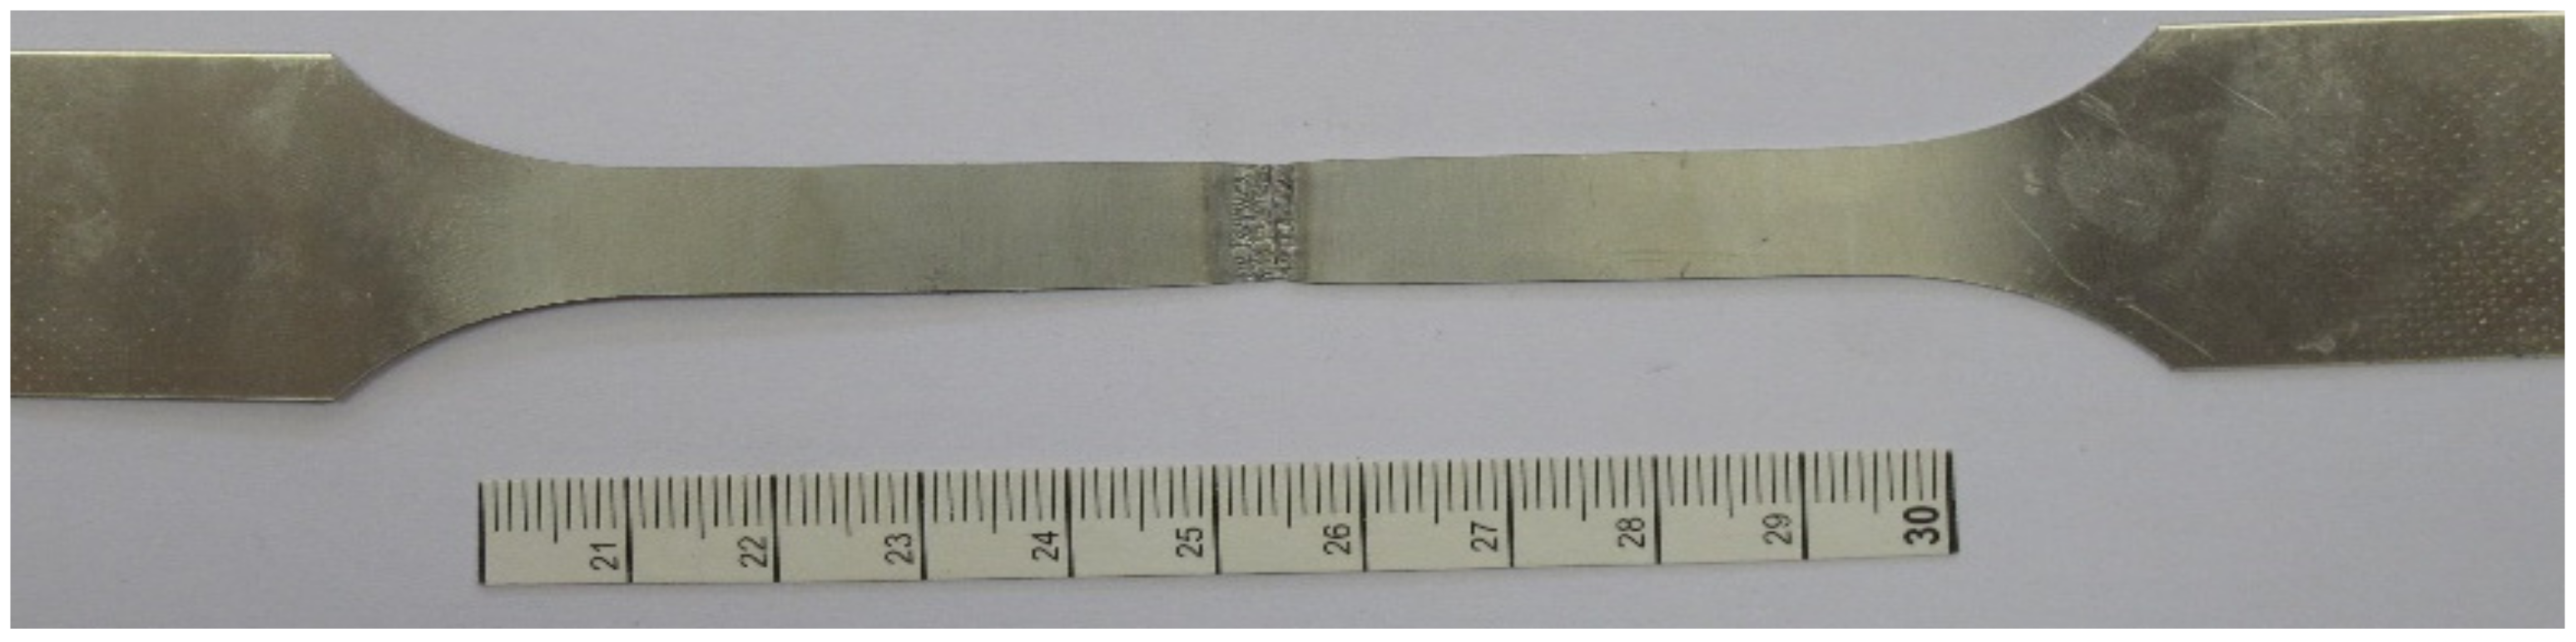
Figure 6 shows the weld metal specimen of sample 1.
As referential values, there were specimens prepared of the base metal sheet taken in the rolling direction and two specimens of the base metal taken in a perpendicular direction. Figure 7 shows the specimen of the base metal taken in the rolling direction.
The Figure 8 shows the stress–strain graphs for the base metal taken a) in the rolling direction (OM1) and b) in the perpendicular direction (OM2), whereby it was noticed that the base metal in the rolling direction had a tensile strength of 675.632 N/mm2 and elongation of A = 41.9375%, while the specimen taken in a perpendicular direction, as seen in the Figure 8b, exhibited a tensile strength of Rm = 626.107 N/mm2 and elongation of A = 47.80%. Therefore, it is concluded that the base metal has greater tensile strength when it is formed (tested) in the rolling direction, while its elongation decreases.
The results of the tensile experiment are shown in Table 6 and Figure 9 through diagrams.
The U1 sample cracked at the welded joint, and its elongation value was the lowest if compared to other samples, being 28.8225%. The U2 sample reached the value of a tensile strength of Rm = 630,274 N/mm2 and elongation of A = 47.1025%, which was close to the base metal values. A fracture of the U3 sample occurred in the heat affected zone, which was seen from the lowered value of elongation A = 41.8550%, while the tensile strength was still retained in the boundaries of the base metal, being Rm = 631.480 N/mm2. When compared to the U3 sample made with a single pass, an increased number of passes in the U4 sample affected the increase of the tensile strength, which was Rm = 633.675 N/mm2, as well as the increase of elongation A = 43.5175%. Changes in the setting of the automatic longitudinal TIG welding had a significant influence on the mechanical properties of the U5 sample, meaning that reducing the space between the tungsten electrode and the workpiece from 2.8 mm to 2.5 mm resulted in an increased tensile strength of Rm = 658.593 N/mm2 and an elongation of A = 42.0325%. By reducing the space between bars (above = below) from 2.5 mm to 2.2 mm, the tensile strength of the U7 sample was Rm = 616.059 N/mm2 and its elongation was A = 46.4100%.
The results of the macro testing are overviewed in the Table 7. The Figure 10a presents points at which dimensions of welded joints were measured (m1, m2 and m3), whereas the Figure 10b shows the appearance of the U1 sample prepared for measuring (BM—base material, HAZ—heat affected zone, WM—weld metal).
Macro testing confirmed that the samples U1, U2, U3, U4, U5, U61 (Z1), U62 (Z2), and U7 did not have anomalies, such as microcracks and cracks, however, there is a confirmed presence of central thinning in the U3 and U5 samples. The greatest thinning occurred on the U5 sample, being 14% in relation to the base metal thickness of 0.07 mm.
There is thinning observed on the fusion line of the samples U1, U3, U5, and U7, of which the greatest thinning of 4% occurred on the U5 sample, when measured in relation to the base metal thickness of 0.02 mm. An increased central rise occurred on welded joints that were made in two passes, where the highest rise was measured on the U2 sample, being 13.79% in relation to the base metal thickness of 0.08mm. Spacing between the tungsten electrode and the workpiece had a significant influence on the welded joint dimensions, since the greatest changes in dimensions of thinning at the welded joint occurred on the U5 sample when the spacing between the tungsten electrode and the workpiece was reduced from 2.8 mm to 2.5 mm.
Referring to the cold-formed samples U61 (Z1) and U62 (Z2), there was a central rise of 1.96% or 0.01 mm happening on the U62 (Z2) sample and on the fusion line, while the U61 (Z1) sample exhibited thickening of the welded joint on the fusion line in a value of 1.96% or 0.01 mm.

3.3. Finite Element Method

For the purpose of investigating how the weld shape affects the strength of a sheet metal specimen, finite element analysis was used. Data from a uniaxial tensile test on a Shimadzu AGS-X 10 kN tensile testing machine were statistically analyzed. Since the true stress–true strain functions could not be obtained for the Heat Affected Zone (HAZ) and the weld zone (no filler material was used), only data from the uniaxial tensile test were used in the finite element simulations.
Typically for dealing with nonlinear analysis, the material true stress (kf) as a function of true strain (φ) is given.
The mostly used mathematical models were [27]:
k f = C · φ n (Ludwik’s power law);
k f = A + C · φ n (modified Ludwik–Hollomon);
k f = C · m + φ n (Swift).
Coefficients A, C and m, were determined by nonlinear regression analysis and obtained mathematical models are given in Figure 11 [28]:
(a)
For the Swift model:
k f = 1503.66 · 0.02 + φ 0.441521 ,   MPa
The coefficient of determination for Equation (1) is R2 = 0.999507, and the estimated variance V(X) = 162.301. The results from regression analysis for Equation (1) are shown in the Table 8.
(b)
For the modified Ludwik–Hollomon equation:
k f = 273.792 + 1544.37 · φ 0.705549 ,   MPa
The coefficient of determination for Equation (2) is R2 = 0.999607, and the estimated variance V(X) = 129.266. The results from regression analysis for Equation (2) are shown in the Table 9.
(c)
For Ludwik’s model equation:
k f = 1190.08 · φ 0.288422 ,   MPa
The coefficient of determination for Equation (3) R2 = 0.988862, and the estimated variance V(X) = 3667.93. The results from regression for Equation (3) analysis are shown in the Table 10.
Figure 12 shows a 3D model of the base sheet metal tensile test specimen (one quarter of a tensile test specimen gauge length, due to symmetry and for simplification). Boundary conditions are shown on the figure, and mesh refinement is visible in the area where necking is expected to occur.
On the right side of the FEM model there is a surface defined, to which the right side nodes are attached (glued) as per the contact table option. This surface has a prescribed motion in the x-axis direction, u = 8.33925 mm, as per the uniaxial tensile test results.
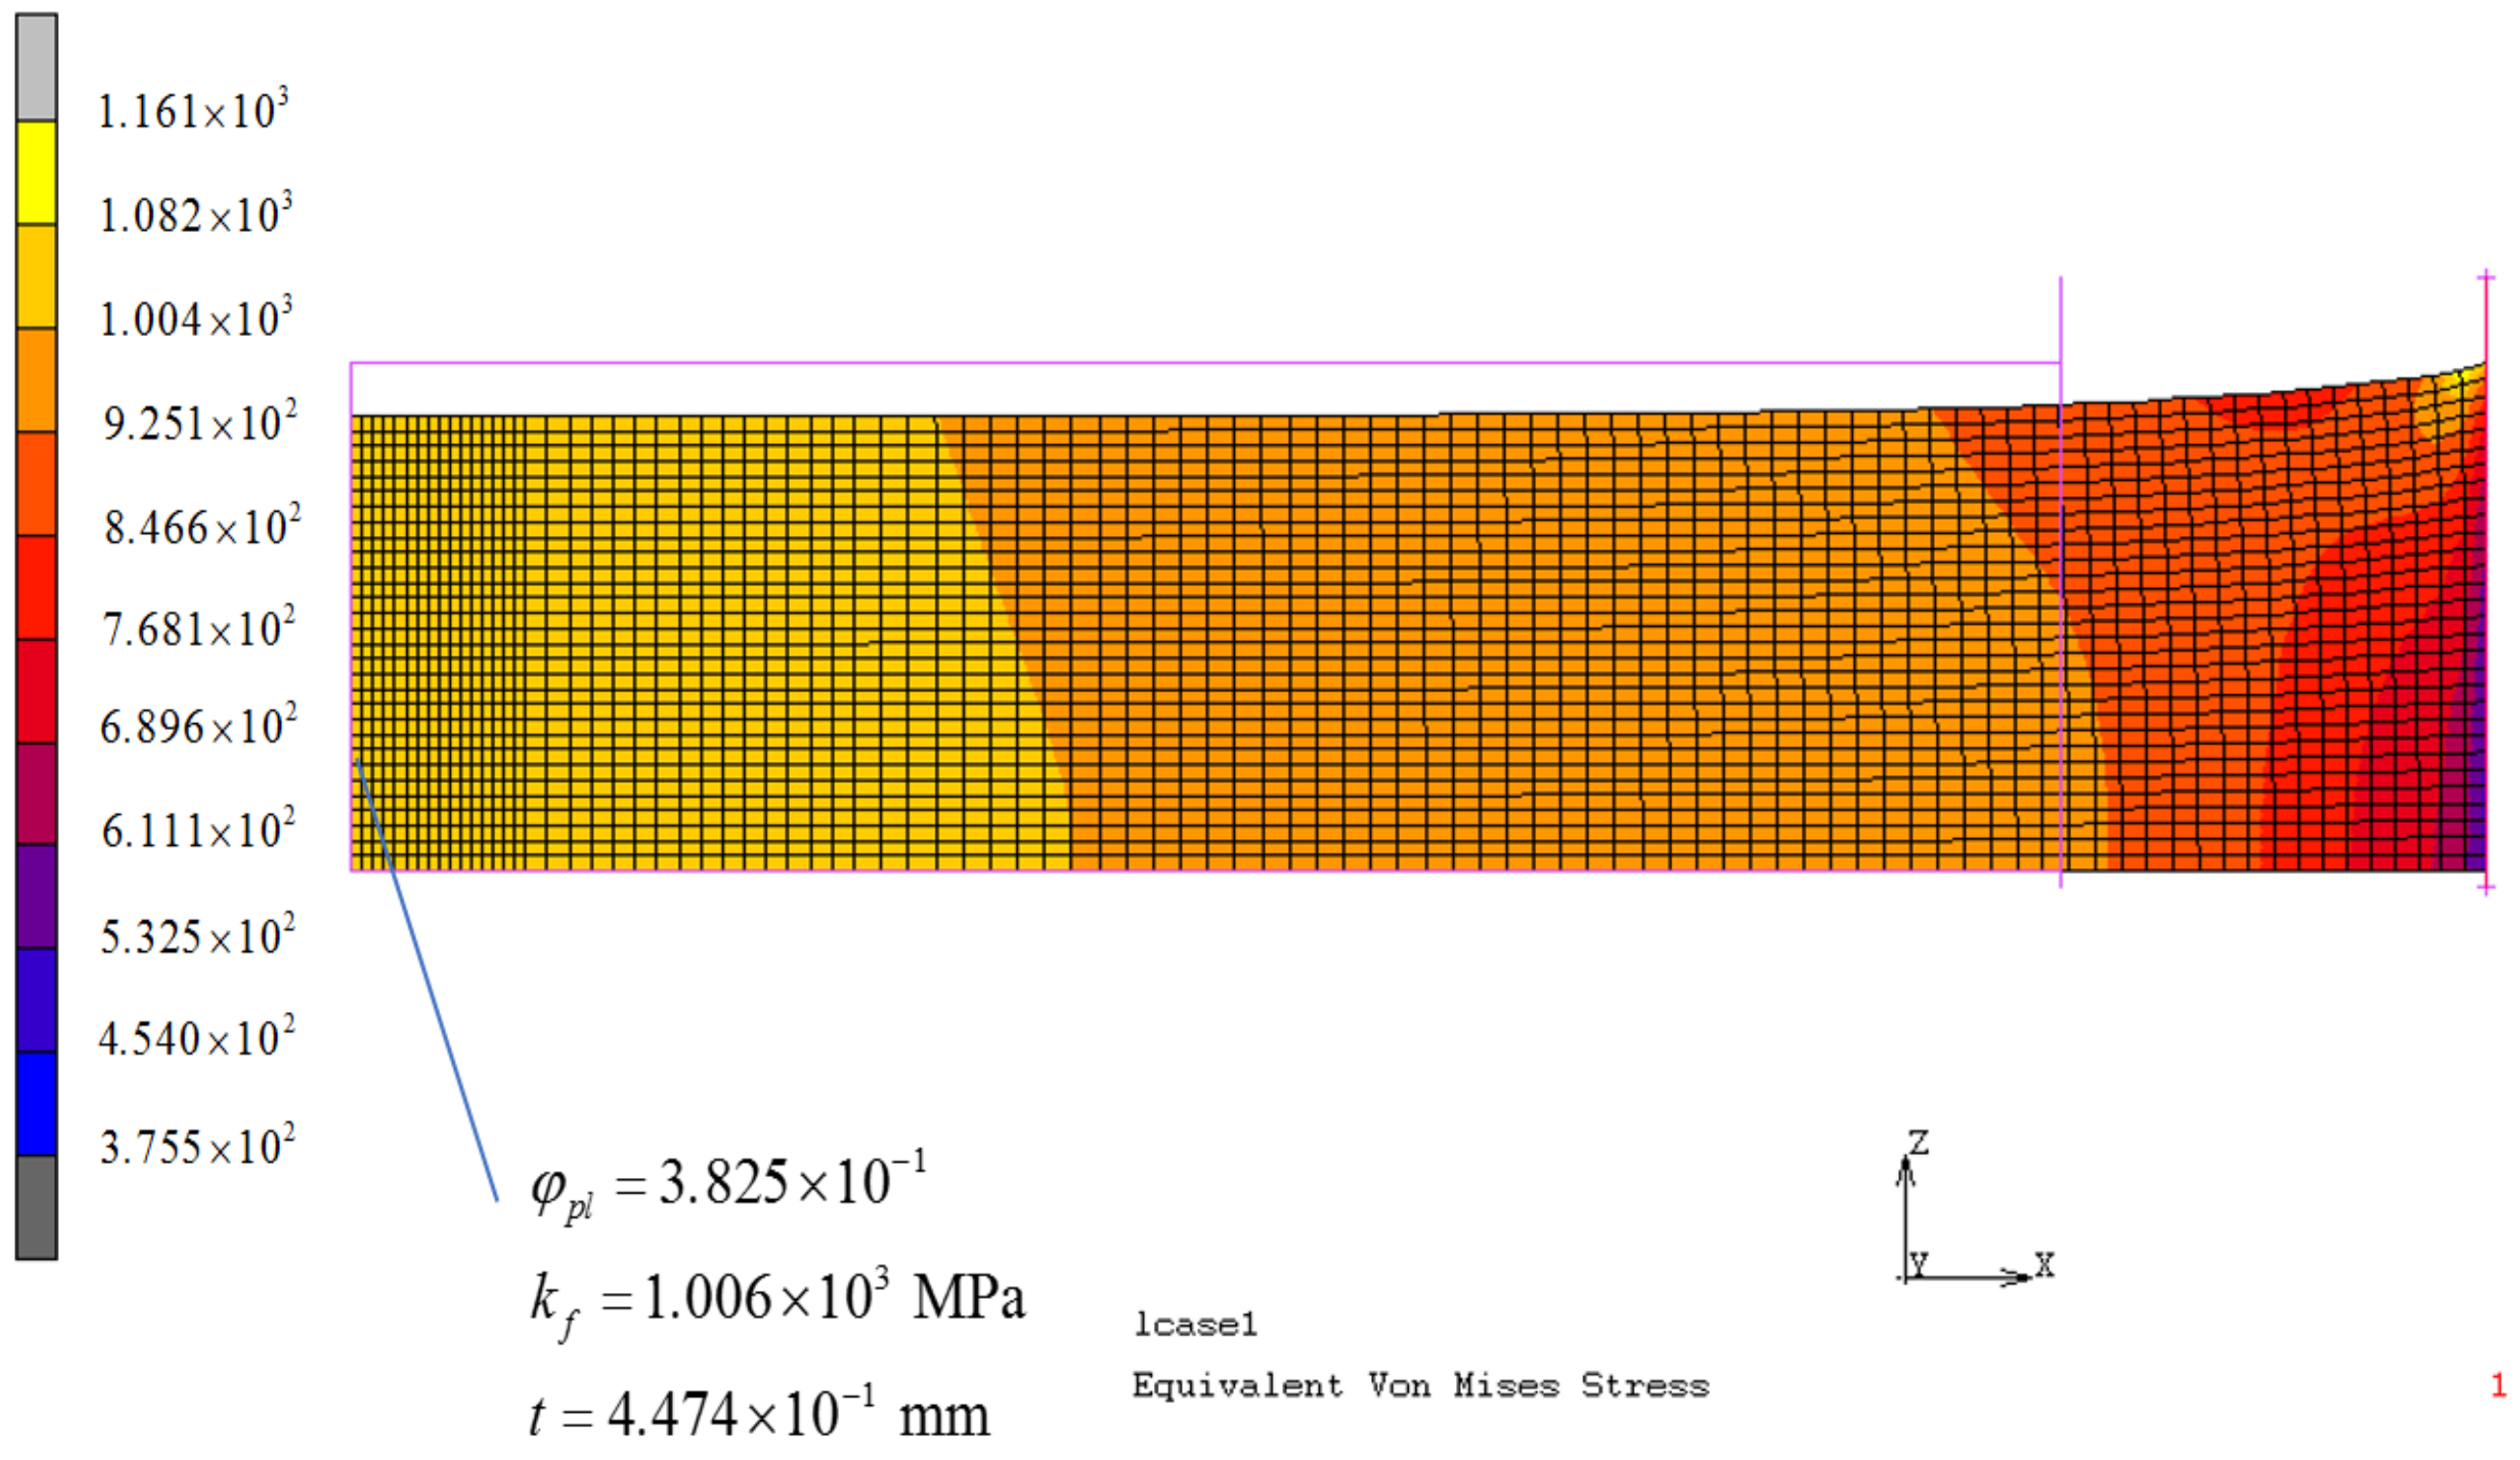
Figure 13 shows results from the FEM simulation in terms of true stress kf, true strain φ and sheet metal thickness at the shown point. Using mathematical terms, true strain can be calculated to conventional (engineering strain as) ε = e φ 1 = 0.465944 , which is related to a local strain higher than the one calculated based on specimen elongation ε =   l / l 0 [27,29]. Engineering (conventional) can be calculated as σ e n g = k f / 1 + ϵ = 686.25 MPa which is a good approximation of the tensile test result of the U1 specimen cut parallel to the sheet metal rolling direction [27].
Figure 14 shows comparison of data from the tensile test and FEM simulation results. It should be noted that the tensile test extensometer cannot measure local strain in the area where local necking occurs, so for this reason, FEM data are shown also with respect to the definition of the engineering strain.
Figure 15 shows a comparison of force as a function of specimen elongation (displacement), where a good FEM approximation can be observed, maximal deviation of results is under 5% ( Δ F = F m e a s F F E M F m e a s · 100 % = 4182 4053.4 4053.4 · 100 % = 3.17 % ).
For the assessment of damage, a Cockroft–Latham damage indicator was used (Equation (4)). The material constant on the fracture criterion C is calculated as follows [30].
C C L = 0 φ f σ m a x σ H d φ p l
where σmax is the maximal principal stress, σH is the equivalent HMH stress, φf is the fracture strain, and φpl is the plastic strain.
Figure 16 shows the nodes for which the Cockroft–Latham damage indicator was calculated, and the average value was obtained. It is assumed that local necking and fractures will occur in the FEM model due to the ¼ model symmetry. A calculated fracture criterion CCL was then applied to the FEM simulation where the model geometry was copied from specimen U5 in order to determine the possible fracture zone.
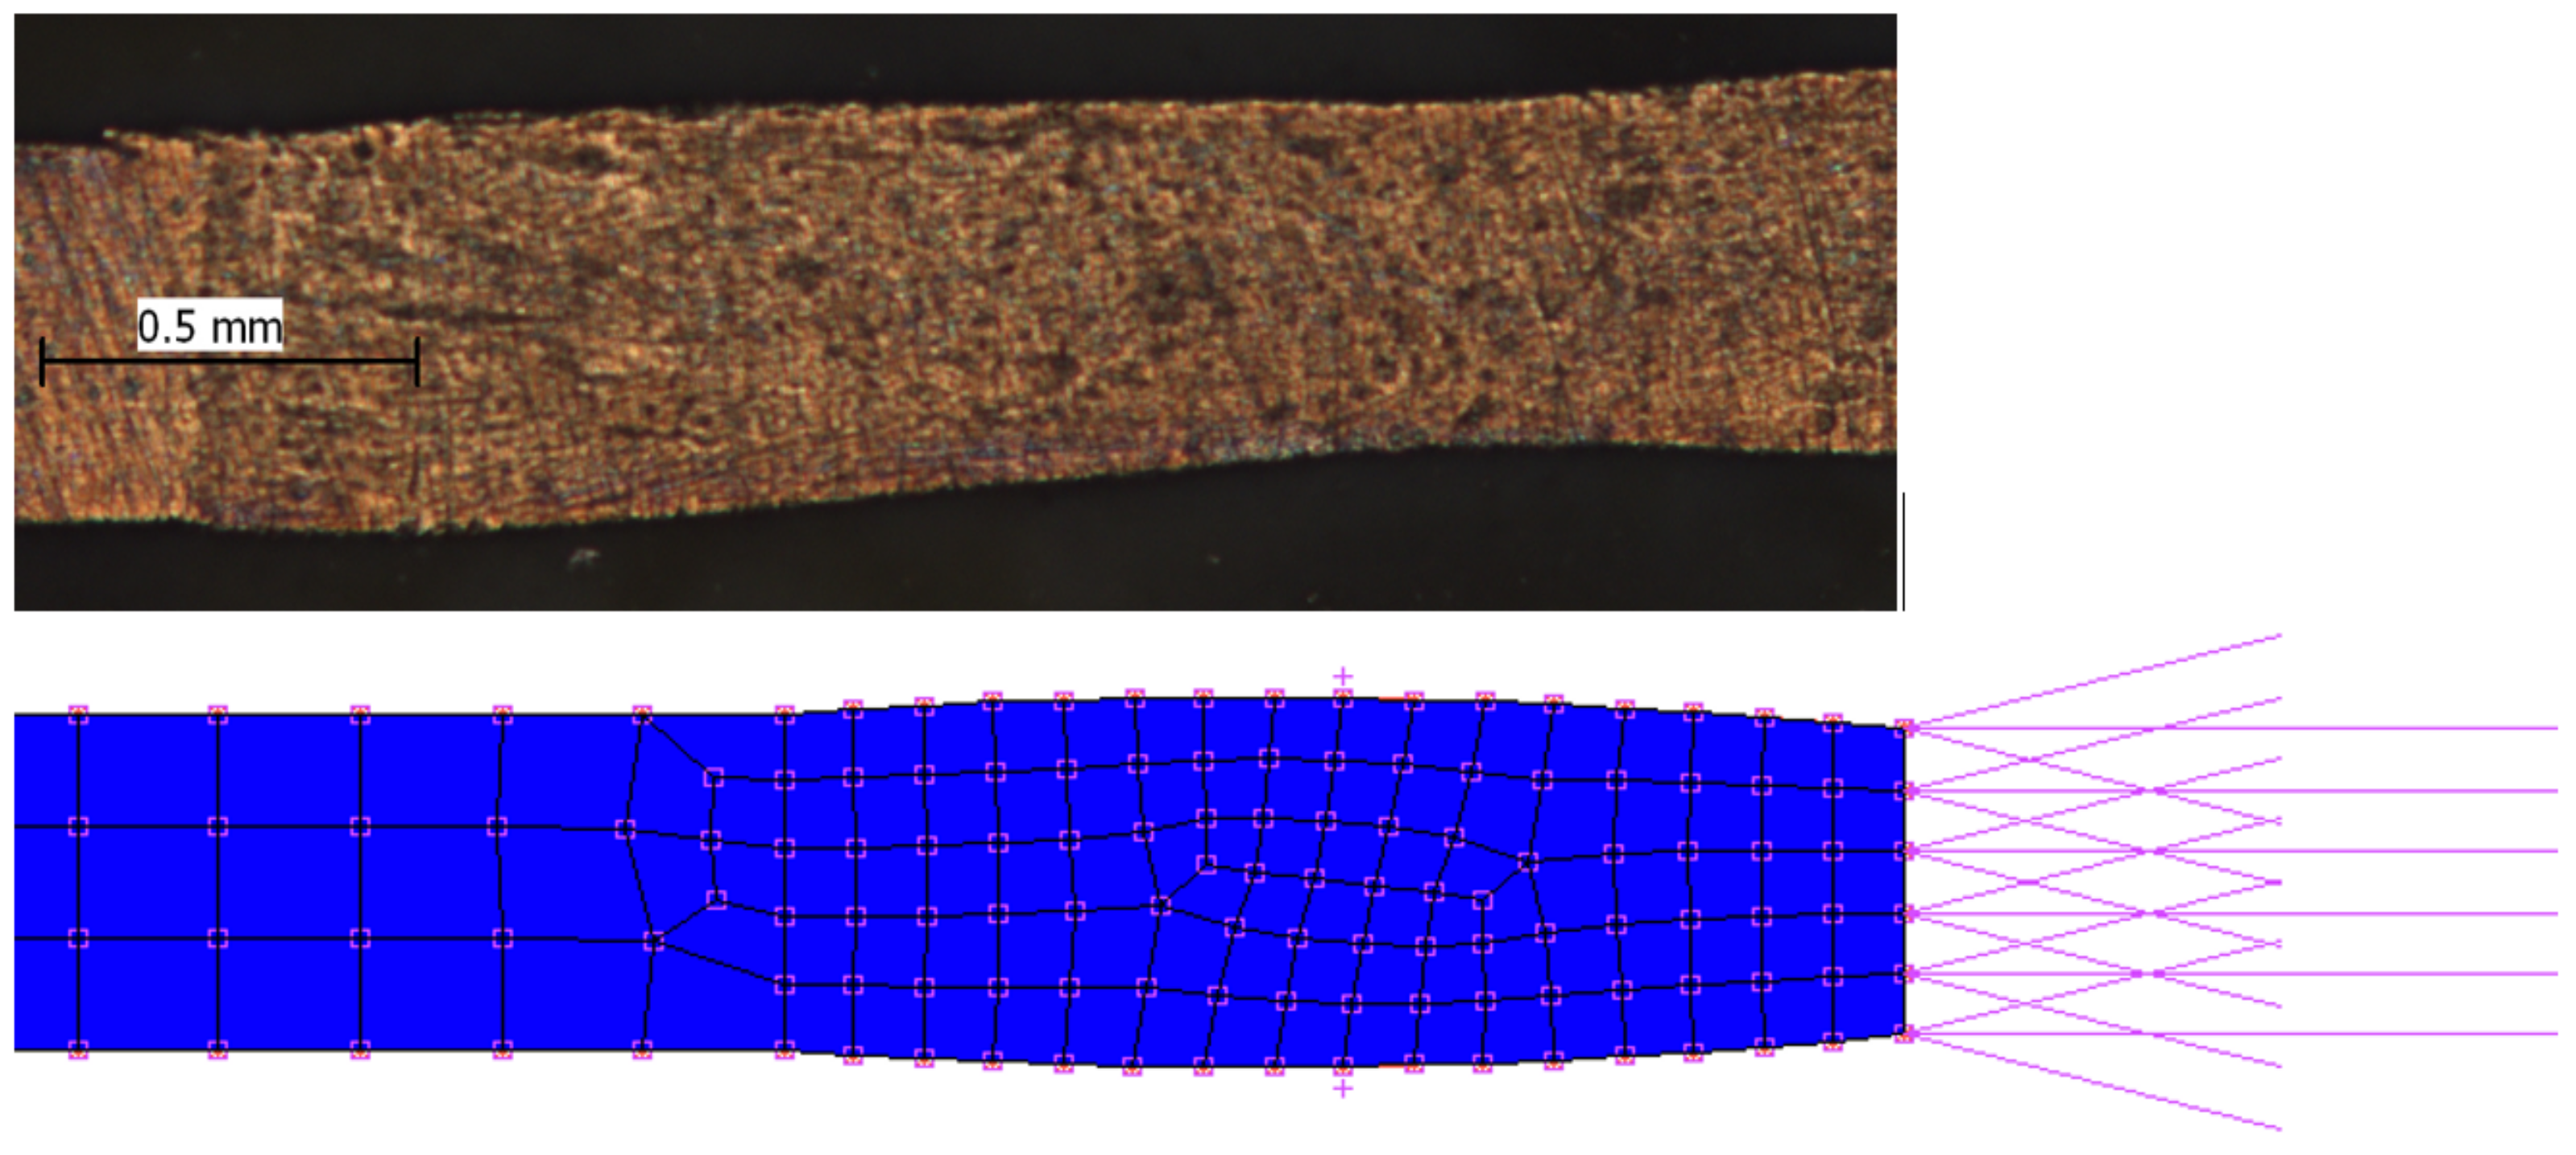
For the next numerical simulation, the goal was to apply a calculated Cockroft–Latham damage indicator on the FEM model, where the weld was modeled per specimen U5, as is shown in Figure 17. The U5 specimen had the largest central thinning (Figure 17 and Table 6), and the hypothesis had been that this specimen would have failed at a lower tensile force due to the geometrical nonlinearity.
Figure 18 shows the equivalent true stress distribution in the tensile test specimen. In the weld zone, stresses are lower for the reason of a larger volume of material (weld nugget). A better representation of stresses is shown in Figure 19.
Figure 20 shows the indication of probable material failure as per the Cockroft–Latham damage indicator. Tensile force at this instant was calculated F = 4144 N. The measured maximal force in the uniaxial tensile test for specimen U5 was F = 3951,6 N which is a difference of Δ F = 4.87 % .
For a better approximation of results, the two material models could be used in numerical simulations (base material, and heat affected material). Since these data are difficult to determine in uniaxial tensile test specimens, only the approximation of material data could be obtained from specialized software, such as, i.e., JMATPRO® software, or data could be obtained by other testing methods.

4. Conclusions

The cleaning of welded joints proved to have a significant influence on their quality (especially porosity), since the welding of joints without cleaning resulted in welded joints with an increased number of inclusions, while cleaned welded joints had fewer inclusions.
AISI 321 steel is acceptable for use in these applications and operating conditions due to its good weldability, good cold forming capability and its mechanical properties.
The residual stresses which are related to the welding procedure are also one of the influencing factors on the quality of the welded joints.
The TIG welding process compared to other welding processes for this application resulted in a much higher local heat input during welding, which automatically increases the residual stresses and strains. Welded joints made with a single pass had considerably more inclusions than those made with two passes. These conclusions were confirmed in the performed experiment, within which radiographic control of the U1 welded joint sample (no cleaning + single pass) showed an increased number of inclusions, and the tensile test resulted in cracks in the welded joint, which is unacceptable. Welded joints that were cleaned did not exhibit problems with inclusions, yet they had issues with geometry, as proved by the radiographic control. The cleaning of joints before welding did not influence the welded joint geometry, as the measured values were acceptable.
The number of passes had a significant influence on the geometric shape of the weld joint, on the occurrence of central thinning and on thinning along the fusion line. Joints welded with a single pass exhibited central thinning, as well as thinning on the fusion line in relation to the thickness of the base metal, which was also proved by radiographic recordings. In addition to its influence on the geometry of welds, the number of passes also had a significant influence on reducing the occurrence of defects in welded joints, meaning that joints welded with two passes had fewer errors (inclusions, central thinning). The spacing between the tungsten electrode and the workpiece proved to have a significant influence on the geometry of the welded joints, since central thinning of 14% occurred in the U5 sample, which was welded with spacing reduced from 2.8 mm to 2.5 mm. Numerical stress analysis for the U5 specimen was performed. Using the Cockroft–Latham failure criterion, the possible critical zone was detected. It should be noted that the change of material properties in the welded zone and HAZ zone was not incorporated in the FEM material model.
When compared to the U5 sample, the lowering of values referring to the welding parameters of current, gas flow and the spacing of bars in the U7 sample affected the change in the geometry of the welded joint by reducing the thinning.
Cold forming of the welded joints in the samples U61 (Z1) and U62 (Z2) did not affect the quality of the welded joints, since dimensional control did not prove the occurrence of significant changes. In summary, the best welding conditions were the usage of two numbers of passes instead of one, the cleaning of the workpiece and maintaining a higher tungsten tip distance from workpiece.
Defects that were noticed on radiographic recordings refer to inclusions in the welded joints, and they had a significant influence on the quality of the welded joints (geometry, mechanical properties). Such defects are unacceptable in the manufacture of compensators and other pressure equipment. Sometimes visual inspection did not prove significant central thinning or thinning on the fusion line, yet their presence was confirmed by the radiographic recordings. The central thinning of samples was classified according to the standard EN ISO 5817 with accompanying defects (5011—Continuous undercut, 502—Excess weld metal (butt weld), 504—Excess penetration, 511—Incompletely filled groove, 515—Root concavity) that confirm that all welded joints were acceptable at the quality levels D and C. In this case, according to the above-mentioned quality control criteria, the welded joint of the U4 sample was the only one to meet the quality criteria of level B.

Author Contributions

Conceptualization, D.M. and T.Š.; methodology, D.M.; validation, J.C. and I.S.; formal analysis, D.M.; investigation, D.M. and J.C.; resources, T.Š.; writing—original draft preparation, D.M.; writing—review and editing, J.C. and I.S.; visualization, D.M.; supervision, D.M.; project administration, I.S.; funding acquisition, I.S. All authors have read and agreed to the published version of the manuscript.

Funding

This research received no external funding.

Institutional Review Board Statement

Not applicable.

Informed Consent Statement

Not applicable.

Data Availability Statement

Not applicable.

Conflicts of Interest

The authors declare no conflict of interest.

References

  1. Xiang, X.M.; Lu, G.; Li, Z.X.; Lv, Y. Finite element analysis and experimental study on a bellows joint. Eng. Struct. 2017, 151, 584–598. [Google Scholar] [CrossRef]
  2. Vukelic, G.; Vizentin, G.; Brnic, J.; Brcic, M.; Sedmak, F. Long-Term Marine Environment Exposure Effect on Butt-Welded Shipbuilding Steel. J. Mar. Sci. Eng. 2021, 9, 491. [Google Scholar] [CrossRef]
  3. Rajala, P.; Sohlberg, E.; Priha, O.; Tsitko, I.; Väisänen, H.; Taussa, M.; Carpén, L. Biofouling on Coated Carbon Steel in Cooling Water Cycles Using Brackish Seawater. J. Mar. Sci. Eng. 2016, 4, 74. [Google Scholar] [CrossRef]
  4. Pavić, J.; Samardžić, I.; Marić, D.; Šolić, T.; Dunđer, M. Metal bellows Expansion Joints for Pressure Applications—Materials Engineering Technologies. In Proceedings of the Manufacturing of Welded Constructions and Products; SBW: Slavonski Brod, Croatia, 2019; pp. 187–199. [Google Scholar]
  5. Pavić, J.; Samardžić, I.; Marić, D.; Horvat, M.; Eržišnik, J. Metal bellows expansion joints for pressure application—Application of welding technology. In Proceedings of the Manufacturing of Welded Constructions and Products; SBW: Slavonski Brod, Croatia, 2021; pp. 141–150. [Google Scholar]
  6. Lucjan, Ś.; Sławomir, S.; Janusz, T.; Volodymyr, H. Deterministic and probabilistic analysis of semi-elliptical cracks in austenitic steel. Procedia Mater. Sci. 2014, 3, 2160–2167. [Google Scholar] [CrossRef] [Green Version]
  7. Wei, L.; Huitao, C.; Cong, L.; Weiying, H.; Jian, C.; Lu, Z.; Yanjie, R.; Jianjun, H.; Shengde, Z. Microstructure and tensile properties of AISI 321 stainless steel with aluminizing and annealing treatment. Mater. Des. 2021, 205, 109729. [Google Scholar] [CrossRef]
  8. Devendranath Ramkumar, K.; Pavan, B.; Chandrasekar, V. Development of improved microstructural traits and mechanical integrity of stabilized stainless steel joints of AISI 321. J. Manuf. Processes 2018, 32, 582–594. [Google Scholar] [CrossRef]
  9. Deli, Z.; Yu, Z.; Jiangyu, F.; Tianyu, L.; Yihong, N.; Wantang, F.; Zhiqing, L. Structural Properties and Phase Stability of Primary Y Phase (Ti2SC) in Ti-Stabilized Stainless Steel from Experiments and First Principles. Materials 2019, 12, 1118. [Google Scholar] [CrossRef] [Green Version]
  10. Kumar Krovvidi, S.C.S.P.; Sunil, G.; Bhaduri, A.K. Design, analysis and experimental validation of Inconel-625 bellows for critical applications. Mater. Today Proc. 2021, 39, 1733–1737. [Google Scholar] [CrossRef]
  11. Pacana, A.; Siwiec, D. Analysis of the Possibility of Used of the Quality Management Techniques with Non-Destructive Testing. Tech. Gaz. 2021, 28, 45–51. [Google Scholar] [CrossRef]
  12. Baofeng, Z.; Xia, H.; Ganping, S. Tests of cold-formed and welded stainless steel beam-columns. J. Constr. Steel Res. 2015, 111, 1–10. [Google Scholar] [CrossRef]
  13. Mohammed, S. Bending Test and Simulation of Welded Galvanized Steel Pipes. Teh. Vjesn. 2021, 28, 509–514. [Google Scholar] [CrossRef]
  14. Sudhir, K.; Rajender, S. Optimization of process parameters of metal inert gas welding with preheating on AISI 1018 mild steel using grey based Taguchi method. Measurement 2019, 148, 106924. [Google Scholar] [CrossRef]
  15. Pradeep, J.; Murugan, N. Microstructure and mechanical properties of friction stir welding AISI321 stainless steel. J. Mater. Res. Technol. 2020, 9, 3967–3976. [Google Scholar] [CrossRef]
  16. Devendranath, R.K.; Shubham, S.; Joshy, C.G.; Anirudh, S.; Brahadees, G.; Sahil, G.; Saurabh, K.G.; Vishnu, C.; Sharan, N.R.; Kalainathan, S. Effect of pulse density and the number of shots on hardness and tensile strength of laser shock peened, activated flux TIG welds of AISI 347. J. Manuf. Process. 2017, 28, 295–308. [Google Scholar] [CrossRef]
  17. Zala, A.B.; Jamnapara, N.I.; Sasmal, C.S.; Sam, S.; Ranjan, M. Study of microstructure & mechanical properties of TIG welded aluminized 9Cr-1Mo steel. Fusion Eng. Des. 2022, 179, 113038. [Google Scholar] [CrossRef]
  18. Ting, L.; Youmin, R.; Hui, W.; Yu, H.; Min, L. A review of vision-aided robotic welding. Comput. Ind. 2020, 123, 103326. [Google Scholar] [CrossRef]
  19. Ting, L.; Chaoqun, W.; Youmin, R.; Yu, H. The development of tube-to-tubesheet welding from automation to digitization. Int. J. Adv. Manuf. Technol. 2021, 116, 779–802. [Google Scholar] [CrossRef]
  20. Nanda, N.K.; Balasubramanian, K.R. Parametric Optimization of TIG Welding on 316L Austenitic Stainless Steel by Grey-Base Taguchi Method. Adv. Mater. Res. 2021, 383–390, 4667–4671. [Google Scholar] [CrossRef]
  21. Abhay, K.J.; Diwaker, V.; Sreekumar, K. Metallurgical investigation on stainless steel bellows used in satellite launch vehicle. Eng. Fail. Anal. 2006, 13, 1437–1447. [Google Scholar] [CrossRef]
  22. Kamal, M.; Swati Ghosh, A. Failure analysis of AISI 321 stainless steel welded pipes in solar thermal power plants. Eng. Fail. Anal. 2018, 86, 33–43. [Google Scholar] [CrossRef]
  23. Kondapalli Siva, P.; Chalamasetti Srinivasa, R.; Damera Nageswara, R. An investigation on weld quality characteristics of pulsed current micro plasma arc welded austenitic stainless steels. Int. J. Eng. Sci. Technol. 2012, 4, 159–168. [Google Scholar]
  24. Pavithra, E.; Senthil Kumar, V.S. Experimental Investigation and Numerical Analysis on Fatigue Life of Bellows. Mater. Today Proc. 2018, 5, 18848–18856. [Google Scholar] [CrossRef]
  25. Mengsi, Y.; Huifang, L.; Yougang, W.; Caifu, Q. Hydroforming of Toroidal Bellows: Process Simulation and Quality Control. Materials 2021, 14, 142. [Google Scholar] [CrossRef]
  26. Balaji, C.; Abinesh Kumar, S.V.; Ashwin Kumar, S.; Sathish, R. Optimization and Non-destructive Test Analysis of SS316L Weldments Using GTAW. Mater. Res. 2014, 17, 190–195. [Google Scholar] [CrossRef] [Green Version]
  27. Ramesh Kumar, B. Weld Quality Analysis of TIG, Laser and Electron Beam Welded ss 304 and 316 materials with NDT Techniques. In Proceedings of the National Seminar & Exhibition on Non-Destructive Evaluation NDE 2011, Chennai, India, 8–10 December 2011; pp. 346–349. [Google Scholar]
  28. Matushevic, E.A.; Massa, J.; Mancini, R. Computation of Tensile Strain-Hardening Exponents through the Power-Law Relationship. J. Test. Eval. 2012, 40, 104226. [Google Scholar] [CrossRef]
  29. Waldemar, M.; Miroslav, D.; Josip, C.; Ivan, S. Conventional Shaping the Edges of Thick Steel Plates after Welding Process. Teh. Vjesn. 2021, 28, 663–667. [Google Scholar] [CrossRef]
  30. Myint, P.W.; Hagihara, S.; Tanaka, T.; Taketomi, S.; Tadano, Y. Determination of the values of critical ductile fracture criteria to predict fracture initiation in punching processes. J. Manuf. Mater. Process. 2017, 1, 12. [Google Scholar] [CrossRef] [Green Version]
Figure 2. Setting the welding parameters on the automatic welding machine.
Jmse 10 00452 g002
Figure 3. Preparation of the sample U6: (a) design for preparation of the bellows with the weld details, (b) appearance of the welded bellows, (c) formed bellows.
Jmse 10 00452 g003
Figure 4. Shimadzu AGS-X 10 kN testing machine.
Jmse 10 00452 g004
Figure 5. Radiographic control of the U1 sample.
Jmse 10 00452 g005
Figure 6. Weld metal specimen of sample 1.
Jmse 10 00452 g006
Figure 7. Specimen of the base metal taken in the rolling direction.
Jmse 10 00452 g007
Figure 8. Stress−strain curve for: (a) OM1 and (b) OM2.
Jmse 10 00452 g008
Figure 9. Stress–strain curve for U1, U2, U3, U4, U5, U7.
Jmse 10 00452 g009aJmse 10 00452 g009b
Figure 10. Measurement of dimensions on samples—(a) measuring points, (b) sample U1.
Jmse 10 00452 g010
Figure 11. Comparison of measured data and mathematical models.
Jmse 10 00452 g011
Figure 12. Three dimensional FEM model of base sheet metal.
Jmse 10 00452 g012
Figure 13. FEM tensile test results.
Jmse 10 00452 g013
Figure 14. Stress–strain diagram obtained from tensile tests and FEM simulations.
Jmse 10 00452 g014
Figure 15. Tensile force as a function of displacement.
Jmse 10 00452 g015
Figure 16. Nodes for which Cockroft–Latham damage indicator was calculated.
Jmse 10 00452 g016
Figure 17. FEM model as per U5 specimen from Table 6.
Jmse 10 00452 g017
Figure 18. FEM Von Mises stresses distribution at the specimen.
Jmse 10 00452 g018
Figure 19. True stress distribution at the specimen (side view).
Jmse 10 00452 g019
Figure 20. Cockroft–Latham indication of material failure in the specimen.
Jmse 10 00452 g020
Table 1. Mechanical properties of the AISI 321 material [7].
Tensile Strength—min (MPa)Yield Strength 0.2% Proof—min (MPa)Elongation (% in 50—min (mm)Hardness Rocwell BBrinell
5152054095217
Table 2. Welding parameters of pre-tests PP1–PP5.
ParametersPP1PP2PP3PP4PP5
Current (A)3333272733
Voltage (V)9.3–9.79.3–9.79.3–9.79.3–9.79.3–9.7
Speed (mm/min)370325325325325
Number of passes22222
Flow of Ar upwards (L/min)1515151515
Flow of Ar downwards (L/min)2020202020
Spacing between the tungsten electrode and the workpiece (mm)≈2.5≈2.5≈2.5≈2.8≈2.8
Table 3. Visual inspection (VI) of welded joints.
Pre-Test PositionImage of the WeldVI
PP1(weld root) Jmse 10 00452 i001NA
(weld face) Jmse 10 00452 i002NA
PP2(weld root) Jmse 10 00452 i003A
(weld face) Jmse 10 00452 i004NA
PP3(weld root) Jmse 10 00452 i005NA
(weld face) Jmse 10 00452 i006A
PP4(weld root) Jmse 10 00452 i007NA
(weld face) Jmse 10 00452 i008A
PP5(weld root) Jmse 10 00452 i009A
(weld face) Jmse 10 00452 i010A
Note: acceptable welded joints—A, not acceptable welded joints—NA.
Table 4. Main experiment parameters.
W.Nr. 1.4541U1U2U3U4U5U61 (Z1)U62 (Z2)U7
CleaningNONOYESYESYESYESYESYES
Number of Passes12122222
Spacing between Bars (above = below)2.52.,52.52.52.52.52.52.2
Spacing between the Tungsten Electrode and the Workpiece (mm)≈2.8≈2.8≈2.8≈2.8≈2.5≈2.8≈2.8≈2.8
Table 5. Results of radiographic recording.
SampleRadiographic Recording—DescriptionAcceptable—A/
Not Acceptable—NA
U1Inclusions—increased concentrationNA
U2Inclusions—reduced concentrationNA
U3Central thinning—beginning, end of weldA
U4Central thinningA
U5Central thinningA
U61, U62Central thinningA
U7Central thinningA
Table 6. Results of tensile test.
SamplesBreak Stress/N/mm2Strain/%Max Stress/N/mm2
U1630.84028.8225631.774
U2621.30947.1025630.274
U3622.33441.8550631.480
U4622.75443.5175633.675
U5648.16242.0325658.593
U7605.59346.4100616.059
Table 7. Results of measuring dimensions on samples U1, U2, U3, U4, U5, U61 (Z1), U62 (Z2), U7.
Samplem1/mmm2/mmm3/mmm1/0.50/%m2/0.50/%m3/0.50/%
U10.500.540.490+7.41−2.04
U20.510.580.50+1.96+13.790
U30.490.460.49−2.04−8−2.04
U40.500.510.500+1.960
U50.490.430.48−2.4−14−4
U61 (Z1)0.510.500.51+1.960+1.96
U62 (Z2)0.500.510.510+1.96+1.96
U70.490.510.49−2.04+1.96−2.04
Table 8. Results from regression analysis for Swift’s model.
EstimateStandard Errort-Statisticp-Value
C1503.661.53147981.8426.0513471006 × 10−5284
n0.4415210.000494624892.6412.31140842177 × 10−5097
Table 9. Results from regression analysis for Ludwik–Hollomon model.
EstimateStandard Errort-Statisticp-Value
A273.7920.513614533.0691.53678148322 × 10−4091
C1544.373.13055493.321.43167904502 × 10−3941
n0.7055490.00159888441.2781.39498347382 × 10−3726
Table 10. Results from regression analysis for Swift’s model.
EstimateStandard Errort-Statisticp-Value
C1190.085.00083237.9762.02555602141 × 10−2564
n0.2884220.0017753162.4635.18114884907 × 10−1893
Publisher’s Note: MDPI stays neutral with regard to jurisdictional claims in published maps and institutional affiliations.

