Article

Field Observations of Scour Behavior around an Oscillating Water Column Wave Energy Converter

1
School of Civil Engineering, University of Queensland, St Lucia, QLD 4072, Australia
2
BMT, 348 Edward Street, Brisbane, QLD 4000, Australia
3
Wave Swell Energy Ltd., 50 Camberwell Road, Hawthorn East, Melbourne, VIC 3121, Australia
*
Author to whom correspondence should be addressed.
J. Mar. Sci. Eng. 2022, 10(3), 320; https://doi.org/10.3390/jmse10030320
Submission received: 31 January 2022 / Revised: 15 February 2022 / Accepted: 19 February 2022 / Published: 23 February 2022
(This article belongs to the Special Issue Wave, Tidal and Offshore Wind Energy Site Assessment and Monitoring)

Abstract

:
This study provides the first ever published measurements of scour and morphological change around an Oscillating Water Column (OWC) Wave Energy Converter (WEC) device at a real-world site, with the intention of informing future designs to reduce costs of the technology. A 200-kW prototype OWC WEC was deployed at King Island, Tasmania, Australia in January 2021, providing a unique opportunity to monitor the device using a combination of dive footage, multi-beam surveys and bedrock surveys. Settlement of the device was observed and monitored before ceasing once the foundation made contact with the underlying bedrock at the site. It is hypothesized that the settlement is caused by scour undermining the gravity structure’s foundations. The processes causing this scour are explored and possible future design modifications are suggested to reduce the risk of scour and settlement.

1. Introduction

The growing importance and recognition of climate change and the need for cleaner energy sources has prompted renewed emphasis on the development of low-carbon energy sources, including marine renewable energy such as wave energy. One type of wave energy currently under development which forms a large portion of existing deployed wave energy devices is the Oscillating Water Column (OWC) Wave Energy Converter (WEC) [1]. A gravity based OWC WEC operates like an artificial blow hole, with the structure similar to a hollow caisson structure with an underwater opening that allows the water level inside the caisson to rise and fall with the wave motion, this in turn causes air pressure fluctuations inside the structure which can be used to produce energy via an air turbine.
Recent innovations have found that using a unidirectional air turbine in conjunction with one-way air valves that open to release air under positive internal pressures, can produce a higher energy extraction efficiency [2]. This has prompted increased funding towards these types of structures, with the Australian Renewable Energy Agency recently funding over 4 million AUD towards a pilot project near King Island in Tasmania [3].
Whilst multiple previous studies have focused on the energy conversion efficiency or internal flow patterns of gravity based OWC WECs [2,4,5], little research has been undertaken on the effects of an OWC WEC on its surrounding environment, and in turn the risks to structure stability or potential reductions in energy efficiency that could occur due to scour (localized sediment erosion) or settlement of the device. This is despite previous site characterization studies for multiple wave energy sites identifying active sediment environments [6,7].
Existing knowledge of potential scour behavior around a gravity-based OWC WEC comes from a laboratory scale experimental study of a generic OWC WEC structure by Lancaster, et al. [8]. The authors showed that scour holes can form at all four corners, and along the front face at the location of the underwater opening. For some wave conditions the equilibrium scour depths at the corners exceeded 10% of the structure width. The scour at the corners of the structure was primarily caused by the formation of vortices at the corners with the passage of the waves, whilst the scour at the front face of the device was due to the increased flow velocities resulting from the inflow and outflow of the underwater opening. This outflow also increased the size of scour holes at the front corners due to the advection of suspended sediment away from the structure.
Aside from the study by Lancaster, et al. [8], very limited knowledge is available in the literature to aid scour prediction around large bluff body structures, and there are no published field measurements of scour around an OWC WEC or large sharp-edged caisson structures available in the literature to the knowledge of the authors. Most research relating to scour around large structures or gravity-based foundations for established offshore industries involve structures that have cylindrical or conical cross-sections and do not investigate the possibility of scour undermining a structure (due either to deep embedment depths or scour protection around the structure) [9,10]. Sumer and Fredsøe [9] undertook a laboratory study to investigate wave scour around large vertical cylindrical structures and found scour occurred around the structure, caused by locally increased flow velocities bringing sediment into suspension, which was then transferred to accretion zones by strong steady streaming velocities that reached 20–25% of the maximum undisturbed near-bed wave velocity. Bolle, et al. [10] presented both field and laboratory measurements of scour around a gravity-based wind turbine foundation involving conical and cylindrical sections. When no scour protection was placed the laboratory studies suggested scour could reach a depth of 2 m at field scale, whilst when an armour layer was placed surrounding the structure it prevented scour development close to the structure, although some edge scour on the outer rim of the scour protection was reported. Field measurements agreed relatively well with the laboratory results in their study. These studies however have key differences compared to an OWC WEC or sharp-edged caisson structure that limit their relatability. Scour around a large circular structure involves less flow separation than around a sharp-edged rectangular sectioned structure, and therefore does not produce vortex-induced corner scour which was found to be of critical concern for OWC WEC’s experimentally by Lancaster, et al. [8], or the inflow/outflow associated specifically with OWC WEC underwater openings/chambers. They also do not investigate the potential impact of scour undermining the structure and the impact of this process on scour development.
Studies of scour around non-cylindrical structures with more relatability to OWC WEC’s include the experimental study by Semenov, et al. [11] and field observations by Whitehouse, et al. [12]. Semenov, et al. [11] presented laboratory measurements of wave scour around a gravity foundation with a tapered square cross-section with cut corners. The tapered natured of the foundation limits the relatability to an OWC WEC however it is notable that scour formed at the edges of the structure and exposed the base of the foundation, washing out some of the underlying sediment. Whitehouse, et al. [12] documents scour in the field around a complex gravity structure consisting of tapered pre-cast concrete units housing a pipeline Wye-piece. Despite clear differences in the structure type compared to an OWC WEC, scour was again observed here to undermine the structure which led to settlement of approximately 1.25 m.
The closest work relating to and expanding on the corner scour observed around an OWC WEC by Lancaster, et al. [8] was a separate laboratory scale experimental study on scour around the head of a vertical wall breakwater by Sumer and Fredsøe [13], which recorded vortex formations behind the head of the vertical wall similar to those observed at the corners of an OWC WEC. Their study went on to show a dependency of the scour depth on the wave incident angle and demonstrated that an increased corner curvature radius can reduce the scour potential. Some relation can also be made between the scour in front of an OWC WEC or caisson structure and the scour in front of a vertical wall [14,15], but this comparison is limited due to (1) the underwater opening means waves are only partially reflected, and (2) in some cases such as in this study, the finite width of the OWC means that the corners likely influence the scour, and diffraction effects will be important for any partially reflected waves. There are also limitations inherent in laboratory studies, and additional potential scale effect on the sediment transport processes. This paper addresses this issue and compliments the prior laboratory experiments using field observations.
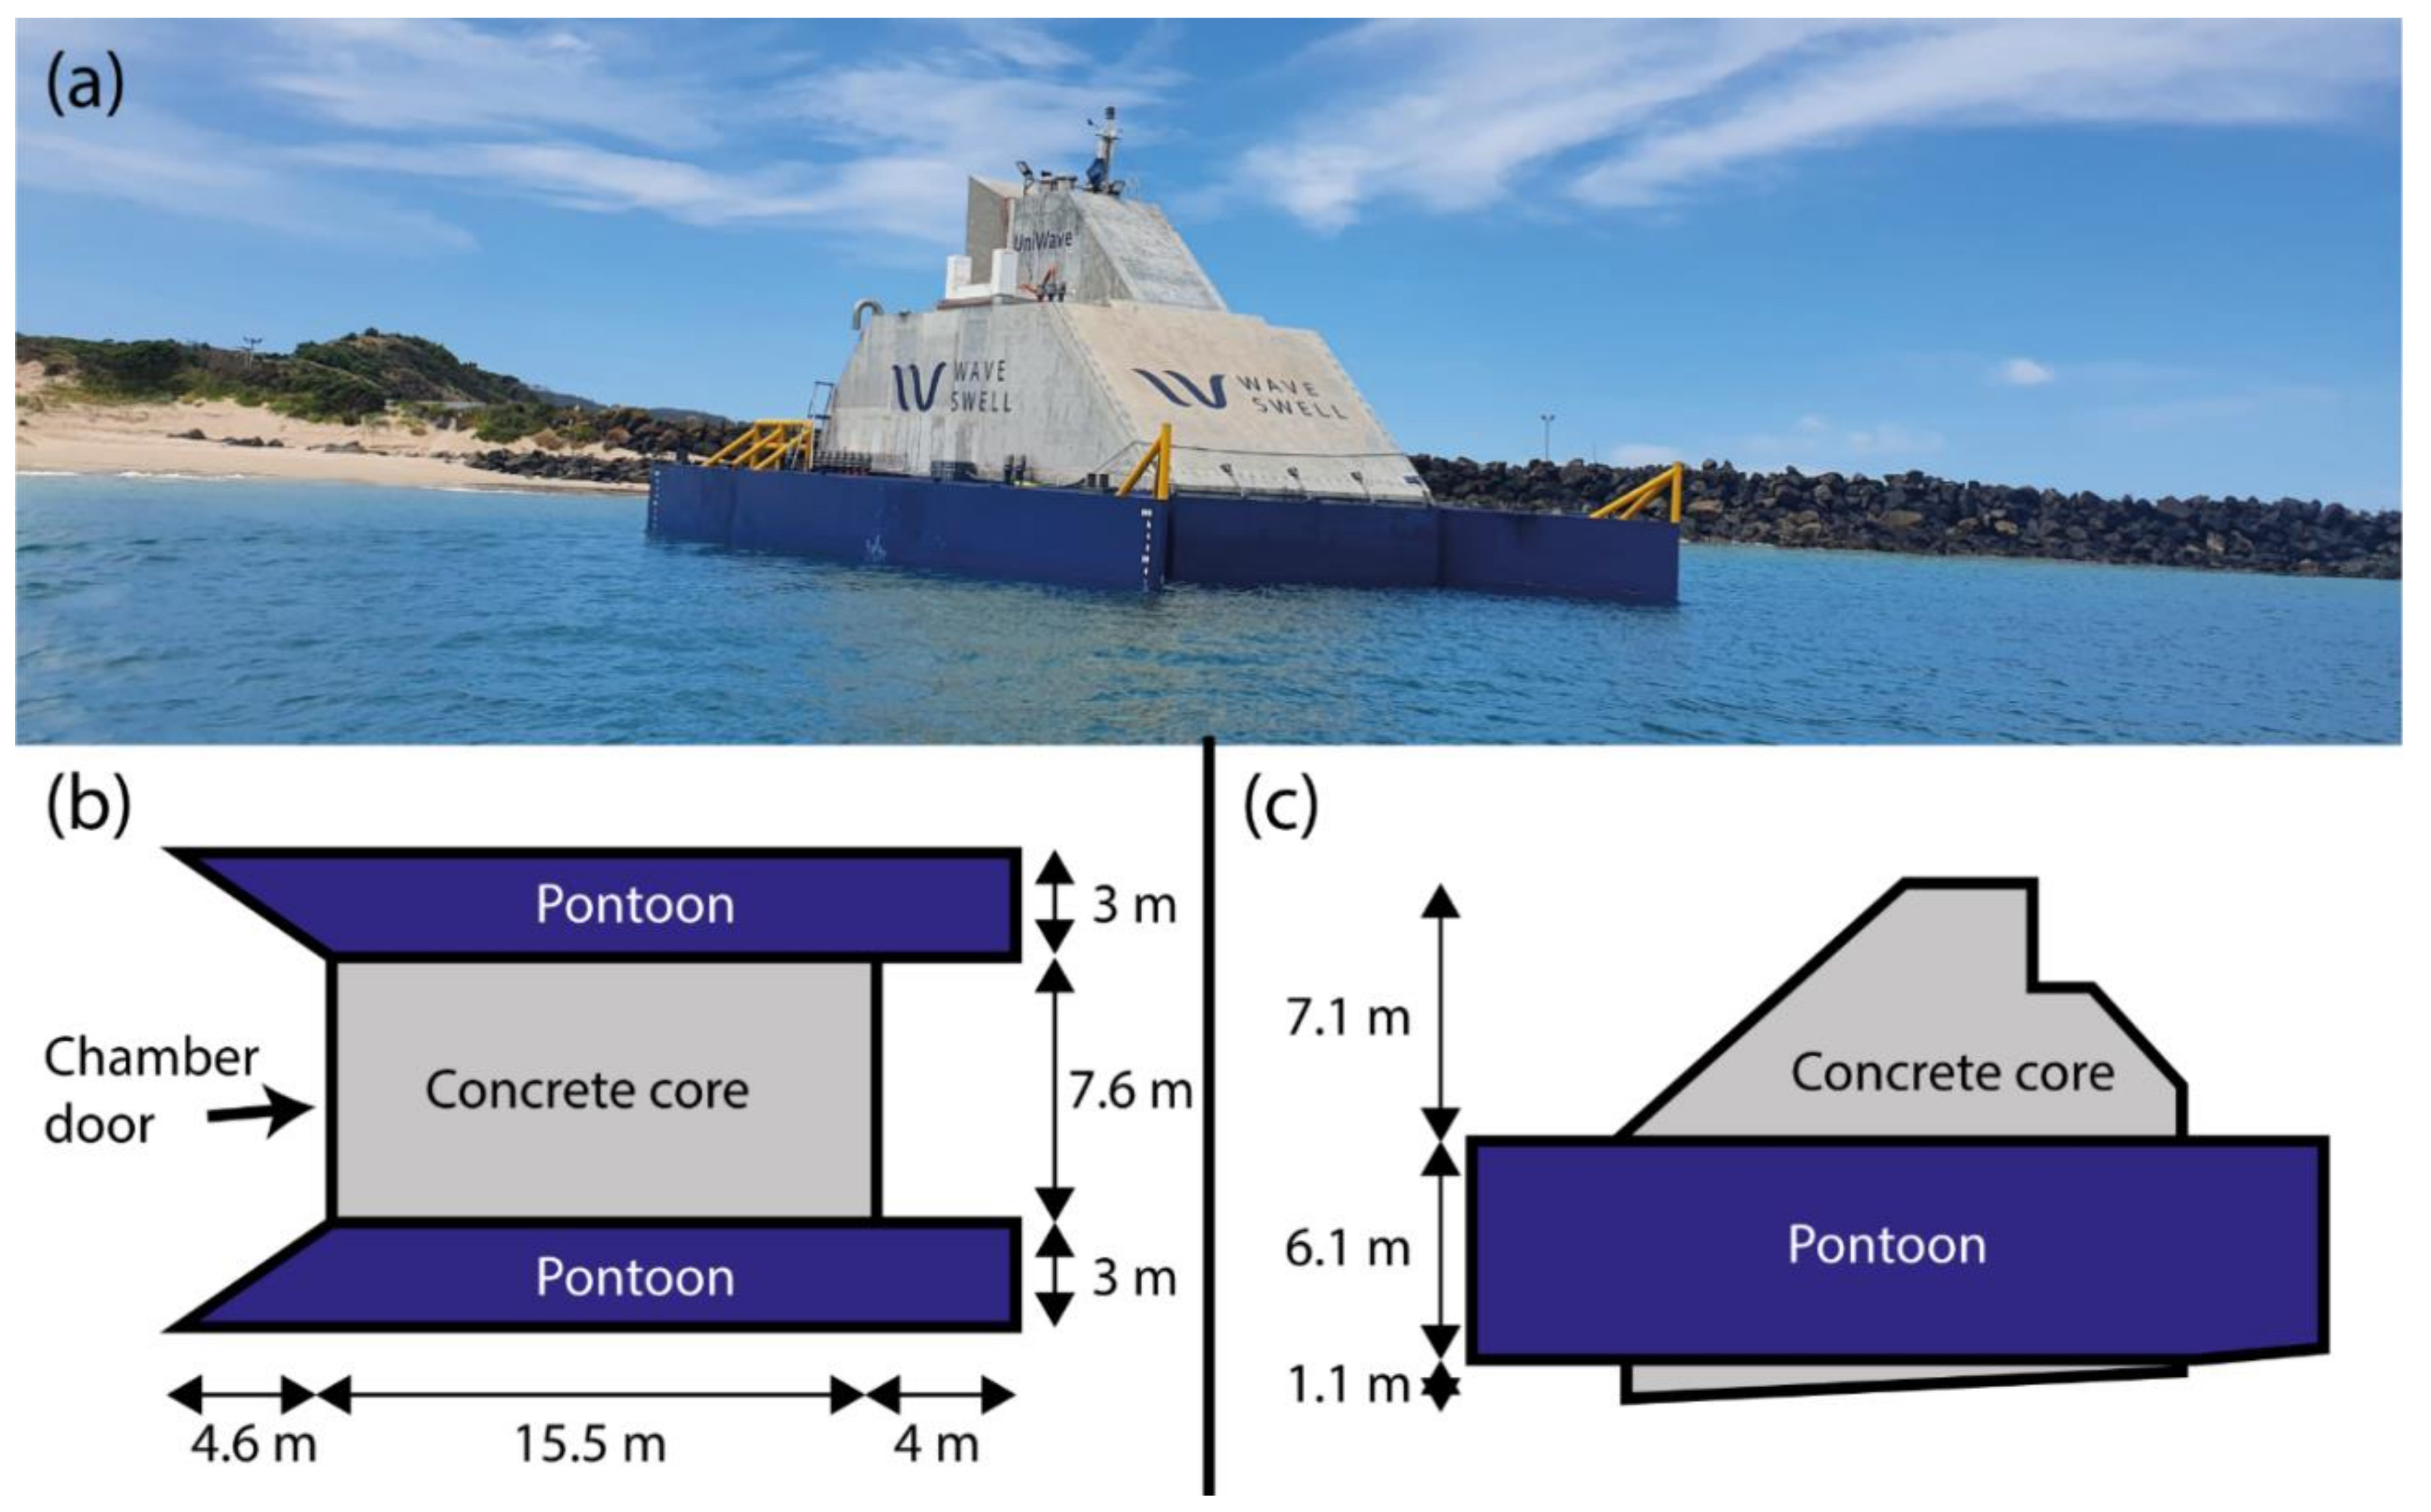
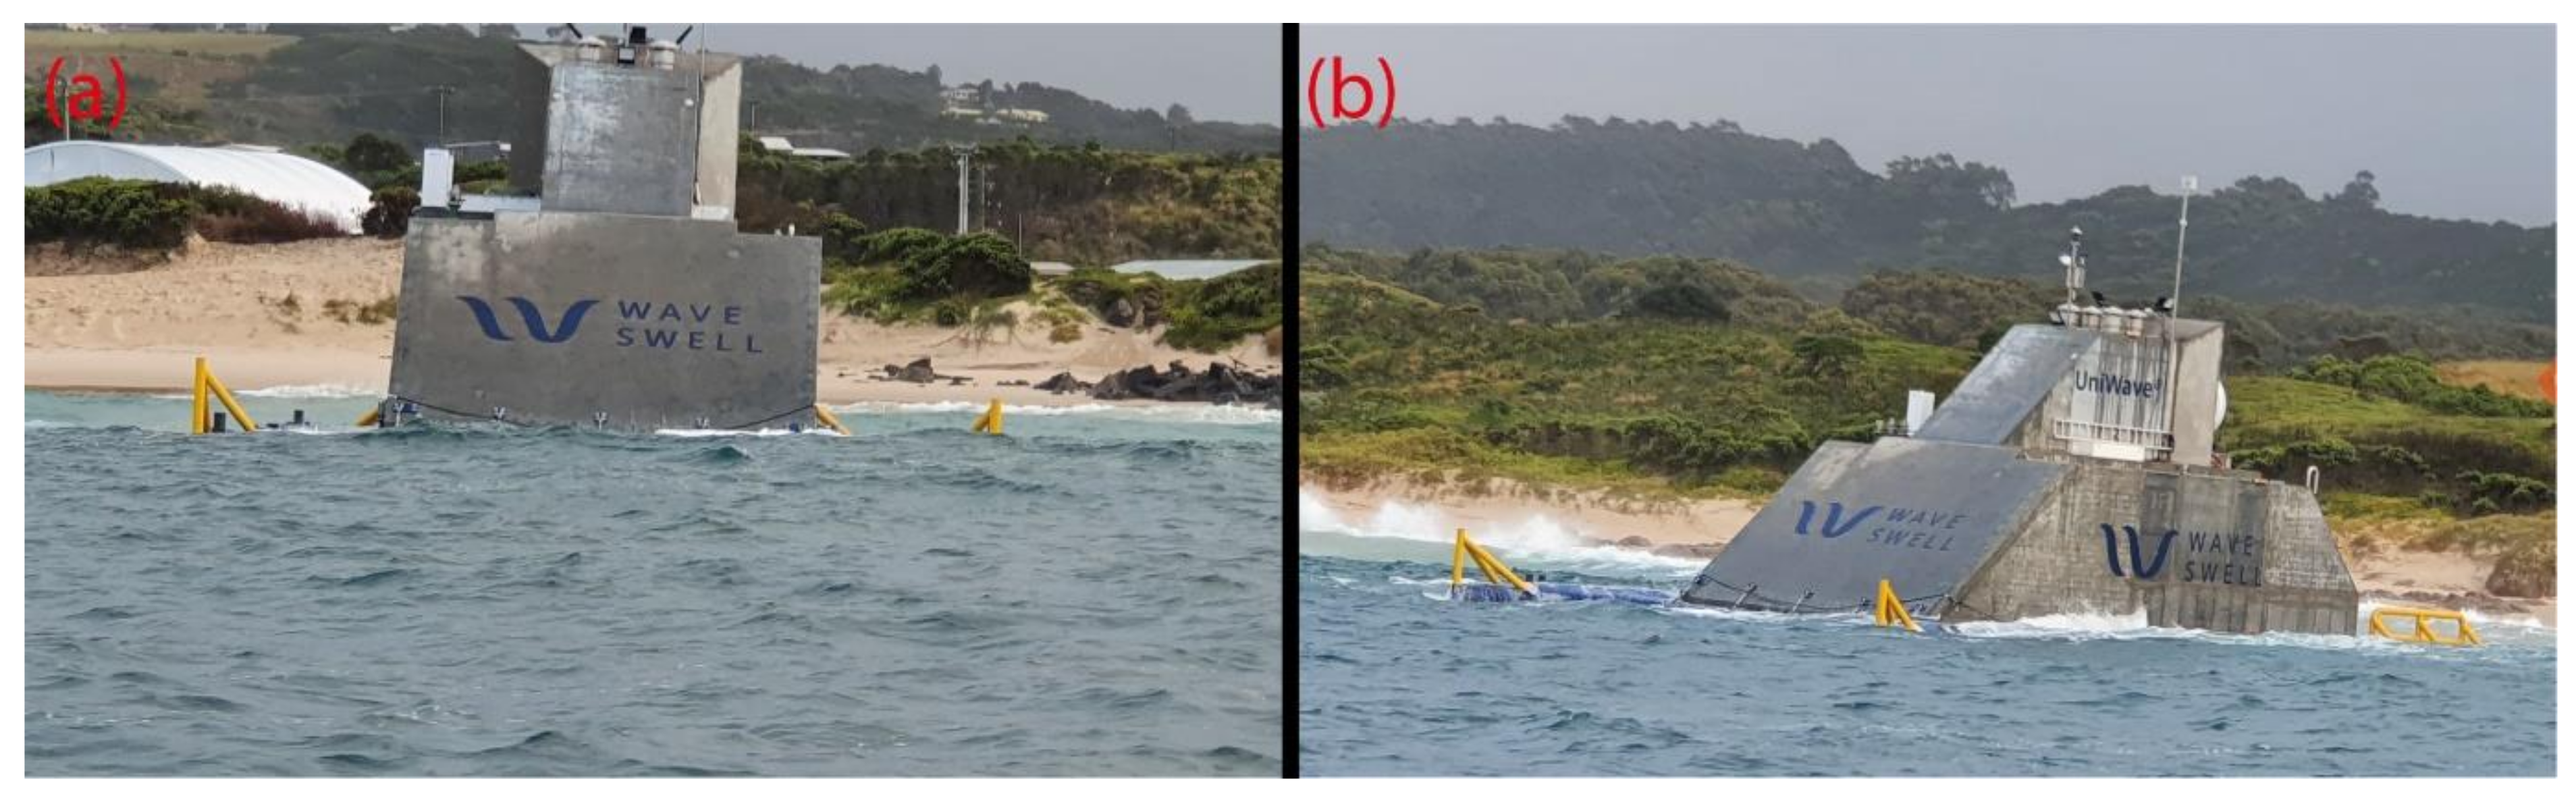
On 10 January 2021 a 200 kW prototype gravity based OWC WEC was deployed at King Island, Tasmania, Australia [16]. This deployment enabled the first ever recorded data collection of scour, morphological change and settlement around a gravity based OWC WEC. The findings will inform the future design of OWC WEC’s and other large caisson-like structures and in-turn reduce the unknowns and risks associated with the deployment of these structures, contributing to potential cost reductions in the renewable wave energy industry.
This manuscript reports on data collected during 2021 of scour, morphological change and settlement around the OWC WEC. The manuscript is structured as follows. Section 2 introduces the King Island OWC WEC prototype project in more detail and describes the measurement techniques utilized. Section 3 presents the results of the various measurements taken around the OWC WEC. Section 4 discusses the results before presenting key findings in Section 5.

2. Materials and Methods

2.1. King Island Site and Project Timeline

The 200-kW gravity based OWC WEC project at King Island has been developed by an Australian unlisted public company, Wave Swell Energy Ltd. (WSE) (Melbourne, Australia). The main purpose of the deployment was to collect data to better understand both the survivability of the structure and the energy conversion efficiency.
The deployment site was located within Grassy Harbour at King Island (Figure 1a), with a breakwater partially sheltering the structure from East or South-East swell leading to a relatively unidirectional wave climate (detailed further in Section 3.1). Two different locations (Location 1 and Location 2) of the OWC WEC are shown in Figure 1b alongside site bathymetry measured in December 2020, the rationale for the two different OWC WEC locations is described later in this section. The mean water depth at the front face of the OWC WEC core at Location 1 and Location 2 is approximately 6.1 m and 4.1 m respectively, and the bearing perpendicular to the front face of the device is 188.5 degrees and 208.5 degrees for Location 1 and Location 2 respectively, relative to North.
A previous site characterization study at the site by Cossu, et al. [7] undertook a sub-bottom profiling analysis to assess the sediment layer thickness at the project site in March 2019 which found that all areas in the survey area had a sediment layer thickness exceeding 1 m. The sediment layer had a thickness of approximately 2–3 m in the area corresponding to Location 1 in Figure 1b. Sand characteristics were also measured in the same study at the site location via dry sieve analysis of retrieved sediment cores. Analysis of this data gives a d10, d30, d50, and d60 of 0.14, 0.19, 0.23 and 0.25 mm respectively, giving a coefficient of uniformity of 1.8 and coefficient of curvature of 1.0.
The site location has a micro tidal range [17]. The relatively small tidal range means large currents are not expected in the area, however due to the relatively shallow deployments (particularly at Location 2), the tides are likely to affect sediment transport due to the different wave transformations and orbital wave velocities at the seabed, at high or low tide.
A photograph in addition to plan and side elevation schematics of the OWC WEC at King Island are shown in Figure 2, with additional details summarized in Table 1. The structure consists of a central concrete core which has an exposed underwater opening at the front (seaward) side, the underwater opening covers the full width of the concrete core and has a height of approximately 4 m. This underwater opening was initially covered by a sealed door that has a hinged connection at the bottom of the door. Note that the door was opened on 1 June 2021 and thereafter sat directly on the seabed. Two pontoon structures are also located at either side of the concrete core. These pontoon structures remained in place throughout the deployment, and their primary purpose was to facilitate the deployment of the OWC WEC. The concrete core sits directly on the sloped seabed, which means that there is some clearance between the base of the pontoon and the seabed in the as-built position.
The initial deployment at Location 1 was on 10 January 2021, and a detailed summary of key events and data collection activities is provided in Table 2. The original placement was made with no scour protection or preparation of the seabed to assess how the device would behave in those conditions. Following observations of settlement to the OWC WEC between 18–19 January 2021, a decision was made to relocate the device to a new predetermined location in a shallower water depth (Location 2), and the device was refloated and moved to Location 2 on 23 January 2021. Scour protection was installed around the OWC WEC on 6 April 2021, consisting of two layers of 2-tonne rock filled bags (Kyowa bags) (see Figure 3).

2.2. Measurement Techniques

2.2.1. Wave Measurements

Wave measurements were taken throughout the deployment at the site so that specific wave conditions can be linked to observations of scour around the OWC WEC. Measurements were made using a wave buoy developed by Sofar Ocean, referred to as the Spotter buoy henceforth. The Spotter buoy has been deployed at the site since 8 August 2019. The data fidelity of the Spotter wave buoy has been previously compared in a comparative study alongside an RD Instrument ADCP at the King Island site between 8 August–12 October 2019 by Lancaster, et al. [17], where the two instruments were found to agree on key wave parameters within 3%, illustrating the high accuracy of the Spotter buoy. The Lancaster, et al. [17] study also provides more information regarding typical frequency and directional spectrums at the project site.
The location of the wave buoy throughout the OWC WEC deployment at King Island referred to in this manuscript is given in Figure 1b, with a mean water depth of approximately 9.7 m, latitude of −40.066692° and longitude of 144.058334°. The Spotter buoy was temporarily out of the water during the installation of the OWC WEC due to the risk of interference of the wave buoy mooring lines and the OWC WEC deployment. The Spotter buoy was reinstalled on the 12 January 2021.

2.2.2. Video Footage

Above and below-water video footage was undertaken throughout the project to document hydrodynamic and morphological processes around the device.
Two video dive surveys around the OWC WEC were undertaken, firstly on 10 January 2021 approximately three hours following the initial deployment at Location 1, and secondly on 1 February 2021 when the OWC WEC was at Location 2. Further below-water footage of the sediment bed around the OWC WEC was recorded on 16 June, by attaching an Insta360 ONE X2 camera to an extension device which could be manually traversed from the top of the pontoon structures.
Drone footage was also taken around the OWC WEC to observe wave propagation and hydrodynamic processes around the OWC WEC, with video footage recorded on 22 July 2021.

2.2.3. Bedrock Survey along OWC Perimeter

A bedrock survey was undertaken around the perimeter of the OWC WEC on 11 March 2021. Air was pumped through a thin hollow pipe to displace sediment until bedrock was reached, whereby a measurement was taken to the bedrock relative to the top of the pontoon structures. Point measurements were taken at the corners of the concrete core and both pontoon structures, in addition to centrally along the outer perimeter of the pontoons and centrally at the back of the concrete core.

2.2.4. Multi-Beam Measurements

Multi-beam measurements across the whole Grassy Harbour site have been undertaken on three previous occasions, twice before the OWC WEC deployment in March 2019 and December 2020, and once after the deployment in May 2021, with a detailed timeline provided in Table 2. The measurements were undertaken using the Bathyswath-2 interferometric bathymetric system (ITER Systems).
The Bathyswath system was bow-mounted to a vessel and records the vessel pitch, roll, and heave in addition to the use of sonar to measure the seabed depth. The raw data is then processed using the Bathyswath Swath Processor for filtering and to correct for tides, the speed of sound and sensor placement, before interpolation between survey lines, data quality checks and data outputs were produced using the Bathyswath Grid Processor and QPS Feldermaus software’s. The collection of tidal data varied between different measurement campaigns. During the March 2019 campaign a pressure sensor on a Nortek Vector Acoustic Doppler Velocimeter (ADV) was used to measure the mean water level which was compared to predicted tidal levels at Grassy Harbour from the Australian Bureau of Meteorology (BOM). The December 2020 campaign calculated tidal levels from the pressure measurements of an RBR pressure logger, and the May 2021 campaign utilized the predicted BOM tidal levels at Grassy Harbour directly due to the lack of a direct tidal measurement.
Some limitations were encountered measuring the seabed at the rear of the OWC WEC in the May 2021 measurement campaign, which reduce the resolution and precision of the data recordings in that area. These limitations were due to both the shallow water encountered in this area and the increased suspended sediment concentrations in the water column.

3. Results

3.1. Wave Measurements

Figure 4 shows a time series of the spectral significant wave height (Hm0) and peak wave period (Tp), in addition to a scatter diagram of the relationship between Hm0 and the mean wave direction.
Between 12 January 2021 and 7 September 2021, the maximum and mean spectral significant wave height was 2.4 m and 0.7 m respectively. The mean peak wave period was 13.0 s and the mean wave direction was at a bearing of 186 degrees. Figure 4c shows that all but one of the largest waves (>1.5 m) recorded were from wave directions between 175 and 195 degrees, with the majority in the 180–185 degree range.
The mean wave direction of 186 degrees is well aligned (within 3 degrees) with the bearing of the OWC WEC at Location 1. There is a difference in the mean wave direction and OWC WEC bearing at Location 2 of approximately 22.5 degrees, and as such scour and sediment transport are expected to be more asymmetric.
Figure 5 shows a shorter duration time series of the Spotter wave buoy data between 12 January 2021 and 4 February 2021, to allow a more detailed inspection of the wave conditions at a similar time to when dive survey footage was collected on the 10 January and 1 February 2021, which is presented in Section 3.2.

3.2. Video Footage

3.2.1. Footage at Location 1

Scour observations from dive footage, taken on the 10 January 2021 is summarized in Figure 6, with photographs from that survey shown in Figure 7. This footage was taken approximately three hours after touch-down of the OWC WEC at Location 1, and the front door of the OWC WEC was closed throughout and before the survey.
A shallow area of scour appears to be forming around the back of the pontoon structures. This area of scour has undermined the pontoon in locations where it was previously flush with the seabed and extends approximately 9–10 m along the edges of the pontoons. Estimates for the depth of this scour at the edges of the pontoons at two locations are 200 and 250 mm, with the locations noted in Figure 6. The sediment deposition zone for this scour appears to be located directly behind the concrete core.
An additional scour trench of a relatively smaller width was present directly along the front face of the front door of the OWC WEC. This scour did not appear to undermine the OWC WEC concrete core. There was no scour observed around the front (seaward) end of the pontoon structures, and the observed clearance under the pontoons in Figure 7b is as built.
During the video survey it was possible to visually observe scour occurring at the back of the pontoon structures, even in the relatively calm (Hm0 < 1 m) wave conditions during the survey, with substantial sediment brought into suspension. This suspended sediment did at times reduce image clarity, making it difficult to accurately assess all areas, particularly at the back (landward) side of the OWC WEC.
Visual observations were made of settlement of the OWC WEC on 18 January 2021, with photographs shown in Figure 8. At the front of the OWC WEC at the time of the photographs, average settlement is estimated to be approximately 0.5–1 m by comparing photographs with the known tidal levels at that time. The settlement is slightly asymmetric, with approximately 200 mm more settlement on the Eastern side compared to the Western side. The largest wave condition (by Hm0) prior to the observation of this settlement was Hm0 = 1.6 m and Tp = 12.8 s, and all incident mean wave directions had been between 165 and 195 degrees (compared to a heading of 188.5 degrees for the OWC WEC at Location 1). Based on this settlement, the decision was made to relocate the OWC WEC to the predetermined Location 2, with the device moved on 23 January 2021.

3.2.2. Below-Water Footage at Location 2

Following movement of the OWC WEC to Location 2 on 23 January 2021, an additional dive survey was undertaken on 1 February 2021. Figure 9 shows a summary of scour and morphological change around the OWC WEC in addition to photograph locations, whilst the photographs are presented in Figure 10. Scouring was visibly occurring during the survey, and substantial suspended sediment in the water column partially obscured the video footage intermittently throughout the survey. The largest wave condition experienced by the structure between its deployment at Location 2 and this dive survey (by Hm0) was on 27 January 2021, with Hm0 = 1.6 m and Tp = 12.8 s. All mean wave directions in this period were between 201 and 165 degrees, compared to a heading of 208.5 degrees for the OWC WEC at Location 2, implying that the OWC WEC had experienced an oblique wave climate.
It was clear during the dive survey that sediment transport and/or settlement had occurred since the deployment at Location 2, and asymmetry of the seabed levels was clear around both the front and back of the device. Relatively large sand waves of varying size are visible on both sides of the pontoons (Figure 10c,d), causing the pontoons to be embedded in sediment in zones which would have had gaps between the pontoon base and seabed in their initial deployed position. These sand waves are mostly prevalent towards the back (Northern) edges of the pontoons, and slope down in the offshore (Southern) direction to expose the base of the pontoons. In areas to the side of the offshore (Southern) ends of the pontoons, relatively steep slopes can be seen which are sloping upwards away from the pontoons (Figure 10f). These different zones are annotated in Figure 9 and suggest that some settlement has occurred to the OWC WEC. Numerical estimates of the settlement or sediment elevation levels are difficult to ascertain due to the high level of suspended sediment in the water column. The best estimate of total settlement comes from viewing some above-water images from the dive survey footage, which when compared with estimated tidal levels at the time of the survey, suggest settlement at the front (Southern) and back (Northern) ends of the pontoons of approximately 2 m and 1.5 m respectively.
A steep mound of sediment was also observed in front of the (closed) front door of the OWC WEC (Figure 10e). This mound sloped steeply down towards the OWC WEC front door but did not appear to undermine the concrete core.
A scour hole can be observed at the back (North-Western) corner of the OWC WEC in Figure 10a,b, however this scour hole does not undermine the pontoon corner, suggesting that settlement and/or accretion of sediment has caused the average seabed level in this area to rise relative to the base of the pontoon corner. Based on an obscured view of an anode on the back of this pontoon during the video survey, it is estimated that the pontoon corner is embedded approximately 1–1.5 m in the sediment.
Photographs from below-water footage on 16 June 2021 at Location 2 are shown in Figure 11. This was following the installation of the scour protection on 6 April 2021 and opening of the OWC WEC door on 1 June 2021.
Figure 11a shows that sediment has infilled above the opened door (which now sits on the seabed). It is further noticeable that settlement or accretion of sediment has occurred since the initial deployment at Location 2 on 23 January 2021. The as-built gap between the pontoon base and seabed immediately next to the underwater opening should be approximately 0.8 m, however the pontoon in this area is instead embedded into the sediment. A buried anode that is not visible in the photograph suggests this embedment is at least 0.4 m, suggesting a combined settlement and sediment accretion of at least 1.2 m next to the underwater opening.
At the Northern end of the Western pontoon, the photograph in Figure 11b shows scouring and a scour hole visible at the corner (similar to Figure 10a,b). At the time of deployment, the gap under the base at the back of this pontoon should have been approximately 0 m, however using an anode visible in Figure 11b as a reference point it can be estimated the back of the pontoon is now embedded in the sediment by 2–2.5 m. This is an increased distance compared to the 1–1.5 m which was observed on 1 February 2021, suggesting additional sediment accretion or settlement has occurred between measurements.

3.2.3. Drone Footage at Location 2

Drone footage taken on 22 July 2021 (Figure 12) gives an overview of the hydrodynamic conditions around the OWC WEC. Figure 12a shows the presence of reflected waves from the Grassy Harbour breakwater, approaching the OWC WEC from an Easterly direction, which may contribute to some asymmetry in the morphology around the device. Close inspection of Figure 12b also shows the formation of vortices around the corners of the pontoons, which is likely to contribute to scour in these locations.

3.3. Bedrock Spot Survey

Spot heights from the top of the pontoon or aft (landward) deck to the bedrock were estimated on 11 March 2021, with the estimated distances between the OWC WEC base and the bedrock shown in Figure 13. The spot heights suggest that the concrete core on the Western (starboard) side of the structure is either very close to or sitting directly on the bedrock layer. The concrete core along the back (aft/landward) side of the structure also appears to be sitting approximately on the bedrock. This may suggest that initial settlement at the site stopped when the structure reached the underlying bedrock at Location 2, on or before 11 March 2021.
It should be noted that the bedrock survey highlights a highly variable bedrock layer, with its varying elevation meaning the South-Eastern (port and bow/seaward) corner of the concrete core is not sitting directly on the seabed, despite the OWC WEC being approximately level. The spot levels are also approximate and are taken slightly offset from the edges of the pontoon/concrete core, which along with steep bedrock variations explains the negative values shown adjacent to the aft (landward) deck in Figure 13.

3.4. Multi-Beam Measurements

Two bathymetric surveys undertaken prior to the OWC WEC deployment (March 2019 and December 2020) are investigated in Figure 14. The bathymetry measured in March 2019 (Figure 14a) shows a relatively shallow slope (approximately 1:20 to 1:25) leading up to the beach around the OWC WEC locations. Figure 14b shows the difference between the bathymetry measured in December 2020 and March 2019 to give an indication of the typical morphological variation experienced at the site. In most areas close to the OWC locations between the −2 mLAT and −10 mLAT contours, the change in bed level is smaller than 0.5 m.
Figure 15a shows multi-beam bathymetry measurements taken on 8 May 2021 whilst the OWC WEC is at Location 2, after the scour protection has been installed but prior to the opening of the front door of the device. Figure 15b plots the change in seabed elevation between the survey on 8 May 2021, and the previous survey on 3 December 2020.
Scour holes can be seen near the four corners, with the largest relative change in the seabed level at each corner being −0.6 m, −0.4 m, −0.7 m, and −1.3 m (clockwise from the North-West corner) respectively. There is also a zone of sediment accretion on the East side of the pontoon, with a maximum increased seabed level of approximately +1.3 m.
Further from Location 2, there are evidently other changes to the morphology. A large zone of accretion is present to the West of the original Location 1 deployment, with the accretion raising the seabed level by up to +1.5 m relative to the December 2020 survey. This accretion zone may partially be explained as the sediment that has been eroded underneath and around the OWC WEC at Location 2. An additional possible explanation is that the accretion zone is related to sediment transport that occurred whilst the OWC WEC was present at Location 1.

4. Discussion

4.1. Scour Observations Immediately after Installation

The video footage taken on 10 January 2021 at Location 1 (Section 3.2.1) shows the potential for scour to develop within three hours of the deployment of an OWC WEC (or similar gravity structure), even with relatively mild wave conditions (Hm0 < 1 m). This scour undermined the back of the pontoon structures and also caused a shallow trench along the front face of the OWC WEC.
It is likely that vortices form at the back corners of the pontoons due to the passage of waves at that location and these vortices initiate sediment motion and scour at the outer corners of the pontoons. Due to the very small embedment of the pontoons an additional process is introduced once the scour undermines the pontoon, this causes velocity streamlines to contract underneath the pontoon structures, creating an increased localized water velocity (and hence bed shear stress) which scours the underneath of the pontoons in a process similar to the tunnel erosion effect experienced under pipelines [15]. As the clearance under the pontoons increases, the flow contraction is less severe, and an equilibrium condition (for a particular sea state) is quickly reached. This process was previously predicted by Lancaster, et al. [18] when discussing scour potential at the back corner of the King Island OWC WEC. Their study had also presented numerical CFD scour results which showed scour would develop at the corners of a large sharp-edged caisson-like structure. This corner scour had also been previously measured experimentally at the corners of a model OWC WEC by Lancaster, et al. [8] separately. Their experimental study mostly utilized a large embedment depth that prevented undermining of the structure, however one test case was reported where the model sat directly on the seabed, and in this case, scour was observed to undermine and washout sediment from beneath the structure, similar to what is now being observed for the King Island OWC WEC device.
It is important to consider this initial scour in future designs of OWC WEC’s or large gravity structures. Due to the near-immediate onset of the scour, without previous preparation of the seabed it is likely that scouring will have already commenced prior to the installation of any scour protection, and this should be considered at the design stage.

4.2. Scour and Settlement Observations

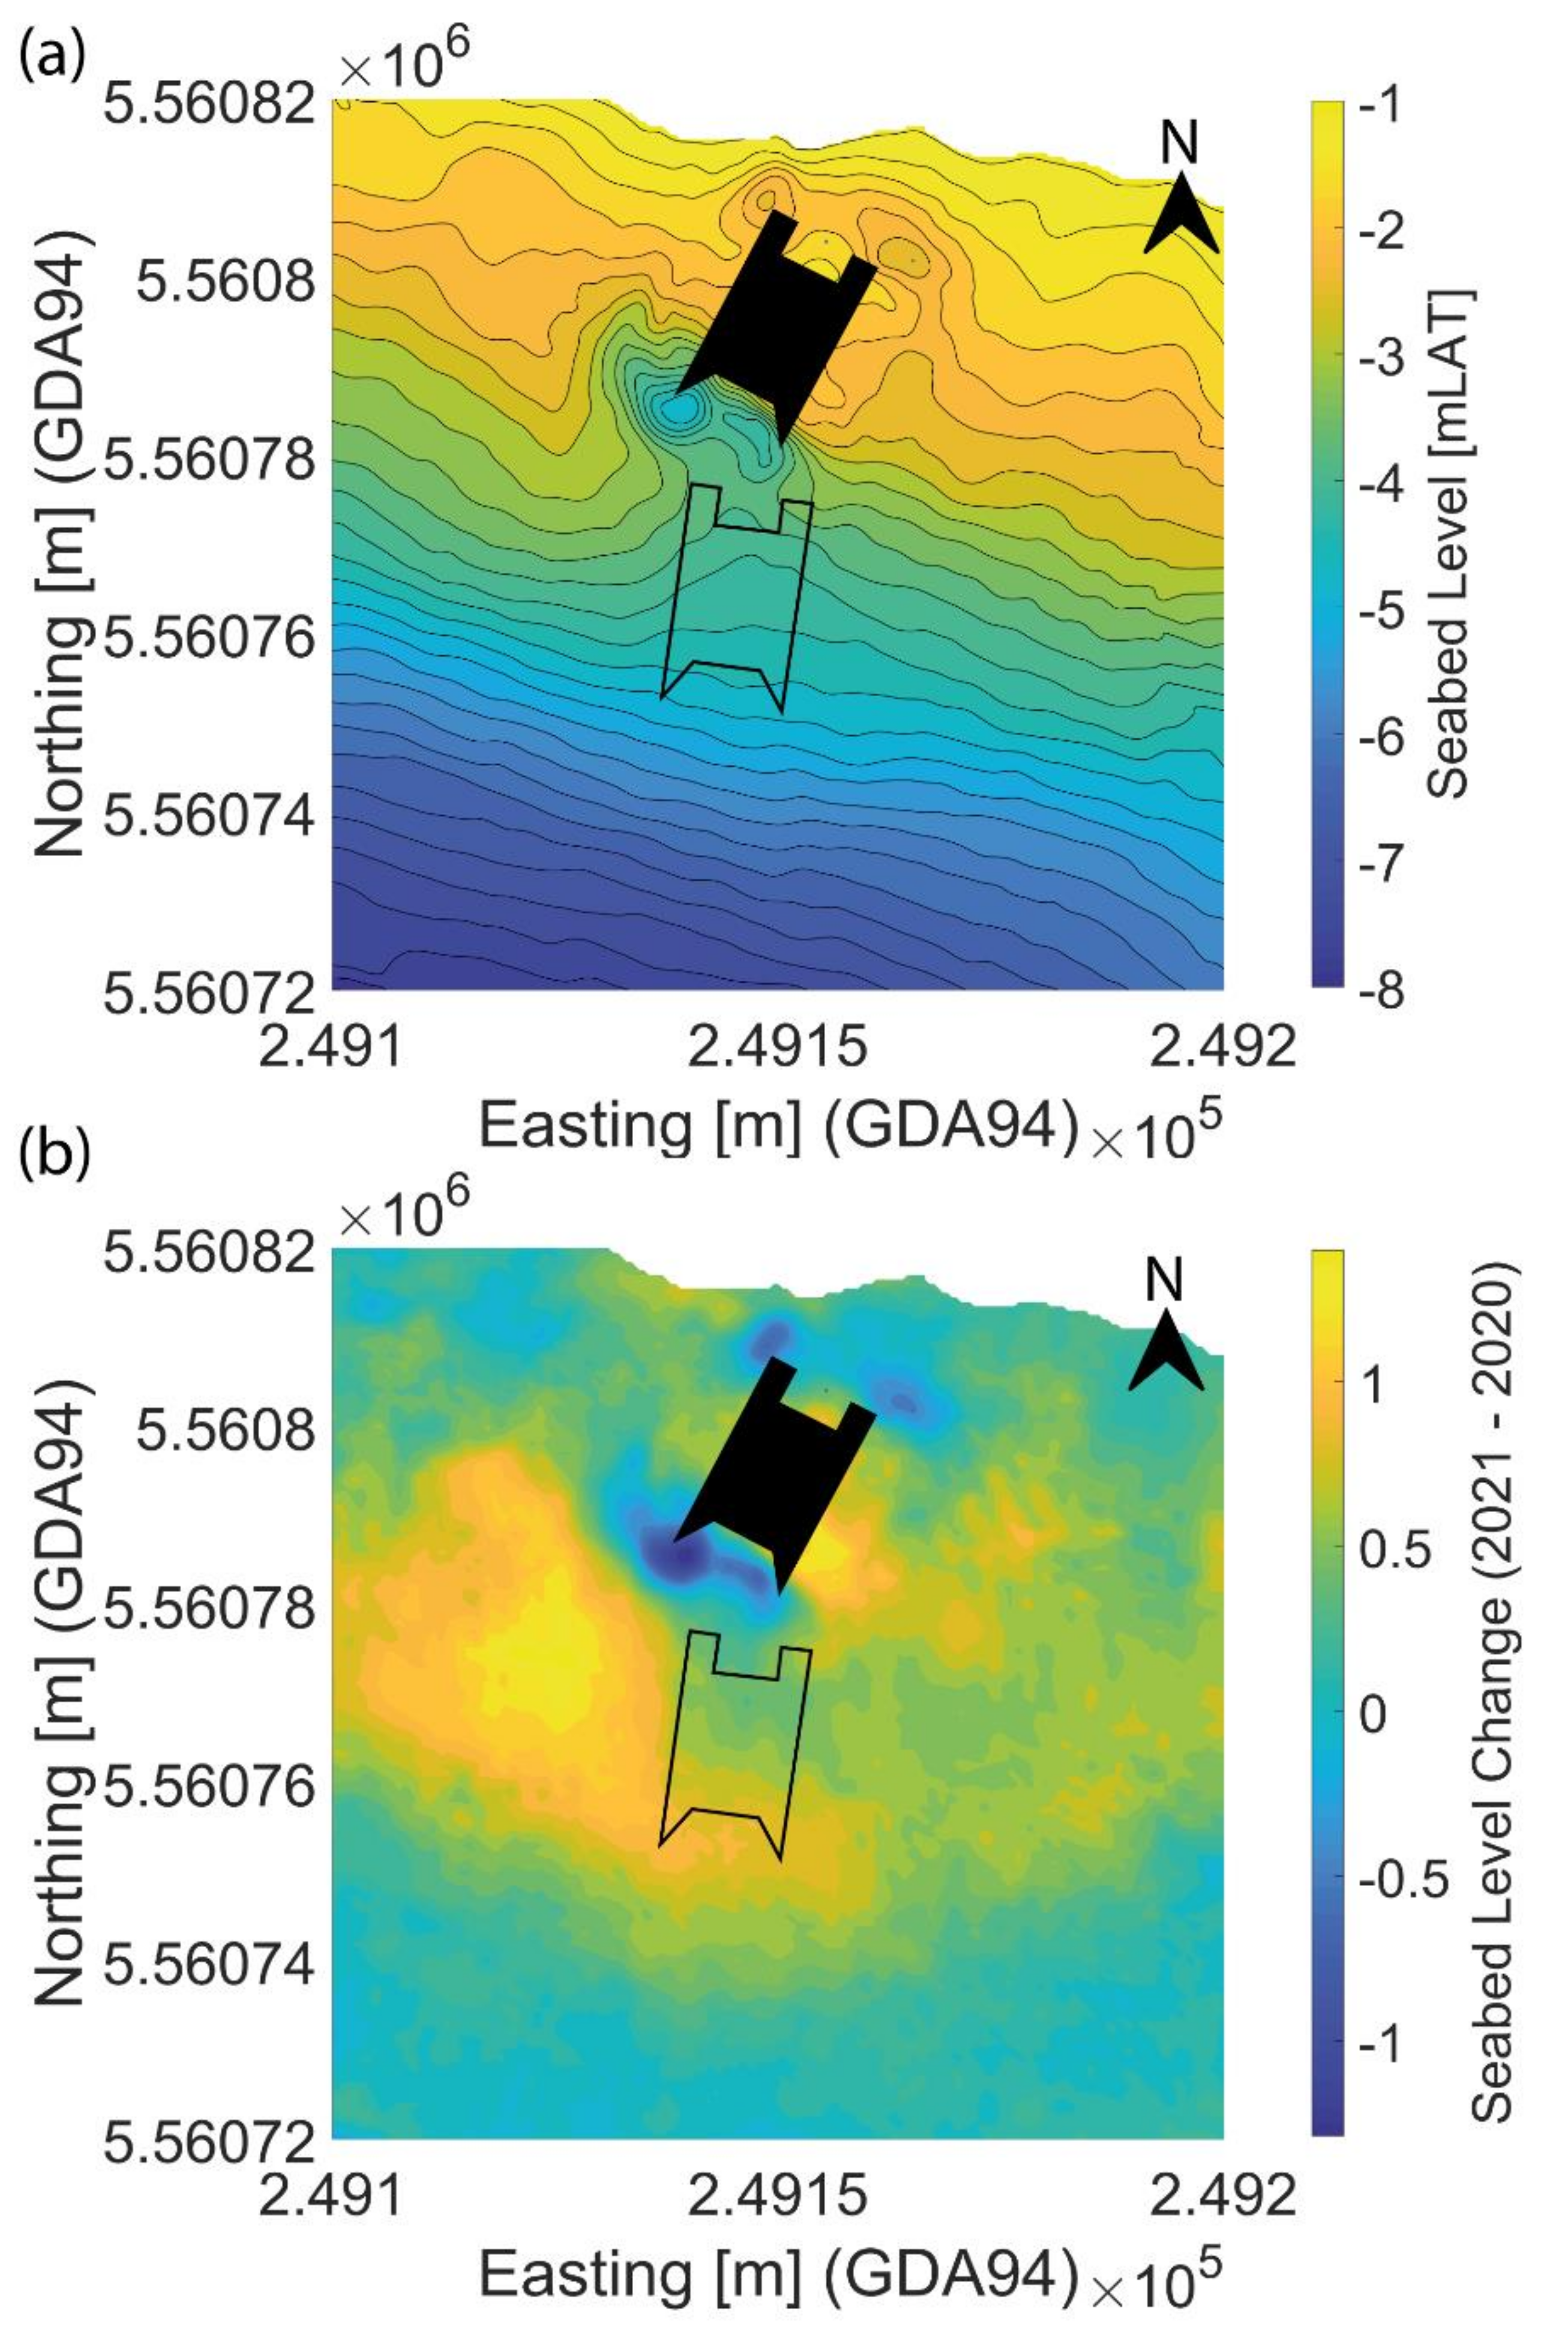
Settlement of the OWC WEC at Location 1 was first documented on 18 January 2021 (Figure 8) with approximate total settlement estimates of 0.5–1 m following wave conditions of up to Hm0 = 1.6 m. This led to the device being relocated on 23 January 2021 to Location 2. Dive survey footage on 1 February 2021 (Figure 9 and Figure 10) in addition to a bedrock survey on 11 March 2021 suggested a similar settlement event had occurred again. Inspection of the mean water level during the dive survey footage on the 1 February 2021 suggested a total settlement of approximately 1.5–2 m at Location 2. The largest wave condition experienced by the OWC WEC between its deployment at Location 2 and the two aforementioned surveys was Hm0 = 1.6 m on 27 January 2021.
The occurrence of settlement of the OWC WEC at two different locations with two different mean water depths highlights the repeatability of this risk and importance of understanding its causation and possible mitigations. The exact reasoning for this settlement event is not definitively known, but an informed discussion can suggest a potential hypothesis. The vortices that form at the corners of the OWC WEC due to the wave motion begin a scouring process that undermines the pontoon bases and progresses into a ‘tunnel scour’ process that continues to scour underneath the pontoons due to the converged flow underneath the pontoon. For a similar sized OWC WEC without pontoon structures, Lancaster, et al. [8] showed experimentally for one wave condition only that this scour can undermine 25% of the foundation base. It therefore could follow that if this scour extends under the concrete core and undermines a significant proportion of the foundation, this reduction in the effective foundation size could lead to settlement of the OWC WEC, as observed in this study. A similar event (settlement caused by scour undermining the structure foundation) for a different tapered gravity structure was also observed by Whitehouse, et al. [12] in marine conditions, who recorded overall settlement of approximately 1.25 m. Semenov, et al. [11] also showed experimentally scour undermining a square cross-sectioned tapered foundation when subject to waves. The Whitehouse, et al. [12] and Semenov, et al. [11] studies differ from the King Island OWC WEC as their tapered foundations likely prevented the development of high magnitude vortices at the corners, but they highlight the ability of scour to undermine gravity foundations, and the possibility that this may lead to settlement.
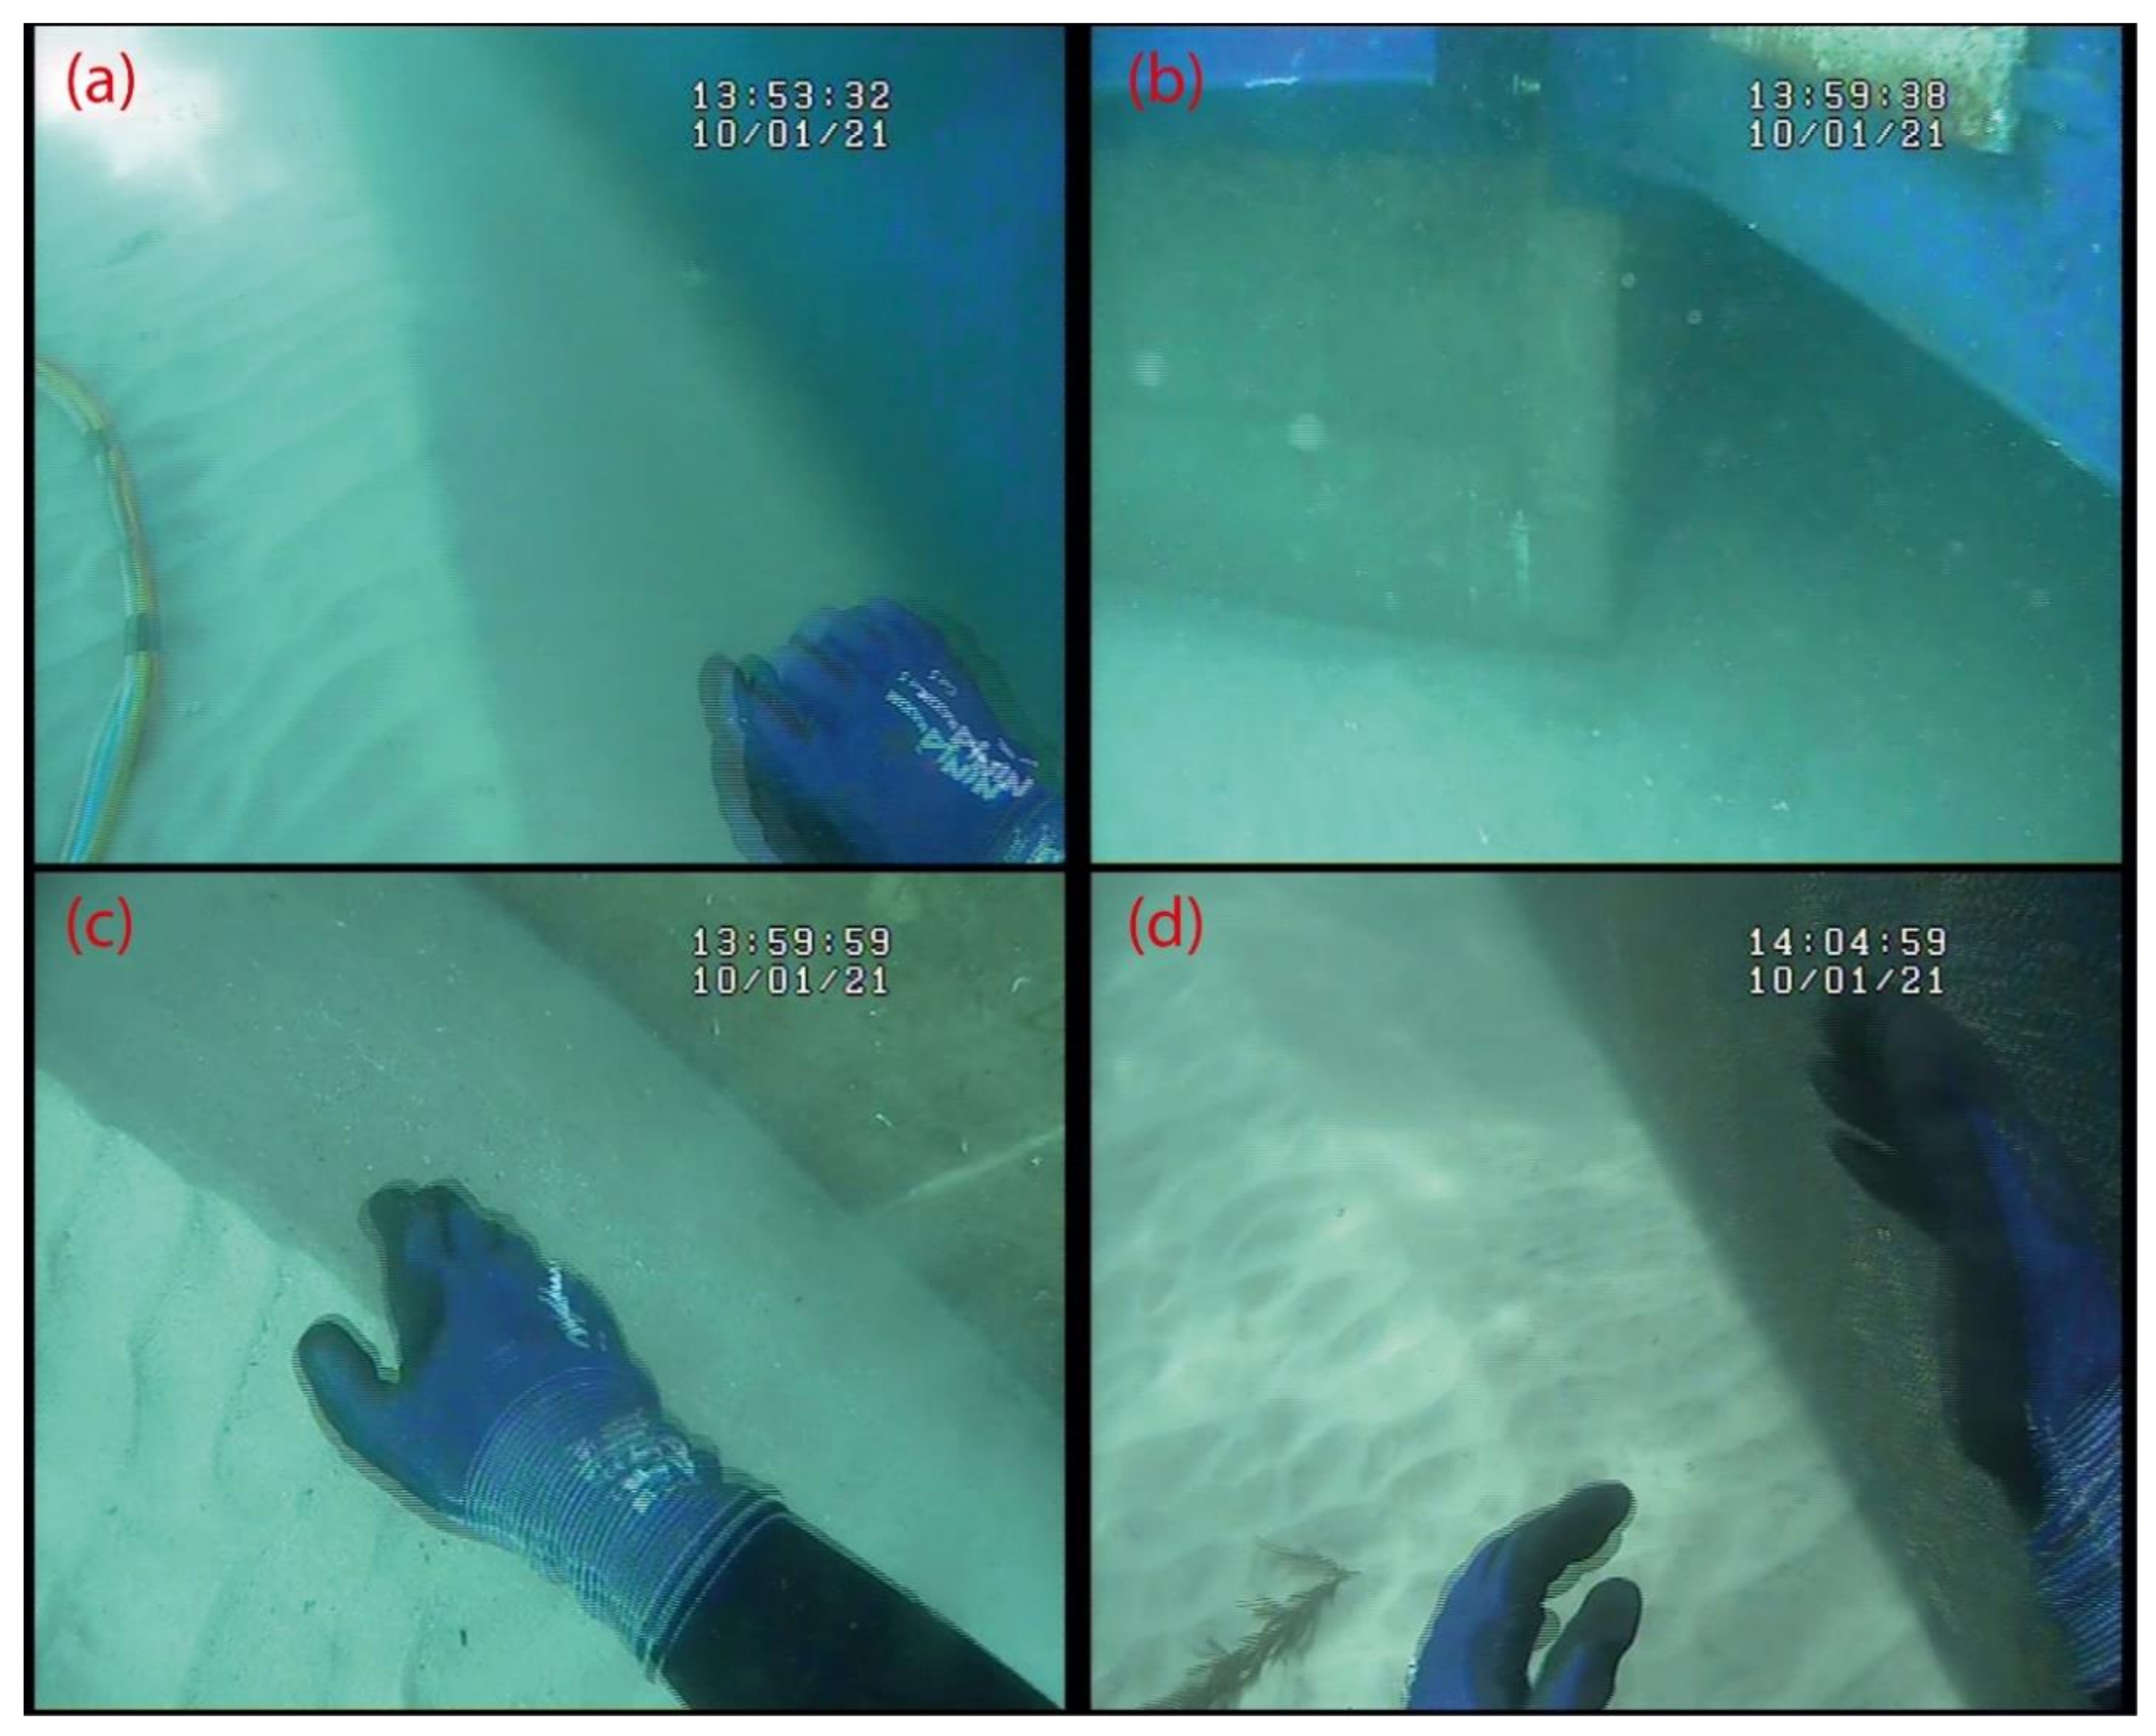
The settlement of the structure leads to the embedment of some areas of the pontoon structures which were previously based on or above the seabed. This is evident in the underwater photographs shown from 1 February 2021 (Figure 10) and 16 June 2021 (Figure 11). Photographs from those two surveys still show scour holes forming at the back corners of the pontoons (Figure 10a,b and Figure 11b). These scour holes form due to the vortex formation at the corners that has been previously mentioned, but no longer undermine the pontoon structures due to the pontoon’s embedment in the sediment.
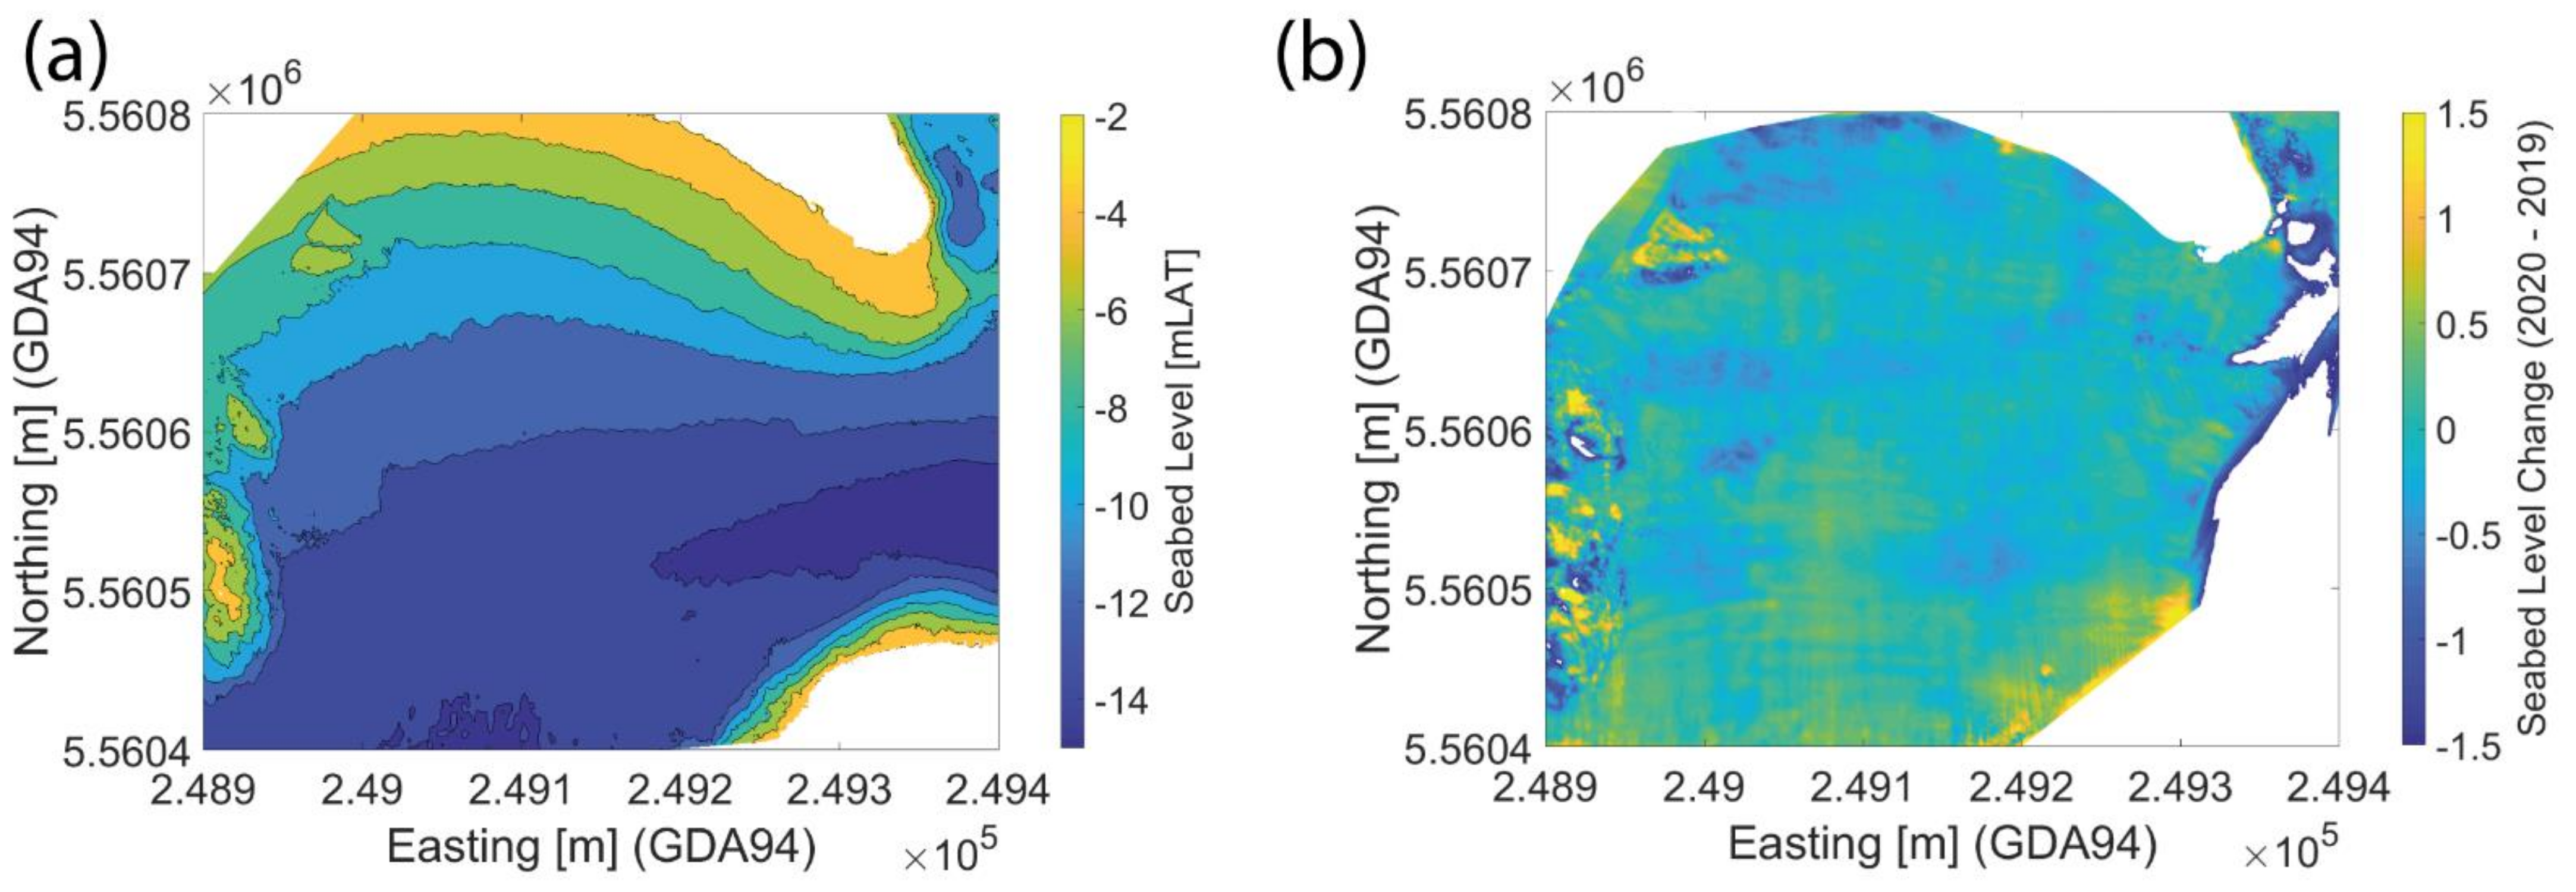
In addition to the morphological change induced from local scour effects and the device settlement, larger scale changes to the morphology are evident in Figure 15, with large sediment deposition zones visible both to the East and West of the OWC WEC, most substantially to the South-West of Location 2. Whilst this may in part be due to the accretion of sediment that was previously located underneath the OWC WEC, it is also likely in part due to the structure influencing the natural shoreline evolution at Grassy Harbour. The structure acts like a portion of a groyne structure, reducing longshore transport in its vicinity.

4.3. Influence of Scour Protection and Door Opening

The bedrock survey undertaken on 11 March 2021 suggested that due to settlement, the base of the concrete core of the OWC WEC at three corners was either very close to or sitting directly on the underlying bedrock. This likely prevented the development of further settlement, and it is unknown how much further settlement would have progressed if the bedrock was located deeper.
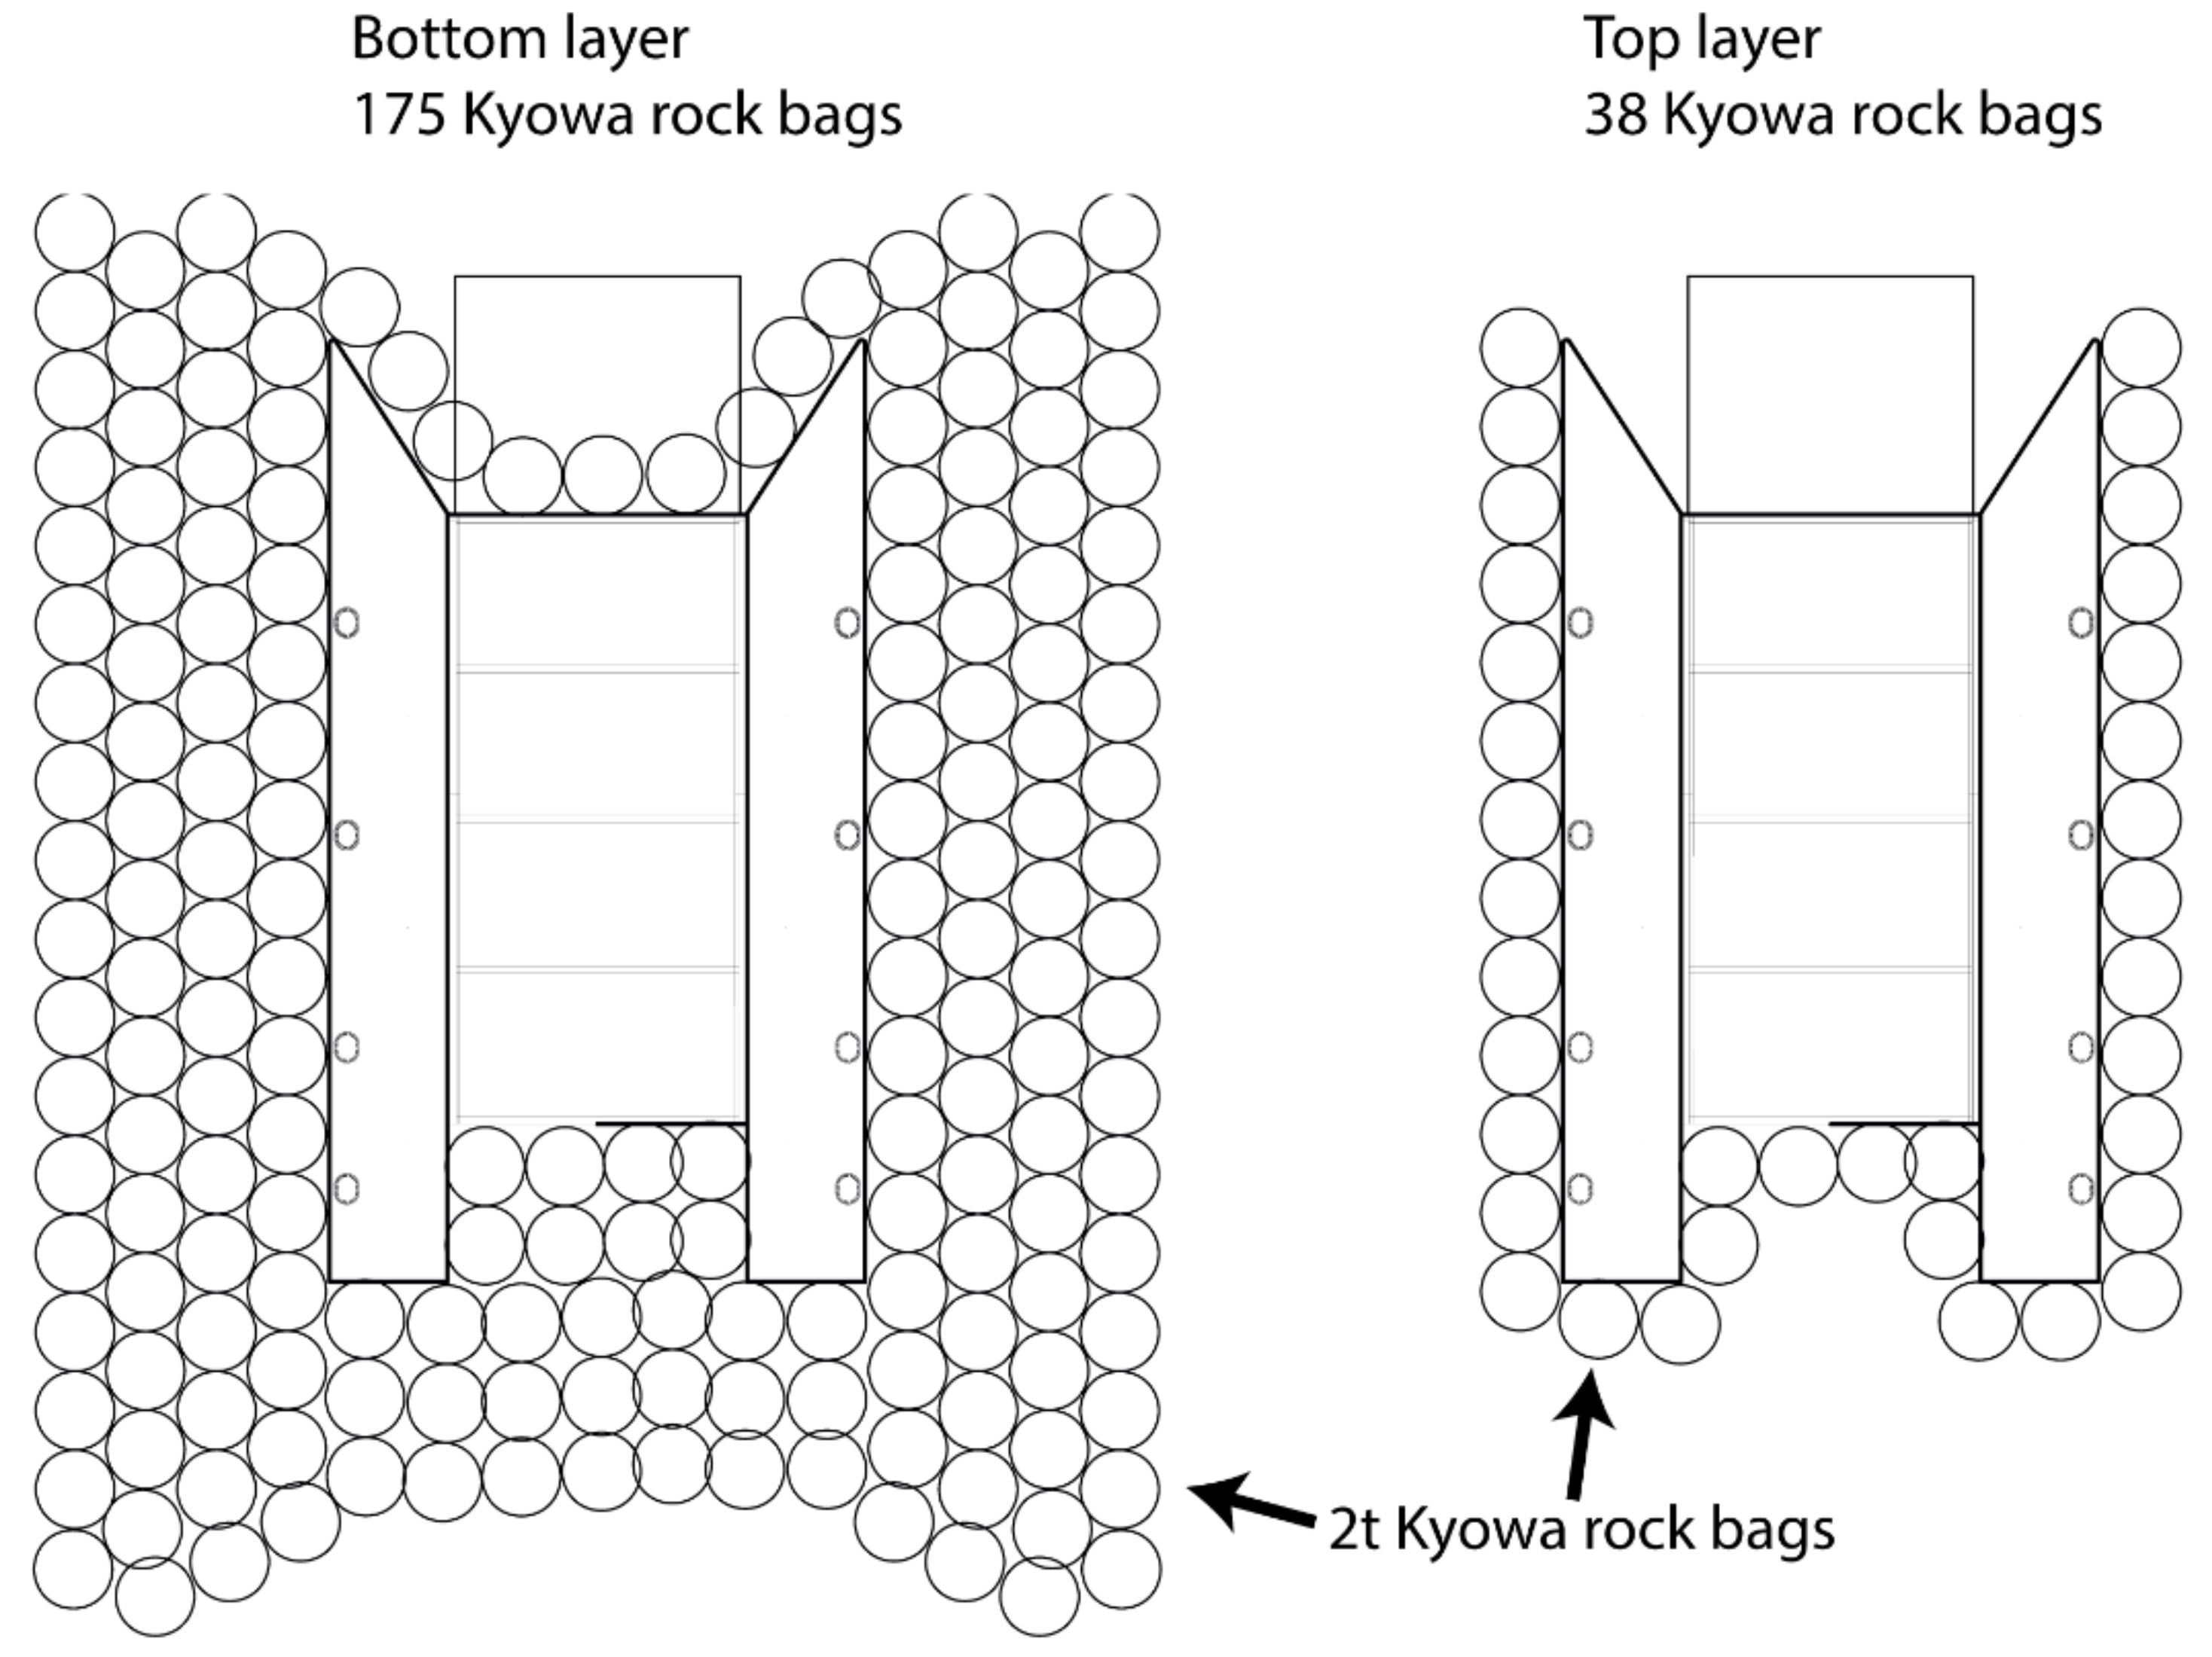
The scour protection (Figure 3) installed on 6 April 2021 is therefore unlikely to have contributed to the reduction of further settlement activity, however it is reasonable to assess that it could have reduced the settlement potential if it was installed immediately after the OWC WEC deployment at Location 2 on 23 January 2021. Inspection of under-water video footage taken on 16 June 2021 did not appear to show any obvious displacement of the rock bags placed on the side of the OWC WEC, however the rock bags at the back of the device appeared to have been buried due to sediment accretion in the area. If the scour protection had been placed before the onset of scour undermining the structure, it may have been possible to prevent the scour mechanism which is hypothesized to have caused the settlement.
As scour effects first appear around the outer corners and at the front face of the OWC WEC, it is likely in these areas where scour protection or mitigation measures can be implemented with maximum effect. For instance, curving the back corners of the structure to reduce flow separation effects would likely reduce the magnitude of vortex formations, and this coupled with either localized scour mattresses at the corners or an increased localized skirting depth to prevent the scour undermining the structure may largely reduce the scour risks in that area.
Scour and settlement protection measures for gravity based structures have been previously investigated by Whitehouse, et al. [12]. Their study observed undermining scour and settlement of a gravity structure which consisted of a pipeline segment covered by pre-cast concrete units (approximate footprint of 18 × 14 m). A numerical model was developed to investigate a possible scour protection method which involved in-filling the existing scour holes with gravel, pre-laying scour mattresses beneath the gravity structure, and the addition of flexible concrete fronded mattresses around the sides of the structure. It was suggested by the numerical modelling that this would eliminate the risk of scour undermining the structure foundations. It is important to consider that any scour protection solution should also consider the risk that the scour protection itself will induce scour behavior, such as edge scour around the edges of protection layers [19].
The opening of the front door of the OWC WEC would likely have had a significant effect on scour potential at the front of the OWC WEC, if scour protection had not already been placed and settlement not already occurred. The front door of the OWC WEC is hinged at the bottom of the underwater opening and therefore once open, lies directly on the seabed, which effectively creates a form of scour protection in that area. Footage taken after the opening of the door (Figure 11) shows that the part of the door closest to the underwater opening is partially buried in sediment, with the outer edge of the opened door exposed, and no additional scour since the opening of the door is visible. If this door had been opened at an earlier stage soon after the initial deployment, it is possible that the door could have been utilized as a form of scour protection, reducing scour risks at the front of the OWC WEC. Current observations do not show substantial accretion of sediment inside the OWC WEC chamber, which may suggest that the outflow is sufficient to flush out any sediment build-up, however it is not conclusive if this will always be the case for different wave and sediment conditions.

4.4. Impact of Scour and Settlement on OWC WEC Performance

Scour and settlement around an OWC WEC have the potential to threaten the stability of the structure, particularly if the settlement is asymmetrical or scour has reduced the foundation area in direct contact with the underlying sediment. However, it should be noted that even if the structure remains stable, scour and settlement can lead to inefficiencies and reduce the energy absorption ability of the device.
At the design stage an OWC WEC will be tuned to a specific range of water levels to maximize the energy extraction possible from the local wave climate, with the geometrical dimensions of the underwater chamber and turbine unit being modified depending on the expected water level and internal pressure fluctuations. If settlement is experienced by an OWC WEC it will change the relative distance between the still water level and top of the underwater chamber, which will in turn reduce the energy extraction efficiency of the device.
Further reductions in energy extraction efficiency could result from large scour holes or accretion zones in front of the underwater opening. These sharp changes in the morphology will induce turbulence and energy dissipation in the incident waves, reducing the potential energy available to be extracted by the OWC WEC.

4.5. Scour Monitoring Methods

Dive footage and multi-beam bathymetry were the primary means of data collection in this study to record the occurrence of scour and settlement. These methods allowed good documentation of scour patterns, settlement development and broader morphological response, however they suffer from some limitations.
This study utilized multiple dive surveys and multi-beam surveys which may not always be possible for other sites, particularly when there are budget constraints or when the site of interest is located further offshore or in a difficult to reach area. Further, determination of the time-evolution of scour is difficult due to the discrete time intervals of the measurements, and both methods could only be undertaken in relatively calm wave conditions which introduces some bias to the measurements, whereby scour holes may have partially filled up between a storm event and measurement period. For future studies, autonomous scour monitoring (such as the utilization of autonomous vehicles) or continuous scour monitoring (such as acoustic instruments that measure the evolution of the seabed with time at discrete points) could be utilized for a simpler and more comprehensive scour monitoring campaign, but these must consider the inherent challenges faced by instrumentation in the marine environment.

5. Conclusions

This study provides the first ever published measurements of scour and morphological change around an OWC WEC device at a real-world site. The findings presented are intended to inform the development of future designs of OWC WEC’s to mitigate scour and settlement risks at minimal cost. Different projects will be sited in different geotechnical conditions and will likely have a range of different OWC WEC geometries that will influence the specific scour/settlement behavior for different projects, but an understanding of the key underlying principles leading to scour and settlement can nevertheless lead to cost-efficient designs to reduce the risk.
Scour effects first appear around the outer corners of the structure and also at the front face of the OWC WEC facing the incoming incident waves. This can lead to scour undermining the corners of the structure, which can in turn lead to settlement of the device. This study has shown settlement of approximately 0.5–1 m, and 1.5–2 m of a gravity-based OWC WEC at two different water depths at the project site. These observations highlight the importance of investigating cost-effective scour protection methods for OWC WEC’s.
The results have implications for other sharp-edged gravity-based structures and future OWC WEC’s of differing geometries. Where sharp edges are present on gravity structures, vortices will form at those corners and induce scour if appropriate scour protections have not been placed. If possible, it is recommended that future structures with sharp corners are modified to round or taper the corners, to reduce the development of vortices. The results here also underly the importance of preventing scour from undermining any gravity-based foundation, as it has been demonstrated that this undermining scour can propagate and eventually lead to settlement of the structure. Seabed preparation and scour protection must be considered for future gravity-based structures if it is assessed that scour could undermine the structure.
As the findings of this manuscript show, where an OWC WEC or sharp-edged gravity-based structure is deployed over a finite sediment layer, monitoring of scour and settlement is critical to ensure appropriate interventions can be made if necessary.

Author Contributions

Conceptualization, O.L., R.C. and S.H.; methodology, O.L., R.C. and S.H.; software, O.L. and C.H.; validation, O.L. and C.H.; formal analysis, O.L. and C.H.; investigation, R.C., C.H. and S.H.; resources, R.C. and S.H.; data curation, O.L. and C.H.; writing—original draft preparation, O.L.; writing—review and editing, O.L., R.C. and T.E.B.; visualization, O.L.; supervision, R.C.; project administration, R.C. and S.H.; funding acquisition, R.C. and S.H. All authors have read and agreed to the published version of the manuscript.

Funding

This research was funded by Wave Swell Energy Ltd., with resources coming from the Australian Renewable Energy Agency (ARENA).

Data Availability Statement

The data presented in this study are available on request from the corresponding author.

Conflicts of Interest

Scott Hunter (S.H) is employed by Wave Swell Energy Ltd., who funded the deployment of OWC WEC discussed in this manuscript.

References

  1. Falcão, A.F.O.; Henriques, J.C.C. Oscillating-water-column wave energy converters and air turbines: A review. Renew. Energy 2016, 85, 1391–1424. [Google Scholar] [CrossRef]
  2. Fleming, A.; MacFarlane, G.; Hunter, S.; Denniss, T. Power performance prediction for a vented OWC WEC with a unidirectional air turbine power take off. In Proceedings of the 12th European Wave and Tidal Energy Conference, Cork, Ireland, 27 August–1 September 2017. [Google Scholar]
  3. ARENA. UniWave200 King Island Project-Wave Swell. Available online: https://arena.gov.au/projects/uniwave200-king-island-project-waves-well/ (accessed on 7 November 2019).
  4. Ferguson, T.M.; Penesis, I.; Macfarlane, G.; Fleming, A. A PIV investigation of OWC operation in regular, polychromatic and irregular waves. Renew. Energy 2017, 103, 143–155. [Google Scholar] [CrossRef]
  5. López, I.; Castro, A.; Iglesias, G. Hydrodynamic performance of an oscillating water column wave energy converter by means of particle imaging velocimetry. Energy 2015, 83, 89–103. [Google Scholar] [CrossRef]
  6. Cossu, R.; Heatherington, C.; Grinham, A.; Penesis, I.; Hunter, S. A seabed survey off King Island for a Wave Energy Company to support a potential wave energy project. In Proceedings of the 4th Asian Wave and Tidal Energy Conference, Taipei, Taiwan, 9–13 September 2018. [Google Scholar]
  7. Cossu, R.; Heatherington, C.; Penesis, I.; Beecroft, R.; Hunter, S. Seafloor Site Characterization for a Remote Island OWC Device Near King Island, Tasmania, Australia. J. Mar. Sci. Eng. 2020, 8, 194. [Google Scholar] [CrossRef] [Green Version]
  8. Lancaster, O.; Cossu, R.; Baldock, T.E. Experimental investigation into 3D scour processes around a gravity based Oscillating Water Column Wave Energy Converter. Coast. Eng. 2020, 161, 103754. [Google Scholar] [CrossRef]
  9. Sumer, B.M.; Fredsøe, J. Wave Scour around a Large Vertical Circular Cylinder. J. Waterw. Port Coast. Ocean Eng. 2001, 127, 125–134. [Google Scholar] [CrossRef]
  10. Bolle, A.; Haerens, P.; Trouw, K.; Smits, J. Scour around gravity-based wind turbine foundations-prototype measurements. Coasts, marine structures and breakwaters: Adapting to change. In Proceedings of the 9th International Conference Organised by the Institution of Civil Engineers, Edinburgh, UK, 16–18 September 2009; 2010; pp. 103–114. [Google Scholar]
  11. Semenov, K.K.; Lebedev, V.V.; Nudner, I.S.; Geidarov, N.A.; Ivanov, K.S.; Zakharov, Y.N.; Belyaev, N.D.; Mishina, A.V.; Schemelinin, L.G. Impact of Waves and Currents on the Soil Near Gravity-Type Offshore Platform Foundation: Numerical and Experimental Studies. In Proceedings of the Twenty-Fifth International Ocean and Polar Engineering Conference, Kona, HI, USA, 27 July 2015; p. 8. [Google Scholar]
  12. Whitehouse, R.; Lam, C.; Richardson, S.; Keel, P. Evaluation of seabed stability and scour control around subsea gravity protection structures. In Proceedings of the 29th International Conference on Ocean, Offshore and Arctic Engineering, Shanghai, China, 6–11 June 2010. [Google Scholar]
  13. Sumer, B.M.; Fredsøe, J. Scour at the head of a vertical-wall breakwater. Coast. Eng. 1997, 29, 201–230. [Google Scholar] [CrossRef]
  14. Xie, S.L. Scouring Patterns in Front of Vertical Breakwaters and Their Influence on the Stability of the Foundations of the Breakwaters; Department of Civil Engineering, Delft University of Technology: Delft, The Netherlands, 1981; p. 61. [Google Scholar]
  15. Sumer, B.M.; Fredsøe, J. The Mechanics of Scour in the Marine Environment; World Scientific: Singapore, 2002; Volume 17. [Google Scholar]
  16. Wave Swell Energy. Wave Swell Energy’s UniWave200 Is Installed at King Island. Available online: https://www.waveswell.com/king-island/wave-swell-energys-uniwave200-is-installed-at-king-island/ (accessed on 20 January 2021).
  17. Lancaster, O.; Cossu, R.; Boulay, S.; Hunter, S.; Baldock, T.E. Comparative wave measurements at a wave energy site with a recently developed low-cost wave buoy (Spotter), ADCP and pressure loggers. J. Atmos. Ocean. Technol. 2021, 38, 1019–1033. [Google Scholar] [CrossRef]
  18. Lancaster, O.; Cossu, R.; Hunter, S.; Baldock, T.E. Scour prediction around an Oscillating Water Column Wave Energy Converter. In Proceedings of the 14th European Wave and Tidal Energy Conference, Plymouth, UK, 5–9 September 2021. [Google Scholar]
  19. Petersen, T.U.; Mutlu Sumer, B.; Fredsøe, J.; Raaijmakers, T.C.; Schouten, J.-J. Edge scour at scour protections around piles in the marine environment—Laboratory and field investigation. Coast. Eng. 2015, 106, 42–72. [Google Scholar] [CrossRef]
Figure 1. (a) Overview of Grassy, King Island, Tasmania, Australia. (b) Location 1 and Location 2 of the OWC WEC with a bathymetric overlay (0.5 m contours) measured on 3 December 2020, stated levels are m LAT.
Jmse 10 00320 g001
Figure 2. (a) Photograph of the King Island OWC WEC. (b) Plan schematic of the King Island OWC WEC with key dimensions. (c) Side Elevation schematic of the King Island OWC WEC with key dimensions.
Jmse 10 00320 g002
Figure 3. Schematic of scour protection placed around the OWC WEC at Location 2 on 6 April 2021.
Jmse 10 00320 g003
Figure 4. (a) Time series of the spectral significant wave height (Hm0) and (b) the peak wave period (Tp) measured at King Island. (c) Scatter diagram showing the relationship between the spectral significant wave height and mean wave direction at King Island. Wave measurements undertaken utilizing a Sofar Ocean Spotter buoy between 12 January 2021 and 7 September 2021.
Jmse 10 00320 g004
Figure 5. Spotter wave data between 12 January 2021 and 4 February 2021 showing time series of (a) the spectral significant wave height (Hm0), (b) the peak wave period (Tp), and (c) the mean wave direction.
Jmse 10 00320 g005
Figure 6. Plan sketch of observed scour around the OWC WEC at Location 1 on 10 January 2021. Not to scale.
Jmse 10 00320 g006
Figure 7. Photographs extracted from dive survey footage around the OWC WEC at Location 1 on 10 January 2021. (ad) refer to photographic references given in Figure 6. (a) Scour is seen undermining the Eastern pontoon, with the scour width visibly decreasing in the Northern direction. (b) Intersection of the core and pontoon at the South-East corner, no visible scour can be seen underneath the pontoon. (c) A scour trench is seen running along the front (Southern) face of the concrete core. (d) Scour undermining the Western pontoon.
Jmse 10 00320 g007
Figure 8. Above-water photographs of the OWC WEC at Location 1 at approximately 7 a.m. on 18 January 2021. (a) Head-on image from a Southern perspective. (b) Side view from a South-Eastern perspective.
Jmse 10 00320 g008
Figure 9. Plan sketch of observed scour and morphological changes around the OWC WEC at Location 2 on 1 February 2021. Not to scale.
Jmse 10 00320 g009
Figure 10. Photographs extracted from dive survey footage around the OWC WEC at Location 2 on 1 February 2021. (af) refer to photographic references given in Figure 9. (a,b) show a scour hole on the back outer corner of the Western pontoon from different angles, which does not appear to have undermined the pontoon. (c) Photograph from the perspective of the back outer corner of the Western pontoon, this photo shows a relatively elevated zone of sediment with sand wave peaks visible. (d) The location along the outer edge of the Western pontoon where the base becomes exposed. (e) A large mound of sediment is visible at the front of the OWC WEC, sloping steeply down towards the chamber door. (f) Photograph looking in a Northern direction along the outer edge of the East pontoon, a steep slope can be seen in that right of the photograph sloping upwards away from the pontoon.
Jmse 10 00320 g010
Figure 11. Under-water photographs taken around the OWC WEC at Location 2 on 16 June 2021. (a) Photograph taken from in front of the chamber opening, above the opened door, facing towards the Southern corner of the Western pontoon. Sediment has infilled above the door and the Western pontoon is now embedded in sediment. (b) Photograph taken of the Northern corner of the Western pontoon. A scour hole is visible at the corner on the outer edge of the pontoon, but the pontoon remains embedded in sediment.
Jmse 10 00320 g011
Figure 12. (a) Aerial photograph on 22 July 2021 showing reflected waves from the Grassy Harbour breakwater propagating towards the OWC WEC. (b) Aerial photograph on 22 July 2021 showing vortex formation at the corners of the OWC WEC pontoons.
Jmse 10 00320 g012
Figure 13. Bedrock spot heights around the pontoon perimeter at Location 2 on 11 March 2021. Spot heights were taken from either the top of the pontoon or top of the aft deck (landward side).
Jmse 10 00320 g013
Figure 14. (a) Multi-beam bathymetry measured at Grassy on 3 December 2020. (b) Elevation changes in the multi-beam bathymetry measured at Grassy Harbour on 3 December 2020 relative to the bathymetry measured in March 2019.
Jmse 10 00320 g014
Figure 15. (a) Close-up of multi-beam bathymetry measurements on 8 May 2021. (b) Elevation changes in the close-up multi-beam bathymetry measured at Grassy on 8 May 2021 relative to the bathymetry measured on 3 December 2020. The black filled plan sketch of the OWC WEC is Location 2, whilst the black outline plan sketch is Location 1.
Jmse 10 00320 g015
Table 1. King Island OWC WEC device details.
VariableValue
Rated power200 kW
Submerged mass (ballasted)1,080,000 kg
Concrete core length15.5 m
Concrete core width7.6 m
Pontoon maximum length24.1 m
Pontoon maximum width3 m
Overall OWC WEC width13.6 m
Internal chamber height4 m
Internal chamber width7 m
Front chamber door height5.9 m
Table 2. Timeline of key events and date collection activities. Key changes to the OWC WEC deployment are highlighted in bold.
DateEvent
14–17 March 2019Geotechnical site survey [7], including multi-beam seabed survey, sediment coring and sub-bottom profiling.
8 August 2019-ongoingDeployment of Sofar Ocean Spotter buoy on-site for continuous measurements.
3 December 2020Multi-beam seabed survey.
10 January 2021Wave Swell Energy Ltd. initial deployment of 200-kW OWC WEC at King Island site in Location 1.
10 January 2021Below-water video footage of OWC WEC collected post-installation.
18–19 January 2021Observations of significant settlement of OWC WEC.
23 January 2021OWC WEC re-floated and moved to Location 2.
1 February 2021Below-water video footage of OWC WEC collected.
11 March 2021Bedrock survey in vicinity of OWC WEC.
6 April 2021Scour protection installed around OWC WEC.
8 May 2021Multi-beam seabed survey.
1 June 2021Front door of OWC WEC opened.
16 June 2021Below-water video footage collected.
22 July 2021Above-water video footage collected.
Publisher’s Note: MDPI stays neutral with regard to jurisdictional claims in published maps and institutional affiliations.

