
Chronology of Four Climbing Dune Outcrops on the Atlantic Coast of Galicia (NW Spain) Linked to the Sea Level Fall during the MIS6 and MIS4 Isotopic Stages


Abstract
:1. Introduction
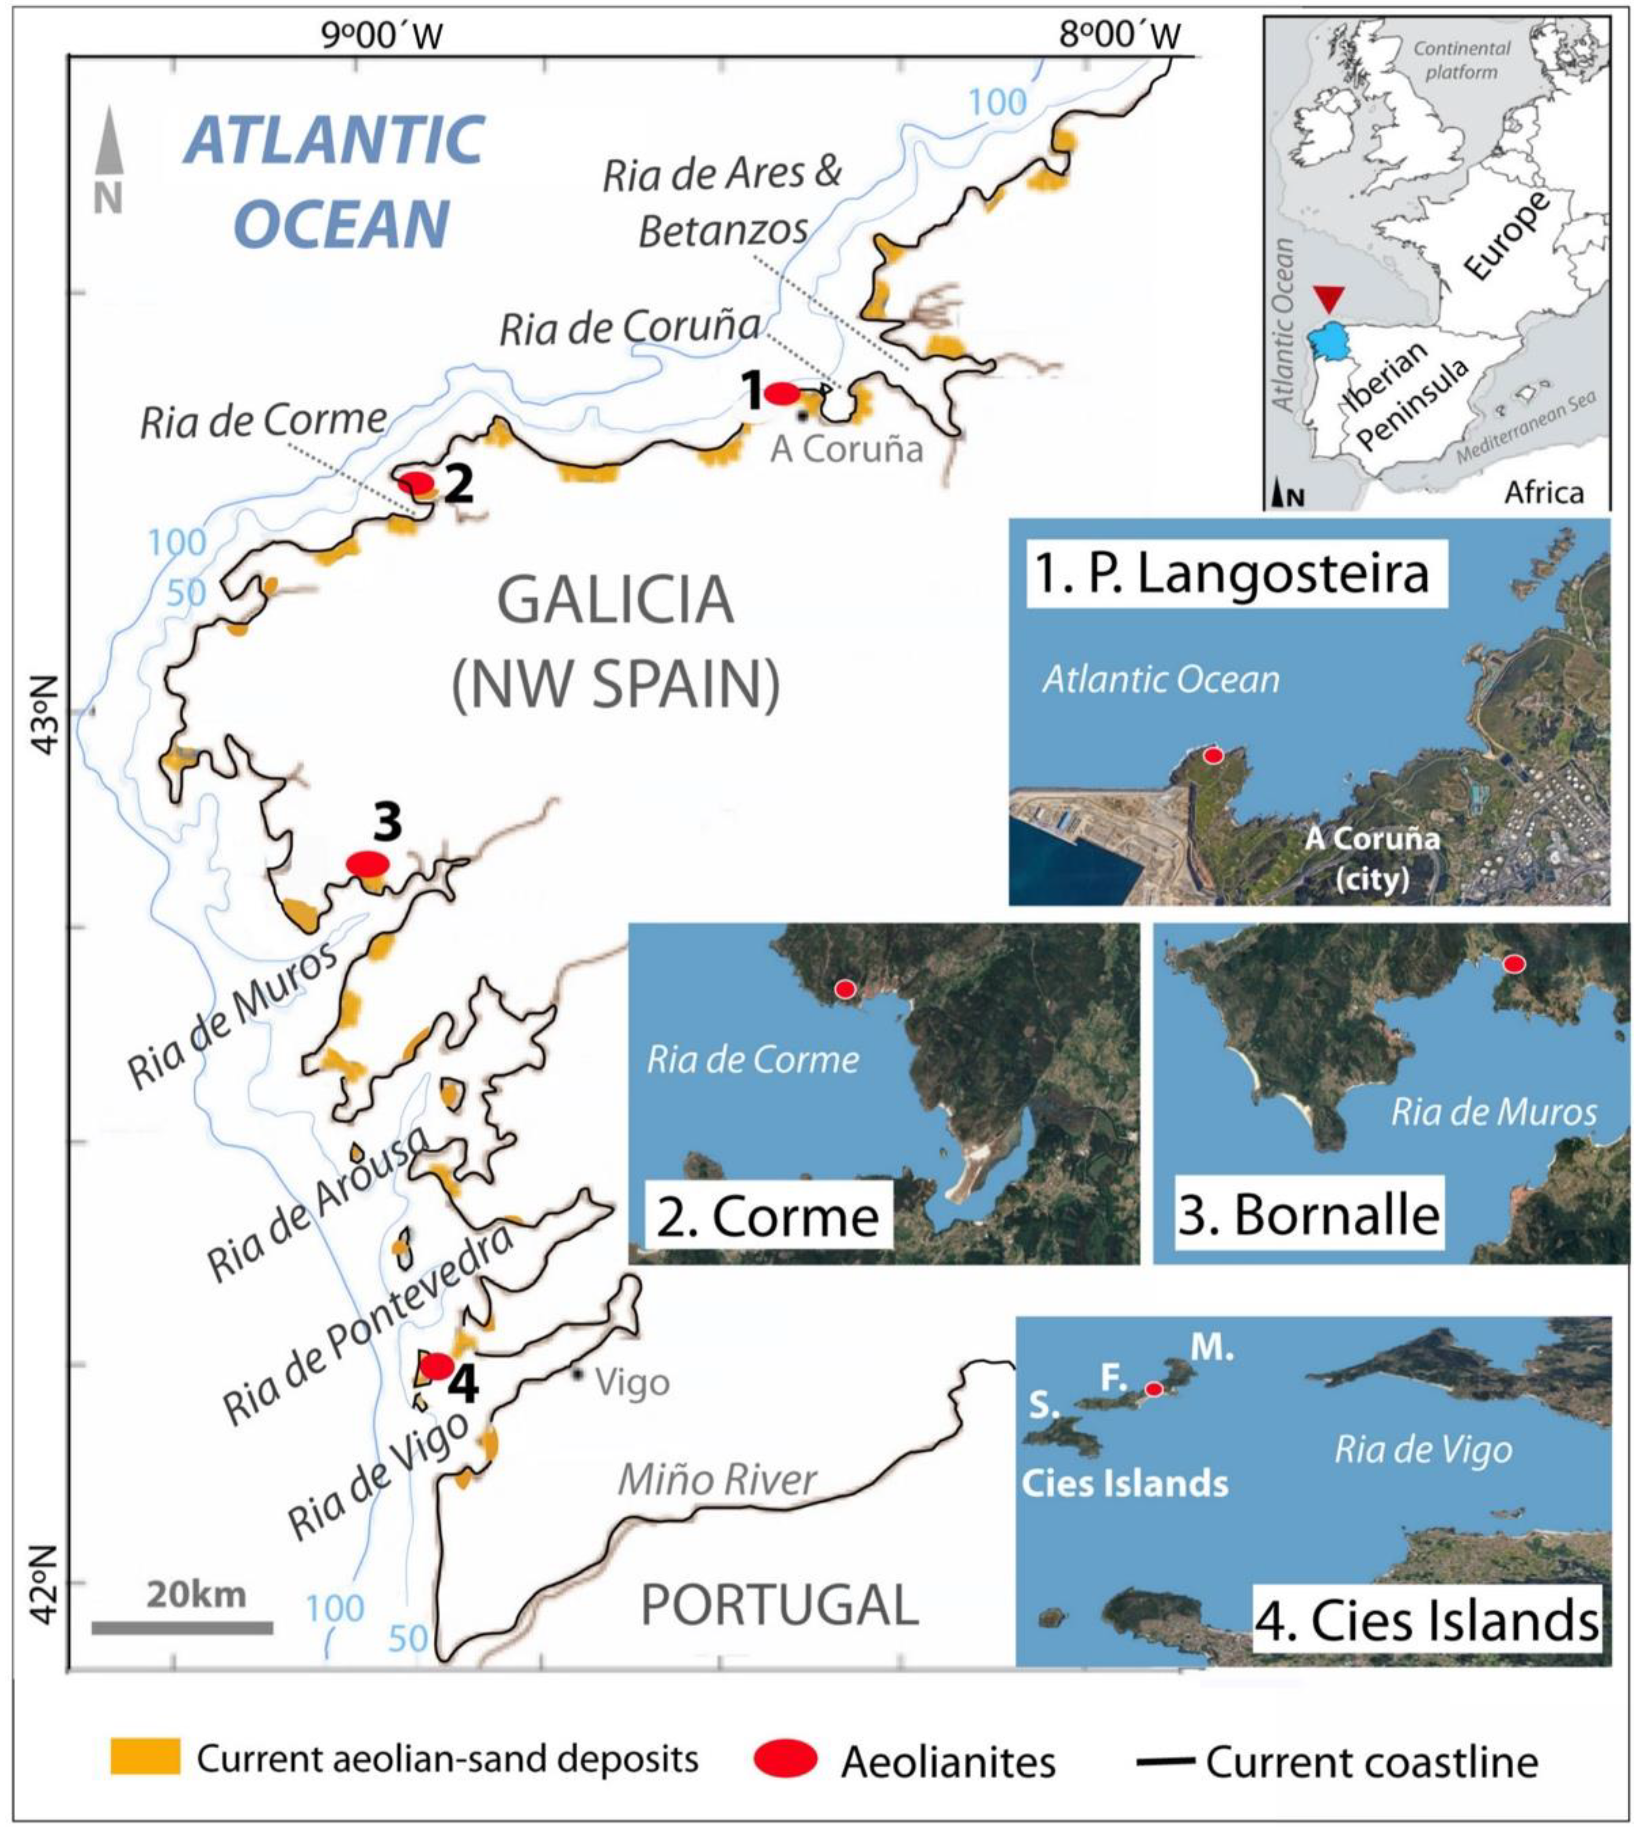
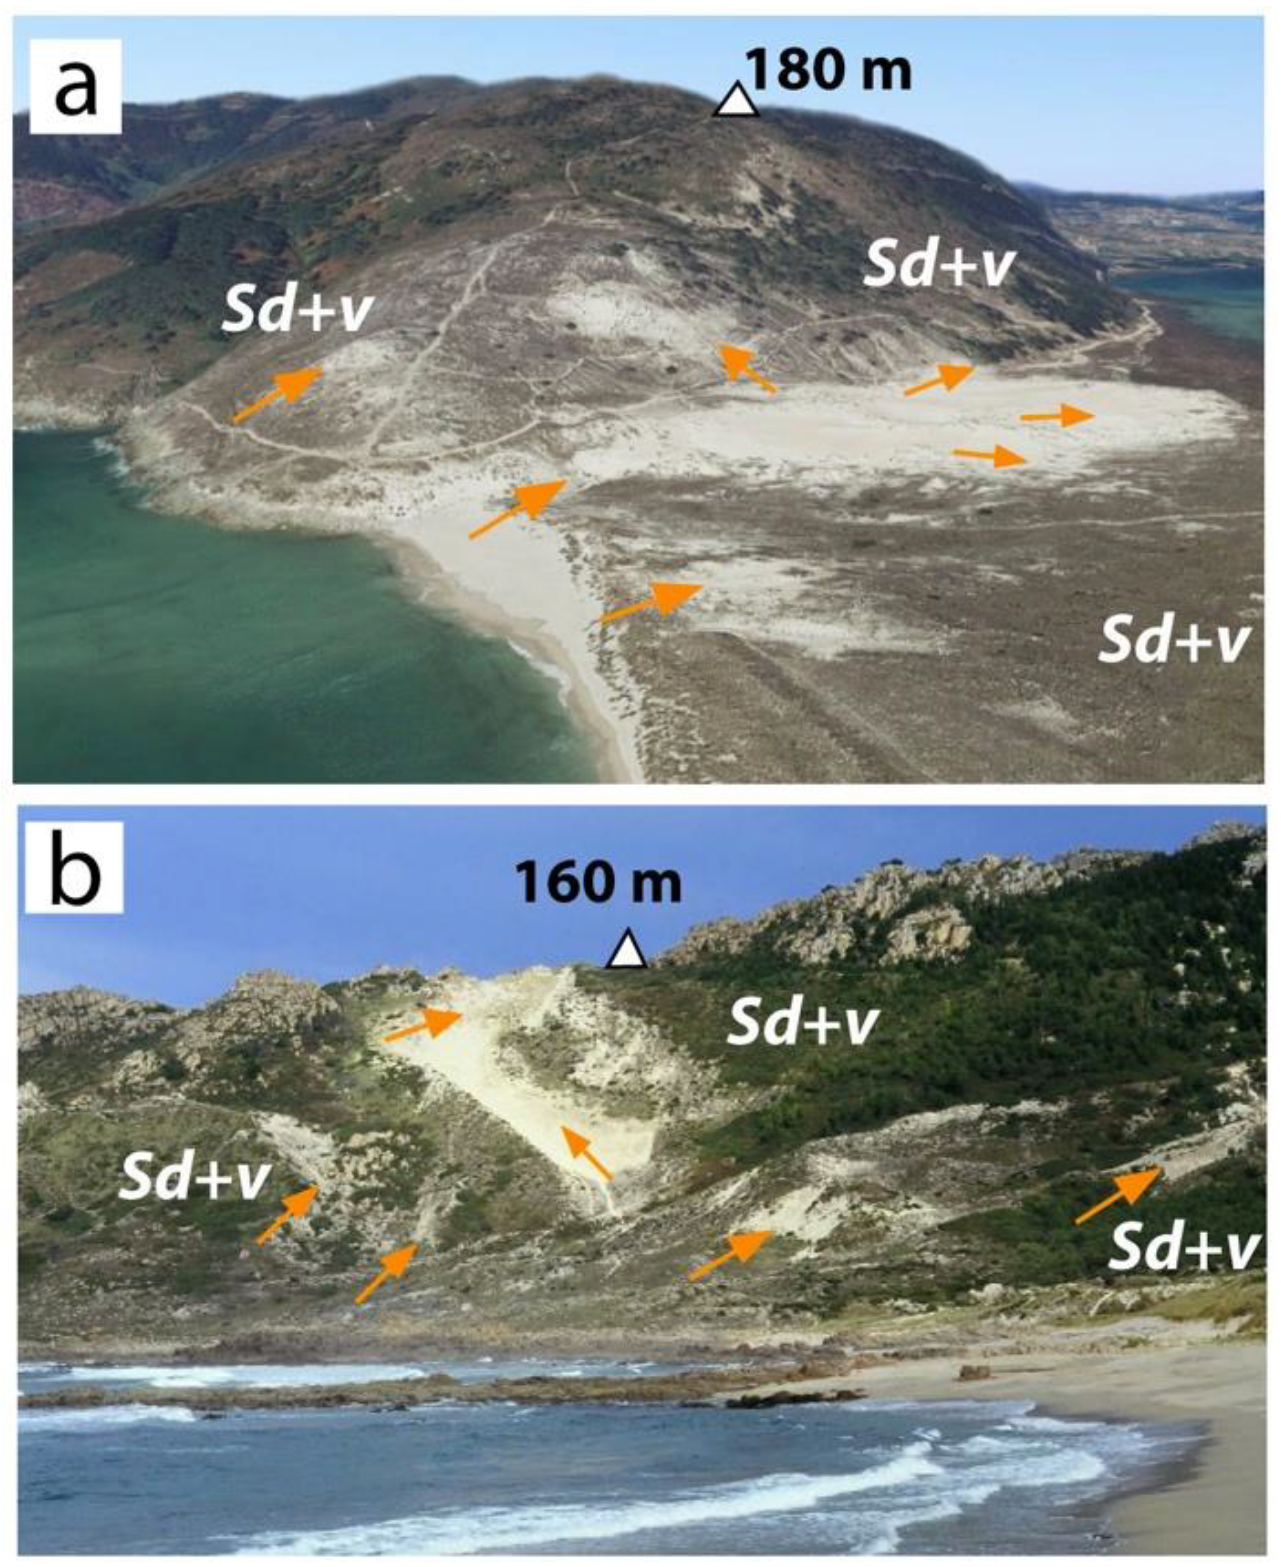
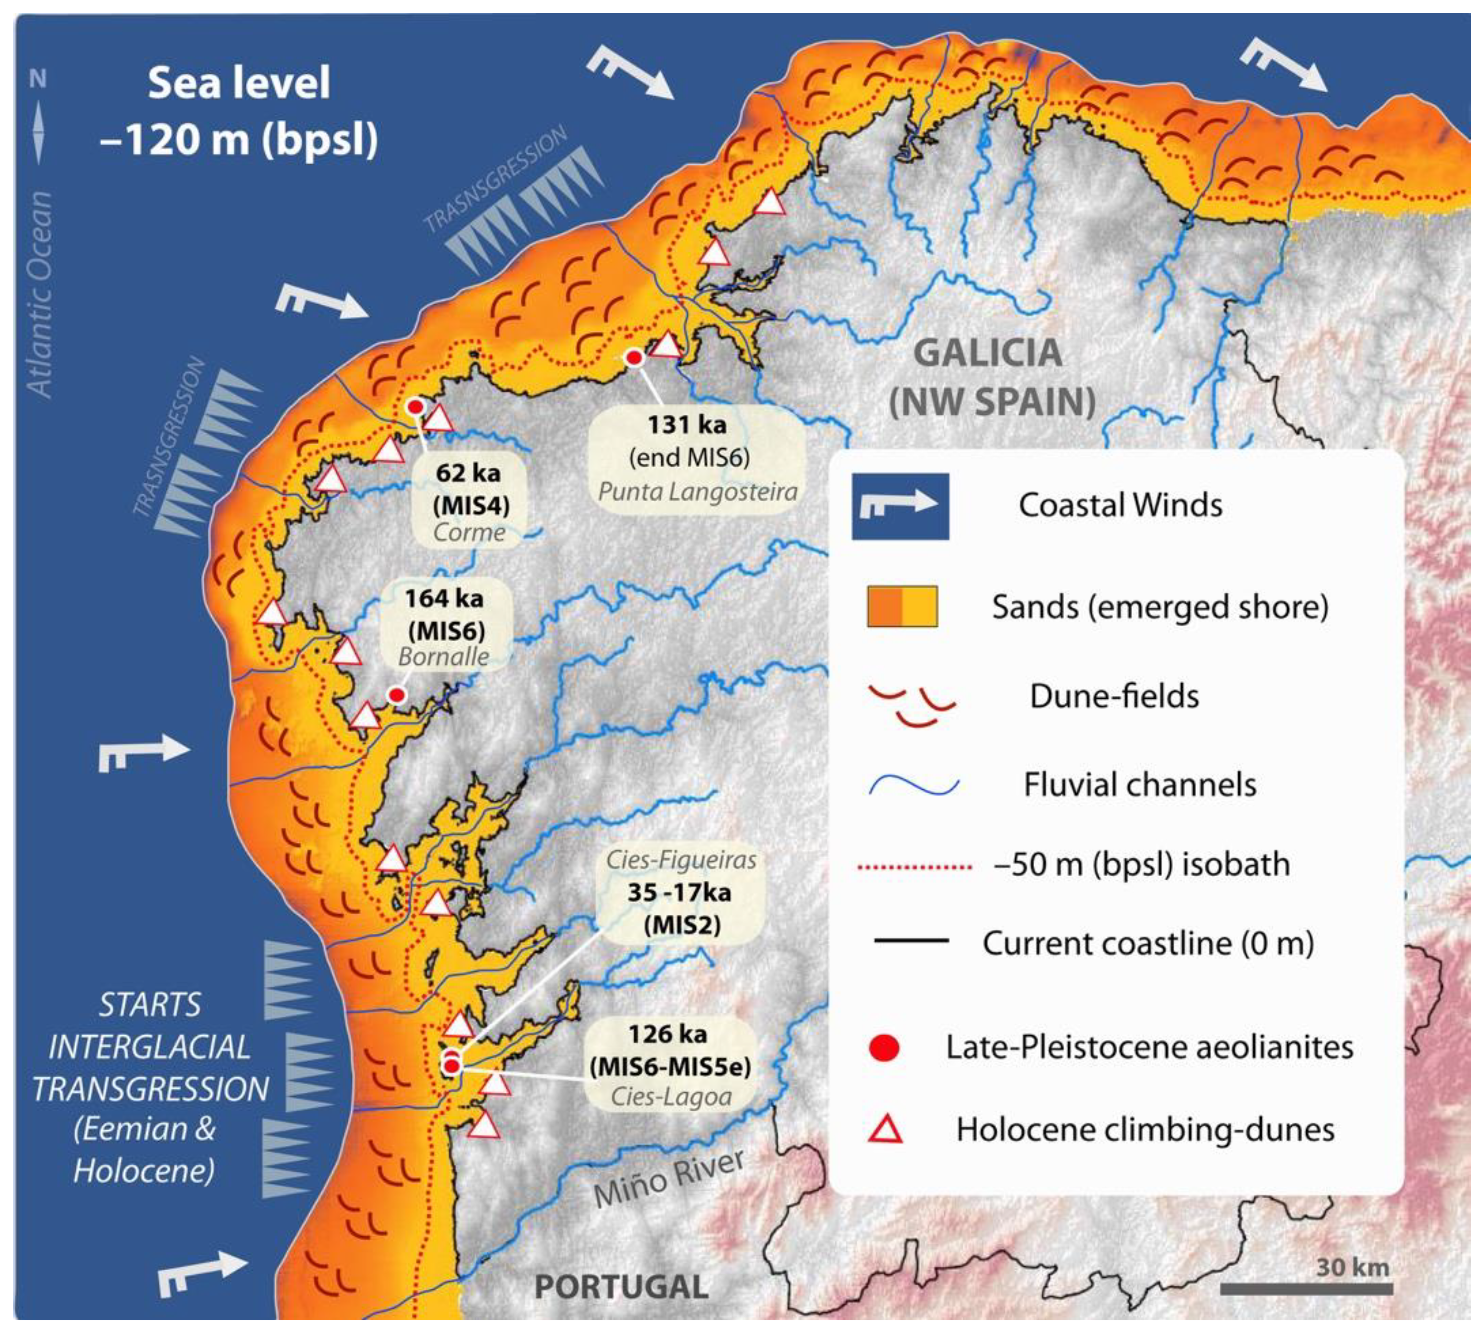
2. Study Area
3. Materials and Methods
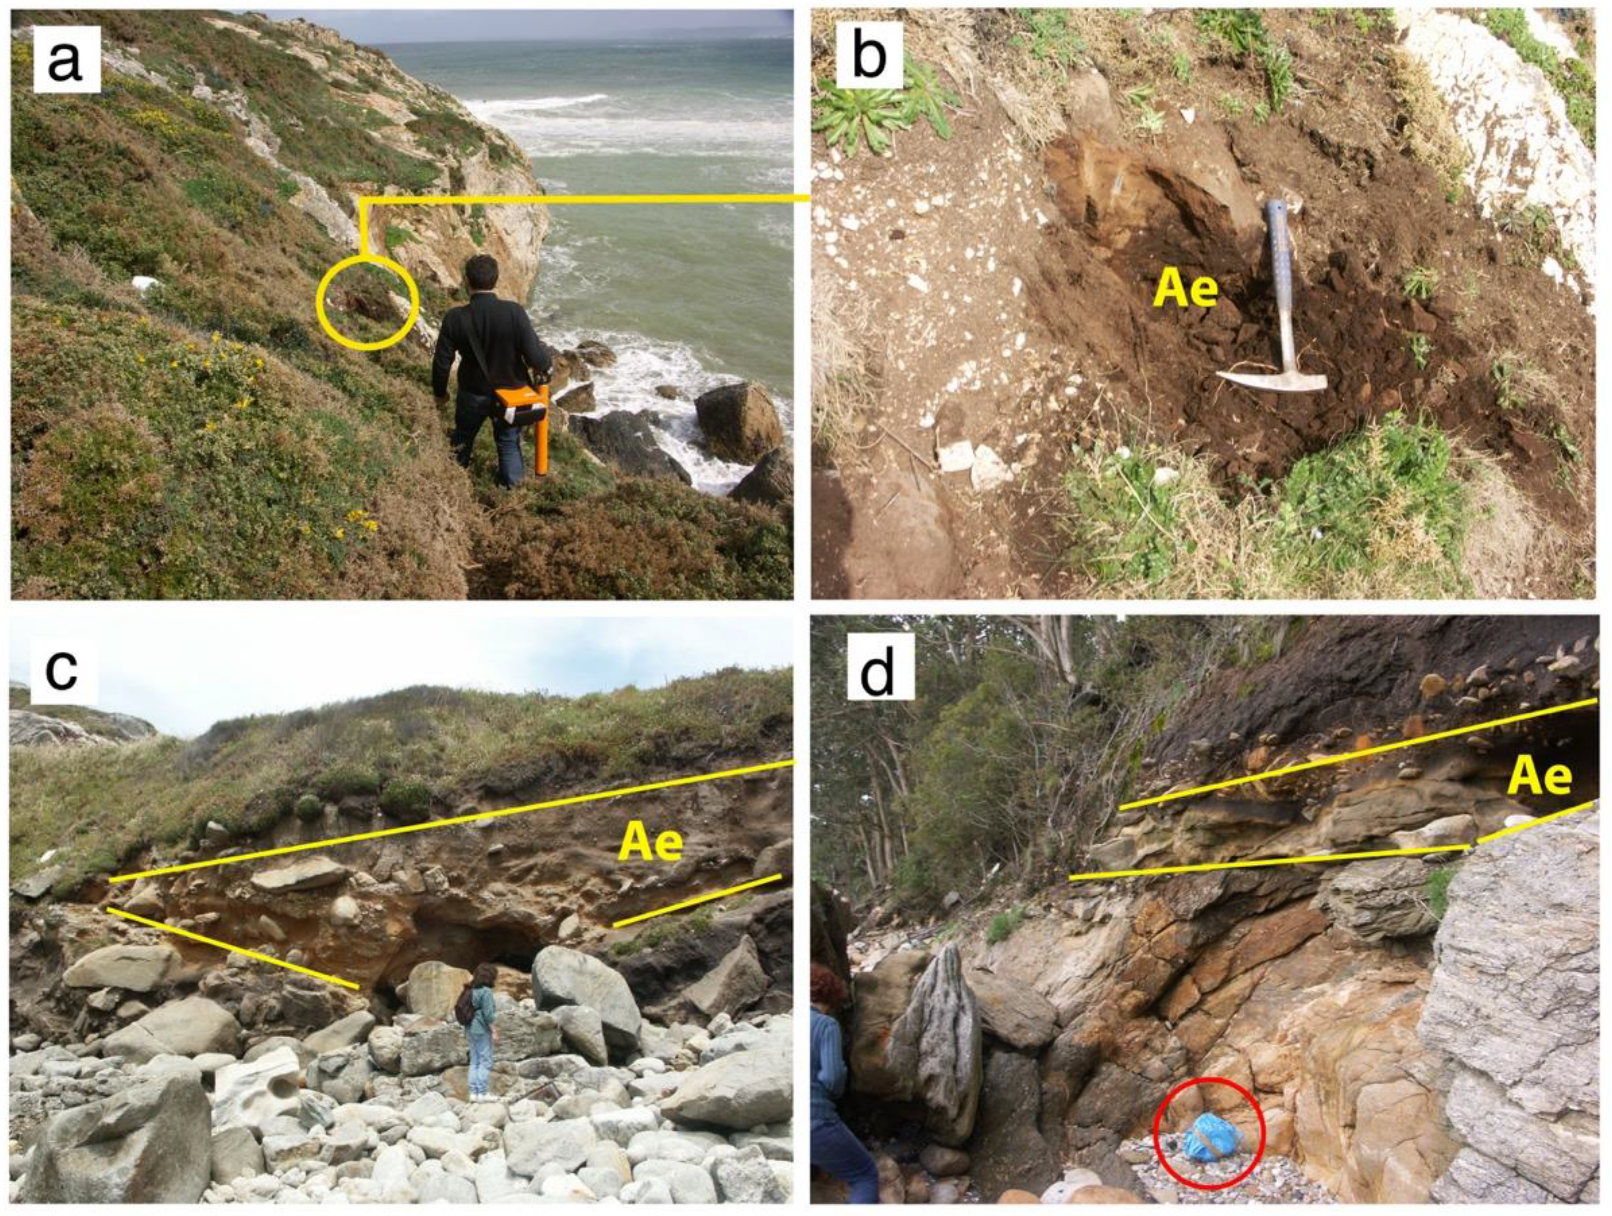
4. Results
4.1. Dose Rate (Dr)
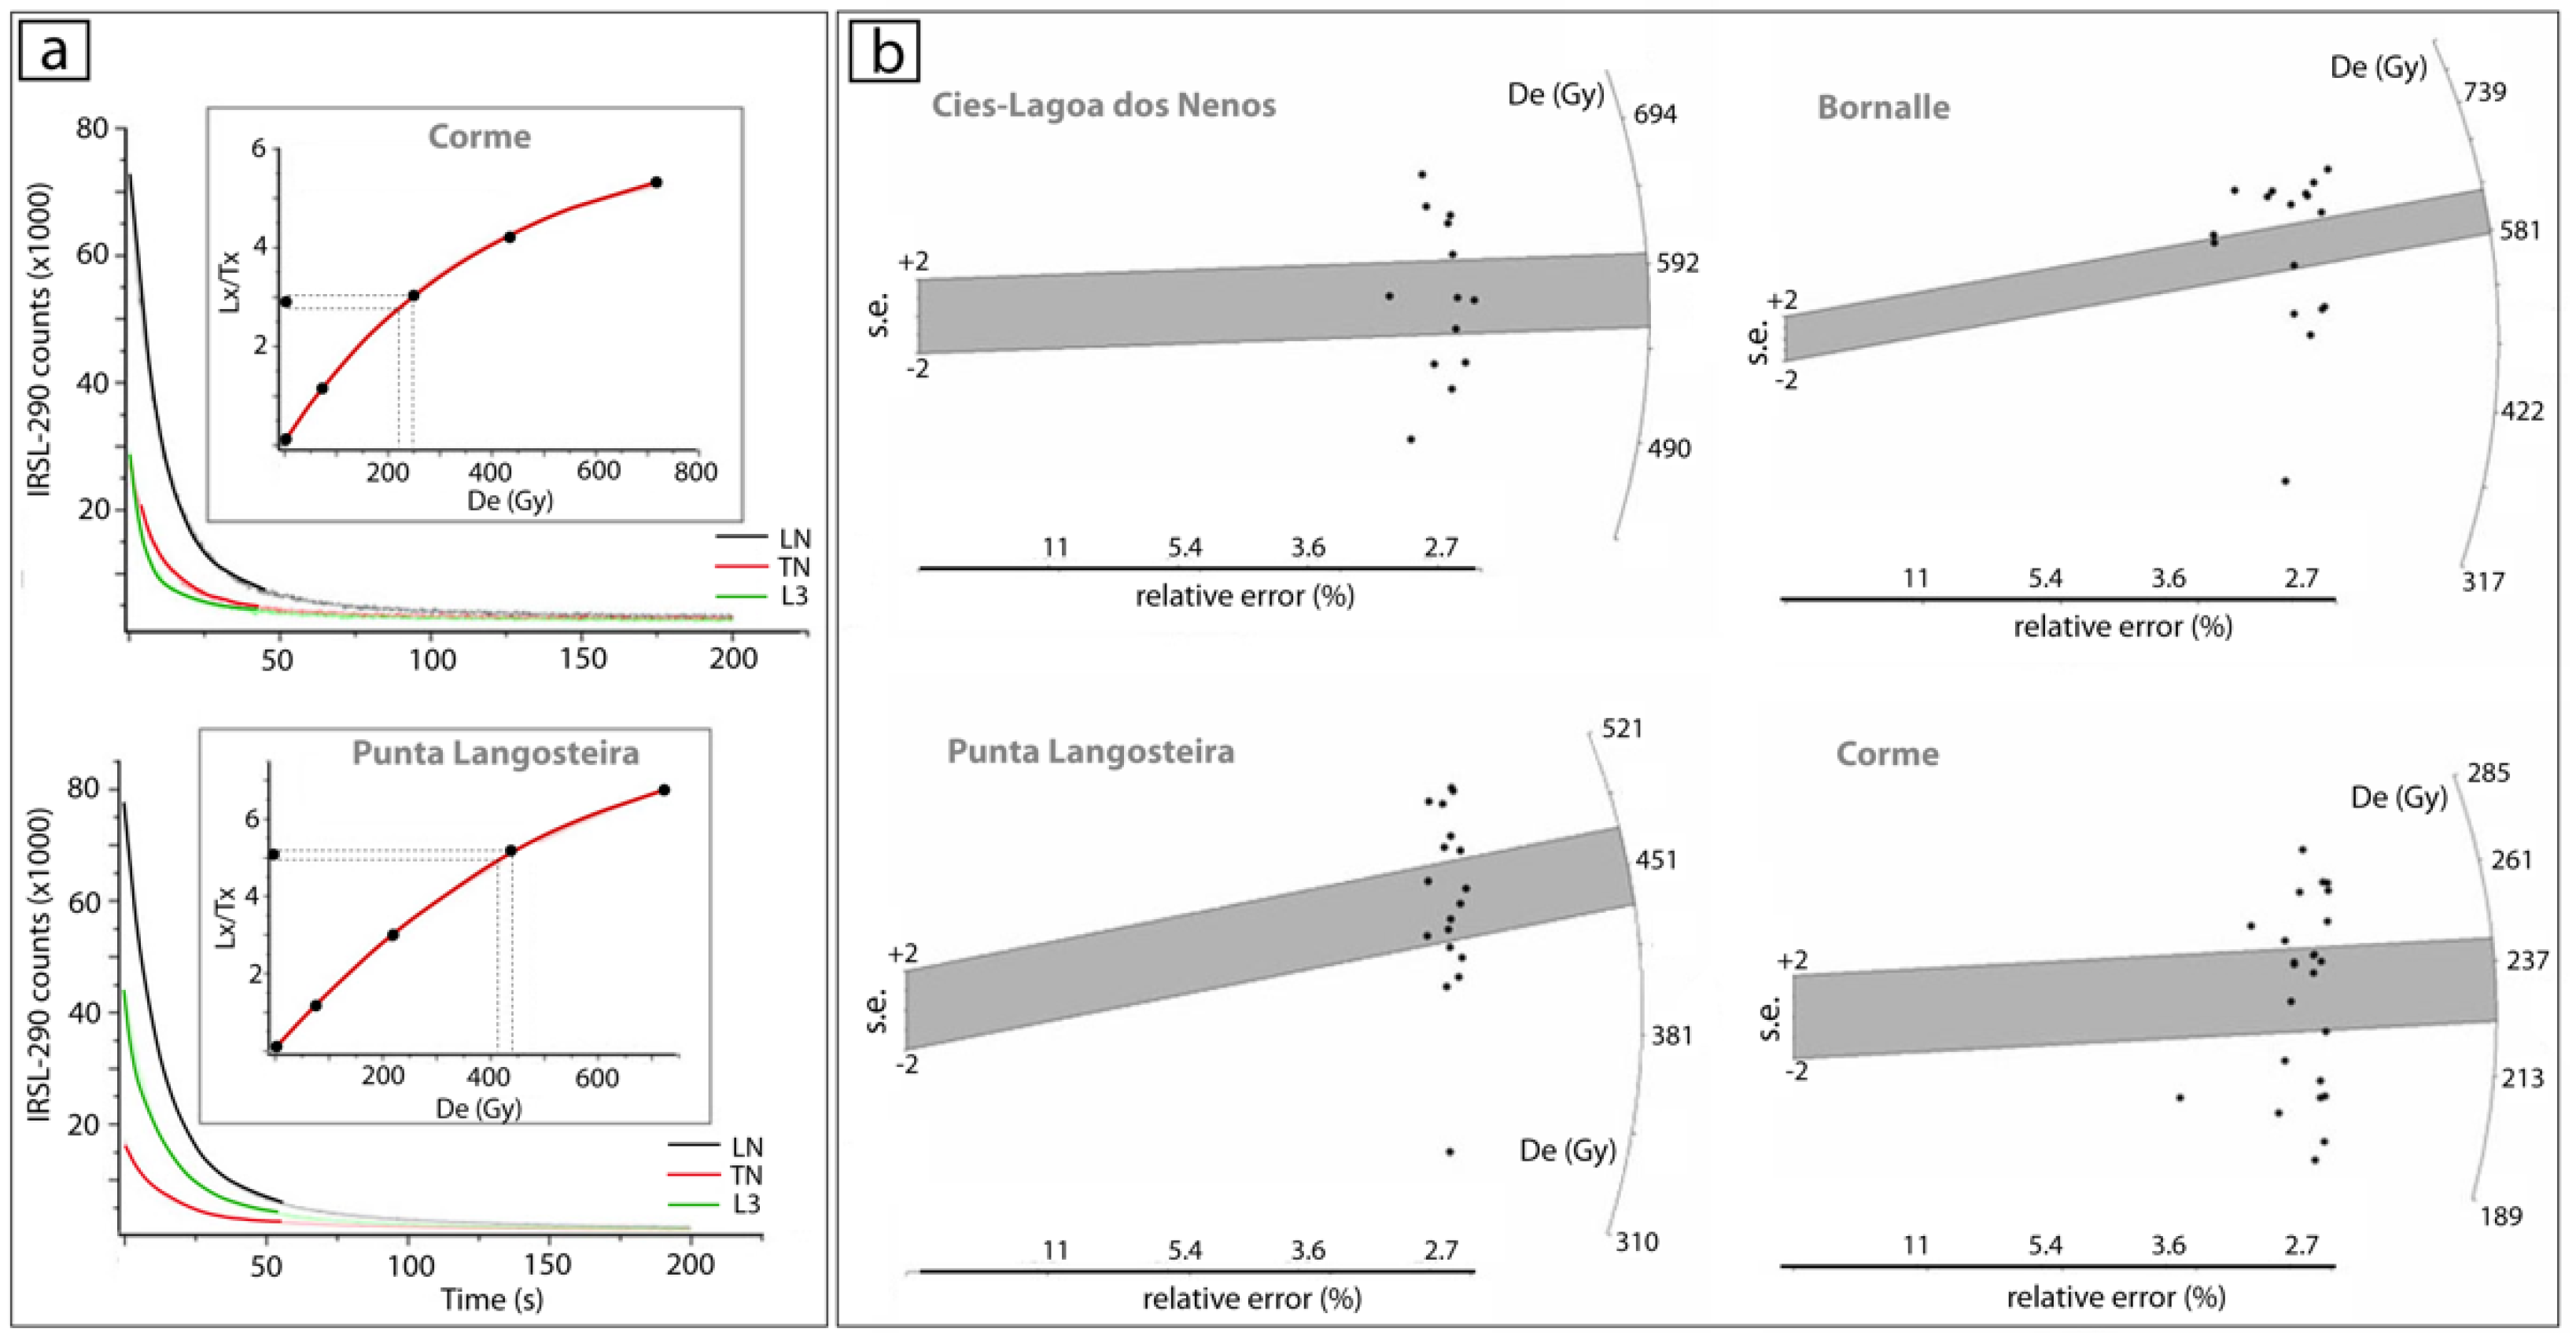
4.2. Equivalent Dose (De) and Ages
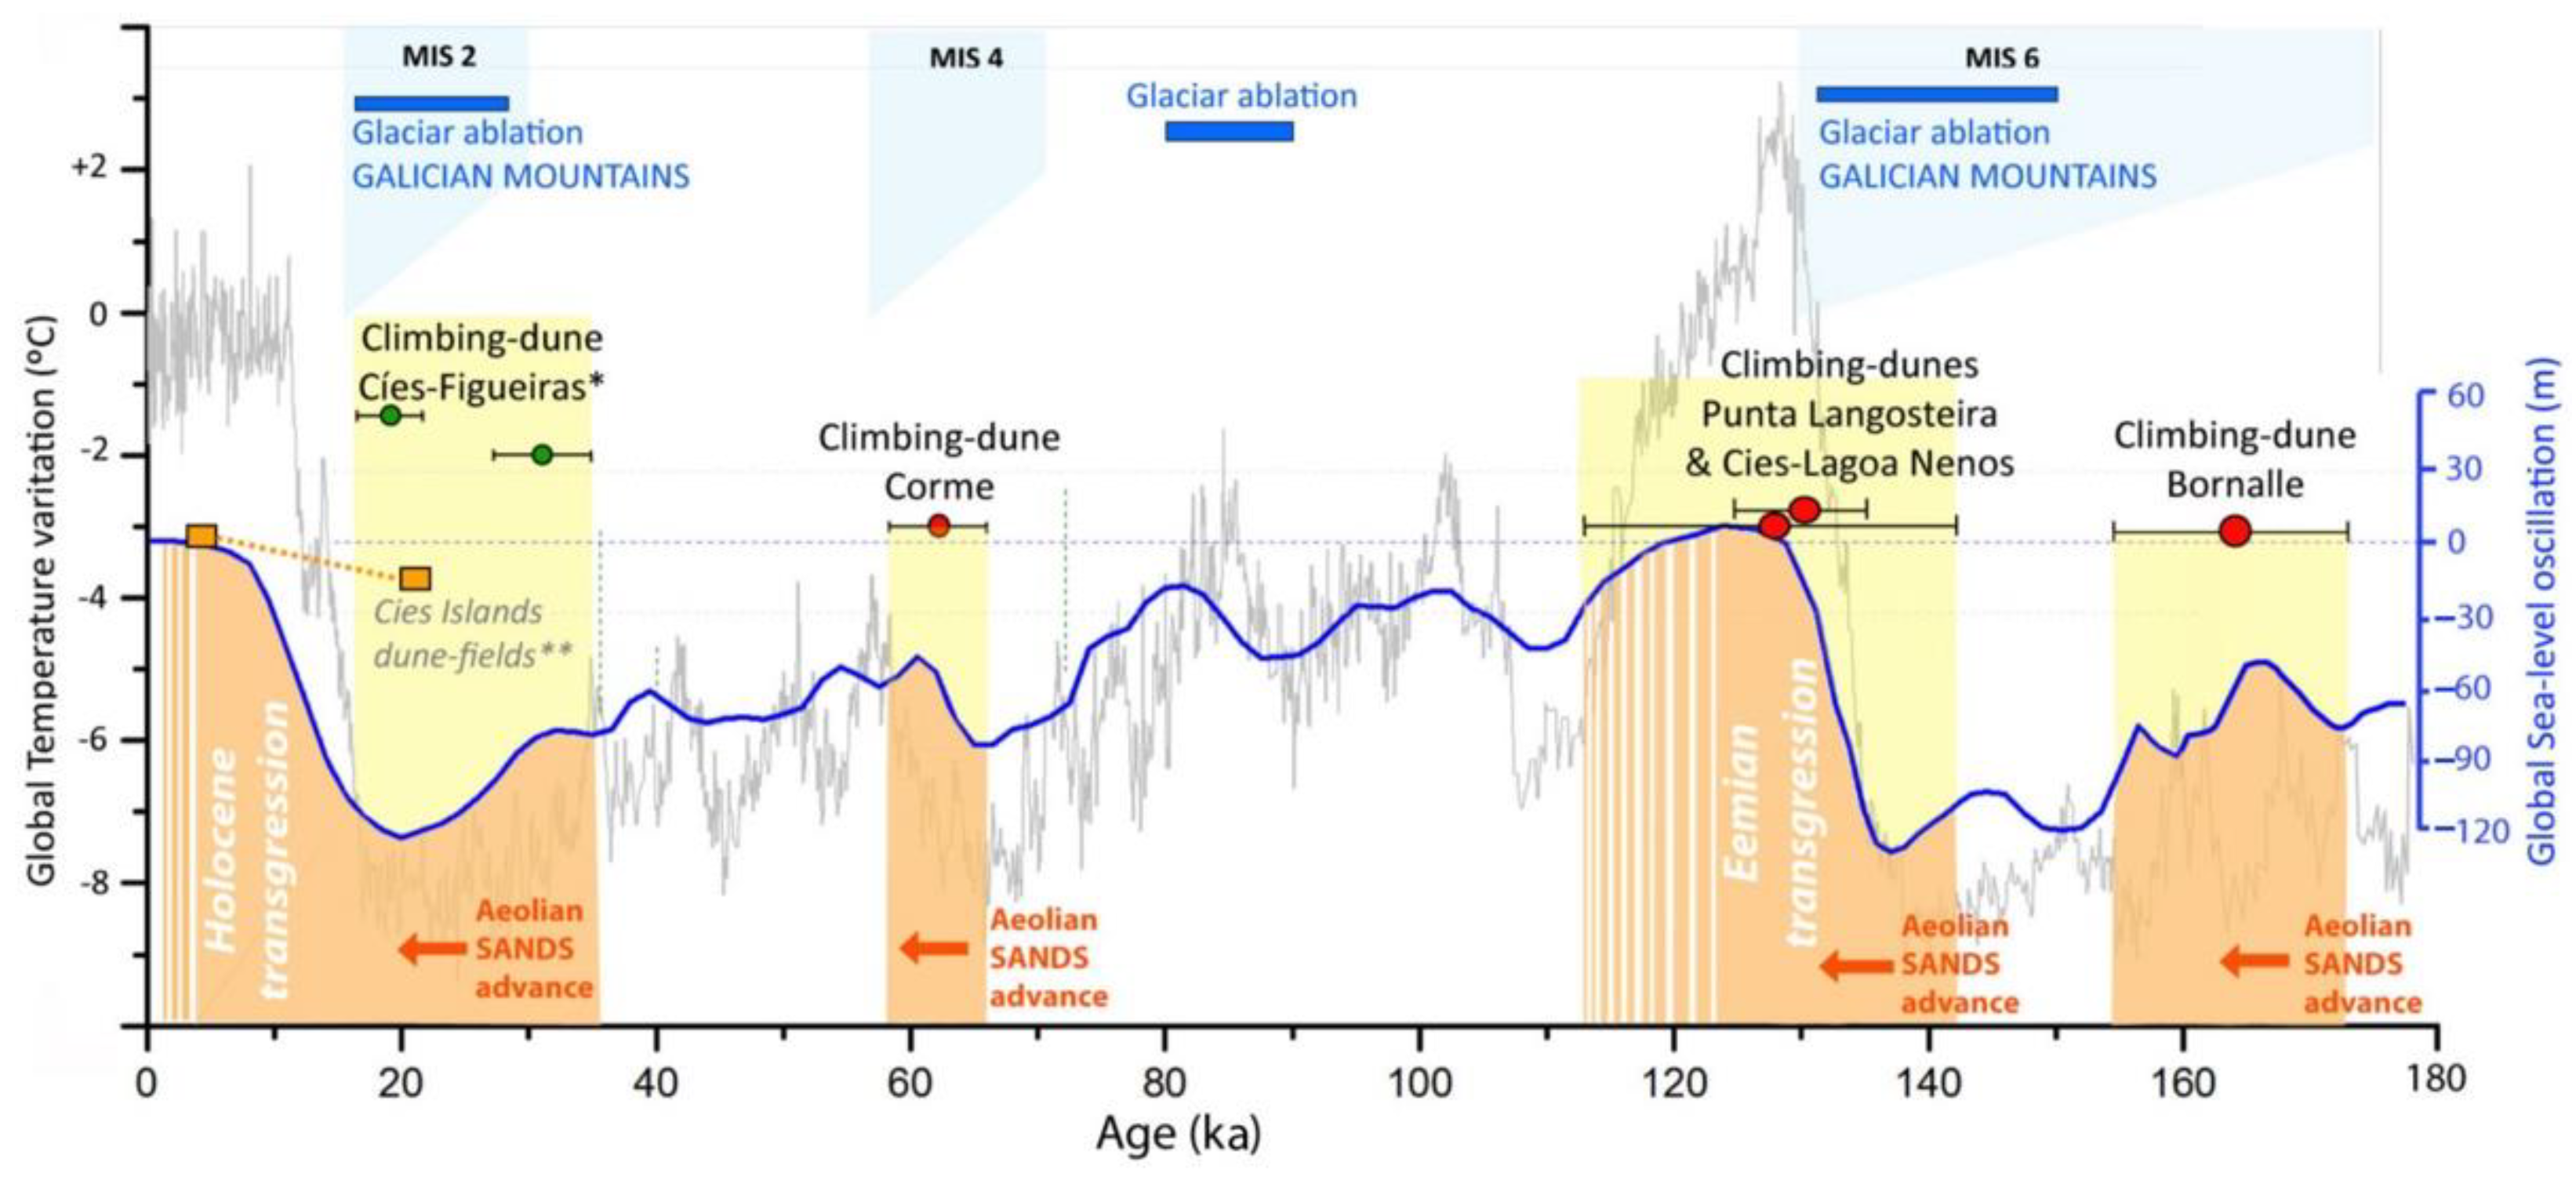
5. Discussion
6. Conclusions
Author Contributions
Funding
Institutional Review Board Statement
Informed Consent Statement
Data Availability Statement
Acknowledgments
Conflicts of Interest
References
- Gutiérrez-Becker, L. Caracterización de los Sistemas Dunares Costeros del NW Ibérico y su Evolución Durante el Cuaternario. Ph.D. Thesis, Universidad de Coruña, A Coruña, Spain, 2008. Available online: https://dialnet.unirioja.es/servlet/tesis?codigo=45245 (accessed on 1 February 2022).
- Nonn, H. Les Régiones Cotières de la Galice (Espagne). Etude Géomorpholigique; Publications de la Faculté des Lettres de L´Université de Strasbourg; Foundation Baulig: Paris, France, 1966; Tomo III. [Google Scholar]
- Viveen, W.; Braucher, R.; Bourlès, D.; Schoorl, J.M.; Veldkamp, A.; van Balen, R.T.; Wallinga, J.; Fernandez-Mosquera, D.; Vidal-Romani, J.R.; Sanjurjo-Sanchez, J. A 0.65 Ma chronology and incision rate assessment of the NW Iberian Miño River terraces based on 10Be and luminescence dating. Glob. Planet. Change 2012, 94–95, 82–100. [Google Scholar] [CrossRef]
- Santos, M.L.; Vidal-Romaní, J.R. La transgresión holocena en la Ria de Ares (A Coruña, Galicia, España). Datos cronológicos, sedimentarios y geomorfológicos. In Proceedings of the 3ª Reunião do Quaternario Ibérico, Coimbra, Portugal, 27 September–1 October 1993; pp. 339–345. [Google Scholar]
- Vidal-Romaní, J.R.; Santos-Fidalgo, L.; López-Cancelo, L.; Mosquera-Santé, M.J.; Leira-Campos, M. Storminess Variation along the Atlantic Seaboard of Europe over the Last 2000 Years: Holocene Storminess from Coastal Barriers in North-West Spain; Internal Report; Universidade da Coruña: A Coruña, Spain, 2000. [Google Scholar]
- López-Cancelo, L. Cambios Paleoambientales en el NW Peninsular, Durante el Holoceno, Determinados a Partir del Estudio de Foraminíferos Bentónicos. Ph.D. Thesis, Universidad de A Coruña, A Coruña, Spain, 2004. Available online: https://dialnet.unirioja.es/servlet/tesis?codigo=47918 (accessed on 1 February 2022).
- Nieto, M.I.; Vidal-Romaní, J.R. Niveles marinos y depósitos continentales antiguos en el borde costero entre Cabo Prior y Cabo Prioriño (A Coruña, Galicia, España). Cad. Lab. Xeol. Laxe 1989, 14, 67–78. [Google Scholar]
- Arce-Chamorro, C.; Vidal-Romaní, J.R.; Sanjurjo-Sánchez, J. Islas Cíes: Una trampa eólica en la Ría de Vigo (NO de la Península Ibérica) al final del último glacial. Estudio del afloramiento de eolianitas de la Isla de Monteagudo (Cíes, Pontevedra, Galicia). Geogaceta 2021, 70, 3–6. [Google Scholar]
- Costas, S.; Muñoz-Sobrino, C.; Alejo, I.; Pérez-Arlucea, M. Holocene evolution of a rock-bounded barrier-lagoon system, Cies Islands, northwest Iberia. Earth Surf. Proc. Land. 2009, 34, 1575–1586. [Google Scholar] [CrossRef]
- Vidal-Romaní, J.R.; Grandal-d´Anglade, A. Nota sobre la última transgresión marina en la costa de Galicia. Cad. Lab. Xeol. Laxe. 2018, 40, 229–246. [Google Scholar] [CrossRef]
- Fick, S.E.; Hijmans, R.J. WorldClim 2: New 1-km spatial resolution climate surfaces for global land areas. Int. J. Climatol. 2017, 37, 4302–4315. [Google Scholar] [CrossRef]
- Jackson, D.W.T.; Costas, S.; González-Villanueva, R.; Cooper, A. A global ‘greening’ of coastal dunes: An integrated consequence of climate change? Glob. Planet. Change 2019, 182, 103026. [Google Scholar] [CrossRef]
- Flor-Blanco, G.; Alcántara-Carrió, J.; Jackson, D.W.T.; Flor, G.; Flores-Soriano, C. Coastal erosion in NW Spain: Recent patterns under extreme storm wave events. Geomorphology 2021, 387, 107767. [Google Scholar] [CrossRef]
- Trindade, M.J.; Prudêncio, M.I.; Sanjurjo-Sánchez, J.; Romaní, J.R.V.; Ferraz, T.; Mosquera, D.F.; Dias, M.I. Post-depositional processes of elemental enrichment inside dark nodular masses of an ancient aeolian dune from A Coruña, Northwest Spain. Geologica Acta 2016, 11, 231–244. [Google Scholar] [CrossRef]
- Ottman, F.C. Introducción a la Geología Marina y Litoral; Editorial EUDEBA: Buenos Aires, Argentina, 1967; 287p. [Google Scholar]
- Rey-Salgado, J. Relación Morfosedimentaria entre la Plataforma Continental de Galicia y las Rías Bajas y su Evolución durante el Cuaternario; Instituto Español de Oceanografía: Madrid, Spain, 1993; 233p. [Google Scholar]
- De Vicente, G.; Vegas, R. Large-scale distributed deformation controlled topography along the western Africa –Eurasia limit: Tectonic constrains. Tectonophysics 2009, 474, 124–143. [Google Scholar] [CrossRef] [Green Version]
- Costas, S.; Jerez, S.; Trigo, R.M.; Bogle, R.; Rebêlo, L. Sand invasion along the Portuguese coast forced by westerly shifts during cold climate events. Quat. Sci. Rev. 2012, 42, 15–28. [Google Scholar] [CrossRef] [Green Version]
- EDMOnet Bathymetry Consortium. EMODnet Digital Bathymetry (DTM). 2018. Available online: https://doi.org/10.12770/18ff0d48-b203-4a65-94a9-5fd8b0ec35f6 (accessed on 1 February 2022).
- Arce-Chamorro, C. Datación por Luminiscencia de Depósitos Fluviales y Eólicos en el Margen Occidental de Galicia. Ph.D. Thesis, Universidade da Coruña, A Coruña, Spain, 2017; p. 399. Available online: http://hdl.handle.net/2183/19810 (accessed on 1 February 2022).
- Buylaert, J.P.; Murray, A.S.; Thomsen, K.J.; Jain, M. Testing the potential of an elevated temperature IRSL signal from K-feldspar. Radiat. Meas. 2009, 44, 560–565. [Google Scholar] [CrossRef]
- Thiel, C.; Buylaert, J.P.; Murray, A.; Terhorst, B.; Hofer, I.; Tsukamoto, S.; Frenchen, M. Luminiescence dating of the Stratzing loess profile (Austria)—Testing the potential of an elevated temperature post-IR IRSL protocol. Quat. Int. 2011, 234, 23–31. [Google Scholar] [CrossRef]
- Auclair, M.; Lamothe, M.; Huot, S. Measurement of anomalous fading for feldspar IRSL using SAR. Radiat. Meas. 2003, 37, 487–492. [Google Scholar] [CrossRef]
- Huntley, D.J.; Lamothe, M. Ubiquity of anomalous fading in K-feldspars and the measurement and correction for it in optical dating. Can. J. Earth. Sci. 2001, 38, 1093–1106. [Google Scholar] [CrossRef]
- Burow, C.; Kreutzer, S.; Dietze, M.; Fuchs, M.; Fischer, M.; Schmidt, C.; Brückner, H. RLumShiny—A graphical user interface for the R Package 'Luminescence'. Ancient TL 2016, 34, 22–32. [Google Scholar]
- Guérin, G.; Mercier, N.; Adamiec, G. Dose rate conversion factors. Ancient TL 2011, 29, 5–8. [Google Scholar]
- Huntley, D.J.; Baril, M.R. The K content of K-feldspars being measured in optical dating or in thermoluminescence dating. Ancient TL 1997, 15, 11–13. [Google Scholar]
- Mejdahl, V. Internal radiactivity in Quartz and felspar grains. Ancient TL 1987, 5, 10–17. [Google Scholar]
- Prescott, J.R.; Hutton, J.T. Cosmic ray contribution to dose rates for luminescence and ESR dating: Large depths and long-term time variations. Radiat. Meas. 1994, 23, 497–500. [Google Scholar] [CrossRef]
- Guérin, G.; Mercier, N. Preliminary insight into dose deposition processes in sedimentary media on a scale of single grains: Monte Carlo modelling of the effect of water on the gamma dose rate. Radiat. Meas. 2012, 47, 541–547. [Google Scholar] [CrossRef]
- Nathan, R.; Thomas, P.J.; Murray, A.S.; Rhodes, E.J. Environmental dose rate heterogeneity of beta radiation and its implications for luminescence dating: Monte Carlo modelling and experimental validation. Radiat. Meas. 2003, 37, 305–313. [Google Scholar] [CrossRef]
- Ivanovich, M.; Harmon, R.S. Uranium Series Desequilibrium: Applications to Earth, Marine and Environmental Sciences, 2nd ed.; Clarendon Press: Oxford, UK, 1982; 910p, ISBN 0 19 854278 X. [Google Scholar]
- Krebscheck, M.R.; Uieser, U.; Stolz, W. Optical dating: Some luminescence properties of natural feldspars. Radiat. Prot. Dosimetry 1996, 66, 407–412. [Google Scholar] [CrossRef]
- Pye, K.; Tsoar, H. Aeolian Sand and Sand Dunes; Unwin Hyman Ltd.: London, UK, 1990; p. 396. ISBN 004551125X. [Google Scholar]
- Jacobs, Z. Luminescence chronologies for coastal and marine sediments. Boreas 2008, 37, 508–535. [Google Scholar] [CrossRef]
- Galbraith, R.F.; Roberts, R.G.; Laslett, G.M.; Yoshida, H.; Olley, J.M. Optical dating of single and multiple grains of quartz from Jinmium rock shelter, northern Australia: Part I. Experimental design and statistical models. Archaeometry 1999, 41, 339–364. [Google Scholar] [CrossRef]
- Sanjurjo-Sánchez, J.; Vidal-Romaní, J.R. Problemas nuevos y procedimientos de datación por OSL para los sedimentos litorales del NO de la Península Ibérica. VII Jornadas de Geomorfología Litoral, Oviedo, España. Geotemas 2013, 14, 47–50. [Google Scholar]
- Petit, J.R.; Jouzel, J.; Raynaud, D.; Barkov, N.I.; Barnola, J.-M.; Basile, I.; Bender, M.; Chappellaz, J.; Davis, M.; Delaygue, G.; et al. Climate and atmospheric history of the past 420,000 years from the Vostok ice core, Antarctica. Nature 1999, 399, 429–436. [Google Scholar] [CrossRef] [Green Version]
- Lisiecki, L.E.; Raymo, M.E. A Pliocene-Pleistocene stack of 57 globally distributed benthic d18O records. Paleoceanography 2005, 20, PA1003. [Google Scholar] [CrossRef] [Green Version]
- Waelbroeck, C.; Labeyrie, L.; Michel, E.; Duplessy, J.C.; McManus, J.F.; Lambeck, K.; Balbon, E.; Labracherie, M. Sea-level and deep water temperature changes derived from benthic foraminifera isotopic records. Quat. Sci. Rev. 2002, 21, 295–305. [Google Scholar] [CrossRef]
- Mohamed, K.J.; Rey, D.; Rubio, B.; Vilas, F.; Frederichs, T. Interplay between detrital and diagenetic processes since the last glacial maximum on the northwest Iberian continental shelf. Quat. Res. 2010, 73, 507–520. [Google Scholar] [CrossRef]
- Vidal-Romaní, J.R.; Fernández-Mosquera, D.; Marti, K.; De Brum-Ferreira, A. Nuevos datos para la cronología glaciar pleistocena en el NW de la Península Ibérica. Cad. Lab. Xeol. Laxe. 1999, 24, 7–29. [Google Scholar]
- Vidal-Romaní, J.R.; Fernández-Mosquera, D.; Marti, K. The glaciation of Serra de Queixa-Invernadoiro and Serra do Geres-Xurés, NW Iberia. A critical review and a cosmogenic nuclide (10-Be and 21-Ne) chronology. Cad. Lab. Xeol. Laxe. 2015, 38, 25–44. [Google Scholar] [CrossRef]
- Granja, H.M.; Soares de Carvalho, G. Sea-level changes during the Pleistocene-Holocene in the NW coastal zone of Portugal. Terra Nova 1995, 7, 60–67. [Google Scholar] [CrossRef]
- Thomas, J.P.; Murray, A.S.; Granja, H.M.; Jain, M. Optical Dating of Late Quaternary Coastal Deposits in Northwestern Portugal. J. Coast. Res. 2006, 24, 134–144. [Google Scholar] [CrossRef]
- García-Amorena, I.; Gómez-Manzaneque, F.; Rubiales, J.M.; Granja, H.M.; de Carvalho, G.S.; Morla, C. The Late Quaternary coastal forests of western Iberia: A study of their macroremains. Palaeogeog. Plaeoclimatol. Palaeoecol. 2007, 254, 448–461. [Google Scholar] [CrossRef]
- Arce-Chamorro, C.; Vidal-Romaní, J.R. Late-Pleistocene chronology of coastal fluvial deposits at the mouth of the Ulla River in the Ría de Arousa (Galicia, NW Spain) by OSL dating. Cad. Lab. Xeol. Laxe 2021, 43, 61–88. [Google Scholar] [CrossRef]
- Ribeiro, H.; Pinto de Jesus, A.; Sanjurjo-Sánchez, J.; Abreu, I.; Romani, J.R.V.; Noronha, F. Multidisciplinary study of the quaternary deposits of the Vila Nova de Gaia, NW Portugal, and its climate significance. J. Iber. Geol. 2019, 45, 1–11. [Google Scholar] [CrossRef]
- Shackleton, N.J.; Sánchez-Goñi, M.F.; Pailler, D.; Lancelot, Y. Marine Isotope Substage 5e and the Eemian Interglacial. Glob. Planet. Change 2003, 36, 151–155. [Google Scholar] [CrossRef]


| Samples | 238-U (Bq/kg) | 226-Ra (Bq/kg) | 232-Th (Bq/kg) | 40-K (Bq/kg) | W (%) | Dr-Total (Gy/ka) | Corrected Dr-Total |
|---|---|---|---|---|---|---|---|
| Corme | 53 ± 13 | 16 ± 1 | 13 ± 1 | 552 ± 51 | 30 ± 3 | (e) 3.9 ± 0.3 | 3.7 ± 0.8 |
| (d) 3.3 ± 0.2 | |||||||
| Lagoa dos Nenos | 60 ± 18 | 21 ± 2 | 18 ± 4 | 756 ± 41 | 20 ± 2 | (e) 4.8 ± 0.4 | 4.5 ± 0.6 |
| (d) 4.1 ± 0.2 | |||||||
| Punta Langosteira | 48 ± 12 | 21 ± 1 | 43 ± 3 | 539 ± 50 | 20 ± 2 | (e) 3.9 ± 0.2 | 3.7 ± 0.6 |
| (d) 3.4 ± 0.2 | |||||||
| Bornalle | 24 ± 5 | 30 ± 1 | 11 ± 1 | 676 ± 63 | 20 ± 2 | (e) 3.7 ± 0.3 | 3.6 ± 0.4 |
| (d) 3.5 ± 0.2 |
| Samples | Dr (Gy/ka) | N | OD (%) | OD-Rec. (%) | De(Gy) | Age (ka) | |
|---|---|---|---|---|---|---|---|
| Apparent | Corrected | ||||||
| Corme | 3.7 ± 0.8 | 24/24 | IRSL50 (g < 0.1) 217 ± 12 | = | 59 ± 13 | ||
| 11 ± 2 | <5 | IRSL290 (g < 0.1) 231 ± 7 | = | 62 ± 3 | |||
| Lagoa dos Nenos | 4.5 ± 0.6 | 17/17 | IRSL50 (g = 5.2 ± 1.1) 354 ± 15 | 79 ± 11 | 153 ± 58 | ||
| 11 ± 3 | <5 | IRSL290 (g < 0.1) 576 ± 23 | = | 128 ± 18 | |||
| Punta Langosteira | 3.7 ± 0.6 | 18/26 | IRSL50 (g = 0.5) 352 ± 16 | 95 ± 16 | 100 ± 16 | ||
| 11 ± 2 | <5 | IRSL290 (g < 0.1) 484 ± 51 | = | 131 ± 6 | |||
| Bornalle | 3.6 ± 0.4 | 17/30 | IRSL50 (g = 2.3 ± 0.5) 499 ± 29 | 139 ± 17 | 176 ± 25 | ||
| 19 ± 3 | <5 | IRSL290 (g = 1.0) 600 ± 31 | 151 ± 8 | 166 ± 9 | |||
Publisher’s Note: MDPI stays neutral with regard to jurisdictional claims in published maps and institutional affiliations. |
© 2022 by the authors. Licensee MDPI, Basel, Switzerland. This article is an open access article distributed under the terms and conditions of the Creative Commons Attribution (CC BY) license (https://creativecommons.org/licenses/by/4.0/).
Share and Cite
Arce-Chamorro, C.; Vidal-Romaní, J.R.; Sanjurjo-Sánchez, J. Chronology of Four Climbing Dune Outcrops on the Atlantic Coast of Galicia (NW Spain) Linked to the Sea Level Fall during the MIS6 and MIS4 Isotopic Stages. J. Mar. Sci. Eng. 2022, 10, 312. https://doi.org/10.3390/jmse10030312
Arce-Chamorro C, Vidal-Romaní JR, Sanjurjo-Sánchez J. Chronology of Four Climbing Dune Outcrops on the Atlantic Coast of Galicia (NW Spain) Linked to the Sea Level Fall during the MIS6 and MIS4 Isotopic Stages. Journal of Marine Science and Engineering. 2022; 10(3):312. https://doi.org/10.3390/jmse10030312
Chicago/Turabian StyleArce-Chamorro, Carlos, Juan Ramón Vidal-Romaní, and Jorge Sanjurjo-Sánchez. 2022. "Chronology of Four Climbing Dune Outcrops on the Atlantic Coast of Galicia (NW Spain) Linked to the Sea Level Fall during the MIS6 and MIS4 Isotopic Stages" Journal of Marine Science and Engineering 10, no. 3: 312. https://doi.org/10.3390/jmse10030312
APA StyleArce-Chamorro, C., Vidal-Romaní, J. R., & Sanjurjo-Sánchez, J. (2022). Chronology of Four Climbing Dune Outcrops on the Atlantic Coast of Galicia (NW Spain) Linked to the Sea Level Fall during the MIS6 and MIS4 Isotopic Stages. Journal of Marine Science and Engineering, 10(3), 312. https://doi.org/10.3390/jmse10030312