Article

The Key Impact on Water Quality of Coral Reefs in Kenting National Park

1
Department of Life Science, National Taiwan Normal University, Taipei 116, Taiwan
2
National Museum of Marine Biology and Aquarium, Checheng, Pingtung 944, Taiwan
3
Graduate Institute of Marine Biology, National Dong Hwa University, Checheng, Pingtung 944, Taiwan
4
Atlantic Oceanic and Meteorological Laboratory, National Oceanographic and Atmospheric Association, Miami, FL 33149, USA
5
Department of Oceanography, National Sun Yat-sen University, Kaohsiung 804, Taiwan
6
Graduate Institute of Marine Biology, National Dong Hwa University, Shoufeng, Hualien 974, Taiwan
*
Authors to whom correspondence should be addressed.
These authors contributed equally to this work.
J. Mar. Sci. Eng. 2022, 10(2), 270; https://doi.org/10.3390/jmse10020270
Submission received: 15 January 2022 / Revised: 9 February 2022 / Accepted: 10 February 2022 / Published: 15 February 2022
(This article belongs to the Special Issue The Impact of Changes in the Marine Environment on Marine Organisms)

Abstract

:
Southern Taiwan’s Kenting National Park is a popular retreating place for many domestic and international tourists, with increasing tourist numbers potentially over-burdening the coastal ecosystems. To better understand human impacts, a long-term ecological research program was initiated in 2001 to track water quality at 14 coral reef-abutting sites throughout the park since then. Extracting the data from this 20-year survey, we found that increasing in the nutrient levels during the summer rainy season, together with the drops in salinity led by freshwater inputs (land- & rainfall-derived), was the main impact to coral reef ecosystem of Kenting. Cluster analysis further confirmed the nutrient influx was mainly attributed to the local discharge outlets with dense of villages and hotels at upstream. Therefore, more efforts are needed to input to control tourist number, treat waste water discharge and strengthen land protection facilities.

1. Introduction

Kenting National Park (KNP) is located at the southernmost tip of Taiwan, and the plethora of beaches and vibrant coral reefs are a draw for myriad domestic and international tourists. Unfortunately, the pre-Covid tourism boom (3 million in 2001 to 8 million in 2018) has led to increasing coastal development, sewage and other pollutant discharge, and eutrophication [1,2,3]; high nitrogen and suspended solid (SS) levels have even been linked to coral reef decline in the area [3], with more direct impacts of tourists (e.g., physical damage to coral colonies) having also been documented [4]. The SS, high nutrient loads, and pathogenic bacteria are presumably land-based, entering the ocean via channels or creeks during the May to September rainy season; such runoff can also include fertilizers and pesticides used in local agriculture [4]. Given these threats, KNP initiated a long-term ecological research (LTER) program in 2001, with data collected until 2019. There has been a focus on nearshore environments abutting coral reef ecosystems (N = 19 sites). Herein we sought to use multivariate statistical approaches, namely principal components analysis (PCA) and cluster analysis (CA), to uncover relationships among seawater quality parameters across the LTER study sites, sensu [5,6,7,8,9,10,11]. The overarching goal was to use this approach to better understand spatio-temporal variation in seawater quality in this ecologically rich bio-region.

2. Materials and Methods

The KNP LTER sample sites are shown in Figure 1, and seawater quality was assessed at regular intervals between 2001 and 2019. The following parameters were assessed as in our prior works [3,4]. Practically, quality control (QC) for sampling equipment and field measurement procedures, including those for temperature, salinity, pH, and dissolved oxygen (DO), were conducted in situ following government QA/QC regulations. The remaining water samples were preserved at 4 °C and returned to the laboratory for analysis of the following parameters: pH, five days of biochemical oxygen demand (BOD5), nutrients (nitrite, nitrate and phosphate, ammonia) chlorophyll-a, suspended solids, and turbidity.
The measurements of temperature and salinity were carried out in situ with a CTD (conductivity, temperature, and depth [pressure]) instrument (Sea-Bird Electronics Model 19 plus) on the research vessel Ocean Research III and/or by the EPA/ROC (Taipei) technique on fishing boats. The precision for temperature was ±0.05 °C and the accuracy and precision for salinity were ±0.003 and ±0.023 psu, respectively. DO was measured by the Winkler method with an accuracy of ±0.04 mg/L and a precision of ±1.2%. The precision and accuracy (recovery of a spiked glucose standard) of BOD (five days) measurements were ±2.38% and 98.3 ± 7.7%, respectively, and the values were subsequently checked with the control chart.
Analysis of nutrients and ammonium was conducted as followings. Immediately after collection, water samples were stored in a cooler at 4 °C and returned to the laboratory for analysis of ammonia and nutrients. A Flow Injection Analyzer (FIA) and spectrophotometer (Hitachi model U-3000) were used to conduct analysis of ammonia, nitrate, nitrite, phosphate and silicate [12,13,14,15].
These data (with the exception of temperature, which was omitted) were analyzed by PCA, hierarchical CA, and discriminant analysis (DA). PCA was used to determine relationships among seawater quality parameters and similarity among sites, with CA used to corroborate the inter-site relationships (Ward’s method of Euclidean distances; depicted as a dendrogram). DA was used to statistically assign sites to particular groups using a predictive model based on the seawater quality parameters. We hypothesized that sites would cluster by anthropogenic input (namely nutrient loads).

3. Results and Discussion

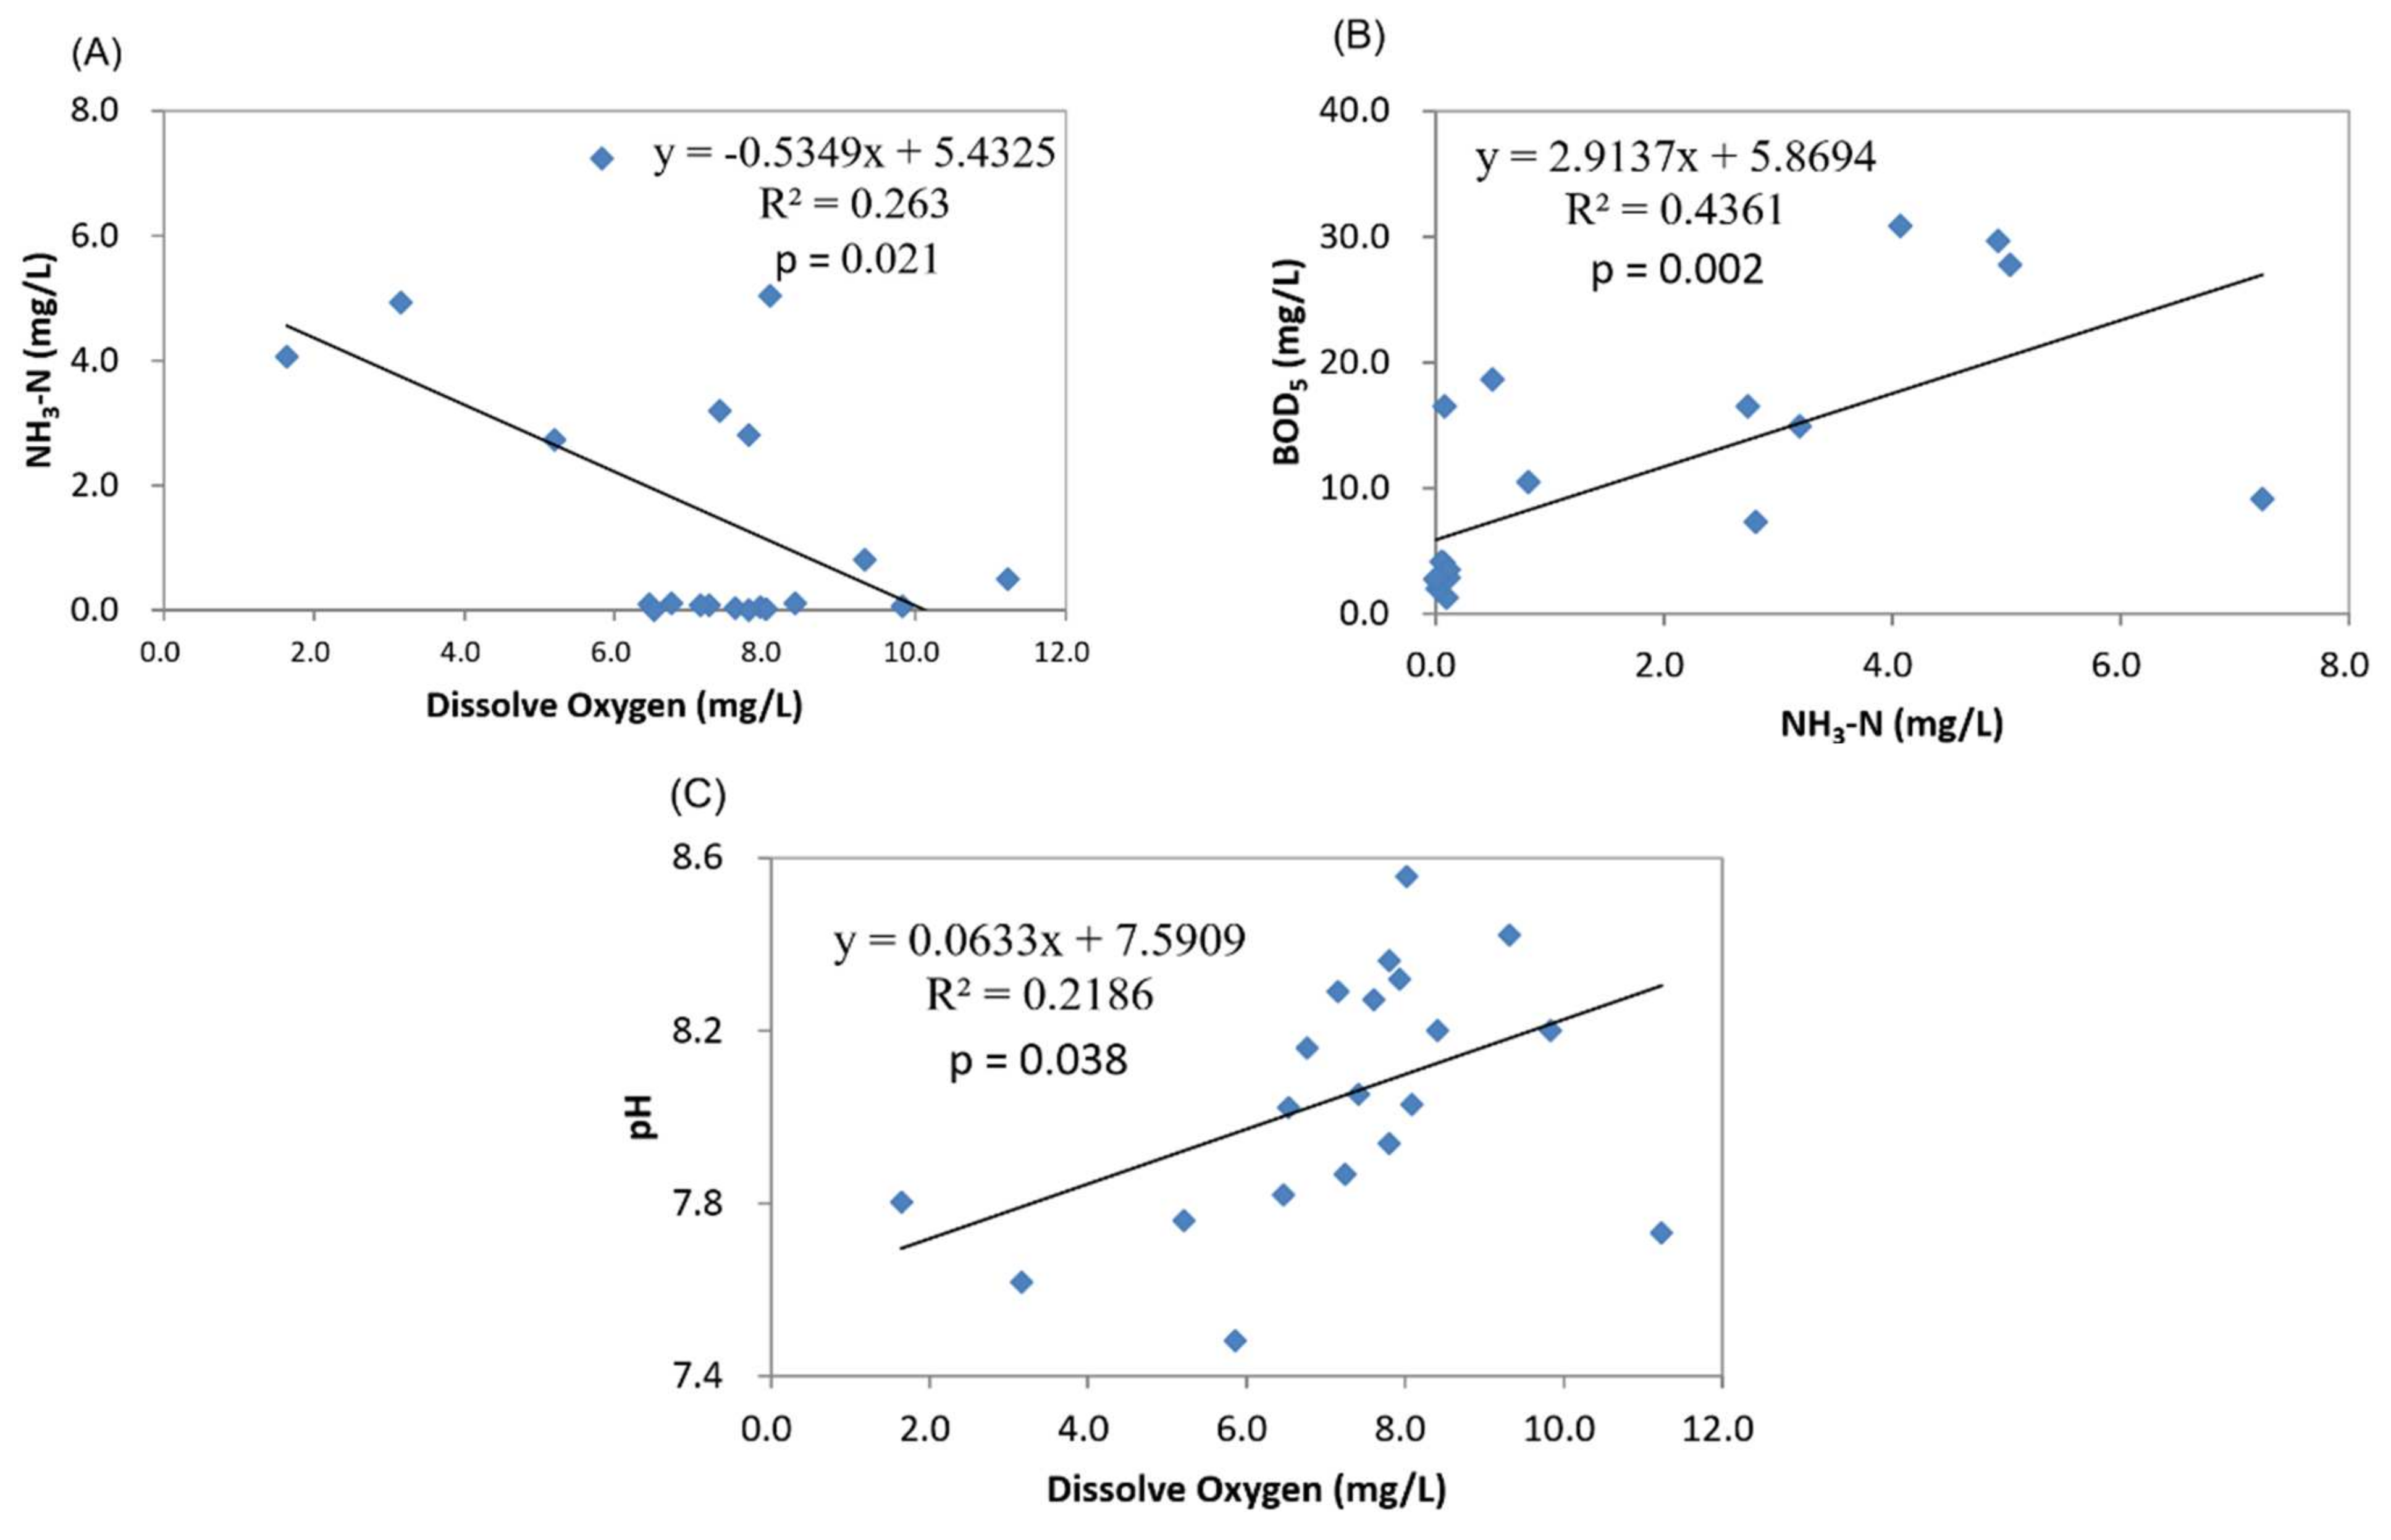
Overall, there were negative correlations between salinity and (1) nutrients and (2) SS (Table 1). This is likely because drops in salinity are associated with influx of land-based freshwater, which can carry high nutrient loads. BOD5 was positively correlated with turbidity, SS, and nutrients (Table 1), including ammonia (Figure 2B). In contrast, ammonia concentration was negatively correlated with DO (Figure 2A), particularly at the stream and outlet sites. Streams and outlet station were particularly affected by rainfall and sewage discharge. In Table 1, total counts of coliform bacterial (TCB) showed no correlation with any of water parameters measured in this survey, which seemed to discount the impact of sewage. However, most of the seasons displayed high counts of coliform bacteria (median values = 4.88 × 10³ colony-forming units (cfu)/100 mL, n = 20) in the water samples collected from the streams and outlet station. Due to lack of long term data on TCB, more information is required to explain this phenomenon. At the Kenting outlet station, a high BOD5 value was measured alongside a DO saturation of 139%; this could be evidence for high concentrations of phytoplankton and/or dense of coral population (which would provide oxygen at high concentrations via photosynthesis). In addition, there was a significant positive correlation between DO and pH (Figure 2C); this was likely driven by photosynthesis, which would increase the pH.
After normalizing the data, sensu [16], the first two principal components explained 43% of the variation (Table 2). PC1 loadings (Table 3) were dominated by silica, nitrate, and salinity (negatively correlated with silica & nitrate), with DO and O2 saturation featuring the highest loadings within PC2 (16.8% of the variance). In the rotated component matrix (Table 4), the total variance explained by components 1, 2, and 3 for spring were 22, 18, and 15%, respectively, and the dominant seawater quality parameters were turbidity, DO, salinity (negatively correlated with silica), and two nutrients (N, P). The negative relationship between silica and salinity was likely due to rainfall [3]. This finding was also consistent with the impact of rainfall on the water quality of coral reef [17,18,19], especially from agriculture land [20]. The nutrient influx along with rainfall would be a significant factor to deteriorate coral health [17]. Summer (34, 17, and 13% for components 1, 2, and 3, respectively) trends were mainly related to salinity (negatively correlated with N & P), DO, turbidity, and N-based nutrients; with fall (28, 19, and 14%, respectively) ones related to salinity (negatively correlated with silica), DO, nutrients (N, P), and turbidity. Winter (26, 20, and 12%, respectively) trends were driven by DO, salinity (negatively correlated with silica), nutrients (N, P), and turbidity. Wet and dry season trends were mainly related to DO, salinity (negative correlated with silica), turbidity, and nutrients (P, N). Positives loading of PC3 were SS and turbidity, both of which are affected by rainfall, run-off, river discharge, and typhoons [3]. Finally, PC4 featured positive loadings of phosphate, nitrite, and ammonium (i.e., likely anthropogenic pollutants). Based on the PCA, the wet season water quality was distinct from that of the dry season.
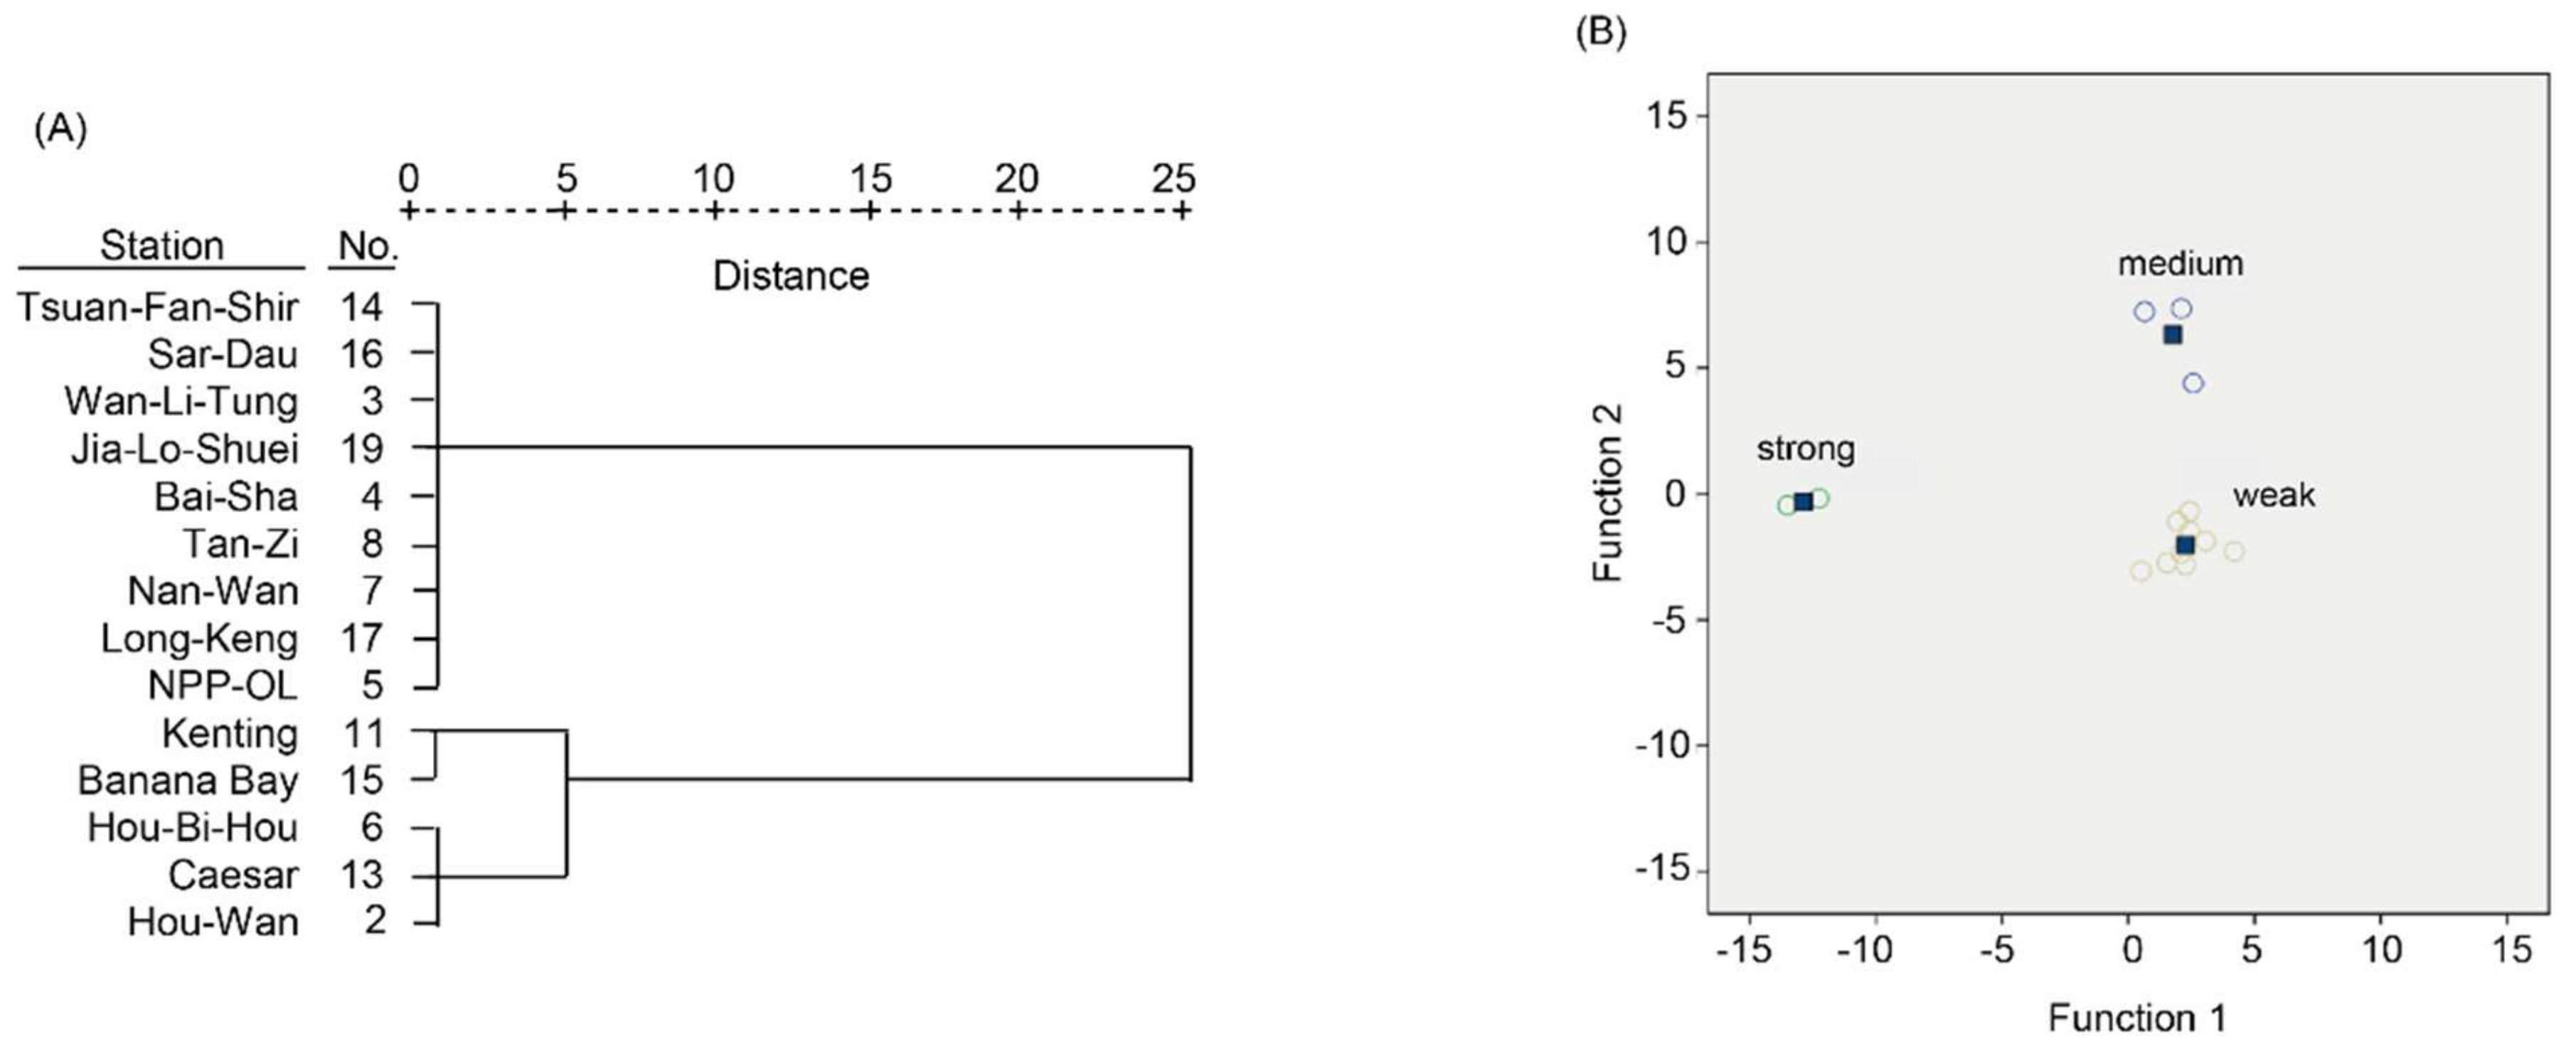
CA was also used to assess similarity across sampling sites, and three clusters were identified (Figure 3A); these clusters were supported by a discriminant analysis (i.e., CCA; Figure 3B and Table 5). Based on the data, the three clusters appear to be linked to anthropogenic impact. The “weak” group (Figure 3B), which featured high salinity and low nutrient levels consisted of Wan-Li-Tung, Bai-Sha, nuclear power plant outlet (NPP-OL), Nan-Wan, Tan-Zi, Tsuan-Fan-Shir, Sar-Dau, and Long-Keng. The “strong” group was characterized by low salinity and high nutrient levels and included Kenting and Banana Bay. The remaining sites fell within the “medium” group (Hou-Wan, Hou-Bi-Hu, Caesar, and others). Thirteen of the fourteen groups were classified correctly by the corresponding model (Table 6); Banana Bay was incorrectly classified, possibly due to its low salinity. In summary, then, we documented higher anthropogenic nutrient input in the summer rainy season, and study sites clustered by degree of nutrient loading. Those sites near major freshwater discharge areas were particularly affected by high nutrient loads.

4. Conclusions

The results of PCA indicated anthropogenic-nutrient-input from household waste water discharge were main pollution impact to the seawater quality of Kenting reef area in the past 20 years, especially in the rainy season of summer. CA and DA further revealed the strong nutrient impact was confined to the sampling sites with local discharge outlets after analysis with 14 sampling sites. With the increasing tourism pressure to KNP, tourist number control, waste water treatment and increase of land protection facility are the urgent concern to reduce and further the anthropogenic impact to the coral reef ecosystem in KNP.

Supplementary Materials

The following supporting information can be downloaded at: https://www.mdpi.com/article/10.3390/jmse10020270/s1, Supplementary Data for Figure 2, Table 2 and Table 3.

Author Contributions

Conceptualization, C.-C.C., J.-T.W. and P.-J.M.; methodology, P.-J.M.; software, H.-Y.H. and C.-M.C.; field work and analysis, C.-M.C.; writing—original draft preparation, J.-T.W. and P.-J.M.; writing—review and editing, A.B.M.; supervision, J.-T.W. and P.-J.M.; project administration, P.-J.M.; funding acquisition, P.-J.M. and C.-C.C. All authors have read and agreed to the published version of the manuscript.

Funding

This research was funded by the Ministry of Science and Technology of Taiwan: NSC 92-2621-B-291-004, NSC93-2621-B-291-001, NSC 94-2621-B-291-003, NSC 95-2621-B-291-003-, NSC 95-2611-M-291-004-, NSC 96-2611-M-291-002-, NSC 97-2621-B-291-002-MY3, MOST 106-2611-M-291-006-, MOST 107-2611-M-291-001, MOST 108-2611-M-291-005-, MOST 109-2611-M-259-003-, MOST110-2611--259-002- to PJM and MOST-98-2611-M-003-001-MY3, MOST-101-2611-M-003-003, MOST 107-2611-M-003-001-MY3, and MOST 110-2611-M-003-002 to CCC.

Data Availability Statement

All data are provided in Supplementary Materials.

Acknowledgments

We like to thank the support from the administration of Kenting National Park.

Conflicts of Interest

The authors declare no conflict of interest.

References

  1. Meng, P.J.; Chung, K.N.; Chen, J.P.; Chen, M.H.; Liu, M.C.; Chang, Y.C.; Fan, T.Y.; Lin, H.J.; Liu, B.R.; Chang, C.M.; et al. Long-term ecological monitoring and studies of human activities on the marine ecosystem of Kenting National Park. Bull. Natl. Park 2007, 17, 89–111. [Google Scholar]
  2. Meng, P.J.; Chung, K.N.; Chen, J.P.; Chen, M.H.; Liu, M.C.; Chang, Y.C.; Fan, T.Y.; Lin, H.J.; Liu, B.R.; Chang, C.M.; et al. Long-term ecological monitoring on the marine ecosystem of Kenting National Park. Bull. Natl. Park 2007, 17, 71–88. [Google Scholar]
  3. Meng, P.J.; Lee, H.J.; Wang, J.T.; Chen, C.C.; Lin, H.J.; Tew, K.S.; Hsieh, W.J. A long-term survey on anthropogenic impacts to the water quality of coral reefs, southern Taiwan. Environ. Polutl. 2008, 156, 67–75. [Google Scholar] [CrossRef] [PubMed]
  4. Liu, P.J.; Meng, P.J.; Liu, L.L.; Wang, J.T.; Leu, M.Y. Impacts of human activities on coral reef ecosystems of southern Taiwan: A long-term study. Mar. Pollut. Bull. 2012, 64, 1129–1135. [Google Scholar] [CrossRef] [PubMed]
  5. Lohani, B.N.; Todino, G. Water Quality Index of Chao Phraya River. J. Environ. Eng. 1984, 110, 1163–1176. [Google Scholar] [CrossRef]
  6. Shihab, S. Application of Multivariate Method in the Interpretation of Water Quality Monitoring Data of Saddam Dam Reservoir; Confidential 13; Mosul University: Mosul, Iraq, 1993. [Google Scholar]
  7. Ouyang, Y.; Nkedi-Kizza, P.; Wu, Q.T.; Shinde, D.; Huang, C.H. Assessment of seasonal variations in surfacewater quality. Water Res. 2006, 40, 3800–3810. [Google Scholar] [CrossRef] [PubMed]
  8. Zeilhofer, P.; Lima, E.B.N.R.; Lima, G.A.R. Spatial patterns of water quality in the Cuiabá River Basin, Central Brazil. Environ. Monit. Assess. 2006, 123, 41–62. [Google Scholar] [CrossRef] [PubMed]
  9. Shrestha, S.; Kazama, F. Assessment of surfacewater quality using multivariate statistical techniques: Acase study of the Fuji river basin, Japan. Environ. Model. Softw. 2007, 22, 464–475. [Google Scholar] [CrossRef]
  10. Olsen, R.L.; Chappell, R.W.; Loftis, J.C. Water quality sample collection, data treatment and results presentation for principal components analysis-literature review and Illinois River watershed case study. Water Res. 2012, 46, 3110–3122. [Google Scholar] [CrossRef] [PubMed]
  11. Muangthong, S.; Shrestha, S. Assessment of surface water quality using multivariate statistical techniques: Case study of the Nampong River and Songkhram River, Thailand. Environ. Monit. Assess. 2015, 187, 548. [Google Scholar] [CrossRef] [PubMed]
  12. Pai, S.C.; Yang, C.C. Effects of acidity and molybdate concentration on the kinetics of the formation of the phosphoantimonylmolybdenum blue complex. Anal Chim Acta 1990, 229, 115–120. [Google Scholar]
  13. Pai, S.C.; Yang, C.C. Formation kinetics of the pink azo dye in the determination of nitrite in natural waters. Anal Chim Acta 1990, 232, 345–349. [Google Scholar] [CrossRef]
  14. Pai, S.C.; Riley, J.P. Determination of nitrate in the presence of nitrite in natural waters by flow injection analysis with a non-quantitative on-line cadmium redactor. Int. J. Environ. Anal. Chem. 1994, 57, 263–277. [Google Scholar] [CrossRef]
  15. Pai, S.C.; Tsau, Y.J.; Yang, T.I. PH and buffering capacity problems involved in the determination of ammonia in saline water using the indophenol blue spectrophotometric method. Anal. Chim. Acta 2001, 434, 209–216. [Google Scholar] [CrossRef]
  16. Singh, K.P.; Malik, A.; Mohan, D.; Sinha, S. Multivariate statistical techniques for the evaluation of spatial and temporal variations in water quality of Gomti River (India): A case study. Water Res. 2004, 38, 3980–3992. [Google Scholar] [CrossRef] [PubMed]
  17. Haapkylä, J.; Unsworth, R.K.F.; Flavell, M.; Bourne, D.G.; Schaffelke, B.; Willis, B.L. Seasonal rainfall and runoff promote coral disease on an inshore reef. PLoS ONE 2011, 6, e16893. [Google Scholar] [CrossRef]
  18. Butler, I.R.; Sommer, B.; Zann, M.; Zhao, J.-X.; Pandolfi, J.M. The cumulative impacts of repeated heavy rainfall, flooding and altered water quality on the high-latitude coral reefs of Hervey Bay, Queensland, Australia. Mar. Pollut. Bull. 2015, 96, 356–367. [Google Scholar] [CrossRef] [PubMed]
  19. Fong, C.R.; Gaynus, C.J.; Carpenter, R.C. Extreme rainfall events pulse substantial nutrients and sediments from terrestrial to nearshore coastal communities: A case study from French Polynesia. Sci. Rep. 2020, 10, 2955. [Google Scholar] [CrossRef] [PubMed] [Green Version]
  20. Packett, R.; Dougall, C.; Rohde, K.; Noble, R. Agricultural lands are hot-spots for annual runoff polluting the southern Great Barrier Reef lagoon. Mar. Pollut. Bull. 2009, 5, 976–986. [Google Scholar] [CrossRef] [PubMed]
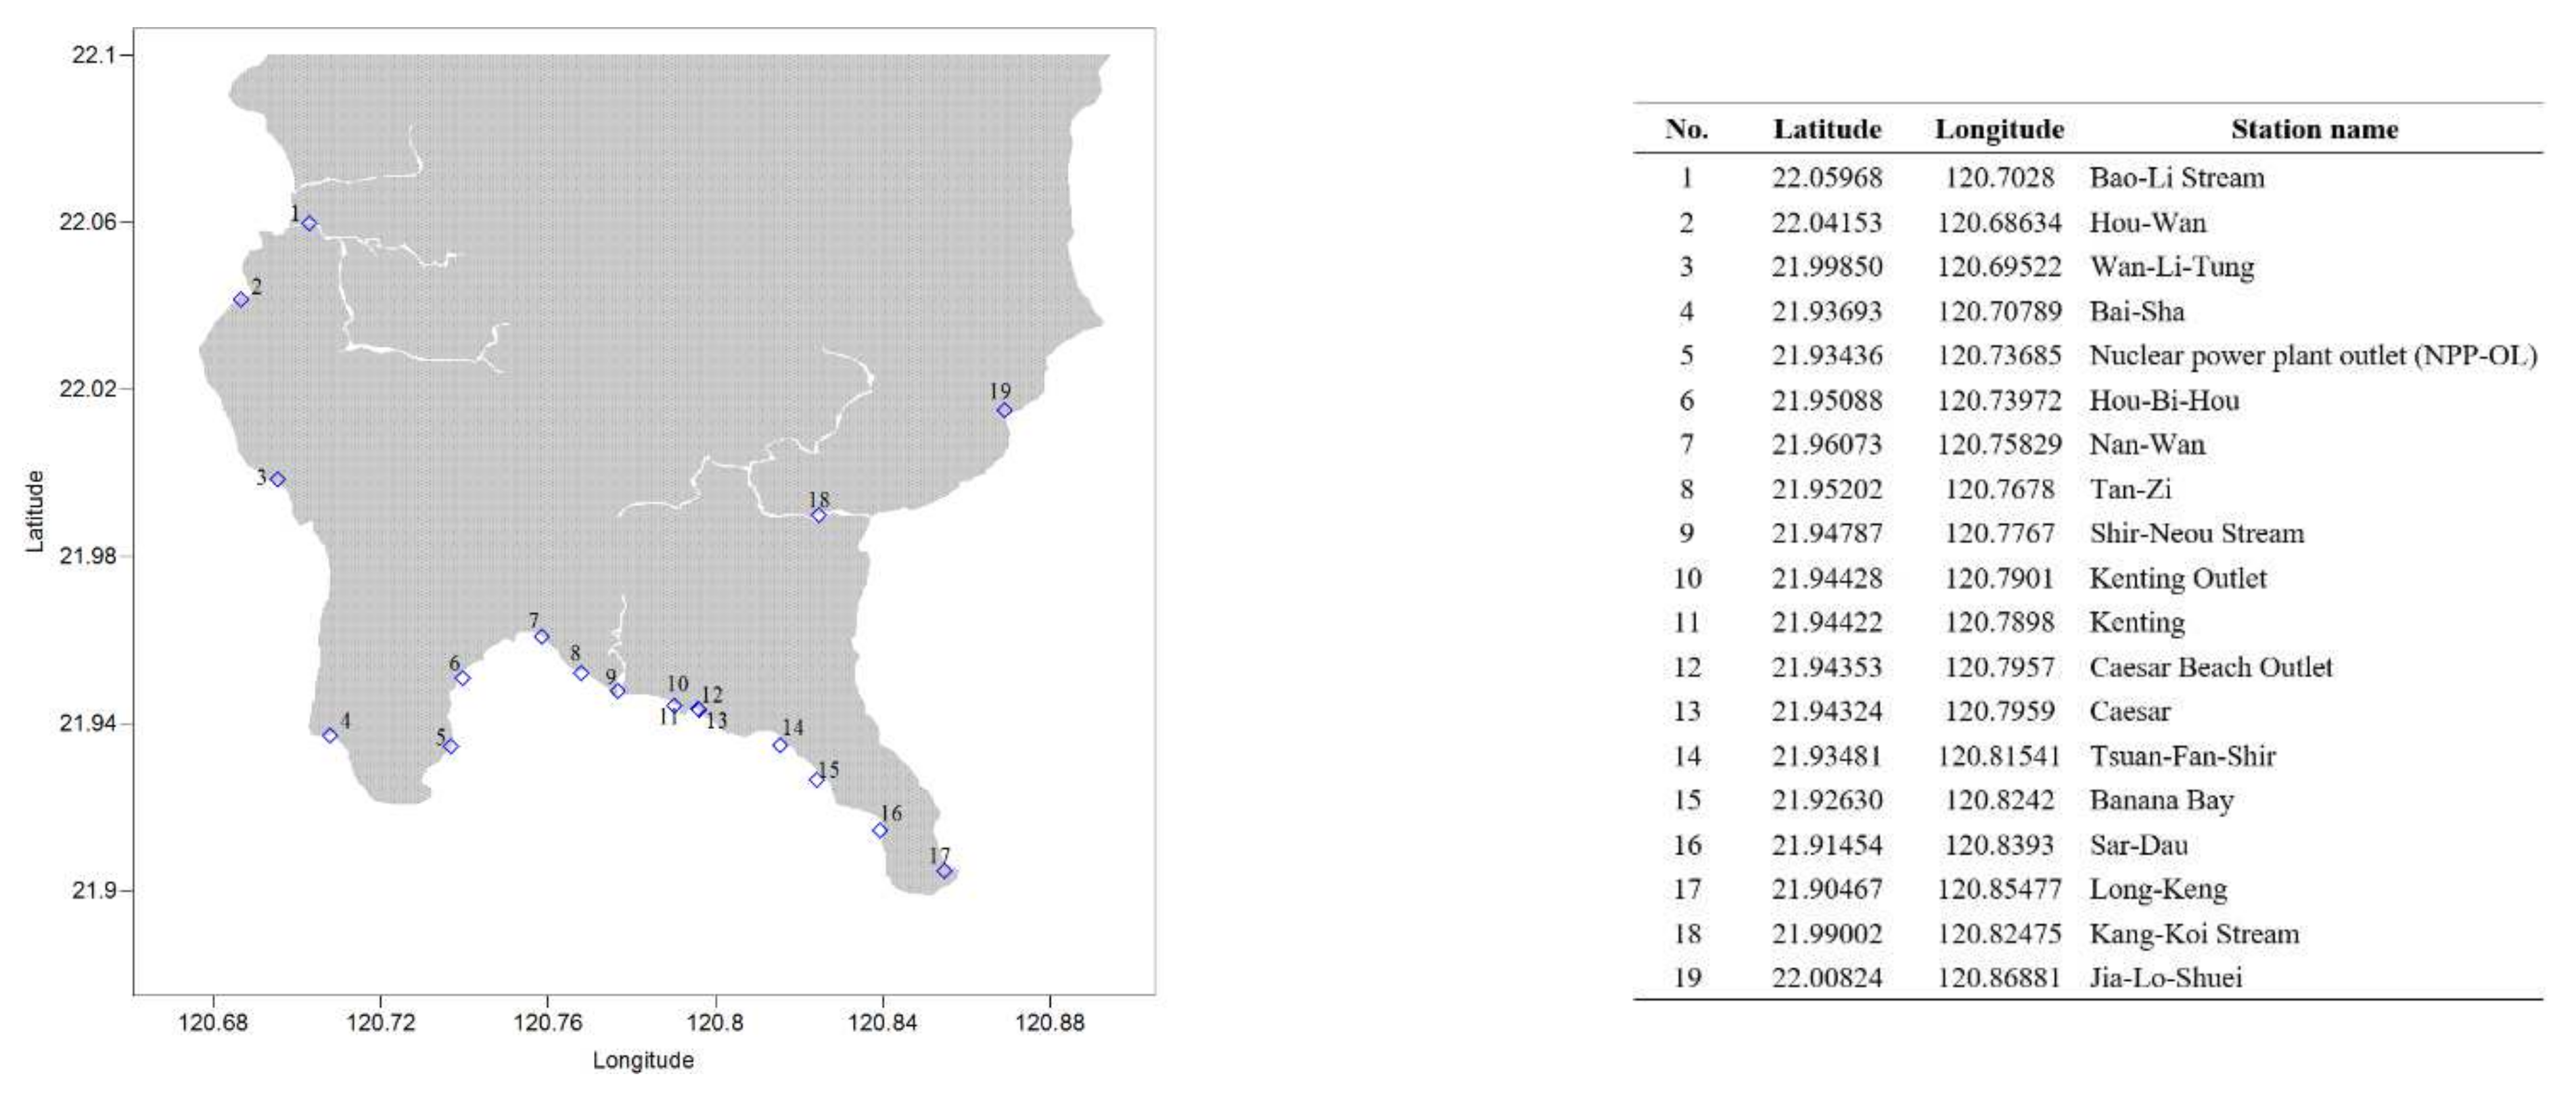
Figure 1. Map of study site and appended table with GPS coordinates.
Jmse 10 00270 g001
Figure 2. Correlations among selected seawater quality parameters across sites. Correlation plots are shown between NH3-N and dissolve oxygen (A), BOD5 and NH3-N (B), and pH and dissolve oxygen (C).
Jmse 10 00270 g002
Figure 3. Hierarchical clustering and canonical correlation analysis of seawater quality data across sites. In the cluster tree (A), relative distances are shown, and in the CCA biplot (B), the mean (centroid) for each group is indicated by a square.
Jmse 10 00270 g003
Table 1. Correlation coefficients (R) among seawater quality parameters. DO: dissolved oxygen; O2 sat.: oxygen saturation; Chl-a: chlorophyll a; SS: suspended sediments; TCB: total coliform bacteria. (*: p < 0.05; **: p < 0.01).
SalinitypHDOO2 sat.BOD5NO3NO2PO4SiO2NH3TurbidityChl-aSS
pH0.03
DO00.182
O2 sat.0.1190.2590.944 **
BOD5−0.2430.126−0.445 **−0.353 **
NO3−0.546 **−0.423 **−0.024−0.142−0.026
NO2−0.501 **−0.135−0.007−0.0670.1130.576 **
PO4−0.585 **−0.088−0.036−0.1120.1880.621 **0.961 **
SiO2−0.915 **−0.1370.07−0.0720.1330.516 **0.335 *0.396 **
NH3−0.487 **−0.183−0.011−0.0970.1130.579 **0.982 **0.955 **0.318 *
Turbidity−0.0980.044−0.302 *−0.220.385 **0.0910.2540.2470.0710.225
Chl-a0.0020.082−0.023−0.0570.208−0.076−0.021−0.024−0.0170.046−0.028
SS−0.327 *−0.031−0.167−0.1510.391 **0.343 *0.688 **0.65 **0.2440.662 **0.814 **−0.01
TCB−0.124−0.112−0.014−0.008−0.0380.204−0.009−0.0310.261−0.0170.090.110.065
Table 2. Total variance explained by PCA.
ComponentTotal% of VariationCumulative %
13.4126.2526.25
22.1816.7843.03
31.5511.9054.93
41.299.9164.84
Table 3. PCA loadings of seawater quality parameters.
Component
1234
Salinity−0.872 −0.190−0.167
SiO20.848 0.1440.156
NO30.781
Dissolved oxygen 0.959
Oxygen saturation 0.958
pH−0.2920.663
SS0.129 0.965
Turbidity0.155−0.1050.961
PO40.122 0.836
NO20.286 0.749
NH3 0.1280.586
BOD50.171 0.134
Chl-a
Table 4. Principal components and total variance explained (%). Sal.: salinity; Nut.: nutrient; DO: dissolved oxygen; N: nitrogen-based nutrients; P: phosphate; Si: silicon.
Component1234
AllSal., Nut. (Si)
(26.25)
DO
(16.78)
Turbidity
(11.90)
Nut. (N, P)
(9.91)
SpringTurbidity
(22.10)
DO
(18.37)
Sal., Nut. (Si)
(14.79)
Nut. (N, P)
(9.86)
SummerSal., Nut. (N, P)
(33.50)
DO
(16.81)
Turbidity
(12.79)
Nut. (N)
(8.44)
FallSal., Nut. (Si)
(27.55)
DO
(18.58)
Nut. (N, P)
(13.80)
Turbidity
(12.11)
WinterDO
(25.62)
Sal., Nut. (Si)
(20.45)
Nut. (N, P)
(11.94)
Turbidity
(9.49)
Dry seasonDO
(27.03)
Sal., Nut. (Si)
(17.62)
Turbidity
(13.14)
Nut. (N, P)
(10.17)
Wet seasonSal., Nut. (N, Si)
(27.68)
DO
(16.72)
Turbidity
(12.60)
Nut. (N)
(9.14)
Table 5. Canonical correlation analysis.
CanonicalEigenvalue% of VarianceCumulative %Canonical Correlation
135.28371.171.10.986
214.34628.91000.967
Test ofWilks’ lambdaChi-squaredfp-value
function(s)
1 through 20.00253.73912<0.01
20.06523.2125<0.01
Table 6. Confusion matrix of classification results. In total 13 or 14 samples were correctly classified by the model.
Cluster Case NumberPredicted Group MembershipTotal
MediumStrongWeak
Training modelActualmedium3003
strong0202
weak0099
%medium10000100
strong01000100
weak00100100
Validation modelActualmedium3003
strong0112
weak0099
%medium10000100
strong05050100
weak00100100
Publisher’s Note: MDPI stays neutral with regard to jurisdictional claims in published maps and institutional affiliations.