1. Introduction
With the long-term development of the marine and shipbuilding industry, people’s maritime activities have penetrated into all aspects of marine production. To ensure the effective conduct of marine production activities, maritime supervision is needed to ensure the safety of maritime activities. In the relevant maritime supervision activities, the main work is to identify the abnormal behavior of the ship. Thus, timely and accurate identification of the abnormal behavior of the ship is a powerful guarantee for the normal navigation of the ship and an effective method to reduce the incidence of maritime and port traffic accidents.
To realize the effective monitoring of the ship’s navigation state, the relevant government departments have established a ship traffic service monitoring system in marine environments. However, this monitoring system does not have the ability to identify abnormal behaviors, and the processing of ship trajectory information is manually completed. Therefore, the monitoring and management of ships are prone to incomplete and unmeticulous phenomena [
1]. Considering the defects of the traffic service monitoring system, a large number of researchers and engineers have tried to model ship behavior, so as to realize the detection of abnormal behavior. The existing ship anomaly behavior detection methods mainly include clustering analysis, statistical modeling, neural networks, and other anomaly detection methods [
2,
3,
4]. Ma [
5] classified abnormal behavior detection methods according to whether they were data-driven, model-driven, or hybrid-driven [
6,
7].
On clustering-based anomaly behavior detection methods, Liu et al. [
8] proposed an anomaly behavior detection method based on an auxiliary feature vector and a density-based spatial clustering of applications with noise (DBSCAN). Compared with the existing anomaly behavior detection techniques, this method has the ability to accurately identify and distinguish normal data patterns, effective anomalies, and invalid anomalies. Reference [
9] proposed a data flow clustering algorithm based on dimension maximum entropy, and realized the anomaly detection of the data flow by comparing the information entropy size and distribution characteristics of micro-clusters. In view of the multi-dimensional characteristics of ship track features, Zhao [
10] proposed a ship anomaly behavior detection method and recurrent neural network based on DBSCAN, which can detect the anomalies of the multi-dimensional features of ships. However, there are some problems in density clustering, such as the setting of initial parameters, which greatly affects the accuracy of anomaly detection. Wang et al. [
11] improved the DBSCAN algorithm, combined it with the isolated forest algorithm, and selected the internal distribution law of the data set, changing the clustering effect in a large number of unrelated ship distribution data to find abnormalities. Based on the ship anomaly behavior detection method of statistical modeling, Tang [
12] proposed a ship anomaly detection method based on the probabilistic digraph model, which has the ability to detect most ship abnormal behaviors. Wang et al. [
13] used the electronic chart system to collect data for the repeated abnormal behavior of ships in navigation, and used the time-space analysis method and state determination method to process the collected data, so as to detect the trajectory characteristics of the ship. This method has a large amount of calculation in the data collection and analysis process, and the time complexity is high.
In the method based on neural networks, the recurrent neural network (RNN) takes ship trajectory data as the research object, and proposes an application method of ship anomaly behavior detection using a RNN [
14,
15,
16]. However, most of the problems considering the selection of training data are studied. Yang et al. [
17] proposed a ship abnormal behavior detection method based on bi-long short-term memory (LSTM) for ship abnormal behavior recognition and detection. The results showed that the recognition accuracy of the Bi-LSTM model was higher, and the ship abnormal behavior could be found in time. However, there were problems in the selection of model parameters, and the recognition accuracy needed to be improved. Hu et al. [
18] proposed a parallel LSTM-FCN (parallel LSTM-FCN, PLSTM-FCN) model, whose accuracy for multi-dimensional feature ship track prediction is significantly better than that of the traditional recurrent neural network. Liu et al. [
19] proposed a new deep learning model called a bidirectional Gated Recurrent Unit (GRU) and attention mechanism (BGRUA), which can accurately identify web services running on HTTPS connections. BGRUA uses a bidirectional gating loop unit (GRU) and attention mechanism to improve the accuracy of HTTPS traffic classification. Wang et al. [
20] proposed a Bi-GRU-Caps net model based on the attention mechanism to detect the epistasis between composite entities. The attention mechanism aims to focus on the difference between the two composite entities. The experimental results show that the model has high accuracy in the detection of symptoms and corresponding diseases in English and Chinese corpus, which is superior to the traditional method. References [
21,
22,
23] use the characteristics of deep learning and time series to propose a ship trajectory prediction method based on recurrent neural networks—the long–short-term memory (RNN-LSTM) model. With the prediction of the correct ship trajectory, the ship abnormal behavior is judged by the threshold, and the LSTM model is superior to the ability to process sequence data, while the selection of the threshold has a great influence on the results.
There are few studies using neural networks for ship anomaly behavior detection in existing methods. Based on the existing methods, this paper proposes a GRU network model with an attention mechanism. This model uses an intelligent algorithm to optimize the structural parameters and convergence speed of the GRU network, and then constructs a ship abnormal behavior detection model based on the optimized GRU network. The model improves the real-time accuracy of ship abnormal behavior detection and solves the problems of low detection accuracy and long detection time caused by the complex detection methods in the existing methods.
3. Optimize GRU Neural Network
3.1. GRU Network Model
Cyclic neural networks are good at processing time series signals and can accurately obtain the logic between input information. Therefore, it is suitable for the detection of the abnormal behavior of ships. Among them, GRU is an improved variety based on RNN [
24], and its internal structure is shown in
Figure 2.
In Equation (
1), [ ] is to concatenate the matrices in square brackets:
and [11] are concatenated into
. * represents the Hadamard product of the matrix, that is, the element-to-bit multiplication.
is the
function, which scales the data to (0, 1),
is the hyperbolic tangent function, which scales the data to
. Reset gate: determines the degree of discarding the state information of the previous moment—the smaller the
r, the more discarded (the range of
r is
). Update gate: here,
constitutes a forgetting gate (refer to LSTM) to selectively forget the previous state information
, selectively remember the current hidden state information
, and finally get
. The structure diagram of GRU is shown in
Figure 2.
where
and
functions are the following equations:
where
x is the input variable.
Compared with the basic RNN, the GRU has deeper feature extraction and self-learning ability, and has memory mechanism for long-term state information. However, there are problems in the GRU network, such as unstable training and learning results, the complexity of structural parameters, and a poor optimization of initial weights and feature extraction. Therefore, this paper designs a parameter optimization method for the GRU model. The structure parameters of the GRU neural network are optimized based on an intelligent algorithm to improve the convergence speed and accuracy of the GRU model.
3.2. GRU Neural Network with Attention Mechanism
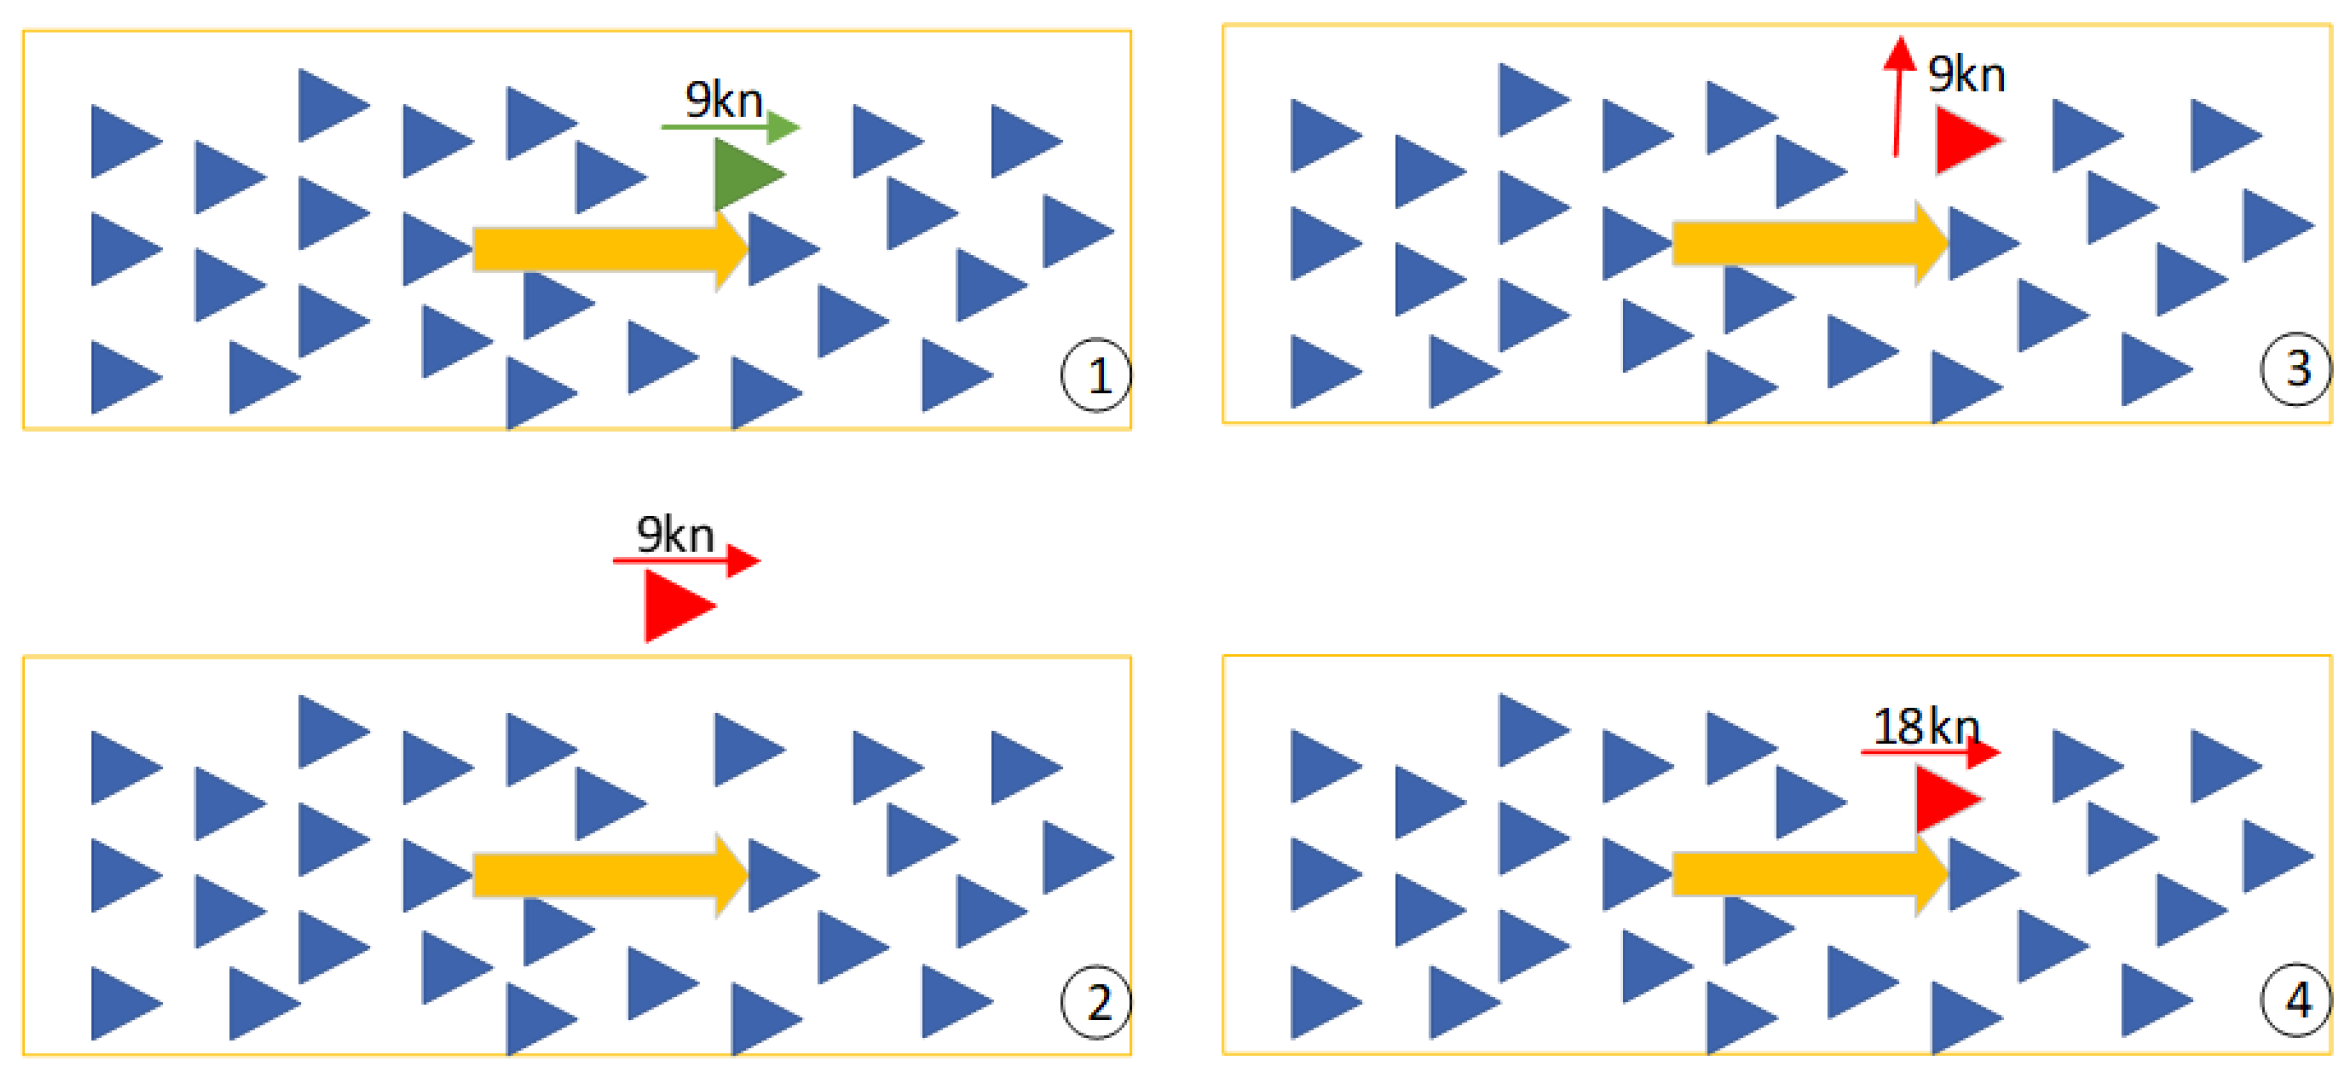
The inspiration for the attention mechanism comes from the human itself. When processing information, the human brain adjusts the distribution of brain attention according to knowledge and experience to improve efficiency. Therefore, the attention mechanism is an algorithm related to biological attention-allocation mechanisms. Its core idea is to optimize a series of weight parameters, namely to adjust the impact size of each element in the sequence and merge the elements according to the impact size. The weight parameter is similar to the ‘attention’ allocation coefficient, which determines the ‘attention’ assigned to each element. Using mathematical principles, the probability distribution of each element is calculated. A series of weight parameters are obtained to reflect the effect of important elements on the output, so as to overcome the relatively poor ability of extracting temporal relations in RNNs [
25].
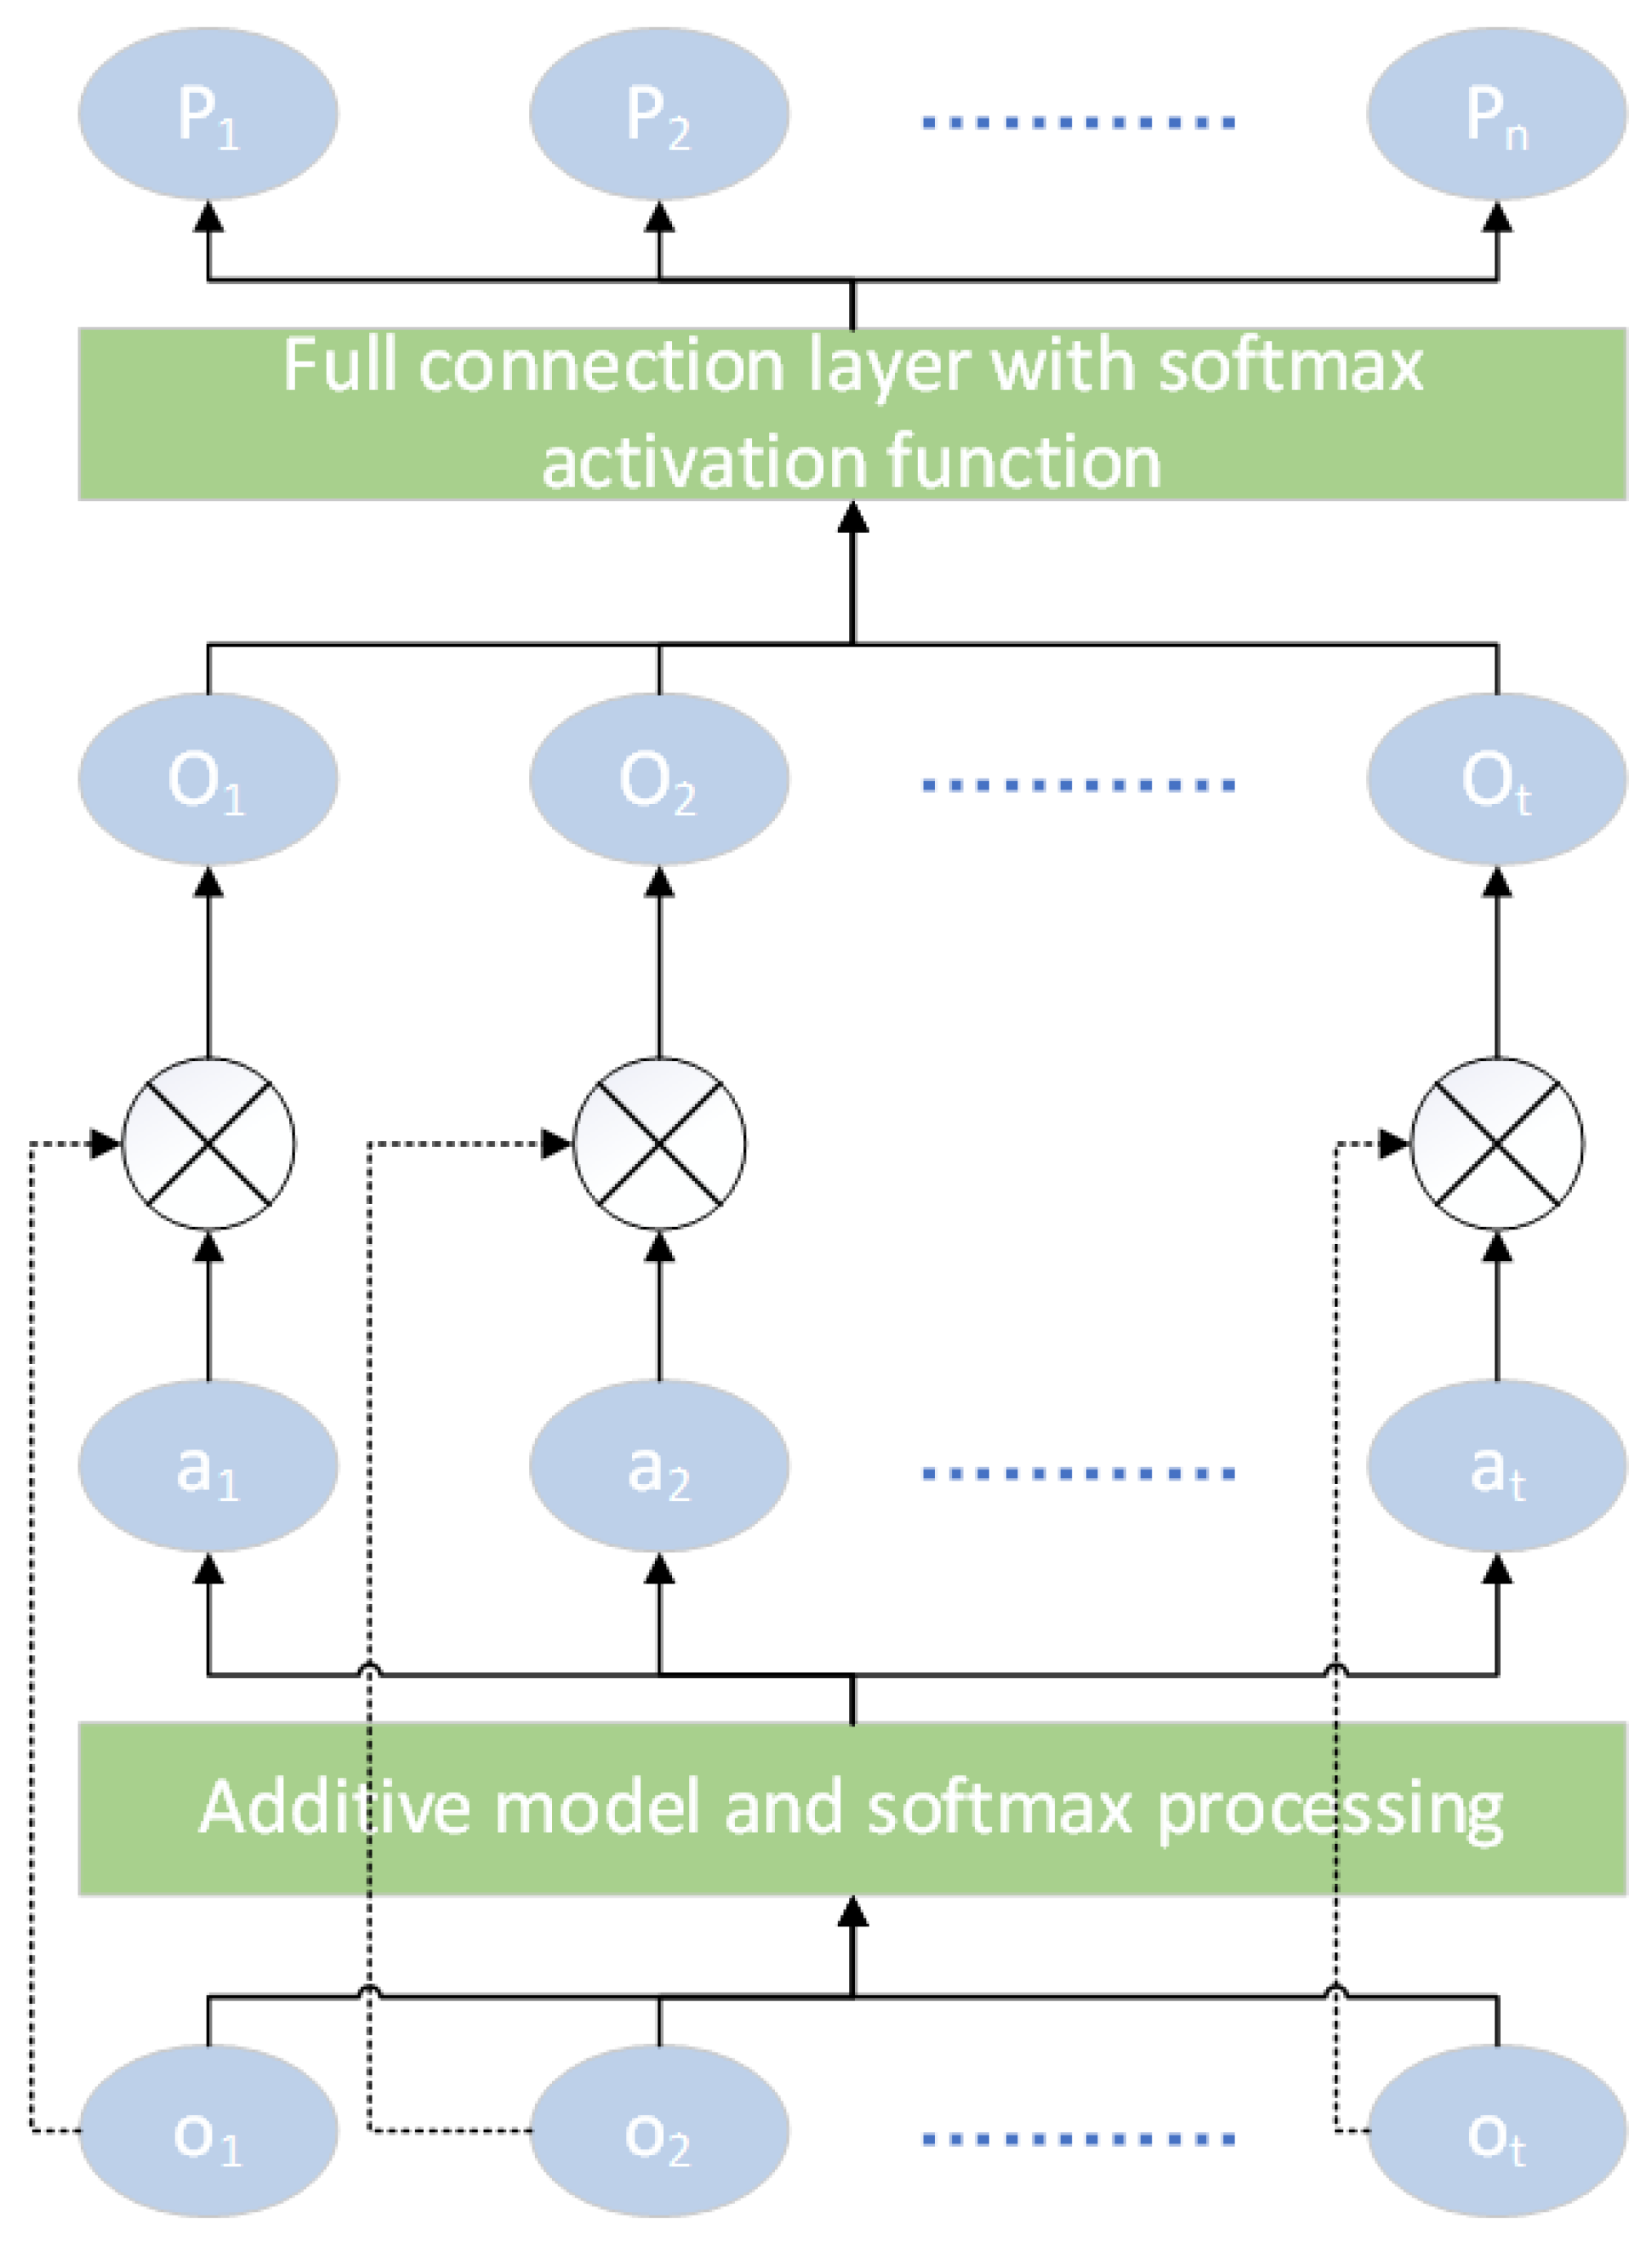
To improve the detection stability of the GRU recurrent neural network, this paper introduces the attention mechanism to calculate the attention probability, so as to highlight the influence of a certain trajectory point on the whole trajectory. For the ship anomaly detection model, adding an attention mechanism increases the association between the front and rear trajectory points. The input of the anomaly detection model is (
). The hidden layer output of the GRU neural network is (
). It can be regarded as the feature capture of each track point. The output of
is set to be
. The attention probability of the attention mechanism is
. The formulation:
where
and
are the trainable weight matrix,
b is the
as vector,
is the additive algorithm, and the output after the attention mechanism is set as
=
.
The detection model needs to classify the types of data. Hence, the model output should be a vector with dimension n. Each dimension represents the possibility of each type, and n represents the classified type. , i is the ith trajectory of the ship data, c is the label type. Therefore, this paper needs to add a full-connected layer with a softmax activation function after the attention mechanism. It will be used as the input of the full-connected layer. After the full-connected layer processing, a vector with dimension n (n is the number of pre-set types) is obtained, and each dimension represents the probability of the type represented by this dimension. The type represented by the dimension, where the maximum probability is located, is taken as the final identified label.
3.3. GA Optimizes GRU Network
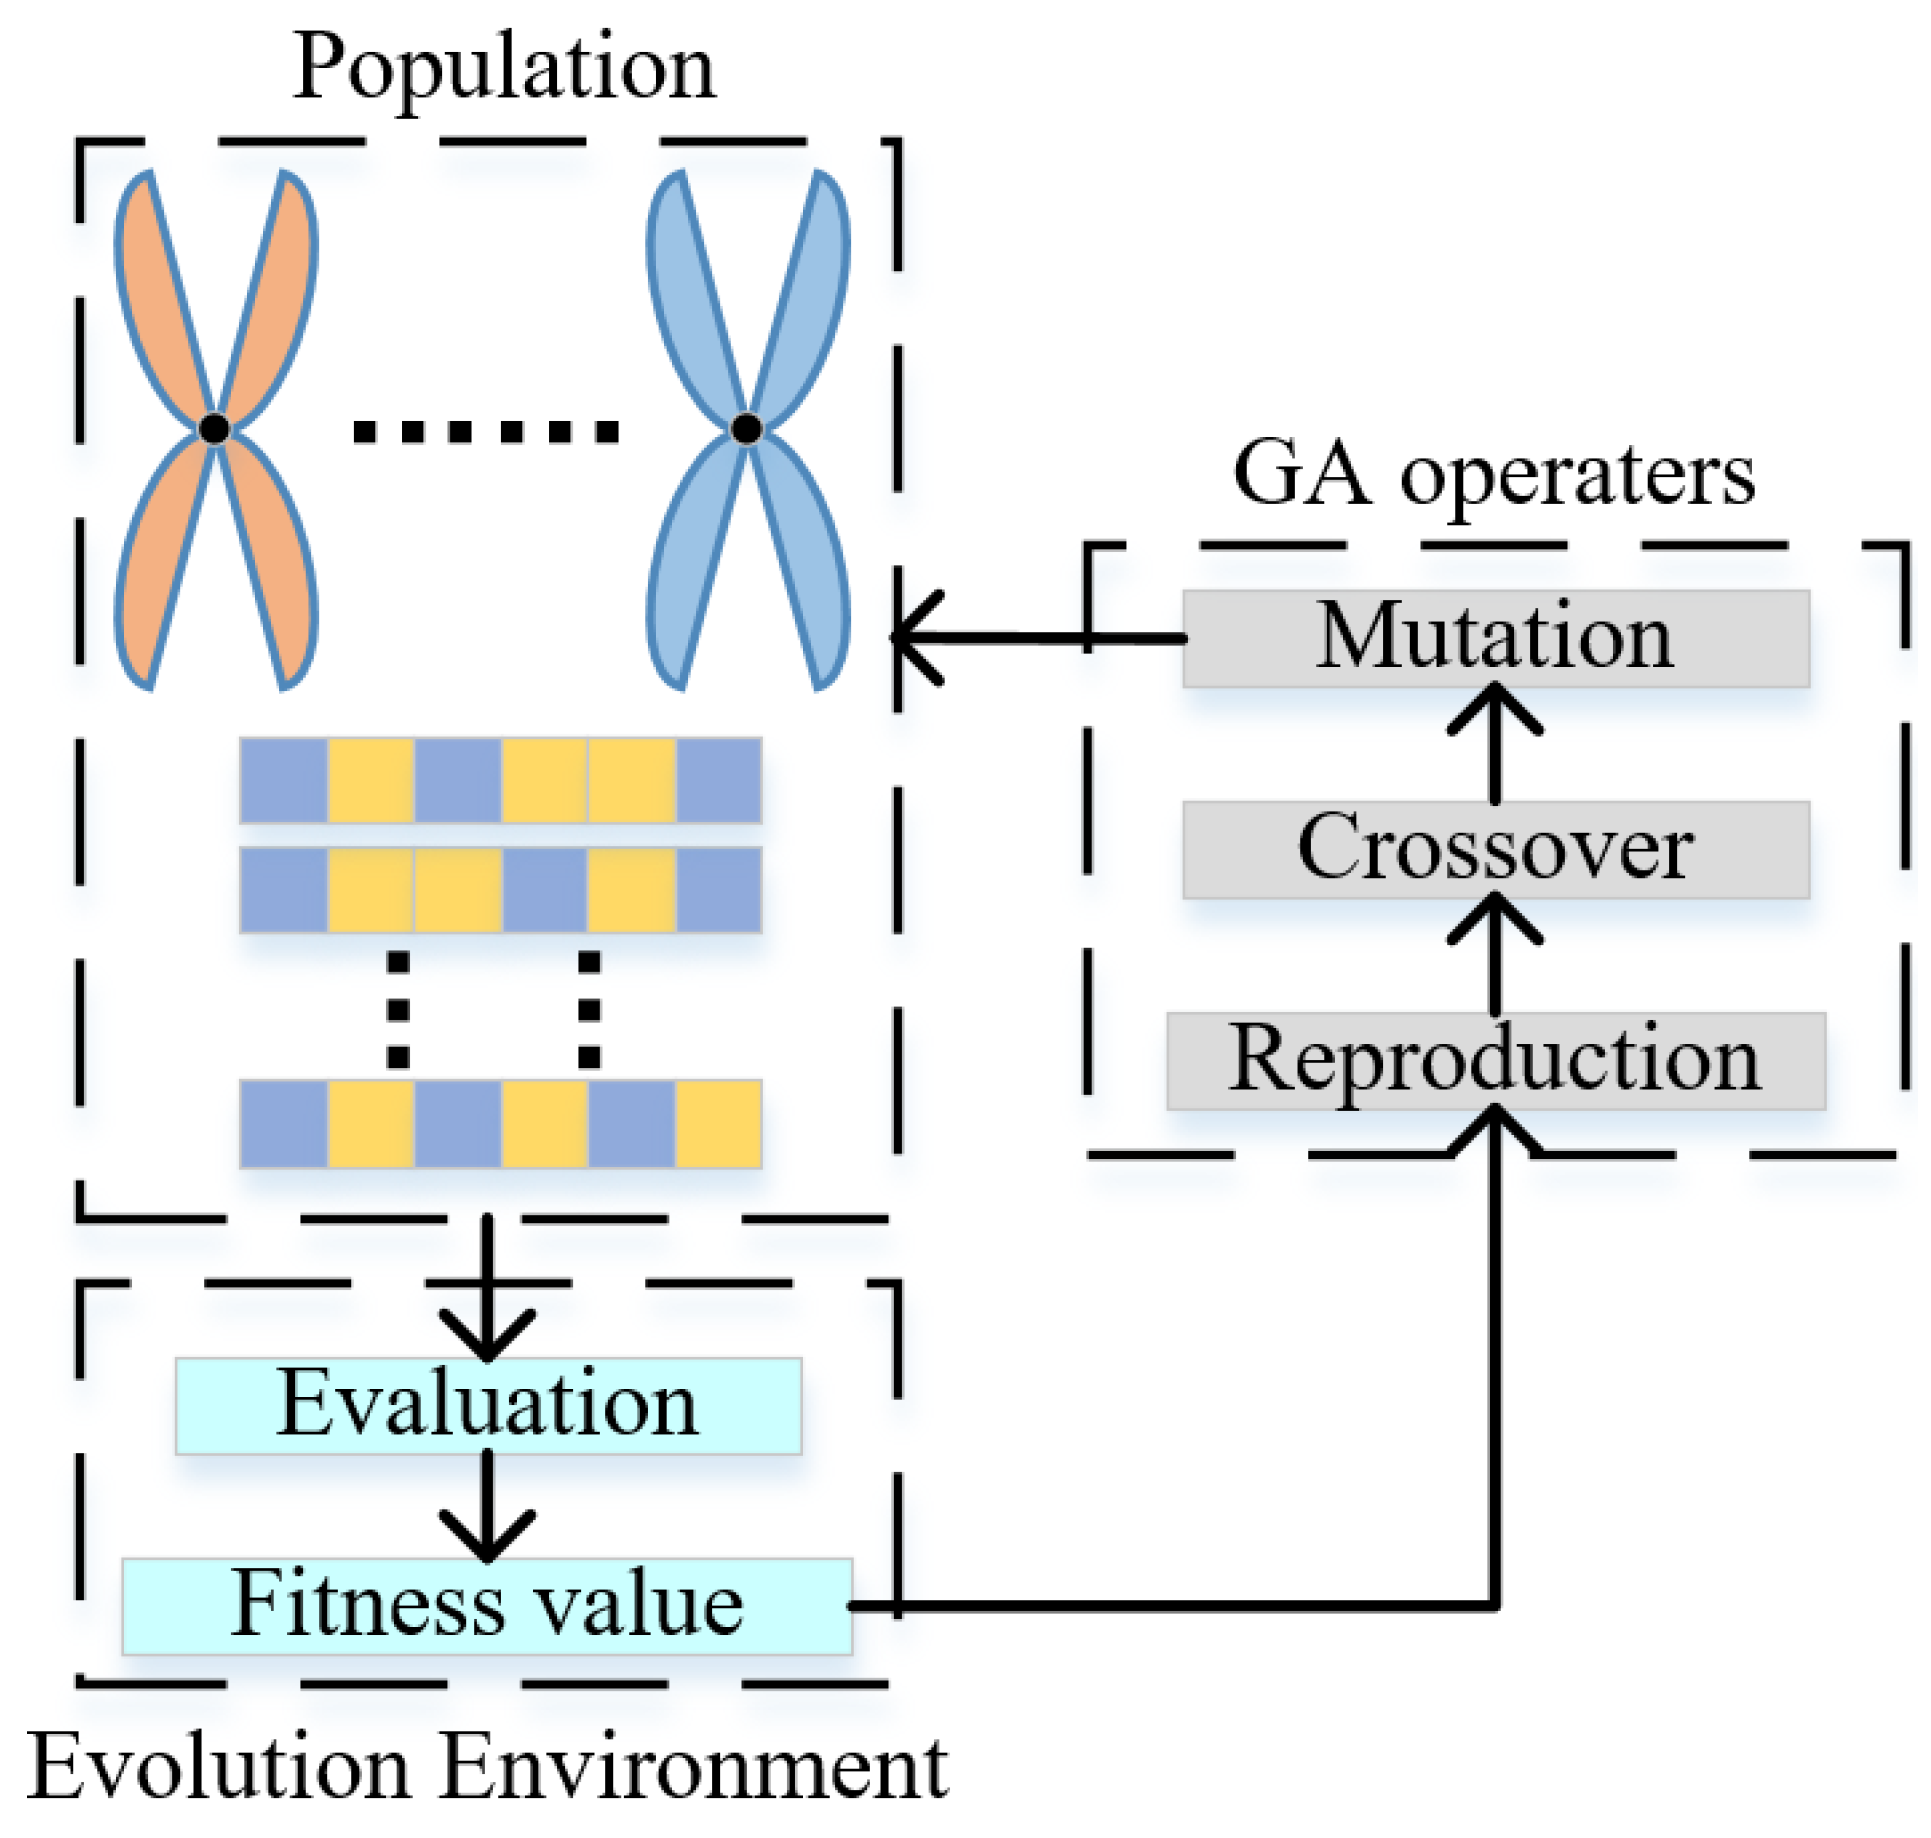
For the parameter optimization problem of the neural network, the key to the evaluation is whether the optimized design can improve the learning ability of the model. The GA (genetic algorithm) is a mature optimization algorithm [
26], which does not rely on the gradient information in the optimization. Therefore, this algorithm is applied to optimize the super parameters of the GRU neural network, including the number of layers and the number of nodes in each layer. The model includes the GRU layer and the full-connection layer to improve the convergence speed and accuracy of the neural network model.
Each chromosome is set to the same length (in this article, we set 2 GRU layers and 2 fully connected layers, plus the first two genes representing the number of layers; thus, each chromosome has genes), and zeros are added after the length requirement is not met.
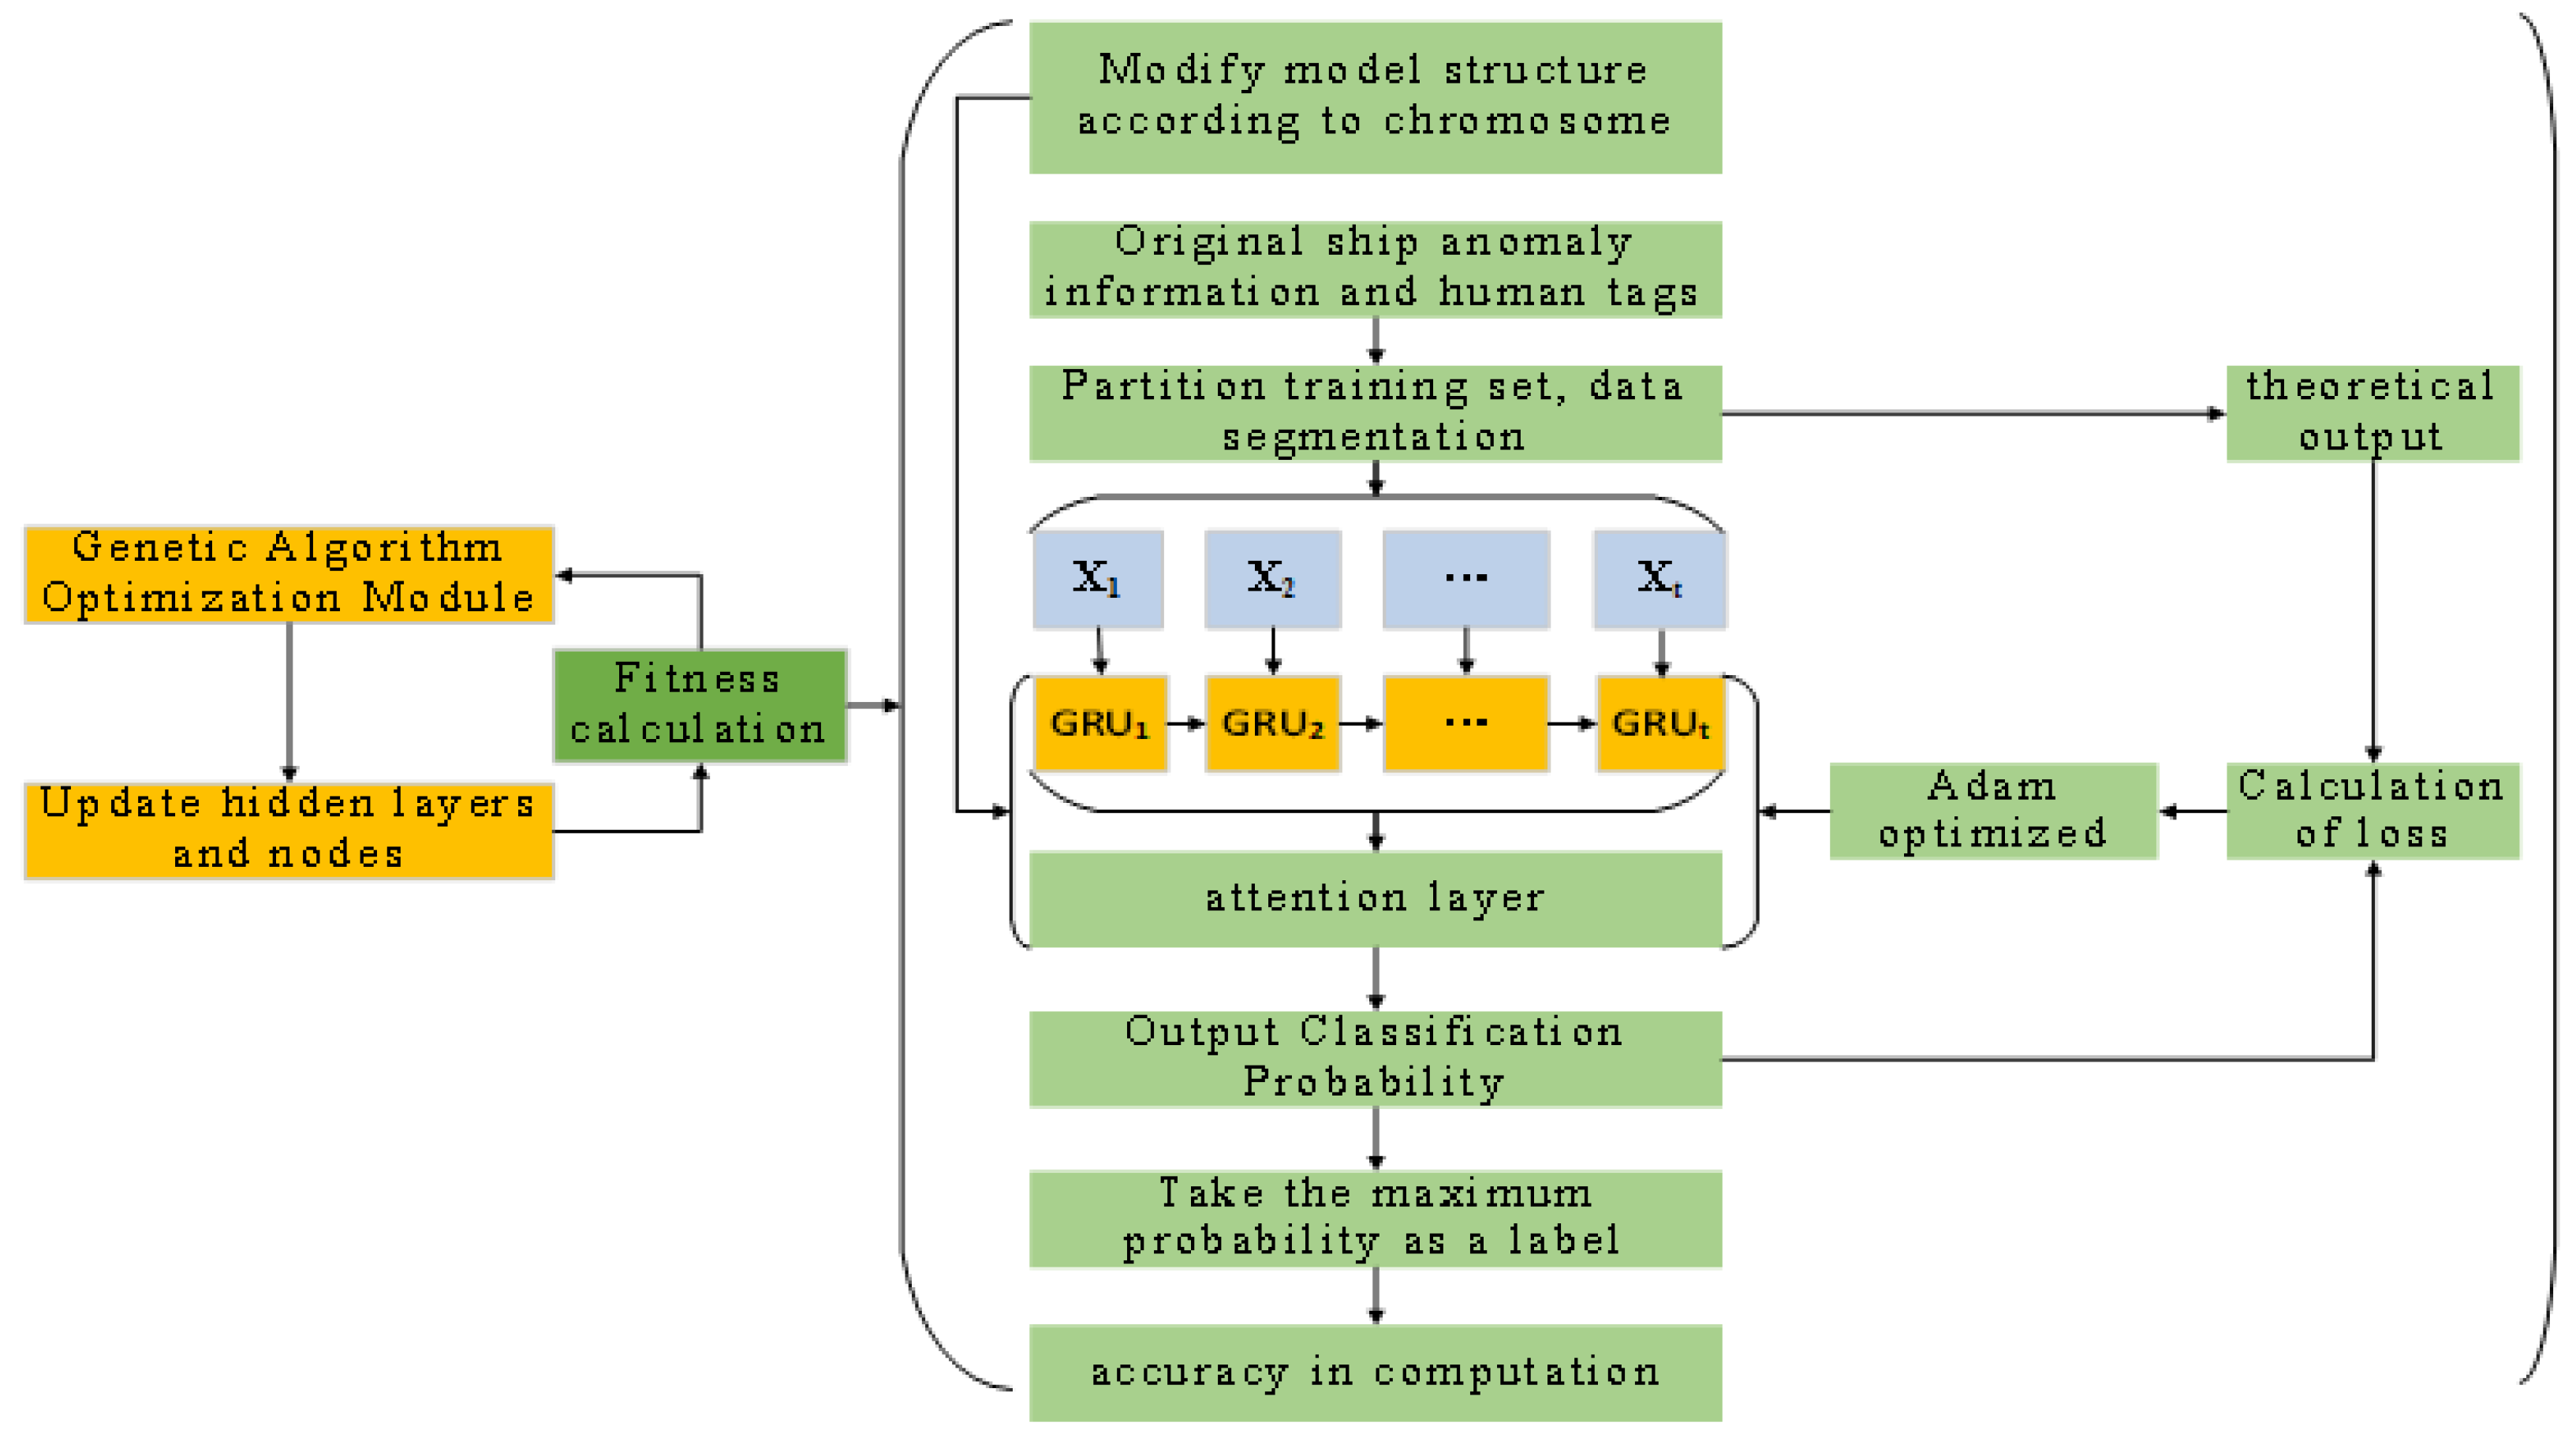
In
Figure 4, the GA algorithm structure is divided into chromosome structure, GA operation, adaptation function. In optimizing neural networks, traditional algorithms are not easy to implement. The following methods are used to manage the complications:
First, set the first two genes. Thus, their ranges are between one and three. Then, determine the following genes related to the number of neurons in each layer according to these two genes;
For the modification of the crossover function, first determine the positions that need to be exchanged on the two extracted chromosomes (set as ‘a’ chromosome and ‘b’ chromosome), and then traverse the genes of the two chromosomes at these positions. If the gene is 0 or the gene to be swapped is about the number of layers, the swap at this position is canceled;
For the modification of the variogram, only the genes related to the number of neurons mutate, and the genes related to the number of layers do not mutate.
Parameter settings: population
C, selection probability
, crossover probability
, mutation probability
, and iteration number
T. We randomly selected and repeatedly randomly sampled
C populations from
C populations to perform population initialization operations. Here, the roulette method is used for selection. The selected population is formed into the initial population. Then, the crossover operation is performed, and the crossover occurs when the random number is less than the crossover probability. We selected a population from
C populations for crossover. Next, the mutation operation is performed, and the mutation operation is only for the last 6-bit parameters. Finally, within the number of iterations, the fitness function of the population is calculated according to Equation (
6):
where
is the fitness function,
is the fitness of each chromosome,
is the largest fitness in the chromosome,
is the average fitness of each chromosome, and
is
.
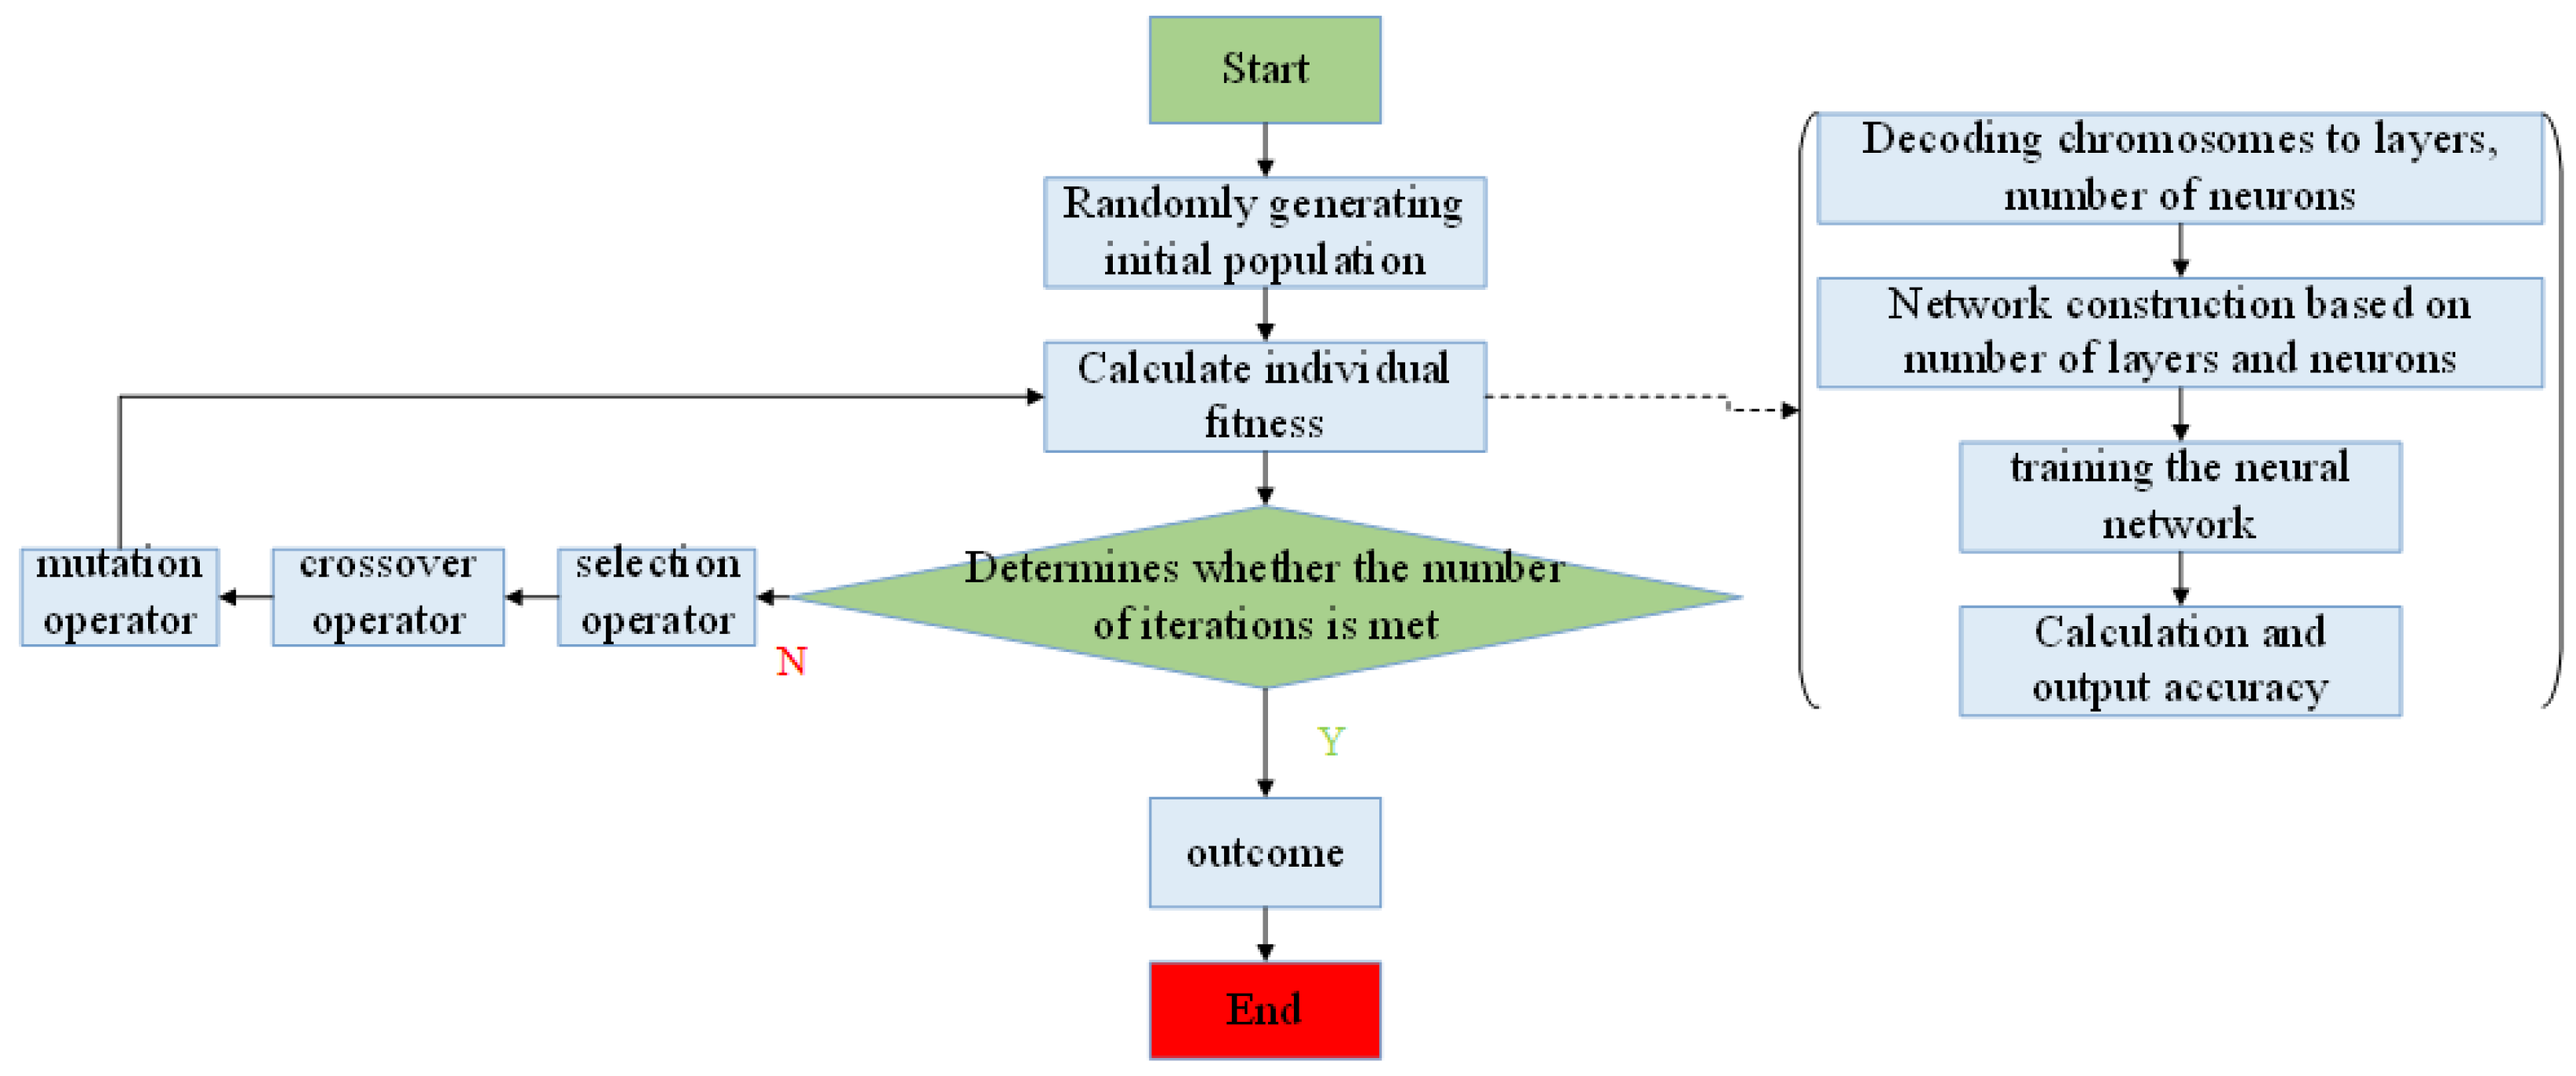
In the experiment, when the neural network layer number of the model is four, the output result is the best. According to the characteristics of ship abnormal behavior detection, the number of layers of the neural network is four layers, and the number of nodes in each layer is between . The genetic algorithm coding in this paper is not a binary coding, but a one-dimensional array composed of various parameters. Each chromosome is a variable of a 10-bit integer. Positions 0 and 1 represent the number of layers, and positions 2–9 represent the number of specific nodes in each layer. The specific implementation steps are described as follows:
According to the network layer number limit, the neuron number limit, and the chromosome coding method, the chromosomes with a certain population number are randomly generated. The specific genotype of the chromosome was decoded, and the model was built according to the layer information and node information obtained by decoding. The data were input to train for a certain number of times to obtain the accuracy of the model after training, and the accuracy was used as the individual fitness index;
According to the calculated fitness, the selection operator is used to select the individuals that are inherited to the next generation. The crossover operator operation is carried out according to the crossover probability to exchange genes for individuals. The mutation operator is calculated according to the mutation rate, and new individuals are mutated;
The fitness of the new population obtained by Step2 is calculated. The various calculation iterations of Step2 are repeated to the optimal individual genotype in the whole process, namely the optimal layer node information. The specific flow chart is shown in
Figure 5:
5. Simulation and Analysis of Ship Abnormal Behavior Detection
5.1. Simulation Data Processing
The GRU neural network simulation in this paper is based on the existing advanced neural network framework TensorFlow2.0. The raw ship data is downloaded from
www.hifleet.com (accessed on 31 May 2021), mainly for general cargo ships and container ships. In our study, a ship enters (or leaves) once as a trajectory. We selected ship data for approximately 70 vessels during the periods 1 March 2021 and 30 March 2021. We first use the ADTK module in Python to process the ship data, so as to obtain the initial abnormal data of the ship. The ADTK module in Python has the function of labeling data. We use the ‘ThresholdAD’ algorithm in the ADTK module. This algorithm can detect the anomaly of input data according to the set threshold. The trajectory points above the threshold are marked as anomalies, which can provide convenience for subsequent research. In this study, according to the ‘COLREGS—international collision avoidance rule’, and the threshold research method adopted by the scholars in reference [
30], we analyzed the threshold of this study area. Finally, based on the empirical threshold, the speed threshold is set to 3.589 kn (when the speed of the ship entering and leaving the port exceeds this threshold, it is a speed anomaly), and the course threshold is set to 8.867° (when the angle deviating from the route exceeds this threshold, it is a course anomaly). In the data preprocessing, the ship’s longitude, dimension, speed, and heading exceeding the threshold in the detection are abnormal. Our research area is the inland navigation section of Nanjing Port (32°10.405 N, 118°51.942 E), as shown in
Figure 8.
In the data processing stage of the early simulation stage, the data is screened for abnormal classification, and the ship data is summarized and classified. The trajectory data segment with abnormal behavior is intercepted, and labels are preset to obtain the data set of the abnormal behavior trajectory of the ship. The abnormal behavior data accounts for 10% and the overall data is divided into a training set (including 20% in a validation set) and a test set in a ratio of 9:1. The training set is used to train the model, the validation set is used to adjust the parameters, and the test set is used to verify the effects of the model. The input format of the GRU neural network is a multi-dimensional matrix. The construction of the ship trajectory input vector is to convert the ship’s AIS trajectory information into a vector form, and each to-be-detected ship trajectory segment is converted into a vector form. Since the ship’s AIS trajectory information itself is the time series, the input vector can be designed directly according to the physical meaning. The characteristics of each ship at a certain moment can be embodied by the latitude, longitude, speed, course, and other information in the AIS information. Therefore, the input information can be designed as a four-dimensional direction, including longitude, latitude, speed, and course information, which is = .
The recurrent neural network has the concept of the number of steps, and the processing information is generally expanded from a vector to a tensor, and the tensor can be regarded as a time series, so this paper combines multiple track points as an input tensor. Based on the duration of abnormal ship behavior, this paper selects the feature states of 20 trajectory points (20 time steps after the ship in the research port and 20 time steps before departure) as the training tensor. In the simulation, the batch size of network training is set to 40, which takes into account the computer operation speed while calibrating the gradient optimization direction of the model. The shape of the multi-dimensional input matrix for this model are in studies [40, 20, 4]. The output is four categories, and the categories are labeled. The normal mark is 0, the position abnormality is marked as 1, the track abnormality is marked as 2, and the speed abnormality is marked as 3.
5.2. Evaluation Index of Anomaly Detection Model
This paper chooses to evaluate the classification effect of ship abnormal behavior detection frameworks by cross entropy. Cross entropy is an important concept in information theory that is mainly used to measure the difference in information between two probability distributions. It depicts the distance between the two probability distributions. Cross entropy can measure the similarity between classification markers and prediction markers. The calculation formula is Equation (
8). The smaller the cross-entropy error index, the more accurate the classification of the anomaly detection.
Besides using a loss function to represent the model performance, this paper also adds the output accuracy of test-set labels as one of the evaluation criteria of the model. Compared with the accuracy of cross entropy, the physical meaning is clearer and more intuitive. If the correct number of predictions is , the total number of test sets is , and the accuracy is , then the greater the detection accuracy of , and the better the final effect of the detection model.
5.3. GRU Neural Network Comparison Simulation
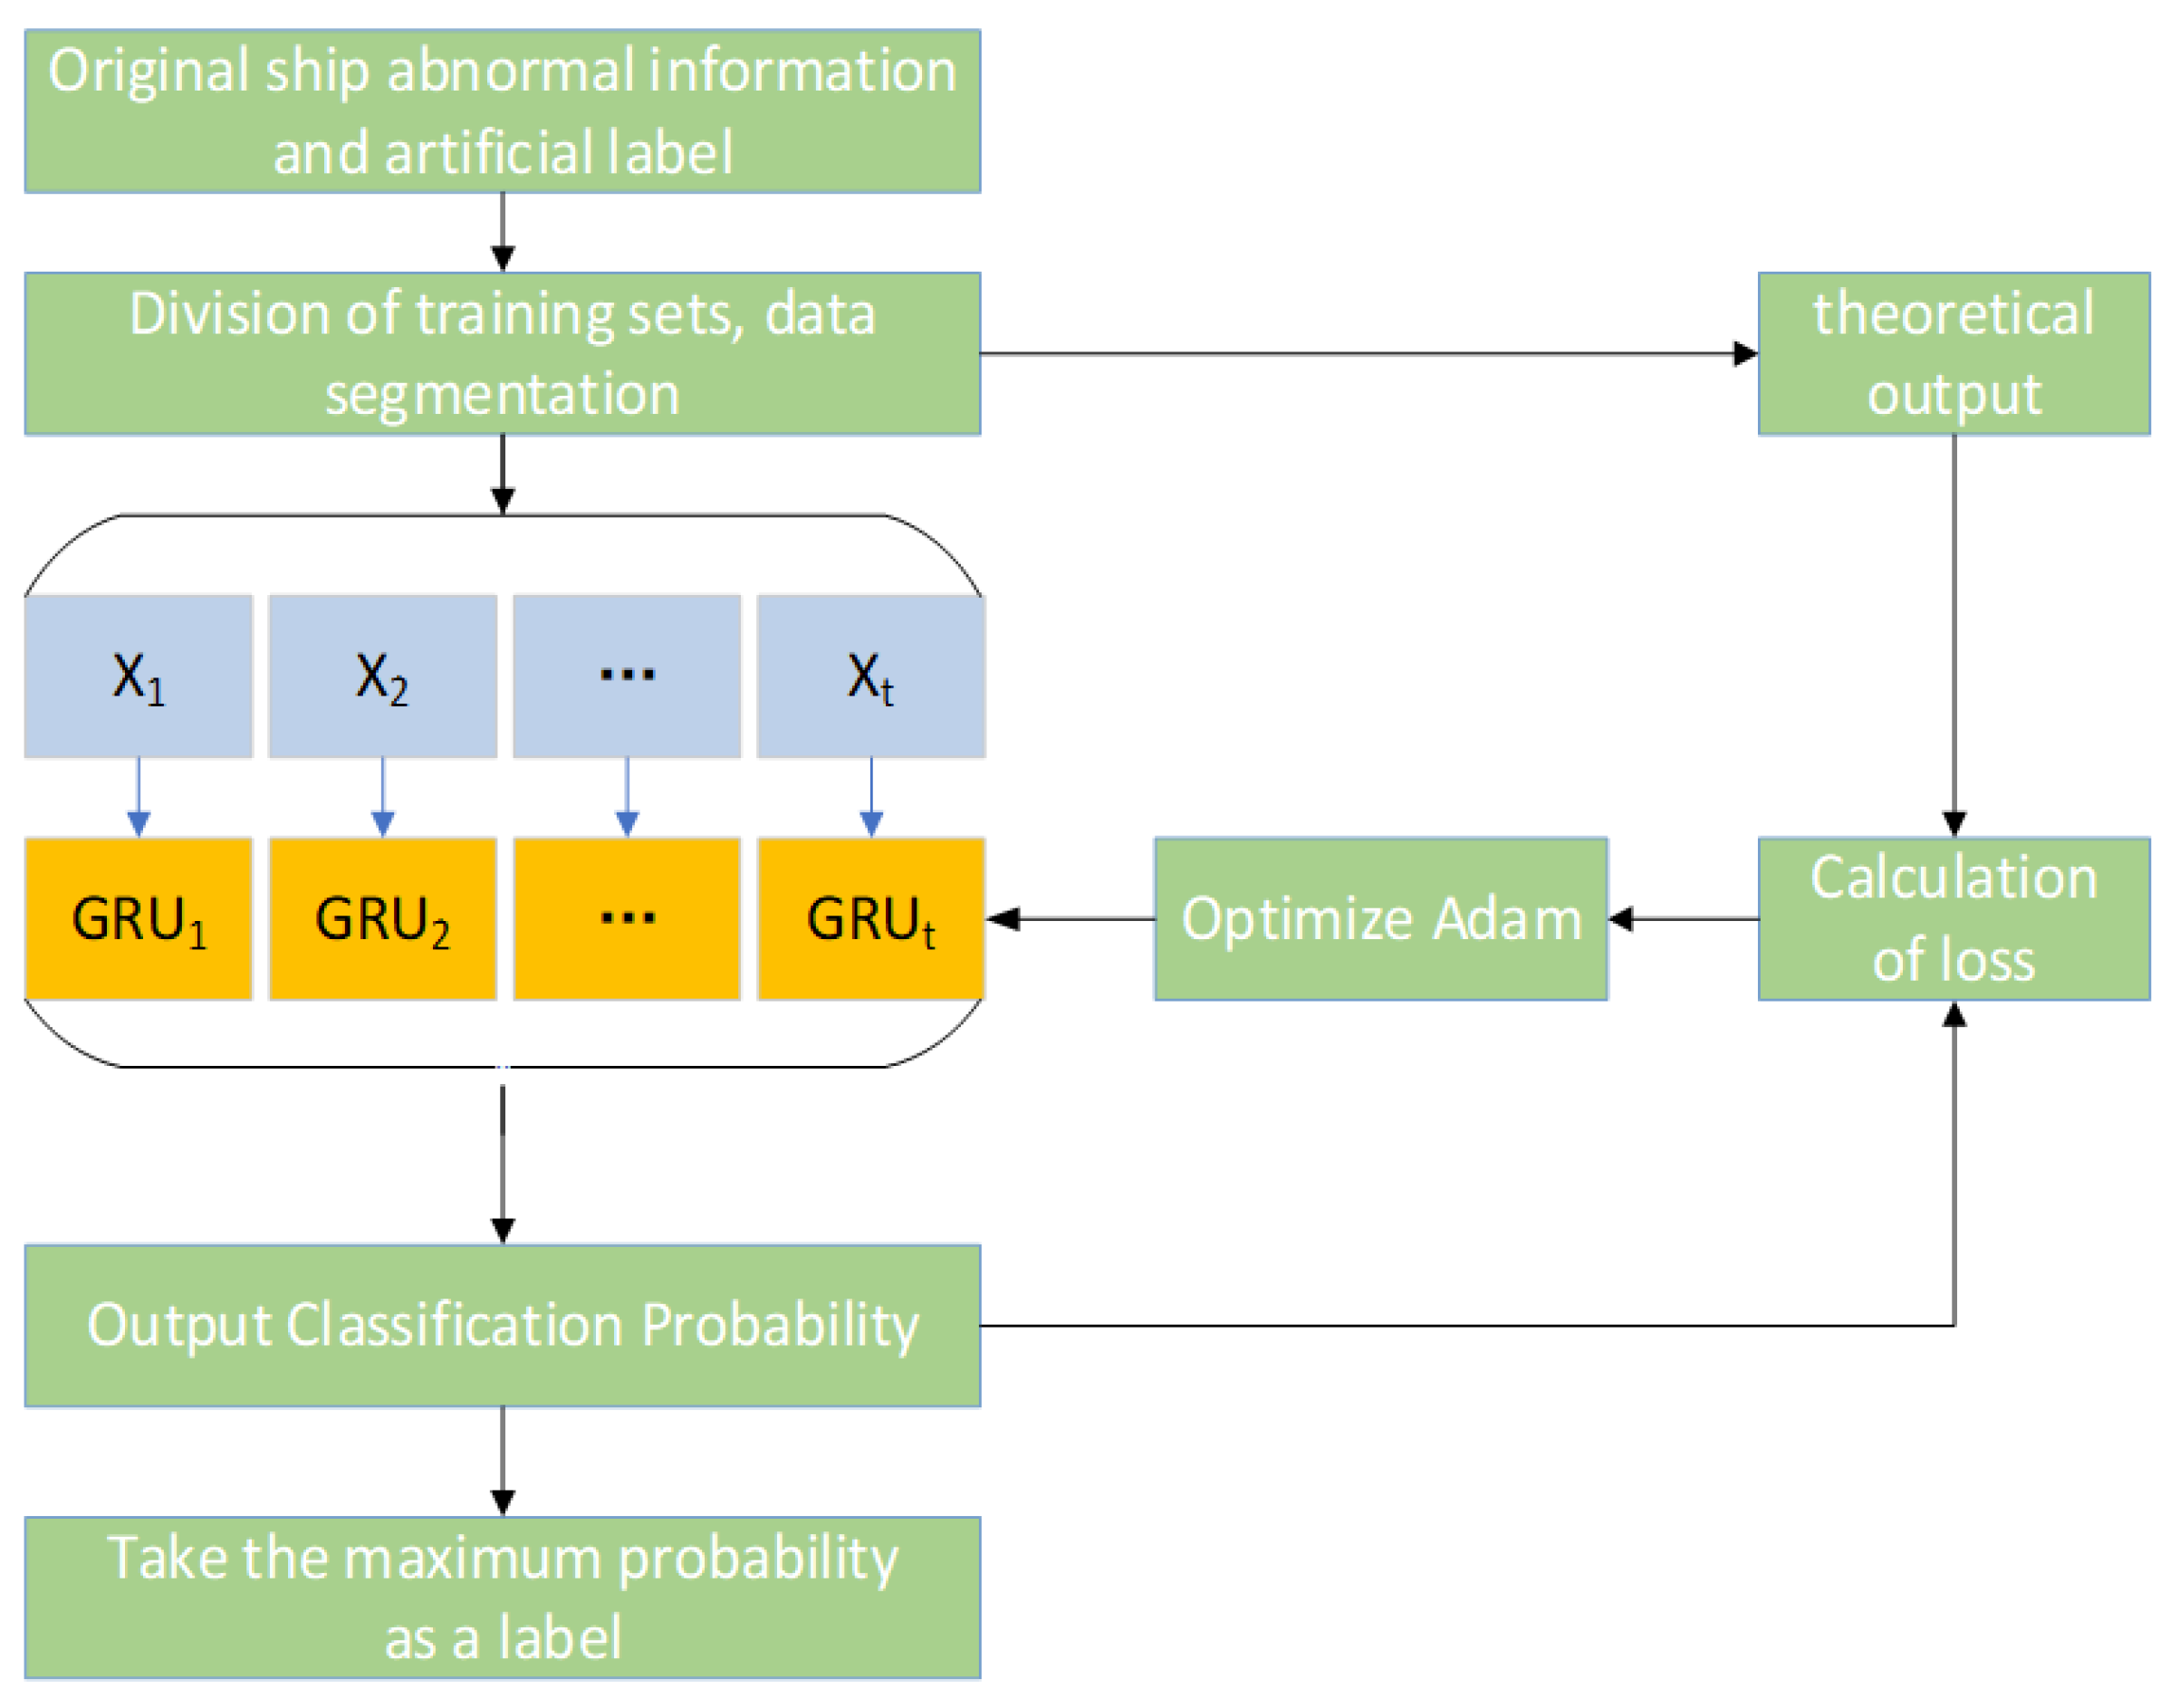
The input part of the GRU model is a fully connected layer. The hidden layer is mainly composed of multiple GRUs superimposed. The output part is a fully connected layer whose output is a vector. The output of the model represents the inferred probability of each label. The basic GRU model selects the hidden layer as a two-layer GRU, and sets the random initial weight seed.
After testing, when the number of nodes is greater than 64, the accuracy drops significantly; as such, this study chooses 64 as the number of hidden layer nodes of the neural network and inputs the prepared AIS data set to train the model. When the number of hidden layer nodes is 64, the recorded result of 200 iterations is shown in
Figure 9. As the number of iterations increases, the accuracy of the test results gradually increases, and the error loss gradually decreases. The final curve tends to be stable, which is in line with the model’s expectations. The final indicator of the detection result of the ship trajectory data of the Jiangsu Nanjing Waterway is connection stable. In this simulation, the average value of the four iterations of the later training curve is selected to represent the final effect. After calculating, the post-average value of the cross entropy of the training set is 0.23, the post-average value of the training set accuracy is 0.905, and the post-average value of the test set accuracy is 0.902, thereby meeting the anomaly detection requirements.
5.3.1. GRU Simulation Analysis with Attention Mechanism
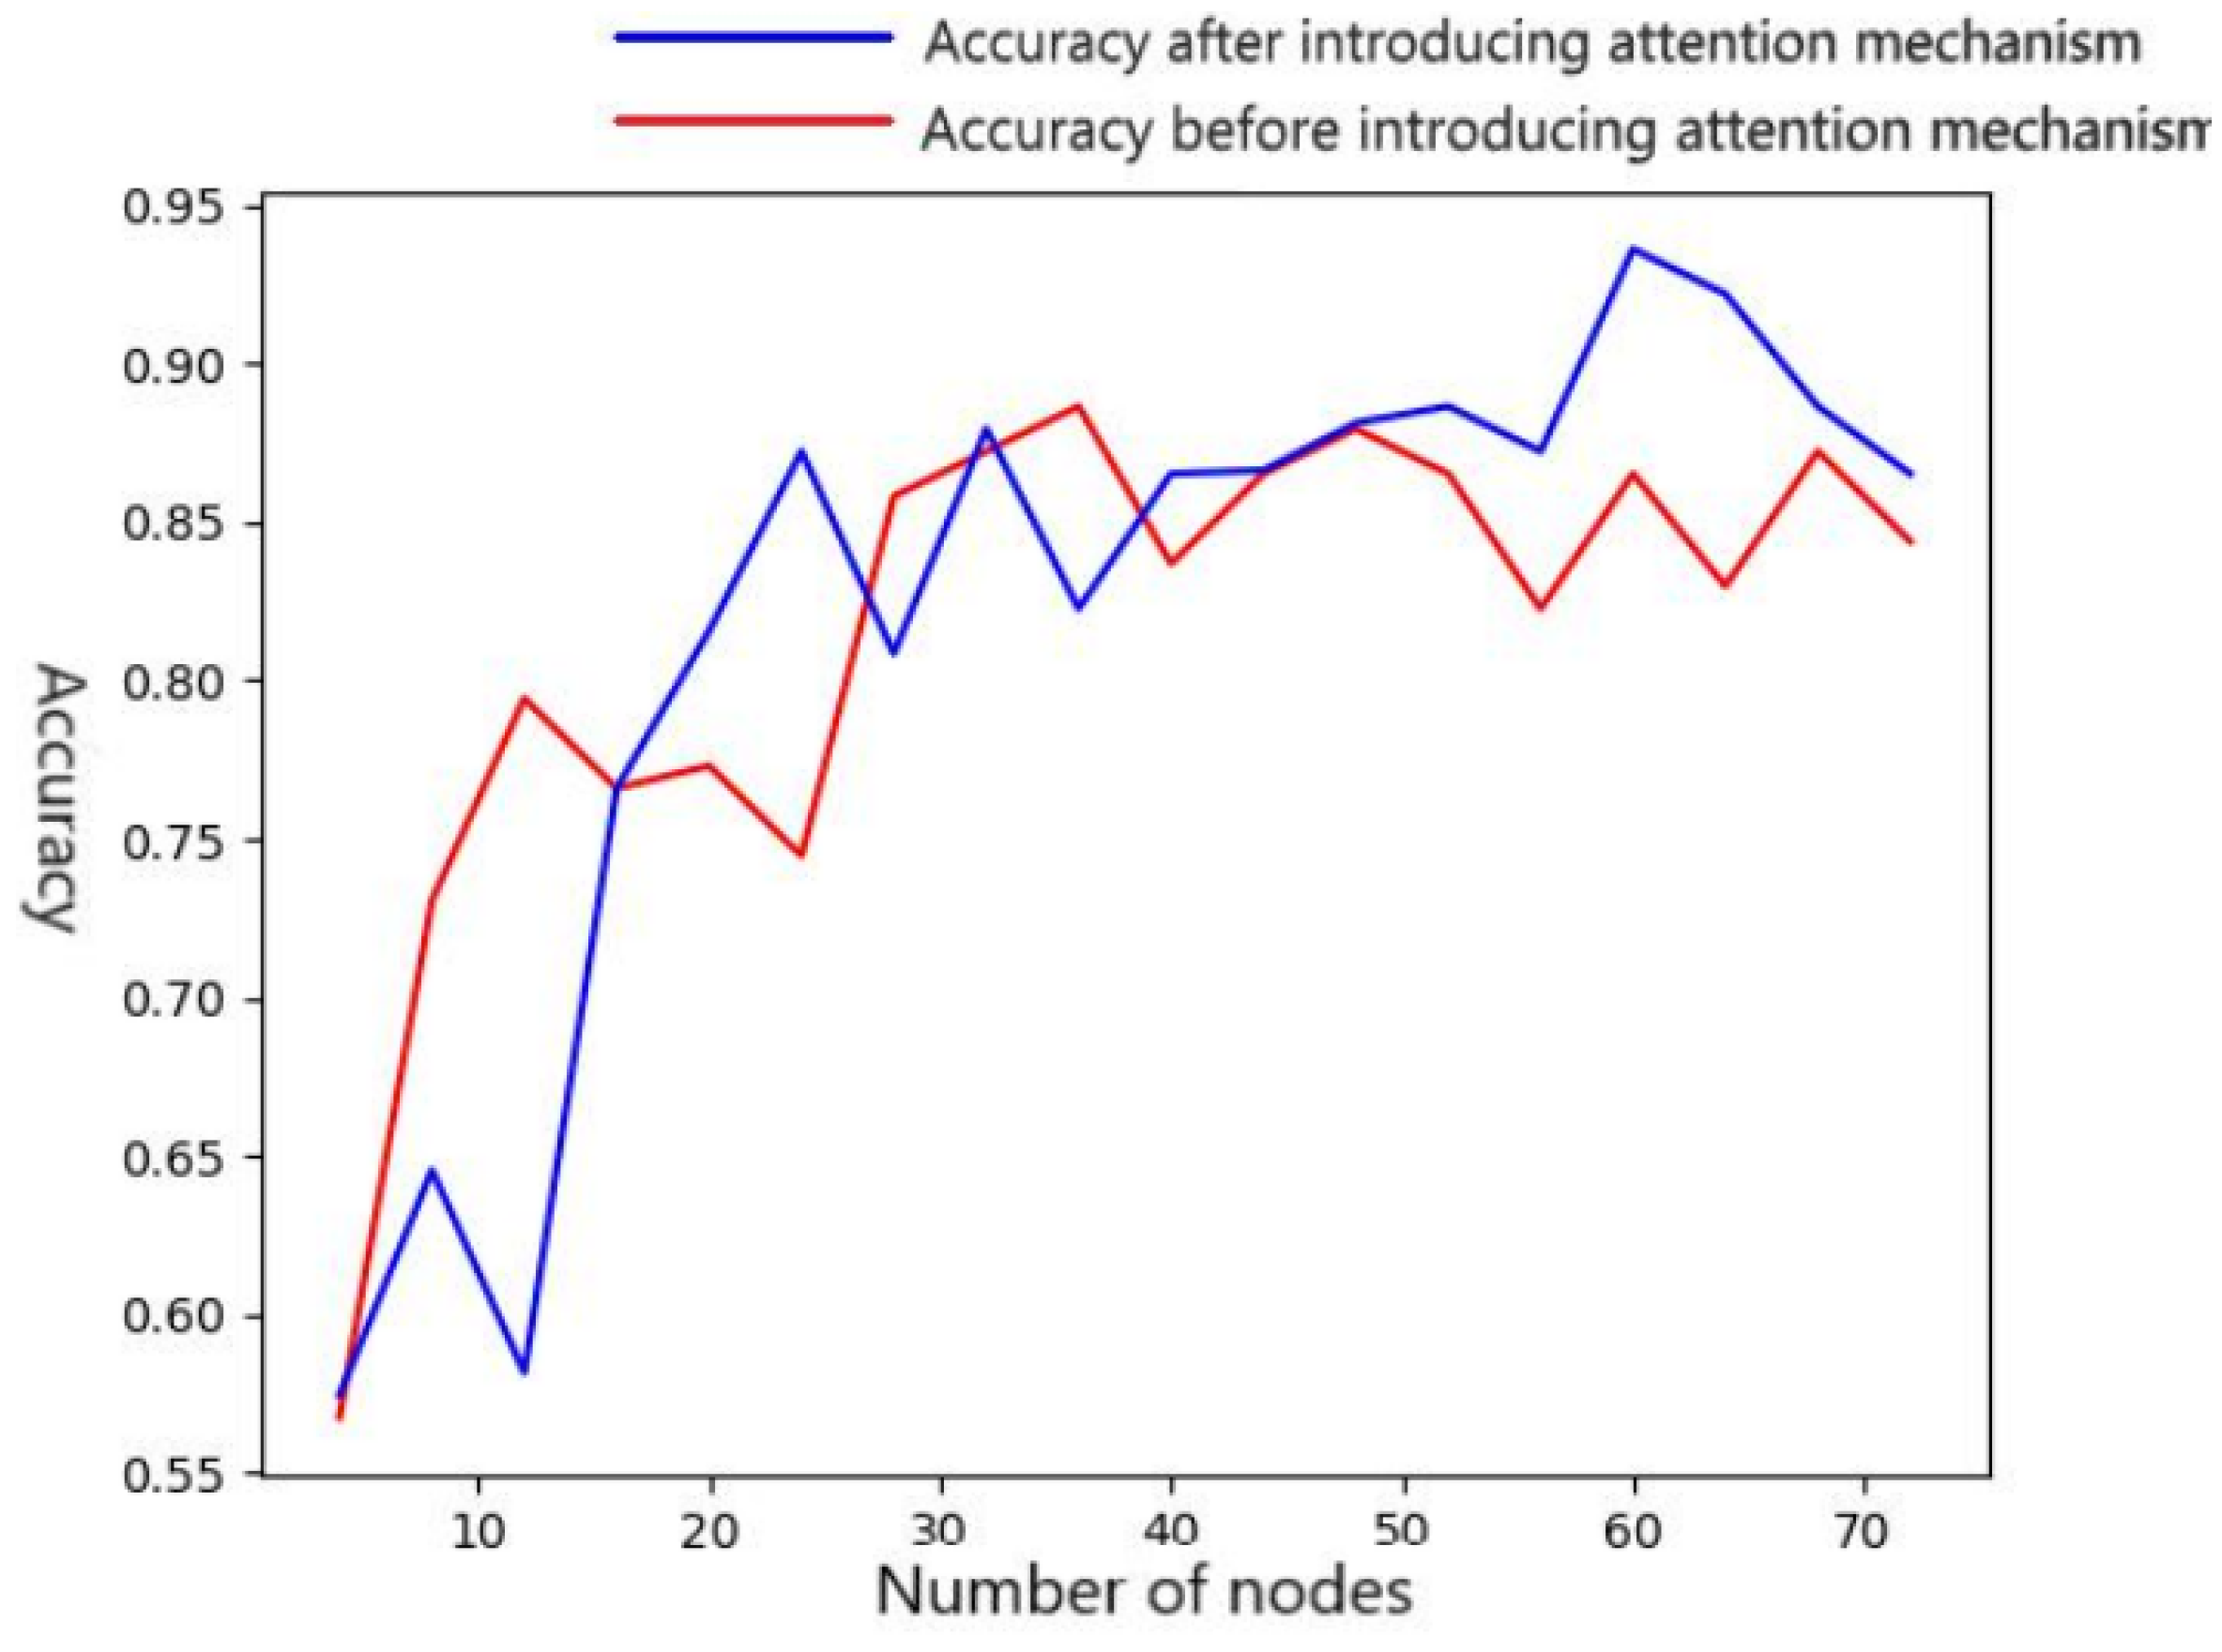
As shown in
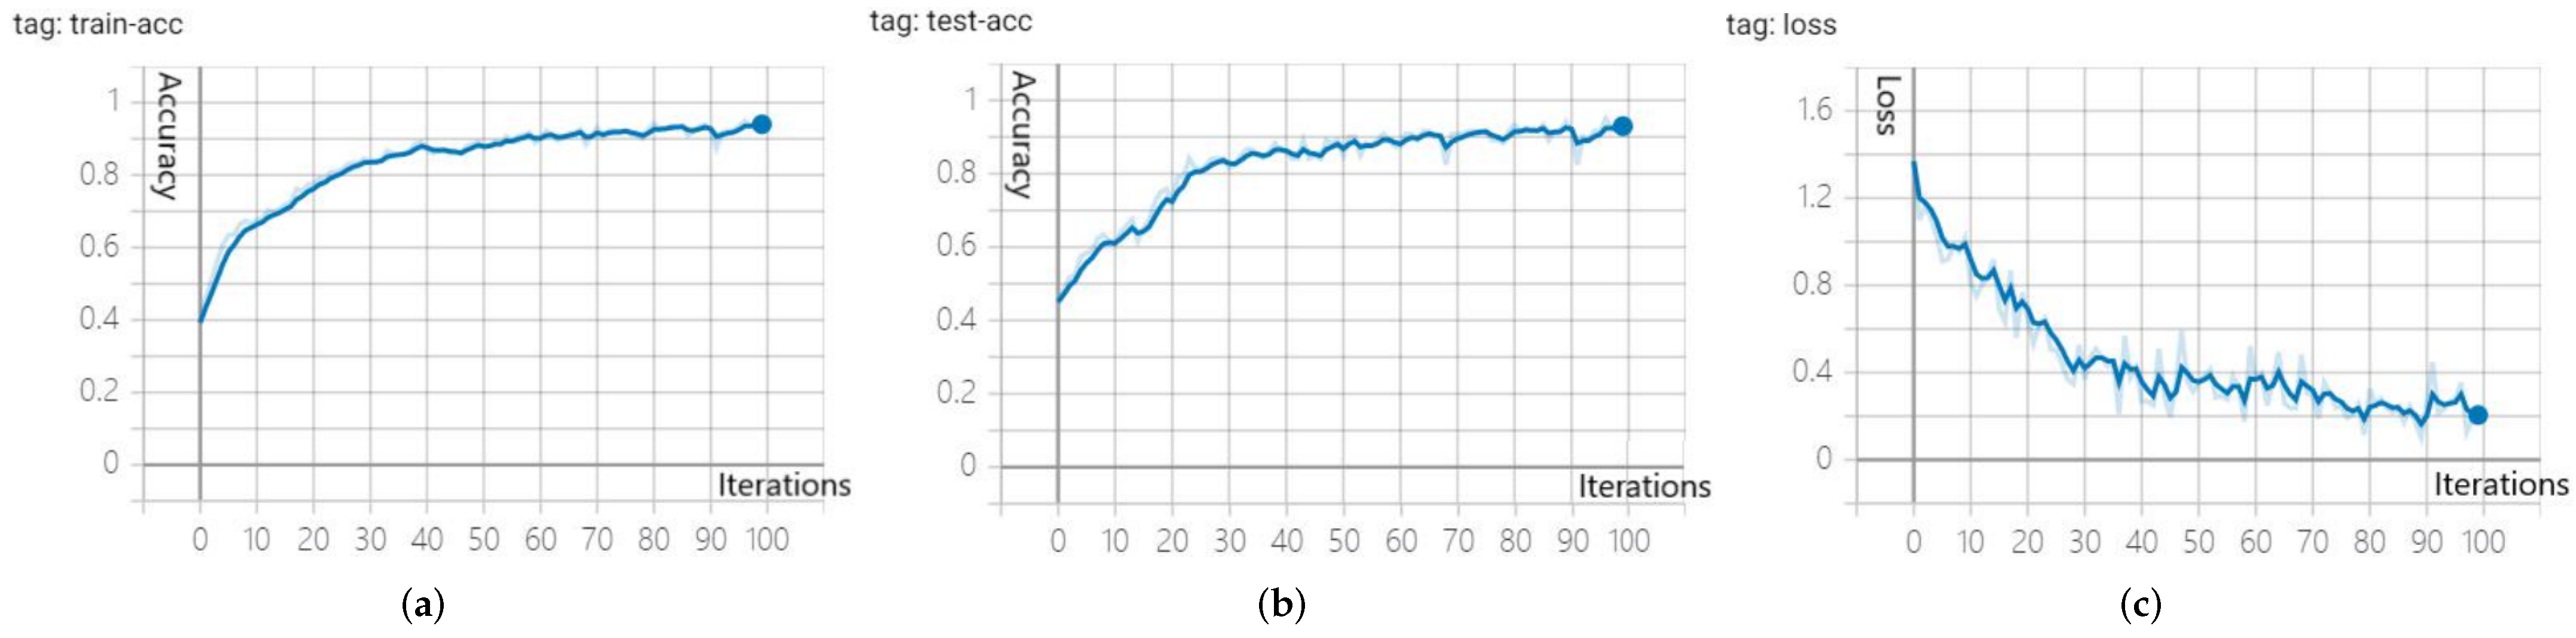
Figure 10, the simulation results suggest that the effect of the attention mechanism is not significant when the number of cells is small; when the number of nodes is more than 45, the accuracy of the detection algorithm is significantly higher than that of the algorithm without attention. The above analysis implies that the learning ability of the GRU neural network with the attention mechanism is significantly better than that of the original GRU neural network, and adding the attention layer has little effect on the training time. Therefore, the attention layer can be added to the GRU to improve its learning ability based on the ship trajectory data of the Nanjing Waterway in Jiangsu Province. By introducing the GRU model with the attention mechanism, the training results of 100 iterations after the anomaly detection simulation are exhibited in
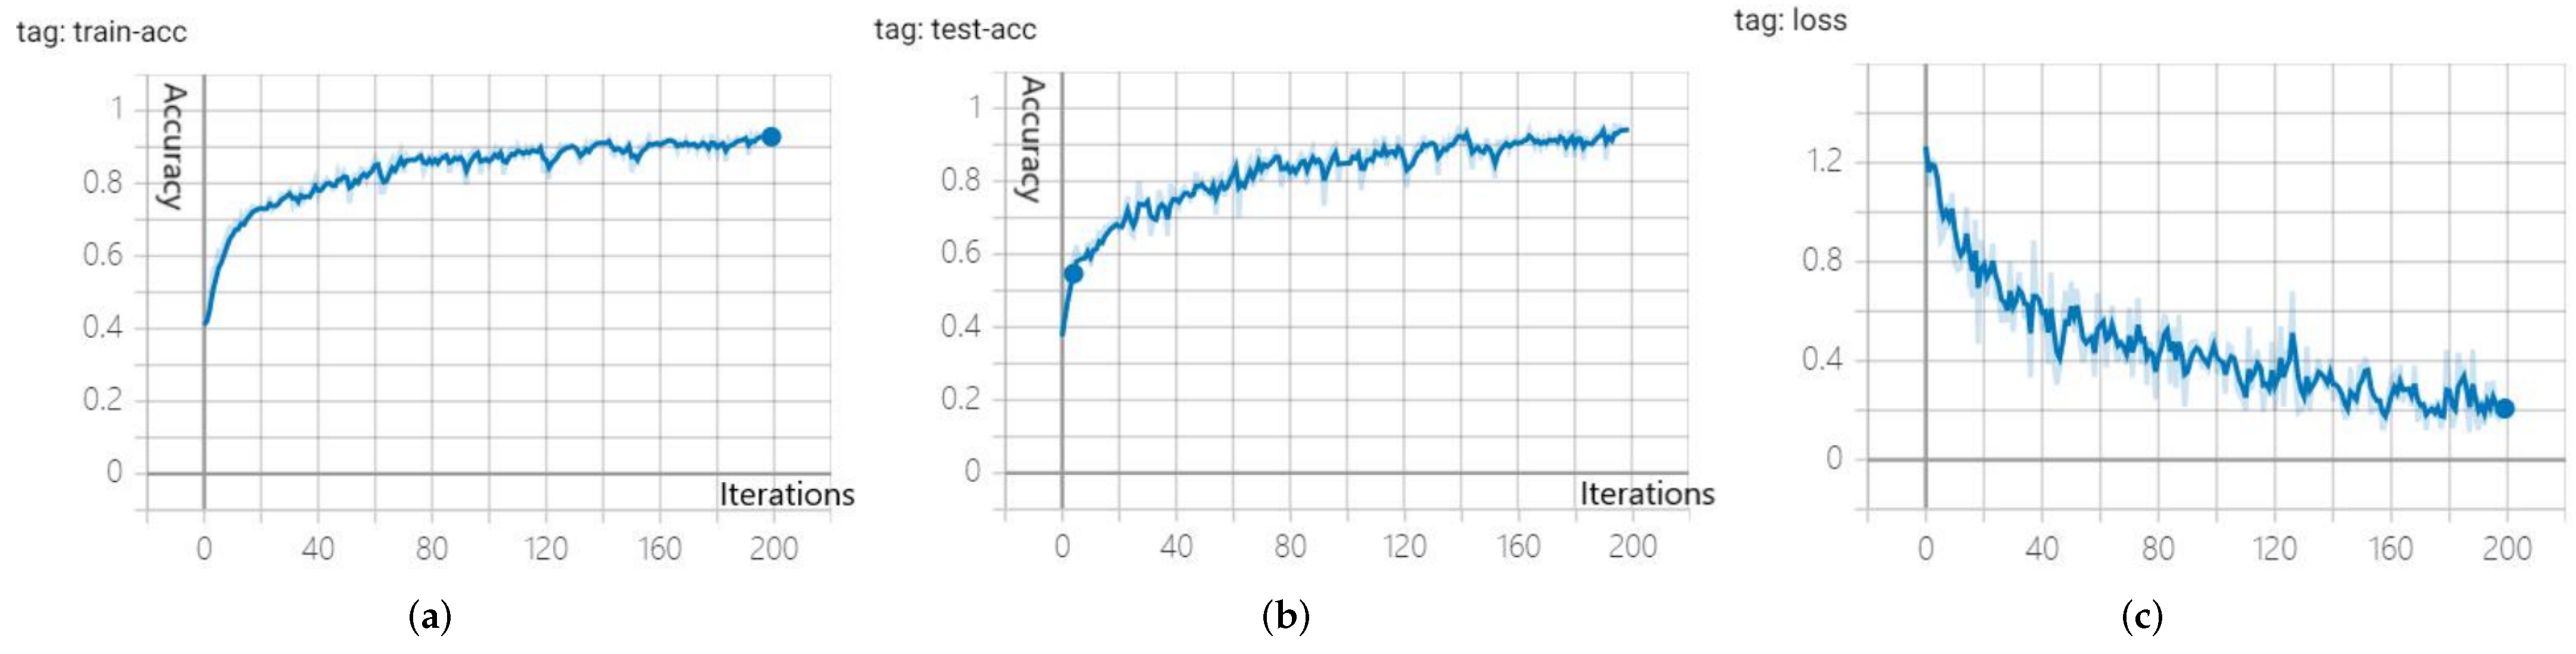
Figure 11a–c. The horizontal axis in the figure is the number of iterations.
As observed in
Figure 11a–c, with the increase of iteration times, the accuracy of the test results improves, and the error loss degree decreases. The final curve tends to be stable, which is consistent with the expectations of the model. In this simulation, the average of the four iterative results of the training curve in the later period is selected to represent the final index. After calculation, the average value of the cross entropy of the training set is 0.20, the average value of accuracy of the training set is 0.942, and the average value of accuracy of the test set is 0.941. Compared with the original GRU, the accuracy and convergence speed are improved to some extent.
5.3.2. GA Algorithm Optimizes GRU Simulation
After introducing the attention mechanism, the accuracy of the GRU model is improved, while the convergence speed is too slow. To accelerate the convergence speed, the GA algorithm is used to improve the convergence speed of the detection based on the attention mechanism, and the mechanism parameters of the GRU network are optimized at the same time. In the simulation, the specific parameters of the genetic algorithm were set as follows: the length of each chromosome was set to be 10, the population size to be
, the selected probability
=
(
from Equation (
6)), the crossover rate was set to
=
, and the mutation rate was set to
=
. The number of iterations was 40 times. After 40 iterations, the optimal individual is a four-layer GRU, a two-layer fully connected layer, and the number of nodes is 64, 72, 112, 56, 78, and 47, respectively. The specific training results of the optimized individual are shown in
Figure 12a–c, and the horizontal axis in the figure represents the number of iterations. It can be seen from
Figure 12a–c that with the increase in the number of iterations, the clarity of the test results gradually increases, and the error loss gradually decreases. The final curve tends to be stable, which is in line with the model’s expectations. In this simulation, the average value of the four iterations of the later training curve is selected to represent the final index. After calculation, the post-average cross entropy of the training set is 0.0914, the post-average accuracy of the training set is 0.991, and the post-average accuracy of the test set is 0.989. This comparison reflects that the anomaly detection model after optimizing the structural parameters has the same convergence speed and a highly improved accuracy of abnormal behavior detection.
5.3.3. Comparative Analysis of GRU Anomaly Detection Models before and after Optimization
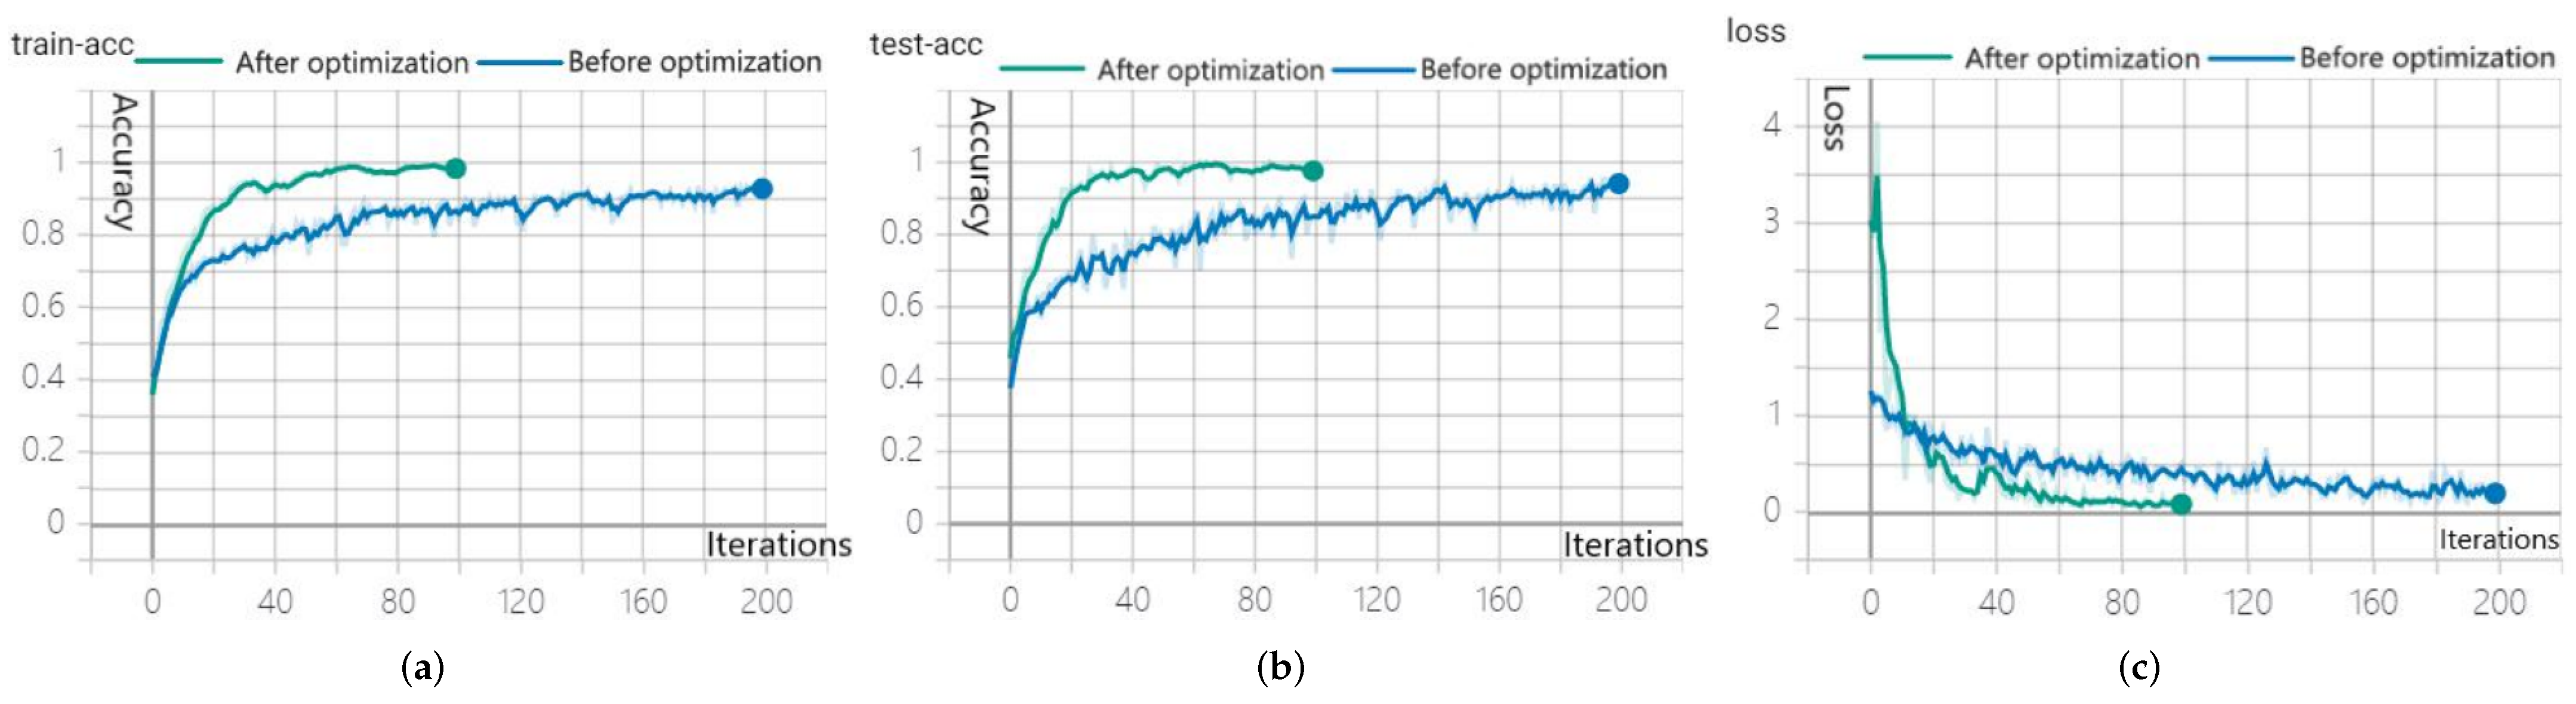
The comparison simulation curve of the anomaly detection model before and after the GRU optimization is illustrated in
Figure 13a–c. The comparison between the training curve that introduces the attention layer and the basic GRU training curve suggests that the GA improves the convergence speed of the abnormal behavior detection framework in the early stage of the iterative optimization, and the curve converges more smoothly in the iterative process. When the curve is finally stable, the final accuracy and loss of the GA-optimized curve are slightly better than the original model.
Comparing the model training curves before and after the GA optimization of the GRU structure parameters, it can be observed that the curve before optimization requires 200 iterations to converge to the optimal value. After using the genetic algorithm to optimize the model hyperparameters, the model only needs about 60 iterations to reach a stable state. The convergence ability of the anomaly detection model is further improved. When the curve becomes stable, the accuracy and loss are better than the original model. Besides this, the learning ability of the detection framework has been significantly optimized.
5.4. Optimized GRU-Based Simulation and Analysis of Ship Abnormal Behavior Detection
This paper uses the optimized GRU model to detect and identify the anomalies of ships entering and leaving the port. The data source is the Nanjing Regional Channel of Jiangsu Maritime between 1 March 2021 and 30 March 2021. Test data were 270 tracks, of which 10% were abnormal, and identifications of specific detection results are shown in
Table 1:
In the end, the number of correct detections was 266, and the correct rate was 96.58%. However, the detection results in the table can only reflect the maximum possible label output by the model, and cannot intuitively reflect the likelihood that the abnormal ship belongs to this label or the degree of differentiation from other labels. Therefore, this paper also draws the label probability output by the model on the three-dimensional image to intuitively reflect the classification of the three abnormal behaviors. In this paper, cross entropy is selected as the loss degree of the weight optimization of the detection model, that is, the final output of the model can be regarded as a vector representing the detection possibilities of various behaviors, and the maximum probability type is taken as the final label.
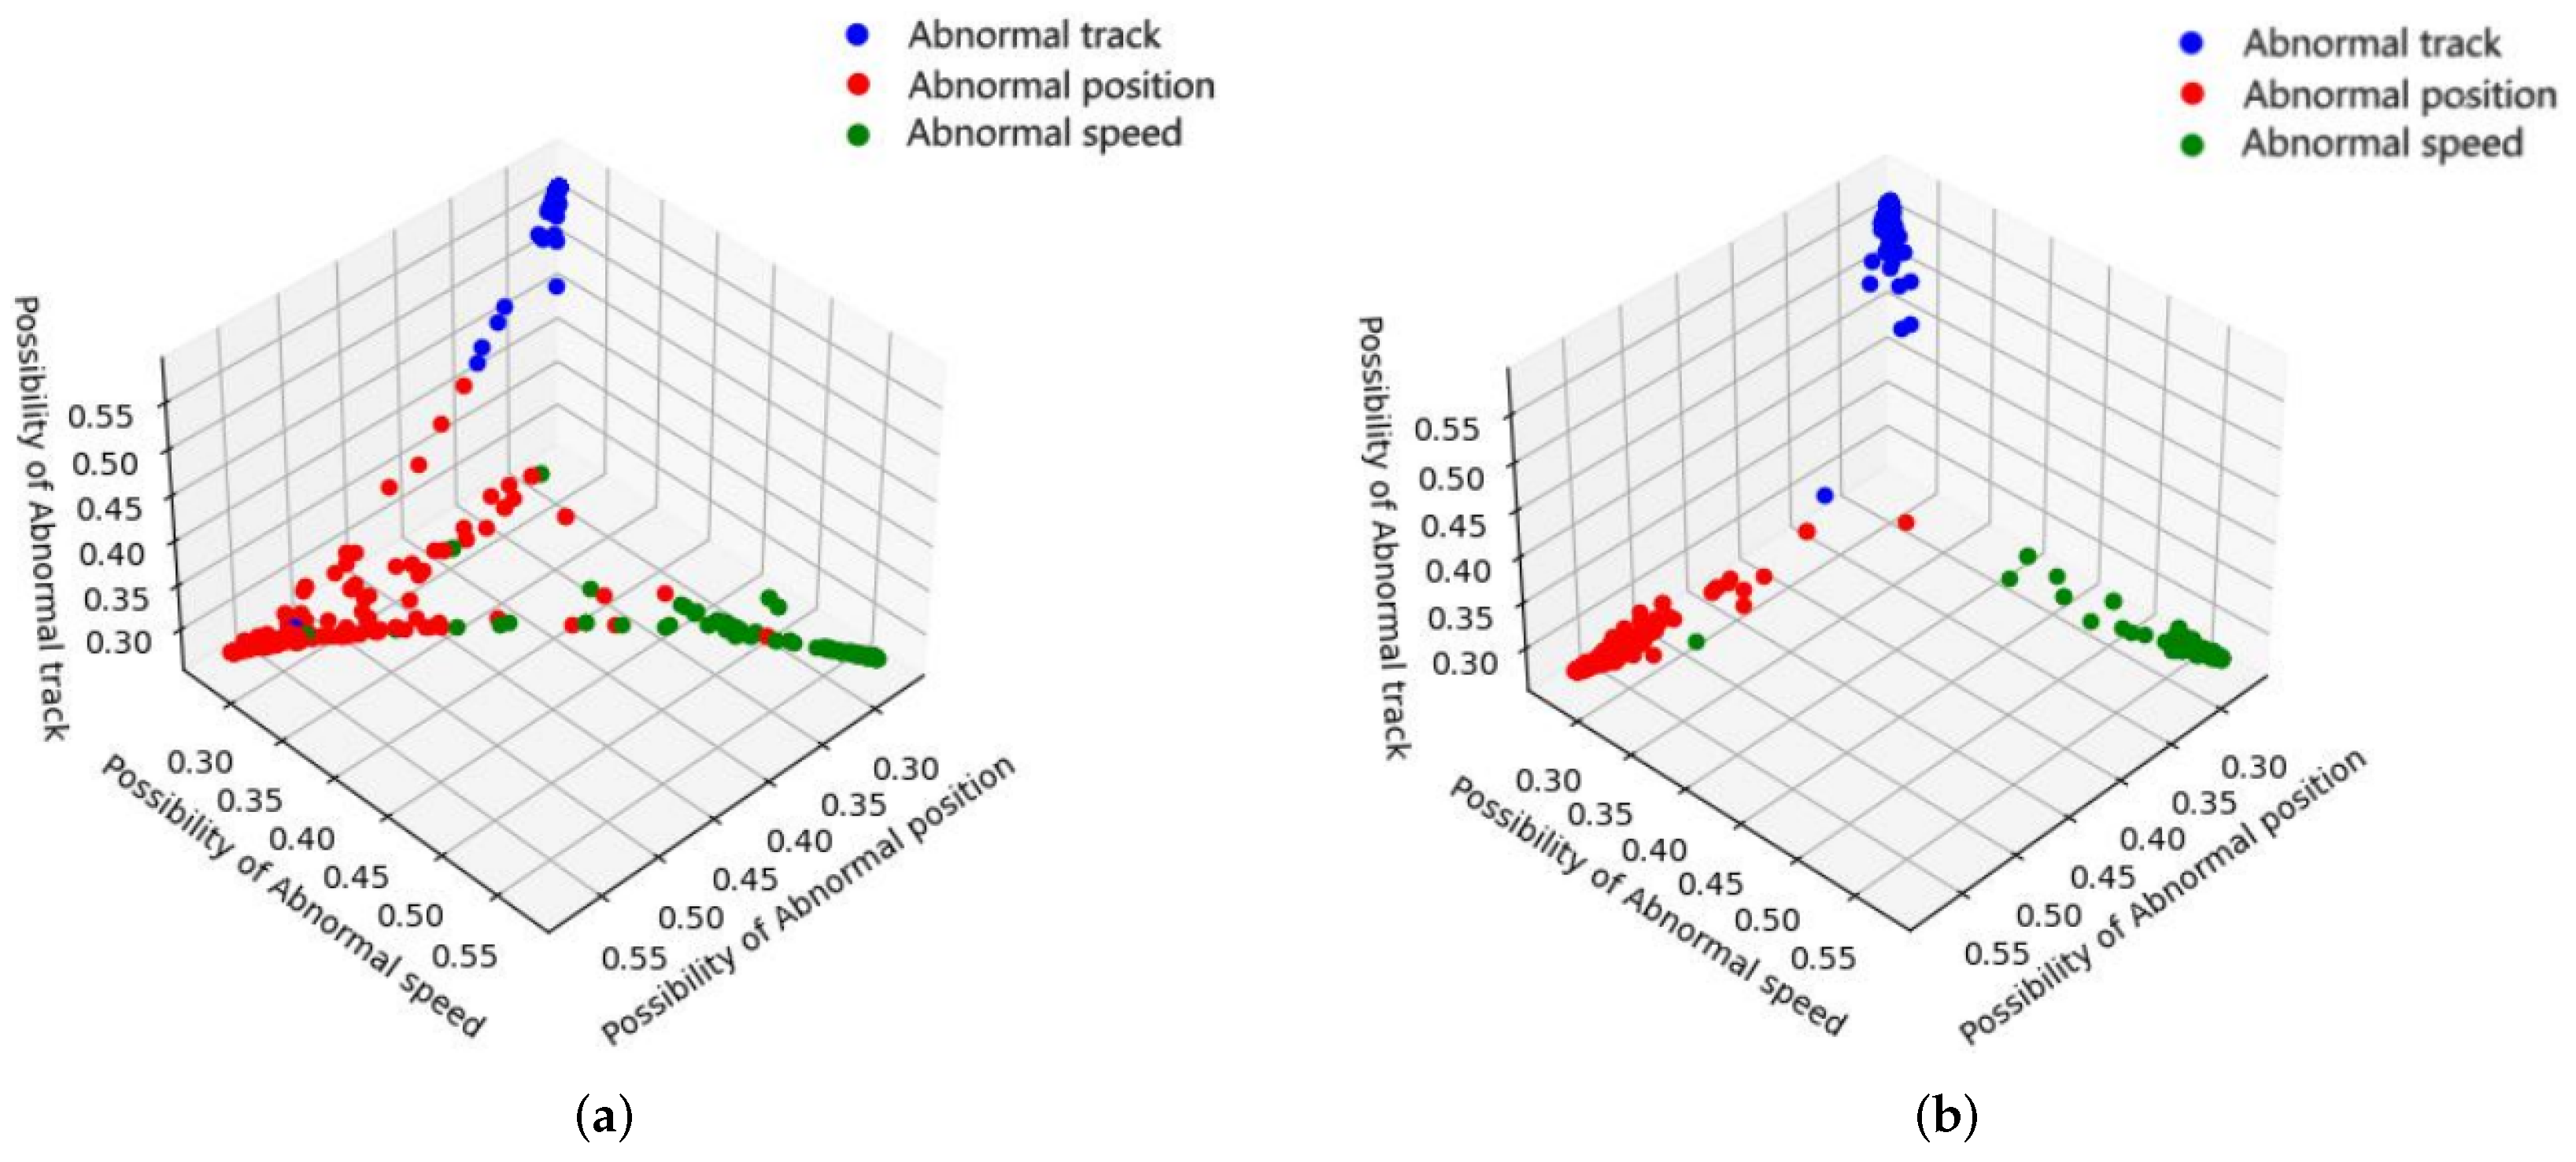
In this paper, normal data and three types of anomalies are selected for identification. The output is a four-dimensional space vector, so as to make the output of the model more intuitive, and we chose three types of anomalies to draw. Then, the vectors representing the differences among the three anomaly types are three-dimensional, and each dimension represents the possibility that a certain trajectory is identified as a certain anomaly. The exception outputs of the original anomaly detection framework and the final anomaly detection framework are presented in
Figure 14a,b:
From the output, three kinds of anomalous trajectories should be clearly divided in the possibility space. Meanwhile, the closer each kind of anomalous trajectory is to the standard axis, the higher the value on the nearest coordinate axis, and the better the classification effect. In
Figure 14a, the division of abnormal trajectories is not clear; there are a large number of trajectories close to other abnormal-possibility axes and origins (normal trajectories). Therefore, it is easy to increase the false detection rate. The detection results of the anomaly detection framework after parameter optimization are shown in
Figure 14b, and the spatial distribution of abnormal trajectories is more clear. Only a few trajectories are identified as other anomalies because they are close to other classification axes, or are identified as normal trajectories because they are close to the origin.


