Article

Intestine Explants in Organ Culture: A Tool to Broaden the Regenerative Studies in Echinoderms

by
Samir A. Bello
*,†,‡ and
José E. García-Arrarás
*
Department of Biology, University of Puerto Rico, Rio Piedras Campus, P.O. Box 23360, San Juan, PR 00931, USA
*
Authors to whom correspondence should be addressed.
Current affiliation: Department of Chemistry, University of Puerto Rico, Rio Piedras Campus, P.O. Box 23346, San Juan, PR 00931, USA.
Current affiliation: Molecular Sciences Research Center, University of Puerto Rico, 1390 Ponce De León Ave, Suite 1-7, San Juan, PR 00926, USA.
J. Mar. Sci. Eng. 2022, 10(2), 244; https://doi.org/10.3390/jmse10020244
Submission received: 31 December 2021 / Revised: 30 January 2022 / Accepted: 7 February 2022 / Published: 11 February 2022
(This article belongs to the Special Issue New Research Advances on Marine Invertebrates)

Abstract

:
The cellular events underlying intestine regrowth in the sea cucumber Holothuria glaberrima have been described by our group. Currently, the molecular and signaling mechanisms involved in this process are being explored. One of the limitations to our investigations has been the absence of suitable cell culture methodologies, required to advance the regeneration studies. An in vitro system, where regenerating intestine explants can be studied in organ culture, was established previously by our group. However, a detailed description of the histological properties of the cultured gut explants was lacking. Here, we used immunocytochemical techniques to study the potential effects of the culture conditions on the histological characteristics of explants, comparing them to the features observed during gut regeneration in our model in vivo. Additionally, the explant outgrowths were morphologically described by phase-contrast microscopy and SEM. Remarkably, intestine explants retain most of their original histoarchitecture for up to 10 days, with few changes as culture time increases. The most evident effects of the culture conditions on explants over culture time were the reduction in the proliferative rate, the loss of the polarity in the localization of proliferating cells, and the appearance of a subpopulation of putative spherulocytes. Finally, cells that migrated from the gut explants could form net-like monolayers, firmly attached to the culture substrate. Overall, regenerating explants in organ culture represent a powerful tool to perform short-term studies of processes associated with gut regeneration in H. glaberrima under controlled conditions.

1. Introduction

Explants are non-disaggregated tissue or organ fragments removed from an organism. In mammals, cultured explants are generally used to obtain primary cell lines constituted by the cells that migrate out from the tiny explants as outgrowths, forming monolayers around them. Remarkably, in most cases, the original pieces of tissue or explants are discarded [1]. Two variants of this method have been developed to study the tissues themselves, rather than the isolated cells: organotypic cultures, and explants in organ culture. In organotypic cultures, cells of different lineages from a donor organ are isolated, expanded, and grown in three-dimensional scaffolds to generate tissue equivalents. Explants in organ culture, in contrast, refer to non-disaggregated tissues or whole small organs (such as mice kidneys) maintained in vitro, retaining most of the in vivo tissue architecture [1]. Organ culture is the preferred method to study histological changes or the behavior of tissues in response to external stimuli, rather than the response of individual cells [2]. Explants in organ culture and their outgrowths have been studied in echinoderms, mainly in the classes Crinoidea and Ophiuroidea [3,4,5,6,7].
The arm explant model has been the most used in echinoderms for in vitro studies. Arm explants have been utilized in organ culture to study regenerative processes, mainly using histological methods, while some groups have focused on describing their outgrowths. Pioneering studies by Candia-Carnevali et al. [3] demonstrated that the cellular events observed in regenerating arms of the crinoid Antedon mediterranea in vivo also occur in arm explants, which can survive in vitro for several weeks. Similar findings were obtained by Dupont and Thorndike [4] and Burns et al. [5] using double amputated arm explants from the brittle star Amphiura filiformis. Additionally, the outgrowths obtained around arm explants of the species A. mediterranea were studied by Di Benedetto et al. [6]. Few explants from other echinoderm organs have been cultured. Moss et al. [7] used radial nerve cord and oral plate explants from the sea star Asterias rubens and the brittle star Ophiura ophiura, respectively, to study the cells that were able to migrate from them. Recently, our group established an in vitro system using explants in the class Holothuroidea [8].
Adult holothurians are a powerful model for organ regeneration, due to their fantastic ability to spontaneously regrow complex organs after autotomy [9]. Many of the cellular and molecular processes underlying the formation of a new intestine from the mesentery after evisceration in the species Holothuria glaberrima have been described [10]. Several techniques have been employed in in vivo studies to decipher these processes; however, crucial aspects, such as the genomic and signaling regulation of the organ regrowth, remain to be elucidated. The lack of in vitro systems in holothurians has hampered the implementation of new techniques to advance the understanding of organogenesis under controlled conditions, free of systemic variations that might arise in vivo. Thus, we have established the explant culture, which was recently used to gain new insights about the signaling mechanisms involved in intestine regrowth [8,11] and the dedifferentiation mechanisms during radial nerve cord regeneration [12] in our model. Furthermore, intestine explants in organ culture were crucial to the establishment of gene knockdown by the RNA interference in H. glaberrima [13].
Here, we implemented the methodology to maintain and characterize regenerating intestines of H. glaberrima cultured for 24 h, 5 d, or 10 d. For this, we used immunocytochemical techniques (antibodies both commercially available and produced by our group). We emphasized the effects of the culture conditions on cellular processes that have been well documented during gut regeneration in vivo in our model, such as muscle dedifferentiation, cell proliferation, changes in the extracellular matrix components, and the distribution of cell populations, such as neurons and mesothelial cells in explants. Finally, the explant outgrowth characteristics were described by phase-contrast microscopy and SEM.

2. Materials and Methods

2.1. Animal Collection and Evisceration

Adult sea cucumbers from the species Holothuria glaberrima were collected from the rocky shores of northeastern Puerto Rico. Upon arrival to the laboratory, animals were injected with 3–5 mL of 0.35 M KCl into the coelomic cavity to induce evisceration. After evisceration, they were maintained in indoor seawater aquaria at room temperature (RT, 20–24 °C) with constant aeration until sacrificed. Animals were anesthetized by immersion in 0.2% 1,1,1-trichloro-2-methyl-2-propanol hemihydrate (chlorobutanol, Sigma-Aldrich, St. Louis, MO, USA) in natural sea water for 20–30 min before being sacrificed.

2.2. Explants

Gut rudiments and associated mesentery were dissected under a stereoscopic microscope from sea cucumbers undergoing intestine regeneration at 5 days post-evisceration (dpe). Immediately after dissection, gut rudiment explants were surface disinfected, as described previously [14], and carefully placed in 24-well plates, one explant per well. Subsequently, each explant was covered with 1 mL of L-15 culture medium (Leibovitz, Cat. L4386, Sigma-Aldrich, St. Louis, MO, USA) conditioned for marine species adding salts as described [14,15] and adjusted to pH = 7.8. The culture medium was also supplemented with antibiotics (100 U/mL penicillin, 100 μg/mL streptomycin, 50 μg/mL gentamicin), antifungal (2.5 μg/mL amphotericin B), 1X MEM nonessential amino acids, 1 mM sodium pyruvate, 1.75 µg/mL α-tocopherol acetate, and 1X ITS (Insulin, Transferrin, and Sodium Selenite). All cell culture reagents were purchased from Sigma-Aldrich (St. Louis, MO, USA). Explants were incubated in a modular incubator chamber (Billups-Rothenberg Inc., San Diego, CA, USA) at room temperature (20–24 °C) for 24 h, 5 d, or 10 d. Culture medium was changed every other day. Control explants were 5 dpe regenerating intestines from sea cucumbers that were dissected and disinfected as the experimental ones, but that were fixed without placing in culture.

2.3. Characterization of Cell Populations in Cultured Explants by Immunocytochemistry

After incubation, explants were fixed in 4% PFA diluted in 0.1 M PBS at 4 °C overnight (ON). After fixation, tissues were rinsed three times with PBS (15 min each) and cryoprotected in 30% sucrose/PBS at 4 °C. Intestine explants were mounted in OCT compound (Sakura Finetek Inc, Torrence, CA, USA) and cryosectioned (20 µm) using a cryostat (model CM1850, Leica Microsystems, Nussloch, Germany). Immunohistochemical staining of tissue sections was performed, as previously described [16]. Briefly, tissue sections were permeabilized with 1% Triton X-100 for 15 min, followed by two rinses with PBS. Then the tissues were blocked with normal goat serum, and subsequently they were incubated ON at room temperature in a humid chamber with the primary antibodies shown in Table 1. These antibodies have been widely used to identify different cell populations in holothurian tissues in in vivo studies [16,17,18,19,20,21,22]. Next day, the slides were washed three times with PBS for 15 min each wash. Then, the tissue sections were incubated with the secondary antibody goat anti-mouse labeled with Cy3 (GAM-Cy3, 1:1000) or goat anti-rabbit labeled with Cy3 (GAR-Cy3, 1:1000) from Jackson ImmunoResearch Labs (West Grove, PA, USA) for an hour at room temperature. The same methodology was used for double immunolabeling, except that tissue sections were incubated simultaneously with both primary antibodies, and the next day with both secondary antibodies, GAM-Cy3 (1:1000), and GAR-Alexa Fluor 488 (Thermo Fisher Scientific, Rockford, IL, USA). After three additional washes with PBS, slides were mounted in buffered glycerol solution containing 1 µg/mL of 4′,6-diamidino-2-phenylindole (DAPI, Sigma-Aldrich, St. Louis, MO, USA). Finally, tissue sections were visualized and analyzed using a fluorescence microscope (Eclipse Ni, Nikon Instruments Inc., Melville, NY, USA).

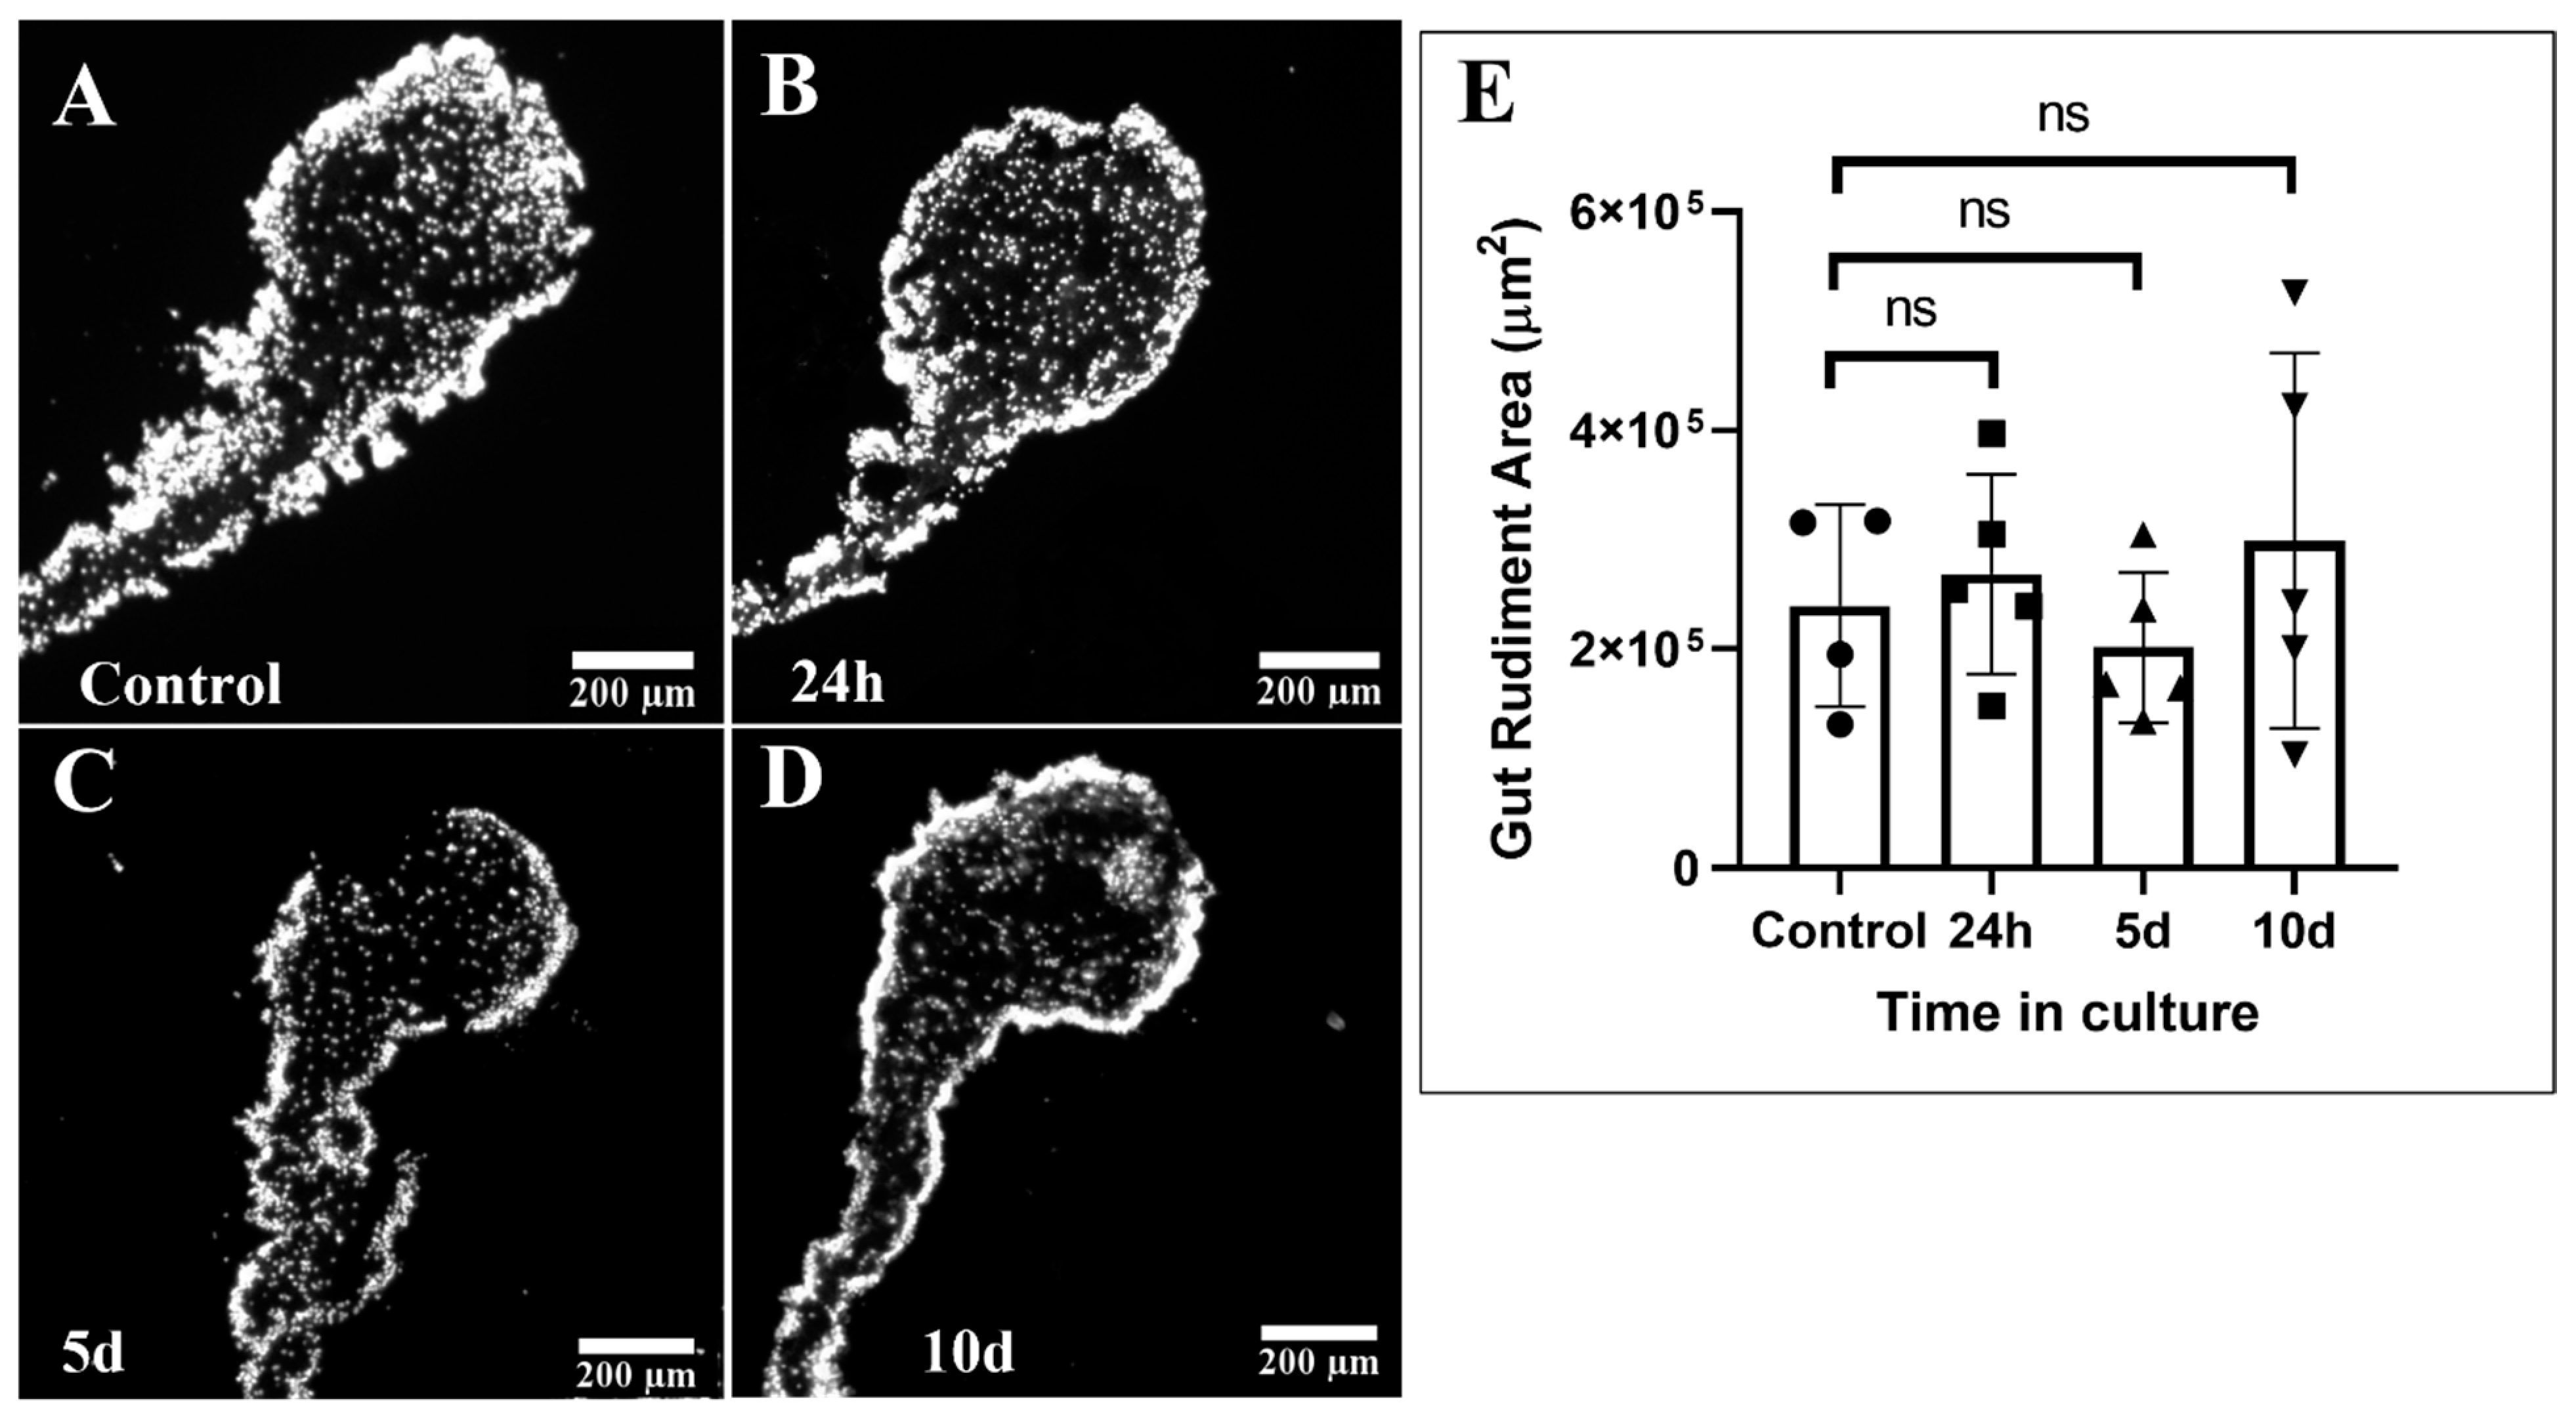
2.4. Gut Rudiment Area

Following evisceration, the mesentery is attached to the body wall, which comprises its proximal boundary. At the other end it is ‘free’ within the coelomic cavity. As the ‘free’ end of the mesentery forms the new intestinal rudiment, a constriction forms that separates the growing intestine from the remaining mesentery. Both boundaries are clearly observed in the explant tissue sections. Thus, we took photographs of gut rudiments in DAPI-labeled tissue sections of control and cultured explants (24 h, 5 d, or 10 d) using a Nikon DS-Q12 digital camera attached to the fluorescence microscope. Gut rudiment area was measured on photographs using the freely available image processing program Image J (version Fiji 1.46, NIH, MD, USA) downloaded from https://imagej.nih.gov/ij/ and last accessed on 15 December 2021. At least three non-consecutive tissue sections were evaluated to obtain the average of gut rudiment area per explant. At least 4 explants (n = 4–5) were used for each culture time point and control.

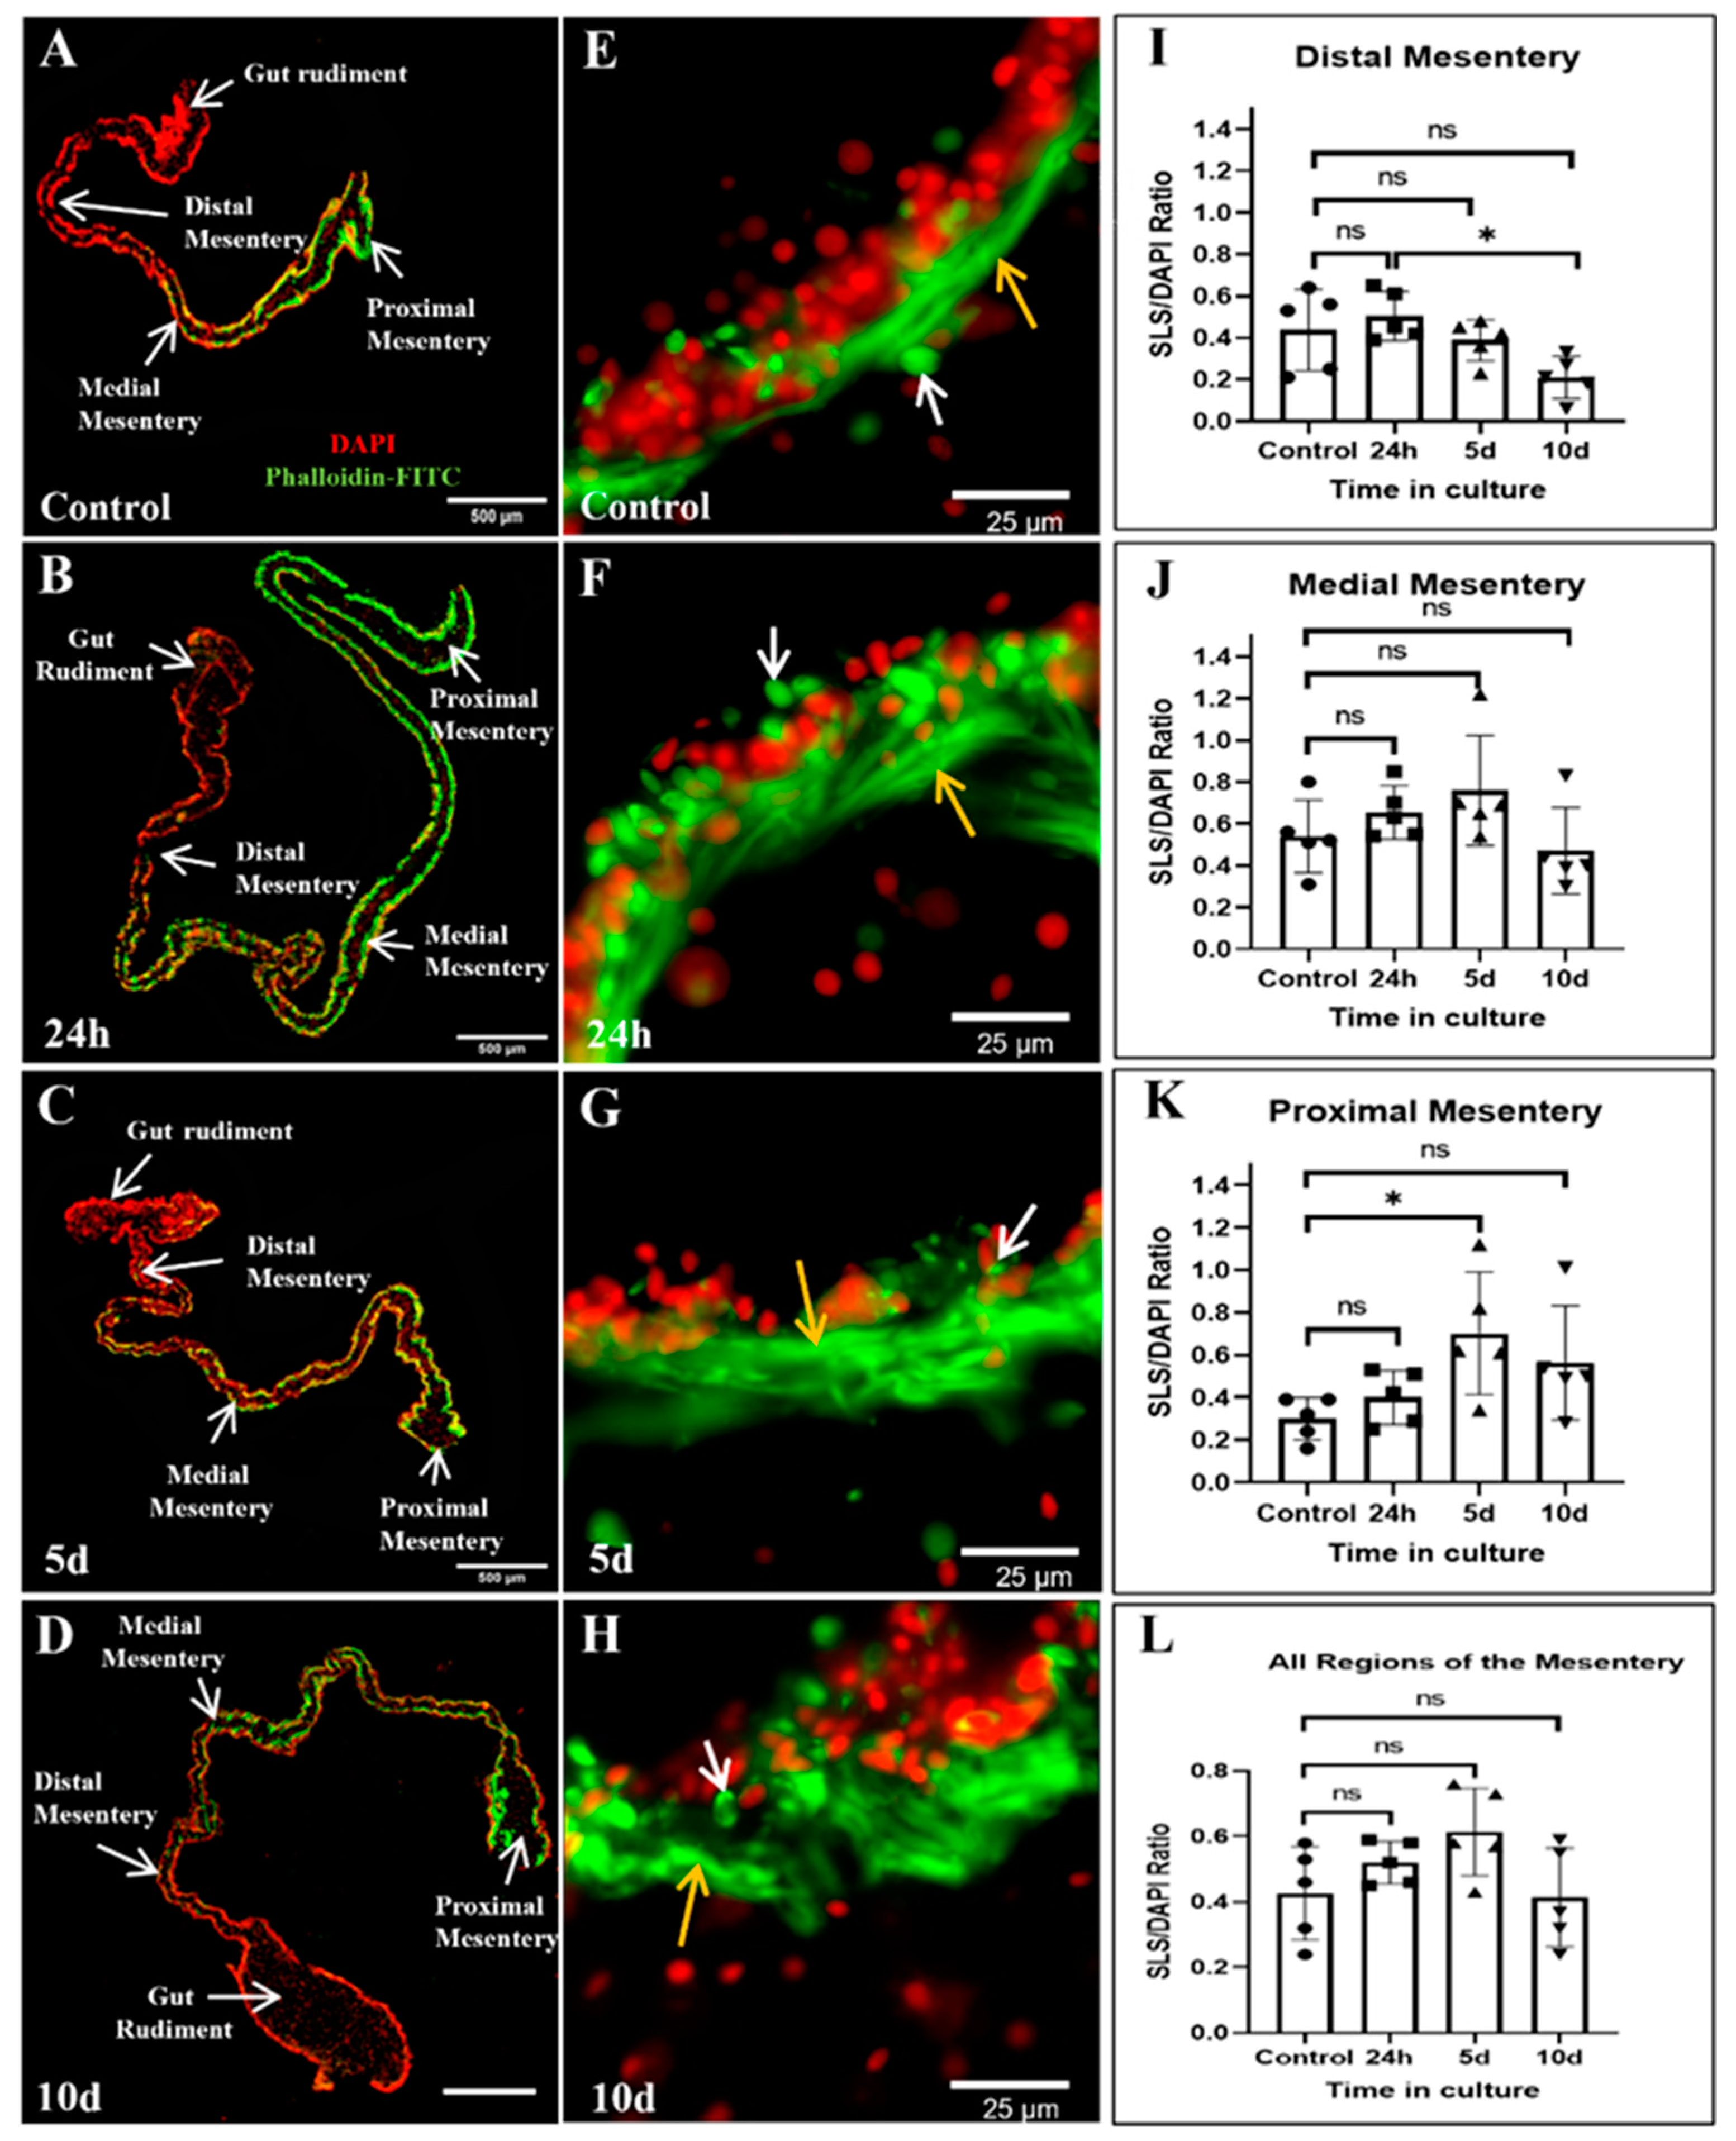
2.5. Muscle and Spindle-like Structures (SLSs)/DAPI Ratio in Cultured Explants

Muscle and spindle-like structures were detected in tissue sections using Phalloidin-TRITC staining (1:1000, Cat. P1951, Sigma-Aldrich, St. Louis, MO, USA). Slides were incubated with diluted Phalloidin-TRITC for one hour, then washed three times with PBS and mounted in buffered glycerol solution containing DAPI. Finally, tissue sections were visualized and analyzed using a Nikon Eclipse Ni fluorescence microscope.
The number of SLSs and DAPI labeled nuclei per field of view were manually counted under the fluorescence microscope, using the 100X objective (area = 13,837 µm2) for each tissue section on three different regions of the mesentery: near the gut rudiment (distal mesentery), medial segment (medial mesentery), and near the body wall (proximal mesentery) in explants cultured for 24 h, 5 d, or 10 d. The number of SLSs and cell nuclei in the three regions was averaged to obtain the SLSs/DAPI ratio per tissue section. At least two non-consecutive tissue sections were used per explant. A total of 5 explants were used in this experiment for each time point (n = 5).

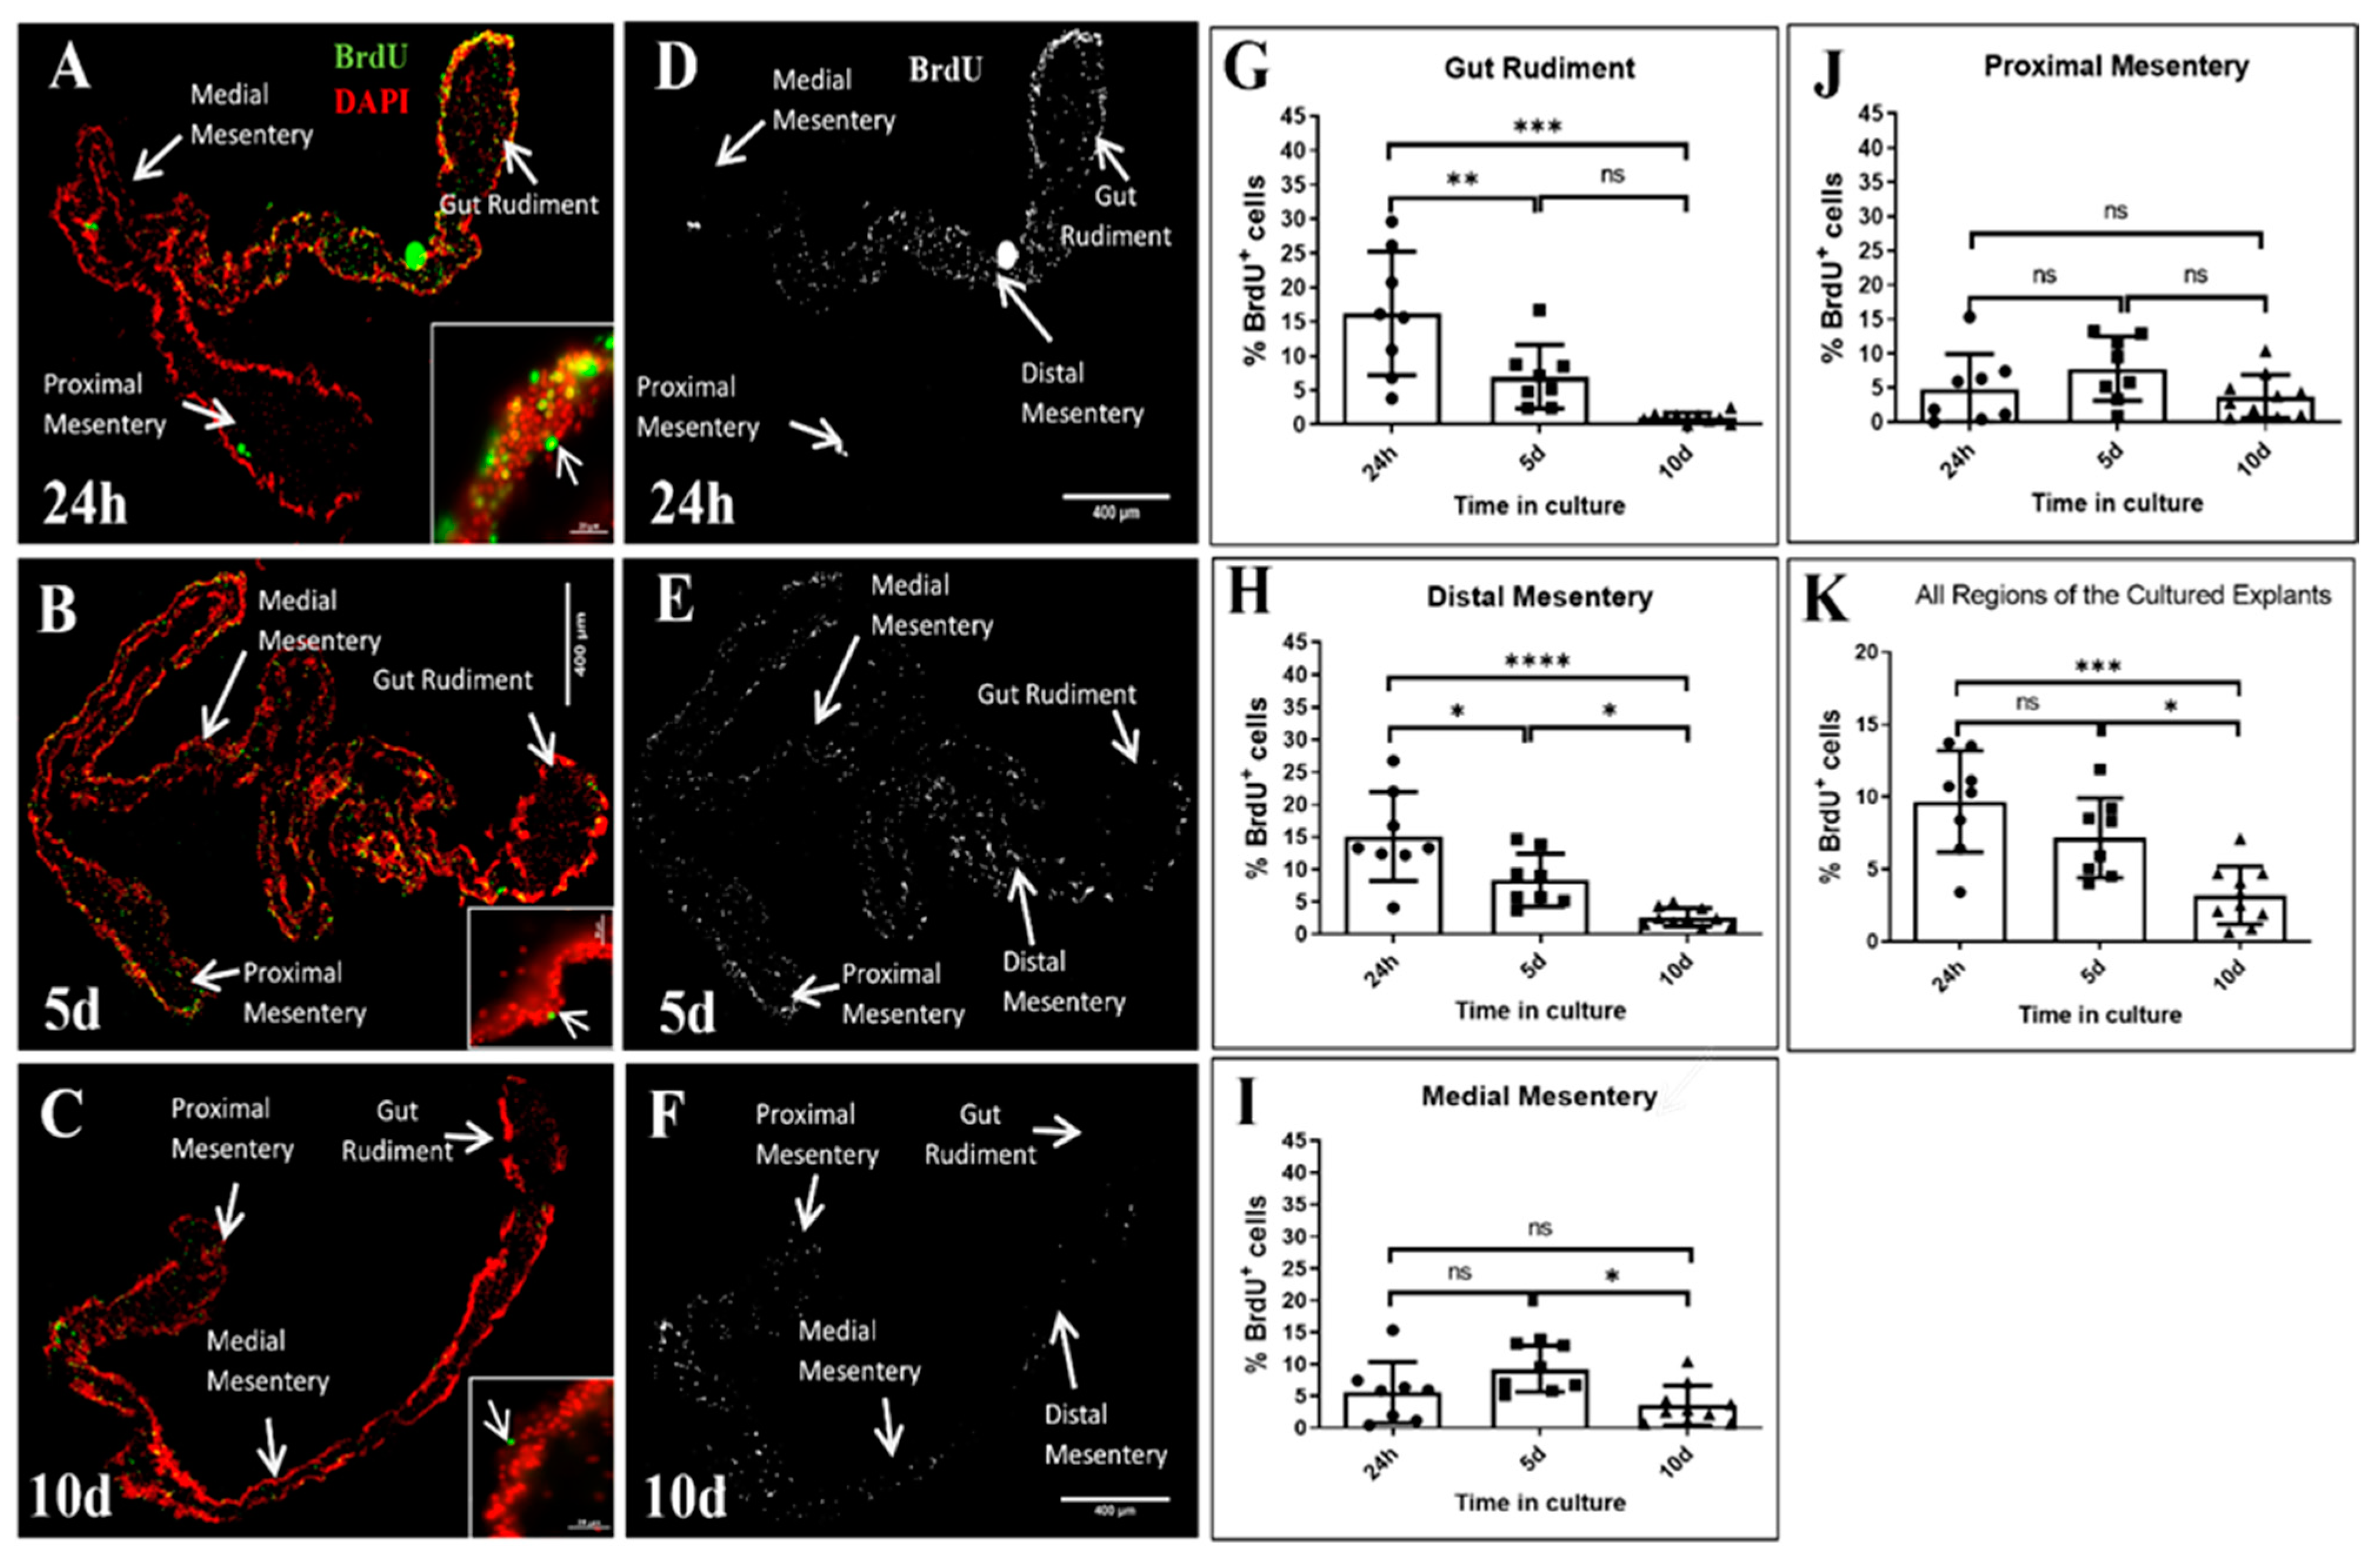
2.6. Cell Proliferation Assays

Cell proliferation was evaluated in explants from 5 dpe after 24 h, 5 or 10 days in in vitro conditions by BrdU incorporation assay. BrdU (Sigma-Aldrich, St. Louis, MO, USA) was added to the cell culture medium at a final concentration of 50 µM for the last 24 h of culture. For explants maintained for only 24 h in vitro, we added the BrdU at the initial explant seeding. Detection of BrdU labeling was performed by immunocytochemistry. The processing of explant tissue sections for anti-BrdU staining was similar to that used for other markers; however, it included an additional step to denature the DNA after fixation. DNA denaturation was done by treating tissue sections with 0.05 M HCl for 1 h after permeabilization. After DNA denaturation, tissue sections were washed twice with PBS, for 10 min each, and then blocked with normal goat serum (diluted 1:50) for 1 h at RT. Subsequently, cells were incubated with the primary antibody anti-BrdU (1:5, Cat. GERPN202, Millipore-Sigma, Marlborough, MA, USA) ON. Next day, tissue sections were washed three times with PBS for 15 min each. Then, tissue sections were incubated with the secondary antibody GAM-Cy3 (1:1000), mounted, and visualized as was mentioned previously.
The percentage of BrdU-positive cells was calculated in at least two non-consecutive tissue sections of gut explants after 24 h, 5 d, or 10 d of culture. For each culture time, 8–10 explants (n = 8–10) were used. To obtain the percentage of BrdU positive cells, photographs were taken of both the gut rudiment and the mesentery (in three regions: distal, medial, and proximal mesentery) with 40X objective (area = 85,580 µm2) and imported to Image J software. The percentage of BrdU positive cells in each region was calculated and averaged to obtain the percentage of BrdU positive cells per explant. DAPI is a nuclear dye that labels all nuclei; thus, providing the number of total cells within the field of view, so as to obtain the percentage of total cells labeled by the BrdU.

2.7. Morphological Characterization of Explant’s Outgrowths by SEM

Explants from 5 dpe animals were seeded on glass cover slips of 8 mm in diameter (Electron Microscopy Sciences, Hatfield, PA, USA) coated with poly-L-lysine and cultured for 24 h, 5 d, or 10 d. After incubation, the cells that were able to migrate from explants and that remained adhered to the glass coverslips were fixed and dehydrated, as described in [23], and chemically dried and mounted, as described in [14] with a few modifications. Briefly, cells were fixed in 4% glutaraldehyde in natural sea water instead of PBS.

2.8. Statistical Analysis

To evaluate the statistical differences in gut rudiment area, SLS/DAPI ratio, and proliferation rate between control and cultured explants, we employed one-way ANOVA followed by Tukey’s test for multiple comparisons of means. All values are reported as mean ± standard deviation (SD). The differences were considered significant when the p-value was <0.05. The level of significance was denoted in figures with asterisks as follow: **** p < 0.0001, *** p < 0.001, ** p < 0.01, * p < 0.05, ns = not significant (p-value > 0.05). These analyses were performed using the software GraphPad Prism 8 (San Diego, CA, USA).

3. Results

Explants from 5 dpe were cultured for 24 h, 5 d, or 10 d. The intestine rudiment area and the expression and localization of markers for muscle dedifferentiation, cell proliferation, mesothelium, nerve fibers and neuron-like cells, and components of the connective tissue were determined in the above-mentioned cultured gut tissues and were compared to explants dissected at 5 dpe but not cultured (controls).

3.1. Gut Rudiment Area

The gut rudiment grows as intestine regeneration proceeds in H. glaberrima in vivo [16]. Here we determined if the intestine rudiment in explants increases in size as the time in culture is extended, mimicking the growth observed in vivo. Remarkably, no significant increase in the gut rudiment area was observed as the culture time increased (Figure 1A–D). Control and cultured explants showed gut rudiment areas in the range of 2 to 3 × 105 μm2 on average (Figure 1E), which agrees with values reported for intestine rudiments at 5 dpe in our model in vivo [16]. Overall, our results suggest that explants did not change their size as the time in culture advanced.

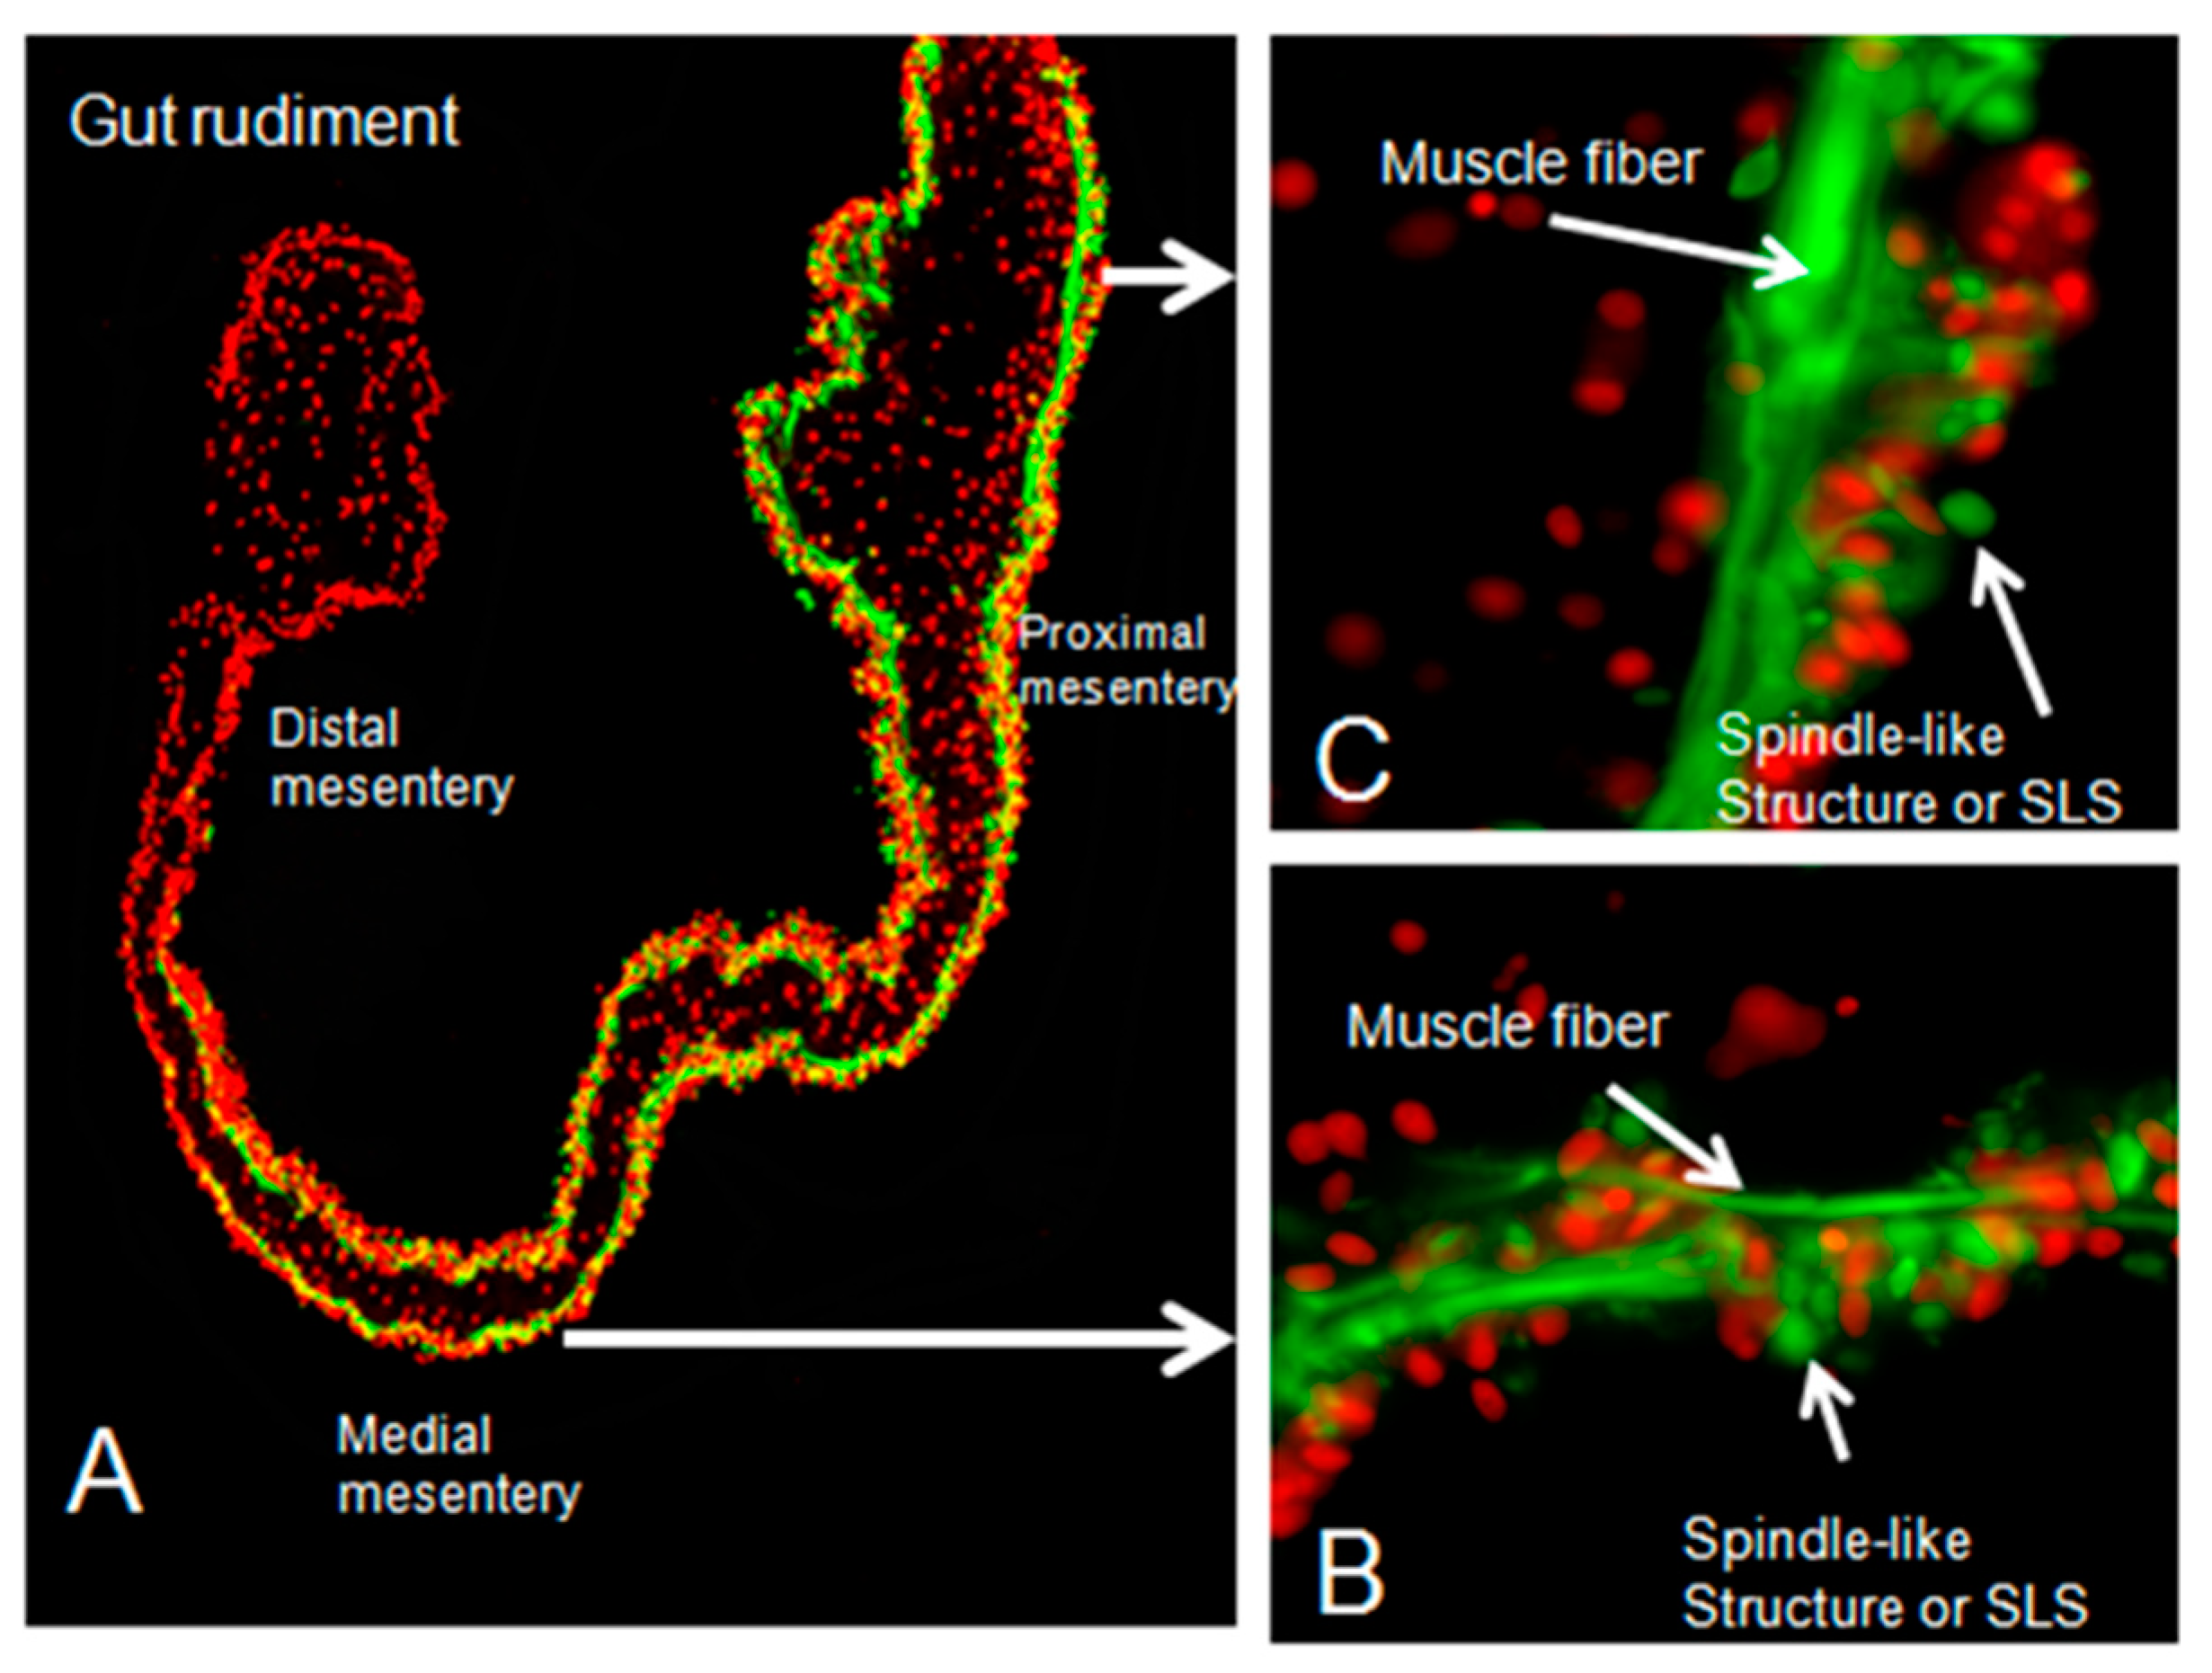
3.2. Muscle Dedifferentiation

Muscle cells, originally assembled into bundles in the mesentery, undergo a process of dedifferentiation during intestinal regeneration. Muscle disassembly and the concomitant appearance of spindle-like-structures (SLSs) are a hallmark of muscle dedifferentiation in echinoderms [3,24,25] and occur following a temporal and spatial sequence [9,16]. Here, we found that in control explants and in those cultured for 24 h, 5 d, and 10 d the muscle fibers had disappeared from the gut rudiment and adjacent mesentery (distal mesentery) but remained from the medial to the proximal mesentery (Figure 2A–D). However, explants cultured for 5 and 10 days exhibited disorganized muscle fibers in the proximal mesentery (Figure 2G,H) when compared to control explants and explants cultured for 24 h (Figure 2E,F). Regarding SLSs, they had disappeared from the gut rudiment but were still present in the mesentery of control and cultured explants (Figure 2A–D). The same characteristics were observed in sea cucumbers regenerating their intestines at 5 dpe (in vivo conditions) [16] (as shown in Figure A1), except for the muscle fiber disorganization observed in explants cultured for 5 and 10 days.
The SLS/DAPI ratio can be used to indicate the degree of muscle dedifferentiation in H. glaberrima, where a higher ratio would suggest increased muscle dedifferentiation [8]. As mentioned above, muscle differentiation occurs in a spatial sequence in the mesentery. Thus, we determined the SLS/DAPI ratio in the three different regions of the mesentery: distal, medial, and proximal, to verify potential changes at different mesenterial locations. We observed a trend toward a SLS/DAPI ratio decrease at the distal mesentery in cultured explants with increased time in culture; however, the reduction was significant only between explants cultured for 24 h compared to explants cultured for 10 days. Conversely, we did not observe significant differences in the SLS/DAPI ratio at the medial mesentery; whereas, at the proximal region, a significant increase in the ratio was observed between control and explants cultured for 5 d. When the SLS/DAPI ratios of the three mesenteric regions were averaged for each sample, no significant differences were found between control and cultured explants, suggesting that in vitro conditions, per se, did not induce muscle dedifferentiation.

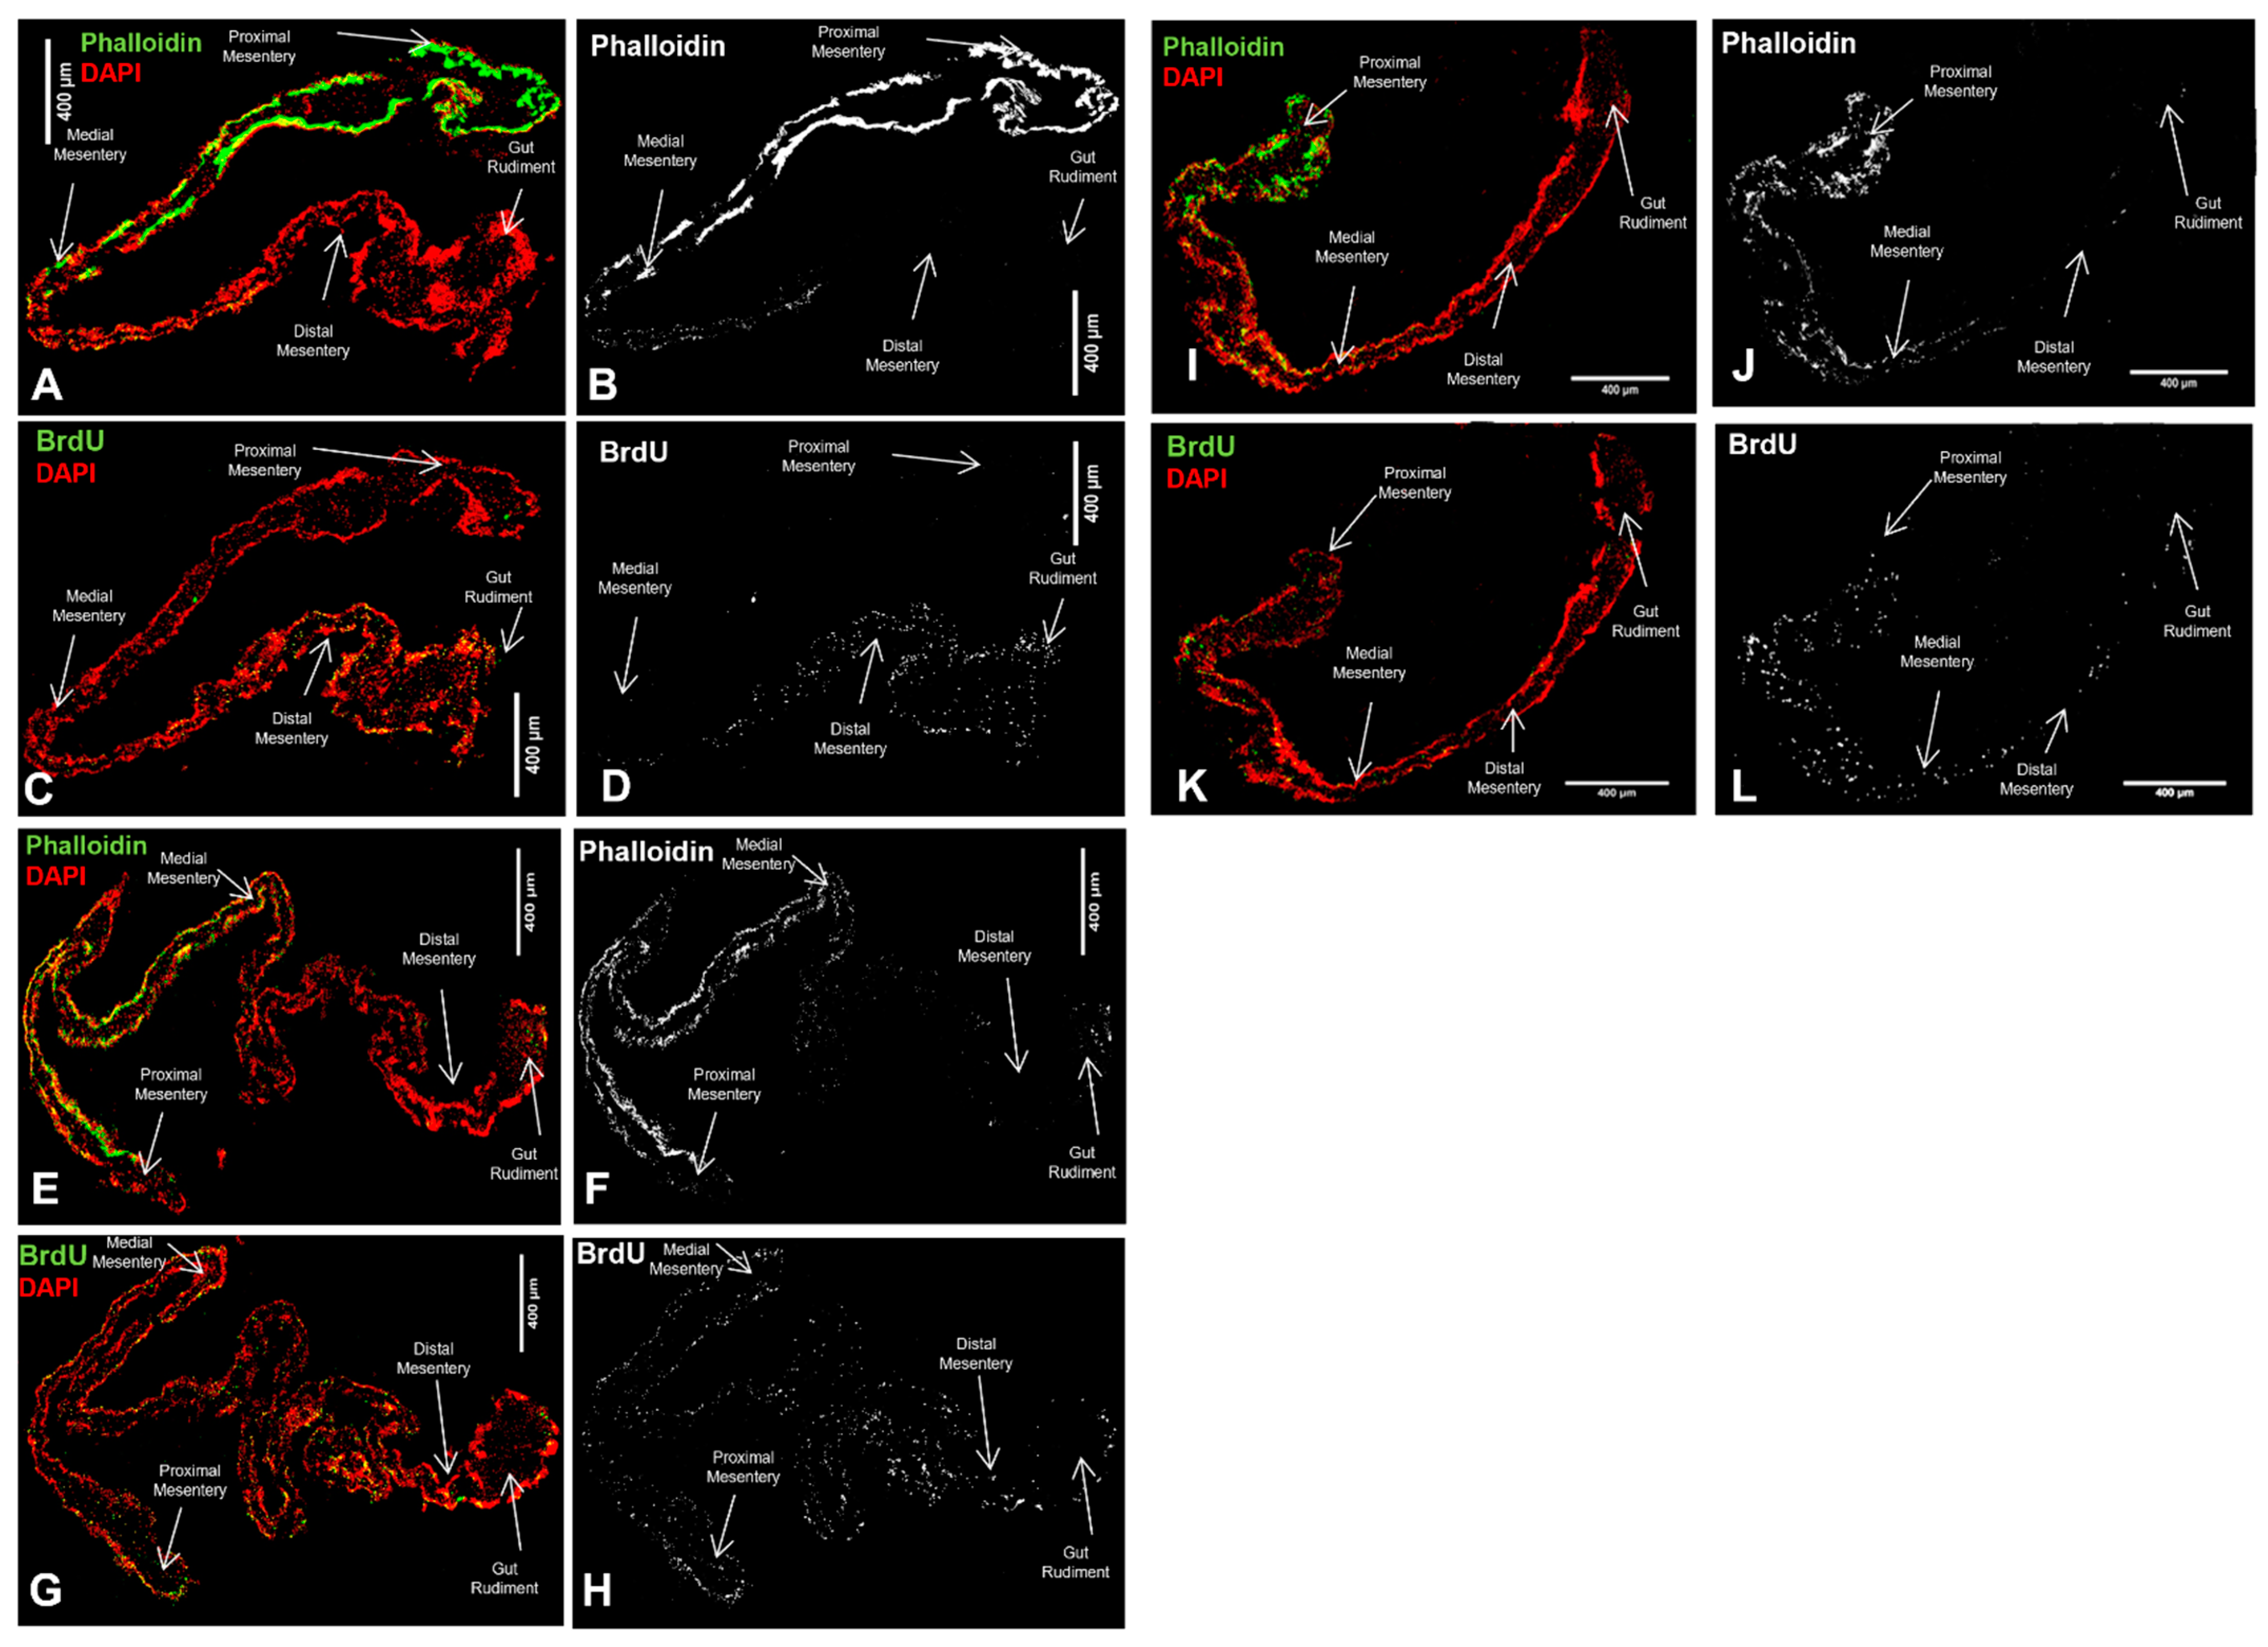
3.3. Cell Proliferation

The ability of cells to proliferate at early regenerative stages is an essential source of new cells for intestine regrowth. Here we evaluated the ability of cells in explants cultured for 24 h, 5 d, or 10 d to proliferate using a BrdU incorporation assay. The percentage of BrdU positive cells was determined in each region of the explants: gut rudiment and distal, medial, and proximal mesentery, to verify if the pattern in the localization of BrdU positive cells was similar in control and cultured explants. To confirm the localization of the gut rudiment and the proximal mesentery (which can be confounded) in cultured explants, we labeled tissue sections of the same explants with phalloidin (as the polarity in the localization of SLS is maintained, as was shown in Section 3.2) and anti-BrdU (See Figure A2). We found that the percentage and distribution pattern of BrdU immunoreactive cells differed in explants, according to the region analyzed and the time in culture (Figure 3). In explants cultured for 24 h, a higher percentage of BrdU positive cells were observed at the gut rudiment and distal mesentery (16.2 ± 9% and 15.0 ± 6.8%, respectively) (Figure 3A,D,G,H) compared to the medial and proximal mesenteric regions (5.5 ± 4% and 4.7 ± 5.1%, respectively) (Figure 3A,D,I,J). In explants cultured for 5 d, the percentage of proliferating cells was relatively constant (in the range of 7 to 9%) in the different regions of the explants (Figure 3B,E,G–J). On the contrary, in explants cultured for 10 d, a smaller percentage of BrdU positive cells was observed in the gut rudiment (1.03 ± 0.7%), and this value increased in the distal (2.6 ± 1.4%), medial (3.5 ± 3.1%), and proximal (3.7 ± 3.1%) regions of the mesentery (Figure 3C,F,G,J). In gut rudiments at 5 dpe in in vivo conditions, the BrdU positive cells were mainly observed in the gut rudiment and in the mesenterial region close to it (a portion of the distal mesentery) [16], similarly to the pattern observed here in explants cultured for 24 h.
These findings suggest that the polarity in the localization of proliferating cells changes in explants as the time in culture increases. When the percentage in BrdU cells found in the different regions of the explants were averaged for each sample, a significant reduction in the percentage of BrdU-labeled cells in explants cultured for 10 days compared with explants cultured for 24 h and 5 days (a reduction of 67% and 45%, respectively) was observed (Figure 3K). In explants cultured for 5 days there was a trend toward proliferation rate reduction, but no significant difference was found when compared to 24 h (Figure 3K). Overall, our results suggest changes in both the proliferation rate and the polarity in proliferating cells’ localization in explants cultured for 5 or more days.

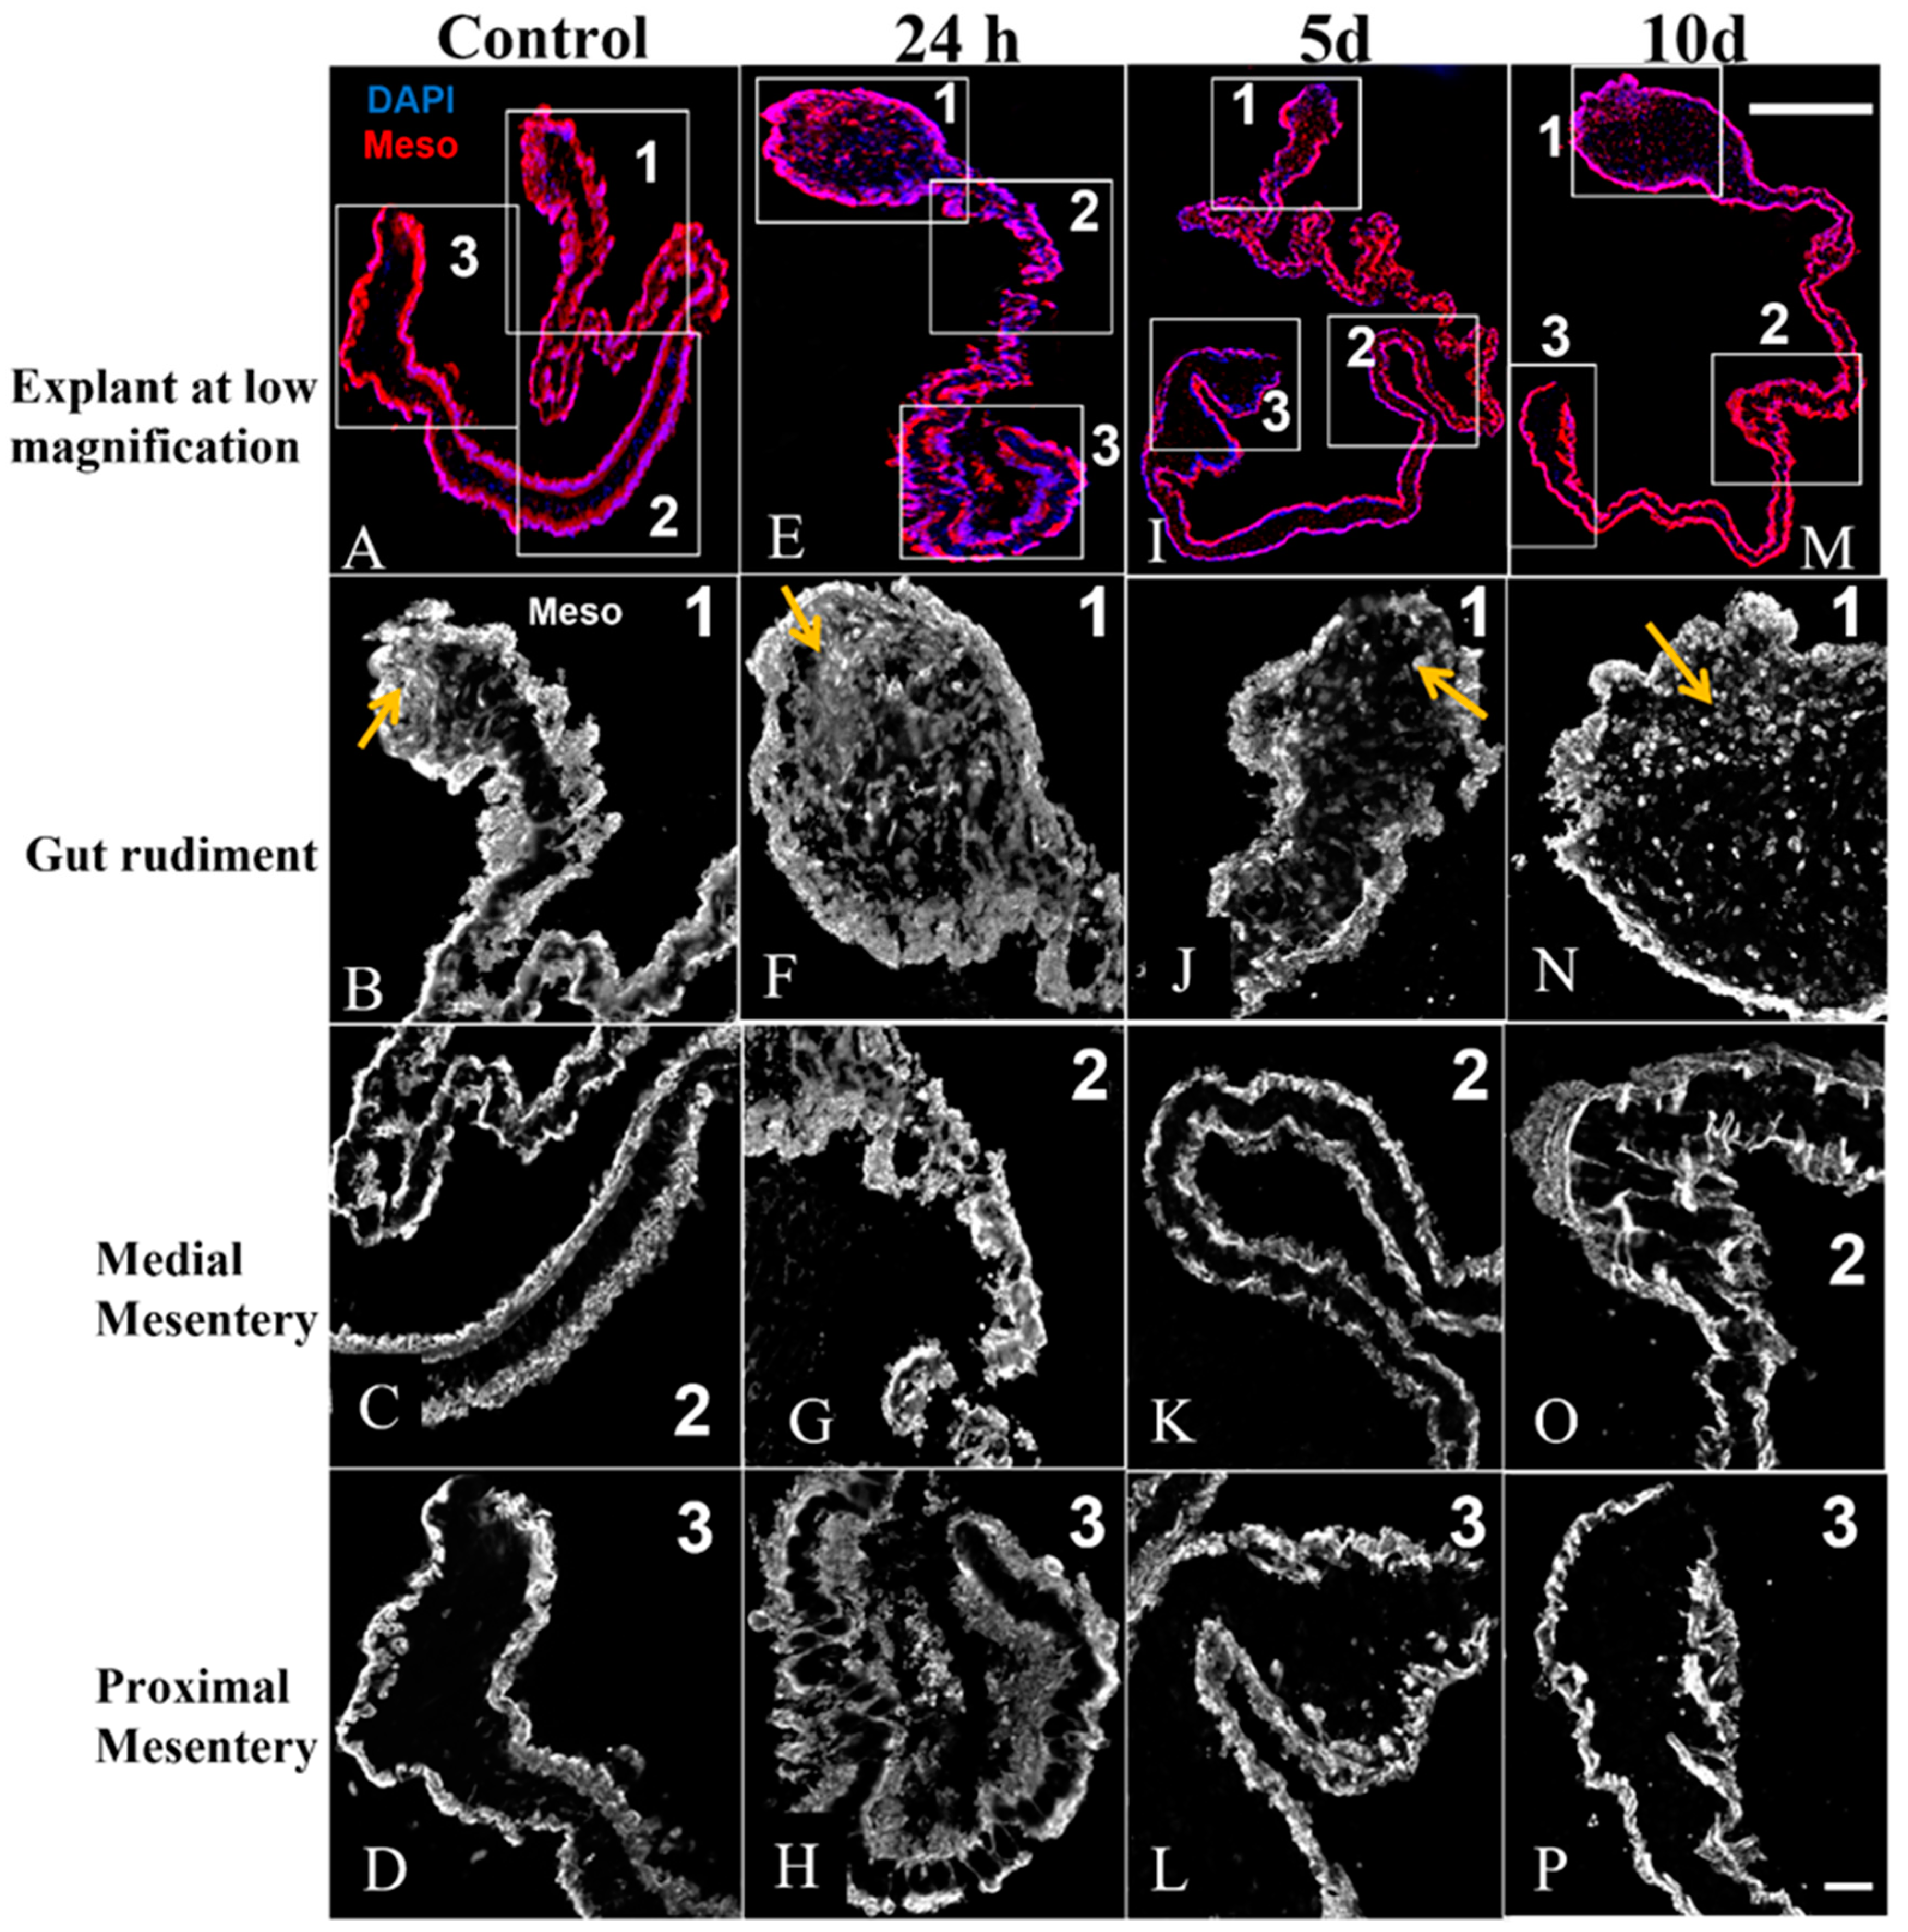
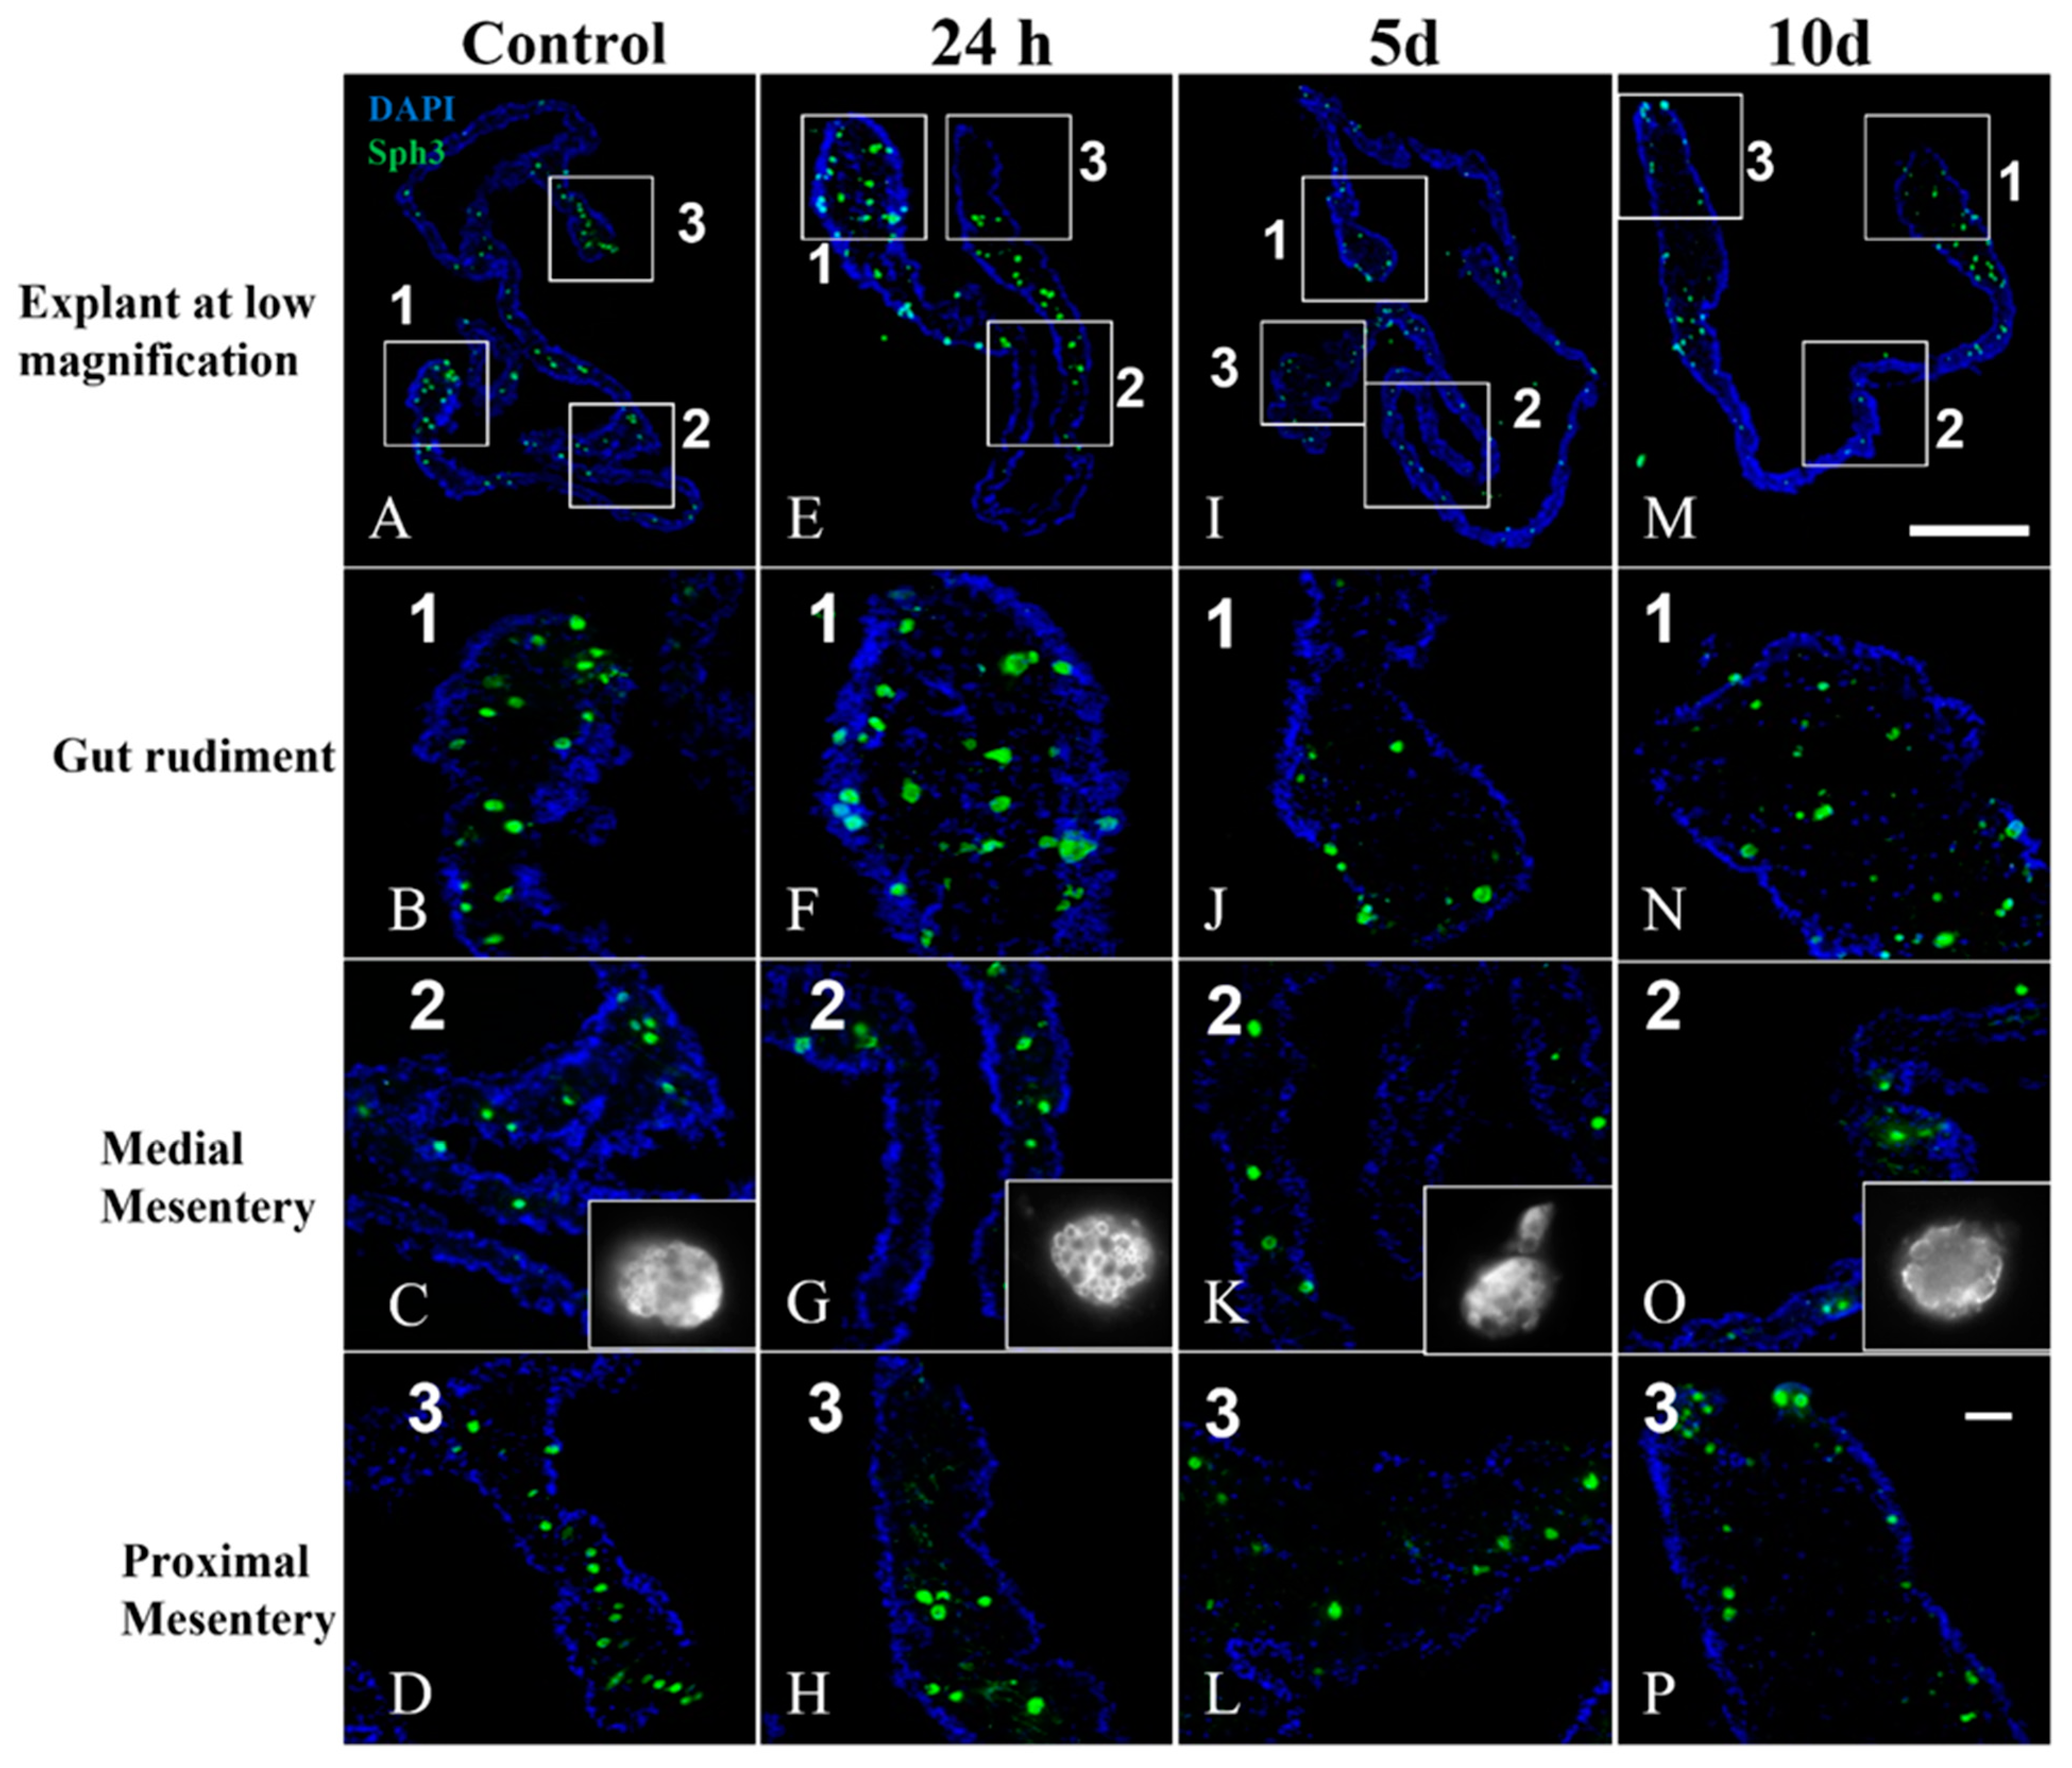
3.4. Mesothelium Labeling in Cultured Explants

The monoclonal antibody (Meso-1), developed in our lab, labels the intestinal and mesenteric mesothelial cells [16]. Here, we observed that control and cultured explants showed a similar pattern of intestinal and mesenteric mesothelium labeling with Meso-1 as that observed in 5 dpe animals. Meso-1 immunoreactive cells ingress from the mesothelium to the connective tissue in control and in explants cultured for 24 h (Figure 4B,F yellow arrows), and it appears to decrease after 5 and 10 days of culture (Figure 4J,N yellow arrows). Overall, culture of explants did not cause major changes in the intestinal or mesenteric mesothelium at the histological level.

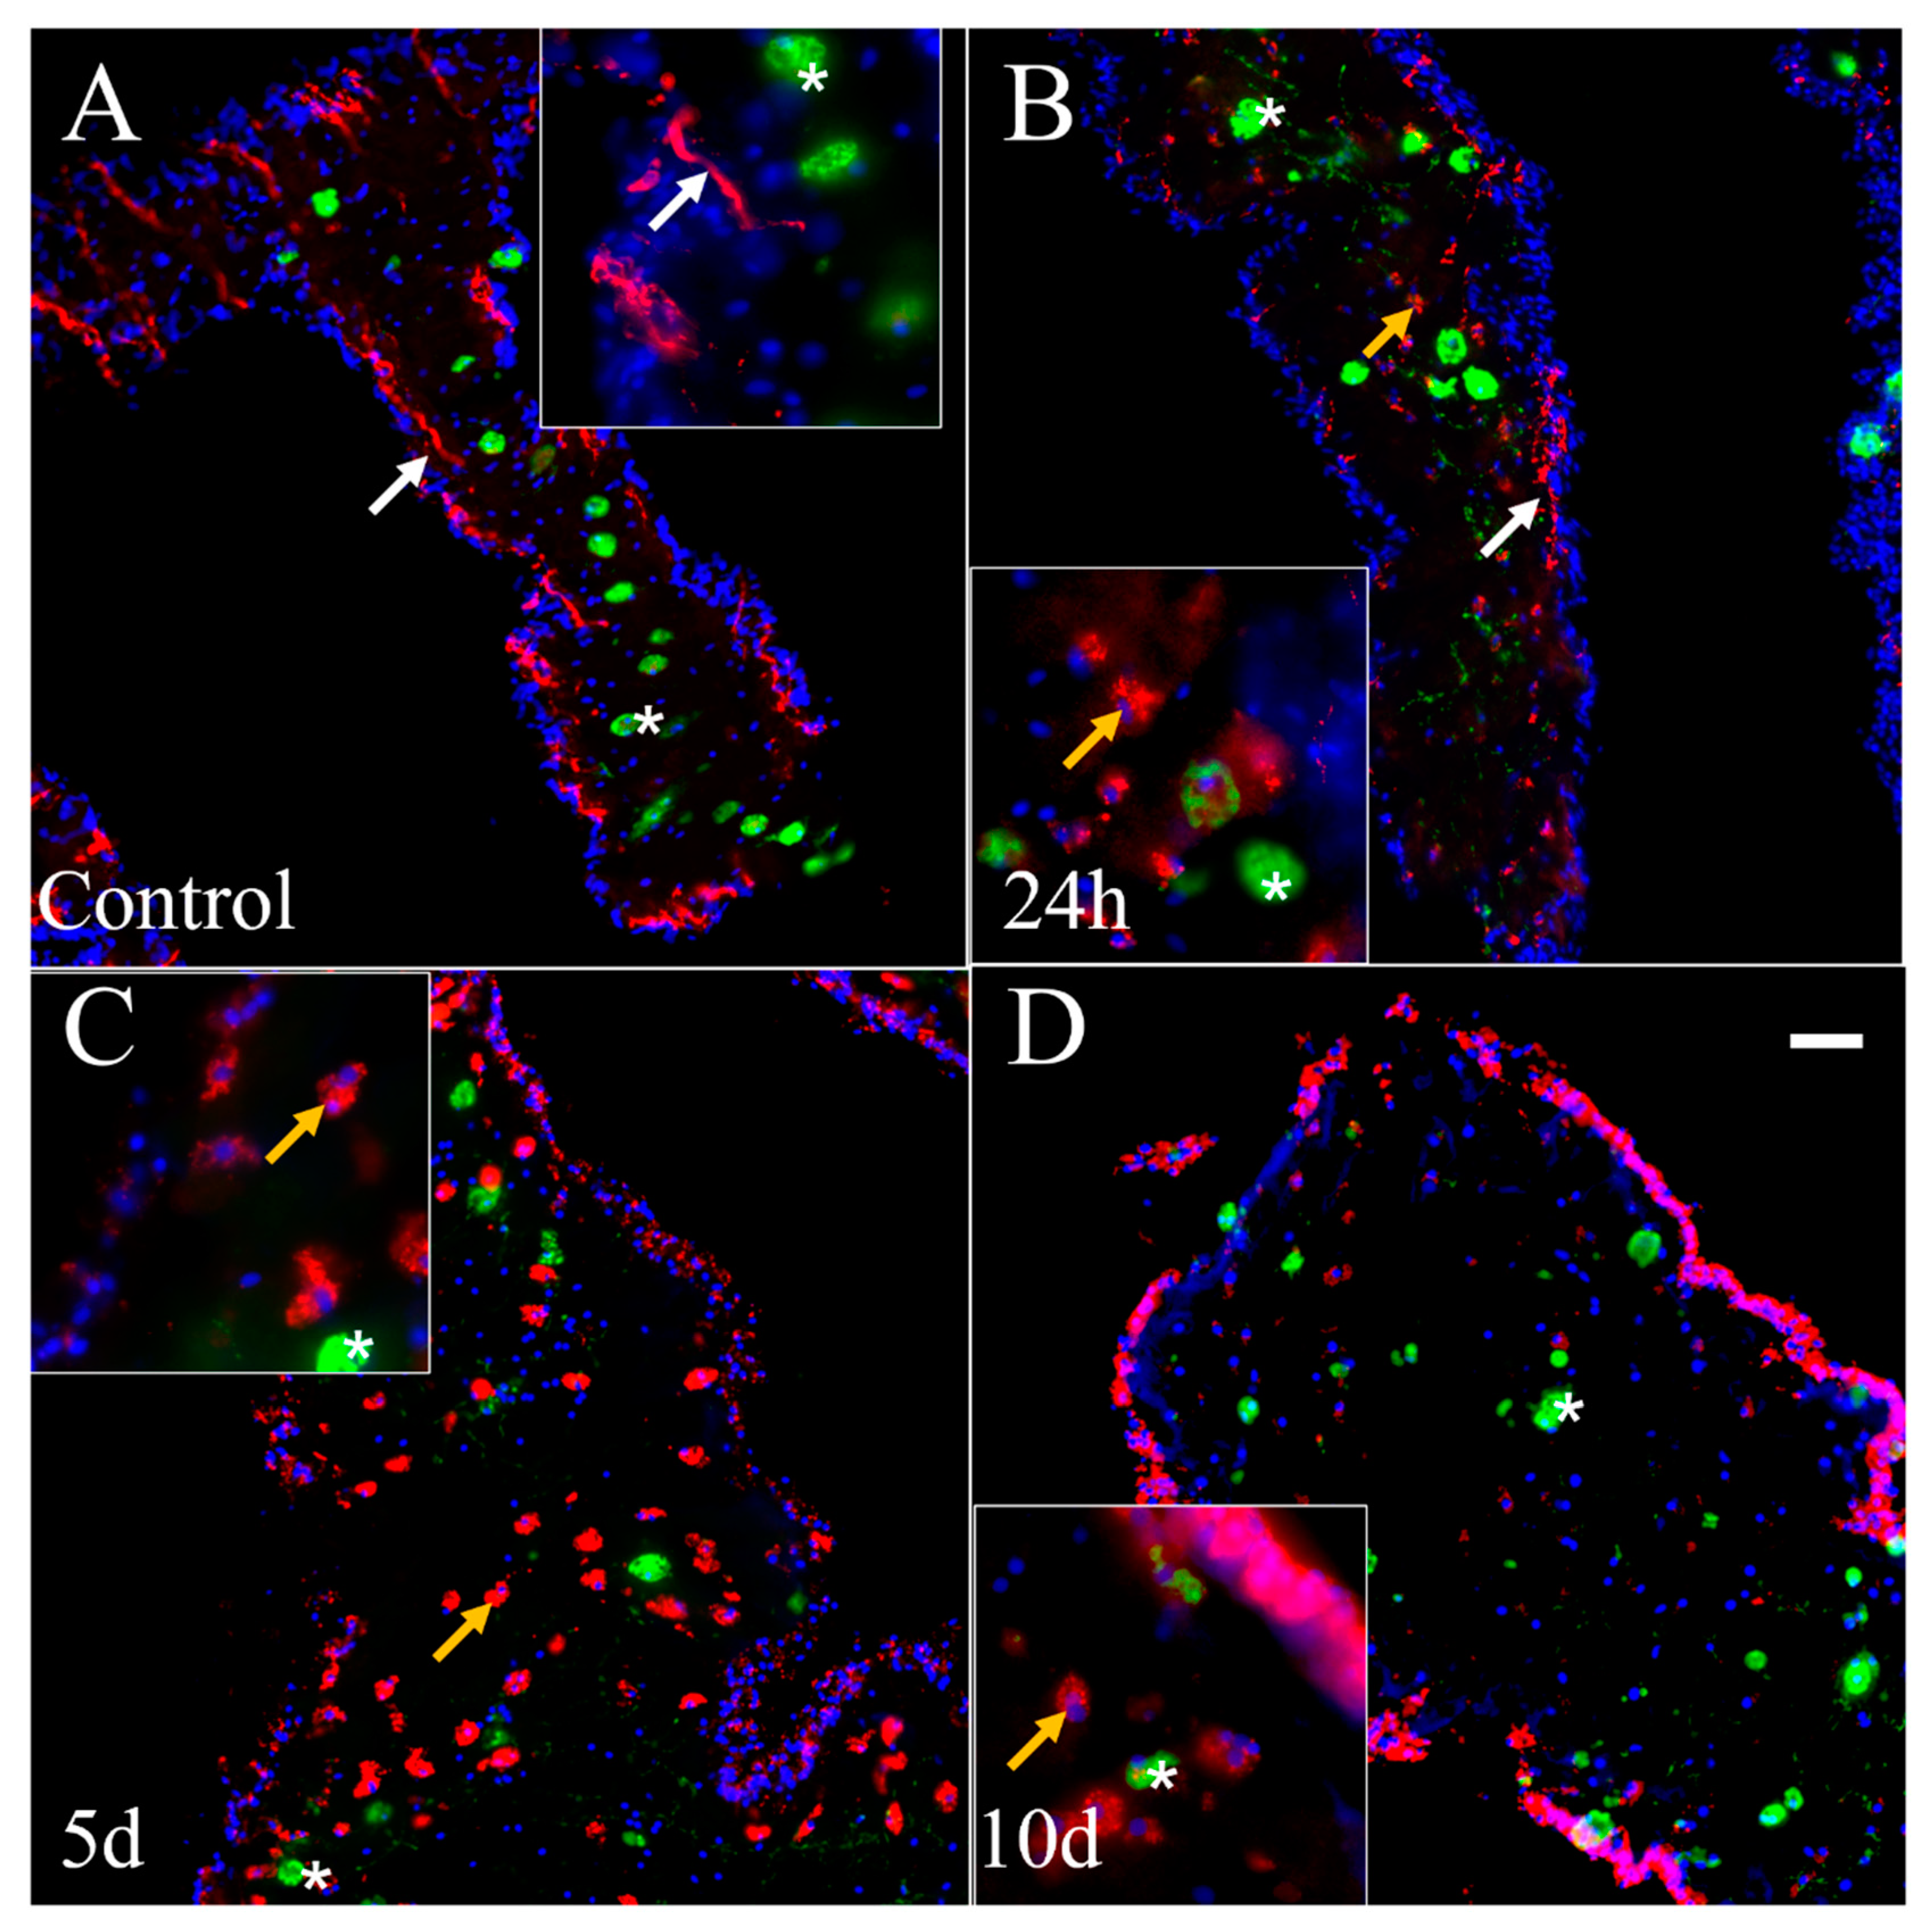
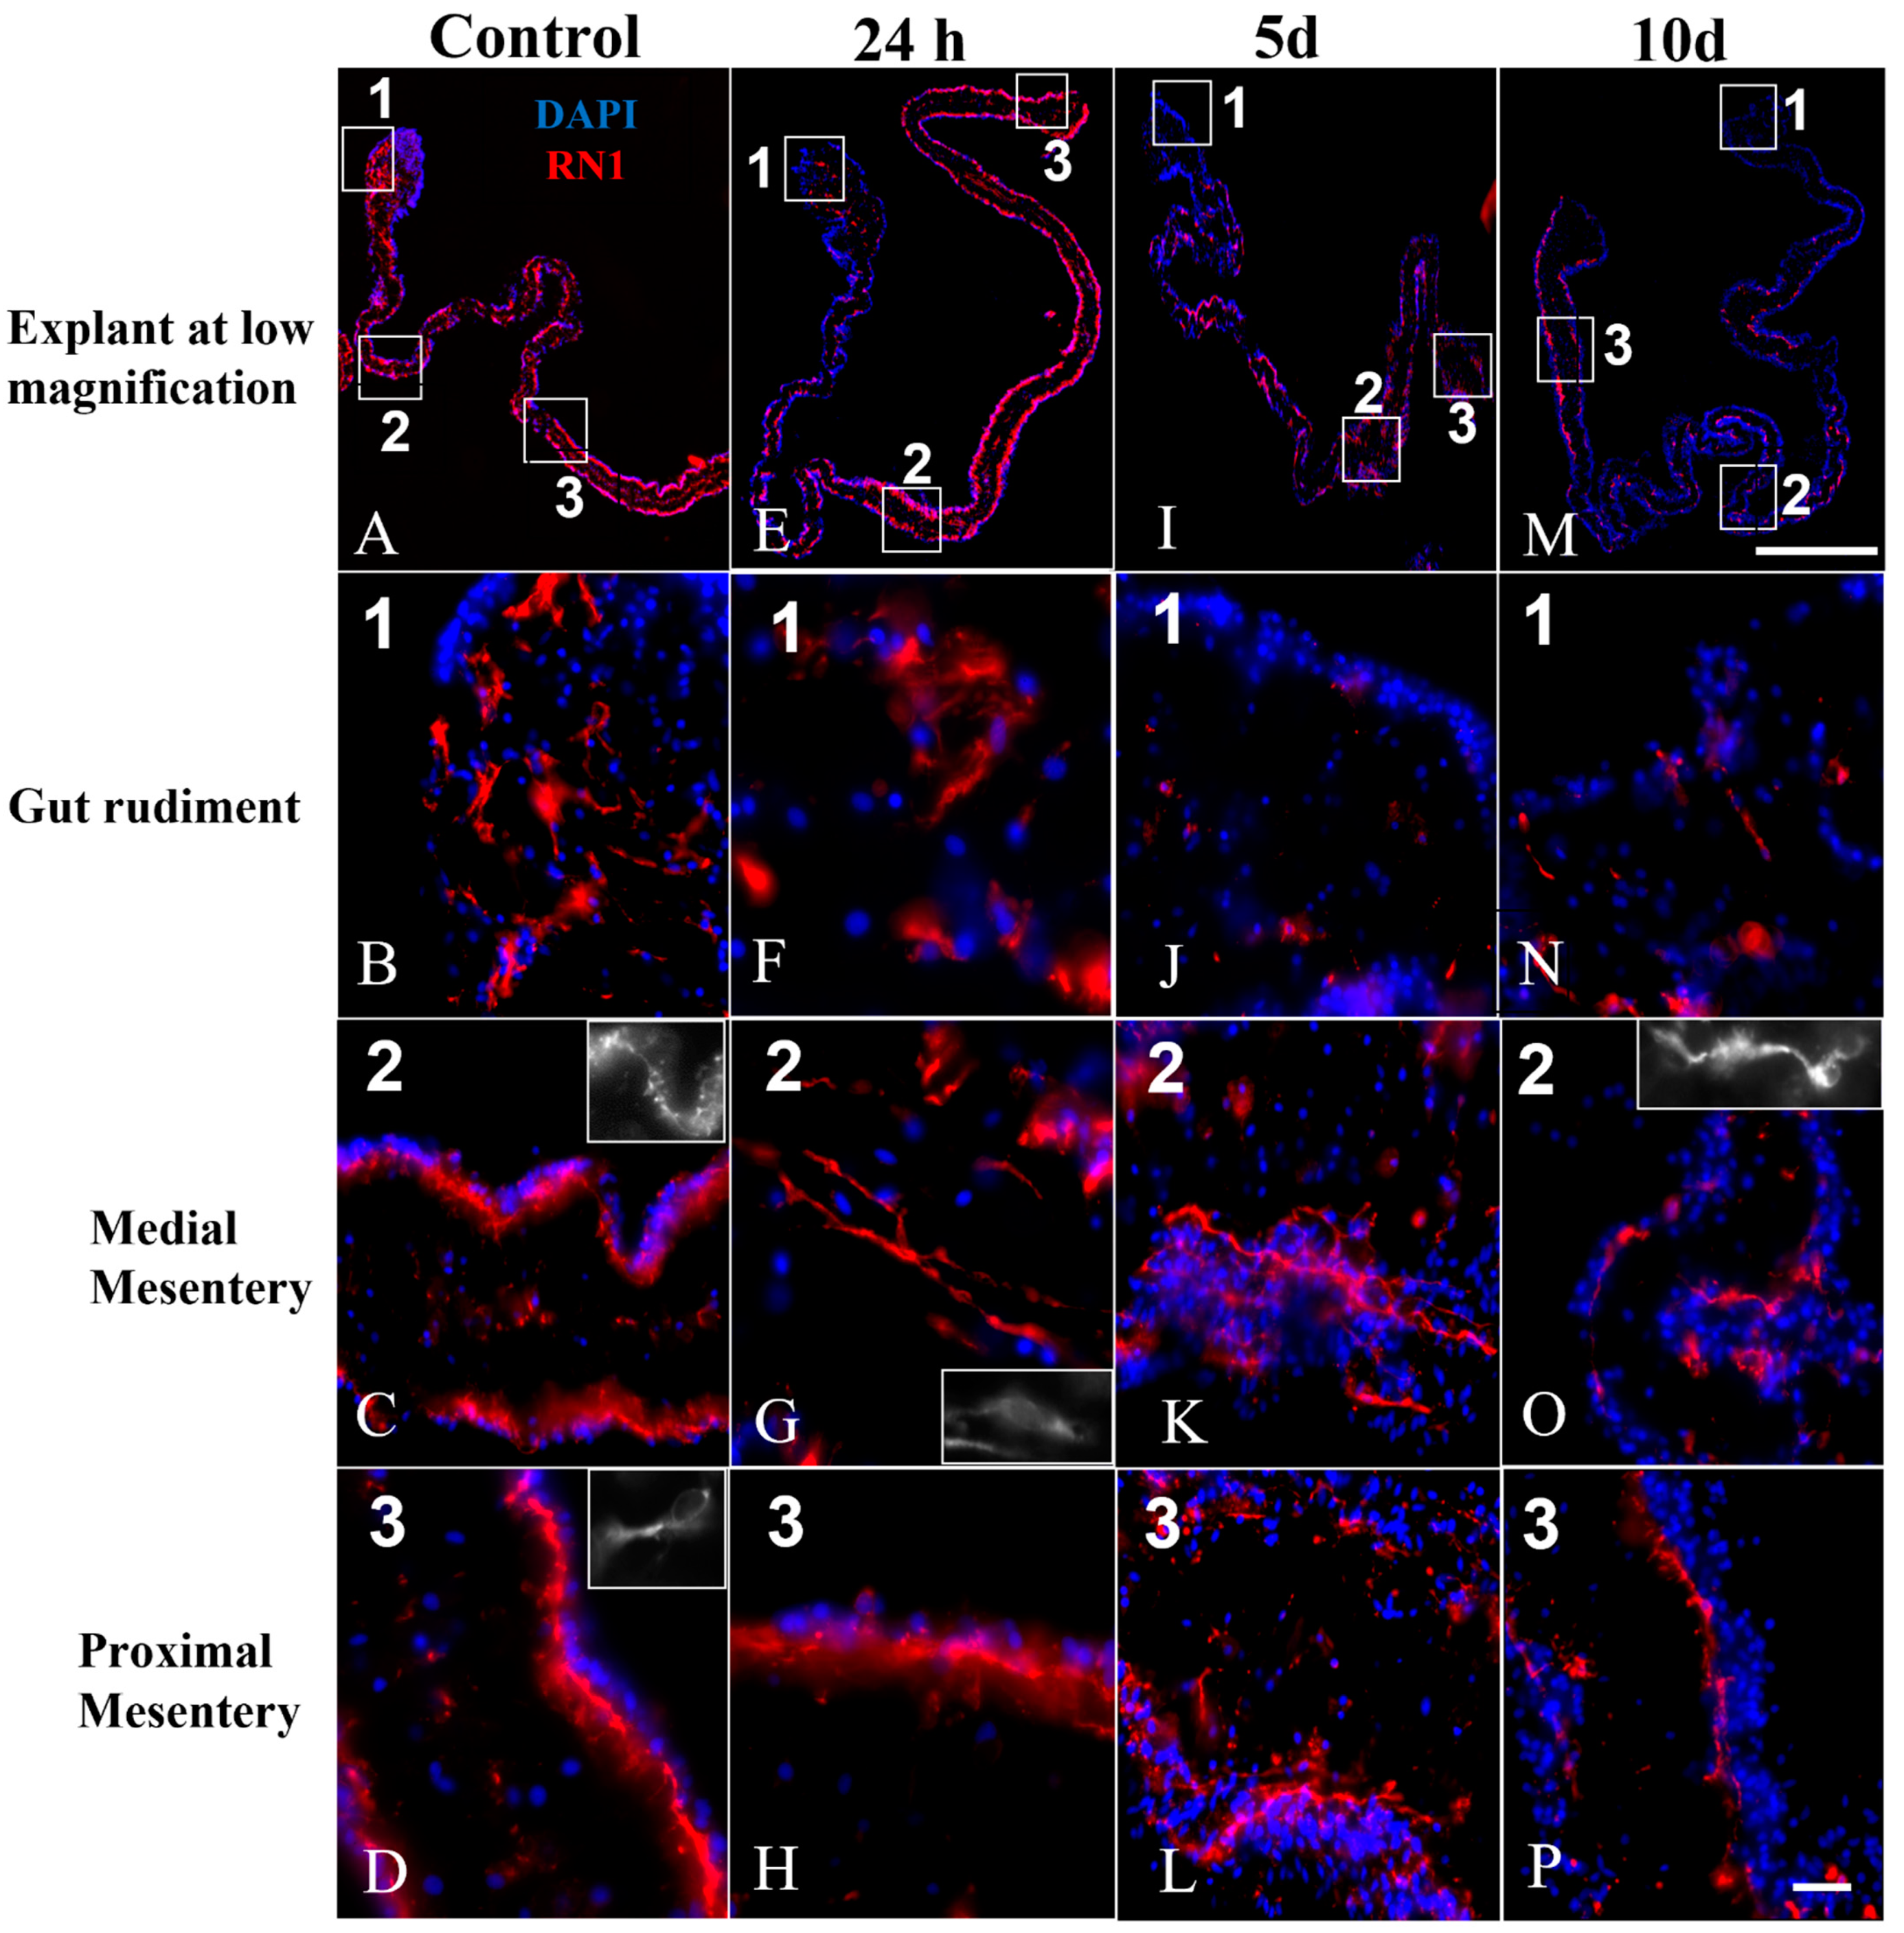
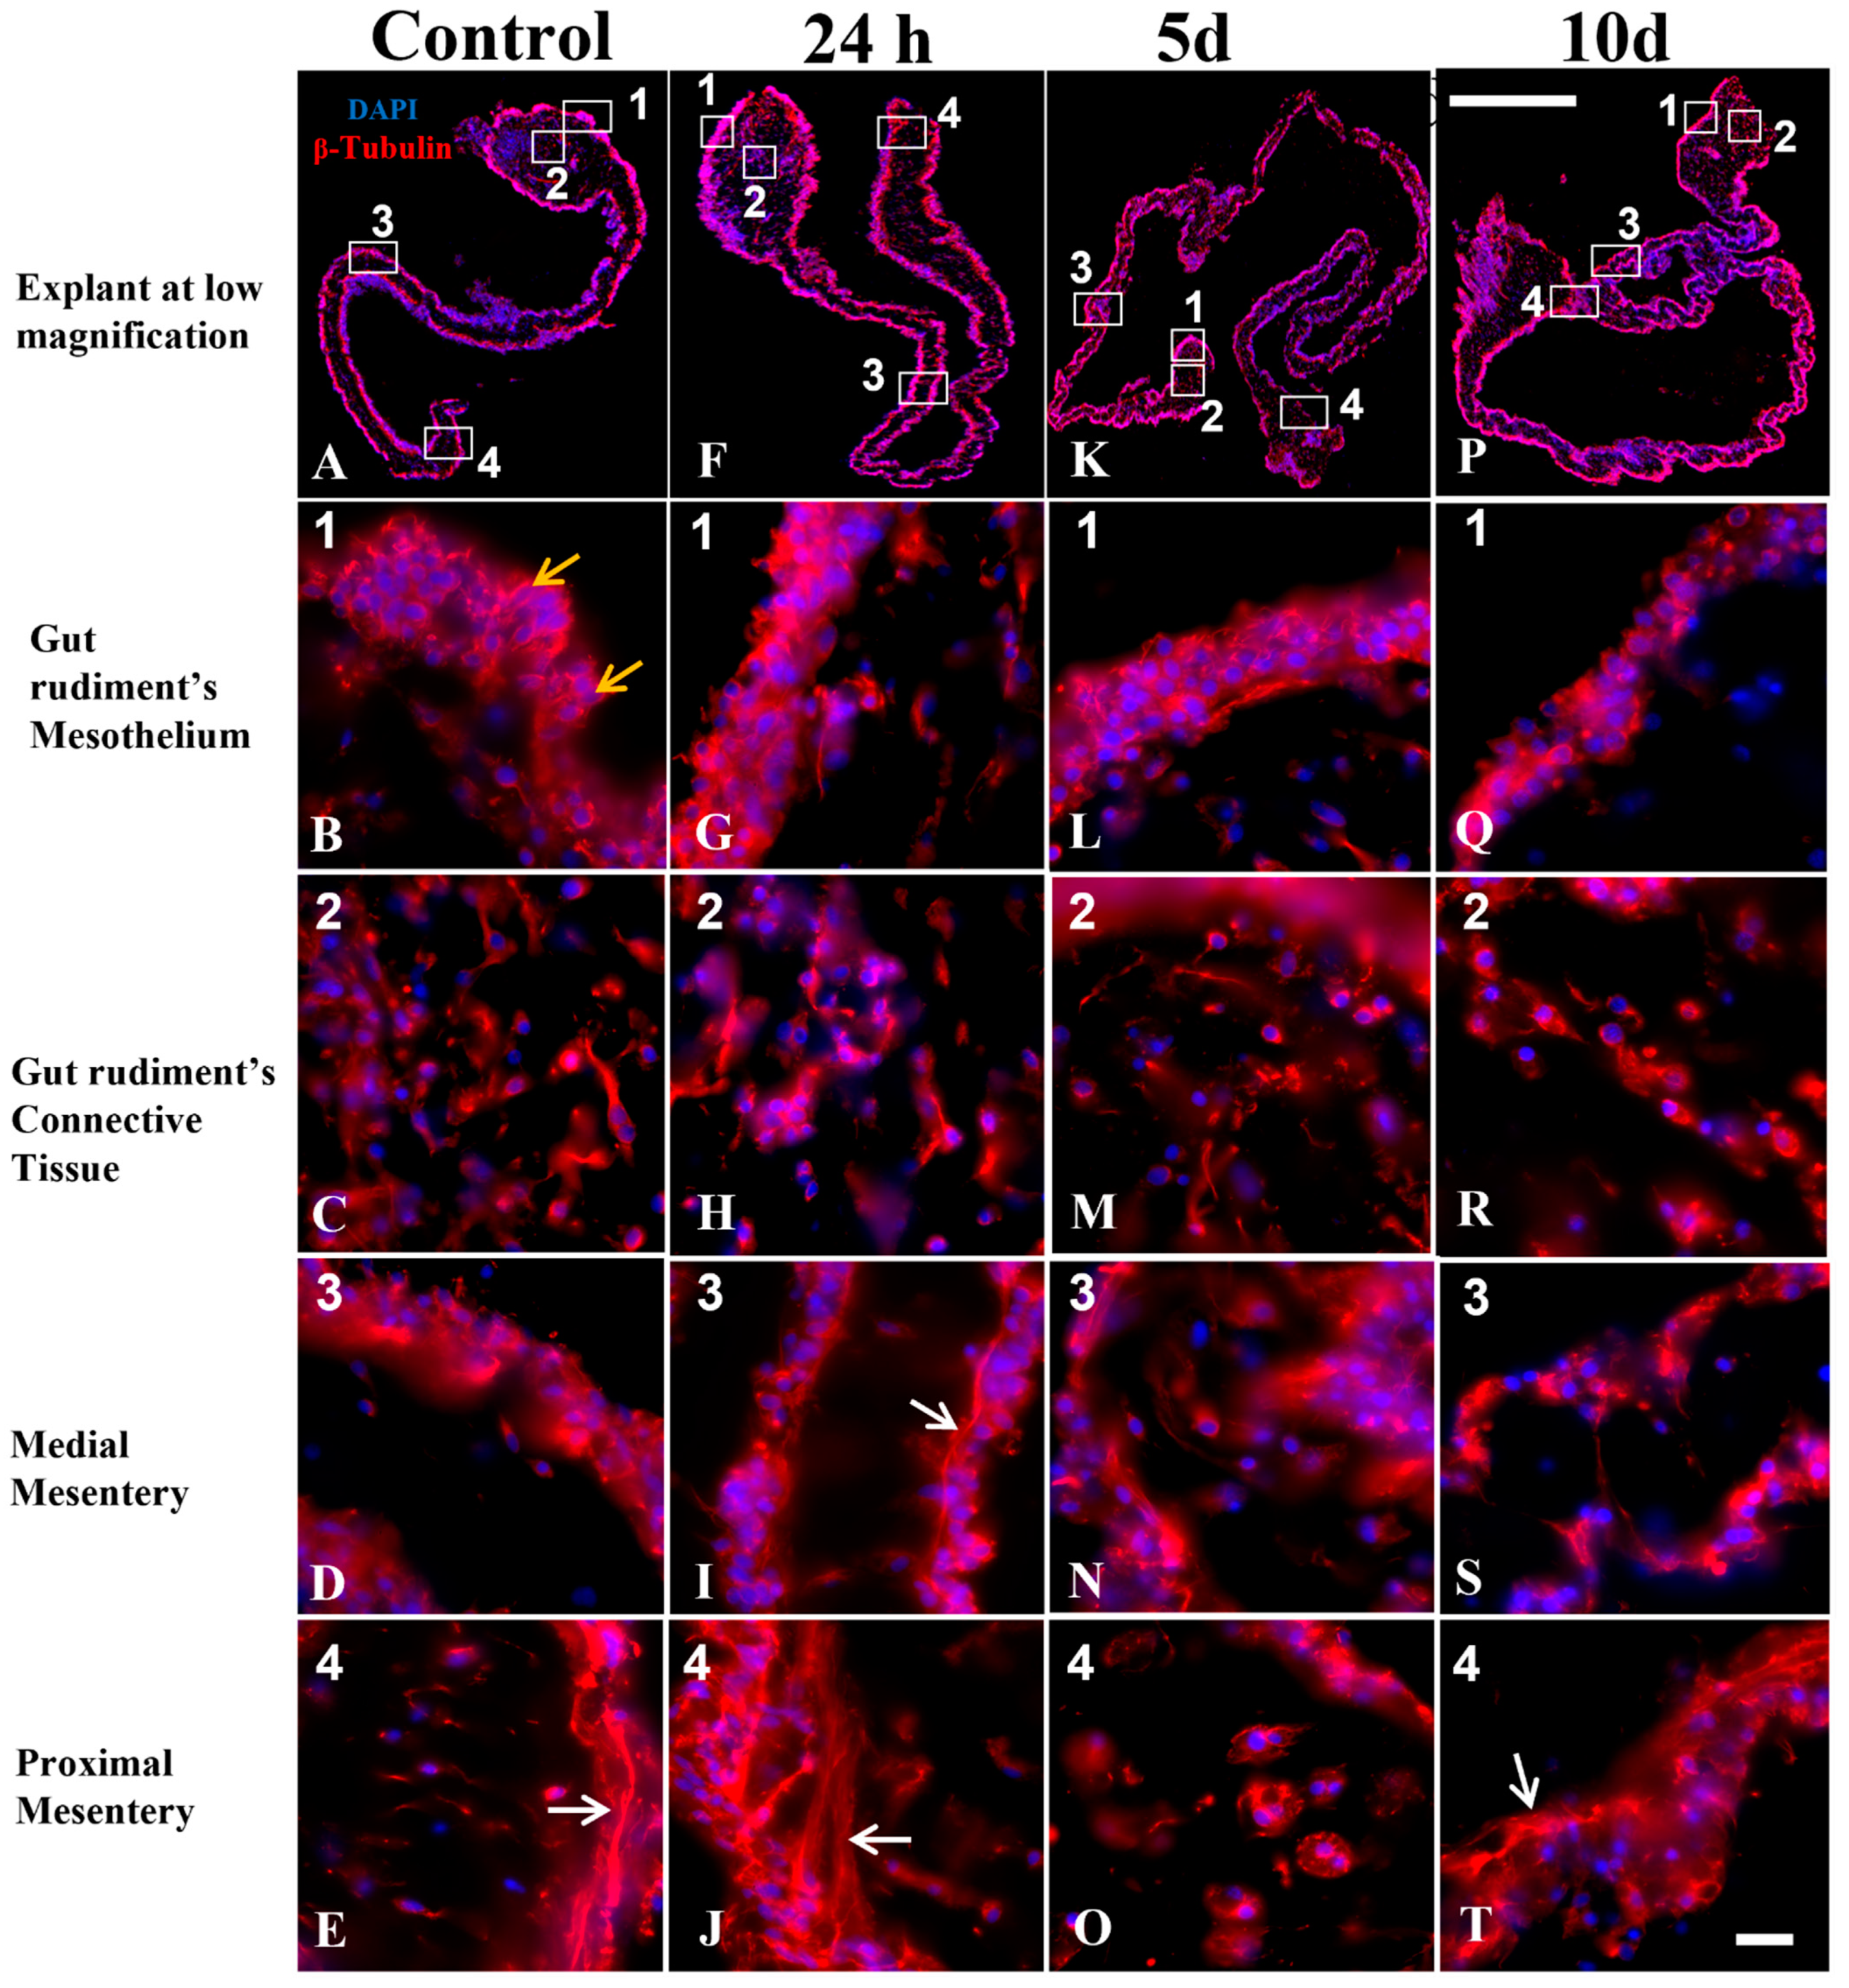
3.5. Nerve Fibers and Neuron-like Cells Labeled by Neuronal Markers in Cultured Explants

RN1. The monoclonal antibody RN1 was developed in our laboratory as a neuronal marker for holothurian tissues [18]. As has been shown in previous results of 5 dpe animals, in our controls and in explants cultured for 24 h, the RN1 antibody labeled disorganized nerve fibers, mainly in the connective tissue, but no neuron-like cells in the gut rudiment (Figure 5A,B,E,F). In the mesentery, both nerve fibers and neuron-like cells were observed as associated with the mesenterial mesothelium (mesothelial plexus) and in the connective tissue (connective tissue plexus) (Figure 5C,D,G,H). The RN1 immunoreactive cells in the mesenteric connective tissue were mainly ovoid-shaped with a short cell projection (Figure 5D, inset). In explants cultured for 5 or 10 d, only remnants of nerve fibers were observed at the gut rudiment (Figure 5I,J,M,N), while in the mesentery, nerve fibers and neuron-like cells were observed associated with the mesothelium, and only fibers were seen in the connective tissue (Figure 5K,L,O,P). Interestingly, a smaller number of nerve fibers appeared to be present in cultured explants over time. In summary, nerve fibers and neuron-like cells immunoreactive for RN1 were observed in both control and cultured explants, but a reduction in their number was found with culture time.
Anti-β-Tubulin. This antibody is a neuronal marker that has been used to label both neural cells and fibers in H. glaberrima in vivo; however, it may also recognize other cell types, such as peritoneocytes and non-neural connective tissue cells. The labeling pattern varies depending on the antibody used, its dilution, and the regenerative stage studied [17]. Here, we observed a similar staining pattern, with the anti-β-tubulin antibody in control and explants cultured for 24 h, 5 d, and 10 d. Mesothelial cells or peritoneocytes, from both the gut rudiment and the mesentery were immunoreactive for anti-β-tubulin. Although the boundaries of peritoneocytes were not clear, in some areas it was evident that they were polygonal or columnar (Figure 6B,G,L,Q). Additionally, some of the cells of the connective tissue were also labeled with this antibody. Most of these cells were spherical, but some were elongated or irregular in shape (Figure 6C,H,M,R). Nerve fibers immunoreactive for β-tubulin were observed mainly in the proximal mesentery, although scarce fibers were also seen in the medial mesentery (Figure 6D,E,I,J,N,O,S,T). No immunoreactive fibers to β-tubulin were observed at the gut rudiment or distal mesentery (Figure 6B,G,L,Q). Overall, a similar staining pattern of neural and non-neural components in control and cultured explants by anti- β-tubulin was observed here.
GFS. The polyclonal antibody developed against the neuropeptide GFSKLYFamide (hereafter referred as anti-GFS) has been used in our model H. glaberrima as a neuronal marker in normal and regenerating tissues [17,20,26]; however, it may also recognize nonspecifically spherulocytes or morula cells [26]. Here, we observed differences in the tissue components labeled with anti-GFS between control and cultured explants. In control explants, we observed GFS immunoreactive nerve fibers mainly in the connective tissue of the gut rudiment or associated with the mesenterial mesothelium (mesothelial plexus) (Figure 7A–D). No cells immunoreactive for GFS were observed in control explants in gut rudiment or mesentery. A similar pattern of GFS labeling was observed in explants cultured for 24 h; however, few GFS-immunoreactive ovoid, or irregular, shaped cells were observed in the connective tissue of the proximal mesentery. These cells somewhat resembled morula cells or spherulocytes and were never observed to be labeled with anti-GFS in tissues of control animals. Additionally, a smaller number of nerve fibers were seen in gut rudiment and mesentery (Figure 7E–H). Some of the mesenterial mesothelial cells (medial and proximal regions) were immunoreactive for GFS after 5 days in culture. Additionally, more GFS-immunoreactive cells were observed in the connective tissue of the mesentery, specifically in the medial and proximal regions (Figure 7K,L and insets). (Figure 7A–D). Explants cultured for 10 days showed GFS immunoreactive cells in both the coelomic epithelium and the connective tissue of gut rudiment and mesentery, but no GFS immunoreactive nerve fibers were observed (Figure 7M–P). The GFS-immunoreactive cells observed at day 10 of culture displayed the same morphology as those observed at day 1 and 5 of culture. Overall, in vitro conditions led to changes in the GFS labeling pattern of cells and fibers in gut explants over time.

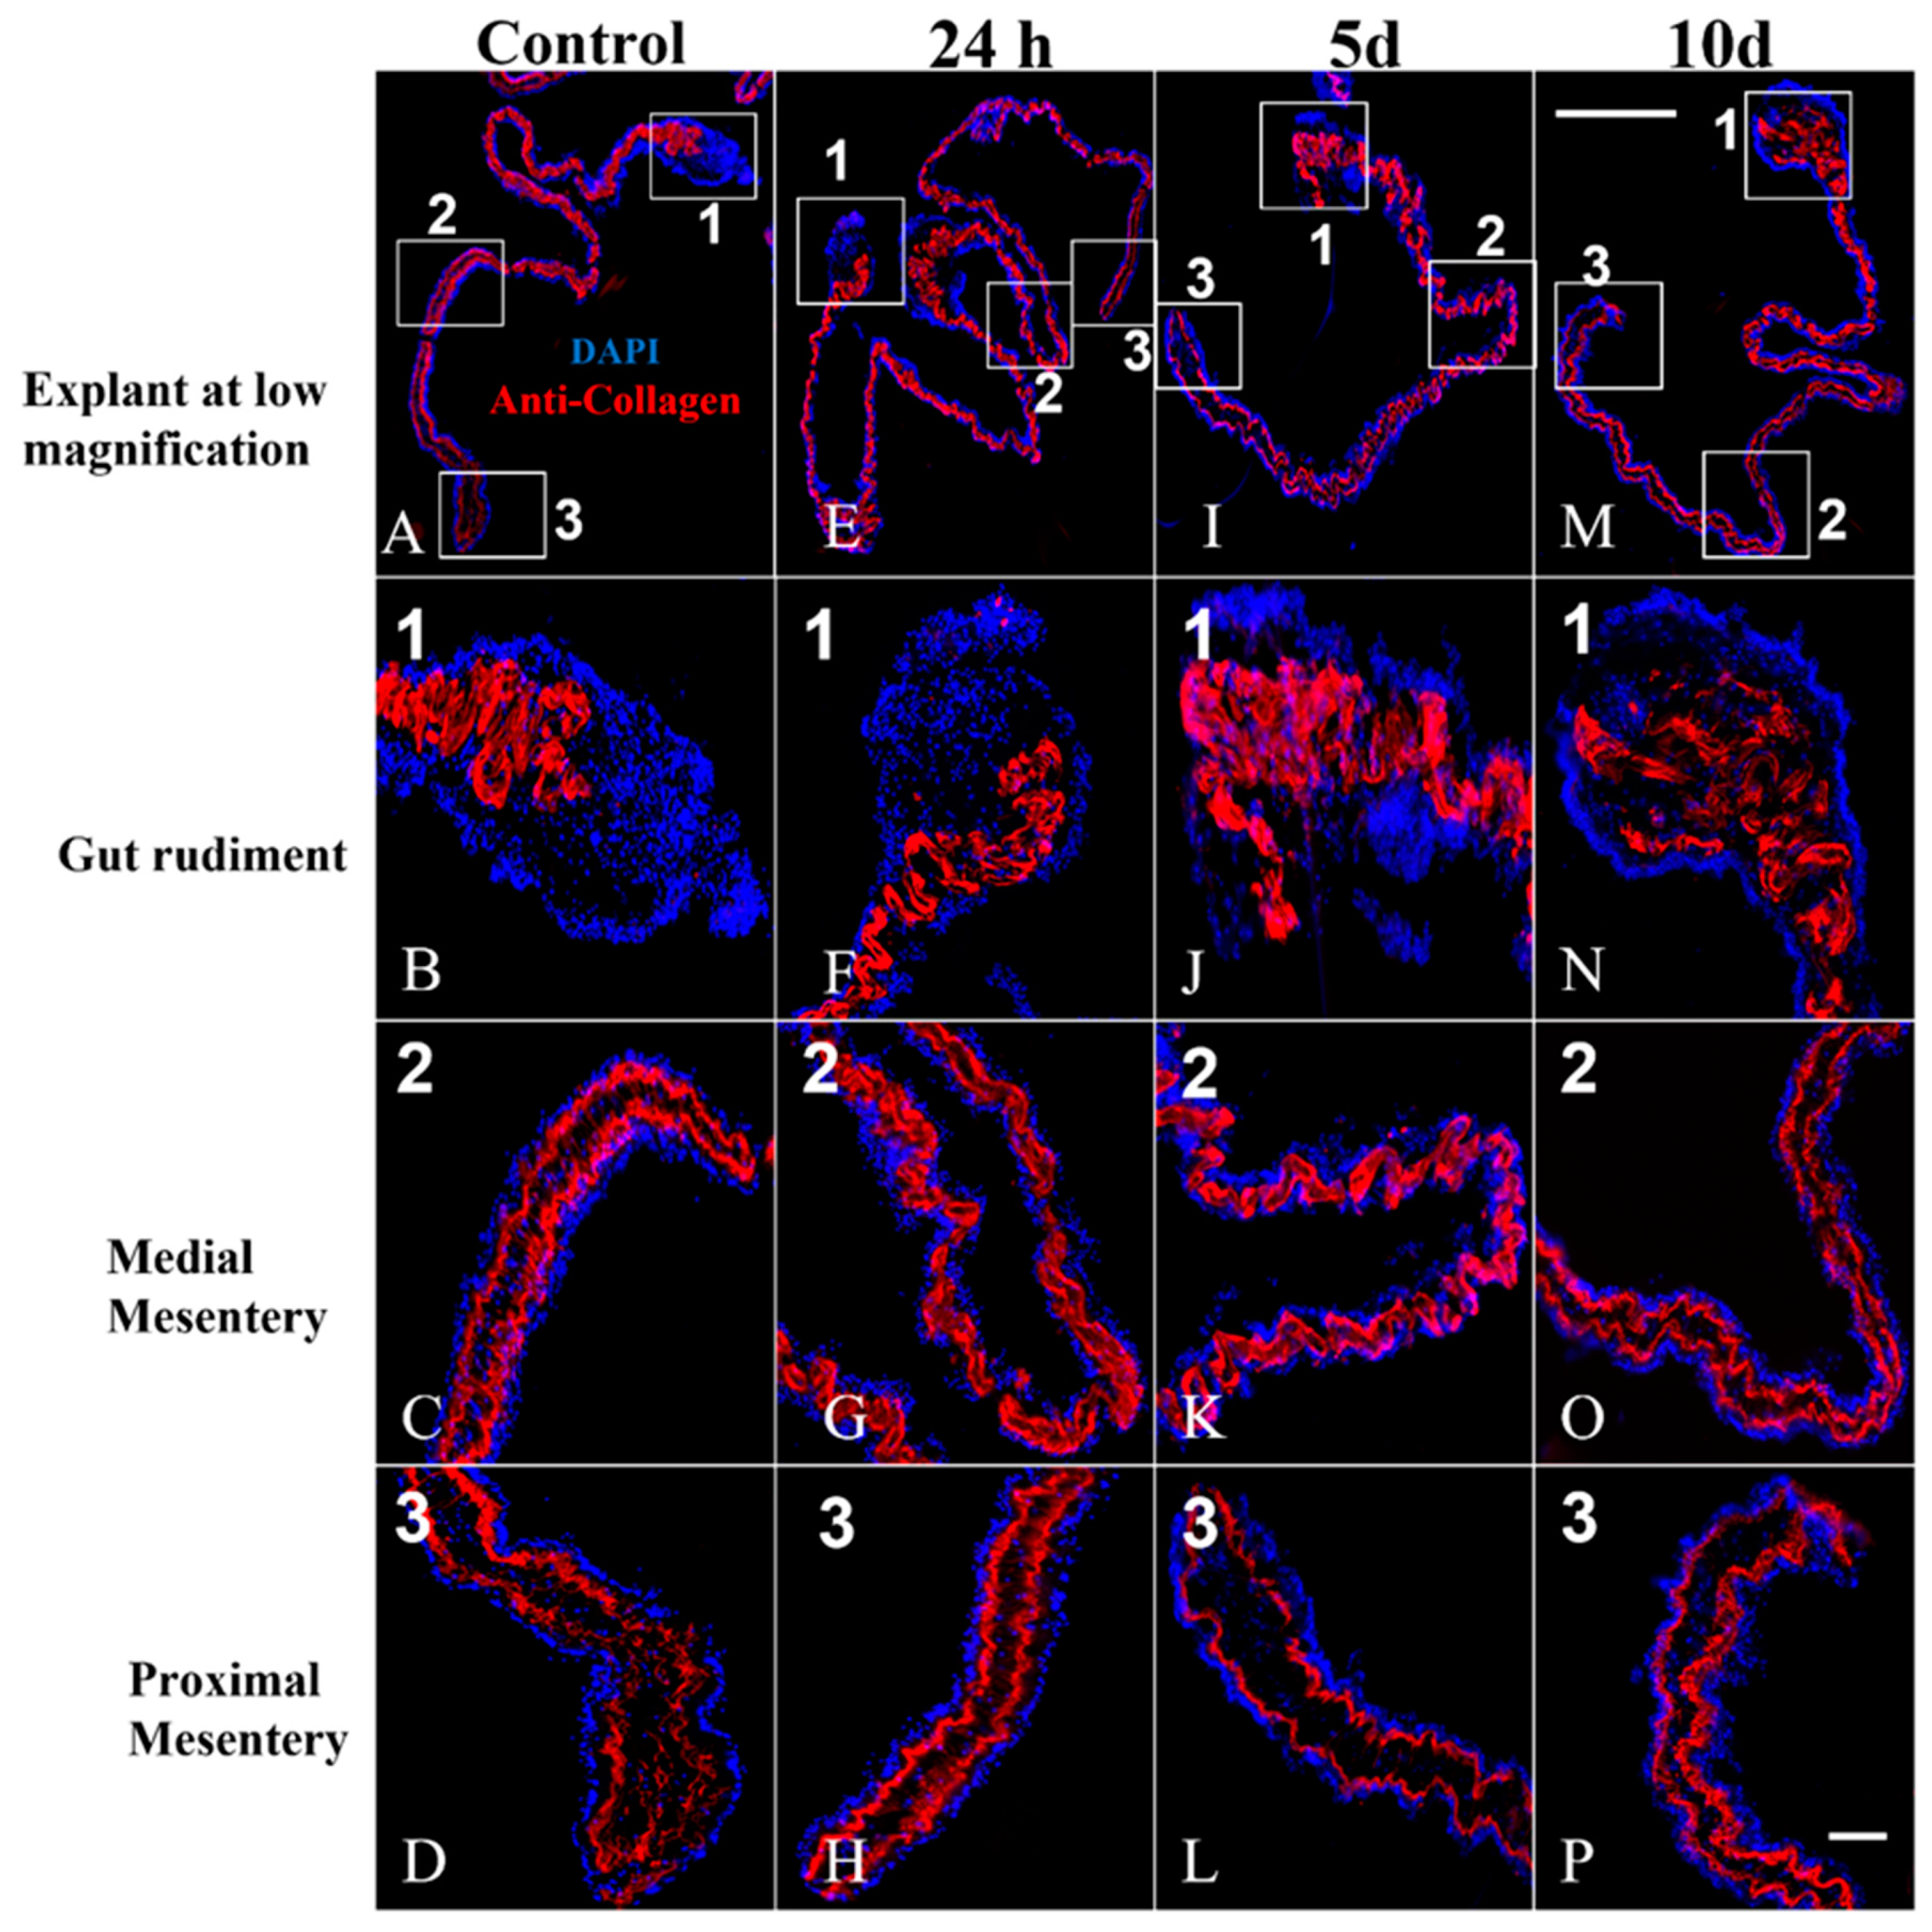
3.6. Components of the Connective Tissue in Cultured Explants

Fibrillar collagen. The monoclonal antibody Hg-fCOL, which binds specifically to fibrillar collagen, has been used to show how the ECM undergoes dramatic changes during regeneration [22]. The fibrous collagen disappears from the gut rudiment and later from all the mesentery as intestine regeneration advances (at 7 dpe, collagen is not observed in the gut rudiment nor in the mesentery). Later on, after lumen appearance in the newly formed intestine, collagen reappears. Here, we found that, as expected for a regenerating intestine at 5 dpe, the fibrillar collagen had disappeared in certain areas of the gut rudiment but was present all along the mesentery in control explants (Figure 8A–D). A similar distribution of collagen was observed in explants cultured for 24 h (Figure 8E–H), 5 d (Figure 8I–L), or 10 d (Figure 8M–P), suggesting that the in vitro conditions did not change the localization of the collagen. Thus, our findings suggest that the histological characteristics of the extracellular matrix in cultured gut explants remained similar to the 5 dpe in vivo counterpart.
Spherulocytes or morula cells. The monoclonal antibody Sph3 was also developed in our laboratory as a marker for spherulocytes or morula cells; a subpopulation of cells found in the connective tissue of holothurians tissues [21]. Here, we found scattered cells labeled with the Sph3 antibody in control explants (Figure 9A–D), as well as in explants cultured for 24 h (Figure 9E–H), 5 d (Figure 9I–L), and 10 d (Figure 9M–P), following no particular pattern of distribution. The Sph3- immunoreactive cells observed in both control and cultured explants displayed the characteristic morphology of spherulocytes: round or oval with numerous spherule-like structures in their interior (insets in Figure 9C,G,K,O).

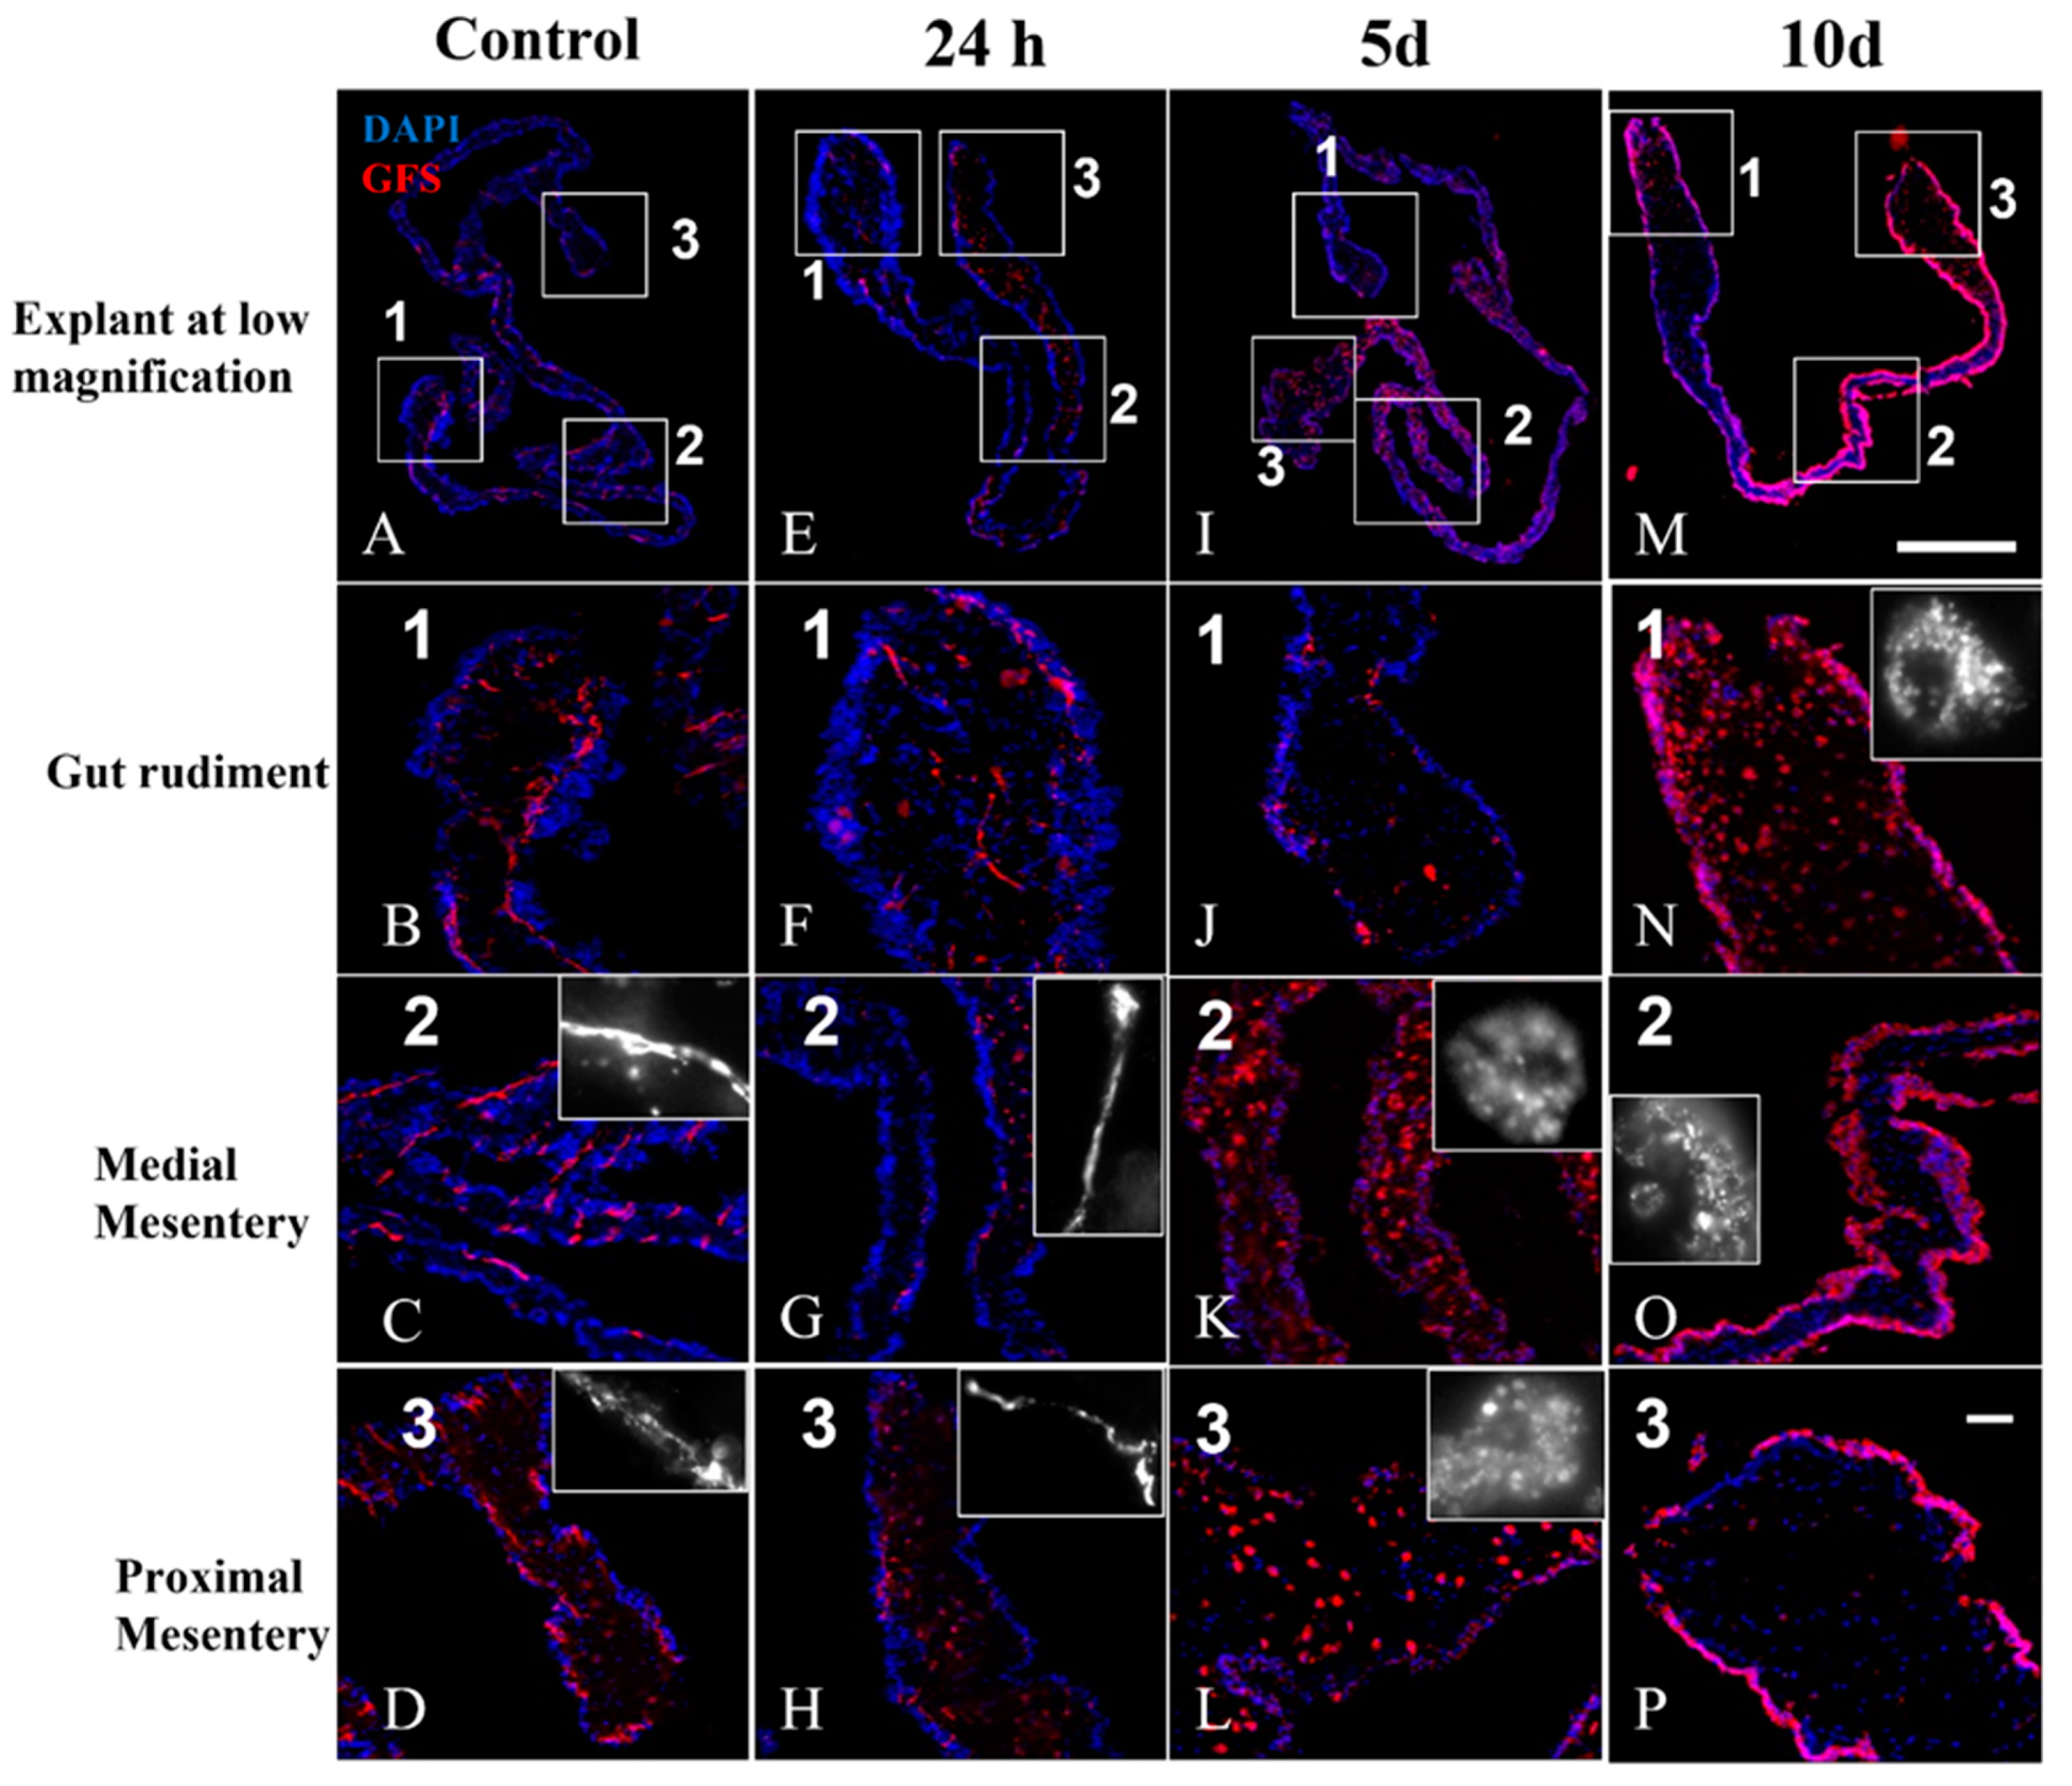
3.7. Double Labeling (GFS and Sph3) in Cultured Explants

As both GFS and Sph3 antibodies label cells resembling spherulocytes, we decided to perform a double labeling of cultured tissues, to determine if the spherulocyte-like cells were co-labeled with both antibodies, which could suggest that they correspond to the same cell population. We found that no co-labeling of Sph3 and GFS was observed in control or cultured explants. In control explants only nerve fibers were immunoreactive for GFS (Figure 10A, white arrow), while ovoid cells were immunoreactive for Sph3 (Figure 10A, asterisk). In explants cultured for 24 h, nerve fibers and irregular shaped cells immunoreactive for GFS were observed (Figure 10B, white and yellow arrows, respectively). Additionally, ovoid Sph3-immunoreactive cells were observed (Figure 10B, asterisk). These cells were not co-labeled with GFS and Sph3 antibodies. GFS positive cells, both at the mesothelial and connective tissue, were found in explants cultured for 5 days. Few Sph3 cells were observed in the connective tissue (Figure 10C). After 10 days in culture, a strong GFS immunoreactivity in the mesenterial mesothelium was observed. Additionally, cells immunoreactive for GFS or Sph3 were observed in the connective tissue (Figure 10D). Remarkably, each antibody appears to label a different subset of cells. Overall, the appearance and increase in the number of GFS-immunoreactive cells with culture time correlated with the disappearance of GFS-positive nerve fibers. The GFS-labeled cells were not co-labeled with the Sph3 antibody.

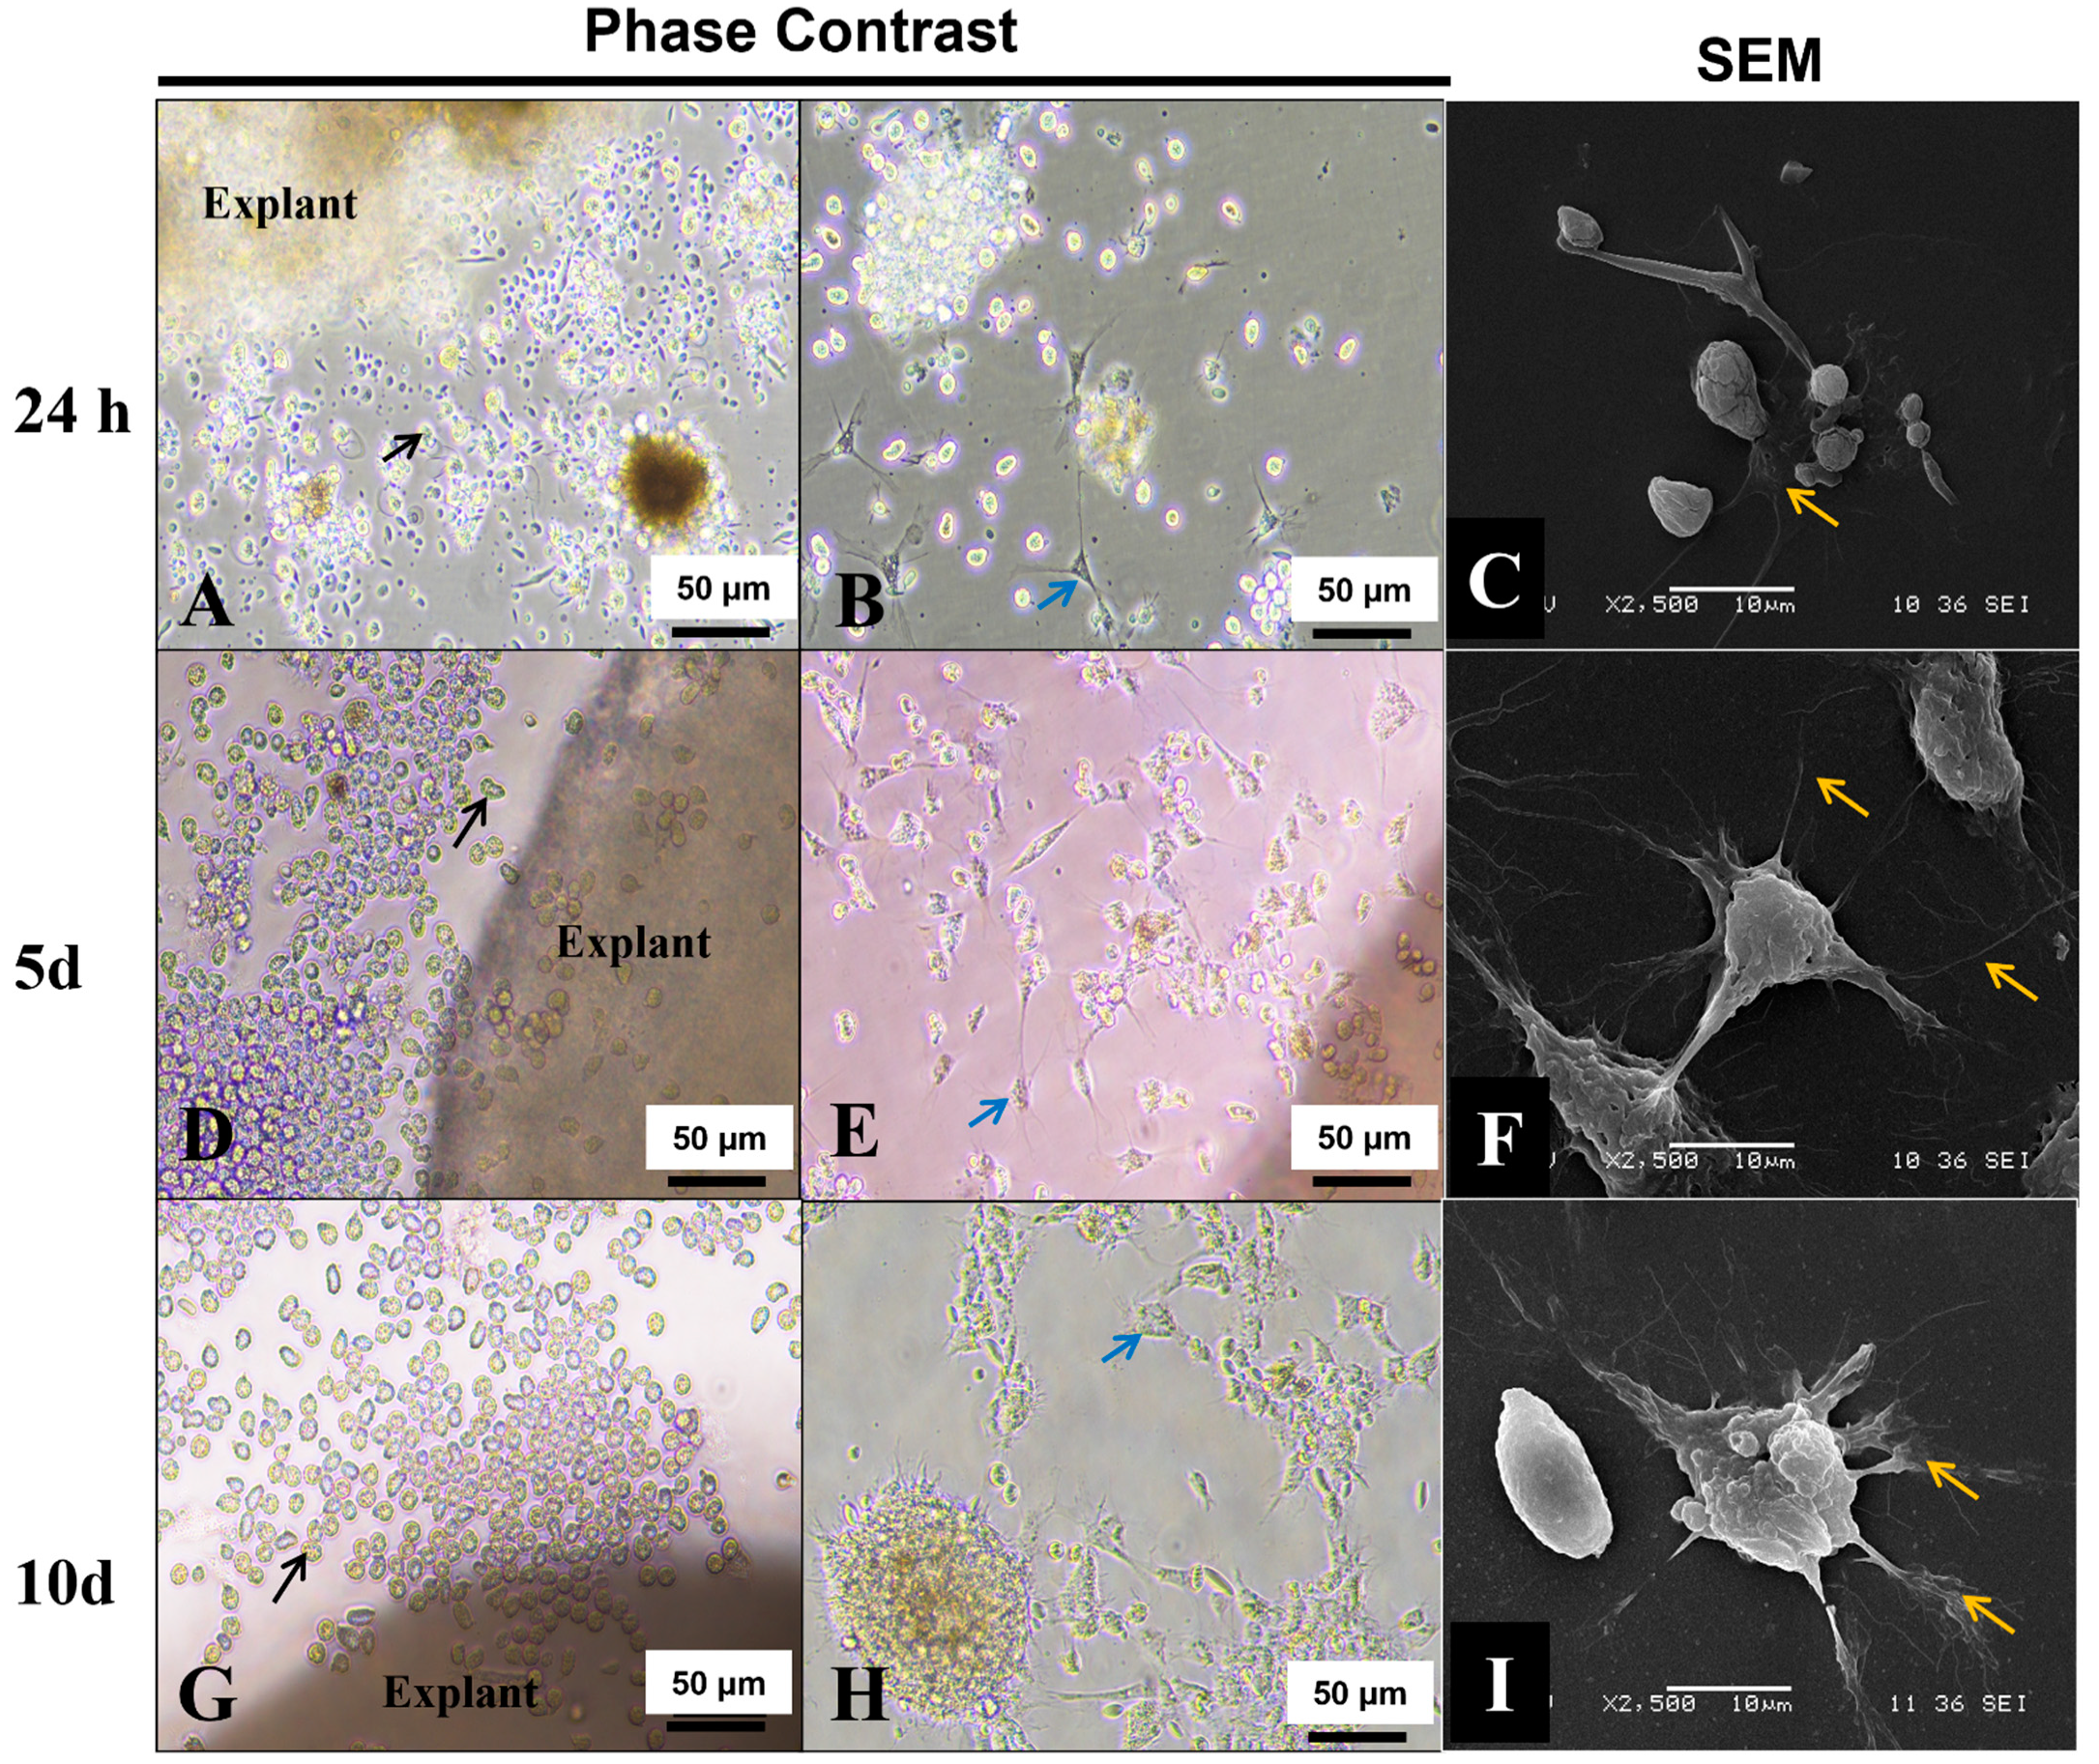
3.8. Explant Outgrowths

Gut explants in organ culture did not adhere firmly to the culture substrates (glass or polystyrene) and remained on them, but not truly attached. Nevertheless, many cells could detach or migrate out from these explants into the culture medium. After 24 h in culture, most of the detached cells, putative coelomocytes according to their spherical or ovoid cell morphology, remained in suspension near the explants (Figure 11A, black arrow). Other cells, spindle-shaped or irregular in morphology, were able to adhere firmly to the substrates and appeared flattened and exhibited cell projections (filopodia) (Figure 11B,C, blue and yellow arrows). After 5 days in culture, spherical cells in suspension were still observed around or near to the explants (Figure 11D, black arrow); however, more cells were flattened and appeared attached to the substrate contacting each other through cell projections (Figure 11E,F, blue and yellow arrows). Remarkably, they did not form a confluent monolayer (Figure 11E). After 10 days in culture spherical cells in suspension were still observed around or near the explants (Figure 11G, black arrow). However, the number of cells attached to the substrate (displaying filopodia and lamellipodia) increased (Figure 11I, yellow arrows). They were able to form net-like structures (Figure 11H).

4. Discussion

Explants in organ culture represent a valuable tool to study the cellular processes underlying developmental or regenerative phenomena in animal models. Explants retain their original histological characteristics; for that reason, they resemble more closely the in vivo conditions than do the two-dimension (2-D) culture systems (cell monolayers) [27]. Thus, the response to external stimuli of explant cells is more similar to the response of cells in vivo, compared to those of cell monolayers. These differences may be due to the absence of the native extracellular matrix in 2-D culture systems. Components of the extracellular matrix have been recognized as crucial modulators of different physiological processes [28]. Explants in organ culture from both invertebrate and vertebrate organisms have been used to perform several physiological, biochemical, and biomechanical studies [29,30,31,32]. For example, in cultured gut explants from mice embryos, natural peristalsis, and stem cell differentiation toward Paneth cells, goblet cells, enterocytes, and others were observed. Additionally, the effect of modulators of signaling pathways on gut differentiation was studied using gut explants, supporting their value as a research tool [32].
To determine the suitability of cultured explants for studying the effect of external stimuli at the histological level, it is necessary to evaluate the changes that the in vitro conditions cause per se on explants. Here, we characterized by histological and immunohistochemical methods the gut explants dissected from H. glaberrima at 5 dpe and that were maintained in culture up to 10 days. Remarkably, gut explants cultured for 24 h up to 10 days retained their histological characteristics, and each explant’s gut rudiment and mesentery could be observed. Key aspects, such as the polarity in the distribution of SLSs and muscle fibers, mesothelium thickness and integrity, and the presence and distribution of fibrous collagen components, are preserved in culture explants as observed in in vivo tissues.
However, a few histological changes in the cultured explants compared to fresh explants (controls) and in vivo tissues were observed as the length of time in culture increased. Among these were a decrease in nervous system labeling, which might indicate a possible loss over time of nervous system components, the appearance of a putative spherulocyte population, and a decrease in proliferation and loss in the polarity of the proliferating cells. These results agree with those found by other research groups [33,34], where the histological characteristics of retinal explants were preserved up to 14 days, although some changes occurred in a time-dependent manner.

4.1. RN1 Labeling Suggests That a Subpopulation of Nerve Fibers Is Reduced in Cultured Explants as the Time in Culture Increases

Here, we used three different markers previously shown to label nerve fibers and neuron-like cells in the intestinal system of H. glaberrima, β-tubulin [17], GFS [20,26], and RN1 [18]. Based on qualitative observations, the overall impression is that the nervous system component is present in the explant in culture but that some components appear to decrease with culture time: β-tubulin labeled components are maintained, while GFS neuronal fibers appear to decrease. Similarly, RN1 labeling suggests that the number of nerve fibers decreases in culture explants. These discrepancies might be explained because each of these three markers recognizes a different subset of nerve fibers and cells in holothurian tissues. Additionally, GFS and anti-β-tubulin are not exclusive to the nervous component; the serum against GFS, as shown previously and in the present manuscript, also labels a spherulocyte-like cell subpopulation [26], while anti-β-tubulin also labels the coelomic epithelial cells [17]. Thus, any quantitative analysis (based on fluorescence intensity) performed with β-tubulin and GFS will be confounded by the labeling of non-neuronal components. Finally, with the use of any of these antibody markers, it is challenging to determine if the decrease in immunofluorescence is due to a decrease in the cell/fiber or a decrease in the expression of the protein. Further efforts must be directed to quantifying by histomorphometry, changes in the presence and number of fibers and neuron-like cells in cultured explants at different culture times, to corroborate the qualitative observations presented here.

4.2. Anti-GFS Labels a Population of Cells That Resemble Spherulocytes in the Connective Tissue and Mesothelial Cells of Cultured Gut Explants

Anti-GFS labels neuron-like cells and nerve fibers in both normal (non-regenerating) and regenerating gut tissues. Interestingly, GFS immunoreactive spherulocyte-like cells were observed after the explants were cultured for 5 days. The GFS immunoreactive cells were observed in both the connective tissue and the mesothelium. The GFS positive cells observed in cultured explants did not appear to be neuron-like cells based solely on their morphology, as they did not exhibit cell projections. In fact, morphologically, they resembled spherulocytes. However, they were not co-labeled with the Sph3 antibody, which is a marker for spherule-containing cells in H. glaberrima. The GFS immunoreactive cells observed in cultured explants may correspond to a subpopulation of spherylocytes that are not labeled by Sph3. These spherulocytes might originate from the dedifferentiated mesothelial cells that ingress into the connective tissue. Previous studies have suggested that spherulocytes are derived from coelomic cells [35] and that dedifferentiated mesothelial cells are stem-like cells with a high degree of plasticity [16]. The in vitro conditions may induce the differentiation of stem-like cells toward the subpopulation of spherule containing cells, which might participate in the remodeling of the extracellular matrix during the intestine regrowth or might represent a response to the in vitro conditions.
Interestingly, the presumptive spherulocytes labeled with the anti-GFS antibody increased with culture time, while those labeled with Sph3 remained relatively constant. These findings suggest that the presumptive spherulocytes labeled with GFS did not originate from the Sph3 subpopulation of cells by a process that involves a change of the vesicular content with a concomitant change of the immunoreactivity. This supports the hypothesis that they are newly formed in cultured explants from dedifferentiated mesothelial cells.
The anti-GFS antibody is a polyclonal antibody produced in rabbits against the synthetic peptide Gly-Phe-Ser-Lys-Leu-Tyr-Phe-NH2 (GFSKLYFamide), which corresponds to the sequence of a neuropeptide isolated from the digestive system of H. glaberrima [26]. In previous studies neuron-like cells and nerve fibers, as well as spherule-containing cells immunoreactive to anti-GFS, were described in H. glaberrima intestines [20,26]. However, when the serum containing the anti-GFS antibody was pre-absorbed against the synthetic GFSKLYFamide peptide, the immunoreactivity against the neuron-like cells and nerve fibers disappeared, while the immunoreactivity against the spherule-containing cells remained, suggesting that other antibodies different to anti-GFS were present in the rabbit serum [26]. Thus, the labeling of a subpopulation of spherulocyes could be due to non-specific labeling and not necessarily because the cells are expressing GFS. Nonetheless, the fact that a subpopulation of spherulocyte-like cells appears due to the culture conditions, continues to be an interesting phenomenon that must be addressed in future studies.

4.3. The Polarity in the Localization of BrdU-Positive Cell Nuclei Is Lost and the Proliferation Rate Decreases over Time in Cultured Explants

BrdU-positive cells were observed in cultured explants, suggesting that explants in in vitro conditions retain their ability to divide as they do in in vivo conditions. Interestingly, after 24 h of culture, the BrdU-positive nuclei were mainly localized to the gut rudiment and the distal mesentery, the same sites where the BrdU-positive cells are observed in in vivo tissues at 5 dpe [16]. However, in explants cultured for 5 or 10 days this pattern changed dramatically; the BrdU-positive cells were observed scattered in all the regions of the gut rudiment and the mesentery. This finding might be due to changes in the expression of molecules that confer polarity to the explants, such as components of the Frizzled/Planar Cell Polarity and Anterior–Posterior (AP) patterning systems [36] or to the loss of paracrine signaling in the explants in culture over time. Our results do not agree with those of Candia-Carnevali et al. [3], who studied the distribution of BrdU-positive cells in double amputated arm explants from the crinoid A. meditteranea after different times in culture. They showed that the BrdU cells were localized mainly in the distal end (where the blastema was formed), the coelomic epithelium and the brachial nerve of the double amputated arm explants. Remarkably, this pattern persisted in explants cultured from 24 h for up to one week.
The proliferation rate in the gut rudiment of explants from 5 dpe cultured for 24 h was similar to that observed in vivo (in the range of 15 to 16%). Remarkably, the proliferation rate was lower after 10 d in culture displaying a trend toward a reduction over time. These results agree with those of other groups [37,38,39], who observed that the proliferation rate decreased over time in mouse kidney, human colon, and heart zebrafish explants, respectively. The causes of the decline in cell proliferation could be missing ingredients in the culture medium, loss of paracrine signaling, or suboptimal environmental conditions. Despite this limitation, the gut explant culture described here is suitable for performing short-term studies on cell proliferation.
Interestingly, while the polarity in the localization of proliferating cells in explants is lost as the time in culture advances, the polarity in the distribution of SLSs and muscle fibers is maintained in explants. These findings support our lab’s hypothesis that cell dedifferentiation and proliferation are uncoupled, and controlled by different signaling pathways at the early stages of intestine regeneration in H. glaberrima [8]. Previous studies by our group found that cell proliferation appears to be controlled by the canonical Wnt pathway [8,11], while muscle dedifferentiation appears to be modulated by GSK-3 signaling in a Wnt-independent manner [8]. Thus, culture conditions might affect the paracrine signaling of the canonical Wnt pathway but not the pathway(s) modulating the muscle dedifferentiation. Further studies must address this topic.

4.4. The Cellular Processes Underlying Intestine Regeneration Are Halted in Cultured Gut Explants Compared to the In Vivo Counterparts

Our findings suggest that gut rudiment size and most of the histological characteristics of cultured gut explants remain similar to those observed in intestines from the same regenerating stage from which they were dissected initially (e.g., 5 dpe), without significant changes over time in vitro. Remarkably, the cellular events that generally occur in guts as regeneration proceeds in vivo appear to be halted, or at least to occur slower, in the cultured explants. The main feature being that no growth of the rudiment is observed, whereas in vivo, the rudiment keeps increasing in size during the second regeneration week [16]. Another example is the lack of muscle fiber reappearance and the lumen formation in the gut rudiment of explants cultured for 10 days. The in vivo counterpart of these explants will be gut tissues of 15 dpe (5 dpe plus 10 days of culture), which already have defined muscle layers as constituents of the mesothelium and display a luminal space. In this respect, our findings do not agree with Candia-Carnevali [3] and Dupont and Thorndyke [4], who observed that the regeneration-associated events described in vivo proceed in crinoid and ophiuroid arm explants, although at a slower rate. These differences might be because crinoid or ophiuroid arms naturally exist as external structures (in a similar environment to culture conditions). In contrast, the intestine and other viscera regenerate within the coelomic cavity, a more controlled space, where the presence of paracrine signaling molecules could be more crucial for the regeneration to proceed. Thus, missing growth factors could have a more significant effect on the visceral than in appendicular regeneration in echinoderms. An additional component that could contribute to the halting of gut regeneration in the cultured explants is the lack of cells that migrate from other organs to the gut rudiment through the mesentery in vivo, where they contribute to the formation of structures such as the lumen. Optimization of the current culture conditions might emulate more accurately the intestine regeneration process in explants, adding value to our in vitro model.
Overall, the gut explant culture method described here is suitable for short-term studies on critical aspects of the intestine regeneration process. The presence of mesothelial, neural, and extracellular matrix components in cultured explants similar to those observed in non-cultured explants and in vivo tissues [16,17,18,19,20,21,22] is a remarkable finding. Explants retain their morphology and histoarchitecture for up to 10 days, with minor changes. Additionally, explants maintain the original polarity in the distribution and localization of muscle bundles, SLSs, and proliferating cells for up to 5 days. Apart from the applicability in histological studies, explants can also be used to perform molecular studies (such as gene expression studies by qRT-PCR) in response to external stimuli [40]. The utility of gut explants has already been demonstrated in studies performed by our group to test the effect of pharmacological agents on muscle dedifferentiation [8], to set up the RNA interference technique to decipher the role of the canonical Wnt signaling pathway in the intestine regeneration in H. glaberrima [11,13], and to determine the toxic effects of antibiotics on holothurian tissues [41], demonstrating their value as a tool to complement the in vivo studies in echinoderms.

Author Contributions

Conceptualization, S.A.B. and J.E.G.-A.; methodology, S.A.B. and J.E.G.-A.; investigation, S.A.B.; validation, S.A.B. and J.E.G.-A.; formal analysis S.A.B.; resources, S.A.B. and J.E.G.-A.; data curation, S.A.B. and J.E.G.-A.; writing—original draft preparation, S.A.B.; writing—review and editing, S.A.B. and J.E.G.-A.; visualization, S.A.B.; supervision, J.E.G.-A.; project administration, J.E.G.-A.; funding acquisition, J.E.G.-A. All authors have read and agreed to the published version of the manuscript.

Funding

This project was funded by NIH (Grant R15GM124595 and R21AG057974), NSF (Grant IOS-1252679) and the University of Puerto Rico. S.A.B. was partially funded by the University of Puerto Rico through the Merit and Doctoral Dissertation Fellowships.

Institutional Review Board Statement

This research deals only with invertebrate animals, thus the University of Puerto Rico IACUC waives ethical approval of research performed on invertebrates.

Informed Consent Statement

Not applicable.

Data Availability Statement

The data presented in this study it is contained within this article.

Acknowledgments

Special thanks to Rey Rosa Morales and Griselle Valentín-Tirado for their technical support. We gratefully acknowledge the Materials Characterization Center (MCC) of the University of Puerto Rico for the use of the Scanning Electron Microscopy Facility.

Conflicts of Interest

The authors declare no conflict of interest.

Appendix A

Figure A1. SLSs and muscle gradient in the regenerating mesentery. (A) Tissue section of a regenerating intestine at 5 dpe. The SLSs and muscle fibers have disappeared from the gut rudiment and the distal mesentery, while they are still present in the medial and the proximal mesenteries at this regenerative stage. SLSs and muscle fibers are shown in medial (B) and proximal (C) mesentery tissue sections. SLSs and muscle fibers were labeled with Phalloidin-TRITC and are displayed in green, and cell nuclei were labeled with DAPI and are displayed in red.
Jmse 10 00244 g0a1
Figure A2. Phalloidin and anti-BrdU staining pattern in cultured explants from 5 dpe. Tissue sections of explants cultured for 24 h (AD), 5 d (EH), and 10 d (IL) were labeled with phalloidin (A,B), (E,F), and (I,J), respectively, or with anti-BrdU (C,D), (G,H), and (K,L), respectively. In each explant the gut rudiment, the distal, medial, and proximal mesentery are signaled. Muscle and SLSs stained with Phalloidin-TRITC and cell nuclei immunoreactive for anti-BrdU are shown in green, while total cell nuclei are shown in red. The panels (B,D,F,H,J,L) are shown in white and black. Scale bar = 400 μm.
Jmse 10 00244 g0a2

References

  1. Freshney, R.I. (Ed.) Primary Culture. In Culture of Animal Cells: A Manual of Basic Technique and Specialized Applications; John Wiley & Sons: Hoboken, NJ, USA, 2010; pp. 163–186. ISBN 978-0-470-52812-9. [Google Scholar]
  2. Yissachar, N.; Zhou, Y.; Ung, L.; Lai, N.Y.; Mohan, J.F.; Ehrlicher, A.; Weitz, D.A.; Kasper, D.L.; Chiu, I.M.; Mathis, D.; et al. An Intestinal Organ Culture System Uncovers a Role for the Nervous System in Microbe-Immune Crosstalk. Cell 2017, 168, 1135–1148.e12. [Google Scholar] [CrossRef] [Green Version]
  3. Carnevali, C.; Bonasoro, F.; Patruno, M.; Thorndyke, M.C. Cellular and molecular mechanisms of arm regeneration in crinoid echinoderms: The potential of arm explants. Dev. Genes Evol. 1998, 208, 421–430. [Google Scholar] [CrossRef]
  4. Dupont, S.; Thorndyke, M.C. Growth or differentiation? Adaptive regeneration in the brittlestar Amphiura filiformis. J. Exp. Biol. 2006, 209, 3873–3881. [Google Scholar] [CrossRef] [Green Version]
  5. Burns, G.; Ortega-Martinez, O.; Dupont, S.; Thorndyke, M.C.; Peck, L.S.; Clark, M.S. Intrinsic gene expression during regeneration in arm explants of Amphiura filiformis. J. Exp. Mar. Bio. Ecol. 2012, 413, 106–112. [Google Scholar] [CrossRef]
  6. Di Benedetto, C.; Parma, L.; Barbaglio, A.; Sugni, M.; Bonasoro, F.; Candia Carnevali, M.D. Echinoderm regeneration: An in vitro approach using the crinoid Antedon mediterranea. Cell Tissue Res. 2014, 358, 189–201. [Google Scholar] [CrossRef]
  7. Moss, C.; Beesley, P.W.; Thorndyke, M.C.; Bollner, T. Preliminary observations on ascidian and echinoderm neurons and neural explants in vitro. Tissue Cell 1998, 30, 517–524. [Google Scholar] [CrossRef]
  8. Bello, S.A.; Torres-Gutiérrez, V.; Rodríguez-Flores, E.J.; Toledo-Román, E.J.; Rodríguez, N.; Díaz-Díaz, L.M.; Vázquez-Figueroa, L.D.; Cuesta, J.M.; Grillo-Alvarado, V.; Amador, A.; et al. Insights into intestinal regeneration signaling mechanisms. Dev. Biol. 2020, 458, 12–31. [Google Scholar] [CrossRef]
  9. García-Arrarás, J.E.; Lázaro-Peña, M.I.; Díaz-Balzac, C.A. Holothurians as a Model System to Study Regeneration. In Results and Problems in Cell Differentiation; Springer: Cham, Switzerland, 2018; Volume 65, pp. 255–283. [Google Scholar]
  10. García-Arrarás, J.E.; Bello, S.A.; Malavez, S. The mesentery as the epicenter for intestinal regeneration. In Seminars in Cell & Developmental Biology; Academic Press: Cambridge, MA, USA, 2018. [Google Scholar]
  11. Alicea-Delgado, M.; García-Arrarás, J.E. Wnt/β-catenin signaling pathway regulates cell proliferation but not muscle dedifferentiation nor apoptosis during sea cucumber intestinal regeneration. Dev. Biol. 2021, 480, 105–113. [Google Scholar] [CrossRef]
  12. Quesada-Díaz, E.; Figueroa-Delgado, P.; García-Rosario, R.; Sirfa, A.; García-Arrarás, J.E. Dedifferentiation of radial glia-like cells is observed in in vitro explants of holothurian radial nerve cord. J. Neurosci. Methods 2021, 364, 109358. [Google Scholar] [CrossRef]
  13. Alicea-Delgado, M.; Bello-Melo, S.A.; García-Arrarás, J.E. RNA Interference on Regenerating Holothurian Gut Tissues. In Methods in Molecular Biology; Humana: New York, NY, USA, 2021; pp. 241–252. ISBN 978-1-0716-0973-6. [Google Scholar]
  14. Bello, S.A.; Abreu-Irizarry, R.J.; García-Arrarás, J.E. Primary cell cultures of regenerating holothurian tissues. Methods Mol. Biol. 2015, 1189, 283–297. [Google Scholar]
  15. Schacher, S.; Proshansky, E. Neurite regeneration by Aplysia neurons in dissociated cell culture: Modulation by Aplysia hemolymph and the presence of the initial axonal segment. J. Neurosci. 1983, 3, 2403–2413. [Google Scholar] [CrossRef]
  16. García-Arrarás, J.E.; Valentín-Tirado, G.; Flores, J.E.; Rosa, R.J.; Rivera-Cruz, A.; San Miguel-Ruiz, J.E.; Tossas, K. Cell dedifferentiation and epithelial to mesenchymal transitions during intestinal regeneration in H. glaberrima. BMC Dev. Biol. 2011, 11, 61. [Google Scholar] [CrossRef] [Green Version]
  17. Tossas, K.; Qi-Huang, S.; Cuyar, E.; García-Arrarás, J.E. Temporal and spatial analysis of enteric nervous system regeneration in the sea cucumber Holothuria glaberrima. Regeneration 2014, 1, 10–26. [Google Scholar] [CrossRef]
  18. Díaz-Balzac, C.A.; Santacana-Laffitte, G.; San Miguel-Ruíz, J.E.; Tossas, K.; Valentín-Tirado, G.; Rives-Sánchez, M.; Mesleh, A.; Torres, I.I.; García-Arrarás, J.E. Identification of nerve plexi in connective tissues of the sea cucumber Holothuria glaberrima by using a novel nerve-specific antibody. Biol. Bull. 2007, 213, 28–42. [Google Scholar] [CrossRef] [Green Version]
  19. Rosado-Olivieri, E.A.; Ramos-Ortiz, G.A.; Hernández-Pasos, J.; Díaz-Balzac, C.A.; Vázquez-Rosa, E.; Valentín-Tirado, G.; Vega, I.E.; García-Arrarás, J.E. A START-domain-containing protein is a novel marker of nervous system components of the sea cucumber Holothuria glaberrima. Comp. Biochem. Physiol. Part-B Biochem. Mol. Biol. 2017, 214, 57–65. [Google Scholar] [CrossRef]
  20. Díaz-Miranda, L.; Blanco, R.E.; García-Arrarás, J.E. Localization of the heptapeptide GFSKLYFamide in the sea cucumber holothuria glaberrima (echinodermata): A light and electron microscopic study. J. Comp. Neurol. 1995, 352, 626–640. [Google Scholar] [CrossRef]
  21. García-Arrarás, J.E.; Schenk, C.; Rodrígues-Ramírez, R.; Torres, I.I.; Valentín, G.; Candelaria, A.G. Spherulocytes in the echinoderm Holothuria glaberrima and their involvement in intestinal regeneration. Dev. Dyn. 2006, 235, 3259–3267. [Google Scholar] [CrossRef]
  22. Quiñones, J.L.; Rosa, R.; Ruiz, D.L.; García-Arrarás, J.E. Extracellular Matrix Remodeling and Metalloproteinase Involvement during Intestine Regeneration in the Sea Cucumber Holothuria glaberrima. Dev. Biol. 2002, 250, 181–197. [Google Scholar] [CrossRef] [Green Version]
  23. Bello, S.A.; De Jesús-Maldonado, I.; Rosim-Fachini, E.; Sundaram, P.A.; Diffoot-Carlo, N. In vitro evaluation of human osteoblast adhesion to a thermally oxidized γ-TiAl intermetallic alloy of composition Ti-48Al-2Cr-2Nb (at.%). J. Mater. Sci. Mater. Med. 2010, 21, 1739–1750. [Google Scholar]
  24. Candelaria, A.G.; Murray, G.; File, S.K.; García-Arrarás, J.E. Contribution of mesenterial muscle dedifferentiation to intestine regeneration in the sea cucumber Holothuria glaberrima. Cell Tissue Res. 2006, 325, 55–65. [Google Scholar] [CrossRef]
  25. Dolmatov, I.Y.; Ginanova, T.T. Muscle Regeneration in Holothurians. Microsc. Res. Tech. 2001, 55, 452–463. [Google Scholar] [CrossRef]
  26. Diaz-Miranda, L.; Price, D.A.; Greenberg, M.J.; Lee, T.D.; Doble, K.E.; Garcia-Arraras, J.E. Characterization of Two Novel Neuropeptides from the Sea Cucumber Holothuria glaberrima. Biol. Bull. 1992, 182, 241–247. [Google Scholar] [CrossRef]
  27. Al-Lamki, R.S.; Bradley, J.R.; Pober, J.S. Human organ culture: Updating the approach to bridge the gap from in vitro to in vivo in inflammation, cancer, and stem cell biology. Front. Med. 2017, 4, 148. [Google Scholar] [CrossRef] [Green Version]
  28. Frantz, C.; Stewart, K.M.; Weaver, V.M. The extracellular matrix at a glance. J. Cell Sci. 2010, 123, 4195–4200. [Google Scholar] [CrossRef] [Green Version]
  29. Koch, M.; Hassan, B.A. The Making and Un-Making of Neuronal Circuits in Drosophila. Out with the Brain: Drosophila Whole-Brain Explant Culture. Neuromethods 2012, 69, 261–268. [Google Scholar]
  30. Lorenzen, U.S.; Hansen, G.H.; Danielsen, E.M. Organ culture as a model system for studies on Enterotoxin interactions with the intestinal epithelium. Methods Mol. Biol. 2016, 1396, 159–166. [Google Scholar]
  31. Taylor, V.; Hicks, J.; Ferguson, C.; Willey, J.; Danelson, K. Effects of tissue culture on the biomechanical properties of porcine meniscus explants. Clin. Biomech. 2019, 69, 120–126. [Google Scholar] [CrossRef]
  32. Sun, X.; Fu, X.; Du, M.; Zhu, M.J. Ex vivo gut culture for studying differentiation and migration of small intestinal epithelial cells. Open Biol. 2018, 4, 170256. [Google Scholar] [CrossRef] [Green Version]
  33. Johnson, T.V.; Martin, K.R. Development and characterization of an adult retinal explant organotypic tissue culture system as an in vitro intraocular stem cell transplantation model. Investig. Ophthalmol. Vis. Sci. 2008, 49, 3503–3512. [Google Scholar] [CrossRef]
  34. Müller, B.; Wagner, F.; Lorenz, B.; Stieger, K. Organotypic cultures of adult mouse retina: Morphologic changes and gene expression. Investig. Ophthalmol. Vis. Sci. 2017, 58, 1930–1940. [Google Scholar] [CrossRef] [Green Version]
  35. Byrne, M. The ultrastructure of the morula cells of Eupentacta quinquesemita (Echinodermata: Holothuroidea) and their role in the maintenance of the extracellular matrix. J. Morphol. 1986, 188, 179–189. [Google Scholar] [CrossRef]
  36. Zallen, J.A. Planar Polarity and Tissue Morphogenesis. Cell 2007, 129, 1051–1063. [Google Scholar] [CrossRef] [Green Version]
  37. Robertson, H.; Wheeler, J.; Morley, A.R. Culture and in vitro bromodeoxyuridine-labelling of mouse kidney explants. J. Tissue Cult. Methods 1994, 16, 49–55. [Google Scholar] [CrossRef]
  38. Usugane, M.; Fujita, M.; Lipkin, M.; Palmer, R.; Friedman, E.; Augenlicht, L. Cell proliferation in explant cultures of human colon. Digestion 1982, 24, 225–233. [Google Scholar] [CrossRef]
  39. Cao, J.; Poss, K.D. Explant culture of adult zebrafish hearts for epicardial regeneration studies. Nat. Protoc. 2016, 11, 872–881. [Google Scholar] [CrossRef]
  40. Bello-Melo, S.A. Determination of the Expression Levels of axin, β-catenin and myc Genes by Quantitative Real Time PCR in Explants Treated with Modulators of the Wnt Signaling Pathway. In Setting-Up an In Vitro Model to Study the Signaling Mechanisms Associated with Intestine Regeneration in the Sea Cucumber Holothuria glaberrima. Ph.D. Thesis, Rio Piedras Campus, University of Puerto Rico, San Juan, PR, USA, 2019; pp. 216–220. [Google Scholar]
  41. Díaz-Díaz, L.M.; Rosario-Meléndez, N.; Rodríguez-Villafañe, A.; Figueroa-Vega, Y.Y.; Pérez-Villafañe, O.A.; Colón-Cruz, A.M.; Rodríguez-Sánchez, P.I.; Cuevas-Cruz, J.M.; Malavez-Cajigas, S.J.; Maldonado-Chaar, S.M.; et al. Antibiotics Modulate Intestinal Regeneration. Biology 2021, 10, 236. [Google Scholar] [CrossRef]
Figure 1. Gut rudiment area in cultured explants. Representative micrographs of gut rudiments in control (5 dpe, not cultured) (A), and explants cultured for 24 h (B), 5 d (C), and 10 d (D) are shown. Gut rudiment area was measured in photographs using ImageJ software. No significant differences in the gut rudiment area were found between control and cultured explants (E). Columns represent the mean ± SD for each group of explants, and circles, squares, triangles are the individual values of each explant. One-way ANOVA. ns = not significant differences (p-value > 0.05), n = 4 for controls, and n = 5 for cultured explants. Cell nuclei (DAPI) are shown in white. Scale bar = 200 µm.
Jmse 10 00244 g001
Figure 2. Spindle-like structures (SLSs) and muscle fiber distribution in cultured gut explants. The presence and distribution of SLSs and muscle fibers in control (not cultured) (A) and cultured for 24 h (B), 5 d (C), and 10 d (D) explants are shown. Tissue sections of the proximal mesentery in control (E), and cultured for 24 h (F), 5 d (G), and 10 d (H) are displayed, showing muscle bundle disorganization in explants cultured for 5 and 10 d. The quantification of the SLS/DAPI ratio in distal (I), medial (J), and proximal (K) mesentery is shown. SLS/DAPI ratio of all regions of the mesentery is displayed in (L). When the SLSs/DAPI ratios in all regions of explants are considered, no significant differences between control and cultured explants are observed (L). Columns represent the mean ± SD for each group of explants, and circles, squares, triangles are the individual values of each explant. One-way ANOVA, * p < 0.05, ns = not significant differences (p-value > 0.05). n = 5 in all groups. All regions (gut rudiment and distal, medial, and proximal mesentery) are labeled in each explant in (AD). White arrows point to SLSs and yellow arrows to muscle fibers in (EH). SLSs and muscle fibers are shown in green and cell nuclei (DAPI) in red. Scale bar = 500 µm in (AD) and 25 µm in (EH).
Jmse 10 00244 g002
Figure 3. Cell proliferation assessed by BrdU incorporation in cultured explants. BrdU positive cell nuclei were observed in explants cultured for 24 h (A,D), 5 d (B,E), and 10 d (C,F). The percentage of BrdU positive cells in gut rudiment (G), and distal (H), medial (I), and proximal (J) regions of the mesentery in explants are shown. The percentage of BrdU positive cells averaging the counts performed in all regions of each explant are shown in (K). When the percentage of BrdU positive cells in all regions of explants are considered, a significant reduction in the number of BrdU positive cells was observed in explants cultured for 10 d compared to explants cultured for 24 h and 5 d (G). Columns represent the mean ± SD for each group of explants, and circles, squares, and triangles are the individual values of each explant. One-way ANOVA, **** p < 0.0001, *** p < 0.001, ** p < 0.01, * p < 0.05, ns = not significant differences (p-value > 0.05). n = 8–10. In Panels (AC) all cell nuclei are shown in red (DAPI), with BrdU positive nuclei (white arrows in inset in AC) in green. In panels (DF) the BrdU positive nuclei are shown in white. Bar = 400 µm.
Jmse 10 00244 g003
Figure 4. Meso-1 staining pattern in cultured explants from 5 dpe. Control (A) and explants cultured for 24 h (E), 5 d (I), and 10 d (M) at low magnification are shown in the upper row. The boxed areas labeled as 1, 2, and 3 in these photographs correspond to gut rudiment, medial, and proximal mesenteries, respectively, shown at a higher magnification from the second to the fourth rows. Meso-1 immunoreactive mesothelium in gut rudiment of control (B), and explants cultured for 24 h (F), 5 d (J), and 10 d (N) are shown in the second row, while immunoreactive mesothelium in the medial mesentery of control (C), and explants cultured for 24 h (G), 5 d (K), and 10 d (O) are shown in the third row. Meso-1 immunoreactive mesothelium in the proximal mesentery of control (D) and explants cultured for 24 h (H), 5 d (L), and 10 d (P) are shown in the fourth row. Meso-1 immunoreactive mesothelium is shown in red and cell nuclei labeled with DAPI are shown in blue. Bar = (A,E,I,M) 500 μm, (BD,FH,JL,NP) 100 μm.
Jmse 10 00244 g004
Figure 5. RN1 staining pattern in cultured explants from 5 dpe. RN1 immunoreactivity in control (A) and cultured explants for 24 h (E), 5 d (I), and 10 d (M) at low magnification are shown in the upper row. The boxed areas labeled as 1,2, and 3 in these photographs correspond to areas of the gut rudiment (1), medial (2), and proximal mesenteries (3) that are shown at higher magnification from the second to the fourth rows. Asterisks indicate the localization of the gut rudiment in (A,E,I,M). RN1 immunoreactive nerve fibers in the gut rudiment of control (B) and explants cultured for 24 h (F), 5 d (J), and 10 d (N) are shown at high magnification in the second row. RN1 immunoreactive nerve fibers and neuron-like cell (insets) in the medial mesentery of control (C) and explants cultured for 24 h (G), 5 d (K), and 10 d (O) are shown in the third row. RN1 immunoreactive nerve fibers and neuron-like cell (insets) in the proximal mesentery of control (D) and explants cultured for 24 h (H), 5 d (L), and 10 d (P) are shown in the bottom row. RN1 immunoreactivity is shown in red and cell nuclei in blue. Bar = (A,E,I,M) 500 μm, (BD,FH,JL,NP) 50 μm.
Jmse 10 00244 g005
Figure 6. β-tubulin staining pattern in cultured explants from 5 dpe. Control (A) and explants cultured for 24 h (F), 5 d (K), and 10 d (P) at low magnification are shown in the upper row. The boxed areas labeled as 1,2, and 3 in these photographs correspond to areas of the gut rudiment (1), medial (2), and proximal mesenteries (3) that are shown at higher magnification from the second to the fourth rows. β-tubulin immunoreactive cells in gut rudiment mesothelium of control ((B), yellow arrows), and explants cultured for 24 h (G), 5 d (L), and 10 d (Q) are shown in the second row, while immunoreactive cells in the gut rudiment connective tissue of control (C), and explants cultured for 24 h (H), 5 d (M), and 10 d (R) are shown in the third row. β-tubulin immunoreactive cells and fibers in medial mesentery control (D) and explants cultured for 24 h (I), 5 d (N), and 10 d (S) are shown in the fourth row, while immunoreactive cells and fibers (white arrows) in the proximal mesentery of control (E) and explants cultured for 24 h (J), 5 d (O), and 10 d (T) are shown in the fifth row. β-tubulin immunoreactive cells are shown in red, and cell nuclei labeled with DAPI are shown in blue. Bar = (A,F,K,P) 500 μm, (BD,GJ,LO,QT) 50 μm.
Jmse 10 00244 g006
Figure 7. GFS staining pattern in cultured explants from 5 dpe. GFS immunoreactivity in control (A) and cultured explants for 24 h (E), 5 d (I), and 10 d (M) at low magnification are shown in the upper row. The boxed areas labeled as 1, 2, and 3 are shown in the second, third, and fourth rows, respectively, at high magnification. GFS- immunoreactive nerve fibers or cells found in the gut rudiment of control (B) and explants cultured for 24 h (F), 5 d (J), and 10 d (N) are shown at high magnification in the second row. GFS immunoreactive nerve fibers and cells in the medial mesentery of control (C) and explants cultured for 24 h (G), 5 d (K), and 10 d (O) are shown in the third row. GFS immunoreactive nerve fibers and cells in the proximal mesentery of control (D) and explants cultured for 24 h (H), 5 d (L), and 10 d (P) are shown in the bottom row. GFS immunoreactivity is shown in red and cell nuclei (DAPI) in blue. Insets show in more detail the GFS-immunoreactive fibers (panels C,D,G,H) or cells (panels K,L,O,P). Bar = (A,E,I,M) 500 μm, (BD,FH,JL,NP) 100 μm.
Jmse 10 00244 g007
Figure 8. Anti-collagen immunoreactivity in cultured explants dissected at 5 dpe. Anti-collagen immunoreactivity is shown in control explants (A) and explants cultured for 24 h (E), 5 d (I), and 10 d (M) at low magnification. The boxed areas labeled as 1, 2, and 3 are shown in the second, third, and fourth rows, respectively, at high magnification. Immunoreactive fibrous collagen is shown at a higher magnification in the gut rudiment of control explants (B), and explants cultured for 24 h (F), 5 d (J), and 10 d (N). Micrographs showing collagen immunoreactivity in the medial and proximal regions of the mesentery of control explants are shown in (C,D), respectively; explants cultured for 24 h are shown in (G,H), respectively; explants cultured for 5 d are shown in (K,L) respectively; and in explants cultured for 10 d are shown in (O,P), respectively. Collagen immunoreactivity is shown in red and cell nuclei (DAPI) in blue. Bar = (A,E,I,M) 500 μm, (BD,FH,JL,NP) 100 μm.
Jmse 10 00244 g008
Figure 9. Sph3 staining pattern in cultured explants from 5 dpe. Sph3 immunoreactivity in control (A) and cultured explants for 24 h (E), 5 d (I), and 10 d (M) at low magnification are shown in the upper row. The boxed areas labeled as 1, 2, and 3 are shown in the second, third, and fourth rows, respectively, at high magnification. Immunoreactive cells for Sph3 in the gut rudiment of control (B) and explants cultured for 24 h (F), 5 d (J), and 10 d (N) are shown at high magnification in the second row. Sph3 immunoreactive cells in the medial mesentery of control (C) and explants cultured for 24 h (G), 5 d (K), and 10 d (O) are shown in the third row. Sph3 immunoreactive cells in the proximal mesentery of control (D) and explants cultured for 24 h (H), 5 d (L), and 10 d (P) are shown in the lower row. Sph3 immunoreactivity is shown in green and cell nuclei in blue. The insets in (C,G,K,O) show the morphology of the spherulocytes. Bar = (A,E,I,M) 500 μm, (BD,FH,JL,NP) 100 μm.
Jmse 10 00244 g009
Figure 10. Double labeling (GFS-Sph3) of cultured explants dissected at 5 dpe. The co-labeling of GFS and Sph3 was evaluated in the proximal mesentery of control (A) and explants cultured for 24 h (B), 5 d (C), and 10 d (D). Nerve fibers, but not cells, immunoreactive for GFS are observed (white arrows) in controls explants. Sph3 positive cells, which are not co-labeled with GFS, are also observed (asterisks) (A). Yellow arrows show GFS positive cells in the connective tissue of explants cultured for 24 h. Asterisks point to Sph3 positive cells (B). Many GFS positive cells are observed in the connective tissue of explants cultured for 5 days (yellow arrows), while few Sph3 cells are also present (asterisk) (C). Remarkably, the mesenteric mesothelium appears to be immunoreactive for GFS in explants cultured for 10 days. However, GFS (yellow arrows) and Sph3 (asterisks) immunoreactive cells are also observed in explants cultured for 10d (D). GFS immunoreactivity is shown in red, Sph3 immunoreactivity is shown in green, and cell nuclei (DAPI) in blue. Bar = (AD) 100 μm.
Jmse 10 00244 g010
Figure 11. Morphology of cells that migrated out from cultured explants. Representative micrographs of cells that were able to migrate out from explants cultured for 24 h (AC), 5 d (DF), and 10 d (GI) are presented. Micrographs in the first column (A,D,G) show the spherical cells located near the explants (black arrows), whereas the second column (B,E,H) shows the spindle-shaped or flattened cells (blue arrows) that were able to attach to the culture substrate at the different time points. The third column (C,F,I) are SEM micrographs showing the morphology of cells attached to glass cover slips through filopodia and lamellipodia (yellow arrows). Bar = (A,B,D,E,G,H) 50 µm, (C,F,I) 10 μm.
Jmse 10 00244 g011
Table 1. Primary antibodies used for immunohistochemical studies.
Antigen (Antibody Name)Raised inImmunogenCells/Structures LabeledSourceDilution
Unknown (Meso-1)Mouse (monoclonal)Homogenate of the regenerating mesothelium Peritoneocytes and myocytes of the mesotheliumDr. García-Arrarás lab. [16]1:50
β-Tubulin (Anti- β-Tubulin clone Mouse (monoclonal)Tubulin from S. purpuratus sperm axonemesSubpopulation of neuron-like cellsSigma-Aldrich (T-293) [17]1:500
HgSTARD10 protein (RN1)Mouse (monoclonal)Homogenate of the radial nerve of H. glaberrimaSubpopulation of neuron-like cellsDr. García-Arrarás lab. [18,19]1:50,000
GFSKLYFamide (GFS)Rabbit (polyclonal)Synthetic peptide GFSKLYFamideSubpopulation of neuron-like cellsDr. García-Arrarás lab. [20]1:1000
Unknown (Sph3)Mouse (monoclonal)Holothurian homeobox peptide coupled to bovine serum albuminSpherulocytesDr. García-Arrarás lab. [21]Undiluted
Fibrous collagen (Hg-fCOL)Mouse (monoclonal)Insoluble intestinal fibrous collagen extract of H. glaberrimaFibrous collagenDr. García-Arrarás lab. [22]1:10
Bromodeoxyuridine (Anti-BrdU)Mouse (monoclonal)BrdUCell nuclei of replicating cellsMillipore-Sigma (GERPN202)1:5
Publisher’s Note: MDPI stays neutral with regard to jurisdictional claims in published maps and institutional affiliations.

