1. Introduction
Energy and the environment have become important factors restricting economic development in the 21st century. With the continuous increase in mechanical equipment with internal combustion engines as their main power source, environmental problems have become more prominent [
1]. The particulate matter emissions of marine diesel engines, as a major diesel consumer, have received particular attention.
In view of this, the International Maritime Organization (IMO) began to implement more stringent third-phase emission standards (Tier Ⅲ) in early 2016. Traditional marine diesel engines cannot meet these requirements. Therefore, the original diesel engines were converted to LNG–diesel dual-fuel engines, a scheme favored by many manufacturers [
2,
3].
The main component of natural gas is methane (CH
4), which has a high octane number and good anti-knock properties. Natural gas-fired engines run stably, have low noise and low emissions, and have obvious cost advantages [
4]. However, regarding how to carry out dual-fuel conversion based on the existing diesel engine, the most important problems are the performance calibration [
5,
6,
7] and emission characteristics of the calibrated engine [
8,
9,
10]. Machine learning is a popular research method at the moment. This method has been verified and used on real datasets in vessels [
11,
12], but has yet to be used on engines, and so these methods will be applied to engine-related research in the future.
There have been many studies of the conventional emissions (CO
2, NO
x, HC, CO, etc.) of LNG–diesel dual-fuel engines under different operating conditions and different combustion system parameters [
13,
14,
15,
16,
17]. The HC and CO emissions of dual-fuel engines increase sharply compared with diesel under light loads [
13], and the diesel injection timing has a prominent impact on the centroid angle of combustion duration (
), which is closely related to NO
x emission. At low and medium loads, when
is near the top dead center (TDC) and after the TDC, the NO
x emissions are higher. Nevertheless, when
is before the TDC, the result concerning NO
x emissions is the opposite [
14]. There are few studies on the emission of particulate matter, and especially the particle size distribution. As mentioned above, emission regulations are becoming more and more stringent, and increasing attention is paid to the emission of particulate matter. The study of particulate matter emissions can help us to further understand the emission characteristics of engines and to reduce emissions. For this reason, according to the working characteristics of the ship engine, a natural gas supply system and a dual-fuel engine control system were constructed, and a diesel engine was converted into an LNG–diesel dual-fuel engine. It was calibrated by a method that takes the peak pressure in the cylinder and the exhaust temperature as the constraint conditions and uses the diesel mass substitution ratio as the objective function. The diesel mass substitution ratio distribution map was obtained, and the economics of the engine were analyzed under different operating conditions and different operating modes. Furthermore, the particulate matter emission characteristics of a dual-fuel engine under different loads, speeds and diesel mass substitution ratios, including particle size distribution, total number of particulates, and volume of particulates, are studied.
In the second section of the article, the new calibration method and test bench proposed to realize the conversion of diesel engines to dual-fuel engines will be introduced in detail. In the third section of the article, the performance parameters of the modified dual-fuel engine will be analyzed, including the substitution ratio, economy, and detailed emission characteristics of particulate matter.
2. Experimental Setup and Method
2.1. LNG–Diesel Dual-Fuel Engine Test Bench
On the basis of the experimental marine diesel engine, a natural gas supply mixing device was installed through the intake manifold to form a dual-fuel engine. The main technical parameters of the diesel engine are shown in
Table 1.
The test bench includes an engine and a natural gas supply system, engine control system, monitoring and testing system and cylinder pressure acquisition system, as shown in
Figure 1. The view of the test engine is shown in
Figure 2.
The natural gas supply system is composed of an LNG storage tank, vaporizer, switch solenoid valve, pressure stabilizer, gas filter, natural gas flowmeter, natural gas injection assembly and mixer. The liquid natural gas first enters the vaporizer from the LNG storage tank and is vaporized by the heat exchange with the engine coolant in the vaporizer. Then, the pressure is adjusted to 0.6 MPa through the switch solenoid valve and the stabilizer, and the pressure-regulated natural gas enters the natural gas flowmeter after the gas filter. The natural gas flowmeter monitors the flow of natural gas in real time. Finally, it enters the natural gas injection assembly, which is injected into the mixer by the natural gas injection valve on the injection assembly and mixed with the supercharged air from the supercharger to form a homogeneous mixture in the engine cylinder. The model of the natural gas flowmeter is JLWQ-25Z, and the natural gas injection valve is a HANA H2200 injector.
Considering that the existing master–slave blending electronic control system cannot realize the optimization of diesel injection rules in dual-fuel blending mode [
18,
19,
20,
21], the parallel blending electronic control system developed by the project team is used here. By adding a dual-fuel ECU (electronic control unit) that can independently drive and control the diesel injector, the optimal blending of dual fuel can be achieved. When the engine works in pure diesel mode, the engine control is realized by the original BOSCH ECU. When the engine is switched to dual-fuel mode through the mode switch board, the diesel injector control signal of the original diesel ECU is transmitted to the analog load box (diesel injector physical simulator). At this time, the dual-fuel ECU takes over the control of the diesel injector, obtains the diesel injector control signal of the original diesel ECU from the simulated load, and obtains the engine speed, load, intake pressure, crankshaft angle and camshaft angle, alongside other parameters, through communication with the original diesel ECU, so as to realize the control of the diesel injector and natural gas injection valve. The mode switching board and the analog load box (diesel injector physical simulator) are integrated into the dual-fuel engine control cabinet (25).
The engine monitoring and testing system is mainly composed of the following equipment: dynamometer, measurement and control cabinet, fuel consumption meter, oil return processor and particulate matter emission test system. Each device model is shown in
Table 2. The particulate matter emission test equipment is Cambustion’s DMS500. This instrument is specially used for the rapid measurement of particulate matter, which can measure and record the particle size distribution and total number concentration in real time. The size range of the measurable particles is 5 nm–1000 nm. During the test, the equipment was used directly to measure the original untreated particulate matter emissions of the engine.
2.2. Engine Calibration Method
Through online calibration, the host computer communicates with the ECU and controls the running state of the engine, monitors in real time whether various indicators meet the requirements, and quickly feeds back the calibration map data to ensure real-time accuracy.
Considering the user’s cost requirements and emission regulations, a calibration method based on the maximum diesel mass substitution ratio is proposed, and the dual-fuel engine is calibrated based on this.
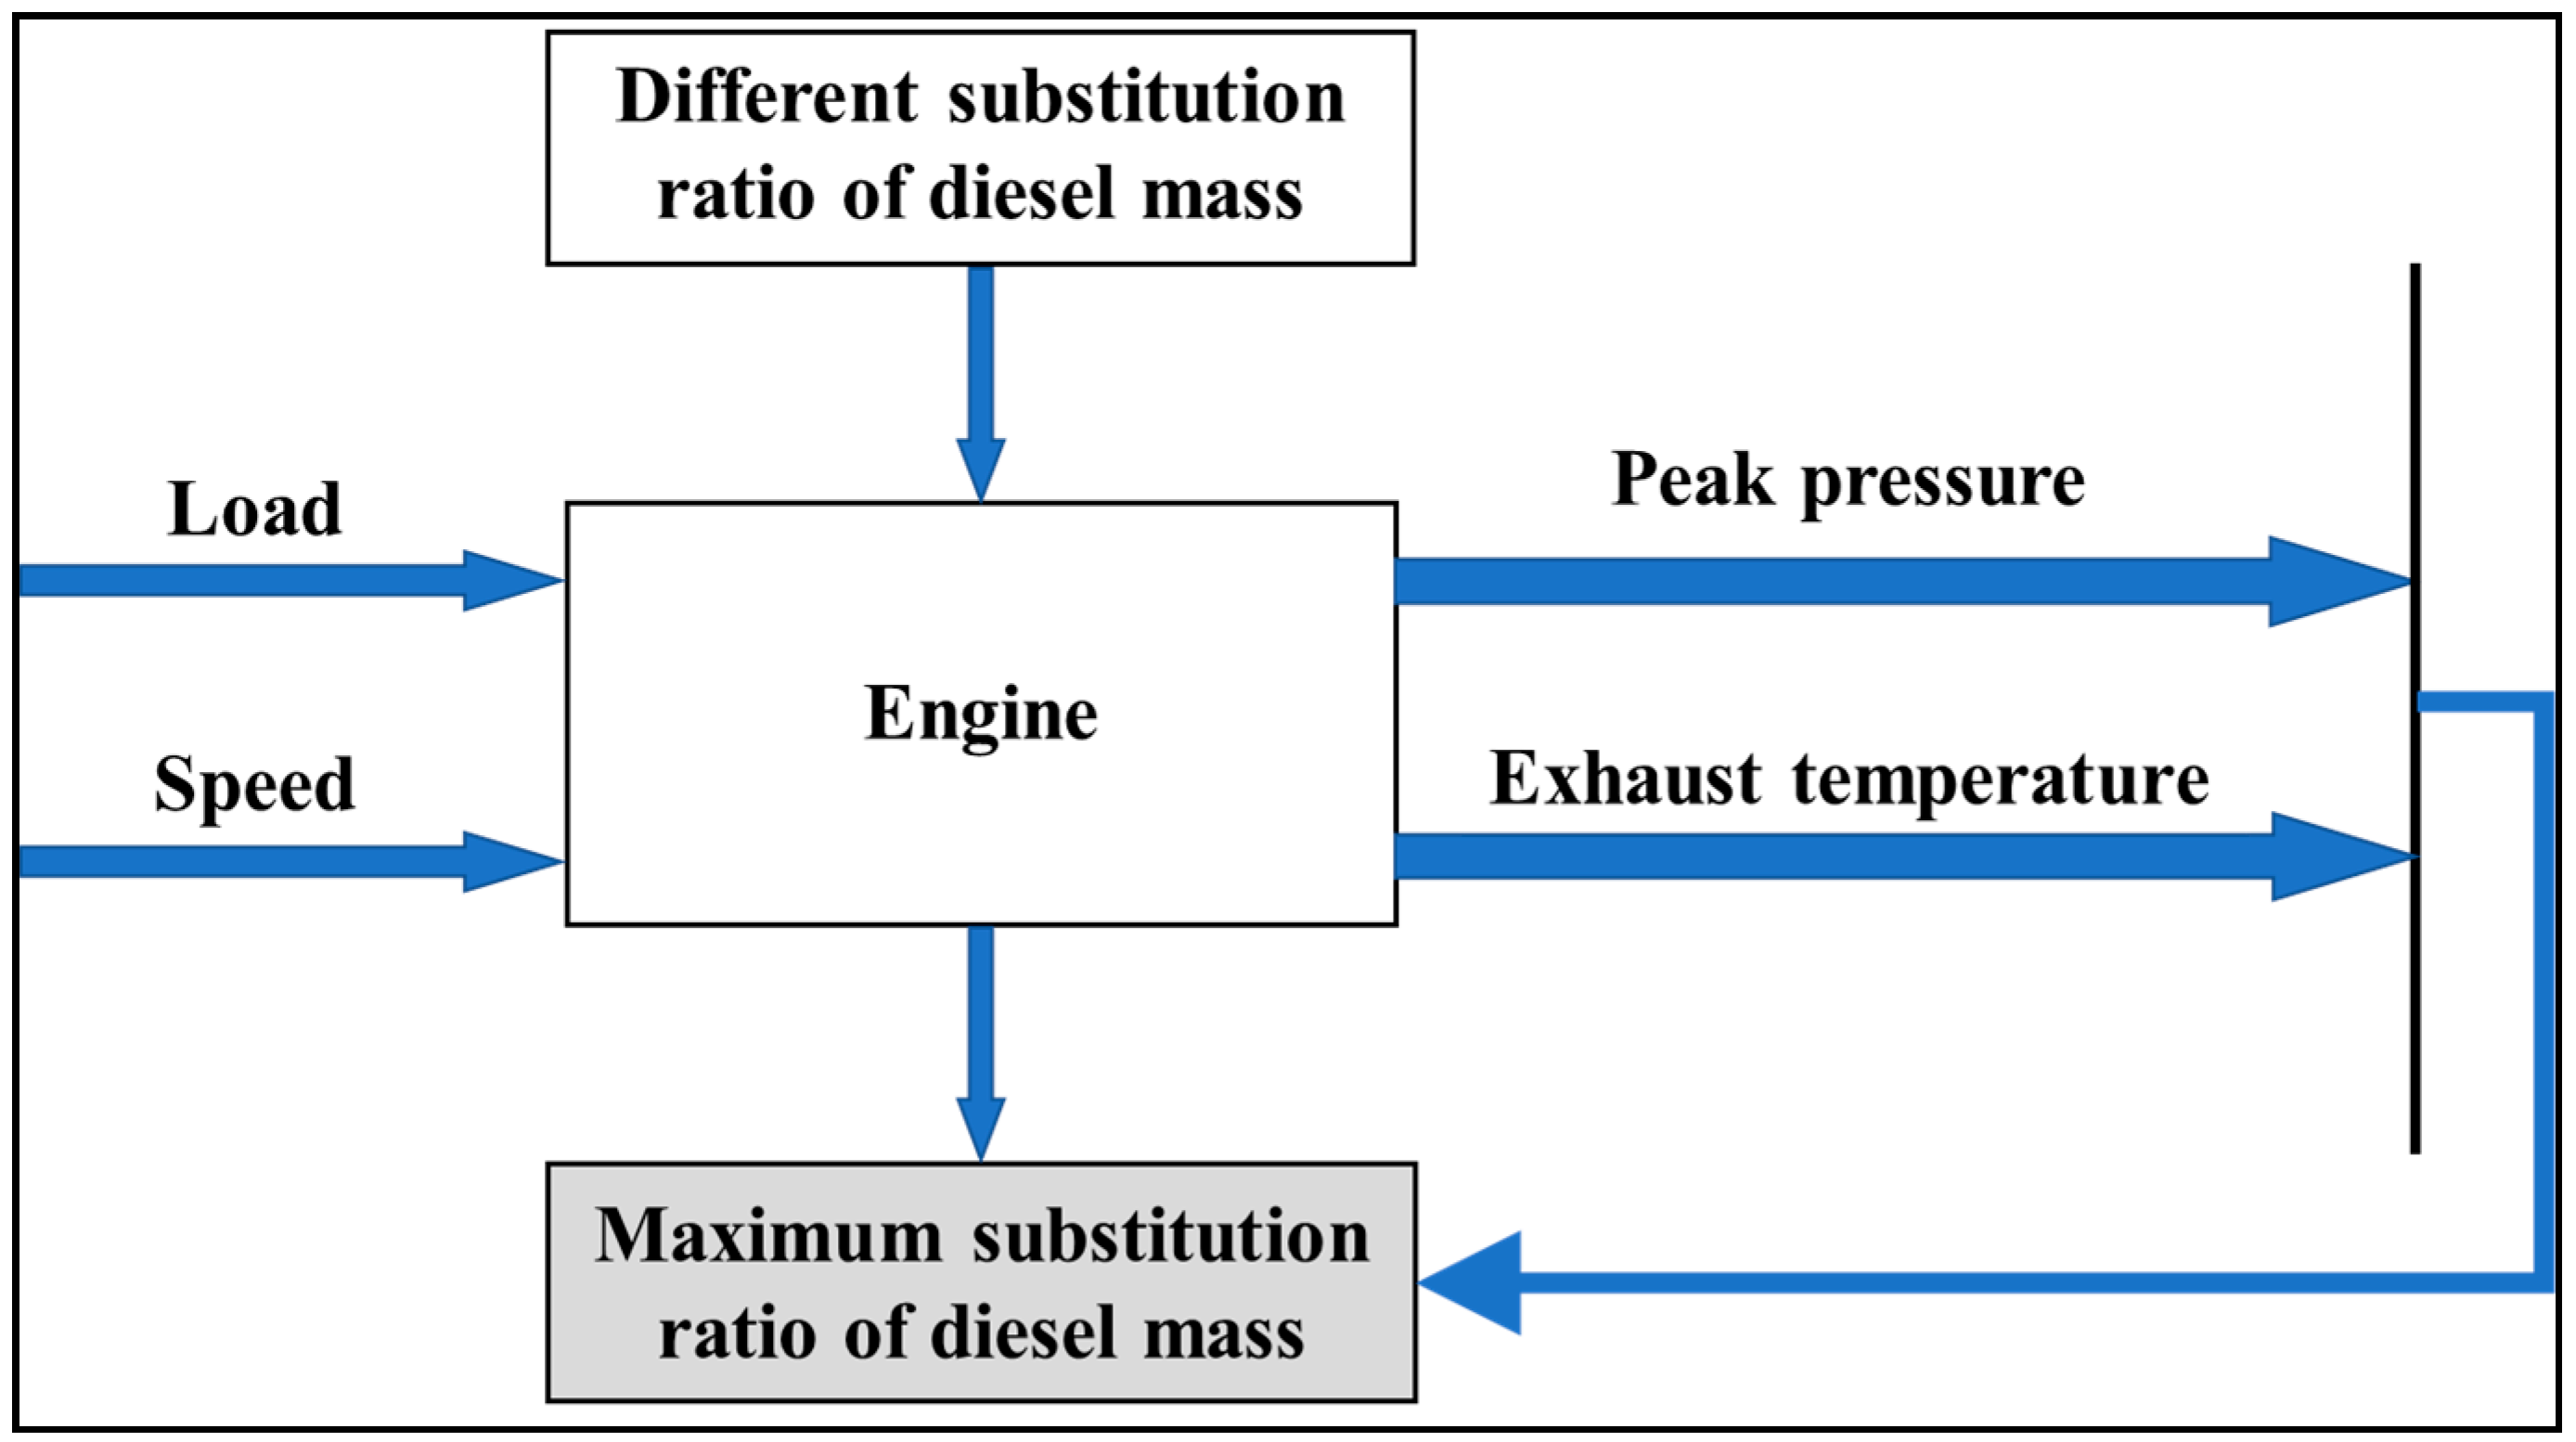
For dual-fuel engines, the control system is more complicated, and there are more parameters that need to be calibrated. In addition to the calibration of diesel fuel injection timing, the diesel mass substitution ratio needs to be calibrated. Considering the mechanical load and thermal load of the engine, as well as the actual test conditions, the peak pressure in the cylinder and the exhaust temperature are selected as the constraint conditions for parameter calibration, and the diesel mass substitution ratio is the objective function. Among them, the peak pressure in the cylinder is acquired through the cylinder pressure acquisition system, and the exhaust temperature is acquired through a temperature sensor installed on the exhaust pipe. The calibration process is shown in
Figure 3. At a certain operating condition point, first measure and record the peak pressure in the cylinder and exhaust temperature when it works in pure diesel mode. After switching to dual-fuel mode, the substitution ratio can be changed by adjusting the diesel, natural gas injection volume and diesel injection timing through the calibration software. The peak pressure and exhaust temperature in the cylinder in the pure diesel mode are used as constraints to find the maximum diesel mass substitution ratio, and the above operation is repeated after changing the operating point.
Diesel mass substitution ratio refers to the proportion of diesel replaced by natural gas when the engine is working in dual-fuel mode under the same operating conditions compared with the diesel consumed when working in pure diesel mode, as shown in Equation (1).
In the formula, S represents the diesel mass substitution ratio, represents the diesel consumption rate in pure diesel mode, in kg/h, and represents the diesel consumption rate in dual-fuel mode, in kg/h.
When calibrating, the engine outlet cooling water temperature is controlled at 80 °C ± 5 °C, the oil temperature is 90 °C ± 5 °C, the intercooler inlet water temperature is ≤35 °C and the air temperature after intercooling is ≤55 °C.
The rotational speed at the calibrated operating point ranges from an idle speed of 600 r/min to 1800 r/min, with an interval of 100 r/min, and the load starts from 200 Nm and increases by 200 Nm to the torque points of the external characteristics of each speed. Since the economy of the engine is poor with a light load, the load area below 200 Nm is not considered, and the engine works in diesel mode in the light-load area.
The engine calibration system requires multiple software and hardware to cooperate with each other [
22]. The most important is the cylinder pressure acquisition system. The cylinder pressure acquisition system used in this article is mainly composed of a cylinder pressure sensor, a charge amplifier, a data acquisition card and a host computer. The engine cylinder pressure change is first transmitted to the charge amplifier via the cylinder pressure sensor, and then the data acquisition card converts the analog signal from the charge amplifier into a digital signal for the host computer to read. Finally, the host computer processes the read data and displays it in the form of numbers and curves, so as to achieve the purpose of the real-time monitoring of the peak pressure in the cylinder. The upper computer program is modified from the previous research results [
23]. The manufacturers and models of the cylinder pressure sensor, charge amplifier, and data acquisition card are shown in
Table 3.
3. Results and Discussion
3.1. Diesel Mass Substitution Ratio
After the engine is calibrated by the aforementioned calibration method, the diesel mass substitution ratio at each operating point can be obtained from Equation (1). The distribution of the substitution ratio formed after the data are graphically processed, as shown in
Figure 4.
It can be seen from the substitution ratio distribution cloud chart that the diesel mass substitution ratio can reach up to 95% (800 r/min @ 800 Nm, 900 r/min @ 800 Nm and 1000 r/min @ 800 Nm). When the idling speed is 600 r/min, the substitution ratio is greater than 54%. The substitution ratio is lower at small loads at various speeds, mainly because the fuel injection volume is less at small loads, the mixture is usually leaner, and it is difficult to achieve full combustion of the fuel in the cylinder. On the other hand, less fuel injection leads to lower ignition energy and fewer fire cores, unable to ignite all natural gas, which also limits the increase in substitution ratio. The high substitution ratio area (≥80%) is mainly distributed in the medium and high load area below 1400 r/min speed. In the speed range of 800 r/min–1000 r/min, the substitution ratio at medium and high loads is above 90%. This is because the combustion effect in the cylinder is good under these working conditions, and most of the natural gas can be completely burned. Even if the substitution ratio reaches 80%, there is enough pilot diesel to provide the energy required for natural gas to ignite. Considering that the marine engine sails forward and backward, when the engine speed is 900–1000 r/min, the substitution ratio is above 70%; when the engine speed is 1000–1200 r/min, the substitution ratio is above 75%. At 1600 r/min and higher speeds, the substitution ratio is reduced. This is because at this time the fuel injection is more, the mixture is richer, and the peak pressure in the cylinder is higher. Continuing to increase the substitution ratio will cause the peak pressure in the dual-fuel mode to exceed the peak pressure in the pure diesel mode, and the engine may work abnormally. At 1800 r/min, the diesel mass substitution ratio is low, especially when the load is heavy; the lowest is 35%. This is because the cylinder pressure and exhaust temperature are both high at this time, and the thermal load and mechanical load on the engine are close to the limit. Excessive blending of natural gas will cause the pressure to be too high and exceed the safety limit. The average diesel mass substitution ratio under all operating conditions is 71%.
3.2. Economy
The main indicators to measure engine economy include brake-specific fuel consumption (BSFC) and brake thermal efficiency (BTE). The engine used here is a dual-fuel engine, and the price of different fuels is different, so the cost issue needs to be considered in actual use.
The total calorific value of natural gas is converted into the calorific value of equivalent diesel consumption and added to the diesel consumption in dual-fuel mode to obtain the equivalent hourly fuel consumption. The calculation formula for equivalent hourly fuel consumption in dual-fuel mode is shown in Equation (2).
In the formula, represents the equivalent hourly fuel consumption, in kg/h; represents the low calorific value of natural gas, which is 49.54 MJ/kg; indicates the low calorific value of diesel, which is 42.5 MJ/kg; and indicates the hourly consumption of natural gas in dual-fuel mode, in kg/h.
The BSFC directly represents the fuel consumption per unit output power of the engine and can be obtained from the equivalent hourly fuel consumption of the dual-fuel engine. The calculation formula is shown in Equation (3).
In the formula, represents the BSFC in g/kWh; represents the effective power in kW.
Among them, the effective power calculation is shown in Equation (4).
In the formula, n represents the engine speed, in r/min; represents the effective torque, in Nm.
In actual operation, the unit price of natural gas is calculated at the current market price of 5 CNY/kg (0.786 USD/kg), and diesel is calculated at the current market price of 7 CNY/kg (1.1 USD/kg). These prices are those in the Chinese market at the time of the experiment. The fuel cost calculation formula of the engine is shown in Equation (5).
In the formula, represents the fuel cost of the engine, in CNY/h; represents the current market price of diesel; and represents the current market price of LNG.
3.2.1. Economics under External Characteristics
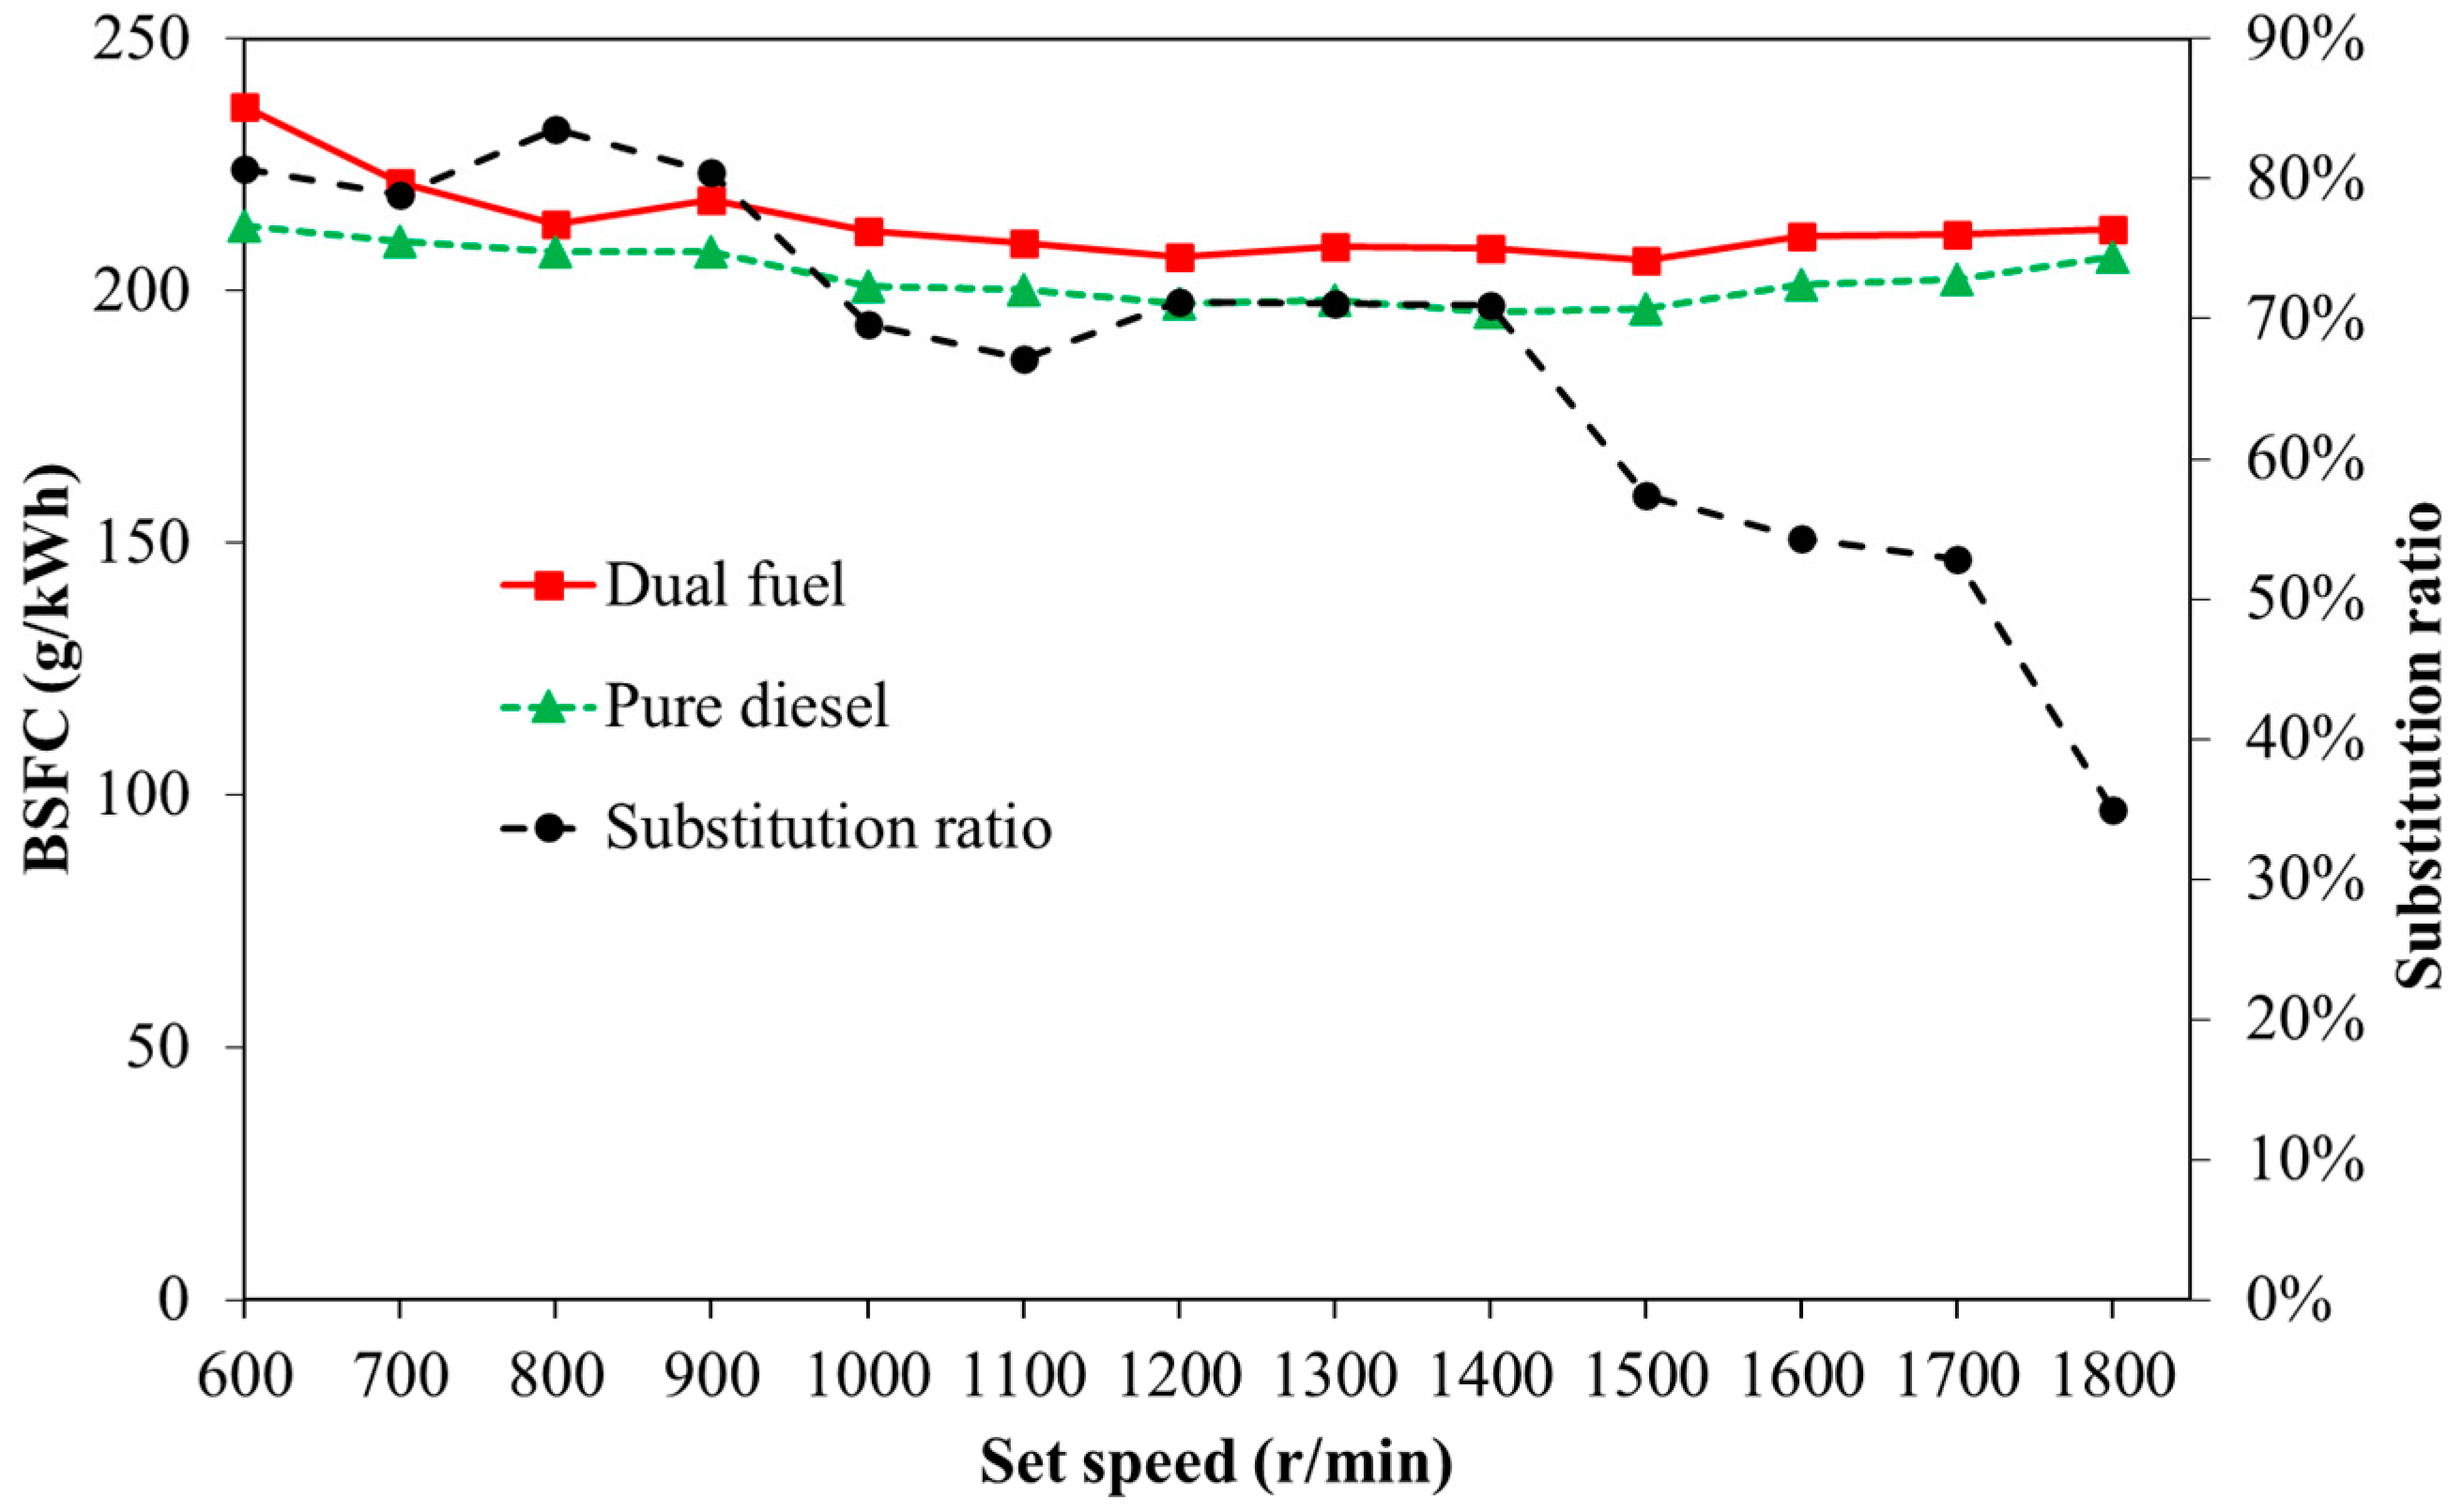
Figure 5 shows the change rule of the BSFC when the dual-fuel engine is operated in pure diesel mode and dual-fuel mode under external characteristic conditions. It can be seen that the BSFC of the engine in the dual-fuel mode is higher than that in the pure diesel mode, and the engine’s economy is worse under the external characteristics. This is mainly because the engine used in the test uses an out-cylinder mixer to supply mixed gas, and part of the mixed gas will be discharged when the valves overlap, so more natural gas is needed to ensure power.
When the engine speed is lower than 1400 r/min under the external characteristic conditions, there is a higher diesel mass substitution ratio, and when the speed is higher than 1400 r/min, the diesel mass substitution ratio gradually decreases as the speed increases. This is mainly because the mechanical load and thermal load on the engine are further increased. Excessive addition of natural gas will cause the engine to perform more poorly than in pure diesel mode, causing abnormalities.
Figure 6 is the BTE diagram of pure diesel mode and dual-fuel mode under external characteristic conditions. The BTE of the engine working in dual-fuel mode is lower than that of pure diesel mode. The efficiency reduction in the usual speed range is about 2%, which is within an acceptable range.
Figure 7 shows the fuel cost of the engine in two modes under the external characteristics. It can be seen that the fuel cost of the engine running in the dual-fuel mode under the external characteristics is much lower than that of pure diesel mode. The fuel cost can be reduced by an average of 21% under external characteristic conditions.
3.2.2. Economics under Load Characteristics
Figure 8 is the curve of BSFC with load when the engine is running in dual-fuel mode and pure diesel mode at a normal speed of 1000 r/min. It can be seen that the BSFC of dual-fuel mode is significantly higher than that of pure diesel mode at light load, and the BSFC of both modes gradually decreases with the increase in load. This is mainly because the load is small, the amount of pilot diesel is small, the ignition energy and the number of ignition centers are small, and the mixture does not easily catch fire. At this time, more natural gas needs to be provided. As the load increases, the combustion conditions improve and the BSFC decreases.
At a speed of 1000 r/min, as the load increases, the diesel mass substitution ratio first increases and then decreases. This is mainly because the engine requires less total fuel at light load. Too little diesel will make it difficult to ignite natural gas. At high load, too much natural gas will cause the peak pressure to become higher than the original one.
Figure 9 shows the law of the BTE of the engine working in two modes with load at 1000 r/min. It can be seen that the BTE of the engine is lower at light load and the BTE of the dual-fuel mode is much lower than that of pure diesel mode; the BTE of dual-fuel mode at medium and high loads is close to that of pure diesel mode.
Figure 10 shows the fuel cost of the engine in the two modes with load at 1000 r/min. It can be seen that the fuel cost of the dual-fuel mode is significantly lower than that of the pure diesel mode at medium and high loads. This is due to the higher diesel mass substitution ratio in these load ranges. At 57% load (84 kW), fuel costs are reduced the most, reaching 31%. When the load increases further, the percentage of fuel cost reduction decreases, because the proportion of natural gas decreases. The fuel cost can be reduced by 22% on average under the load characteristic of 1000 r/min.
3.2.3. Economics under Propulsion Characteristics
Figure 11 shows the BSFC of the engine in dual-fuel mode and pure diesel mode under the propulsion characteristics. The law is similar to that of the BSFC under load characteristics. The BSFC of dual-fuel mode at low speed and light load is much higher than that of pure diesel mode. As the speed and load increase, the BSFC of the two modes gradually decreases and the gap decreases. The change in the diesel mass substitution ratio of a dual-fuel engine under propulsion characteristics is similar to that of external characteristics. When the engine speed is higher than 1300 r/min, the diesel mass substitution ratio gradually decreases. This is because at this time the addition of natural gas has a more obvious impact on the cylinder pressure, and the excessive addition of natural gas will cause the pressure in the cylinder to exceed the safety limit.
Figure 12 shows the BTE of the two modes of the engine under the propulsion characteristics. The BTE of the dual-fuel mode at low speed is much lower than that of the pure diesel mode, and the two are closer when the speed reaches 1000 r/min.
Operating cost is an important factor in the development of marine dual-fuel engines.
Figure 13 shows the fuel cost of the two modes of the engine under the propulsion characteristics. It can be seen from the figure that the fuel cost of the two modes has a small difference at lower speeds. The fuel cost of dual-fuel mode at medium and high speeds is significantly lower than that of pure diesel mode. At 1200 r/min, the fuel cost is reduced the most, reaching 25%. As mentioned above, the engine’s speed range when it sails forward and backward is 900 r/min–1200 r/min, and the fuel cost in this interval is reduced by 22% on average. The fuel cost can be reduced by 17% on average under all propulsion characteristics. Considering the long-distance and long-term transportation of ships, the dual-fuel mode is more economically attractive.
3.3. Particulate Matter Emissions
Diesel is a complex hydrocarbon mixture fuel, mainly including alkanes, cycloalkanes, alkenes, aromatic hydrocarbons, polycyclic aromatic hydrocarbons and a small amount of sulfur, nitrogen and additives, etc. The fuel injected into the cylinder in each working cycle of the engine may not be completely combusted, and some volatile organic compounds and sulfates will be discharged with the exhaust gas. In the high-pressure combustion process, the fuel mixture is cracked in the high-temperature and oxygen-deficient zone, and after a series of complex chemical reactions, insoluble carbon particles composed almost exclusively of carbon are formed [
24]. The main component of natural gas is methane (CH
4), and the fuel composition is simple. As there is only one carbon atom in the molecule when it is burned, it will not crack and cannot produce the precursors of carbon particles, polyacetylene and polycyclic aromatic hydrocarbons (PAHS). Therefore, replacing part of diesel with natural gas can theoretically effectively reduce engine particulate emissions, and different loads and substitution ratios have different effects on particulate emissions.
For the LNG–diesel dual-fuel engine, the substitution ratio, load, speed and combustion system parameters all have an important influence on its particulate matter emission law. Therefore, this article focuses on the engine’s common speed of 1000 r/min, explores the influence of load and substitution ratio on engine emissions under this condition, and explores the characteristics of engine emissions at different speeds at 50% load.
3.3.1. The Influence of Load and Substitution Ratio on Particulate Matter Emissions
Figure 14 shows the particle size distribution of the engine at a 1000 r/min speed, with a 600 Nm, 800 Nm, 1000 Nm, and 1200 Nm load at different substitution ratios. The abscissa represents the particle size, and the ordinate axis represents the particle concentration corresponding to the particle size. The PM size distribution can more clearly reflect the emission characteristics of particulate matter under different substitution ratios, from which the main particle size composition of particulate matter can be seen, which is helpful for judging its main chemical composition in subsequent studies, and is an intuitive analysis indicator. The detailed differences in the distribution of particles with different particle sizes under different substitution ratios also reflect the reasons for the changes in the number and volume of particles. It can be seen that, as the substitution ratio increases at 600 Nm and 800 Nm, the number of particles of each particle size is gradually reduced. The reason is that the load is low at this time, and less diesel and natural gas enter the cylinder. When the ratio increases, the amount of diesel is further reduced, and the generated particulate matter is further reduced. At 1000 Nm and 1200 Nm, the concentration of particles of each particle size is higher than the 0% substitution ratio, at 20% substitution ratio and 50% substitution ratio, respectively. This is because the engine load is higher at this time, the temperature in the cylinder is also higher, and the amount of diesel and natural gas required increases. At the same time, because the engine is a single-point injection into the intake port, natural gas occupies part of the volume, which reduces the excess air coefficient. A large amount of diesel is cracked in the high-temperature and oxygen-deficient zone to produce particles of different sizes.
Figure 15 shows the change in the total number of particles with the substitution ratio under different loads. The ordinate axis represents the total number of particles per cc. It can be seen from the figure that the total amount of particulate matter at low and medium loads (600 Nm and 800 Nm) decreases significantly with the increase in the substitution ratio. At 80% substitution ratio, the total amount of particulate matter decreases by 66% and 63%, respectively. At high loads (1000 Nm and 1200 Nm), the total amount of particulate matter first increases and then decreases. The reason is that the engine circulating fuel supply becomes higher and the excess air coefficient becomes lower under high load. The lower substitution ratio has an adverse effect on the generation of particulate matter. More fuel will form particulate matter due to the incomplete combustion as a result of high temperature and oxygen deficiency. When the substitution ratio further increases, the amount of diesel will continue to decrease, and its role will be changed from providing most of the output power to igniting natural gas. The influence of the excess air coefficient becomes smaller, and the amount of particulate matter is further reduced. When the substitution ratio is 80%, it is reduced by 57% and 19% under the conditions of 1000 Nm and 1200 Nm, 14 respectively. At 0% substitution ratio, the amount of particulate matter under 800 Nm load is higher than that under other loads. This is because the combustion effect in the engine cylinder is poor at this time, and more fuel is cracked in the high-temperature and oxygen-deficient zone. At other substitution ratios, as the load increases, the total number of particulates also gradually increases. This is because the temperature in the cylinder and the circulating oil supply increase when the load increases, and the environment in the cylinder is conducive to the production of particulates.
Figure 16 shows the change in particulate volume with the substitution ratio under different loads. The ordinate axis represents the volume of particles per cc. The volume is calculated on the basis of the aerodynamic equivalent diameter and the particles are assumed to be uniform spheres, which are calculated according to the sphere volume formula. The volume of particulate matter at 600 Nm and 800 Nm decreases with the increase in the substitution ratio. At 1000 Nm and 1200 Nm, the volume of particulate matter increases first and then decreases, and the change law is consistent with the change law of the total number. At 80% substitution ratio, the volume of particulate matter under each load is reduced by 48%, 34%, 23%, and 22%, respectively, compared with a 0% substitution ratio. The reason for the decrease in the volume of particulate matter is that less fuel enters the cylinder when the substitution ratio is high, which is not conducive to the generation of accumulated particles, and the proportion of nuclear particles in the particulate matter increases. The size of the nuclear particles is smaller, so the volume of the particulate matter is also significantly reduced.
3.3.2. The Influence of Speed and Substitution Ratio on Particulate Matter Emissions
Rotational speed also has a greater impact on emissions during actual operation. This section selects 800 r/min, 1000 r/min and 1200 r/min in the engine’s common speed range to explore the influence of speed on particulate matter emissions. Since the medium load is the normal load of the engine, the thermal efficiency is high at the medium load, and the effective fuel consumption rate is low, the load is selected as 50%.
Figure 17 shows the particle size distribution of the engine at 0%, 20%, 50% and 80% substitution ratios, at 800 r/min, 1000 r/min and 1200 r/min speeds, and at 50% load. It can be seen that at the three rotation speeds, nuclear particles and accumulated particles decrease as the substitution ratio increases, and when the substitution ratio increases, the particle size distribution curve gradually shows obvious bimodal distribution characteristics. The reason is that when the substitution ratio increases, less diesel and more natural gas enters the cylinder, and fewer nuclear particles are generated during the diesel atomization combustion process. The spatial distribution of nuclear particles is uneven, and the probability of the particles contacting each other to form accumulated particles is also reduced. This leads to the appearance of double peaks.
The changes in the total number of particles with different substitution ratios at 800 r/min, 1000 r/min and 1200 r/min speeds at 50% load are shown in
Figure 18. It can be seen from the figure that with the increase in the substitution ratio, the total number of particulates at each speed has a significant reduction. When the substitution ratio is 80%, compared with the pure diesel mode, it is reduced by 76%, 69%, and 61%, respectively. The reason is that the increase in the substitution ratio leads to a decrease in the amount of fuel entering the cylinder and a decrease in the source of particulate matter. Among them, the effect of reducing the total number of particles at 800 r/min is the most obvious. This is because the engine power is small at 800 r/min, and the amount of fuel required per cycle is also less. After the substitution ratio increases, the fuel amount is further reduced, and the combustion is more complete. With the increase in speed, the total number of particles at the same substitution ratio first decreases and then increases. The total number of particles at 1000 r/min is lower than 800 r/min and 1200 r/min. This is because the engine load is also low at low speeds, the fuel injected into the cylinder is poorly atomized and poorly mixed, and a large amount of fuel is not completely burned. When the speed increases, the fuel injection pressure increases, and the mixing effect and fuel combustion effect improve. When the speed is further increased, the engine load is further increased, which causes the temperature in the cylinder to become higher; the excess air coefficient decreases; and more fuel is cracked in the high-temperature and oxygen-deficient zone to produce more particulate matter.
Figure 19 shows the change in the volume of particulate matter when the engine is at 50% load and at different substitution ratios, under 800 r/min, 1000 r/min and 1200 r/min operating conditions. At different speeds, the volume of particles is significantly reduced, and at 80% substitution ratio, it is reduced by 71%, 44%, and 29%, respectively. The difference from the change rule of the total number of particles is that the volume of the particles is the lowest when the speed is 1200 r/min. This is because, at 1200 r/min, the fuel pyrolysis generates particulate matter and the residence time in the cylinder is shorter than at other speeds. The HC fragments are discharged before they can react further and become accumulated particulate matter. The volume of particulate matter mainly depends on the number of accumulated particles. Therefore, the volume of particulate matter at 1200 r/min is smaller than that at other speeds.
4. Conclusions
In the present study, a new calibration method is proposed for retrofitting a diesel engine to an LNG–diesel dual-fuel engine, and the substitution ratio, economy, and particulate matter emissions are discussed and studied in detail. The major conclusions of this study are summarized as follows:
(1) Calibrating the engine with the peak pressure in the cylinder and the exhaust temperature in the pure diesel mode as the constraint conditions can obtain a higher diesel mass substitution ratio without losing power. The calibrated dual-fuel engine diesel mass substitution ratio can reach up to 95% (800 r/min @ 800 Nm, 900 r/min @ 800Nm and 1000 r/min @ 800Nm). The substitution ratio in the medium- and high-load areas below 1400 r/min is above 80%, and the substitution ratio is above 70% in the normal speed range of 900 r/min–1200 r/min. The average diesel mass substitution ratio under all working conditions is 71%.
(2) When the engine is working under external characteristics, propulsion characteristics and different loads at 1000 r/min speed, the BSFC of the dual-fuel mode is higher than that of pure diesel mode, which is more obvious at small loads, and the two are closer at medium and high loads.
(3) The operating cost of the engine is significantly reduced in dual-fuel mode. When the engine is working under external characteristics, propulsion characteristics and different loads at 1000 r/min speed, the fuel cost of the dual-fuel mode is reduced by an average of 21%, 17%, and 22%, respectively.
(4) Load and substitution ratio have a significant impact on particulate matter emissions. When the engine is working at the usual speed of 1000 r/min, the total amount of particulate matter under medium and low loads will gradually decrease with an increase in the substitution ratio, and at an 80% substitution ratio, it will decrease by 66% (600 Nm) and 63% (800 Nm), respectively. When the load is high, the total number of particles increases at a low substitution ratio. When the substitution ratio reaches 80%, the total number of particles decreases by 57% (1000 Nm) and 19% (1200 Nm), respectively. The change law of the volume of the particulate matter is consistent with the change law of the total amount of particulate matter.
(5) Rotation speed is an important influencing factor of engine particulate matter emissions. At 50% load rate, the total amount and volume of particulate matter under the selected speed conditions will decrease as the substitution ratio increases. When the substitution ratio is 80%, the total number of particles is reduced by 76%, 69%, and 61%, and the volume of particles is reduced by 71%, 44%, and 29%, respectively.
Author Contributions
Conceptualization, Y.J. and B.Z.; methodology, B.Z.; validation, Y.J., B.Z. and Y.C.; formal analysis, Y.J. and B.Z.; investigation, Y.C. and B.Z.; data curation, B.Z.; writing—original draft preparation, B.Z.; writing—review and editing, Y.C. and B.Z.; funding acquisition, Y.J. All authors have read and agreed to the published version of the manuscript.
Funding
This research was funded by the Science and Technology Department of Hubei Province, China (Grant No: 2020BAB127) and China International Marine Containers (China) (Grant No: ENRIC-2020-003).
Institutional Review Board Statement
Not applicable.
Informed Consent Statement
Not applicable.
Data Availability Statement
Not applicable.
Acknowledgments
This work was financially supported by a project funded by the Science and Technology Department of Hubei Province, China (Grant No: 2020BAB127), and a project funded by CIMC (China International Marine Containers (China)) (Grant No: ENRIC-2020-003).
Conflicts of Interest
The authors declare no conflict of interest.
References
- Rafiee, A.; Khalilpour, K.R. Renewable hybridization of oil and gas supply chains. In Polygeneration with Polystorage for Chemical and Energy Hubs, 1st ed.; Academic Press: Cambridge, MA, USA, 2019; pp. 331–372. [Google Scholar]
- Boretti, A. Advances in Diesel-LNG Internal Combustion Engines. Appl. Sci. 2020, 10, 1296. [Google Scholar] [CrossRef] [Green Version]
- Prastyasari, F.I.; Handani, D.W.; Dinariyana, A.A.B.; Prakoso, M.A. Feasibility study of diesel engine replacement on passenger ships: A system dynamics approach. WMU J. Marit. Aff. 2019, 18, 281–296. [Google Scholar] [CrossRef]
- Arefin, M.A.; Nabi, M.N.; Akram, M.W.; Islam, M.T.; Chowdhury, M.W. A review on liquefied natural gas as fuels for dual fuel engines: Opportunities, challenges and responses. Energies 2020, 13, 6127. [Google Scholar] [CrossRef]
- Wong, K.I.; Wong, P.K. Optimal calibration of variable biofuel blend dual-injection engines using sparse Bayesian extreme learning machine and metaheuristic optimization. Energy Convers. Manag. 2017, 148, 1170–1178. [Google Scholar] [CrossRef]
- Ma, C.; Yao, C.; Song, E.-Z.; Ding, S.-L. Prediction and optimization of dual-fuel marine engine emissions and performance using combined ANN with PSO algorithms. Int. J. Engine Res. 2021, 1468087421990476. [Google Scholar] [CrossRef]
- Lin, Z.Q.; Su, W.H. Mapping technique based on the LaGrange-SUMT method for a pilot ignited CNG engine. Trans. Chin. Soc. Intern. Combust. Engines 2004, 22, 385–390. [Google Scholar]
- Cheenkachorn, K.; Poompipatpong, C.; Ho, C.G. Performance and emissions of a heavy-duty diesel engine fuelled with diesel and LNG (liquid natural gas). Energy 2013, 53, 52–57. [Google Scholar] [CrossRef]
- Li, J.H.; Wu, B.B.; Mao, G.P. Research on the performance and emission characteristics of the LNG-diesel marine engine. J. Nat. Gas Sci. Eng. 2015, 27, 945–954. [Google Scholar] [CrossRef]
- Wu, Z.G. The Trial Experimental of High-Power 190 Diesel-CNG Dual-Fuel Engine. Intern. Combust. Engine Powerpl. 2010, 3, 18–20. [Google Scholar]
- Theodoropoulos, P.; Spandonidis, C.C.; Themelis, N.; Giordamlis, C.; Fassois, S. Evaluation of Different Deep-Learning Models for the Prediction of a Ship’s Propulsion Power. J. Mar. Sci. Eng. 2021, 9, 116. [Google Scholar] [CrossRef]
- Theodoropoulos, P.; Spandonidis, C.C.; Giannopoulos, F.; Fassois, S. A Deep Learning-Based Fault Detection Model for Optimization of Shipping Operations and Enhancement of Maritime Safety. Sensors 2021, 21, 5658. [Google Scholar] [CrossRef] [PubMed]
- Lv, J.; Song, J.; Yao, J. Performance and an optimisation control scheme of a heavy-duty diesel engine fuelled with LNG-diesel dual-fuel. Int. J. Heavy Veh. Syst. 2018, 25, 189–202. [Google Scholar] [CrossRef]
- Zhang, C.; Zhou, A.; Shen, Y.; Li, Y.; Shi, Q. Effects of combustion duration characteristic on the brake thermal efficiency and NOx emission of a turbocharged diesel engine fueled with diesel-LNG dual-fuel. Appl. Therm. Eng. 2017, 127, 312–318. [Google Scholar] [CrossRef]
- Misra, C.; Ruehl, C.; Collins, J.; Chernich, D.; Herner, J. In-Use NOx Emissions from Diesel and Liquefied Natural Gas Refuse Trucks Equipped with SCR and TWC, Respectively. Environ. Sci. Technol. 2017, 51, 6981–6989. [Google Scholar] [CrossRef] [PubMed]
- Seddiek, I.S.; Elgohary, M.M. Eco-friendly selection of ship emissions reduction strategies with emphasis on SOx and NOx emissions. Int. J. Nav. Archit. Ocean Eng. 2014, 6, 737–748. [Google Scholar] [CrossRef] [Green Version]
- Schlick, H. Potentials and challenges of gas and dual-fuel engines for marine application. In Proceedings of the 5th CIMAC Cascades, Busan, Korea, 23 October 2014; pp. 1–31. [Google Scholar]
- Li, J.H.; Liu, D.W.; Mao, G.P. Design and investigation of diesel/LNG dual-fuel engine control system in ship. J. Chin. Agric. Mech. 2016, 37, 170–175. [Google Scholar]
- Yang, B.; Wei, X.; Zeng, K.; Lai, M.C. The Development of an Electronic Control Unit for a High Pressure Common Rail Diesel/Natural Gas Dual-Fuel Engine; SAE Technical Paper (No. 2014-01-1168); SAE International: Warrendale, PA, USA, 2014. [Google Scholar] [CrossRef]
- Liu, L.; Yang, F.Y.; Ouyang, M.G.; Fang, C.; Jiang, Z.J.; Hao, S.G. Control and optimization of diesel/LNG system of a 4G200 diesel engine. J. Jilin Univ. Eng. Technol. Ed. 2015, 45, 414–419. [Google Scholar]
- Xiao, X. Gas Automatic Control System Optimal Design for Marine LNG-Diesel Dual Fuel Engine. Master’s Thesis, Shandong University, Jinan, China, 2019. [Google Scholar]
- Jia, D.R. Research on Multi-Objective Optimization Method for Calibration System and Ignition Advance Angle of Electronically Controlled Gasoline Engine. Master’s Thesis, Zhejiang University, Hangzhou, China, 2007. [Google Scholar]
- Wang, J. Combustion Data Acquisition and Test Research of Dissociated Methanol Engine. Master’s Thesis, Huazhong University of Science and Technology, Wuhan, China, 2016. [Google Scholar]
- Kittelson, D.B. Engines and nanoparticles: A review. J. Aerosol Sci. 1998, 29, 575–588. [Google Scholar] [CrossRef]
Figure 2.
View of the test engine.
Figure 2.
View of the test engine.
Figure 3.
Calibration process of diesel mass substitution ratio.
Figure 3.
Calibration process of diesel mass substitution ratio.
Figure 4.
Distribution cloud map of diesel mass substitution ratio.
Figure 4.
Distribution cloud map of diesel mass substitution ratio.
Figure 5.
BSFC under external characteristics.
Figure 5.
BSFC under external characteristics.
Figure 6.
BTE under external characteristics.
Figure 6.
BTE under external characteristics.
Figure 7.
Fuel cost under external characteristics.
Figure 7.
Fuel cost under external characteristics.
Figure 8.
BSFC under 1000 r/min load characteristics.
Figure 8.
BSFC under 1000 r/min load characteristics.
Figure 9.
BTE under 1000r/min load characteristics.
Figure 9.
BTE under 1000r/min load characteristics.
Figure 10.
Fuel cost under 1000 r/min load characteristics.
Figure 10.
Fuel cost under 1000 r/min load characteristics.
Figure 11.
BSFC under propulsion characteristics.
Figure 11.
BSFC under propulsion characteristics.
Figure 12.
BTE under propulsion characteristics.
Figure 12.
BTE under propulsion characteristics.
Figure 13.
Fuel cost under propulsion characteristics.
Figure 13.
Fuel cost under propulsion characteristics.
Figure 14.
Particle size distribution of 1000r/min with different loads and substitution ratios.
Figure 14.
Particle size distribution of 1000r/min with different loads and substitution ratios.
Figure 15.
Total number of particles under different loads at 1000r/min.
Figure 15.
Total number of particles under different loads at 1000r/min.
Figure 16.
Particle volume under different load at 1000 r/min.
Figure 16.
Particle volume under different load at 1000 r/min.
Figure 17.
Particle size distribution under different speeds at 50% load.
Figure 17.
Particle size distribution under different speeds at 50% load.
Figure 18.
Total number of particles under different speeds at 50% load.
Figure 18.
Total number of particles under different speeds at 50% load.
Figure 19.
Particle volume under different speeds at 50% load.
Figure 19.
Particle volume under different speeds at 50% load.
Table 1.
Specifications of the marine diesel engine.
Table 1.
Specifications of the marine diesel engine.
| Model | YC6K450LN-C31 |
|---|
| Manufacturer | Y&C Engine Co., Ltd. |
| Type | In-line, four-stroke |
| Cooling system | Water cooled |
| Intake system | Turbocharged inter-cooling |
| Cylinder number | 6 |
| Fire sequence | 1-5-3-6-2-4 |
| Bore×stroke | 129 × 155 mm |
| Displacement | 12.16 L |
| Compression ratio | 15.5 |
| Number of valves per cylinder | 4 |
| Rated power/speed | 331 kW/1800 r/min |
| Max torque/speed | 1905 Nm/(1600–1800 r/min) |
Table 2.
Monitoring and testing equipment.
Table 2.
Monitoring and testing equipment.
| Equipment | Manufacturer | Model | Accuracies |
|---|
| Dynamometer | Chengbang | DW400 | ±1 rpm; ±1 Nm |
| Measurement and control cabinet | Chengbang | ET2000 | ±1 rpm; ±1 Nm |
| Fuel consumption meter | Chengbang | ET4500 | 0.4% |
| Oil return processor | Chengbang | ET4700 | 0.4% |
| Particulate matter emission test system | Cambustion | DMS500 | ±1 nm |
| Natural gas flowmeter | JiangyiZhongkong | JLWQ-25Z | 0.2% |
Table 3.
Cylinder pressure acquisition equipment.
Table 3.
Cylinder pressure acquisition equipment.
| Equipment | Manufacturer | Model |
|---|
| Cylinder pressure sensor | KISTLER | 6052C-U20 |
| Charge amplifier | KISTLER | 5018A |
| Data acquisition card | National Instruments | USB-6221 |
| Publisher’s Note: MDPI stays neutral with regard to jurisdictional claims in published maps and institutional affiliations. |
© 2022 by the authors. Licensee MDPI, Basel, Switzerland. This article is an open access article distributed under the terms and conditions of the Creative Commons Attribution (CC BY) license (https://creativecommons.org/licenses/by/4.0/).


