
Stock Assessment and Rebuilding of Two Major Shrimp Fisheries (Penaeus monodon and Metapenaeus monoceros) from the Industrial Fishing Zone of Bangladesh

 ,
,  , ,
, , 
 , and
, and 
Abstract
:1. Introduction
2. Materials and Methods
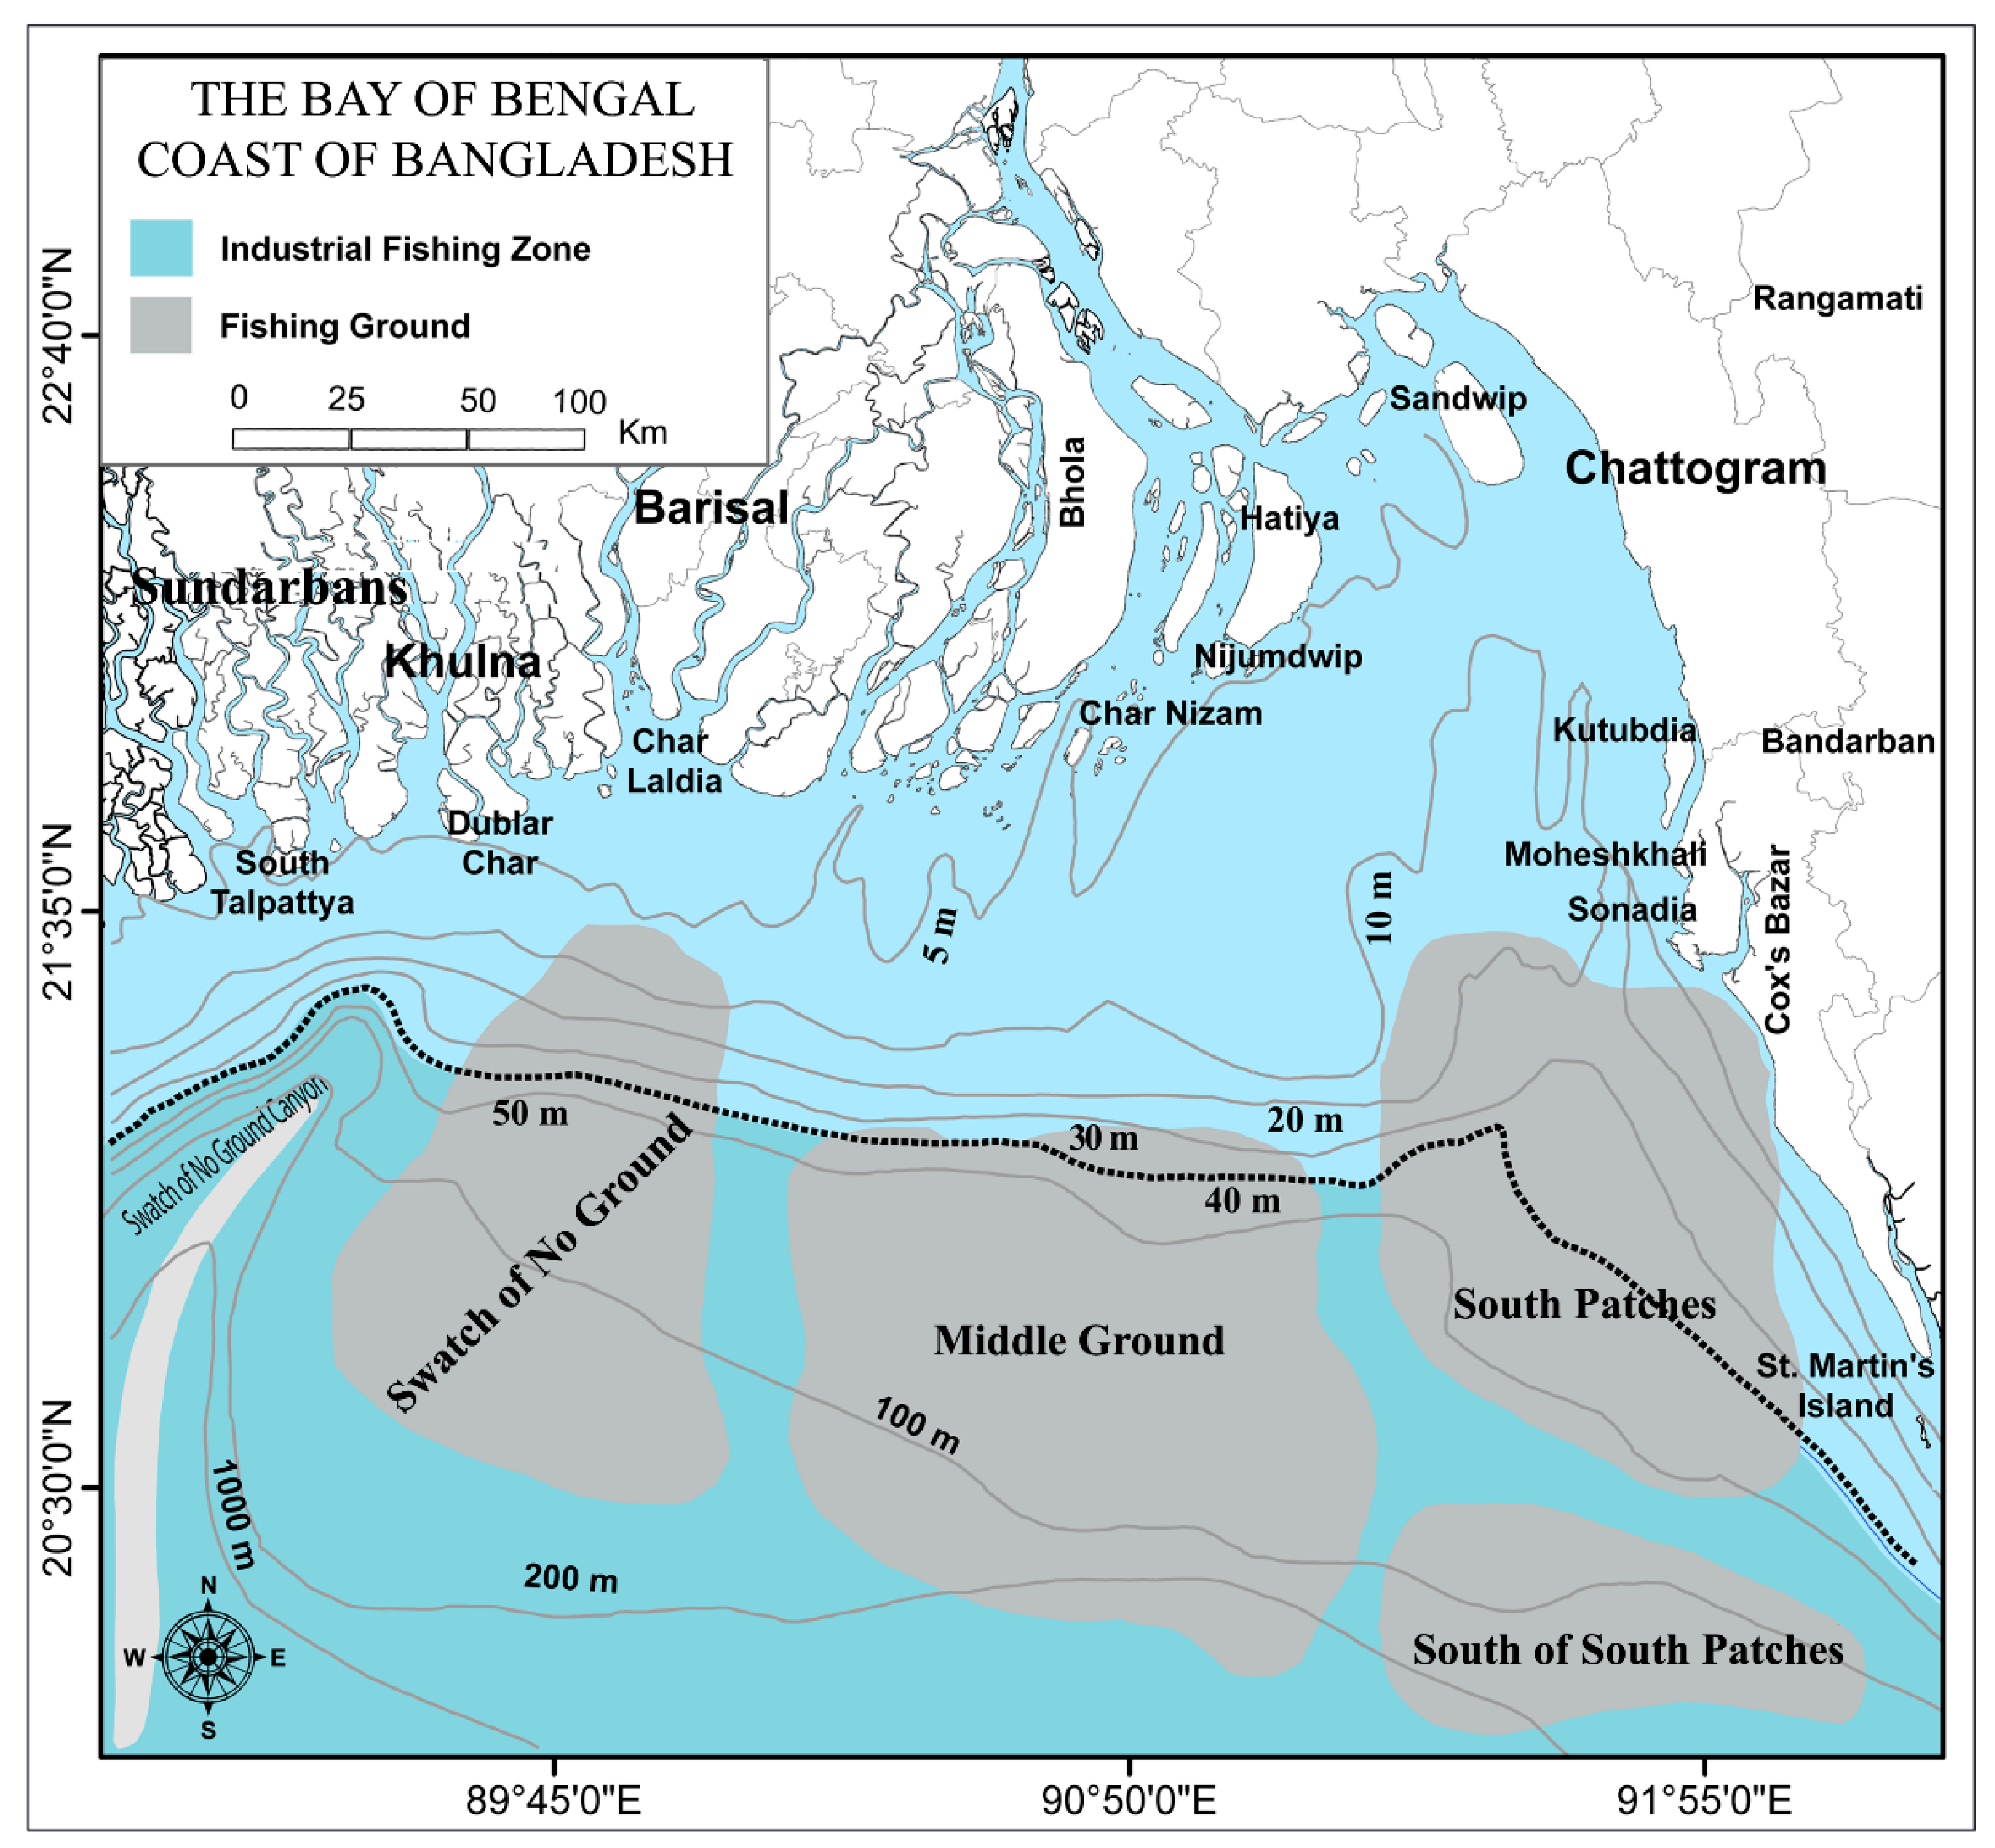
2.1. Study Area and Data Source
2.2. The DB-SRA Model
- when n = 2, the biomass at maximum sustainable yield (BMSY) equals K/2;
- when n < 2, BMSY is less than half of K; and
2.3. Estimation of Input Parameters
2.4. Sensitivity Analysis of DB-SRA
- dlobj: the output object from DB-SRA.
- projyears: the number of projection years (10 years).
- projtype: 2 (user-specified catch)
- projcatch: projected catches (different catch limits including MSY and OFL were used).
3. Results
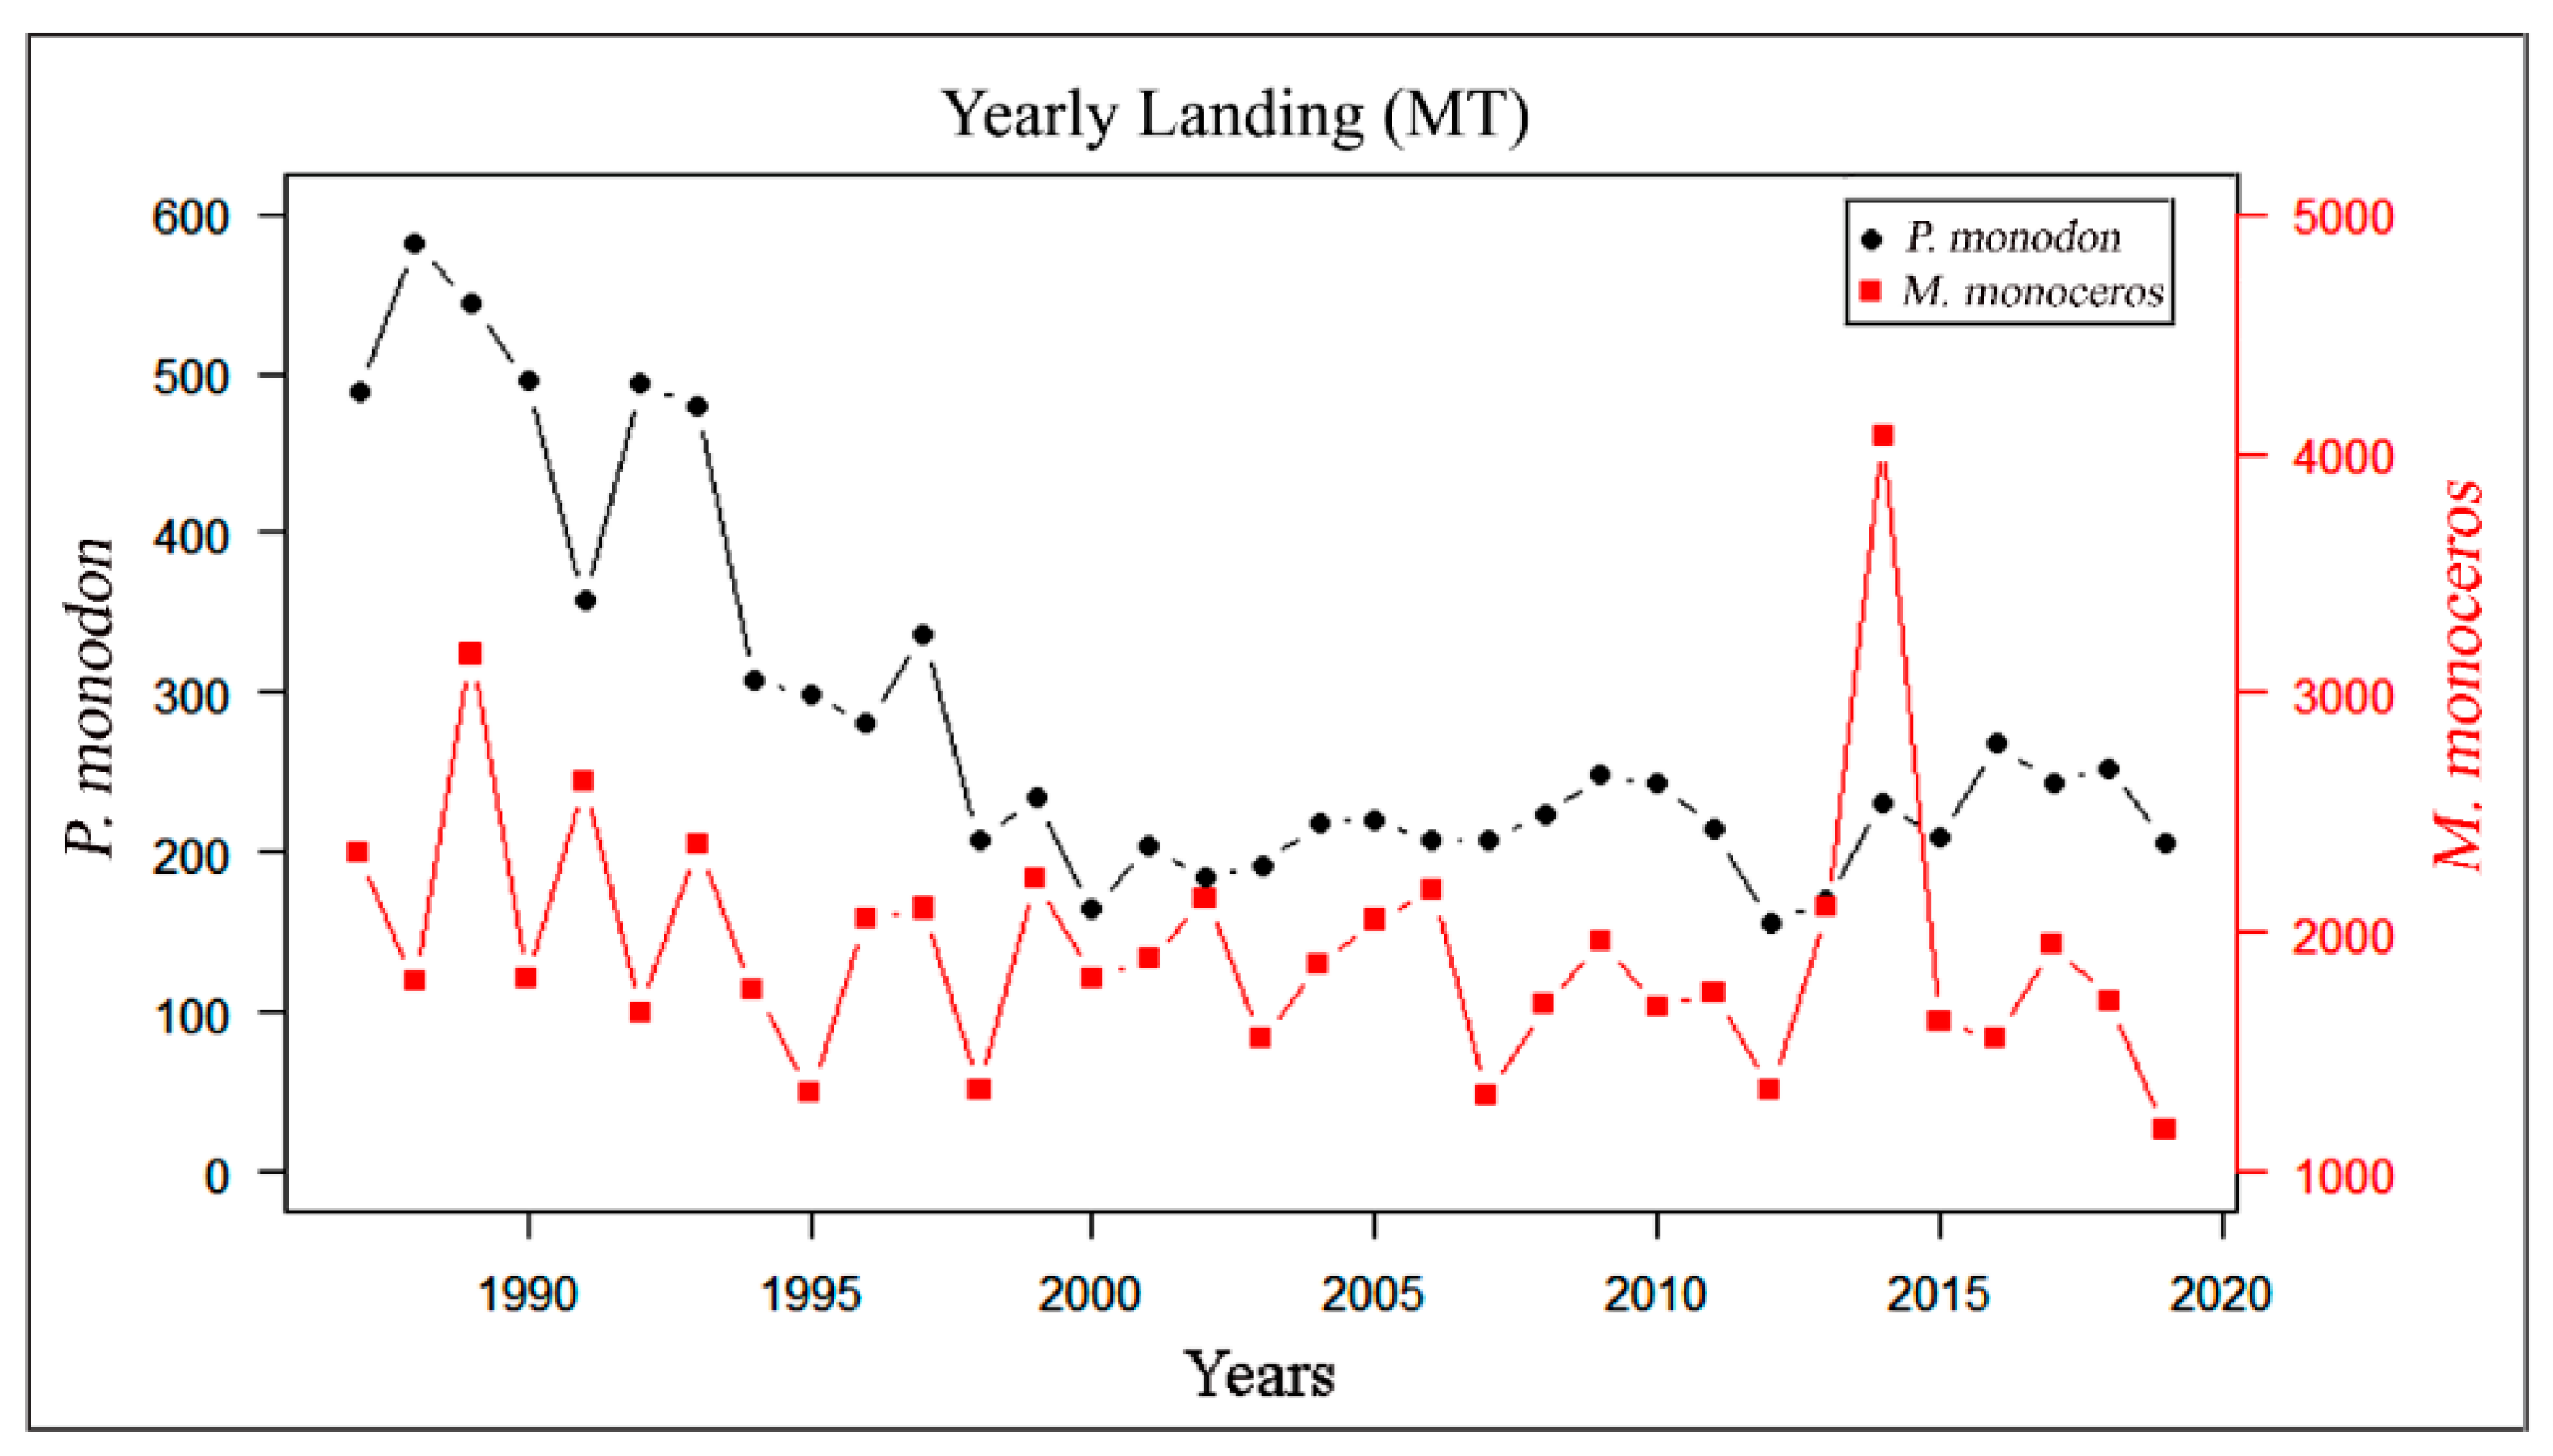
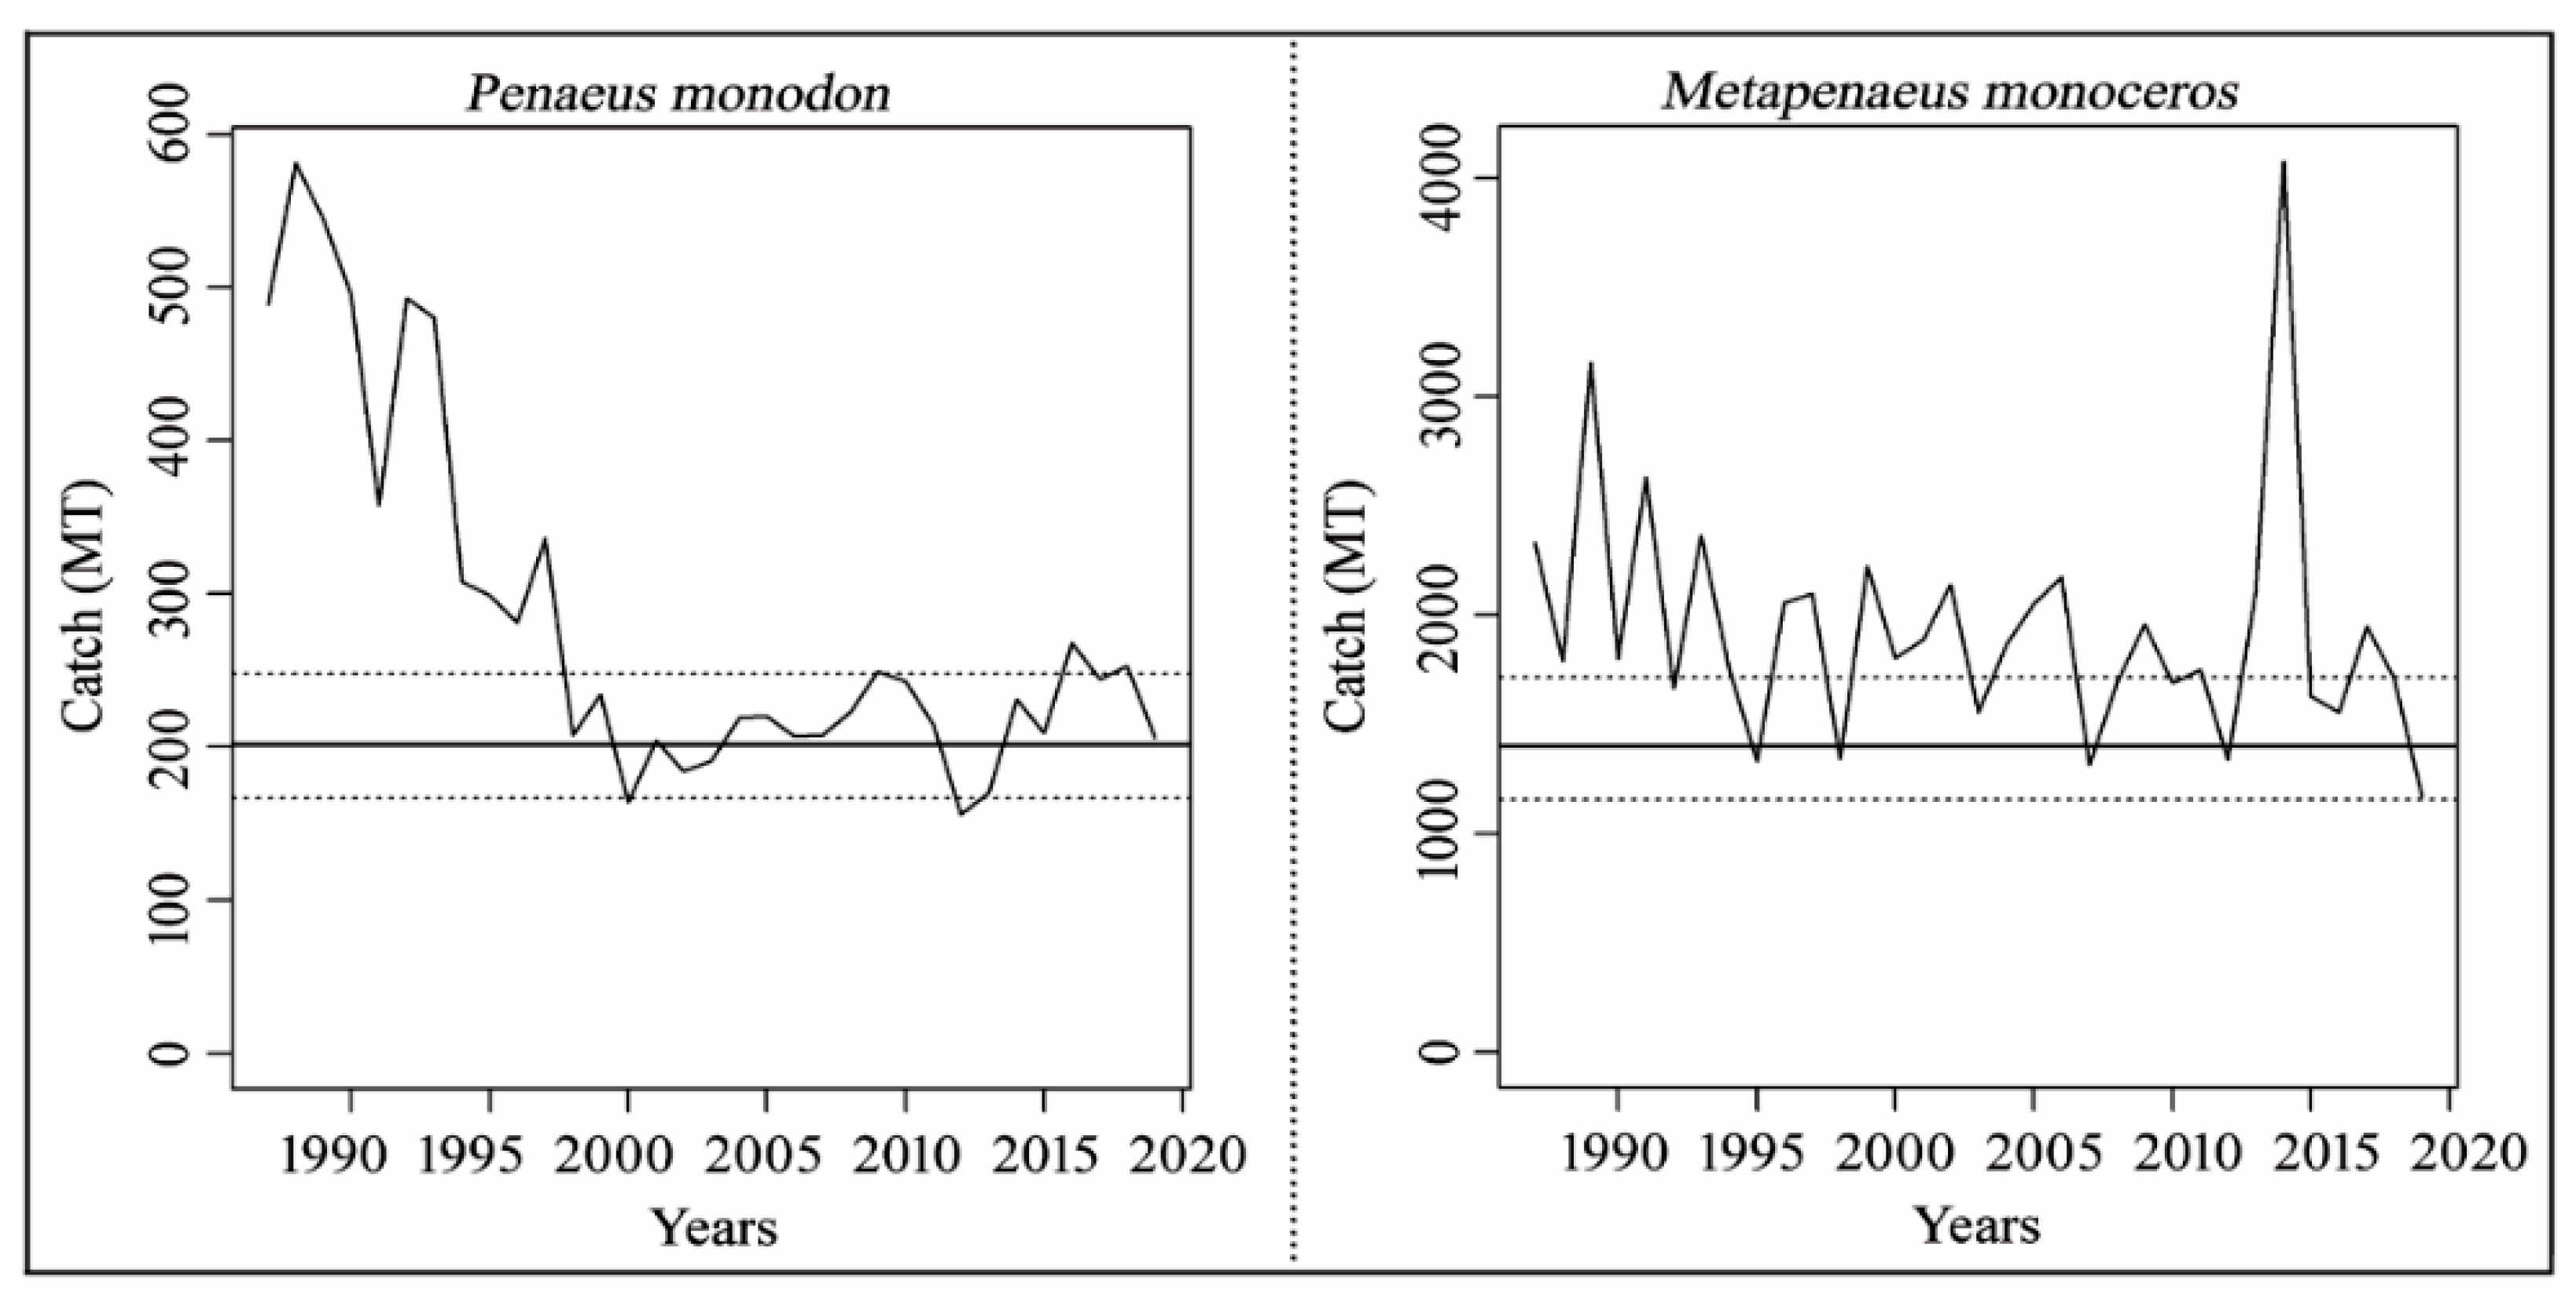
3.1. Landing Trend
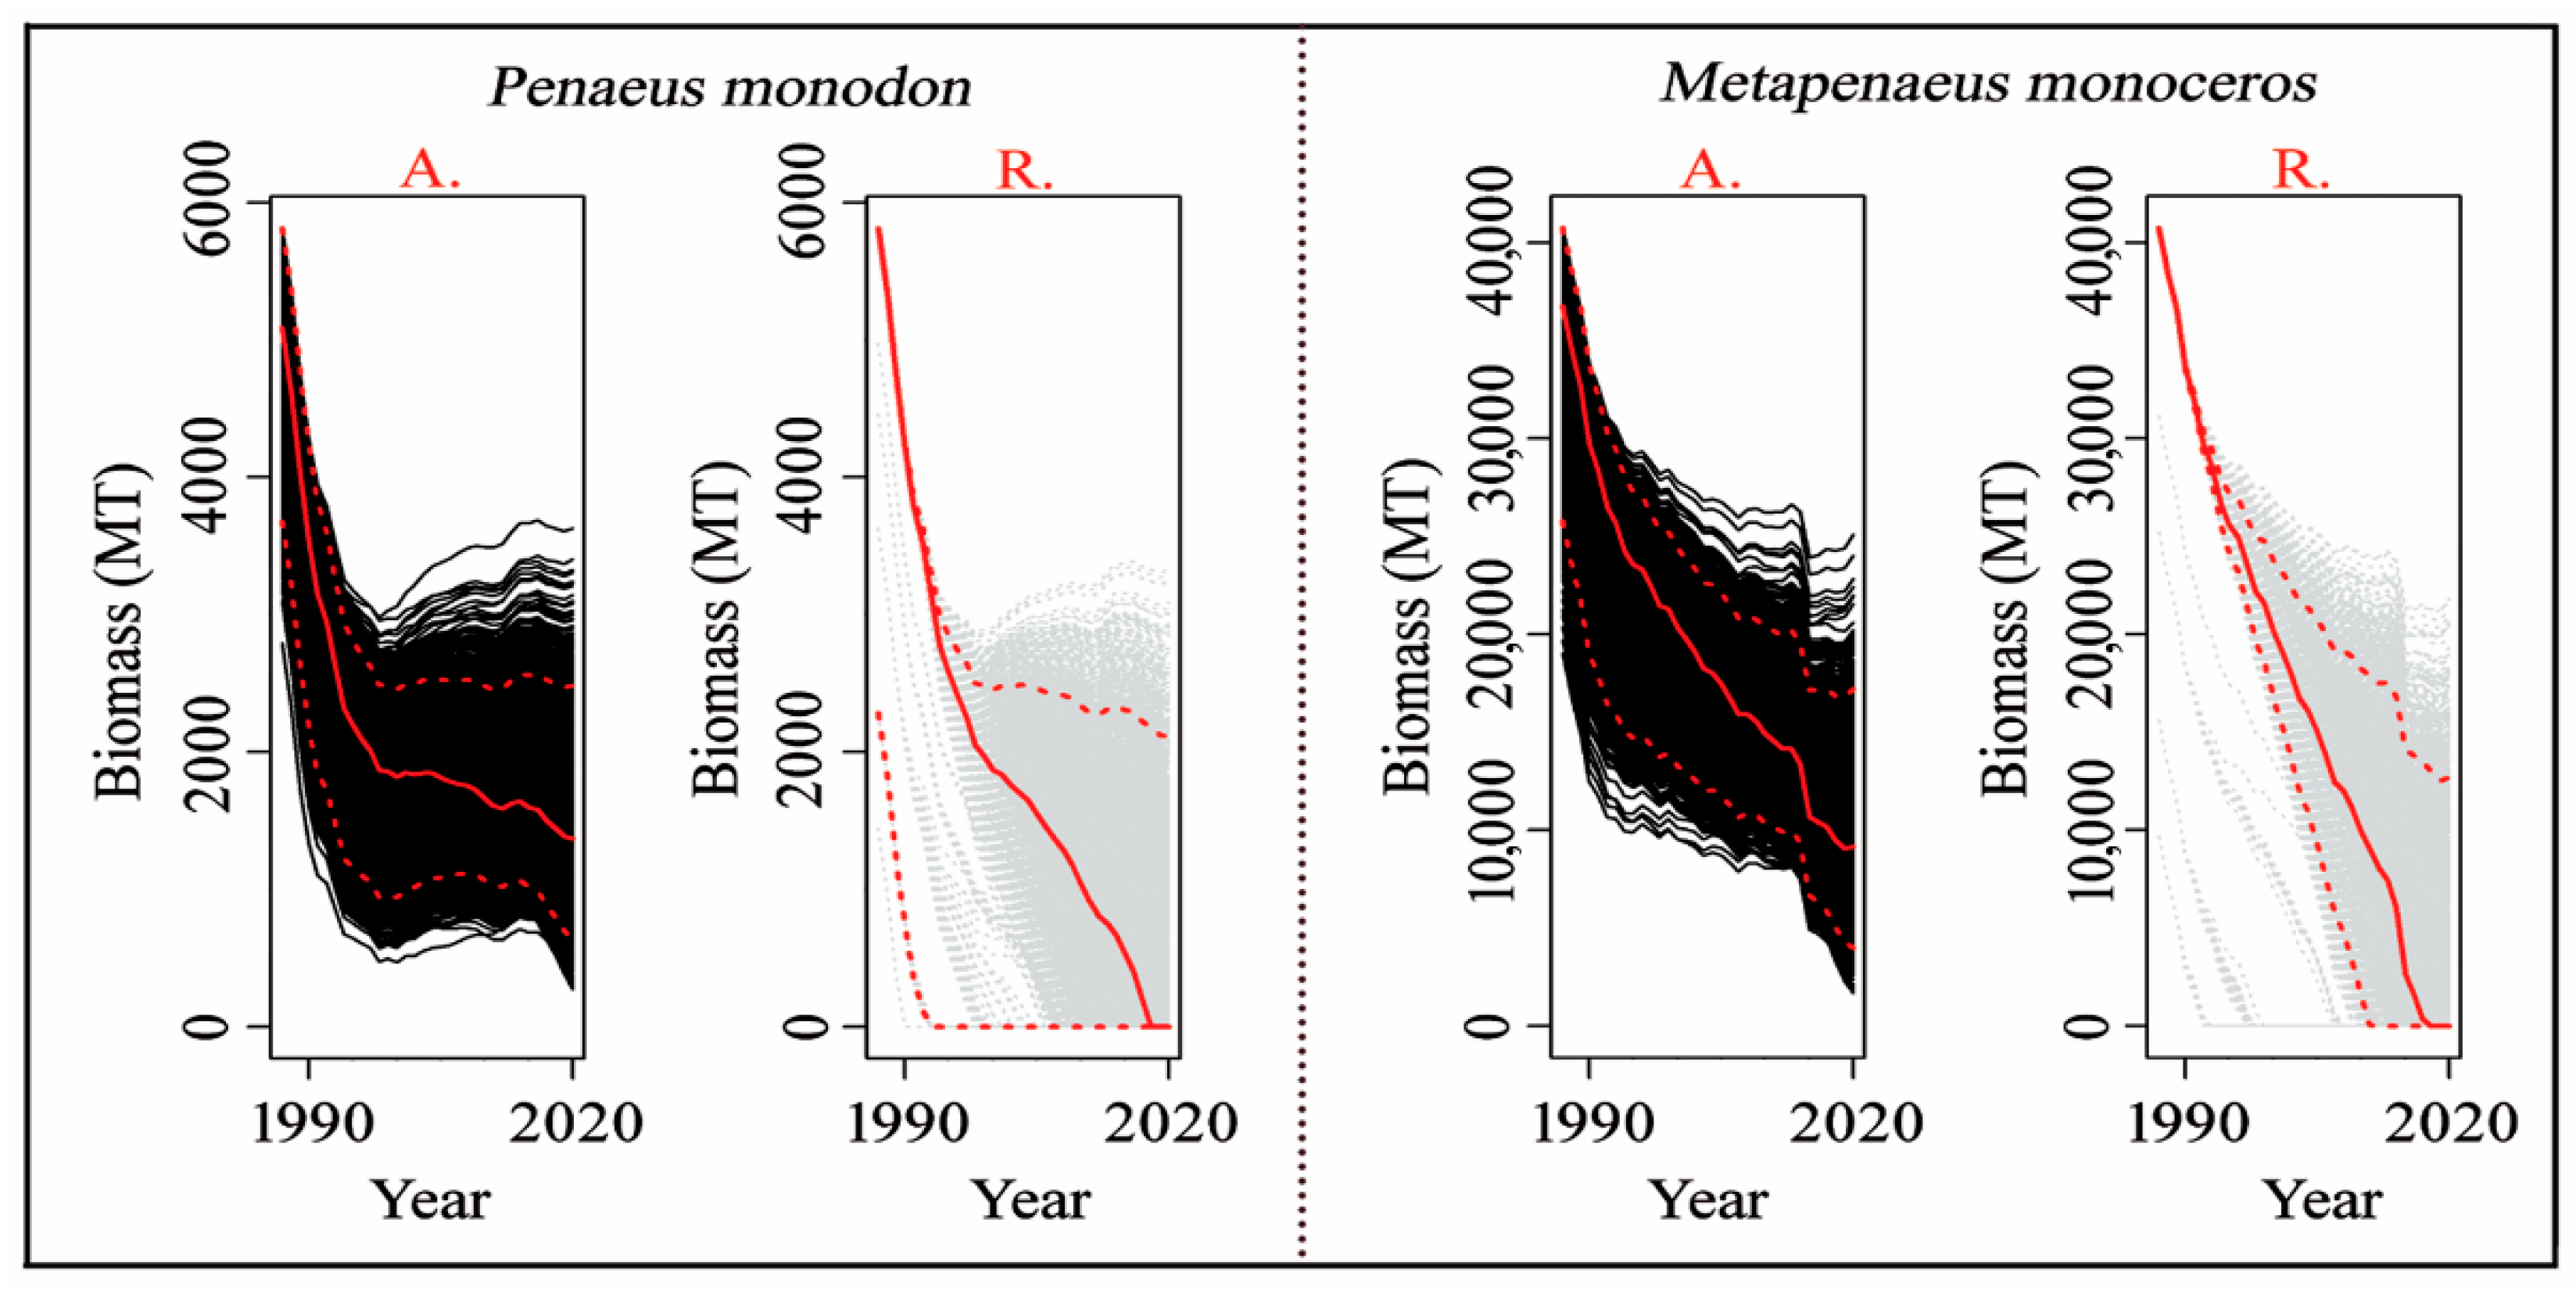
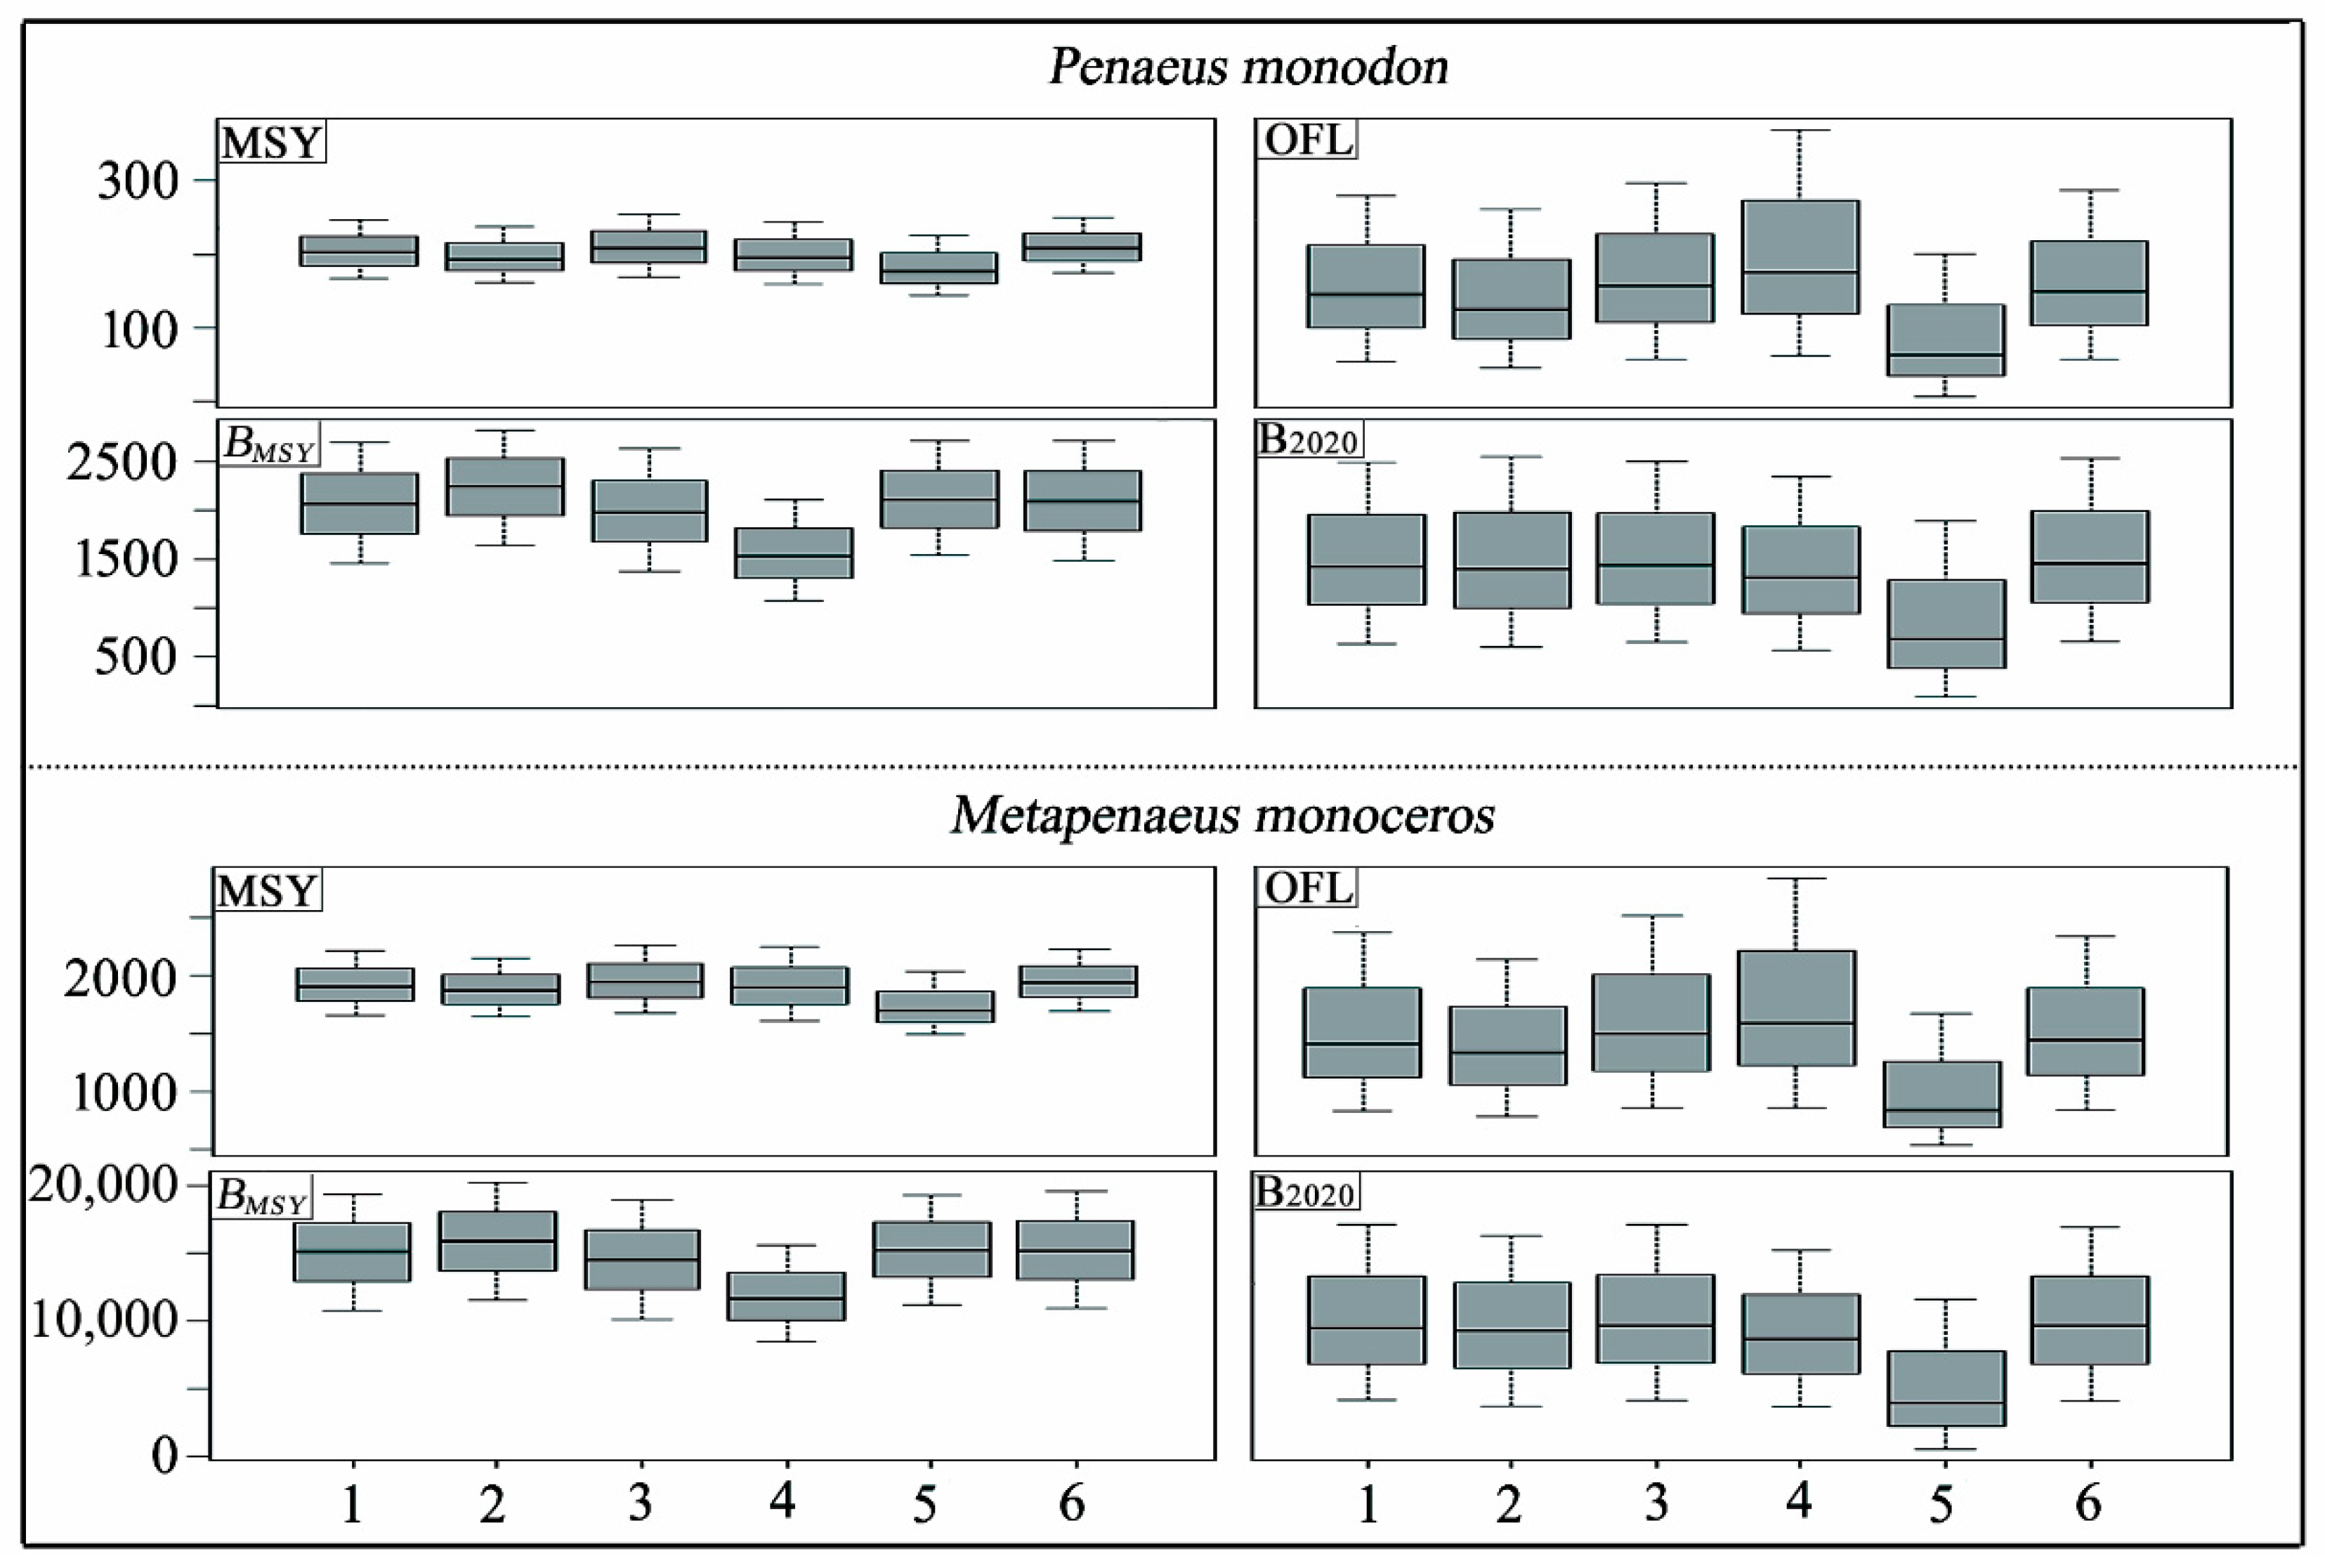
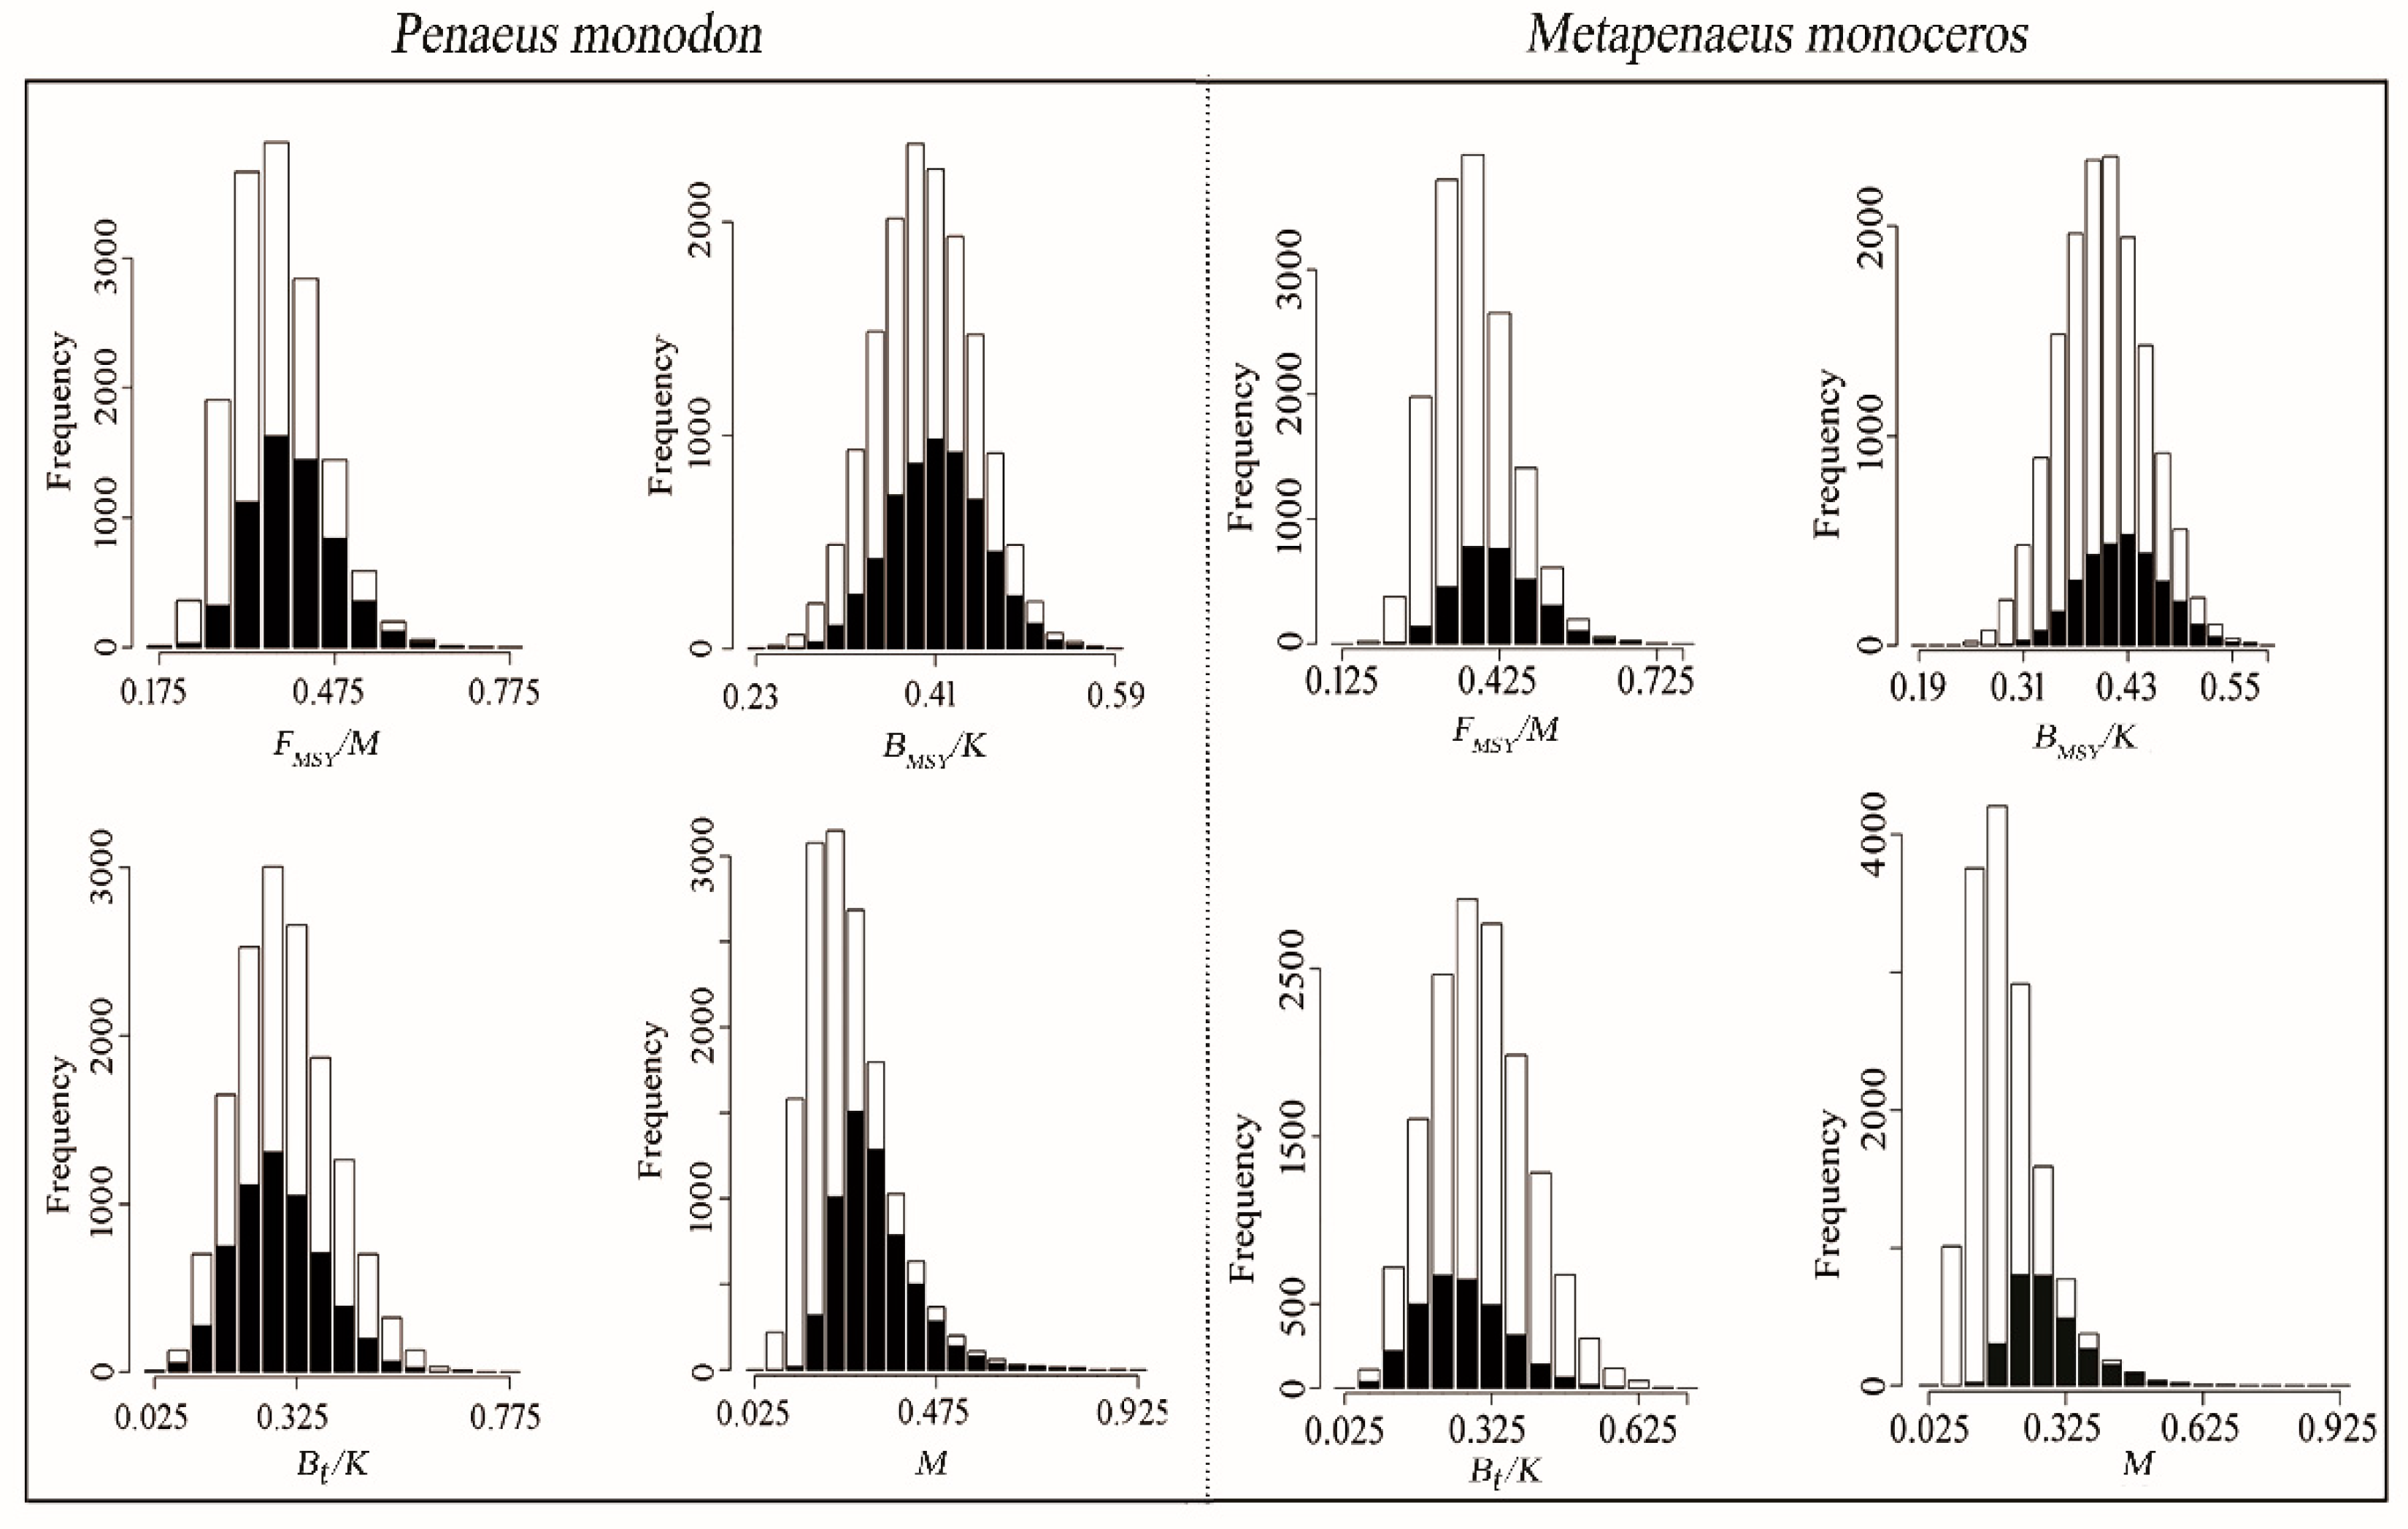
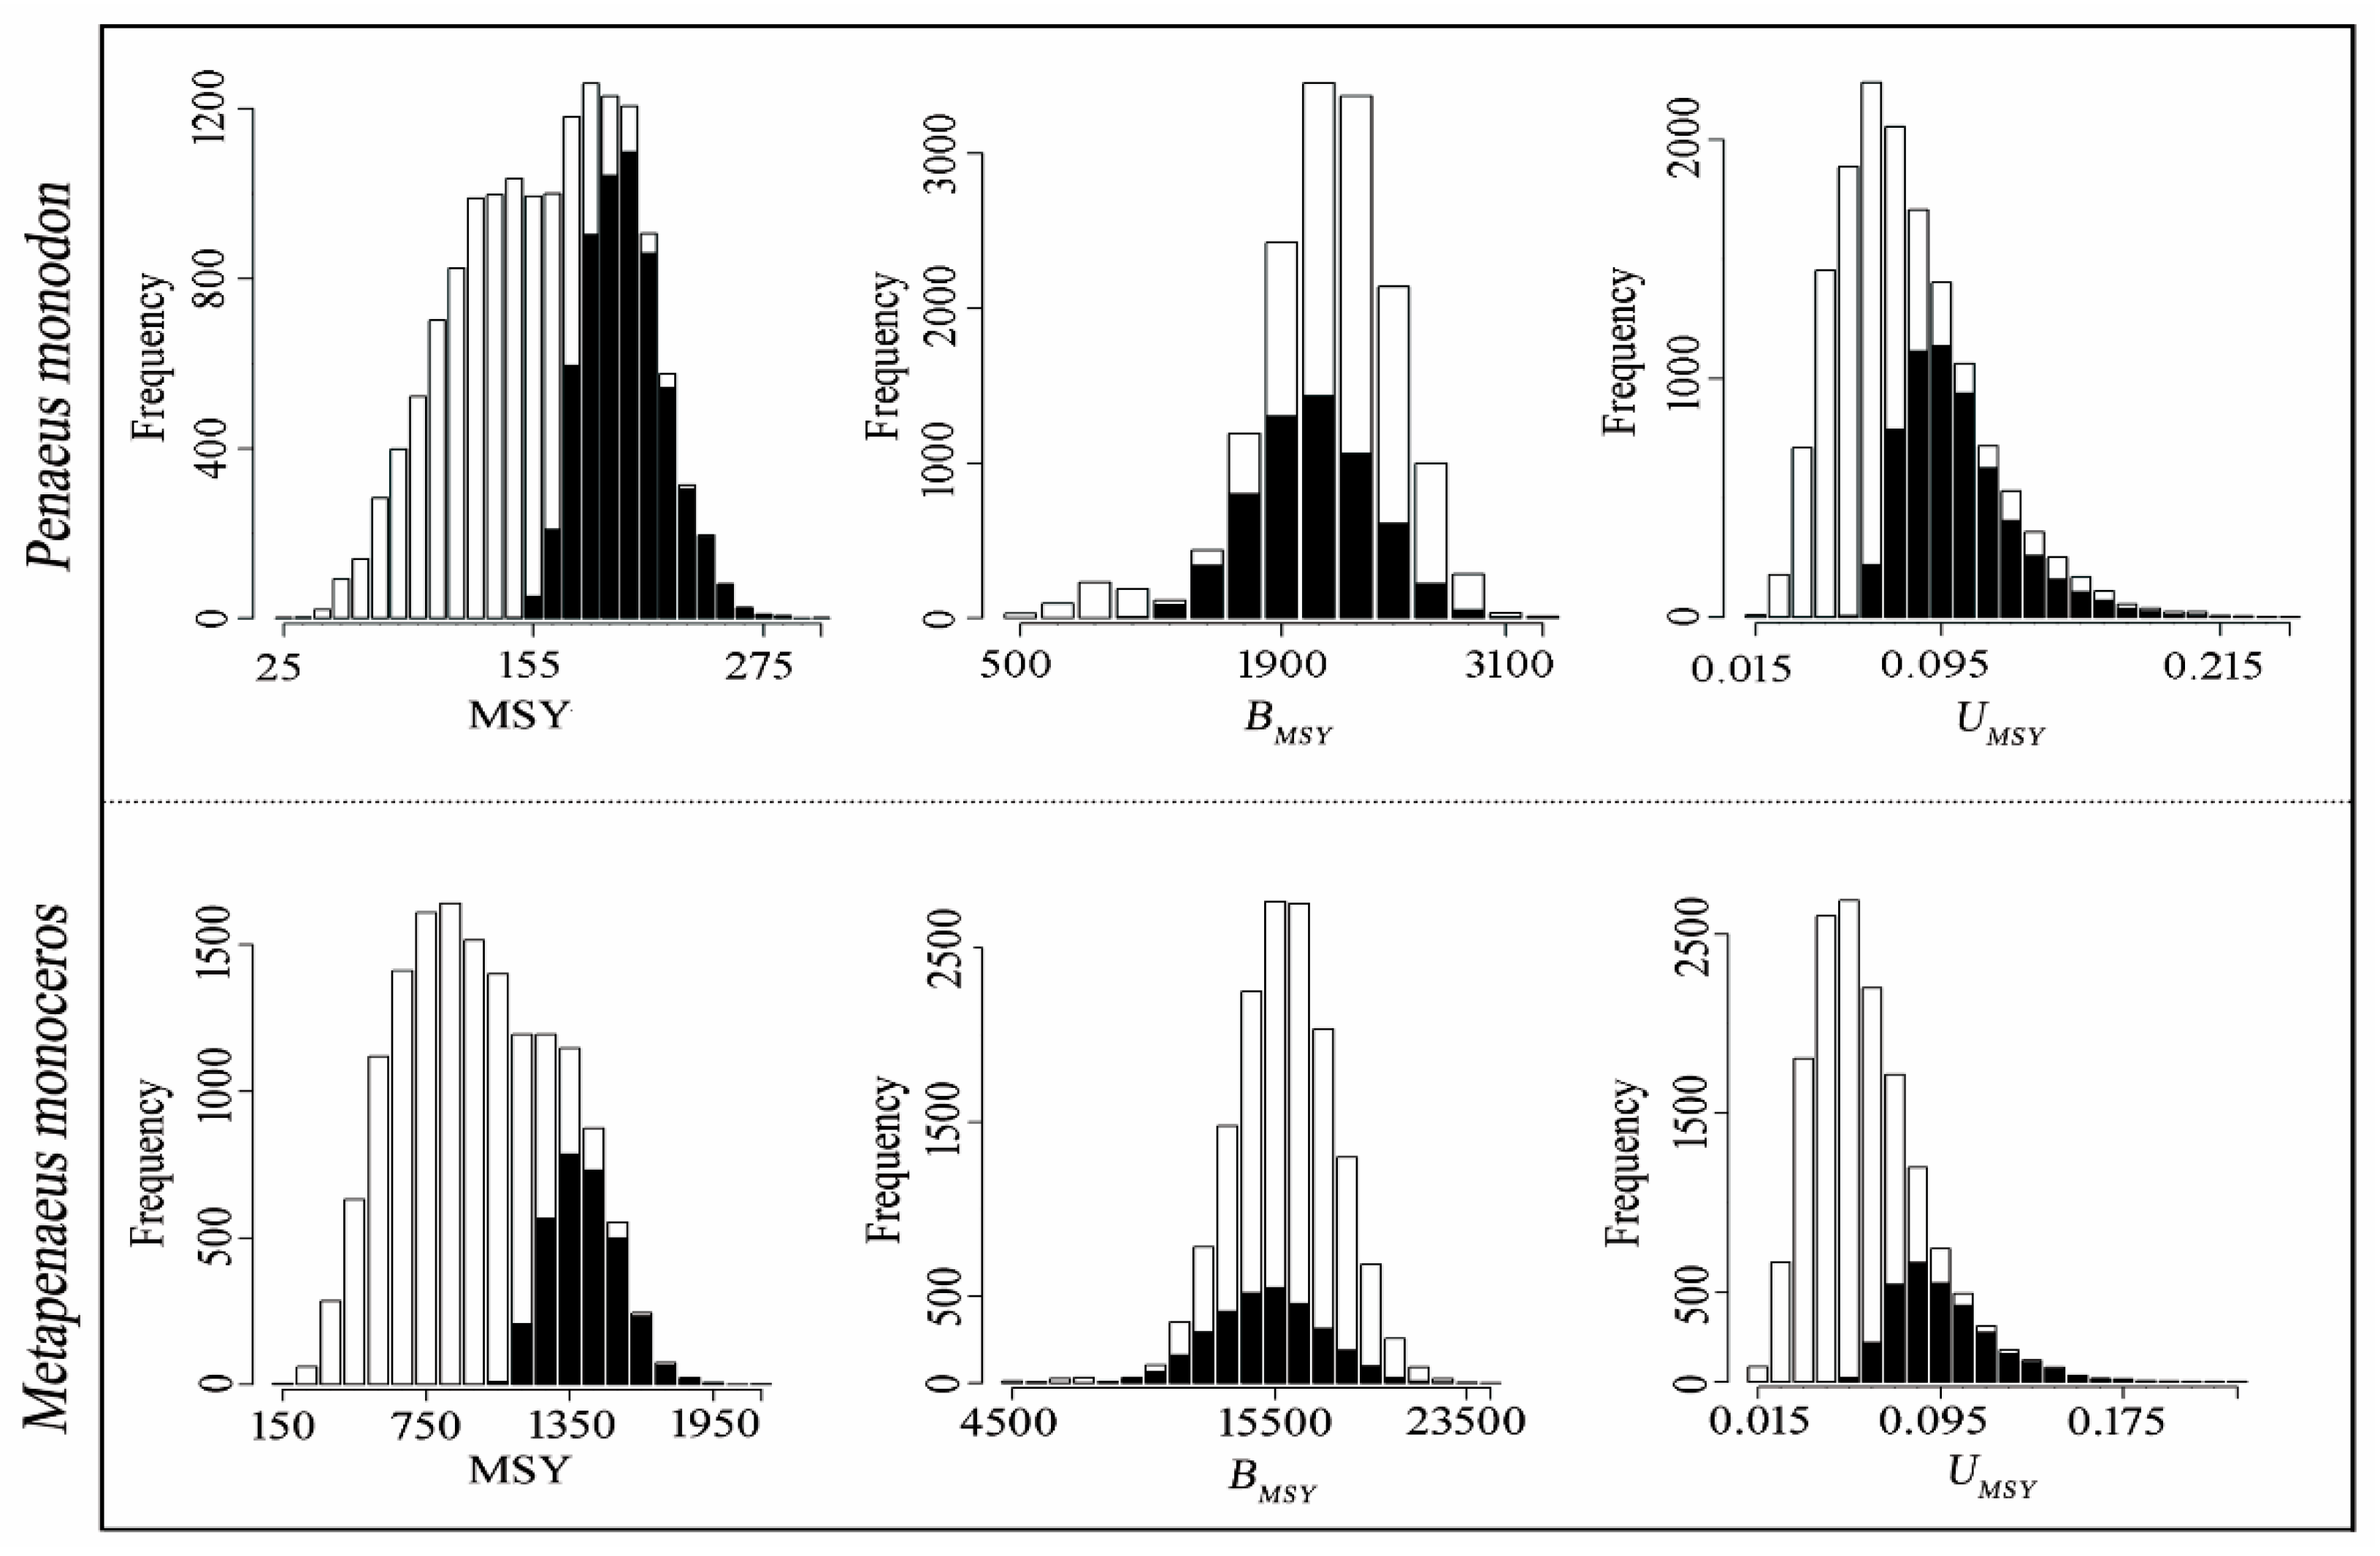
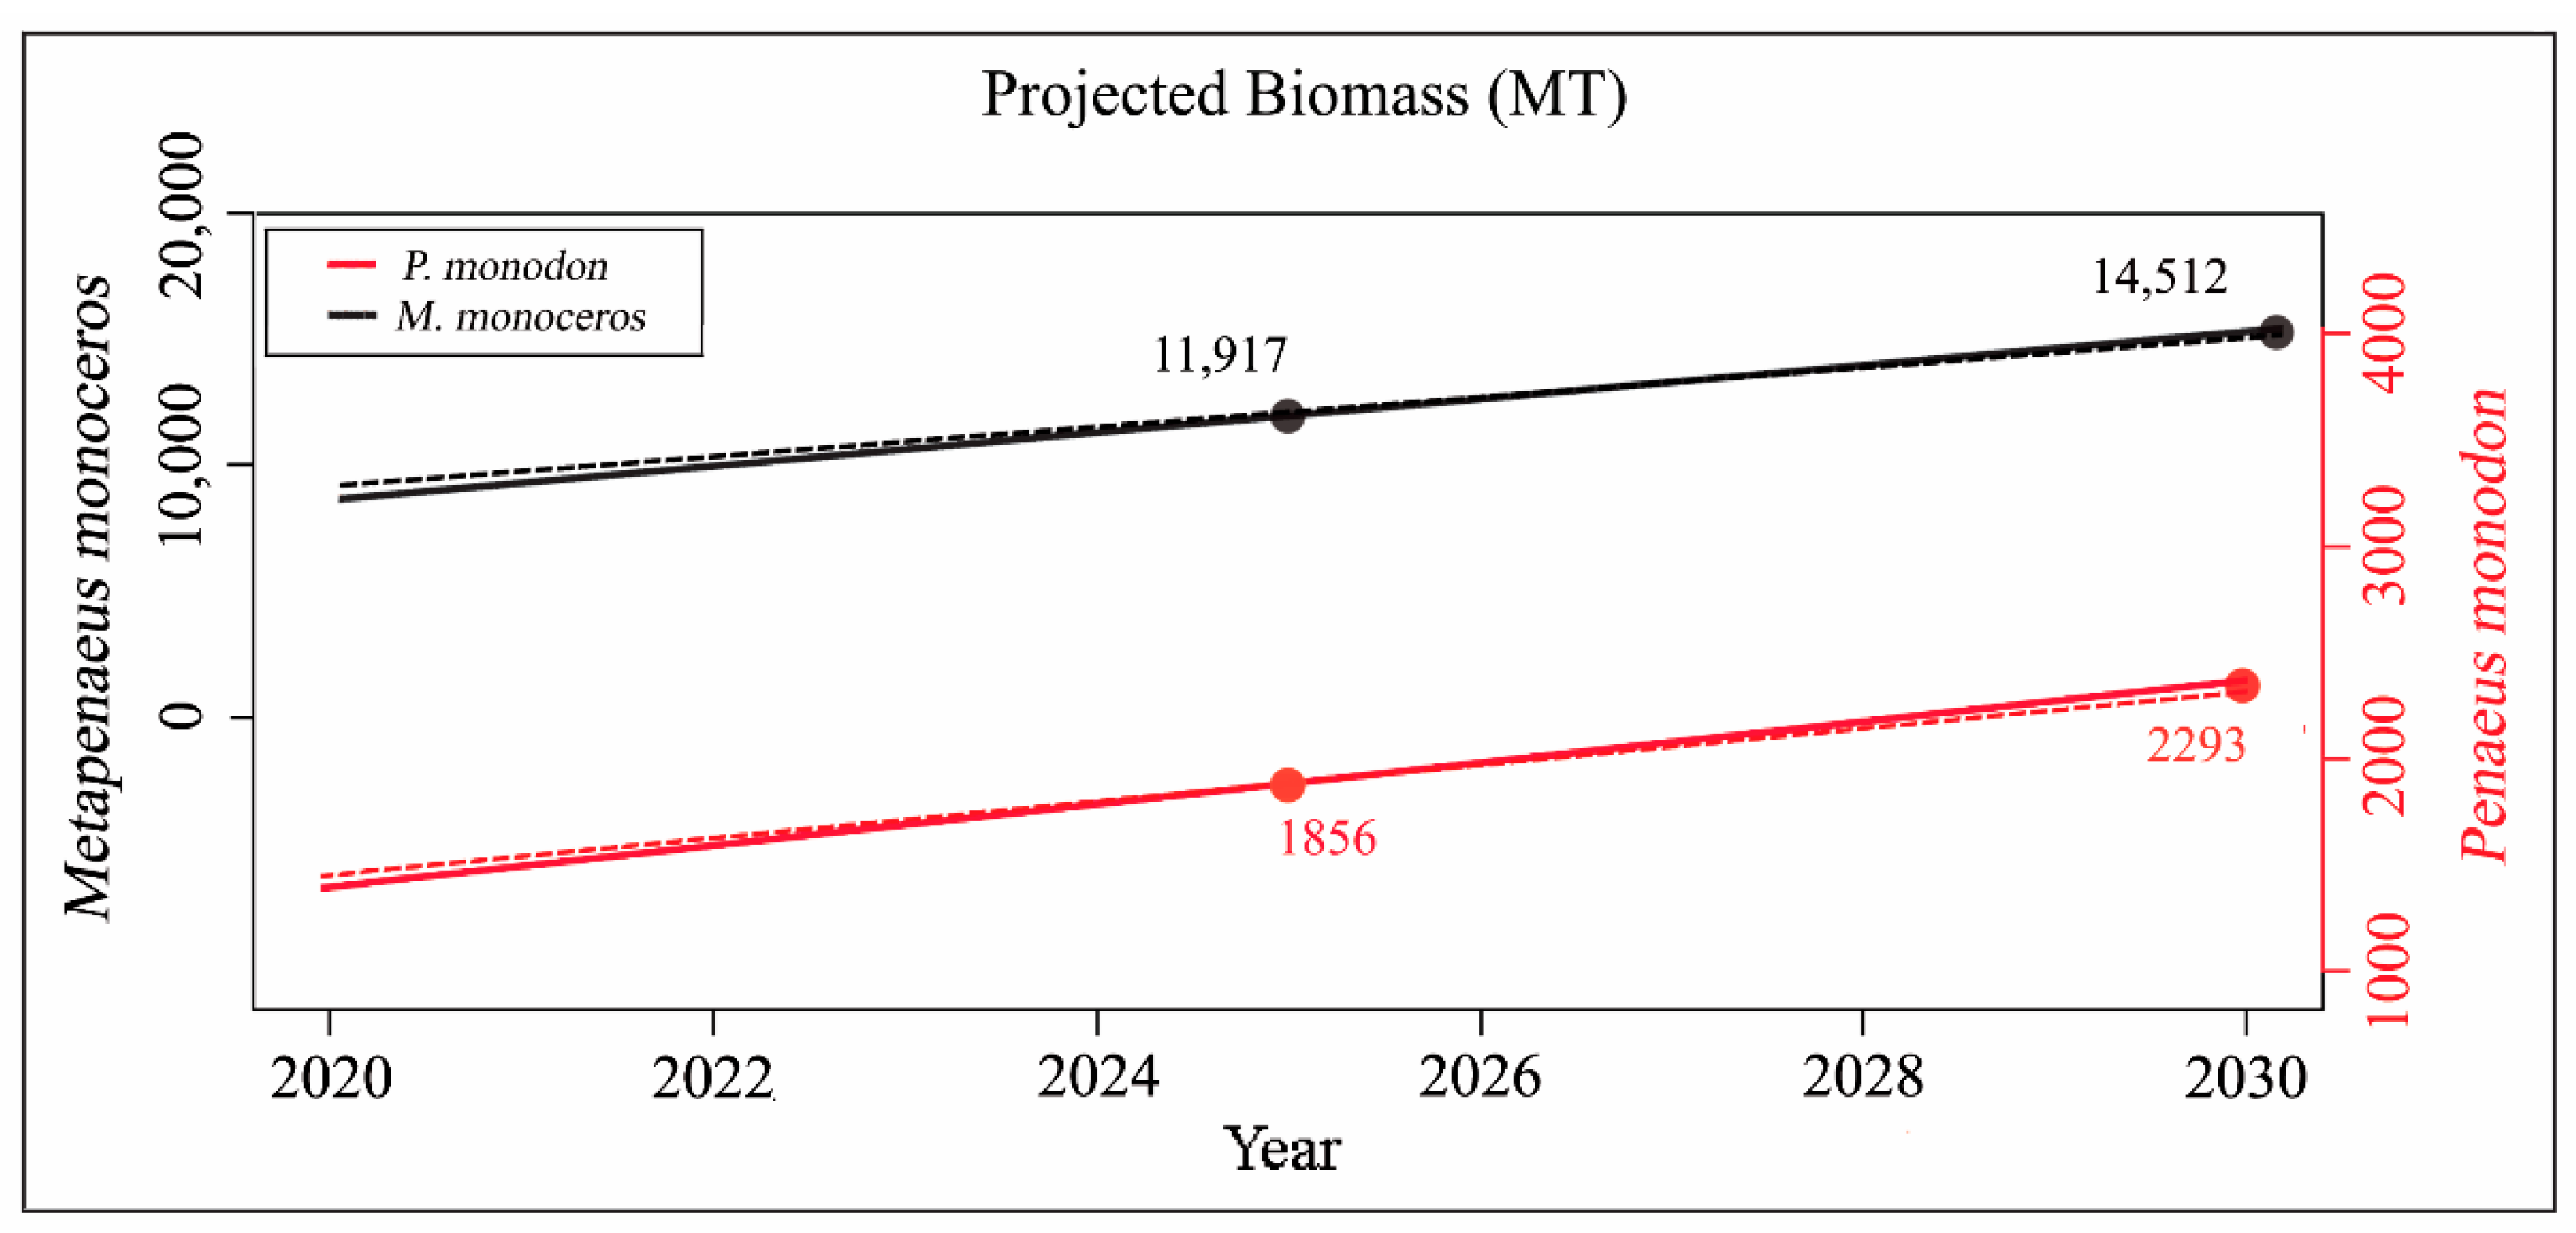
3.2. Stock Analysis Based on DB-SRA Model Results
4. Discussion
5. Conclusions
Author Contributions
Funding
Institutional Review Board Statement
Informed Consent Statement
Data Availability Statement
Acknowledgments
Conflicts of Interest
References
- FAO. Key Features of Small-Scale and Artisanal Fishing [online]. 2011. Available online: http://www.fao.org/fish-ery/topic/14753/en (accessed on 13 October 2021).
- Barman, P.P.; Karim, E.; Khatun, M.H.; Rahman, M.F.; Alam, M.S.; Liu, Q. Application of CMSY to estimate biological reference points of Bombay Duck (Harpadon neherus) from the Bay of Bengal, Bangladesh. Appl. Ecol. Environ. Res. 2020, 18, 8023–8034. [Google Scholar] [CrossRef]
- FAO. The State of World Fisheries and Aquaculture. In Food and Agriculture Organization of the United Nations; FAO: Rome, Italy, 2014; 223p. [Google Scholar]
- Pauly, D.; Zeller, D. Catch reconstructions reveal that global marine fisheries catches are higher than reported and declining. Nat. Commun. 2016, 7, 10244. [Google Scholar] [CrossRef] [PubMed]
- Watson, R.; Pauly, D. Systematic distortions in world fisheries catch trends. Nature 2001, 414, 534–536. [Google Scholar] [CrossRef] [PubMed]
- Watson, R.A.; Cheung, W.W.L.; Anticamara, J.A.; Sumaila, R.U.; Zeller, D.; Pauly, D. Global marine yield halved as fishing intensity redoubles. Fish Fish. 2013, 14, 493–503. [Google Scholar] [CrossRef]
- Froese, R.; Zeller, D.; Kleisner, K.; Pauly, D. What catch data can tell us about the status of global fisheries. Mar. Biol. 2012, 159, 1283–1292. [Google Scholar] [CrossRef]
- Ricard, D.; Minto, C.; Jensen, O.P.; Baum, J.K. Examining the knowledge base and status of commercially exploited marine species with the RAM Legacy Stock Assessment Database. Fish Fish. 2012, 13, 380–398. [Google Scholar] [CrossRef]
- Lockerbie, E.M.; Shannon, L.J.; Jarre, A. The use of ecological, fishing and environmental indicators in support of decision making in southern Benguela fisheries. Ecol. Indic. 2016, 69, 473–487. [Google Scholar] [CrossRef]
- Begg, G.A.; Friedland, K.D.; Pearce, J.B. Stock identification and its role in stock assessment and fisheries management: An overview. Fish. Res. 1999, 43, 1–8. [Google Scholar] [CrossRef]
- Benson, A.J.; Stephenson, R.L. Options for integrating ecological, economic, and social objectives in evaluation and management of fisheries. Fish Fish. 2018, 19, 40–56. [Google Scholar] [CrossRef]
- Punt, A.E. Spatial stock assessment methods: A viewpoint on current issues and assumptions. Fish. Res. 2019, 213, 132–143. [Google Scholar] [CrossRef]
- Butterworth, D.S.; Johnston, S.J.; Brandao, A. Pretesting the Likely Efficacy of Suggested Management Approaches to Data-Poor Fisheries. Mar. Coast. Fish. 2010, 2, 131–145. [Google Scholar] [CrossRef]
- Punt, A.E.; Hilborn, R. Fisheries stock assessment and decision analysis: The Bayesian approach. Rev. Fish Biol. Fish. 1997, 7, 35–63. [Google Scholar] [CrossRef] [Green Version]
- Islam, M.M.; Shamsuzzaman, M.M.; Mozumder, M.M.H.; Xiangmin, X.; Ming, Y.; Jewel, M.A.S. Exploitation and conservation of coastal and marine fisheries in Bangladesh: Do the fishery laws matter? Mar. Policy 2017, 76, 143–151. [Google Scholar] [CrossRef]
- Shamsuzzaman, M.M.; Xiangmin, X.; Islam, M.M. Legal status of Bangladesh fisheries: Issues and responses. Indian J. Geo Mar. Sci. 2016, 45, 1474–1480. [Google Scholar]
- DoF (Department of Fisheries). Marine Fisheries Survey Reports and Stock Assessment 2019 Based on R/V Meen Sandhani Surveys from 2016 to 2019; Bangladesh Marine Fisheries Capacity Building Project; Department of Fisheries, Ministry of Fisheries and Livestock: Dhaka, Bangladesh, 2019. [Google Scholar]
- Hussain, Z.; Archarya, G. (Eds.) Mangroves of the Sundarbans; IUCN: Bangkok, Thailand, 1994; Volume 2. [Google Scholar]
- Rahman, A.K.A.; Khan, M.G.; Chowdhury, Z.A.; Hussain, M.M. Economically Important Marine Fishes and Shellfishes of Bangladesh; Department of Fisheries: Dhaka, Bangladesh, 1995. [Google Scholar]
- Lamboeuf, M. Bangladesh Demersal Fish Resources of the Continental Shelf; R/V Anusandhani Trawling Survey Results (September 1984–June 1986); FAO: Rome, Italy, 1987; 26p. [Google Scholar]
- Khan, M.G.; Mustafa, M.G.; Sada, M.N.U.; Chowdhury, Z.A. Bangladesh Offshore Marine Fishery Resources Studies with Special Reference to the Penaeid Shrimp Stocks, 1988–1989; Annual Report; Marine Fisheries Survey, Management and Development Project, GOB: Chittagong, Bangladesh, 1989; 213p. [Google Scholar]
- Islam, M.S. Perspectives of the coastal and marine fisheries of the Bay of Bengal, Bangladesh. Ocean Coast. Manag. 2003, 46, 763–796. [Google Scholar] [CrossRef]
- Barua, S.; Al Mamun, M.A.; Nazrul, K.M.S.; Mamun, A.; Das, J. Maximum sustainable yield estimate for Tiger shrimp, Penaeus monodon off Bangladesh coast using trawl catch log. Bangladesh Marit. J. 2021, 4, 135–144. [Google Scholar]
- FRSS. Fisheries Resources Survey System: Fisheries Statistical Report of Bangladesh; Department of Fisheries (DoF), Ministry of Fisheries and Livestock (MoFL): Dhaka, Bangladesh, 2019; Volume 31, pp. 1–57. [Google Scholar]
- Smith, D.; Punt, A.; Dowling, N.; Smith, A.; Tuck, G. Reconciling approaches to the assessment and management of data-poor species and fisheries with Australia’s harvest strategy policy. Mar. Coast. Fish. Dyn. Manag. Ecosyst. Sci. 2009, 1, 244–254. [Google Scholar] [CrossRef] [Green Version]
- Honey, K.; Moxley, J.; Fujita, R. From rags to fishes: Data-poor methods for fishery managers. Managing data-poor fisheries: Case studies Models Simul. 2010, 1, 159–184. [Google Scholar]
- Prager, M.H. ASPIC: A Surplus-Production Model Incorporating Covariates. Coll. Vol. Sci. Pap. Int. Comm. Conserv. Atl. Tunas 1992, 28, 218–229. [Google Scholar]
- Martell, S.; Froese, R. A simple method for estimating MSY from catch and resilience. Fish Fish. 2013, 14, 504–514. [Google Scholar] [CrossRef]
- Rosenberg, A.A.; Fogarty, M.J.; Cooper, A.B.; Dickey-Collas, M.; Fulton, E.A.; Gutiérrez, N.L.; Hyde, K.J.W.; Kleisner, K.M.; Kristiansen, T.; Longo, C.; et al. Developing New Approaches to Global Stock Status Assessment and Fishery Production Potential of the Seas; FAO Fisheries and Aquaculture Circular No. 1086; FAO: Rome, Italy, 2014; 175p. [Google Scholar]
- Froese, R.; Demirel, N.; Coro, G.; Kleisner, M.K.; Winker, H. Estimating fisheries reference points from catch and resilience. Fish Fish. 2017, 18, 506–526. [Google Scholar] [CrossRef] [Green Version]
- Winker, H.; Carvalho, F.; Kapur, M. JABBA: Just Another Bayesian Biomass Assessment. Fish. Res. 2018, 204, 275–288. [Google Scholar] [CrossRef]
- Cope, J.; Punt, A.E. Length-based reference points for data-limited situations: Applications and restrictions. Mar. Coast. Fish. Dyn. Manag. Ecosyst. Sci. 2009, 1, 169–186. [Google Scholar] [CrossRef]
- Reuter, R.F.; Conners, M.E.; Discosimo, J.; Gaichas, S.; Ormseth, O.; TenBrink, T. Managing non-target, data-poor species using catch limits: Lessons from the Alaskan groundfish fishery. Fish. Manag. Ecol. 2010, 17, 323–335. [Google Scholar] [CrossRef]
- Agnew, D.J.; Gutiérrez, N.L.; Butterworth, D.S. Fish catch data: Less than what meets the eye. Mar. Policy 2013, 42, 268–269. [Google Scholar] [CrossRef]
- Branch, T.A.; Jensen, O.P.; Ricard, D.; Ye, Y.; Hilborn, R. Contrasting Global Trends in Marine Fishery Status Obtained from Catches and from Stock Assessments. Conserv. Biol. 2011, 25, 777–786. [Google Scholar] [CrossRef]
- Maunder, M.N.; Punt, A.E. Standardizing catch and effort data: A review of recent approaches. Fish. Res. 2004, 70, 141–159. [Google Scholar] [CrossRef]
- Khan, M. Optimal stock, harvest and effort level of Bangladesh trawl shrimp fishery-a nonlinear dynamic approach. J. Agric. Rural. Dev. 2007, 5, 143–149. [Google Scholar] [CrossRef]
- Khan, M.G.; Islam, M.S.; Chowdhury, Z.A.; Paul, S.C. Shrimp Resources of Bangladesh—Jour Crates of Exploitation and Its Comparative Effect on the Stock; Marine Fisheries Research Management & Development Project; DoF: Dhaka, Bangladesh, 1998; 12p. [Google Scholar]
- Ray, A.; Khan, M. Estimating some parameters of shrimp fishery in Bangladesh. Indian J. Fish. 2003, 50, 251–257. [Google Scholar]
- Amin, S.M.N.; Ara, R.; Zafar, M. Conservation of marine and coastal shrimp resources and sustainable aquaculture. Res. J. Fish. Hydrobiol. 2006, 1, 18–22. [Google Scholar]
- Uddin, M.S.; Karim, E.; Hasan, S.J.; Barua, S.; Humayun, N.M. Catch Composition for Main Marine Shrimp Species in Bangladesh. Bangladesh Res. Pub. J. 2012, 7, 91–98. [Google Scholar]
- Barua, S.; Magnuson, A.; Humayun, N.M. Assessment of offshore shrimp stocks of Bangladesh based on commercial shrimp trawl logbook data. Indian J. Fish. 2018, 65, 1–6. [Google Scholar] [CrossRef] [Green Version]
- Barua, S. Maximum sustainable yield estimate for Brown shrimp, Metapenaeus monoceros (Fabricius 1798) in marine waters of Bangladesh using trawl catch log. Indian J. Geo-Mar. Sci. 2020, 50, 258–261. [Google Scholar]
- Pacific Fisheries Management Council (PFMC). Pacific Coast Groundfish Fishery Management Plan for the California, Oregon, and Washington Groundfish Fishery; Pacific Fisheries Management Council (PFMC): Portland, OR, USA, 2011; 177p. [Google Scholar]
- Walters, C.J.; Martell, S.J.D.; Korman, J. A stochastic approach to stock reduction analysis. Can. J. Fish. Aquat. Sci. 2006, 63, 212–223. [Google Scholar] [CrossRef]
- Dick, E.J.; MacCall, A.D. Depletion-based stock reduction analysis: A catch-based method for determining sustainable yields for data-poor fish stocks. Fish. Res. 2011, 110, 331–341. [Google Scholar] [CrossRef]
- Berkson, J.; Barbieri, L.; Cadrin, S.; Cass-Calay, S.; Crone, P.; Dorn, M.; Friess, C.; Kobayash, D.; Miller, T.J.; Patrick, W.S.; et al. Calculating Acceptable Biological Catch for Stocks that Have Reliable Catch Data Only (Only Reliable Catch Stocks-ORCS); NOAA Technical Memorandum NMFS-SEFSC-616; National Oceanic and Atmospheric Administration: Washington, DC, USA, 2011; 56p. [Google Scholar]
- Arnold, L.M.; Heppell, S.S. Testing the robustness of data-poor assessment methods to uncertainty in catch and biology: A retrospective approach. ICES J. Mar. Sci. 2015, 72, 243–250. [Google Scholar] [CrossRef]
- Hoq, M.E.; Haroon, A.K.Y.; Chakraborty, S.C. Marine Fisheries of Bangladesh: Prospect and Potentilities; Support to Sustainable Management of the BOBLME Project; Bangladesh Fisheries Research Institute: Mymensingh, Bangladesh, 2013; 120p. [Google Scholar]
- Huntington, T.; Khan, M.G.; Islam, S.; van Brakel, M.; Miller, A. Towards Sustainable Coastal and Marine Fisheries in Bangladesh: Initiating a Precautionary Approach; Report submitted by the WorldFish Center-Bangladesh Office to the Ministry of Fisheries and Livestock, Government of Bangladesh; WorldFish Center-Bangladesh Office: Dhaka, Bangladesh, 2008; 86p. [Google Scholar]
- Fletcher, R.I. On the restructuring of the Pella-Tomlinson system. Fish. Bull. 1978, 76, 515–521. [Google Scholar]
- Sweka, J.A.; Neuenhoff, R.; Withers, J.; Davis, L. Application of a Depletion-Based Stock Reduction Analysis (DB-SRA) to Lake Sturgeon in Lake Erie. J. Great Lakes Res. 2018, 44, 311–318. [Google Scholar] [CrossRef]
- Nalini, C. Observations on the maturity and spawning of Metapenaeus monoceros (Fabricius) at Cochin. Indian J. Fish. 1976, 23, 23–30. [Google Scholar]
- Rao, G.S. Studies on the reproductive biology of the brown prawn Metapenaeus monoceros (Fabricius: 1798) along the Kakinada coast. Indian J. Fish. 1989, 36, 107–123. [Google Scholar]
- Rao, G.S. The Indian Tiger Prawn Penaeus Monodon Fabricius. In Marine Fisheries Research and Management; CMFRI: Kochi, India, 2000; pp. 511–524. [Google Scholar]
- Nandakumar, G. Reproductive biology of the speckled shrimp Metapenaeus monoceros (Fabricius). Indian J. Fish. 2001, 48, l–8. [Google Scholar]
- Rameshbabu, K. Fecundity variations of black tiger shrimp Penaeus monodon from two different geographical locations, east coast of Andhra Pradesh. India. J. Glob. Biosci. 2014, 3, 725–730. [Google Scholar]
- Sk Uddin, N.; Ghosh, S.; Maity, J. Reproductive biology, maturation size and sex ratio of black tiger shrimp (Penaeus monodon Fabricus, 1798) from fishing grounds of Digha coast, West Bengal. India. Indian J. Aqua. Res. 2015, 2, 372–378. [Google Scholar]
- Froese, R.; Binohlan, C. Empirical relationship to estimate asymptotic length, length at first maturity and length at maximum yield per recruit in fishes, with a simple method to evaluate length-frequency data. J. Fish Biol. 2000, 56, 758–773. [Google Scholar] [CrossRef]
- von Bertalanffy, L. A quantitative theory of organic growth (inquiries on growth laws. II.). Hum. Biol. 1938, 10, 181–213. [Google Scholar]
- Mustafa, M.G.; Ali, S.; Azadi, M.A. Some aspect of population dynamics of three penaeid shrimp (P.monodon, P.semisulcatus and M.monoceros) from the Bay of Bengal, Bangladesh. Chittagong Univ. J. Sci. 2006, 30, 97–102. [Google Scholar]
- McCann, J.A.; Arkin, L.N.; Williams, J.D. Nonindigenous Aquatic and Selected Terrestrial Species of Florida; University of Florida, Center for Aquatic Plants: Gainesville, FL, USA, 1996. [Google Scholar]
- Dineshbabu, A.P. Length-weight relationship and growth of the speckled shrimp, Metapenaeus monoceros (Fabricius) off Saurashtra. J. Mar. Biol. Assoc. India 2006, 48, 180–184. [Google Scholar]
- Hoenig, J.M. Empirical use of longevity data to estimate mortality rates. Fish. Bull. 1983, 82, 898–903. [Google Scholar]
- Manasirli, M.; Kiyaga, V.B.; Perker, M. Reproduction, growth, mortality and exploitation rate of Penaeus semisulcatus De Haan, 1844 (Decapoda, Penaeidae) from iskenderun bay (northeastern mediterranean). Crustaceana 2014, 87, 385–400. [Google Scholar] [CrossRef]
- Walters, C.; Martel, S. Fisheries Ecology and Management; Princeton University Press: Princeton, NJ, USA, 2004; 399p. [Google Scholar]
- R Core Team. A Language and Environment for Statistical Computing; R Foundation for Statistical Computing: Vienna, Austria, 2016. [Google Scholar]
- Nelson, G.A. Fisheries Methods and Models in R. Version: 1.4-0. 2013. Available online: http://www2.uaem.mx/r-mirror/web/packages/fishmethods/fishmethods.pdf (accessed on 12 May 2021).
- Alam, M.S.; Liu, Q.; Nabi, M.; Al-Mamun, M. Fish Stock Assessment for Data-Poor Fisheries, with a Case Study of Tropical Hilsa Shad (Tenualosa ilisha) in the Water of Bangladesh. Sustainability 2021, 13, 3604. [Google Scholar] [CrossRef]
- Alam, M.S.; Hossain, M.S.; Monwar, M.M.; Hoque, M.E. Assessment of fish distribution and biodiversity status in Upper Halda River, Chittagong, Bangladesh. Int. J. Biodivers. Conserv. 2013, 5, 349–357. [Google Scholar]
- Alam, M.W.; Xiangmin, X. Marine Pollution Prevention in Bangladesh: A Way Forward for Implement Comprehensive National Legal Framework. Thalassas 2019, 35, 17–27. [Google Scholar] [CrossRef]
- Wetzel, C.R.; Punt, A.E. Model performance for the determination of appropriate harvest levels in the case of data-poor stocks. Fish. Res. 2011, 110, 342–355. [Google Scholar] [CrossRef]
- Froese, R.; Pauly, D. (Eds.) FishBase 2000: Concepts, Design, and Data Sources; WorldFish: Penang, Malaysia, 2000; 344p. [Google Scholar]


| Parameters | Base Model Distribution | Sensitivity Perturbation |
|---|---|---|
| Initial K | Ten times of maximum catch. | ------ |
| Age at maturity | One year. | ------ |
| M | Lognormal, low = 0.001, up = 3, mean = 1.43 for Penaeus monodon and 1.71 for Metapenaeus monoceros, sd = 0.4. | Increase to 2. |
| B1/K | None, low = 0.01, up = 1, mean = 1, sd = 0.1). | Decrease to 0.80. |
| Bt/K | Beta, low = 0.01, up = 0.99, mean = 0.3, sd = 0.1, refyr = max(final year of time-series) + 1). | Decrease to 0.2. |
| FMSY/M | Lognormal, low = 0.1, up = 2, mean = 1, sd = 0.2. | Decrease to 0.80. |
| BMSY/K | Beta, low = 0.05, up = 0.95, mean = 0.4, sd = 0.05. | Decrease to 0.25. |
| Parameters | P. monodon | M. monoceros | ||||
|---|---|---|---|---|---|---|
| Mean | LCI(2.5%) | UCI (97.5%) | Mean | LCI (2.5%) | UCI (97.5%) | |
| MSY | 203 | 166 | 250 | 1408 | 1155 | 1715 |
| BMSY | 2062 | 1451 | 2694 | 15,140 | 10,795 | 19,320 |
| FMSY | 0.13 | 0.08 | 0.23 | 0.12 | 0.07 | 0.20 |
| UMSY | 0.10 | 0.07 | 0.16 | 0.10 | 0.06 | 0.15 |
| OFL | 146 | 53 | 279 | 912 | 334 | 1871 |
| B2020 | 1429 | 626 | 2458 | 9470 | 4200 | 17,097 |
| K | 5015 | 3635 | 5808 | 35,871 | 26,192 | 40,750 |
| Species Name | K | MSY | BMSY | B2020 * | FMSY | Reference |
|---|---|---|---|---|---|---|
| Penaeus monodon | 4720 (3350–6650) | 527 (388–717) | 2360 (1670–3320) | 1250 (885–1550) | 0.22 (0.16–0.31 | [23] |
| 5015 (3635–5808) | 203 (166–250) | 2062 (1451–2694) | 1429 (626–2458) | 0.13 (0.08–0.23) | Present | |
| Metapenaeus monoceros | 10,000 (8380–12,200) | 3090 (2920–3260) | 5060 (4990–6110) | 5960 (4760–6830) | 0.61 (0.51–0.73) | [43] |
| 35871 (26,192–40,750) | 1408 (1155–1715) | 15140 (10,795–19,320) | 9470 (4200–17,097) | 0.12 (0.07–0.20) | Present |
Publisher’s Note: MDPI stays neutral with regard to jurisdictional claims in published maps and institutional affiliations. |
© 2022 by the authors. Licensee MDPI, Basel, Switzerland. This article is an open access article distributed under the terms and conditions of the Creative Commons Attribution (CC BY) license (https://creativecommons.org/licenses/by/4.0/).
Share and Cite
Alam, M.S.; Liu, Q.; Schneider, P.; Mozumder, M.M.H.; Uddin, M.M.; Monwar, M.M.; Hoque, M.E.; Barua, S. Stock Assessment and Rebuilding of Two Major Shrimp Fisheries (Penaeus monodon and Metapenaeus monoceros) from the Industrial Fishing Zone of Bangladesh. J. Mar. Sci. Eng. 2022, 10, 201. https://doi.org/10.3390/jmse10020201
Alam MS, Liu Q, Schneider P, Mozumder MMH, Uddin MM, Monwar MM, Hoque ME, Barua S. Stock Assessment and Rebuilding of Two Major Shrimp Fisheries (Penaeus monodon and Metapenaeus monoceros) from the Industrial Fishing Zone of Bangladesh. Journal of Marine Science and Engineering. 2022; 10(2):201. https://doi.org/10.3390/jmse10020201
Chicago/Turabian StyleAlam, Mohammed Shahidul, Qun Liu, Petra Schneider, Mohammad Mojibul Hoque Mozumder, Mohammad Muslem Uddin, Md. Mostafa Monwar, Md. Enamul Hoque, and Suman Barua. 2022. "Stock Assessment and Rebuilding of Two Major Shrimp Fisheries (Penaeus monodon and Metapenaeus monoceros) from the Industrial Fishing Zone of Bangladesh" Journal of Marine Science and Engineering 10, no. 2: 201. https://doi.org/10.3390/jmse10020201
APA StyleAlam, M. S., Liu, Q., Schneider, P., Mozumder, M. M. H., Uddin, M. M., Monwar, M. M., Hoque, M. E., & Barua, S. (2022). Stock Assessment and Rebuilding of Two Major Shrimp Fisheries (Penaeus monodon and Metapenaeus monoceros) from the Industrial Fishing Zone of Bangladesh. Journal of Marine Science and Engineering, 10(2), 201. https://doi.org/10.3390/jmse10020201