Article

Comparison of Velocity Obstacle and Artificial Potential Field Methods for Collision Avoidance in Swarm Operation of Unmanned Surface Vehicles

1
Autonomous Ship Verification & Evaluation Research Center, Korea Research Institute of Ships and Ocean Engineering (KRISO), Ulsan 44055, Republic of Korea
2
Maneuvering Control Research Team, Avikus, Seoul 06234, Republic of Korea
3
Department of Marine Design Convergence Engineering, Pukyong National University, Busan 48513, Republic of Korea
4
Department of Naval Architecture and Marine System Engineering, Pukyong National University, Busan 48513, Republic of Korea
*
Author to whom correspondence should be addressed.
J. Mar. Sci. Eng. 2022, 10(12), 2036; https://doi.org/10.3390/jmse10122036
Submission received: 6 November 2022 / Revised: 5 December 2022 / Accepted: 12 December 2022 / Published: 19 December 2022
(This article belongs to the Special Issue Control and Stability of Ship Motions)

Abstract

:
As the research concerning unmanned surface vehicles (USVs) intensifies, research on swarm operations is also being actively conducted. A swarm operation imitates the appearance of nature, such as ants, bees, and birds, in forming swarms, moving, and attacking in the search for food. However, several problems are encountered in the USV swarm operation. One of these is the problem of collisions between USVs. A conflict between agents in a swarm can lead to operational failure and property loss. This study attempted to solve this problem. In this study, a virtual matrix approach was applied as a swarm operation. Velocity obstacle (VO) and artificial potential field (APF) methods were used and compared as algorithms for collision avoidance for USVs in a swarm when the formation is changed. For effective collision avoidance, evasive maneuvers should be performed at an appropriate time and location. Therefore, a closest point of approach (CPA)-based method, which considers both temporal and spatial factors, was used. The swarm operation was verified through a large-scale simulation in which 30 USVs changed their formation seven times in 3400 s. When comparing the averages of the distance, error to waypoint, and battery usage, no significant differences were noticed between the VO and APF methods. However, when comparing the cumulative time using the minimum distance, VO was demonstrably safer than APF, and VO completed the formation faster. In conclusion, both the APF and VO methods can evidently perform swarm operations without collisions.

1. Introduction

Recently, the wave of the fourth industrial revolution has reached most fields. The core of this revolution is unmanned technology, which replaces the systems operated by humans with intelligent robots. The shipbuilding and marine industries are also influenced by unmanned technology. Moreover, many studies concerning unmanned surface vehicles (USVs) have been conducted, and USVs are being actively introduced in commercial and military fields. As USV research intensifies, swarm research is also being actively conducted. Swarm technology mimics the appearance of swarms in nature; for instance, bees and birds forming their respective colonies to accomplish common goals, such as searching for food, moving, and attacking. If swarm USVs are introduced, 24 h monitoring and reconnaissance are possible, even in the cases of marine and distress accidents; therefore, the golden hour of lifesaving can be promptly utilized. Moreover, this technology makes rescue from adverse and dangerous weather conditions possible. However, several problems may arise in USV swarm control. One of these is the problem of collisions between objects within a group. Formation changes within a swarm create the risk of collision between objects; moreover, property loss, environmental pollution, and swarm mission failure may occur if an entity collides with another. Therefore, collision-avoidance algorithms must be studied to realize swarm operation.
For swarm operations, the leader–follower [1,2], virtual structure [3,4], and behavior-based methods [5,6,7] are prominent formation control methods. The leader–follower method uses one entity or more from the entire formation as a leader and the rest as followers [8,9]. Fahimi proposed sliding mode control laws to control multiple USVs in arbitrary formations [10]. The virtual structure approach involves forcing a particle to behave like a particle embedded in a rigid structure to maintain its geometrical configuration [11]. Beard et al. [12,13] and Askari et al. [14] studied an algorithm based on feedback to increase the accuracy of formation. Carpenter generated the same results as centralized controllers by processing only local measurement information, while simultaneously tracking the planned trajectory, when faced with uncertainty and nonlinear perturbations through decentralized control [15]. Kim et al. introduced the virtual matrix approach, combining the advantages of the leader–follower and virtual structure approaches, and proposed a new guidance technique, the isosceles triangle (ISOT), to minimize inefficient movements during swarm operation [16].
In a study related to collision avoidance in a USV, a collision avoidance system was proposed using the collision-risk-based A* algorithm by Lee and Rhee [17]. Kijima and Furukawa introduced the concept of the ship domain and proposed a method for evaluating collision risk and changing avoidance direction [18]. Larson et al. conducted a study on a path-generation method using the A* algorithm [19]. Xie et al. performed collision avoidance by using the potential field method, which is frequently used in mobile robot systems [20]. Kuwata et al. presented a collision-avoidance algorithm using the velocity obstacle method [21]. Moreover, Woo et al., as well as Woo and Kim, conducted studies on USV collision avoidance using deep reinforcement learning [22,23].
For effective collision avoidance, the start and end of collision avoidance maneuvers must be determined. The studies that infer the collision avoidance point implement methods using either the closest point of approach (CPA) or the ship domain. The CPA method was first proposed by Iwasaki and Hara [24], and collision risk was inferred using the spatial distance of the closest point of approach (DCPA) and temporal time of the closest point of approach (TCPA) elements. Another study calculated collision risk by applying the DCPA and TCPA to fuzzy theory [17,25]. Park and Kim obtained instantaneous collision probability using semi-analytical methods and integrated it to quantitatively evaluate collision probability and predict collision risk [26]. Fujii and Tanaka, as well as Goodwin, proposed the ship domain approach [27,28]. The ship domain is a concept that creates a virtual safe area based on a ship and avoids collisions when a target ship invades said safe area. Subsequently, studies were conducted considering various parameters, such as the length, width, angle of encounter, and relative velocity, of the ship [18,29,30,31,32,33].
In a study combining swarm operation and collision avoidance, Yan et al. proposed an algorithm to avoid obstacles while maintaining formation by combining the virtual structure method and potential field [34]. Sun et al. applied the leader–follower method as a swarm operation and showed that obstacles can be avoided in a complex marine environment using a formation collision avoidance system based on finite control set model predictive control [35].
In this study, the previously studied virtual matrix approach was applied as a swarm operation, and algorithms are proposed and compared for collision avoidance for USVs in a swarm. The artificial potential field (APF) and velocity obstacle (VO) methods, which are widely used in the mobile robot field, were used for collision avoidance in the swarm. These two algorithms were chosen because they are guaranteed to work universally and are not limited to a specific system. When a formation is created, it is often left–right symmetrical. At this time, a problem arises when a general APF is used. This study proposes a biased artificial potential field (B-APF) that induces asymmetry by generating a biased potential to solve problems that may occur due to left–right symmetry when APF is used. In addition, a method using the CPA, which can consider both temporal and spatial factors, was applied for efficient collision avoidance timing inference. Swarm simulation on a virtual map was undertaken to verify the collision avoidance between USVs when changing formations. Collision avoidance in the swarm operation of USVs was verified through large-scale simulations of 30 USVs changing their formation seven times in 3400 s. The safety of VO and APF was compared, considering the averages of the distance, waypoint error, and battery usage; the cumulative time using the minimum distance; and the time taken to complete the formation. In conclusion, it is shown that the two proposed collision-avoidance algorithms can be used in swarm operations and can avoid collisions between USVs when changing formation.
The remainder of this paper is organized as follows. In Section 2, the USV dynamics model, guidance and control, and swarm operation method are presented. In Section 3, the theoretical backgrounds of the two collision-avoidance algorithms and the collision risk index (CRI) are presented. In Section 4, the results and analysis of the proposed method from the swarm operation simulation are discussed. Finally, in Section 5, the main conclusions and possible follow-up studies are presented. In addition, Appendix A shows the validation of the two collision-avoidance algorithms.

2. Basic Algorithm

2.1. USV Dynamic Model

The USV dynamics implemented in this study were described by Woo et al., (2018) [36] and are referred to as the wave adaptive modular vessel (WAM-V) dynamics. The length of the WAM-V was 4.88 m (16 ft), the beam length was 2.44 m (8 ft), and two suspensions were set between the supporting arches and pontoons, which can disperse the motion of waves. The WAM-V dynamic system was obtained by using a linear steering model based on a static input experiment and measuring the steady-state response values for each input obtained through the experiment.

2.2. Guidance and Control

In this study, the line-of-sight (LOS) method was used as the guidance for USVs, which is expressed as:
ψ d = tan 1 ( y W P y s ) x W P x s
Here, the subscript W P means the waypoint coordinates and s means the position of the USV.
Proportional–integral–derivative (PID) control was used to control the heading and velocity of USVs. Equation (2) mathematically defines e ψ , which represents the error in the heading control, and Equation (3) is the heading PID control equation. The error in the velocity control was calculated as follows. In the APF method, the difference in the distance from the target point is the error, and for the VO method, the difference between the target total velocity V d and current total velocity V was set as the error, as expressed in Equation (4). Equation (5) represents the PID control equation for velocity control.
e ψ = ψ d ψ
δ n ψ = k p , ψ e ψ + k i , ψ e ψ d t + k d , ψ e ˙ ψ
e V = x W P x s 2 + y W P y s 2 ,   f o r   A P F   m e t h o d V d V ,                                         f o r   V O   m e t h o d
δ n V = k p , V e V + k i , V e V d t + k d , V e ˙ V
k p , ψ , k i , ψ , and k d , ψ are the P, I, and D control gains of the heading PID control, respectively. Similarly, k p , V , k i , V , and k d , V are the control gains of the velocity PID control, respectively. Note that each control gain is determined through trial and error.

2.3. Virtual Matrix Approach

In this study, the virtual matrix approach of Kim et al., (2021) was used for the swarm operation. The leader ship in the virtual matrix approach is a virtual ship, and agents are ships in the swarm positioned around the virtual leader ship. The same dynamic model is applied to both the virtual leader ship and agents. A virtual matrix of size n × m is created around the virtual leader ship. After deciding the virtual matrix and leader ship, each agent is allocated a cell number located on the virtual matrix according to the formation. This cell number indicates the goal position and waypoint for each agent. An example of the virtual matrix approach is shown in Figure 1, in which a 5 × 5 virtual matrix, blue virtual leader ship, and five agents form a wedge formation.
The size, row distance drow, and column distance dcol of the virtual matrix can be changed. When the virtual leader vessel follows the global waypoint with the attached virtual matrix, an agent follows the moving virtual matrix cell. Therefore, if only the number of cells to be followed by an agent is changed, the formation can be changed easily.

2.4. Command Optimization

To change the formation during swarm operation, a cell of the virtual matrix is allocated to each agent, and the corresponding position is followed. In this case, inefficient movement may occur if the cells are not distributed optimally. Therefore, the command is optimized in the following manner. The distance d i , j between the agent and cell is calculated using Equation (6). In this case, i is the number of cells; j is the number of agents; x c , i and y c , i constitute the position of cell i ; and x s , j and y s , j constitute the position of agent j .
d i , j = x c , i x s , j 2 + y c , i y s , j 2
Cell i is assigned to the closest agent after calculating the distance between all agents. In the next cell i + 1 , the distance to all agents, except for the agent to which the cell is already assigned, is calculated, and cell i + 1 is assigned to the closest agent. This can be expressed as a cost function, such as Equation (7). The cell distribution is optimized by following this process, as exemplified in Figure 2. In this figure, the distance between cell 1 and agent 1 is d 1 , 1 and that for agent 2 is d 1 , 2 . The smaller of these two distances is d 1 , 1 . Therefore, cell 1 is assigned to agent 1. Subsequently, cell 2 is followed by agent 2, which is not assigned.
C o s t   F u n c t i o n = d 1 , 1 d 1 , 2 d 1 , 3 d 2 , 1 d 2 , 2 d 2 , 3 d 3 , 1 d 3 , 2 d 3 , 3

3. Methodology

3.1. APF Method

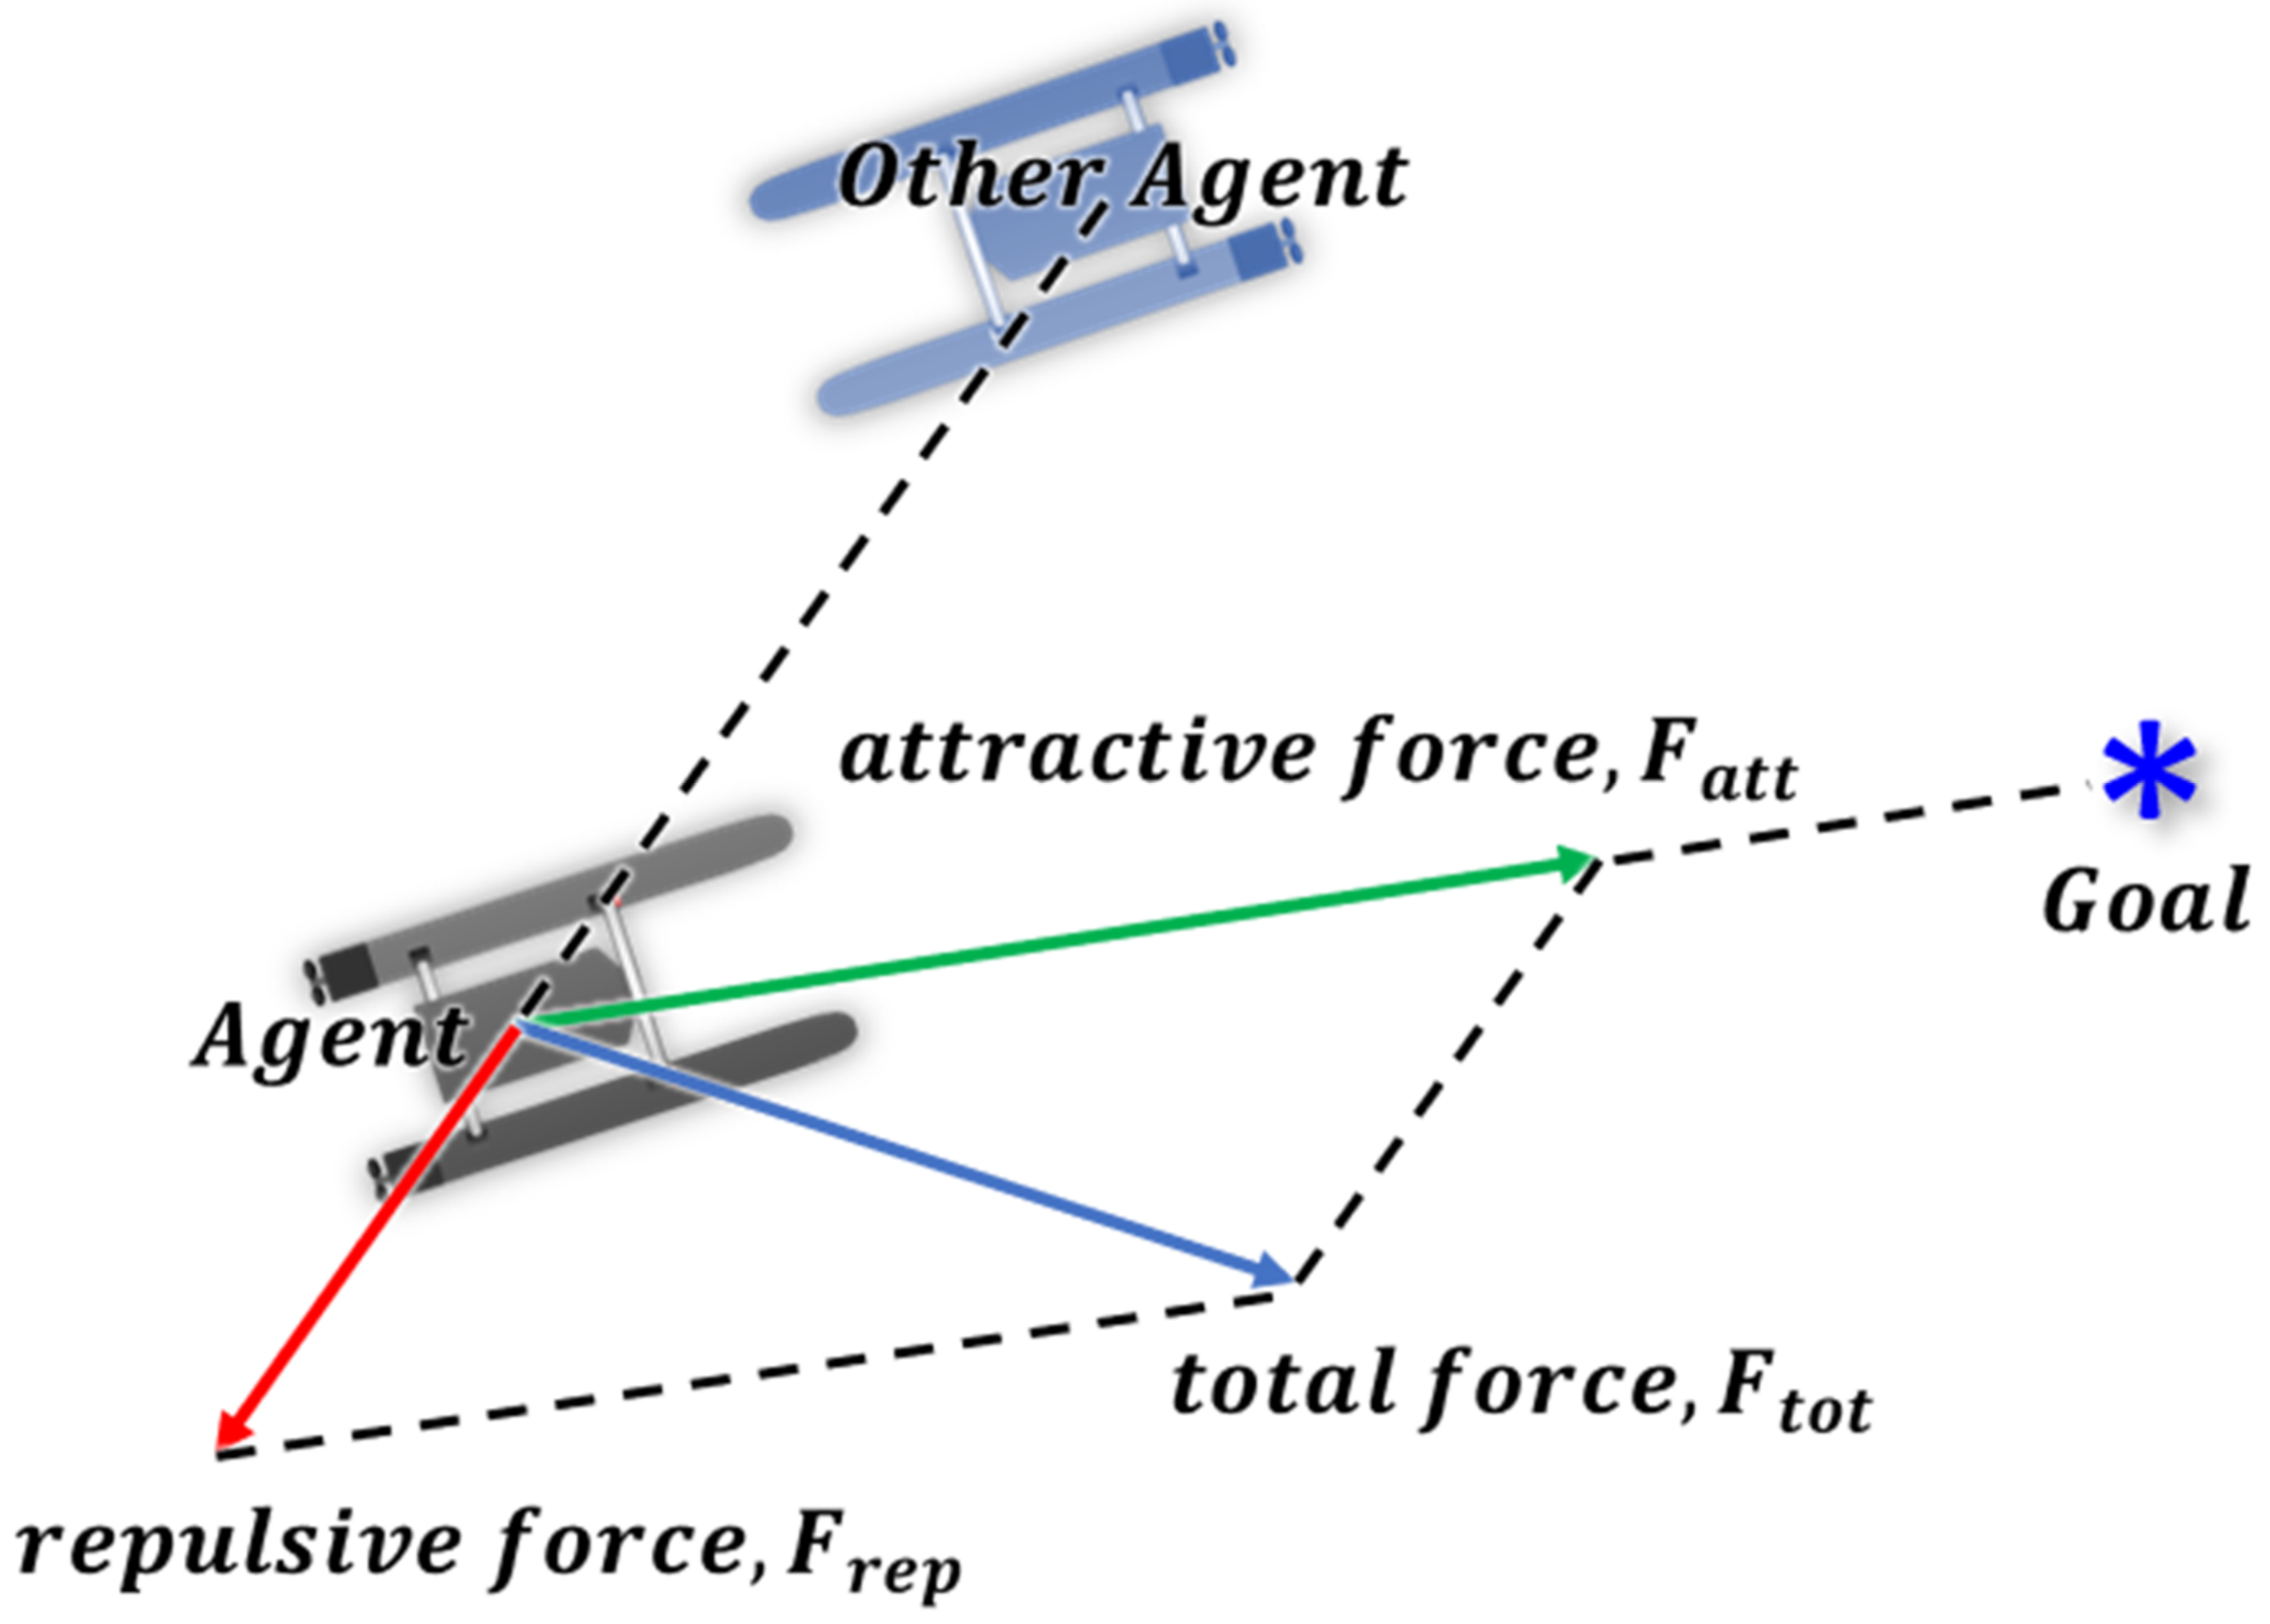
An APF was applied first to avoid collisions between agents during swarm operation. The APF method is a widely used algorithm in various domains because it is easy to implement. In this method, the target ship or obstacle is regarded as the highest potential point, the goal point is regarded as the lowest potential point, and an agent always moves from a high to low potential. Figure 3 shows the concept of an APF.
An attractive force is generated by setting the goal point as the lowest potential point, and a repulsive force is generated by setting the other agent point as a high potential point. The APF generates a local path in the direction of the total force, which is the vector sum of attractive and repulsive forces. This is easy to understand by considering the principle of a round virtual ball rolling down a field composed of a potential function. The total force is expressed as
F t o t = F a t t + F r e p
where the attractive force F a t t is
F a t t = d W P ,     w h e r e   d W P = p W P p A
p W P is the cell location in the virtual matrix given to the agent, p A is the position of the agent, and d W P is the distance between the agent and cell. In other words, the attractive force F a t t is calculated as a function of the distance between the cell and agent.
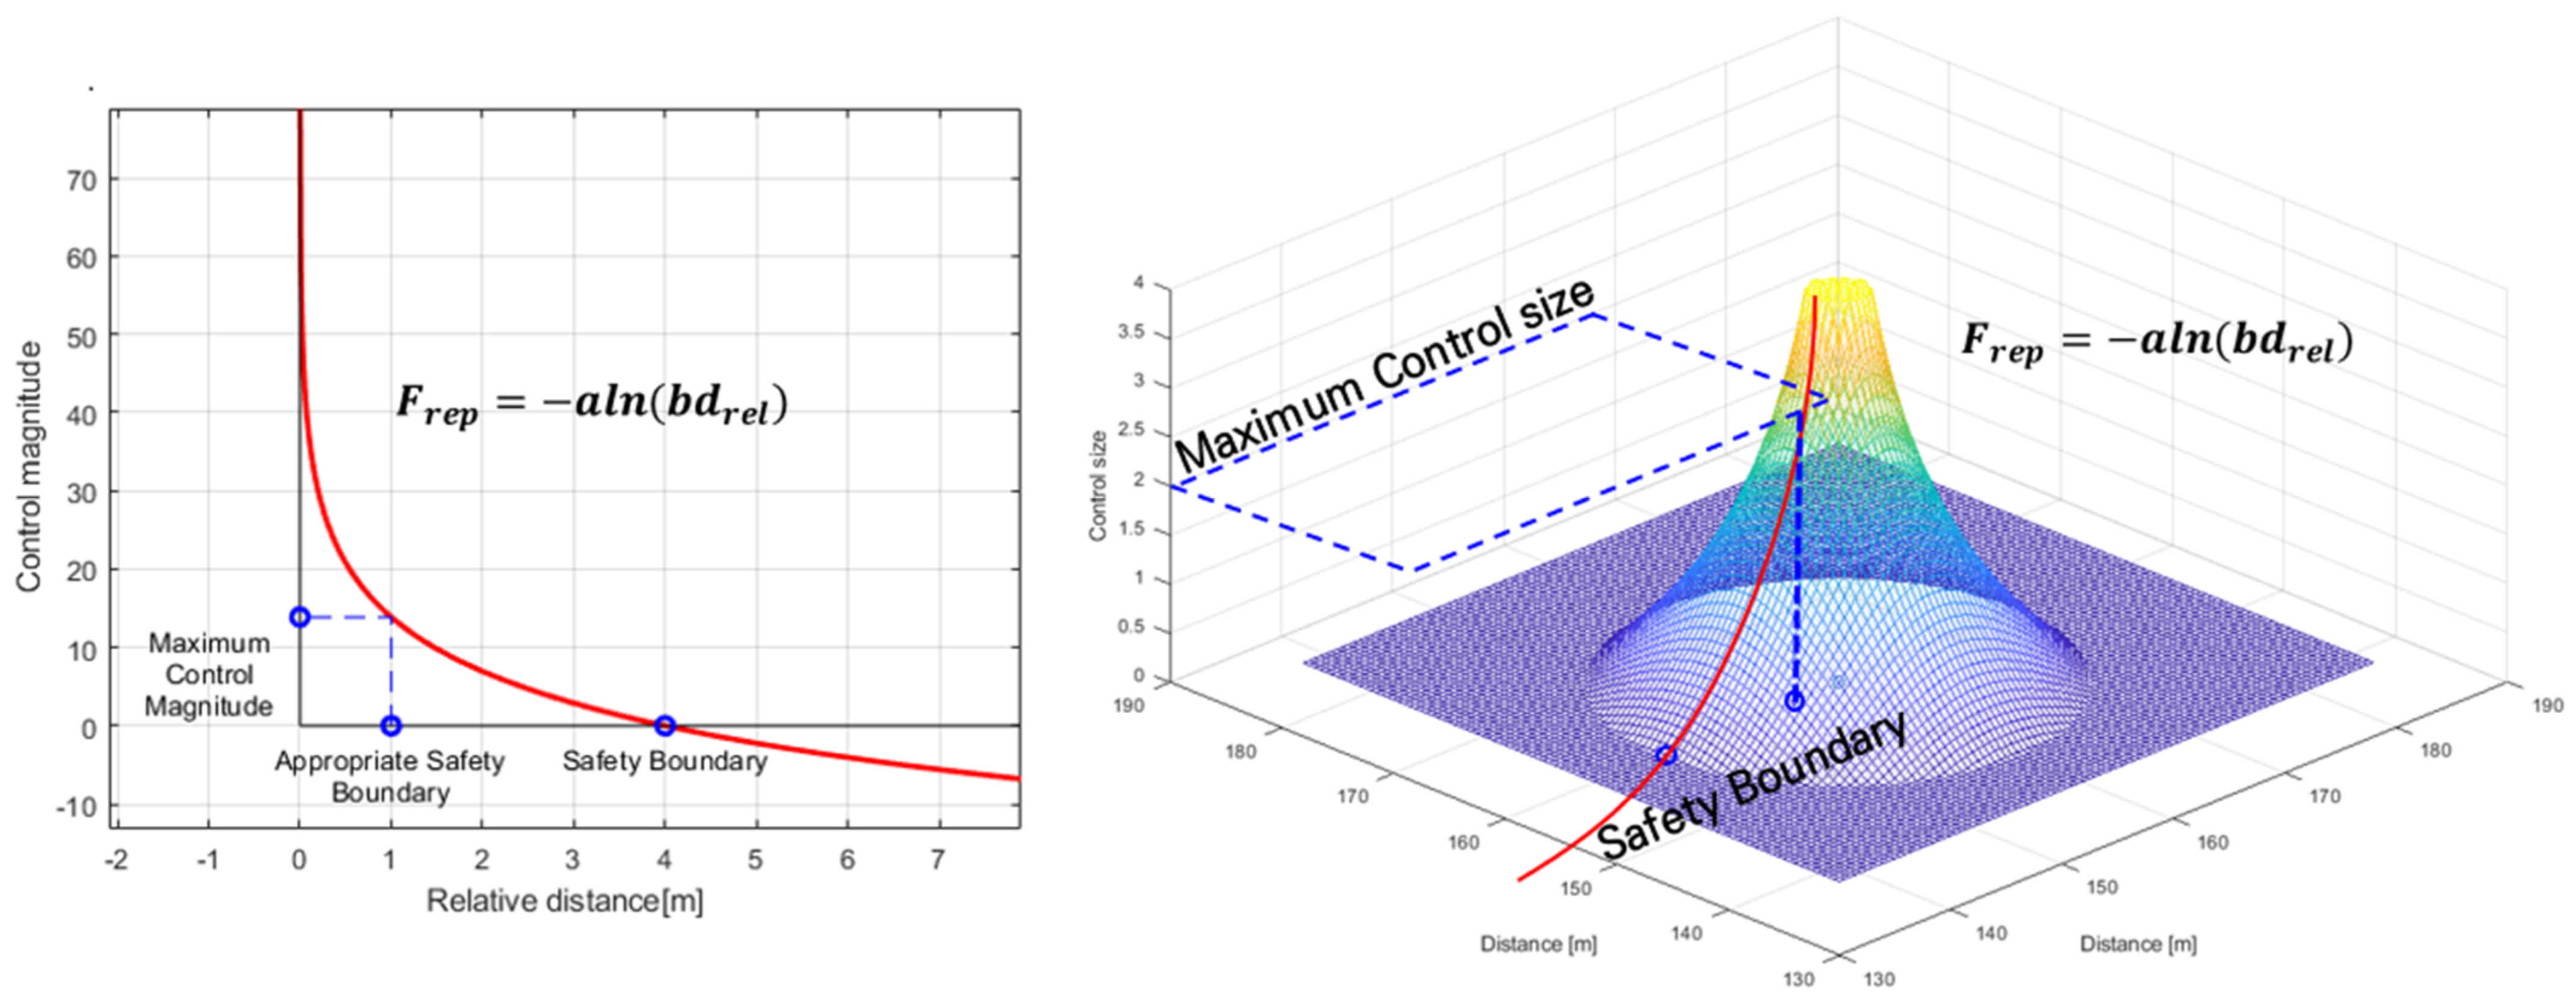
The repulsive force F r e p is based on the relative distance between the agent and another agent using a natural logarithmic function, as expressed in Equation (10). Moreover, a and b are the coefficients of the potential function that determines the type of repulsive force.
F r e p = a l n b d r e l ,     w h e r e   d r e l = p B p A
where p B is the position of the other agent and d r e l is the relative distance between the agent and the other agent. This repulsive force potential function can be mathematically calculated using a gradient in a 2D or 3D space. In general, it is expressed using a vector directed in all directions from the center of the potential function (position of other agents). Numerous calculations are needed to calculate the gradient of all the points in space. The repulsive force is always the same as the direction of the relative distance vector because the potential function has the same shape in all directions. Therefore, in the collision-avoidance algorithm, the repulsive force is applied in the direction of the relative distance vector. In addition, the repulsion potential function can be designed in various ways as a function of relative distance.
Figure 4 shows possible 2D and 3D designs for the control magnitude of the repulsive force. First, a safety boundary is set and then coefficients a and b of the exponential logarithmic function are determined using the maximum control magnitude of the approximate safety boundary. Beyond the safety boundary, the gradient becomes zero without affecting repulsive force. Accordingly, F t o t i , which finally acts on agent i , is expressed as
F t o t i = F a t t i + n = 1 N a F r e p n         f o r   n i ,   w h e r e   N a : n u m b e r   o f   a g e n t s
In other words, agent i avoids a collision by creating a collision avoidance path by adding the attractive force F a t t i and the sum of the repulsive forces excluding i .

3.2. B-APF Method

The general APF method encounters problems under the following simulation conditions in left–right symmetry situations. Most formations are left–right symmetrical, so this is indeed an important issue. The case below is that agent 1 moves from row 1, column 1, to row 1, column 2, and agent 2 moves from row 1, column 2, to row 1, column 1, and the agents cross each other in a symmetrical state.
Table 1 summarizes the simulation conditions under which these problems occur. In Figure 5, note that the two agents do not repel each other and rotate at the center point of the left–right symmetry. For this simulation, a problem occurs because it is a symmetrical situation. Table 2 lists the attractive force F a t t and repulsive force F r e p acting on agents 1 and 2.
In the case of a symmetrical situation, when the difference between the waypoints p W P n and position p n of the two agents is calculated, note that only the directions are different and the magnitudes are the same; therefore, F a t t 1 = F a t t 2 . The repulsive force is F r e p 1 = F r e p 2 because only the positions of the two agents are different. Finally, the force applied to each agent is F t o t = F a t t + F r e p . For agent 1, F t o t 1 = F a t t 1 + F r e p 2 , and for agent 2, F t o t 2 = F a t t 2 + F r e p 1 ; therefore, the expression F t o t 1 = F t o t 2 holds. In other words, since the magnitudes of the forces applied to each other are the same and only the direction is different, one side cannot overcome the other side and a phenomenon occurs in which the agents rotate repeatedly at the same point. To solve this problem, this study proposes a B-APF that breaks the symmetry.
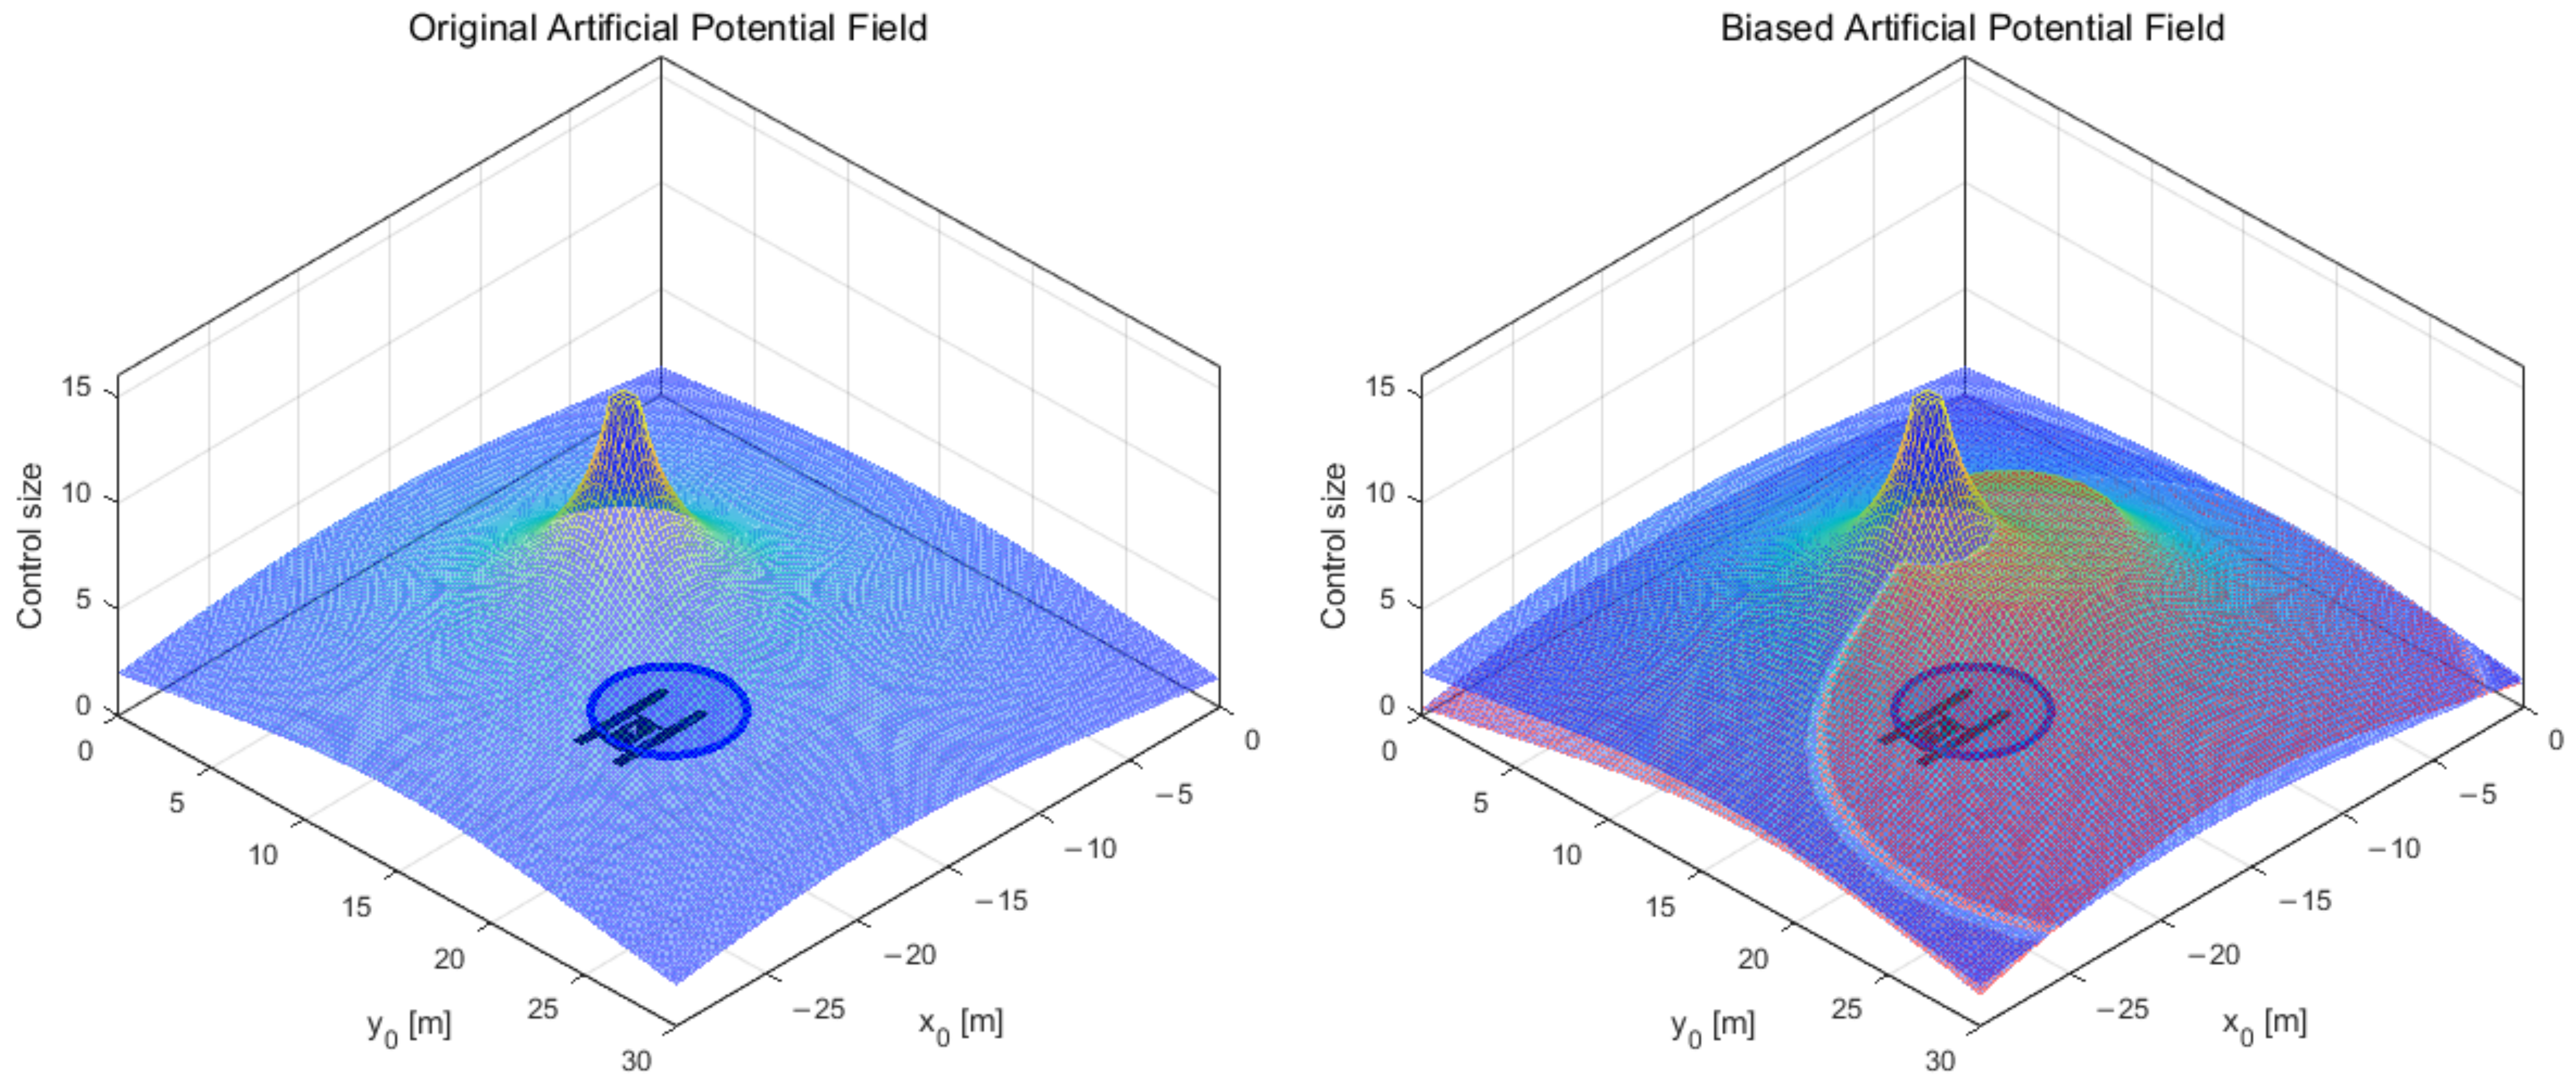
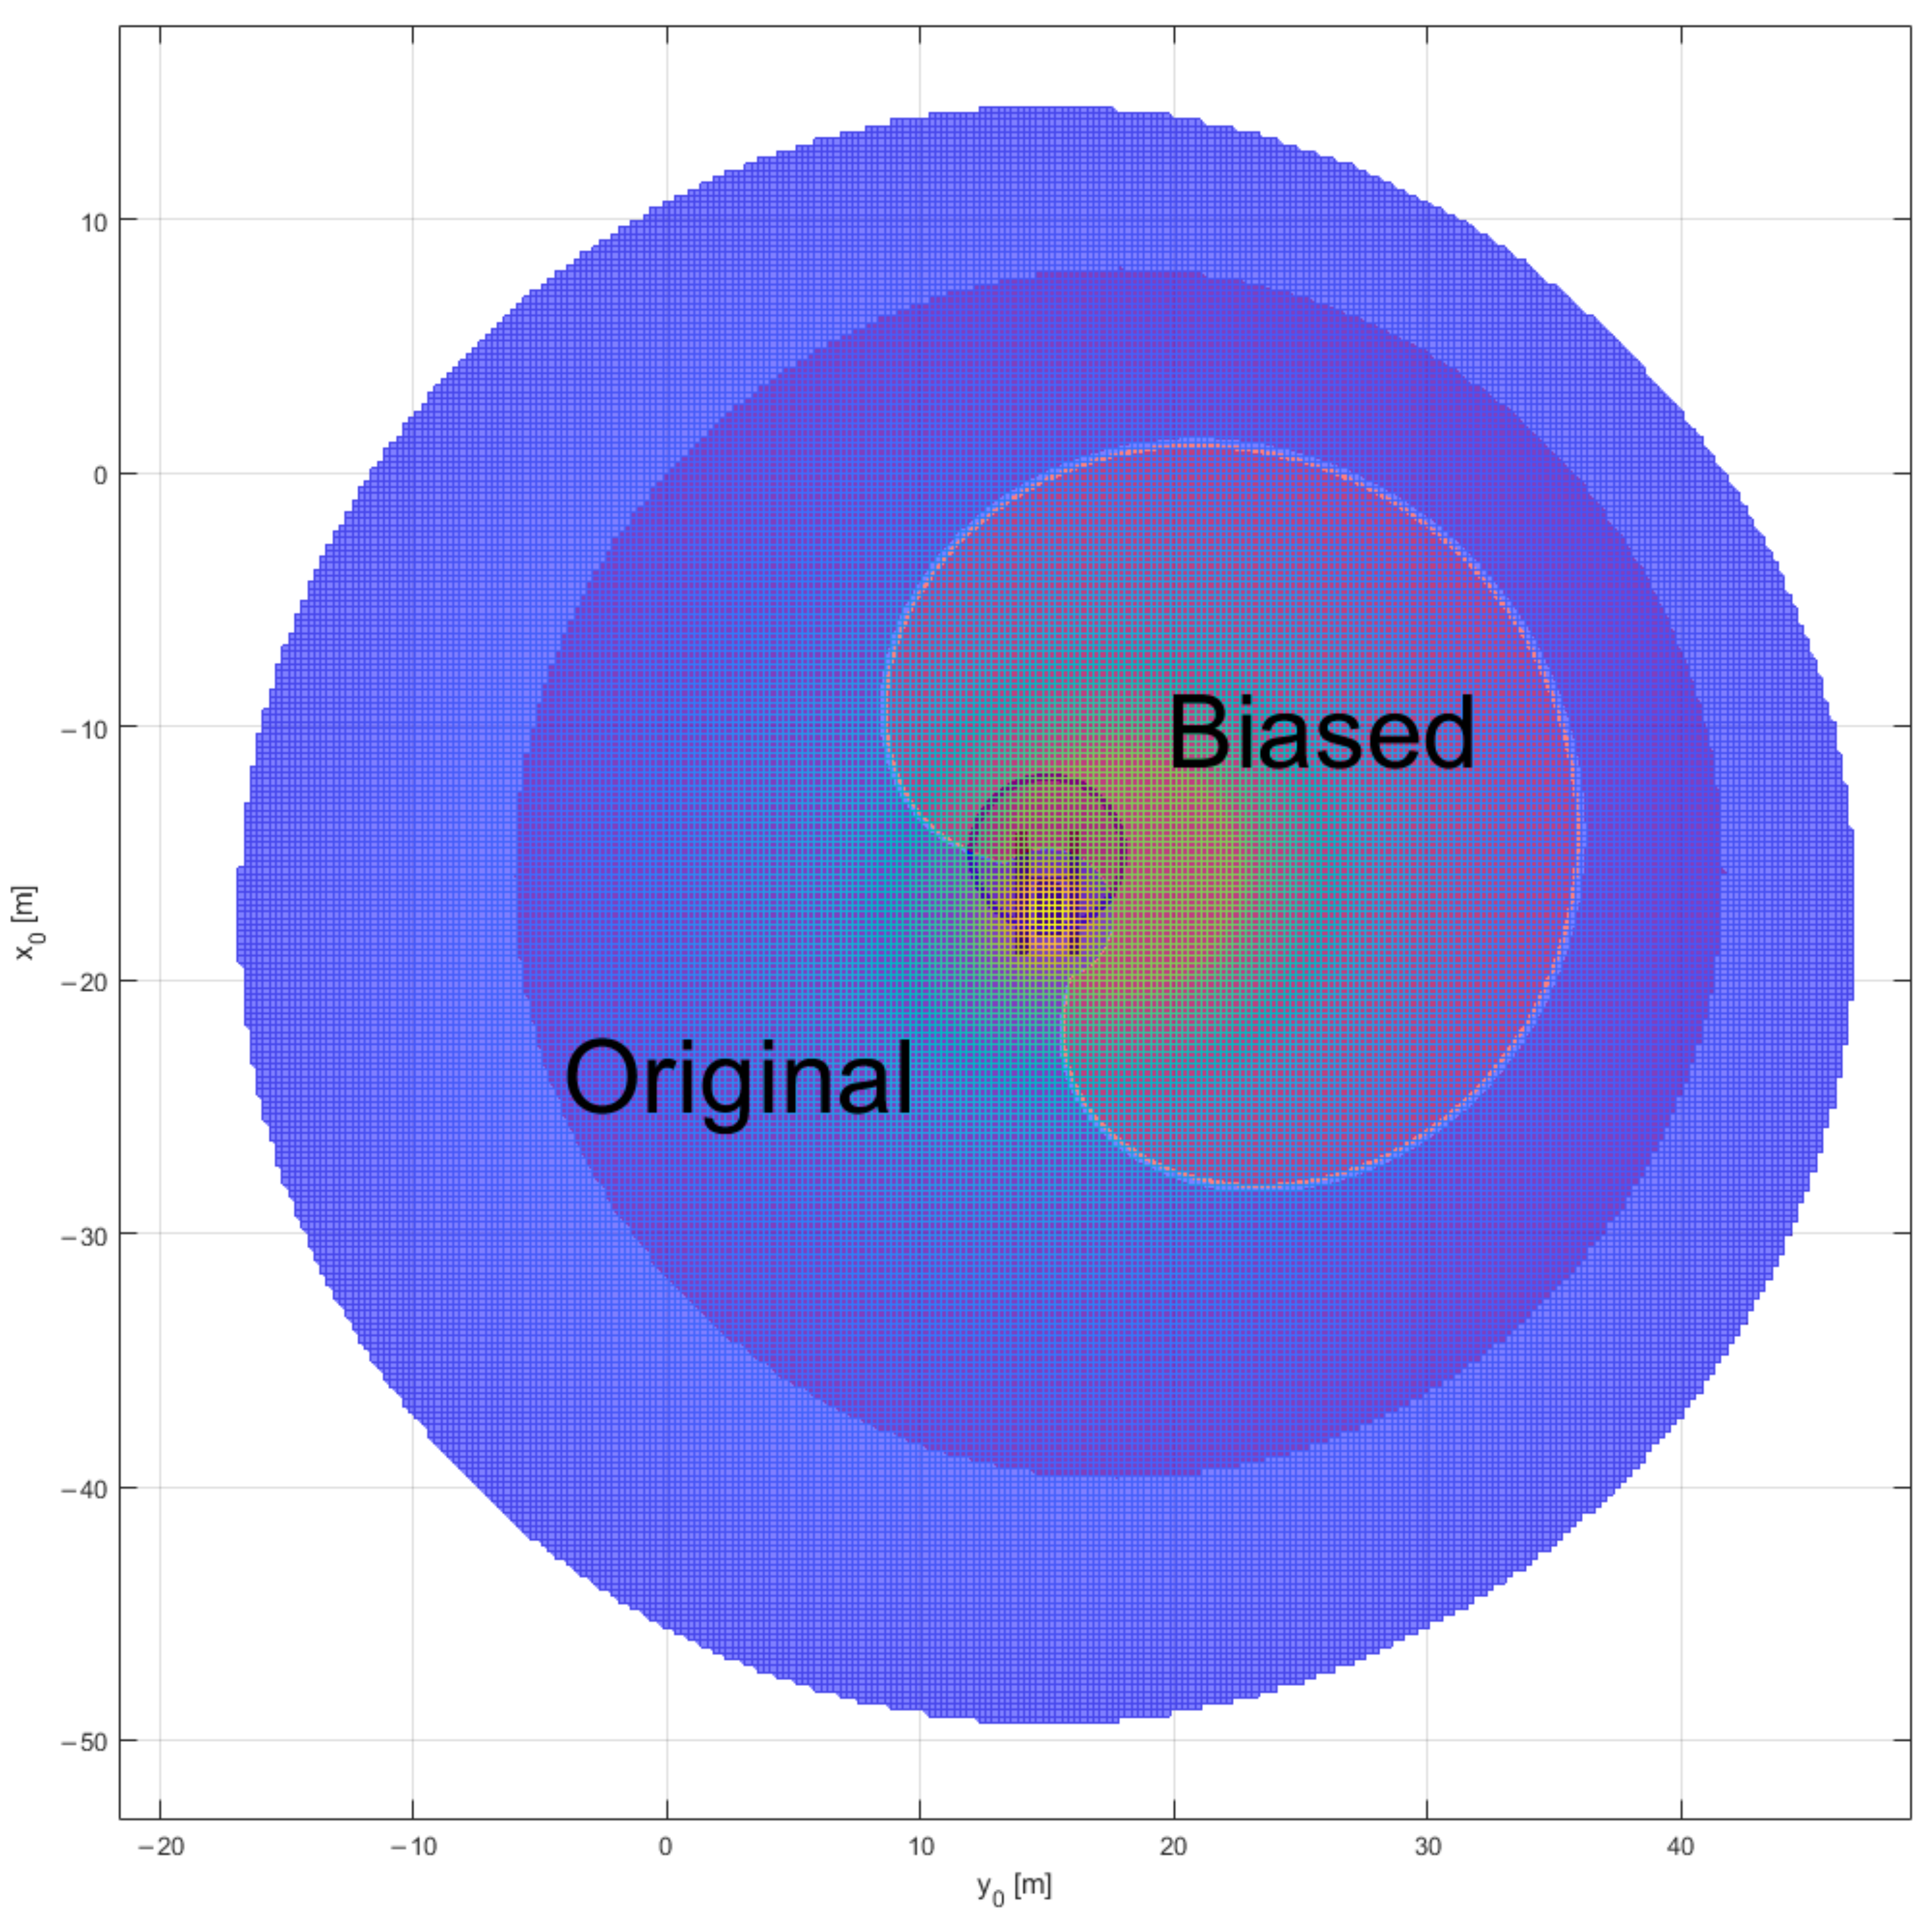
The B-APF is implemented by creating a biased potential field at a different location from the original potential field and using a high control size at that location. The left and right sides of Figure 6 show the APF and B-APF cases, respectively. Note that blue and red represent the original and biased potential fields, respectively. In the blue area of Figure 7, the control size of the original potential field is larger and it is affected by the original potential field. In the red area, the control size of the biased potential field is larger and, thus, it is affected by the biased potential field. In this study, to induce starboard-side avoidance according to the Convention on the International Regulations for Preventing Collisions at Sea (COLREGs) rules, a biased potential field was generated at a distance of 2/3 L and 60 ° clockwise from the frontal direction of the agent. Table 3 lists the simulation conditions for using a B-APF in the aforementioned symmetrical situation for which problems occur while using an APF.
Figure 8 shows the results of the simulation using the B-APF. Unlike the APF, note that collision avoidance can be successfully performed in a symmetrical situation.

3.3. VO Method

The second method of choice for collision avoidance was the VO approach, which is a collision-avoidance algorithm used in the field of robotics. As the name suggests, VO is an algorithm that creates an area with a possibility of collision based on the velocity and size of an obstacle and then derives the velocity and direction to avoid said area. VO has the advantage of being able to avoid both static and dynamic obstacles by considering the relative velocity in a situation with several obstacles around it and, unlike the APF, VO has the advantage of knowing both the direction and velocity. However, since the motion of surrounding objects is estimated using radar, cameras, and LiDAR, the resulting uncertainty is disadvantageous. In this study, since all objects in the swarm know the positions and velocities of other agents, the uncertainty problem need not be considered due to estimation.
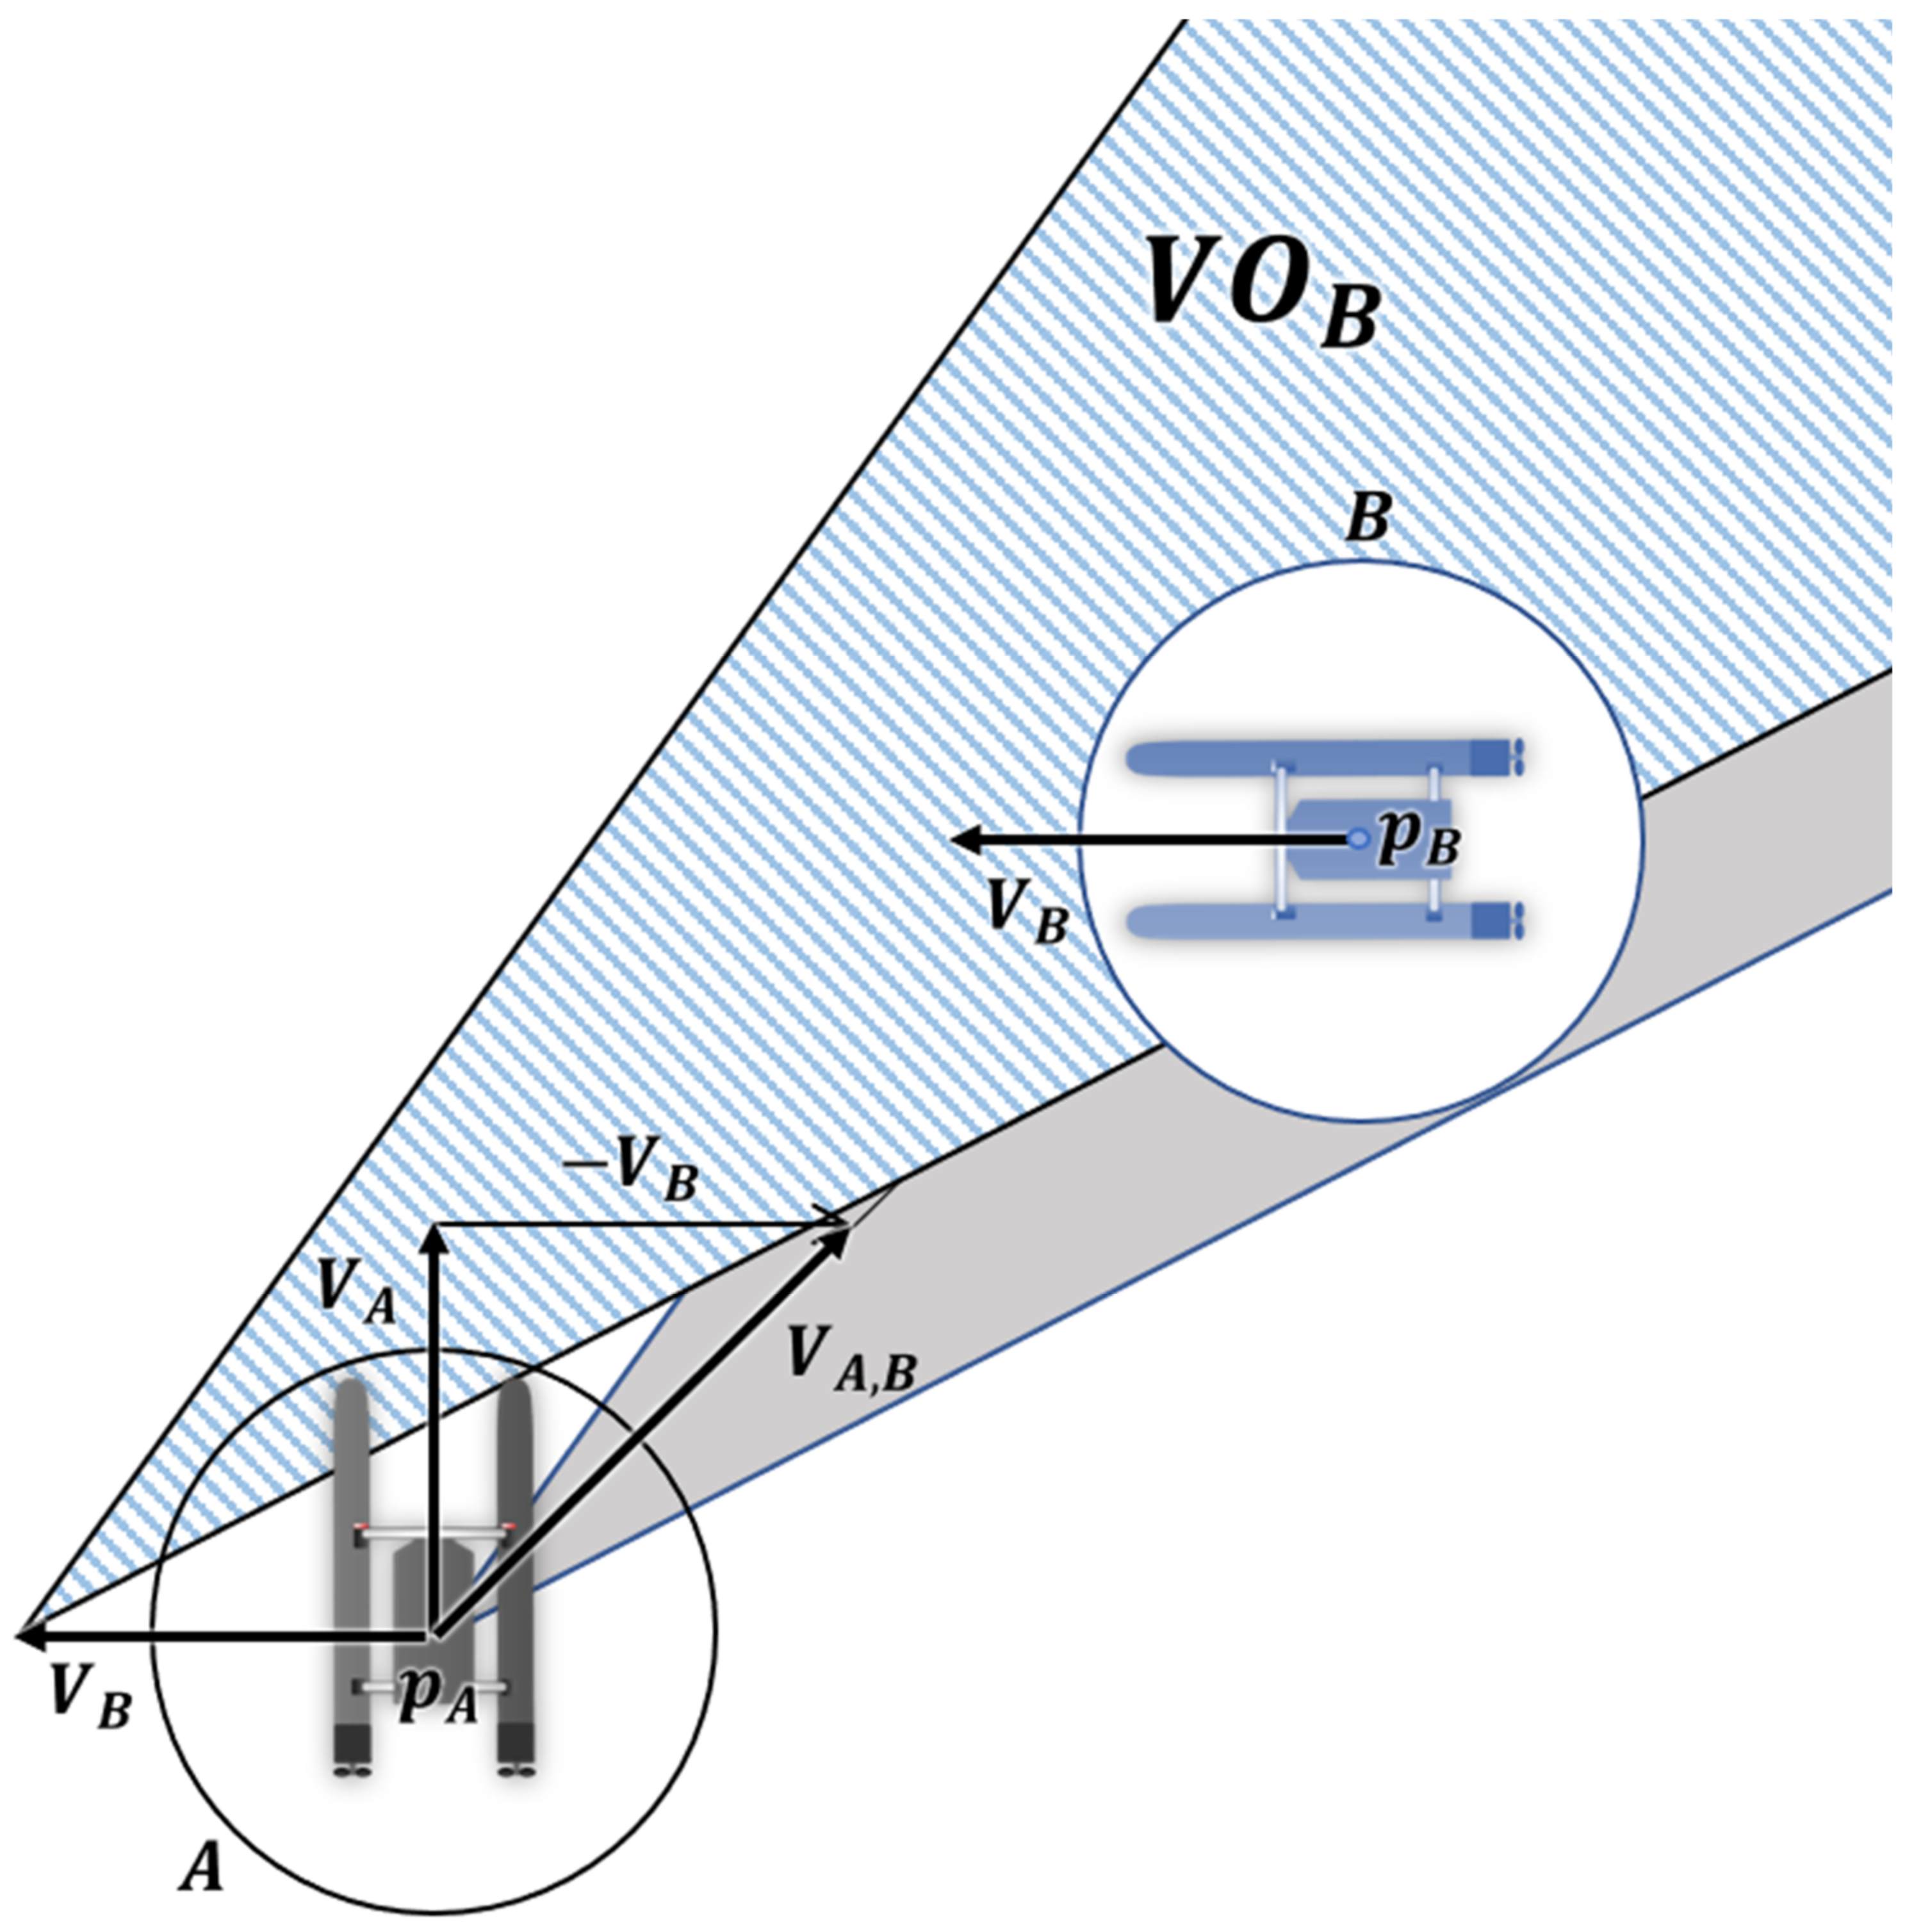
The process of avoiding a collision using the VO approach is discussed next. In Figure 9, A and B are agents moving in the plane with their reference points at p A and p B , respectively. In this situation, the process of A using the VO approach to avoid B is as follows:
  • Definition of collision cone C A B ;
    C A B = { V A , B | λ A , B B }
In Equation (12), V A , B is the relative velocity of A with respect to B . λ A , B is a ray that starts at p A and moves in the direction of V A , B as defined in Equation (13). Note that t represents time.
λ A , B = { p A + t V A , B | t 0 }
C A B is the gray area in Figure 9, which indicates the area between two vectors λ l and λ r circumscribing B , with p A as the origin.
Figure 9. Setting of collision cone.
Jmse 10 02036 g009
  • Definition of velocity obstacle V O B ;
The velocity obstacle V O B is defined as
V O B = C A B V B
In this case, ⨁ means the Minkowski sum of Equation (15). The Minkowski sum is an operation that creates a new vector set by adding all vectors in A to the corresponding vectors in B from two sets of vectors A and B in Euclidean space. The velocity obstacle V O B is equivalent to moving the collision cone C A B by V B using the Minkowski sum, as shown in Figure 10.
A B = { a + b | a A ,   b B }
If V A V O B , then A and B will collide at some point. If V A is outside the VO of B , V O B , then the two objects will never collide. If V A is at the boundary of the velocity obstacle V O B , it will reach B at a certain point. The VO is a cone with a vertex at the sum of p A and V B , as shown in Figure 10.
The concept of the VO can be used to navigate moving objects or obstacles. At each moment, the agent chooses a velocity outside the VO induced by another moving agent. If the selected velocity is directed toward the waypoint, which is the arrival point of the agent, the agent will safely navigate towards the waypoint.
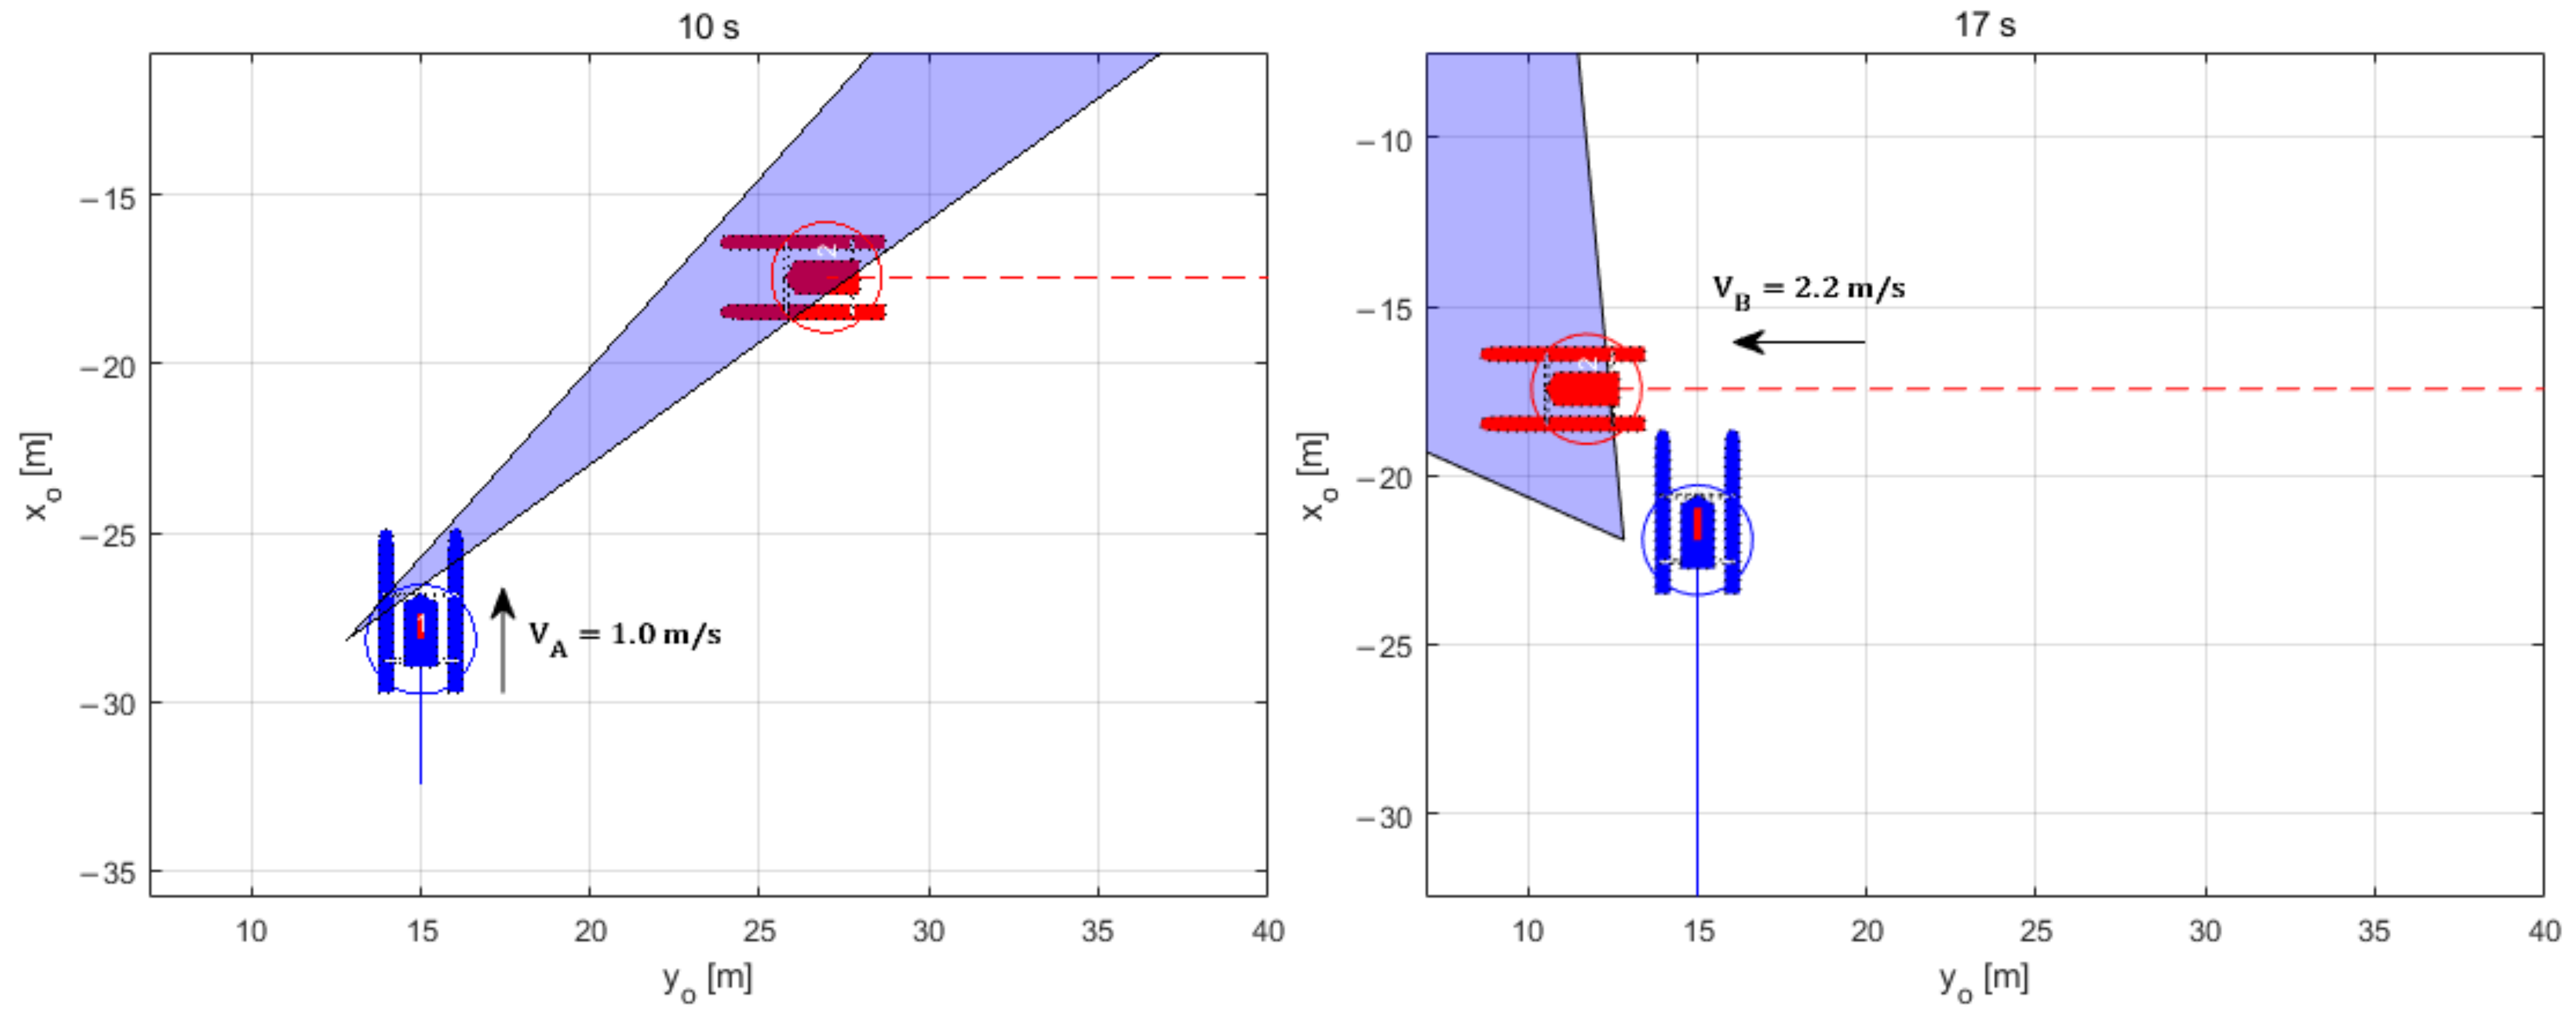
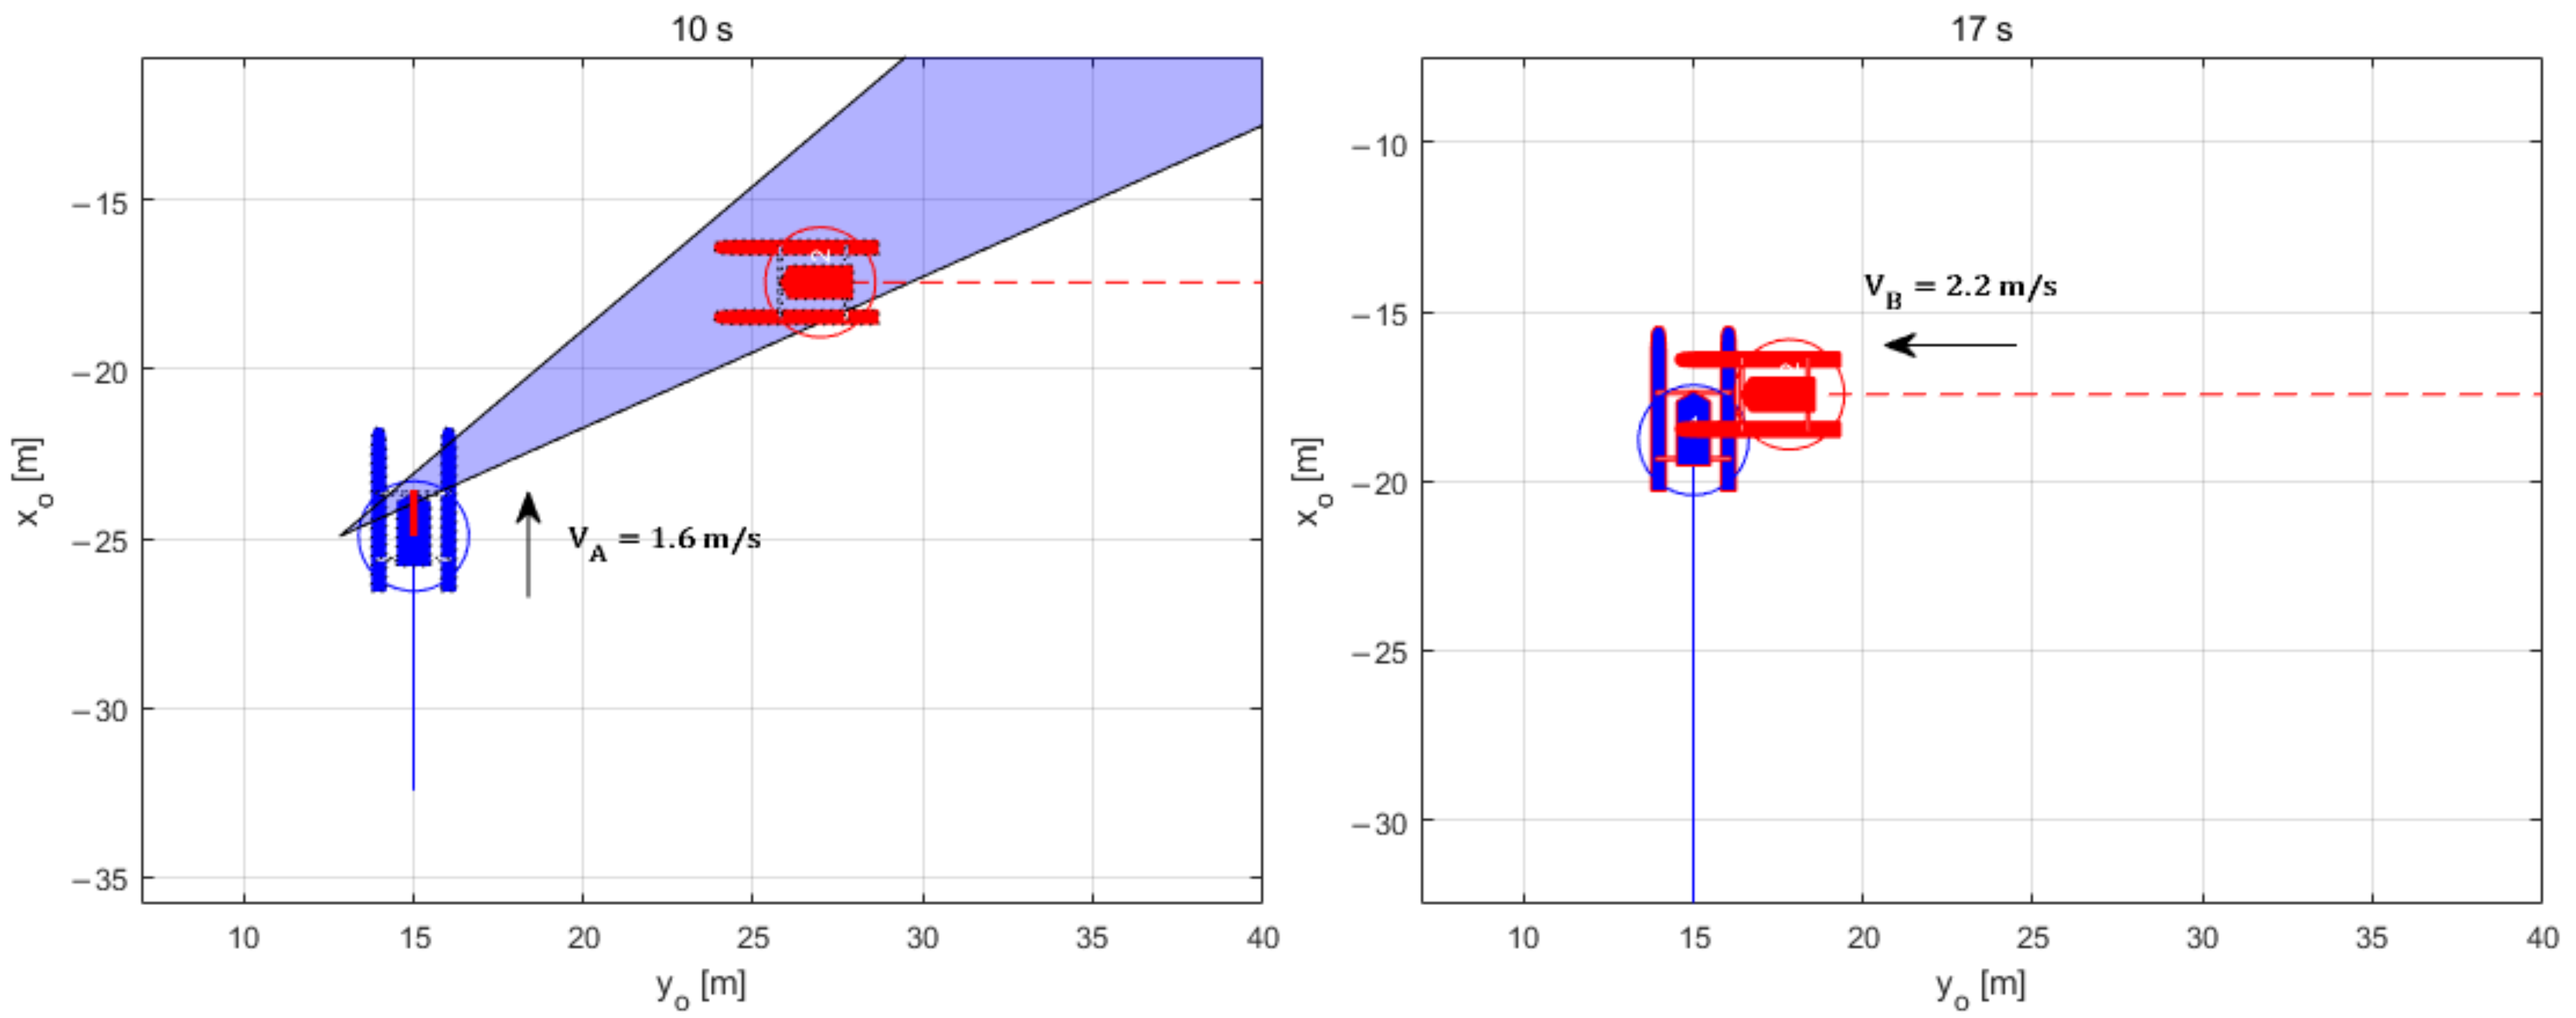
Figure 11 shows an example in which the V A of 1.0 m/s, indicated by a red straight line for the blue agent, does not lead to a collision because it is outside the velocity obstacle V O B . Figure 12 shows an example in which the V A is inside a VO at 1.6 m/s. These two agents may collide over time.

3.4. Estination of CRI

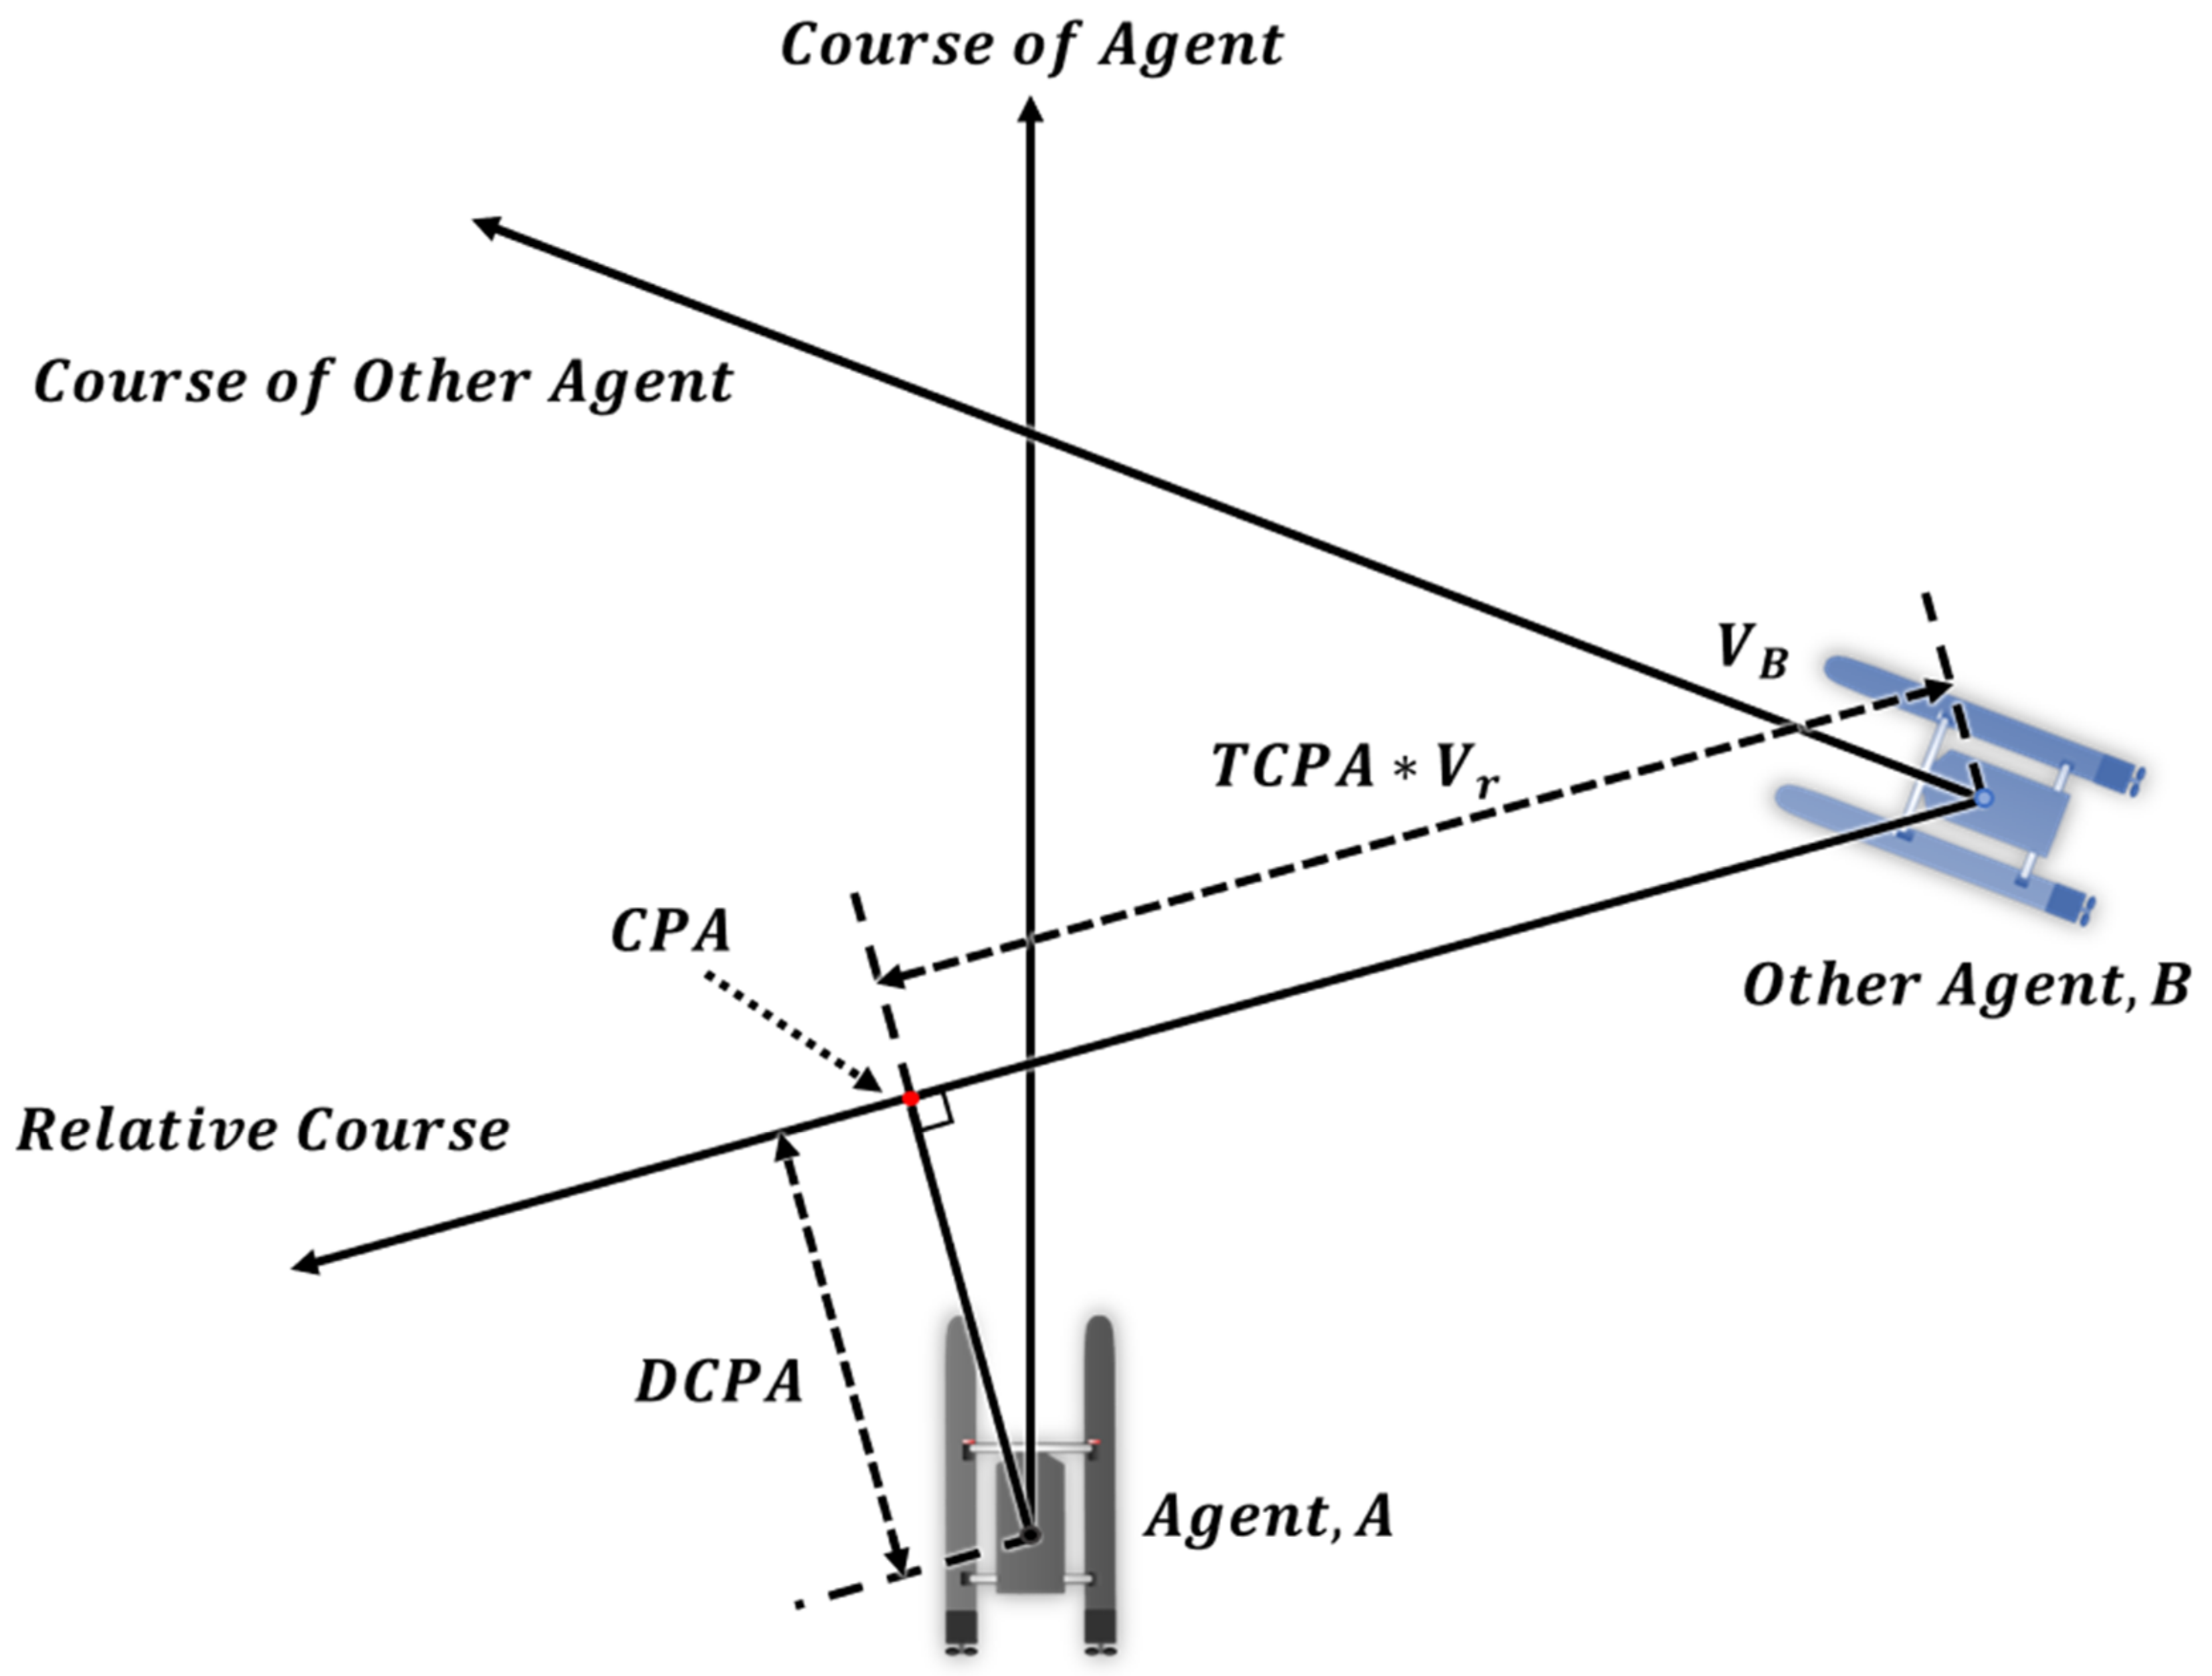
Efficient collision avoidance can only be achieved when collision avoidance maneuvers are performed at an appropriate location and time. The CRI must be calculated to determine these appropriate parameters. The collision avoidance for ships is accomplished by simultaneously considering both temporal and spatial factors. Therefore, the CPA, a method that can determine temporal and spatial factors, is used to calculate collision risk. The CPA is the point at which the other agent is closest when the agent and other agent maintain their current course and speed. When the other agent arrives at the CPA, the distance between the two is defined as the DCPA, and the time taken to reach the CPA is defined as the TCPA. The TCPA and DCPA have the advantage of independently expressing temporal and spatial elements, respectively. Figure 13 explains the concepts of the CPA, DCPA, and TCPA. Moreover, Equation (16) expresses their mathematical definitions:
T C P A = p A p B · V B V A V B V A 2 D C P A = p A + V A · T C P A p B + V B · T C P A
The DCPA is always a positive value, and in the case of the TCPA, a negative value may emerge when two ships pass each other. Only other agents that satisfy Equation (17) are avoided to prevent unnecessary avoidance behavior for other agents with a CRI that is not high.
0 T C P A i T C P A m a x D C P A i D C P A m i n
where T C P A m a x is the maximum shortest approach time, and D C P A m i n is the minimum shortest approach distance. These parameters are provided with appropriate values.

4. Simulation

Swarm Operation Simulation

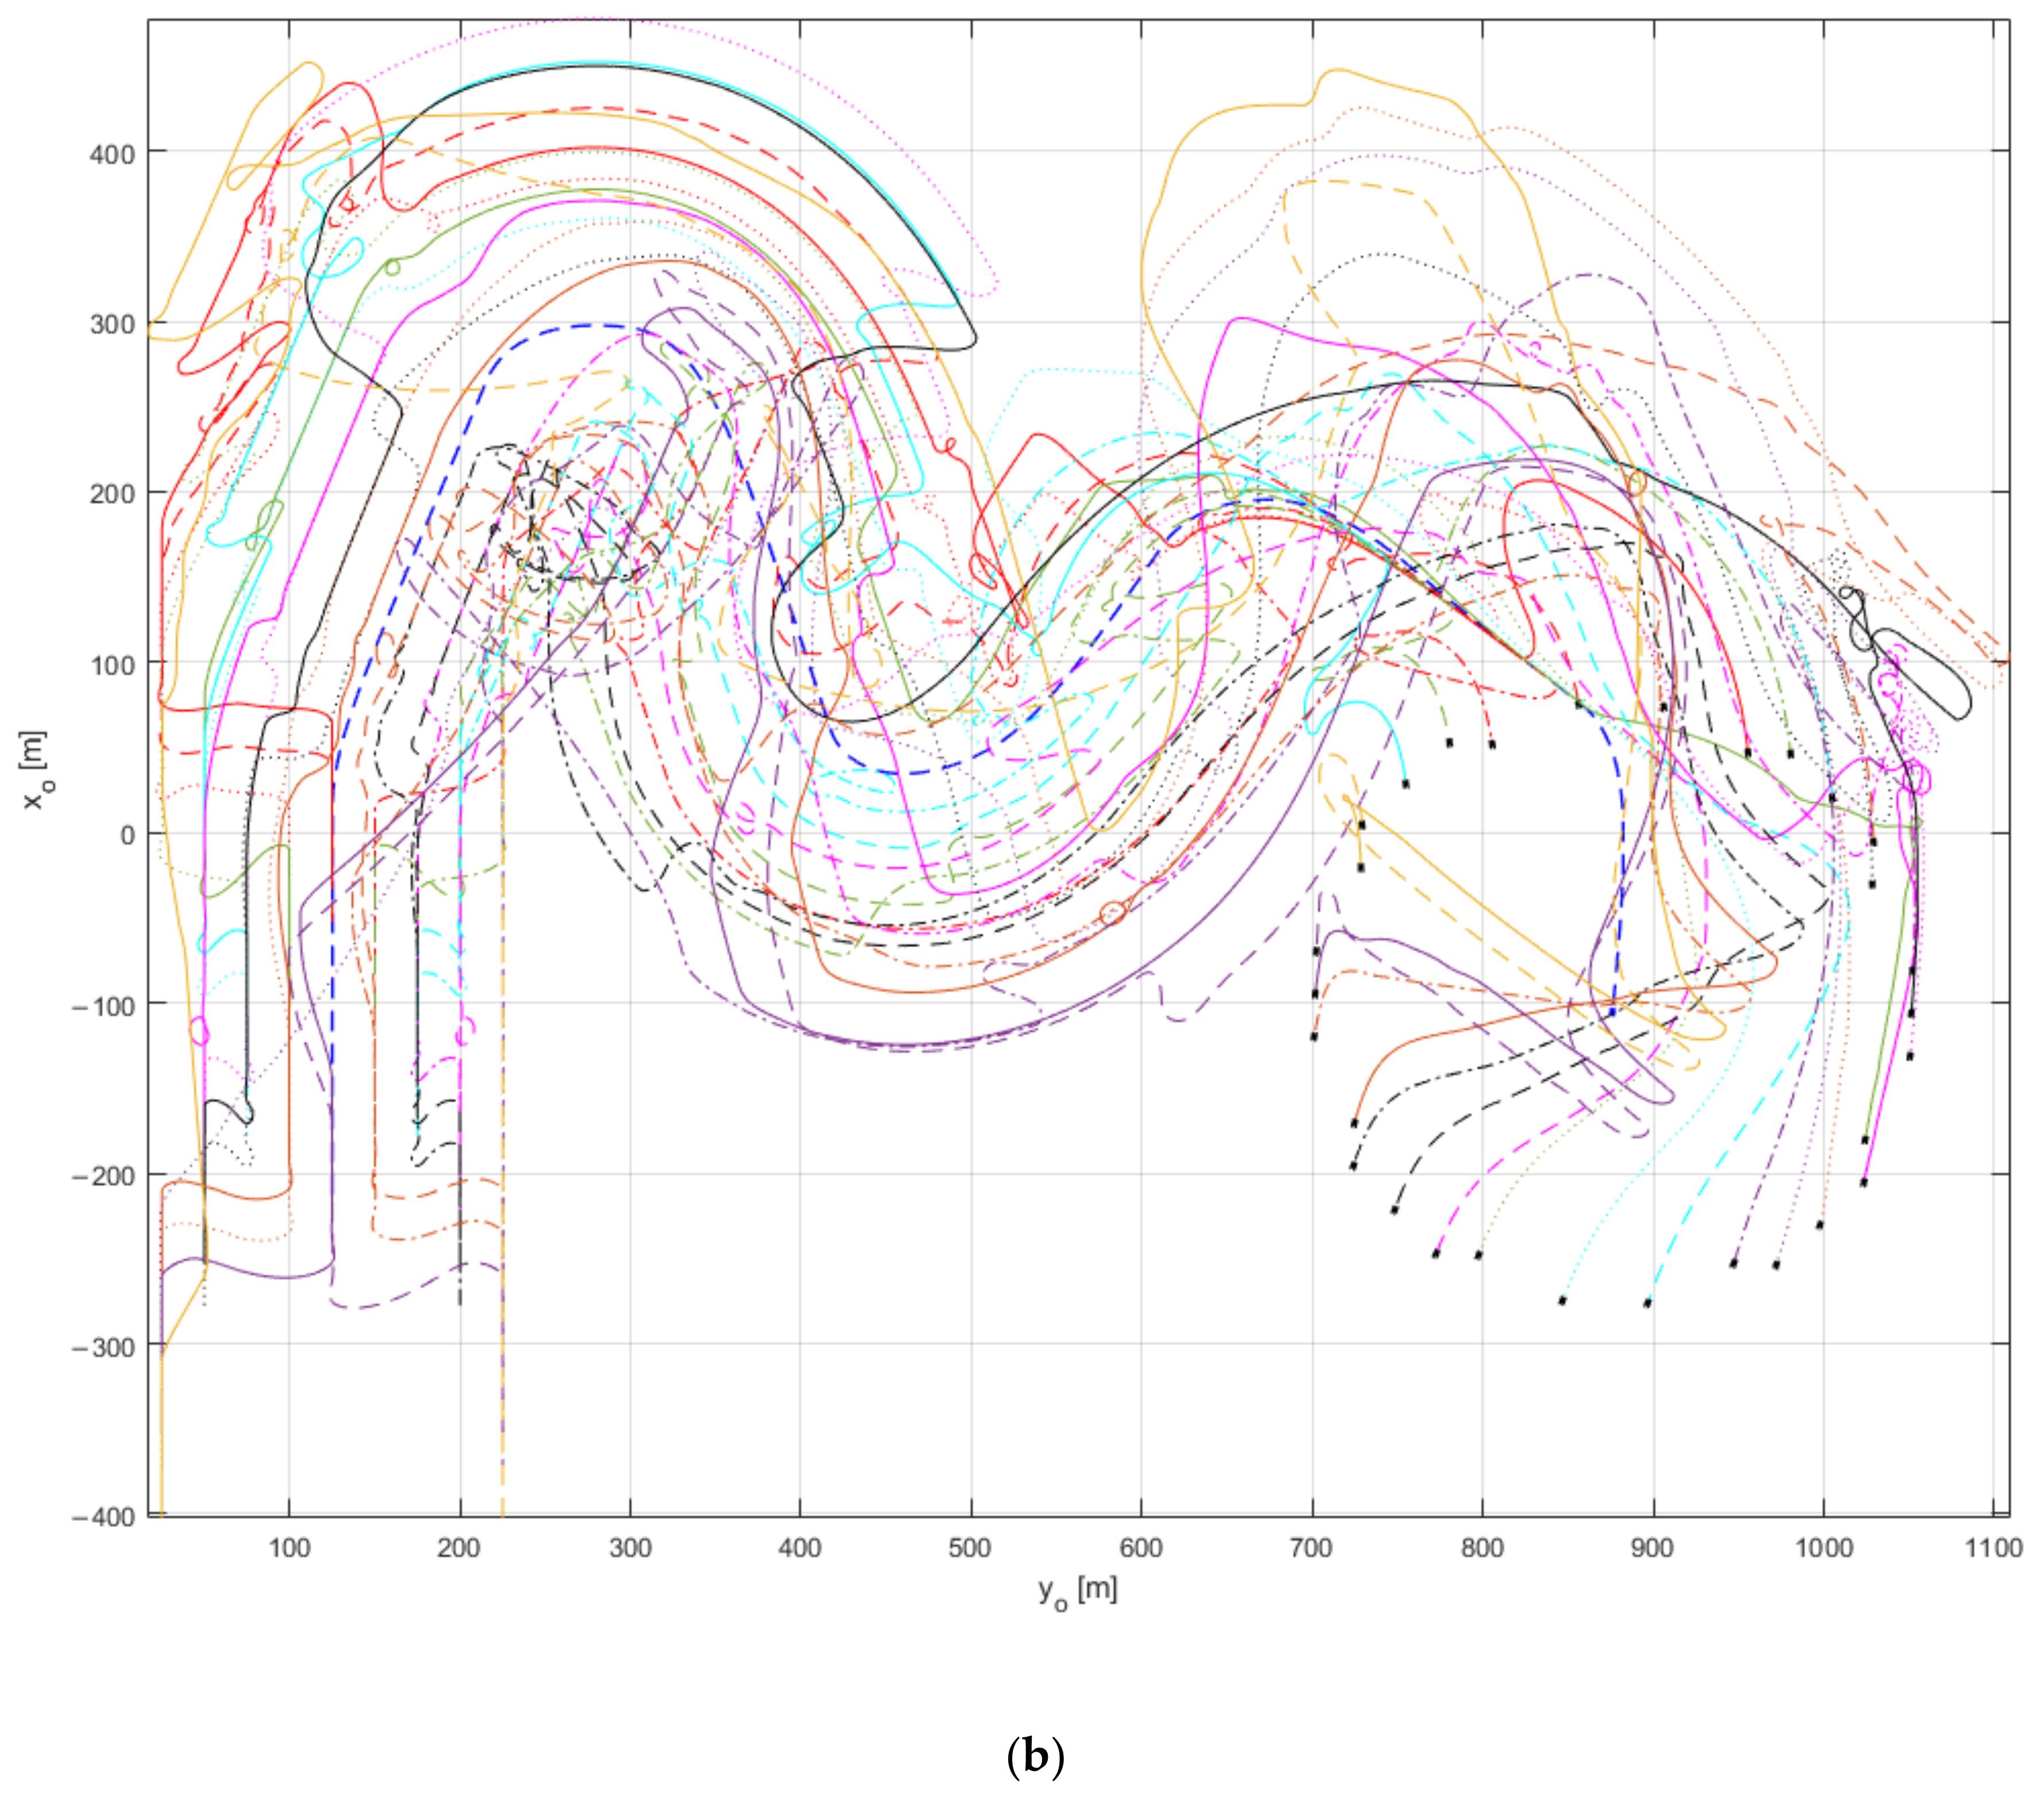
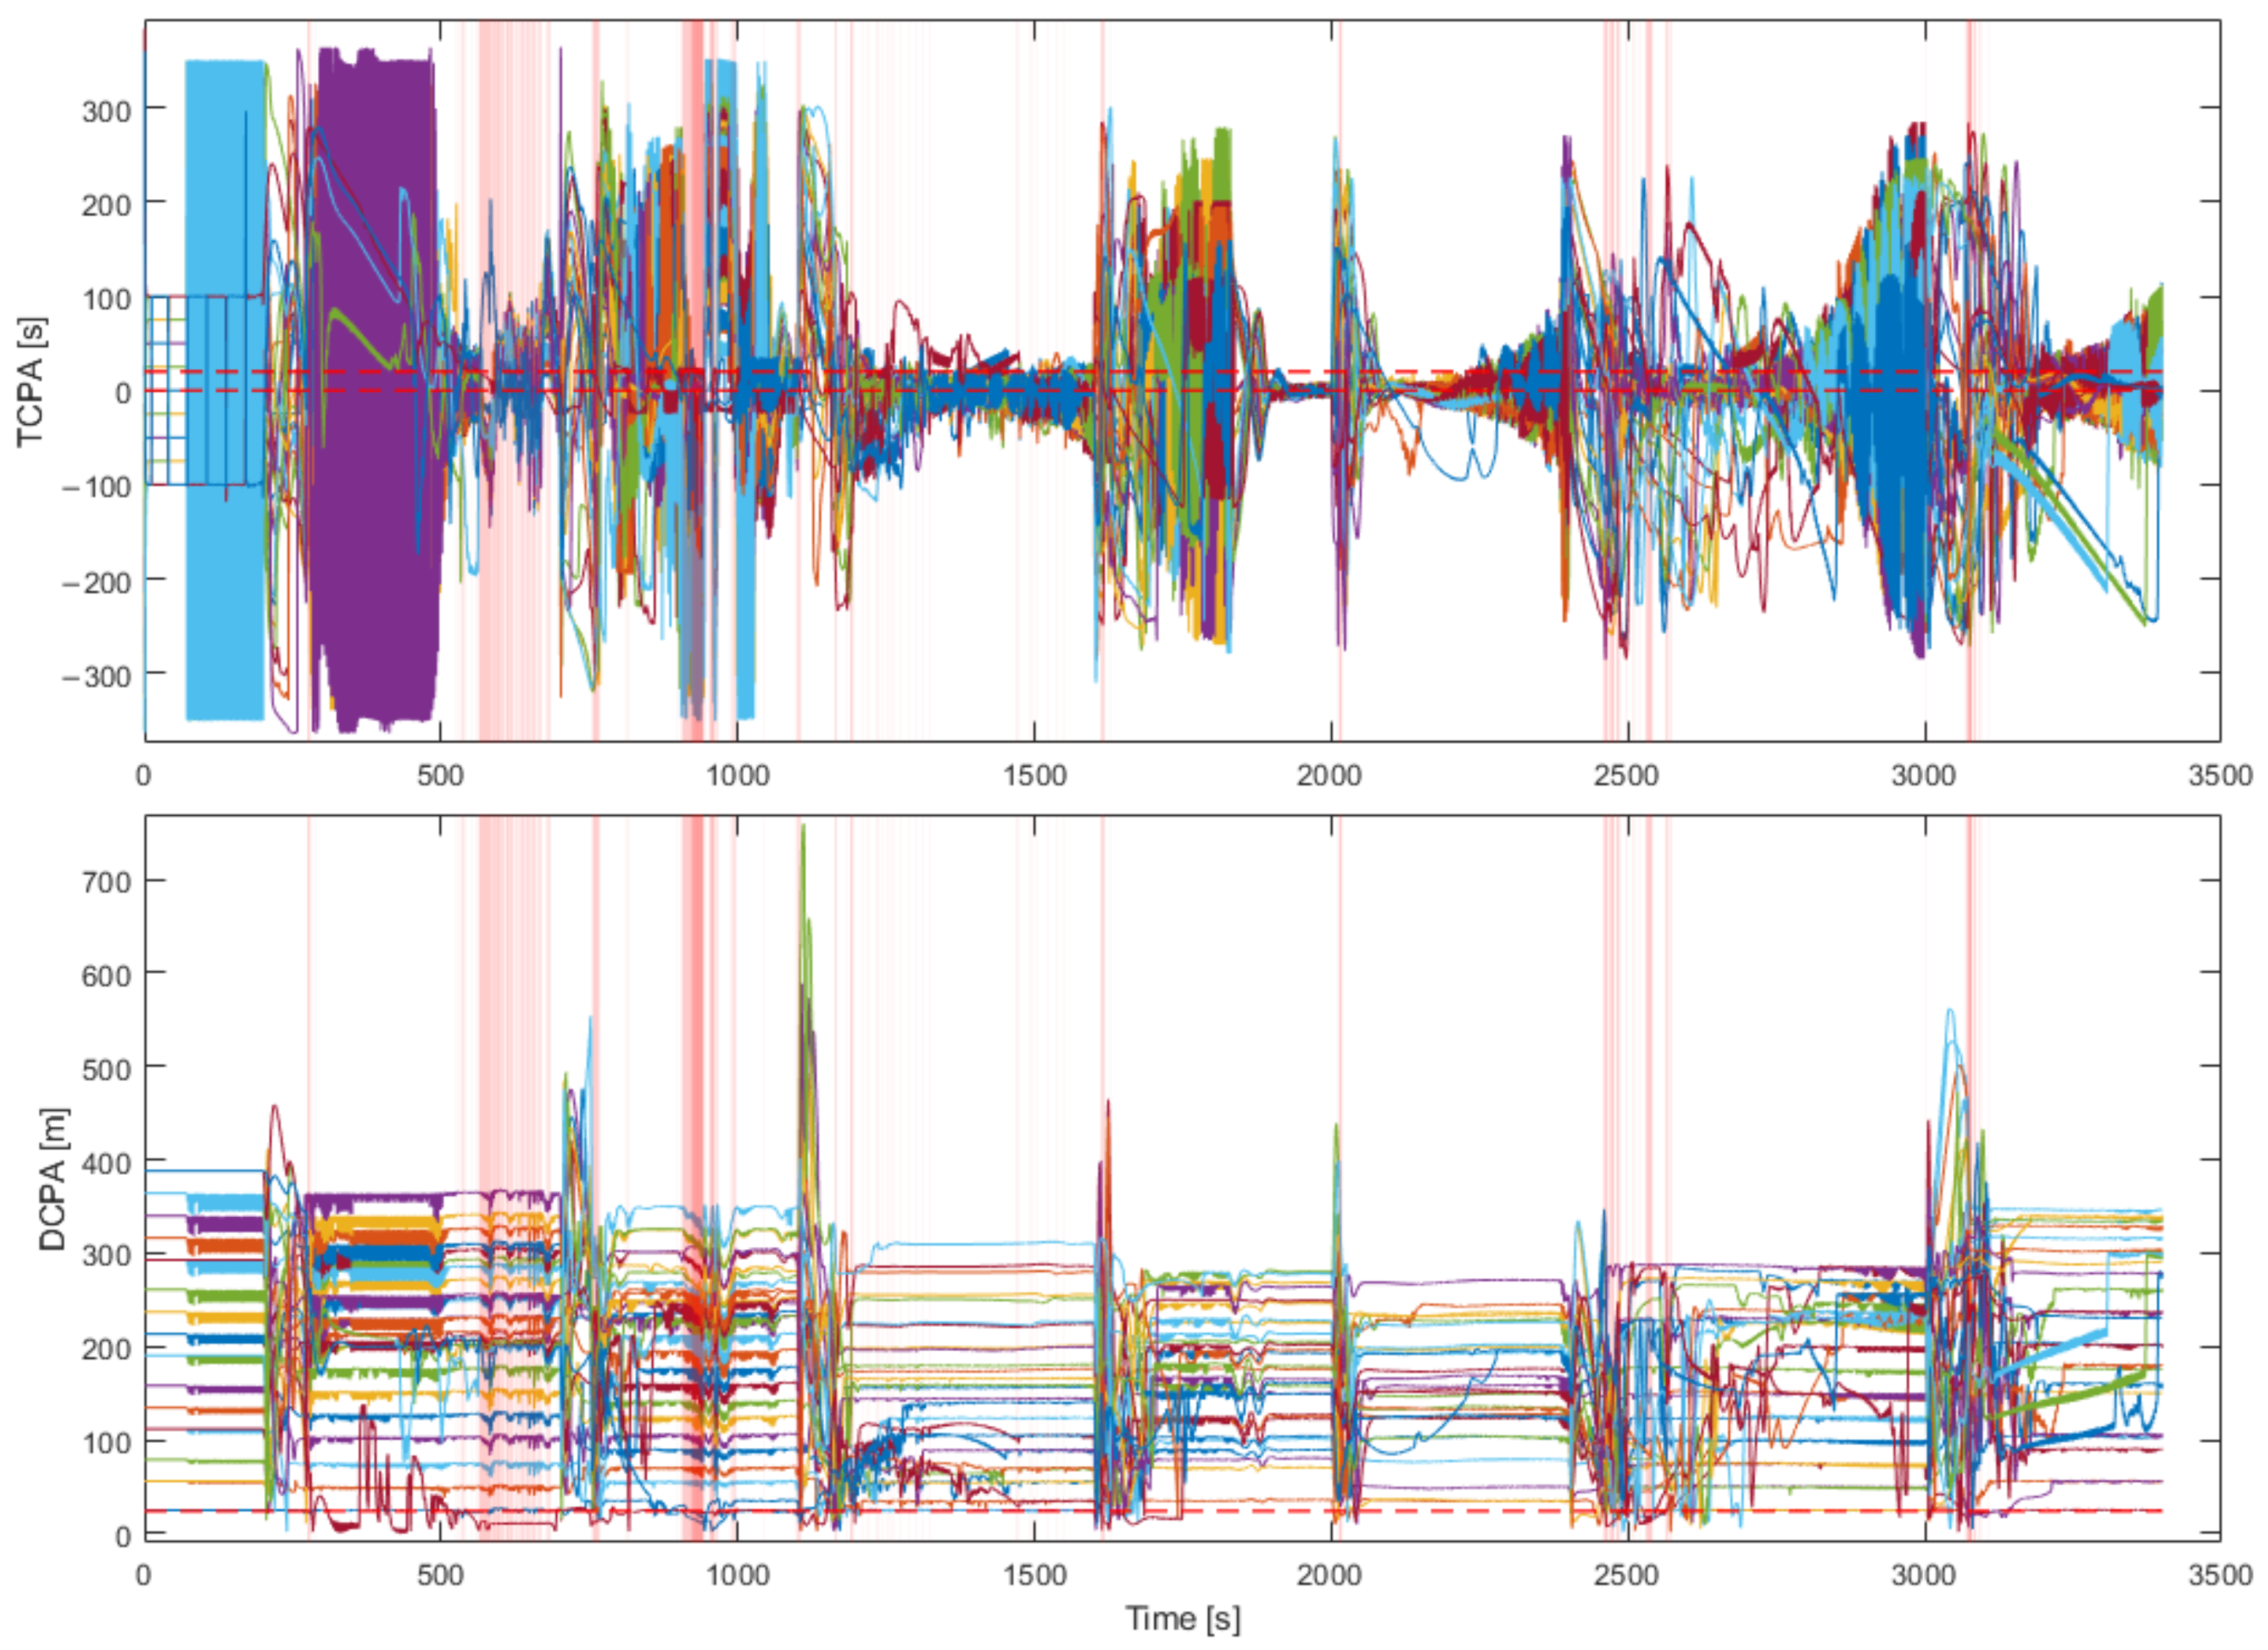
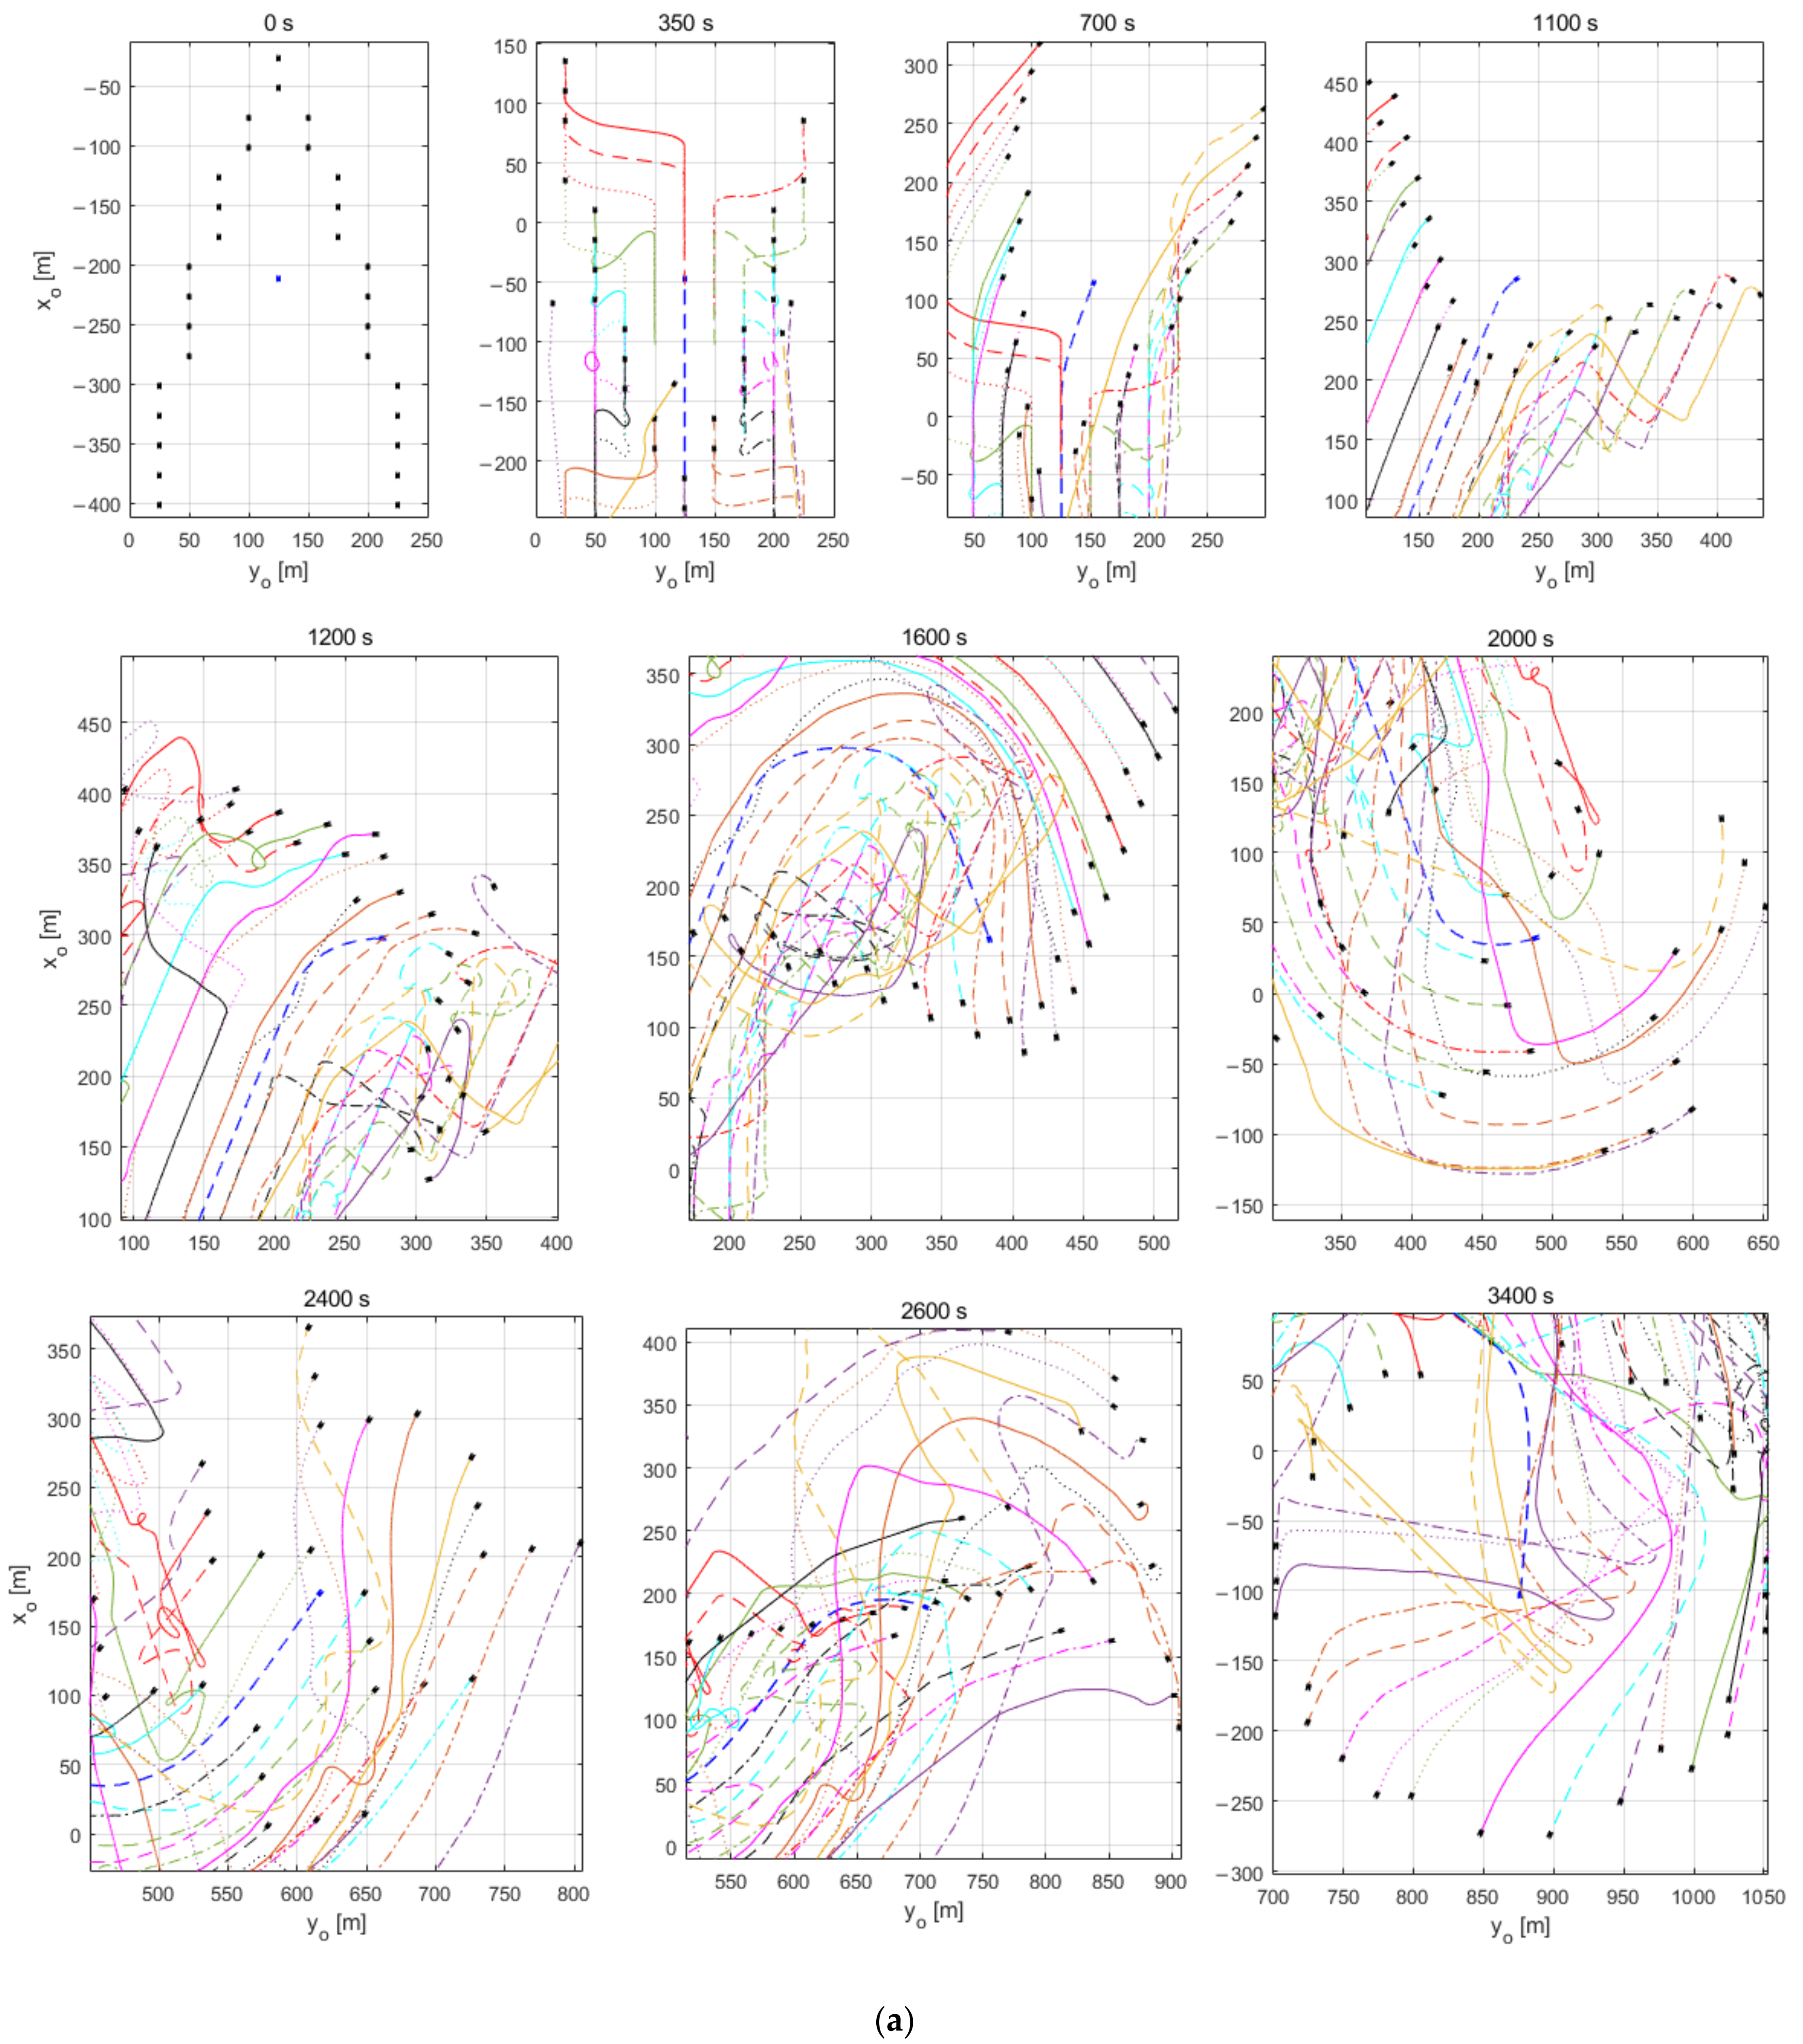
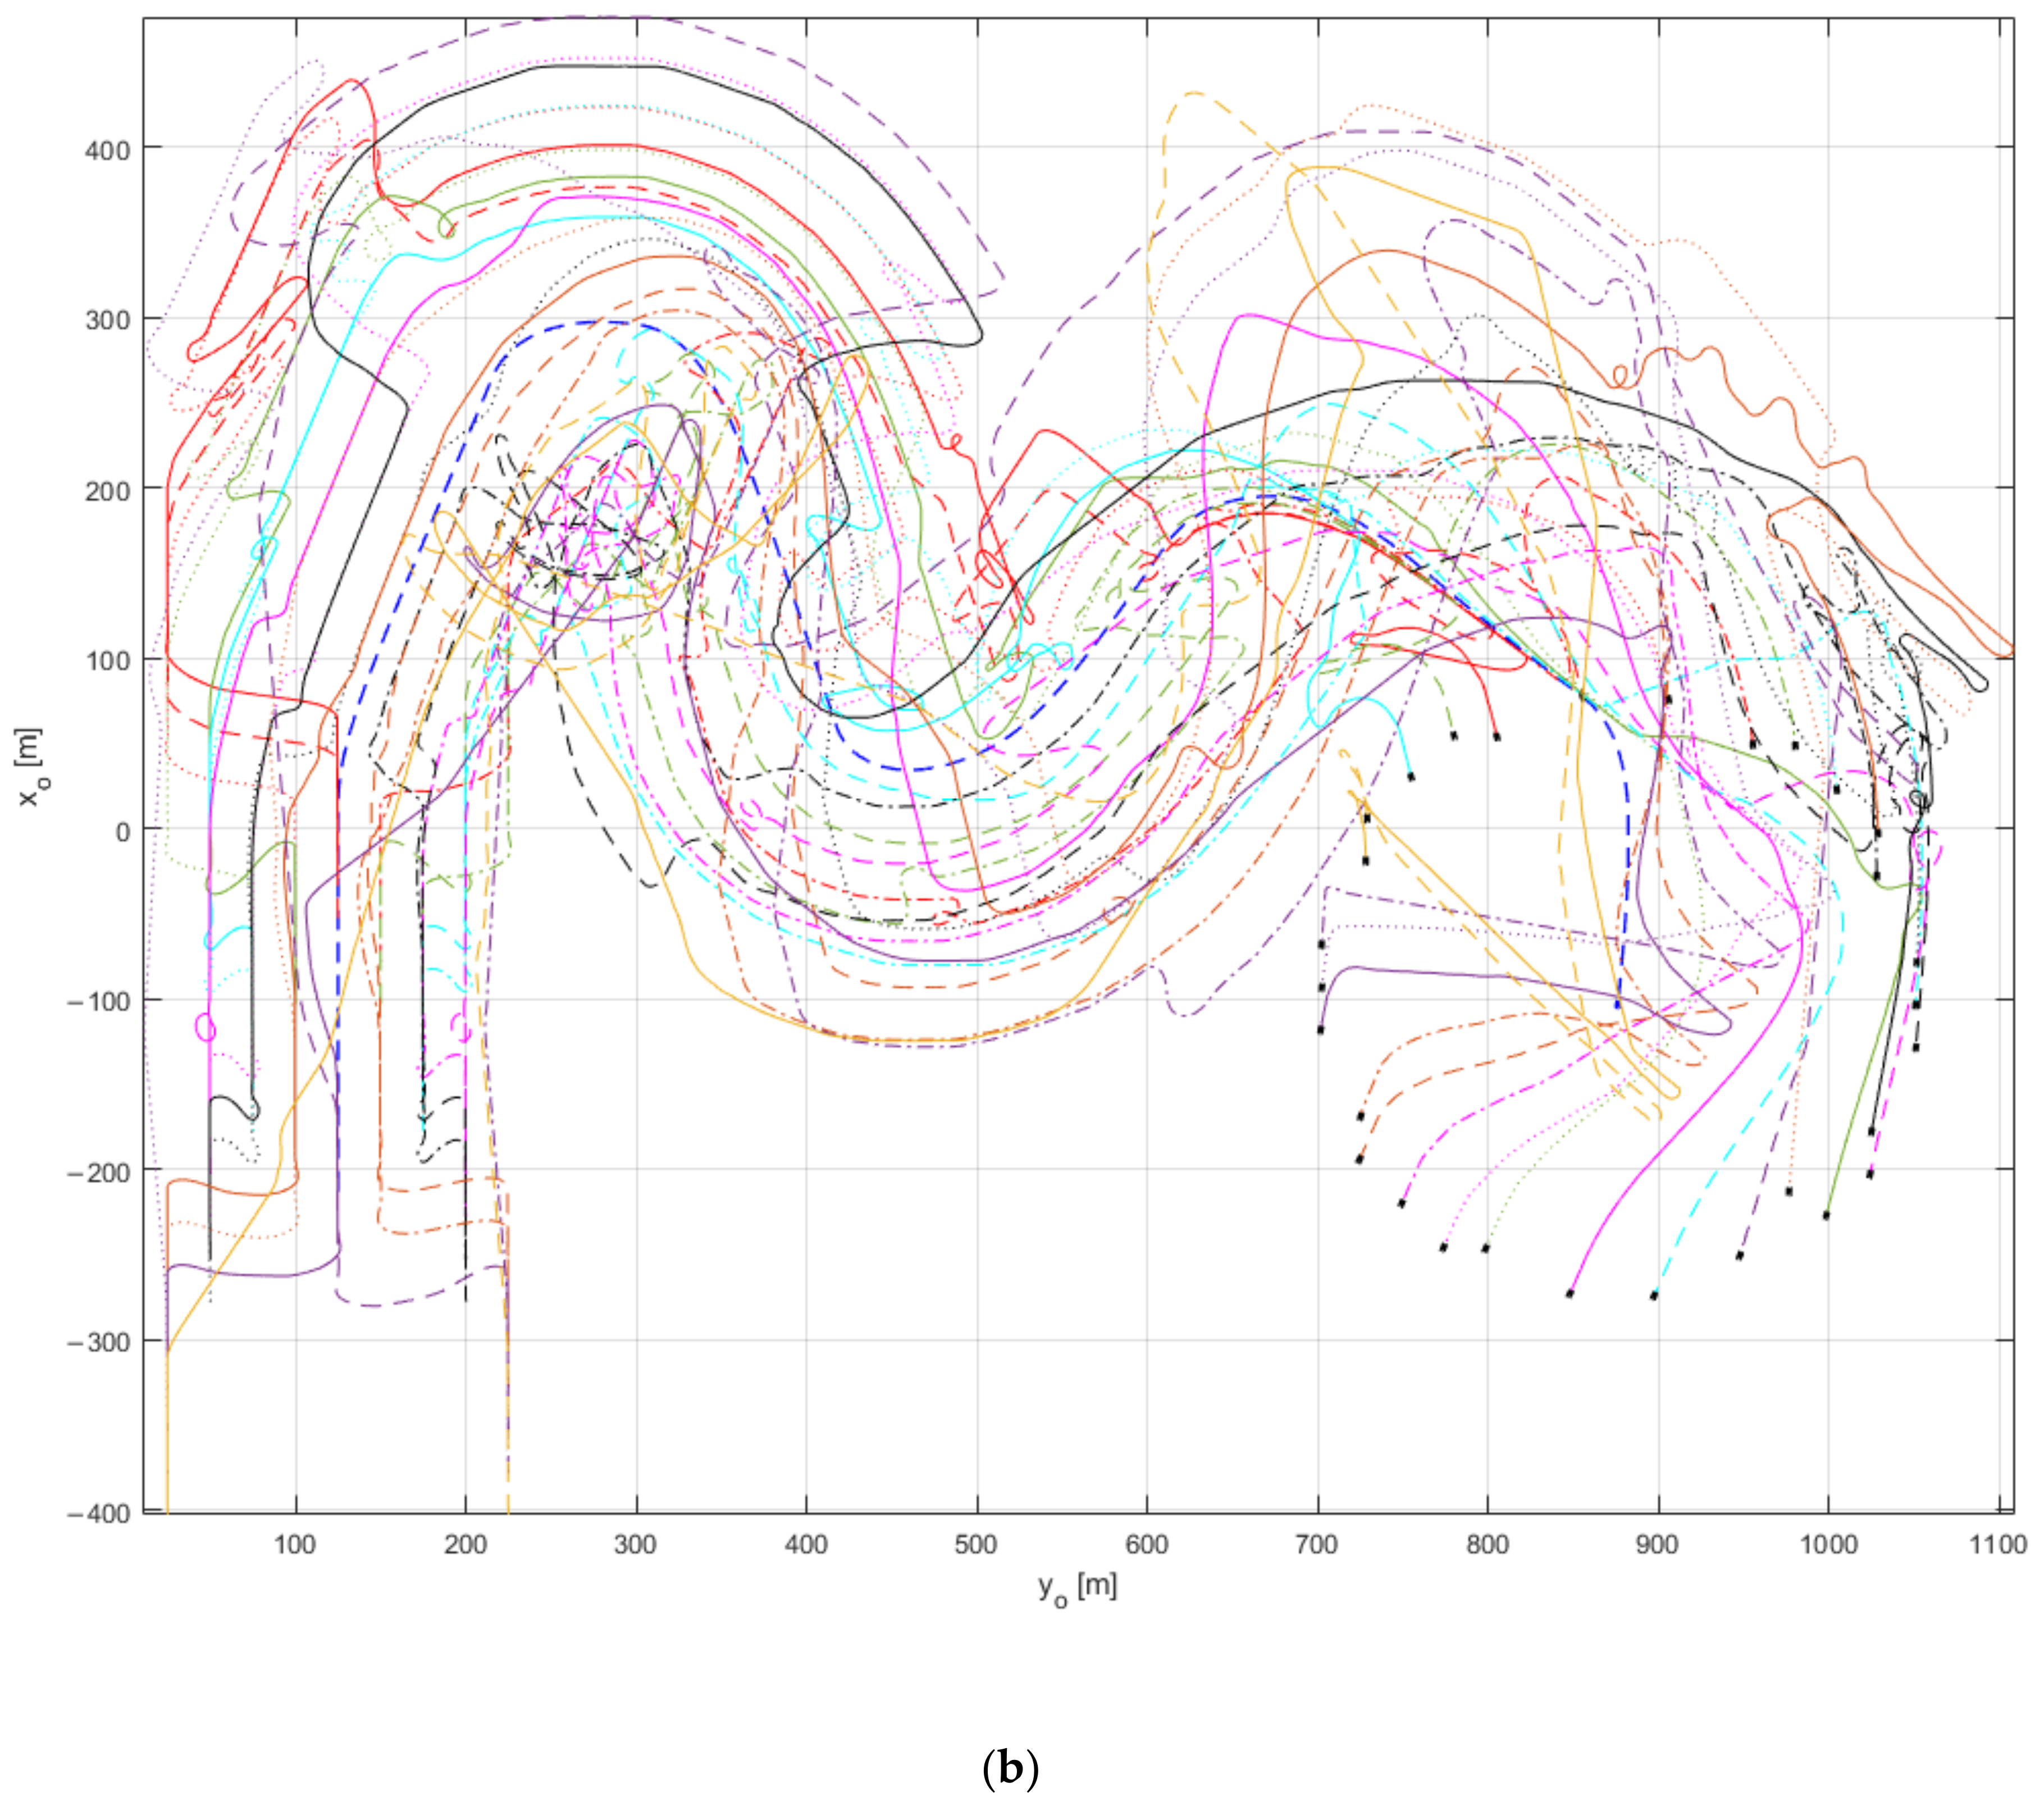
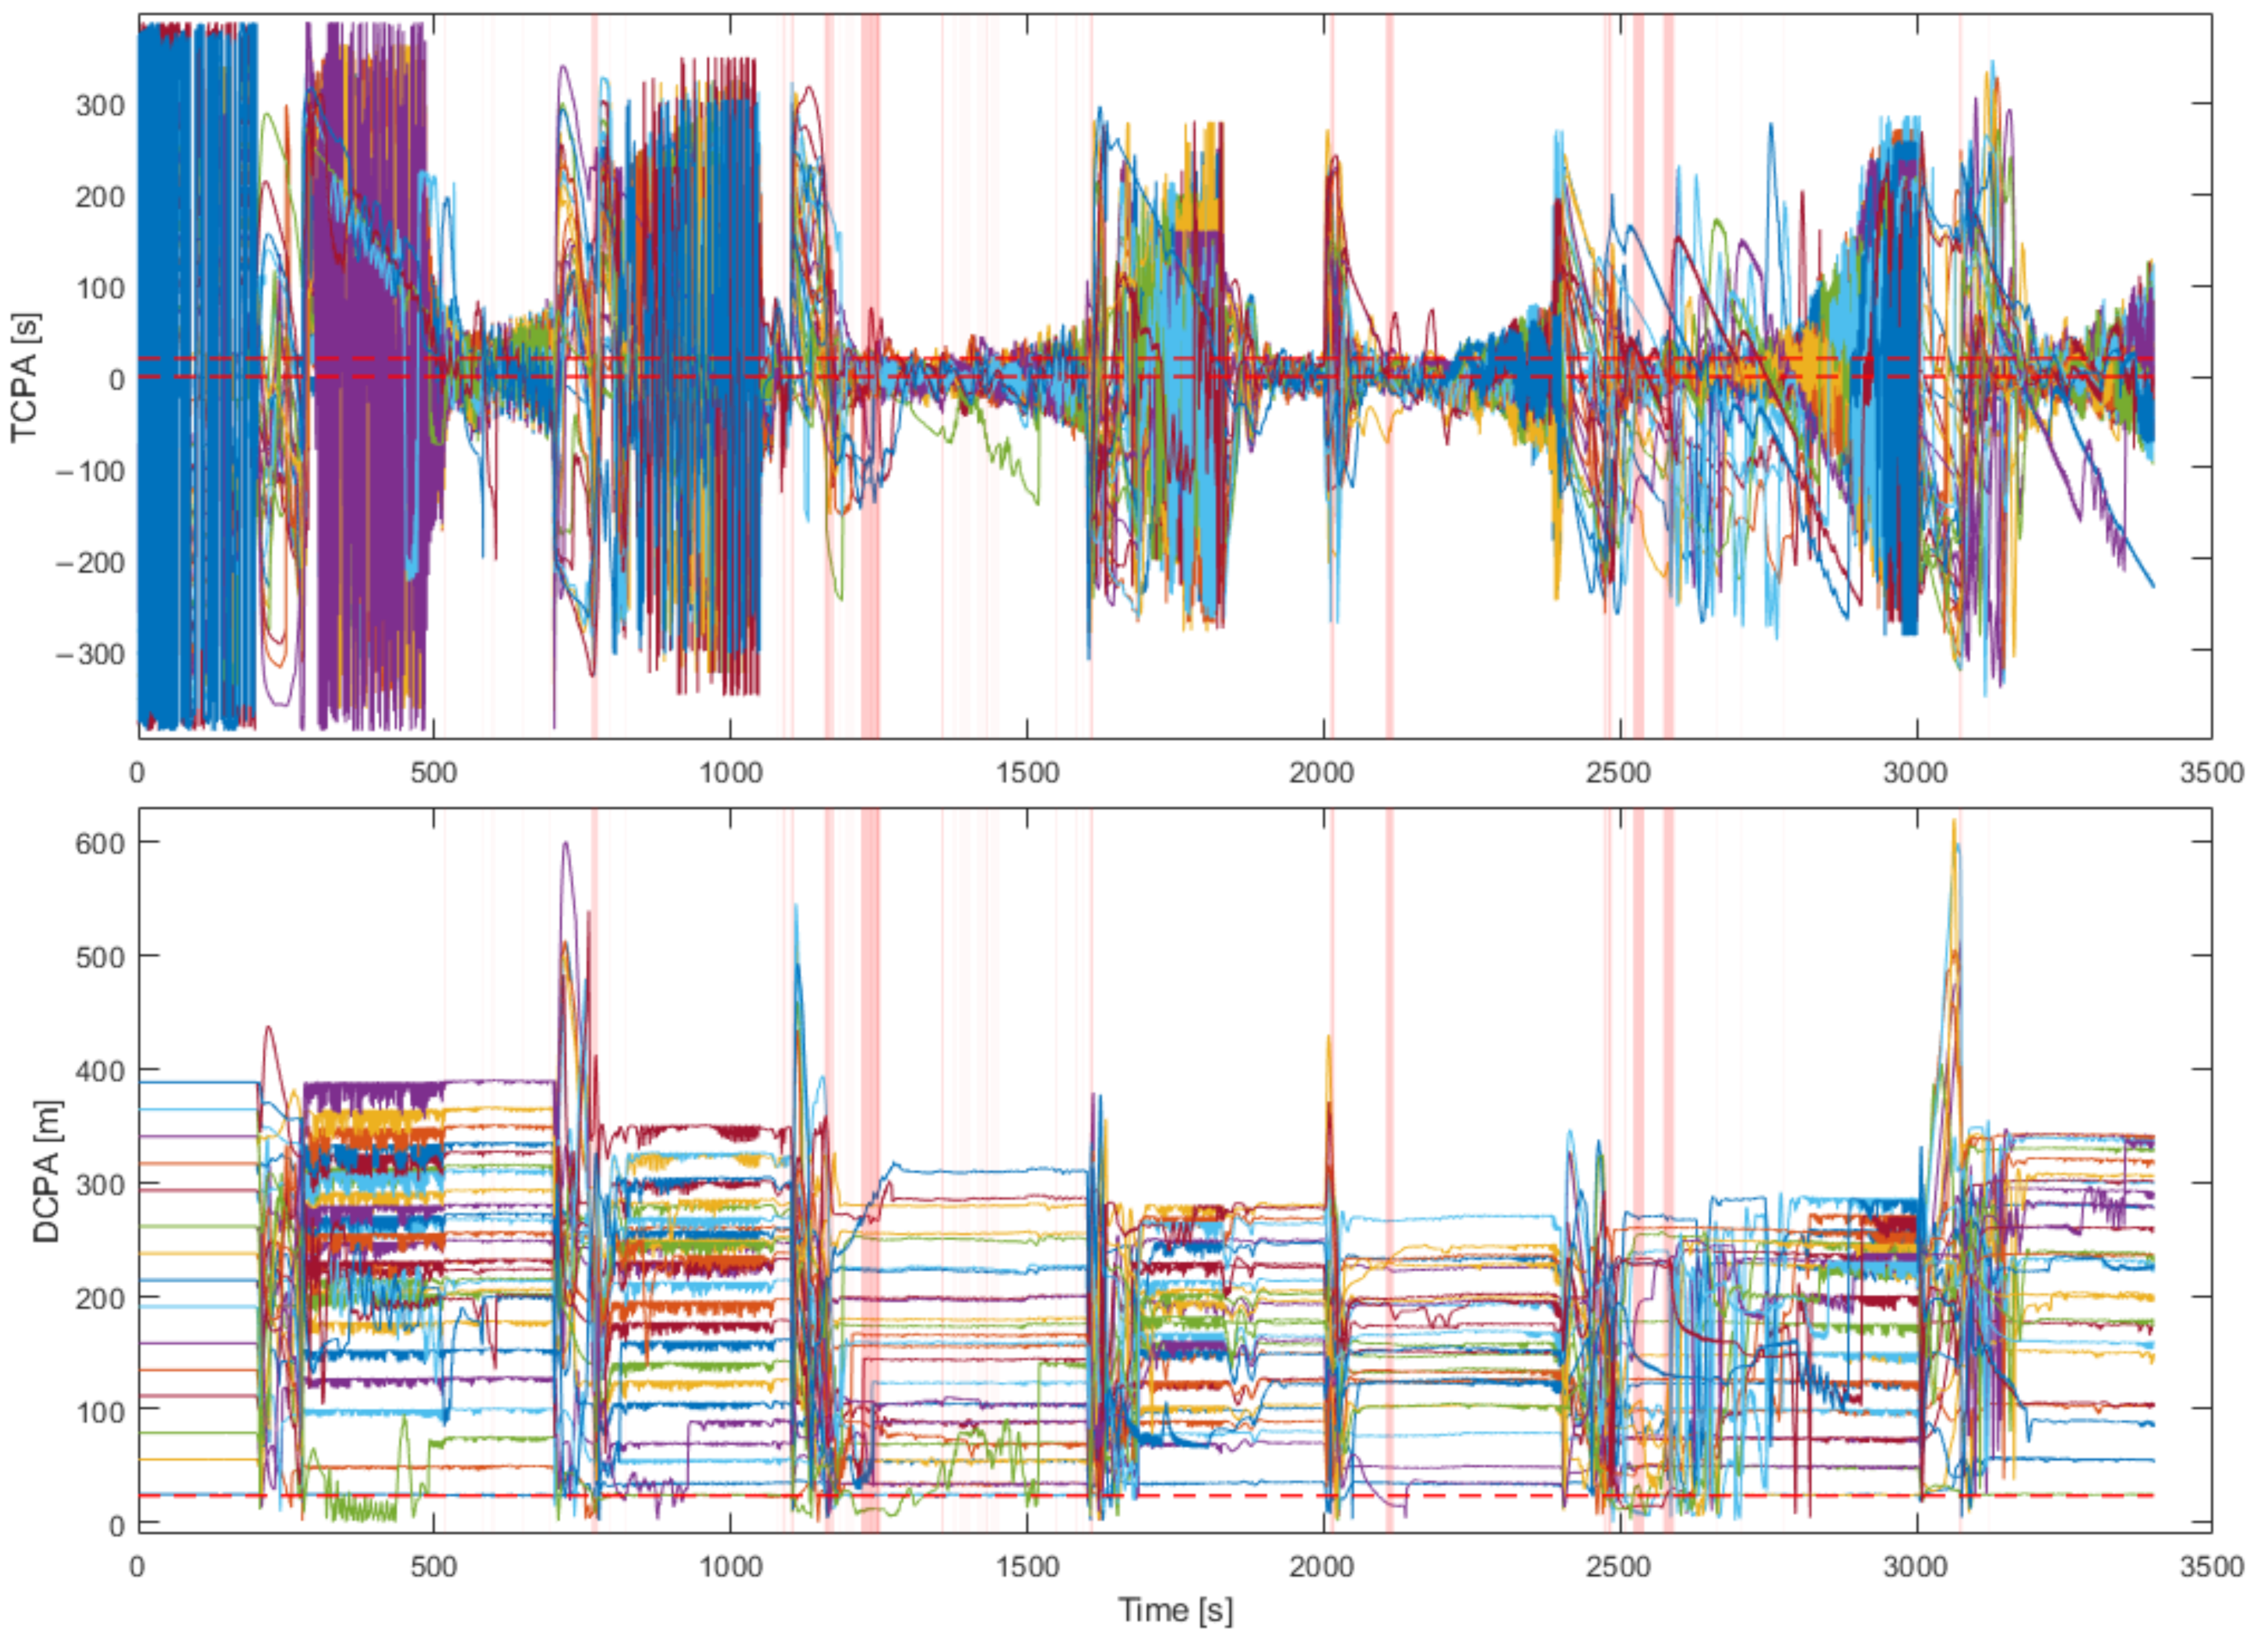
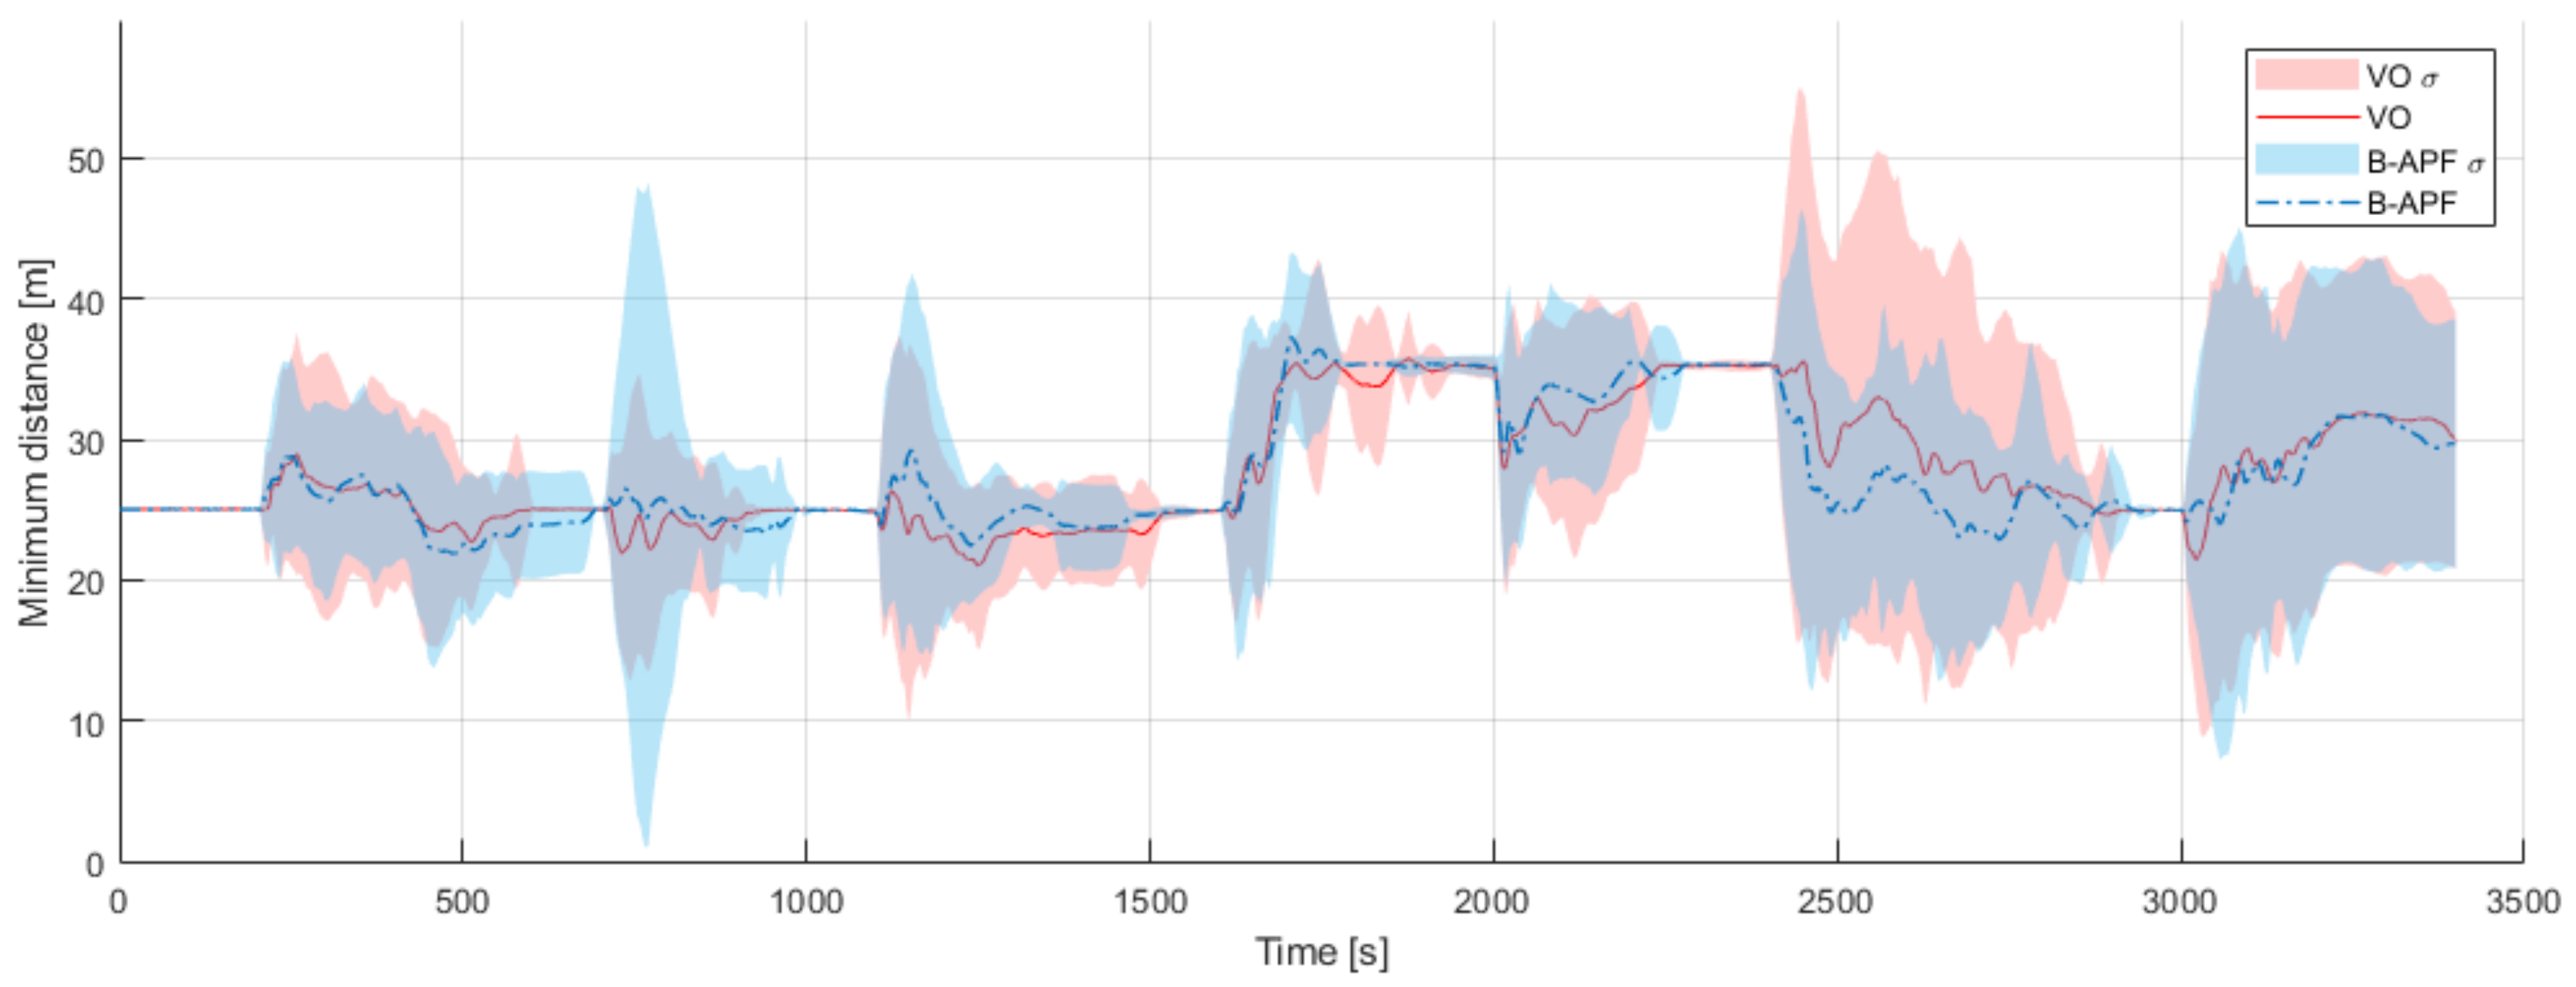
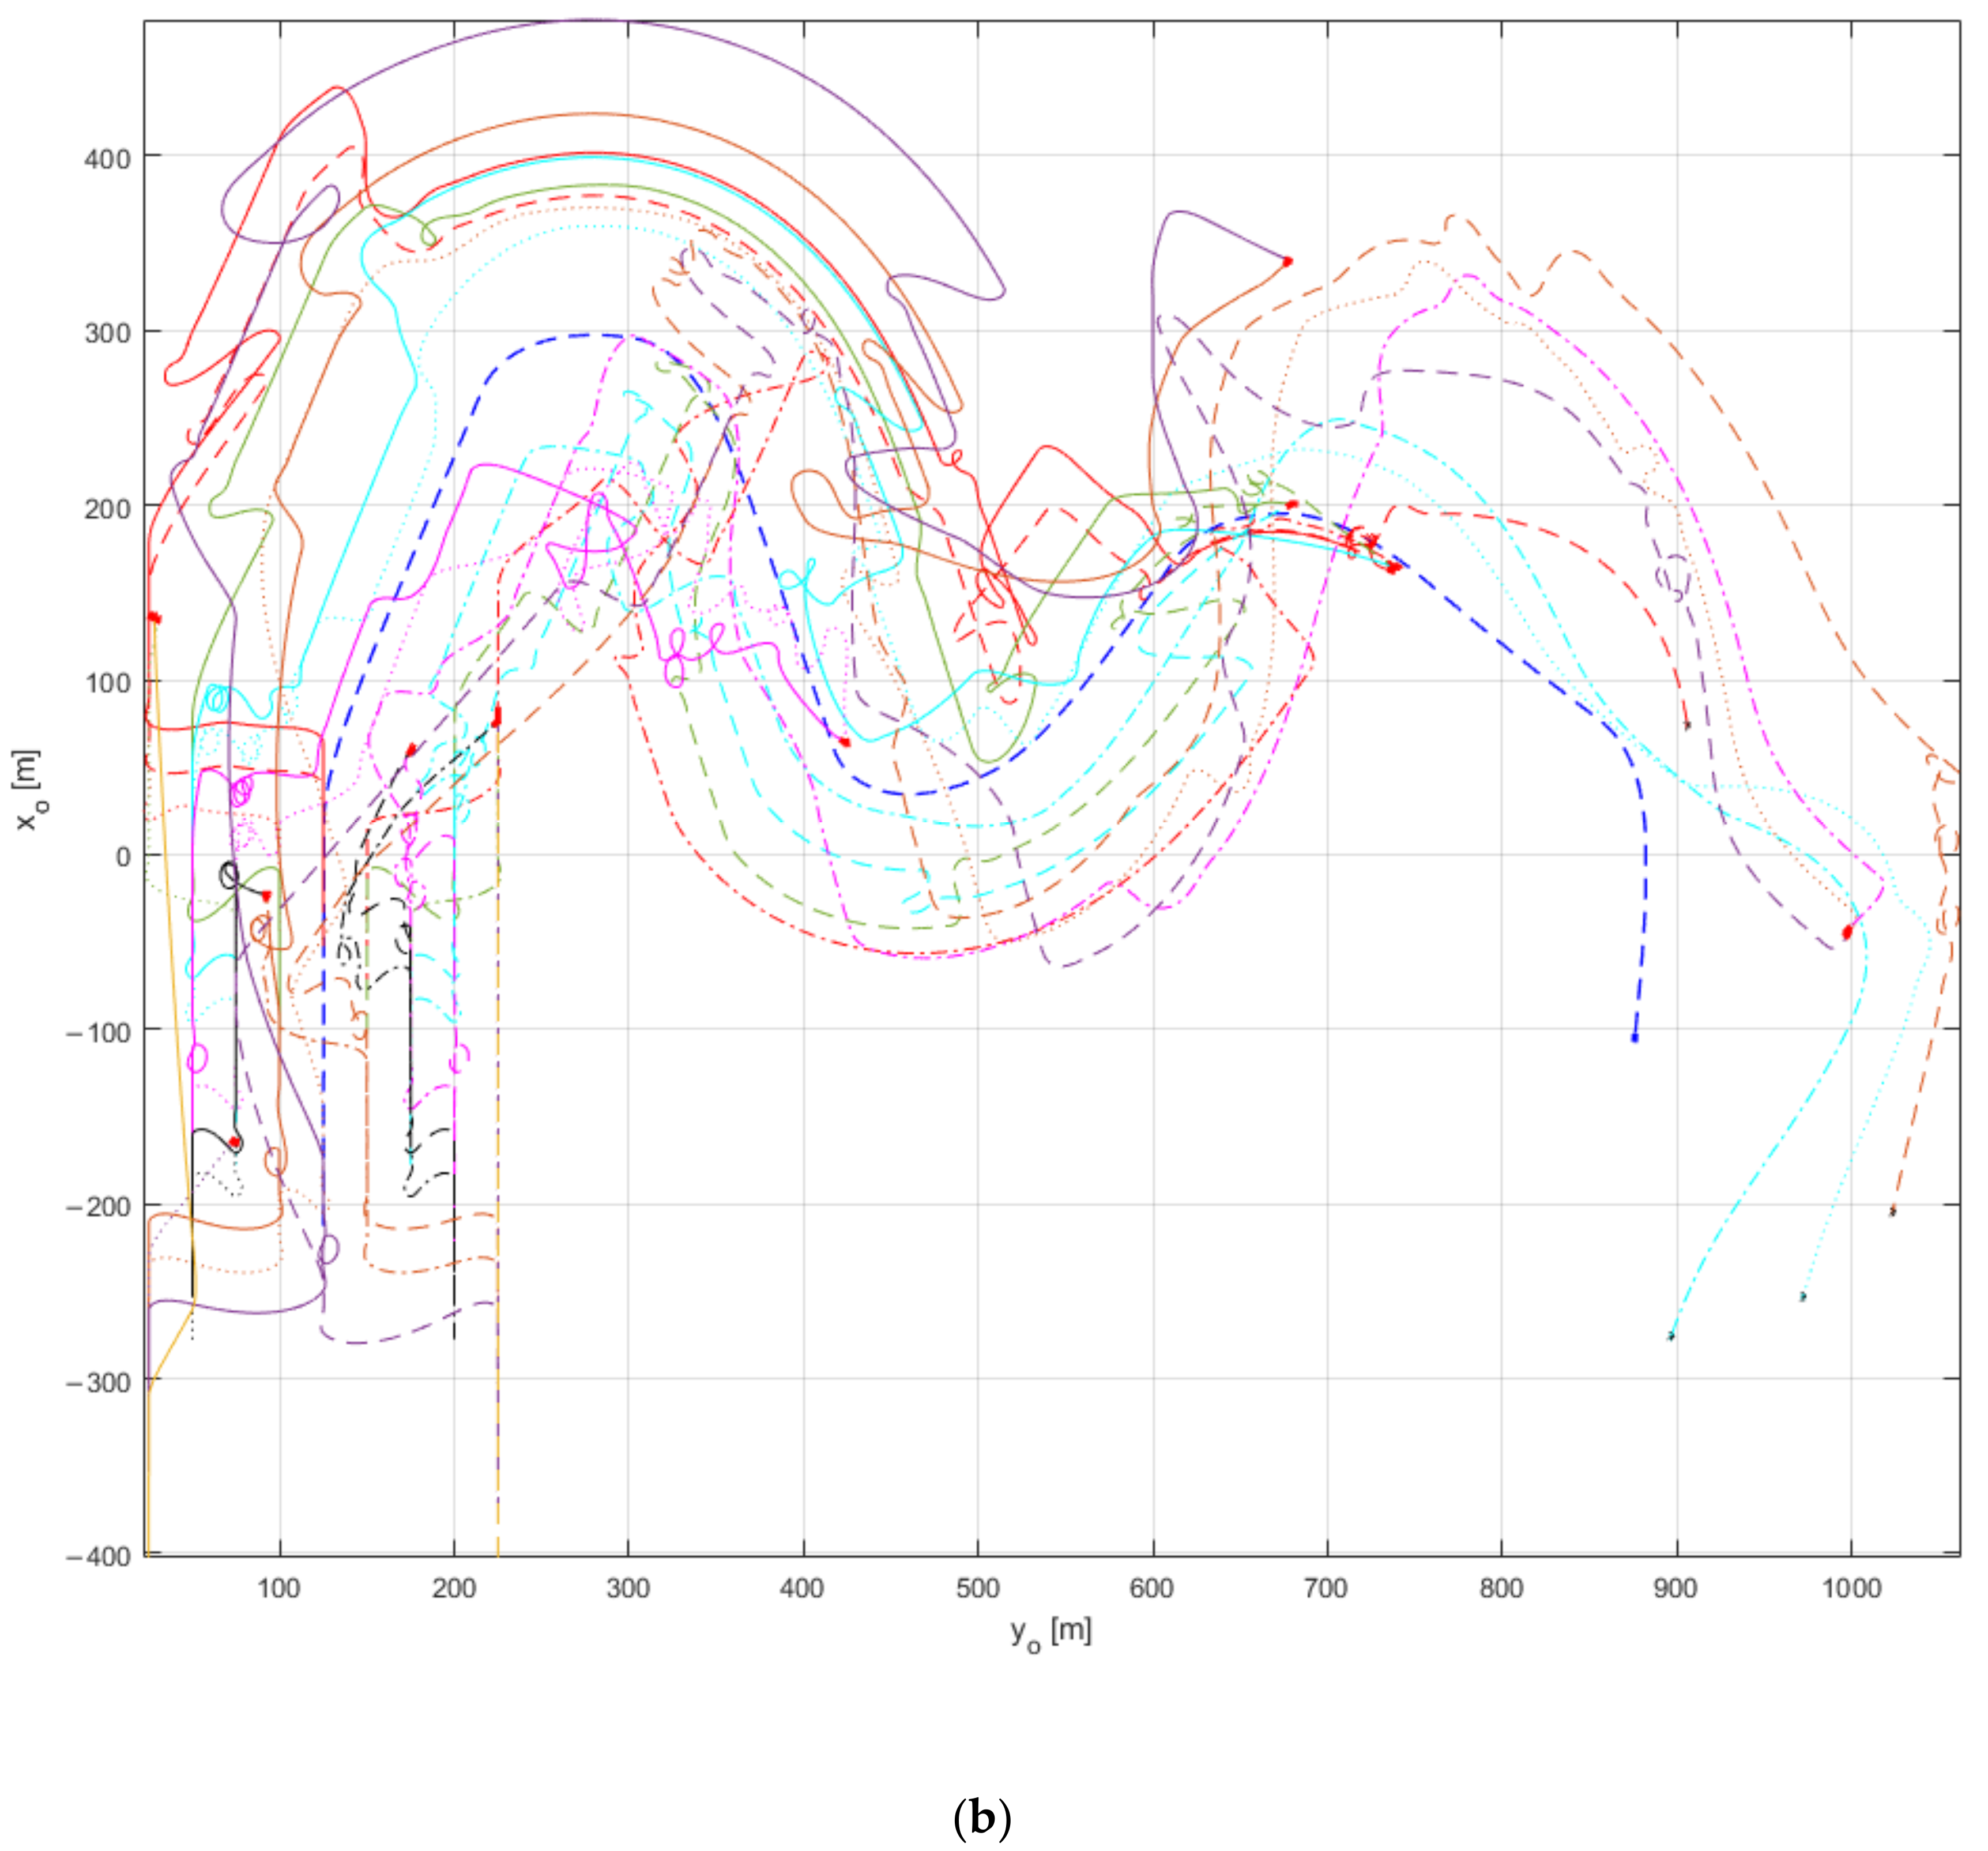
A large-scale simulation was performed in which 30 agents collided through an aggressive formation change. If the DCPAmin was less than 25 m, which was the row or column distance of the virtual matrix, the collision avoidance maneuver was performed continuously. This reduced the rigidity of the formation and created vibrations in the agent movement; therefore, the DCPAmin was set to 24 m, which was slightly smaller than the drow and dcol parameters in this scenario. Three cases were simulated: B-APF, VO, and a control group simulation in which no collision-avoidance algorithm was applied. Table 4 summarizes the simulation conditions, and the simulation conditions for each phase are summarized in Table 5. Table 6 summarizes the agent locations for each formation used in the simulation. Figure 14 shows the snapshots of the B-APF case, and Figure 15 shows a graph of the TCPA and DCPA calculated for all other agents from the perspective of agent 1. Figure 16 shows the snapshots of the VO case, and Figure 17 shows the TCPA and DCPA calculated for all other agents from the perspective of agent 1 in this case and Figure 18 shows the average minimum distance and its standard deviation for all agents as a graph according to changes in time. Figure 19 shows the snapshots of the control group case.
In Figure 15, the changes in the TCPA and DCPA of agent during the simulation1 can be confirmed. In the graph, the red background represents agent 1 making an evasive maneuver. Moreover, the darker (the more overlapped) the red background is, the more noticeably the evasive maneuver was performed when the effects of multiple agents were considered in a complex manner. The DCPA and TCPA changed immediately after the formation change command (immediately after the phase change) due to the movement of the agents. Subsequently, when agents arrived at the formation and maintained their positions, they tended to remain constant.
As in the B-APF simulation, the red part of the graph represents agent 1 performing an evasive maneuver. However, the behavior was slightly different from that in the B-APF simulation because the instruction optimization and collision-avoidance algorithms were different. The DCPA and TCPA showed the same tendency to change values immediately after the formation change command and maintain them after a certain period of time.
As mentioned previously, Figure 18 shows the average minimum distance and its standard deviation for all agents as a graph according to changes in time. When the cell given to the agent was changed with the formation change command, the deviation increased, and after completing the formation, the deviation decreased.
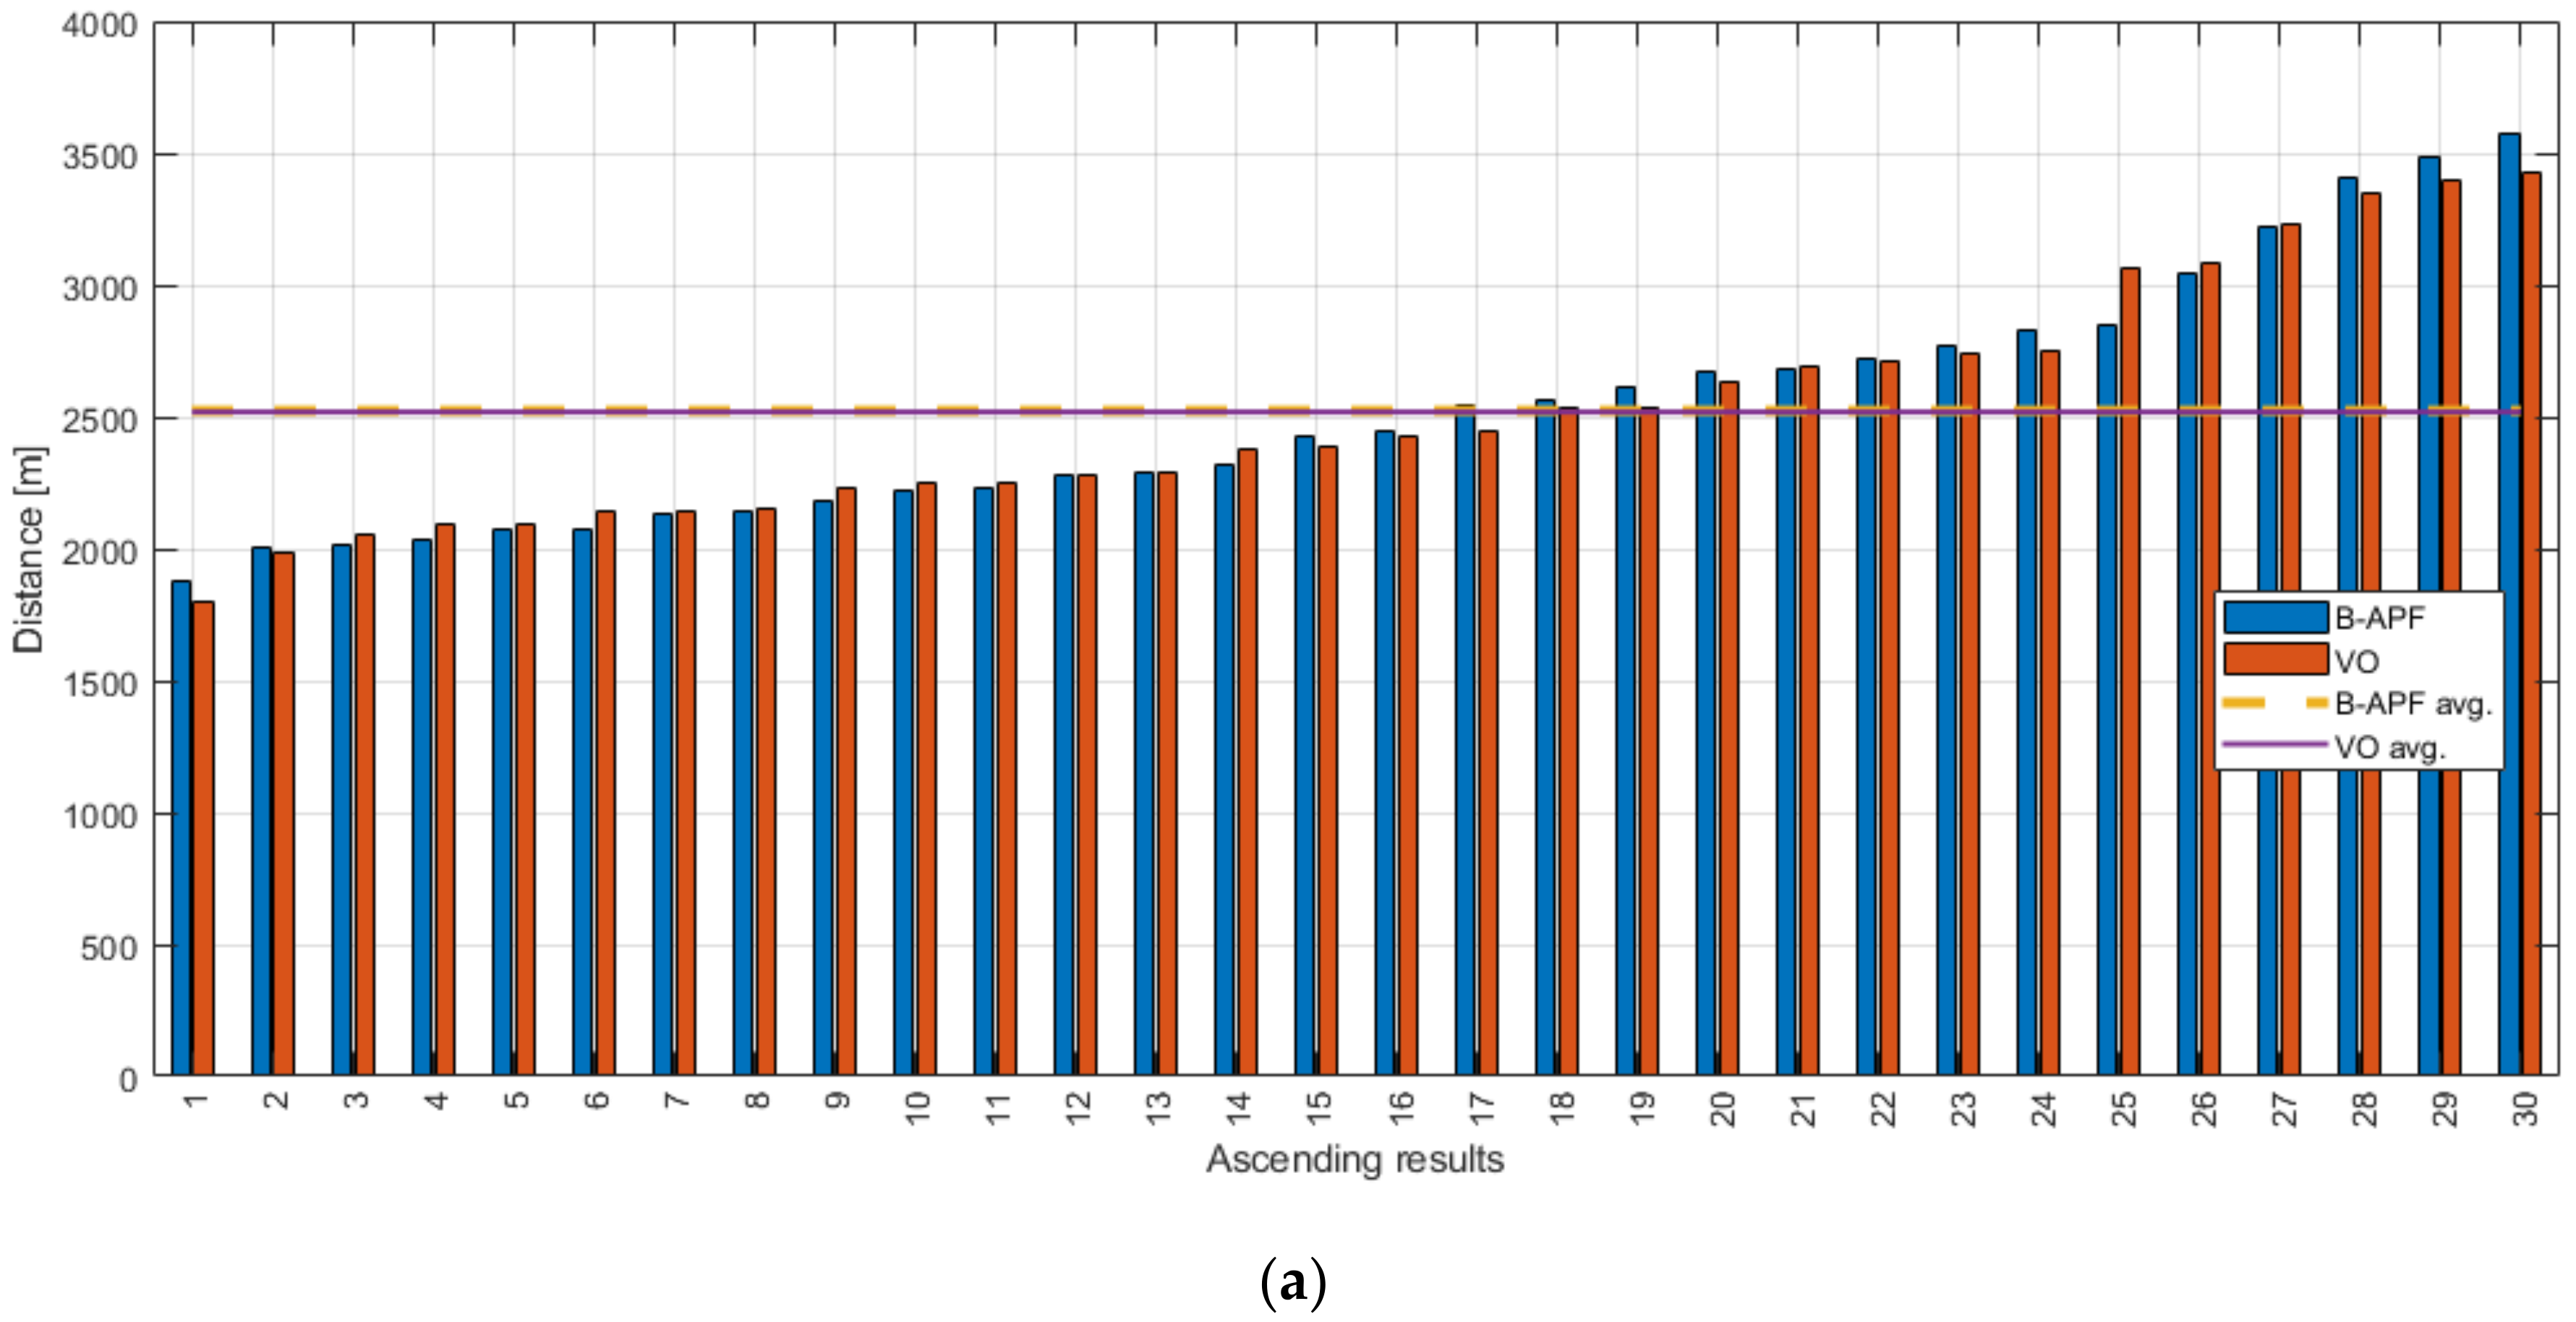
Figure 19 shows the results for the control group to which the collision-avoidance algorithm was not applied. As a result of the simulation, 26 out of 30 agents collided and only 4 operated normally. Table 7 summarizes the simulation results. An ascending comparison of the averages of the distance, waypoint error, and battery usage is shown in Figure 20.
The average distance of the agents using the B-APF was approximately 2523.16 m. Moreover, the average distance using the VO was approximately 2518.65 m, which was approximately the same, but the B-APF was 0.18% slightly larger. For the average of the ErrorWP, which means the distance to a given cell on the waypoint virtual matrix, the B-APF and VO were approximately 16.52 m and 17.37 m, respectively, indicating a smaller error in the B-APF method. The average battery usages were 9.789% and 9.615% for the B-APF and VO, respectively, indicating that the B-APF used 1.78% more battery than the VO. Finally, both the B-APF and VO algorithms verifiably avoided collisions well and firmly maintained the desired formation.
Table 8 compares the time taken to complete the formation by algorithm. In the last column, difference means the difference in the time taken between the VO and B-APF. Overall, the VO was quick to form formations. In the case of phases 4 and 5, where the VO took longer, one USV had to move to a cell farther away due to command optimization, and the rest of the USVs except for that one completed the formation faster than the B-APF.
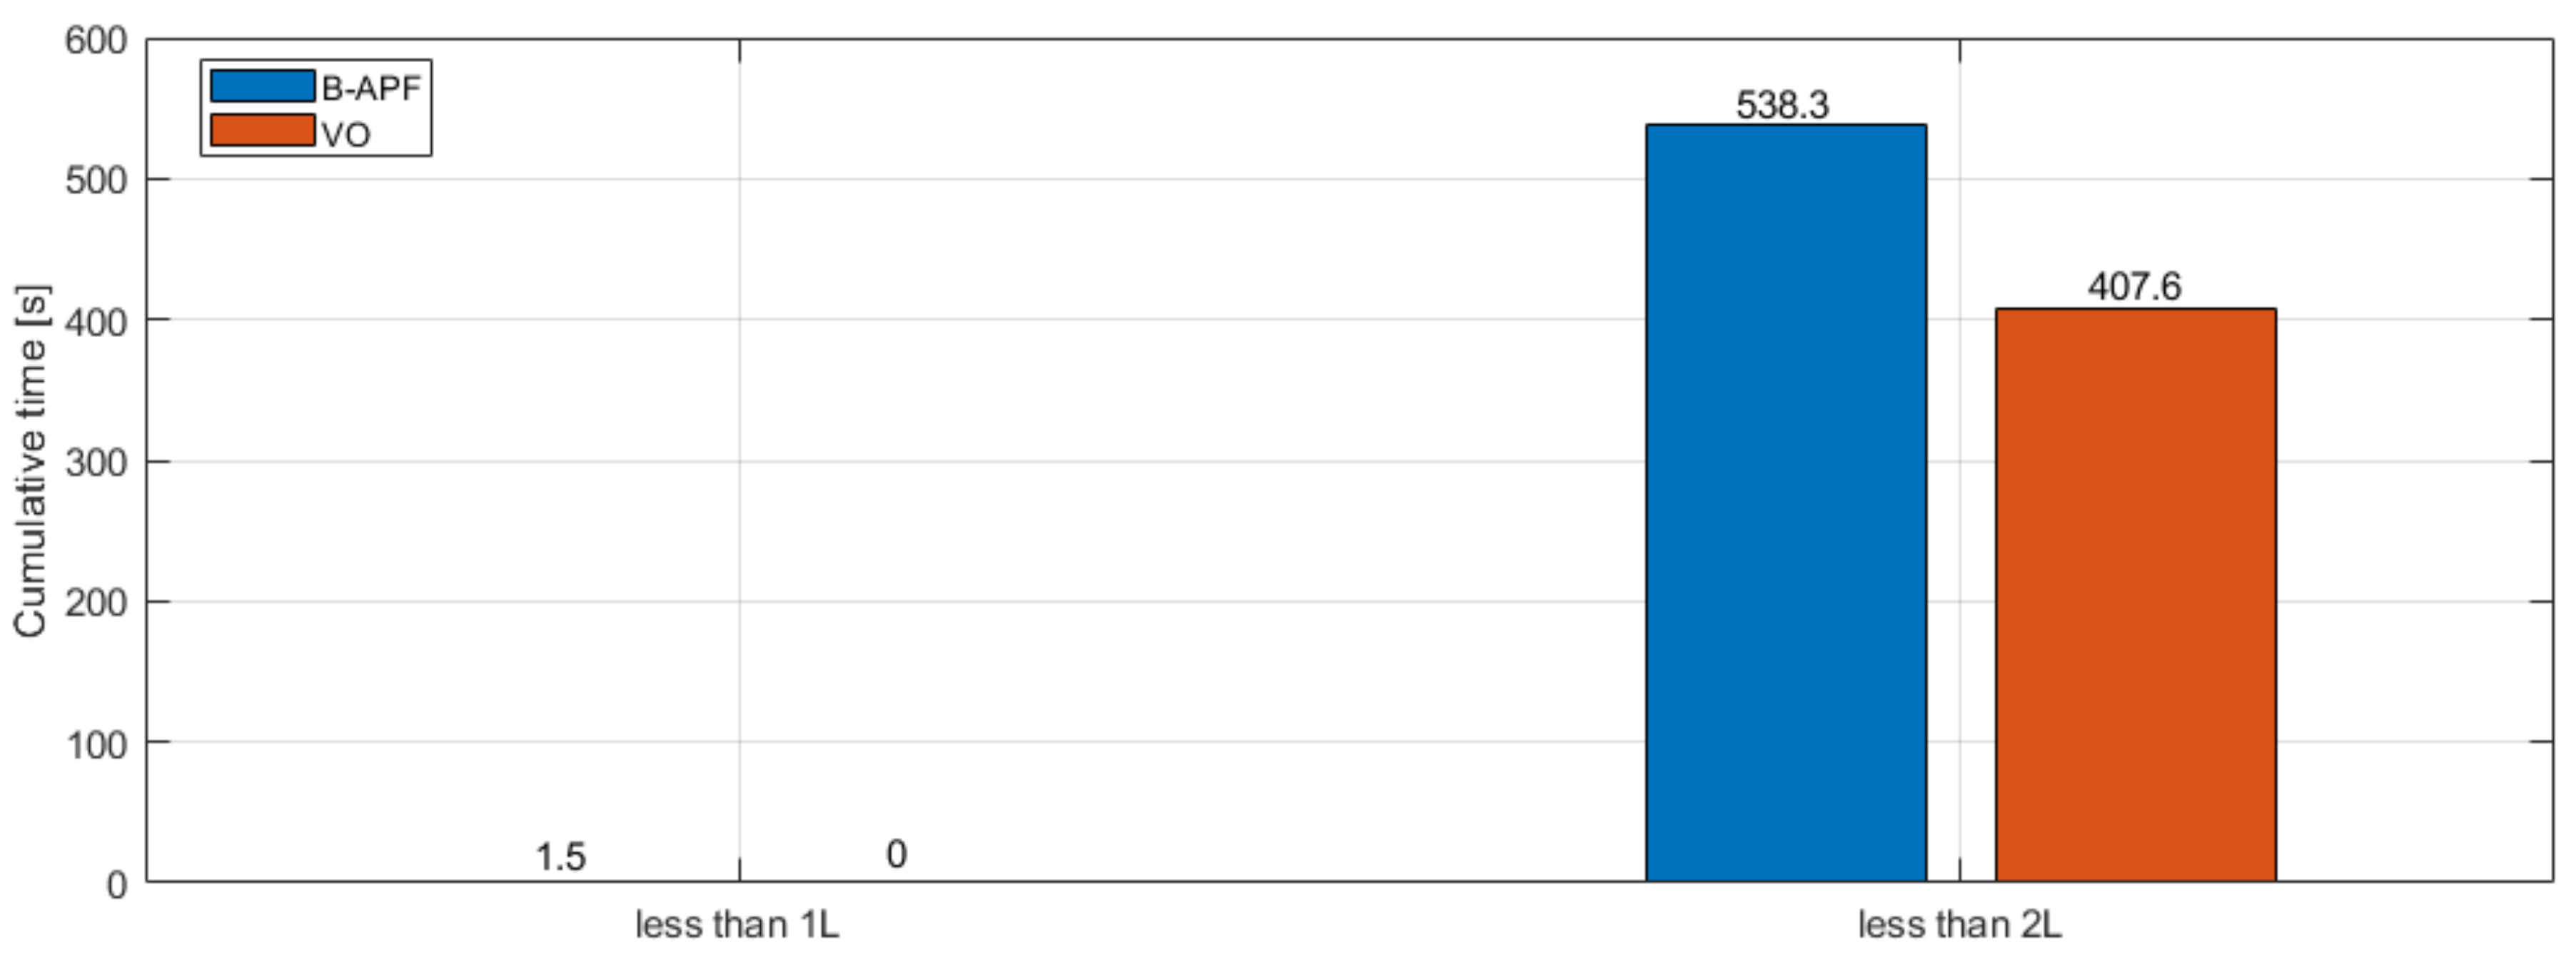
Figure 21 shows a graph of cumulative time for the situation with a minimum distance of less than 1 L and 2 L. Cumulative time indicates that 30 ships × 3400 s = 102,000 s was accumulated. When the minimum distance was less than 1 L, the cumulative times for the B-APF and VO were 1.5 s and 0 s, respectively. When the minimum distance was less than 2 L, the cumulative times for the B-APF and VO were 538.3 s and 407.6 s, respectively. Note that the B-APF approach had at least one dangerous situation close to a collision during a total of 3400 s. Even when the minimum distance was smaller than 2 L, the B-APF had more accumulated time than the VO. Through the comparison of the minimum distance accumulation time, the VO method, which considers velocity, was found to be verifiably safer than the B-APF method, which disregards velocity.

5. Conclusions

In this study, the APF and VO methods were compared as collision-avoidance algorithms that can be used during the swarm operation of USVs. The swarm operation applied the previously studied virtual matrix approach. The virtual matrix approach has the advantage of making it easy to form and change formations by simply entering a cell number into the virtual matrix to be followed by an agent. Efficient collision avoidance can only be achieved by performing collision avoidance maneuvers at an appropriate time. Therefore, the CRI was calculated using the DCPA and TCPA, which can simultaneously consider both temporal and spatial factors. In addition, the inefficient movement of agents was reduced through command optimization.
Among the collision-avoidance algorithms, the APF exhibits a problem in the symmetrical situation. To solve this problem, the use of the B-APF method, which can eliminate symmetry, was proposed. The APF and B-APF have the advantage of being intuitive and easy to implement. Moreover, they are usually used in path-planning processes and do not involve speed control. Therefore, a suitable speed controller must be designed for this purpose. However, VO has the advantage of being able to derive both the direction needed to avoid a collision and the speed to be followed by considering the velocity of the obstacle. However, it requires more computation than the APF method because both the peripheral direction and velocity must be calculated. When simulating 30 swarm operations, 26 ships collided without using the collision-avoidance algorithm. However, when the B-APF and VO were applied, collision avoidance maneuvers were performed to change and maintain the formation without collisions. There were no significant differences between the two methods when comparing the averages of the distance, waypoint error, and battery usage. However, when statistics were generated using the minimum distance accumulation, the VO approach, which considers velocity, was found to be demonstrably safer than the B-APF approach, which disregards velocity. Furthermore, the VO completed formations faster overall than the B-APF.
The limitations of this study were as follows: First, since simulation-based swarm operation and collision avoidance were performed, problems may occur when applied to a real environment. In the future, three or more USVs will be used to perform swarm operation and collision avoidance in real environments. Second, since collision avoidance within the swarm was the main objective, further investigation is required to verify the situation in which other ships or obstacles outside the swarm must be avoided, as encountered during an actual swarm operation. In a follow-up study, the proposed algorithm will be improved by including disturbance to maintain the formation and avoid obstacles outside the swarm.

Author Contributions

Conceptualization, H.-J.J.; validation, S.-R.K.; software, H.-J.J., S.-R.K. and J.-H.K.; writing—original draft preparation, H.-J.J.; investigation, J.-H.K.; visualization, H.-J.J.; supervision, J.-Y.P. All authors have read and agreed to the published version of the manuscript.

Funding

This research was supported by the (a) Korea Institute of Marine Science and Technology Promotion (KIMST) funded by the Ministry of Oceans and Fisheries (20200615, Development of Autonomous Ship Technology), the (b) ‘Autonomous Ship Technology Development Program (PNS4070, Development of evaluation and validation testbed for autonomous ship)’ funded by the Ministry of Trade, Industry & Energy (MOTIE, Korea) and the (c) Basic Science Research Program through the National Research Foundation of Korea (NRF) funded by the Ministry of Education (2022R1I1A3064596).

Institutional Review Board Statement

Not applicable.

Informed Consent Statement

Not applicable.

Conflicts of Interest

The authors declare no conflict of interest.

Appendix A

Appendix A.1. Validation of APF Method

Coefficients a and b of the APF repulsive force function were varied to determine the changes in collision avoidance maneuvers according to these coefficients, and the simulation was performed. The common simulation conditions are listed in Table A1, and the simulation results are listed in Table A2. The size of the virtual matrix was 2 × 2, and the simulation time was 100 s. Agent 1 moves from row 1, column 1, to row 2, column 2, and agent 2 moves from row 2, column 2, to row 1, column 1. The two agents cross diagonally in this simulation. The maximum control size was set to 4. The upper portion of Table A2 lists the results when coefficient b is fixed and coefficient a increases. Moreover, the lower portion lists the simulation results when coefficient a is fixed and coefficient b increases.
Table A1. Conditions for APF simulation.
ParameterValue
Simulation time100 s
Max. control size4
Virtual matrix size2 × 2
Number of agents2
Table A2. Simulation results according to coefficients a and b.
CoefficientMinimum Distance (m)Distance (m)ErrorWP (m)Battery Usage (%)
abAgent 1Agent 2Agent 1Agent 2Agent 1Agent 2
26/643.4640.5459.529.8417.390.0870.168
36/643.9340.8660.259.8617.540.0880.171
46/644.3141.1260.779.8917.660.0890.173
56/644.6441.3661.149.9117.750.0900.175
66/644.9041.5461.499.9417.820.0910.177
76/645.1241.6361.659.9617.880.0910.177
86/645.3041.6961.709.9717.920.0910.178
96/645.4541.7861.859.9917.950.0920.178
106/645.5741.8161.8810.0017.970.0920.178
21/647.1040.7461.4710.6919.340.0860.175
22/645.5341.0661.3610.1618.330.0880.176
23/644.6840.9260.779.9917.890.0880.174
24/644.1340.7560.359.9117.660.0880.172
25/643.7540.6659.949.8617.490.0870.170
26/643.4640.5459.529.8417.390.0870.168
27/643.2340.4659.279.8317.310.0870.167
28/643.0440.4259.049.8317.260.0870.165
The minimum distance is the distance between the two agents in the simulation. Distance is the moving distance of each agent, and ErrorWP is the average distance to the cell; i.e., the waypoint provided to each agent. Battery usage refers to the percentage of battery used during the simulation, which was calculated by referring to Woo et al., (2018), where the authors state, “The maximum speed that can be operated is about 5 knots, and it can be operated for about 3 h when operating at 3 knots”. Figure A1 shows a snapshot of the simulation for one case.
Figure A1. APF simulation snapshots at 0, 15, 22, and 35 s.
Jmse 10 02036 g0a1
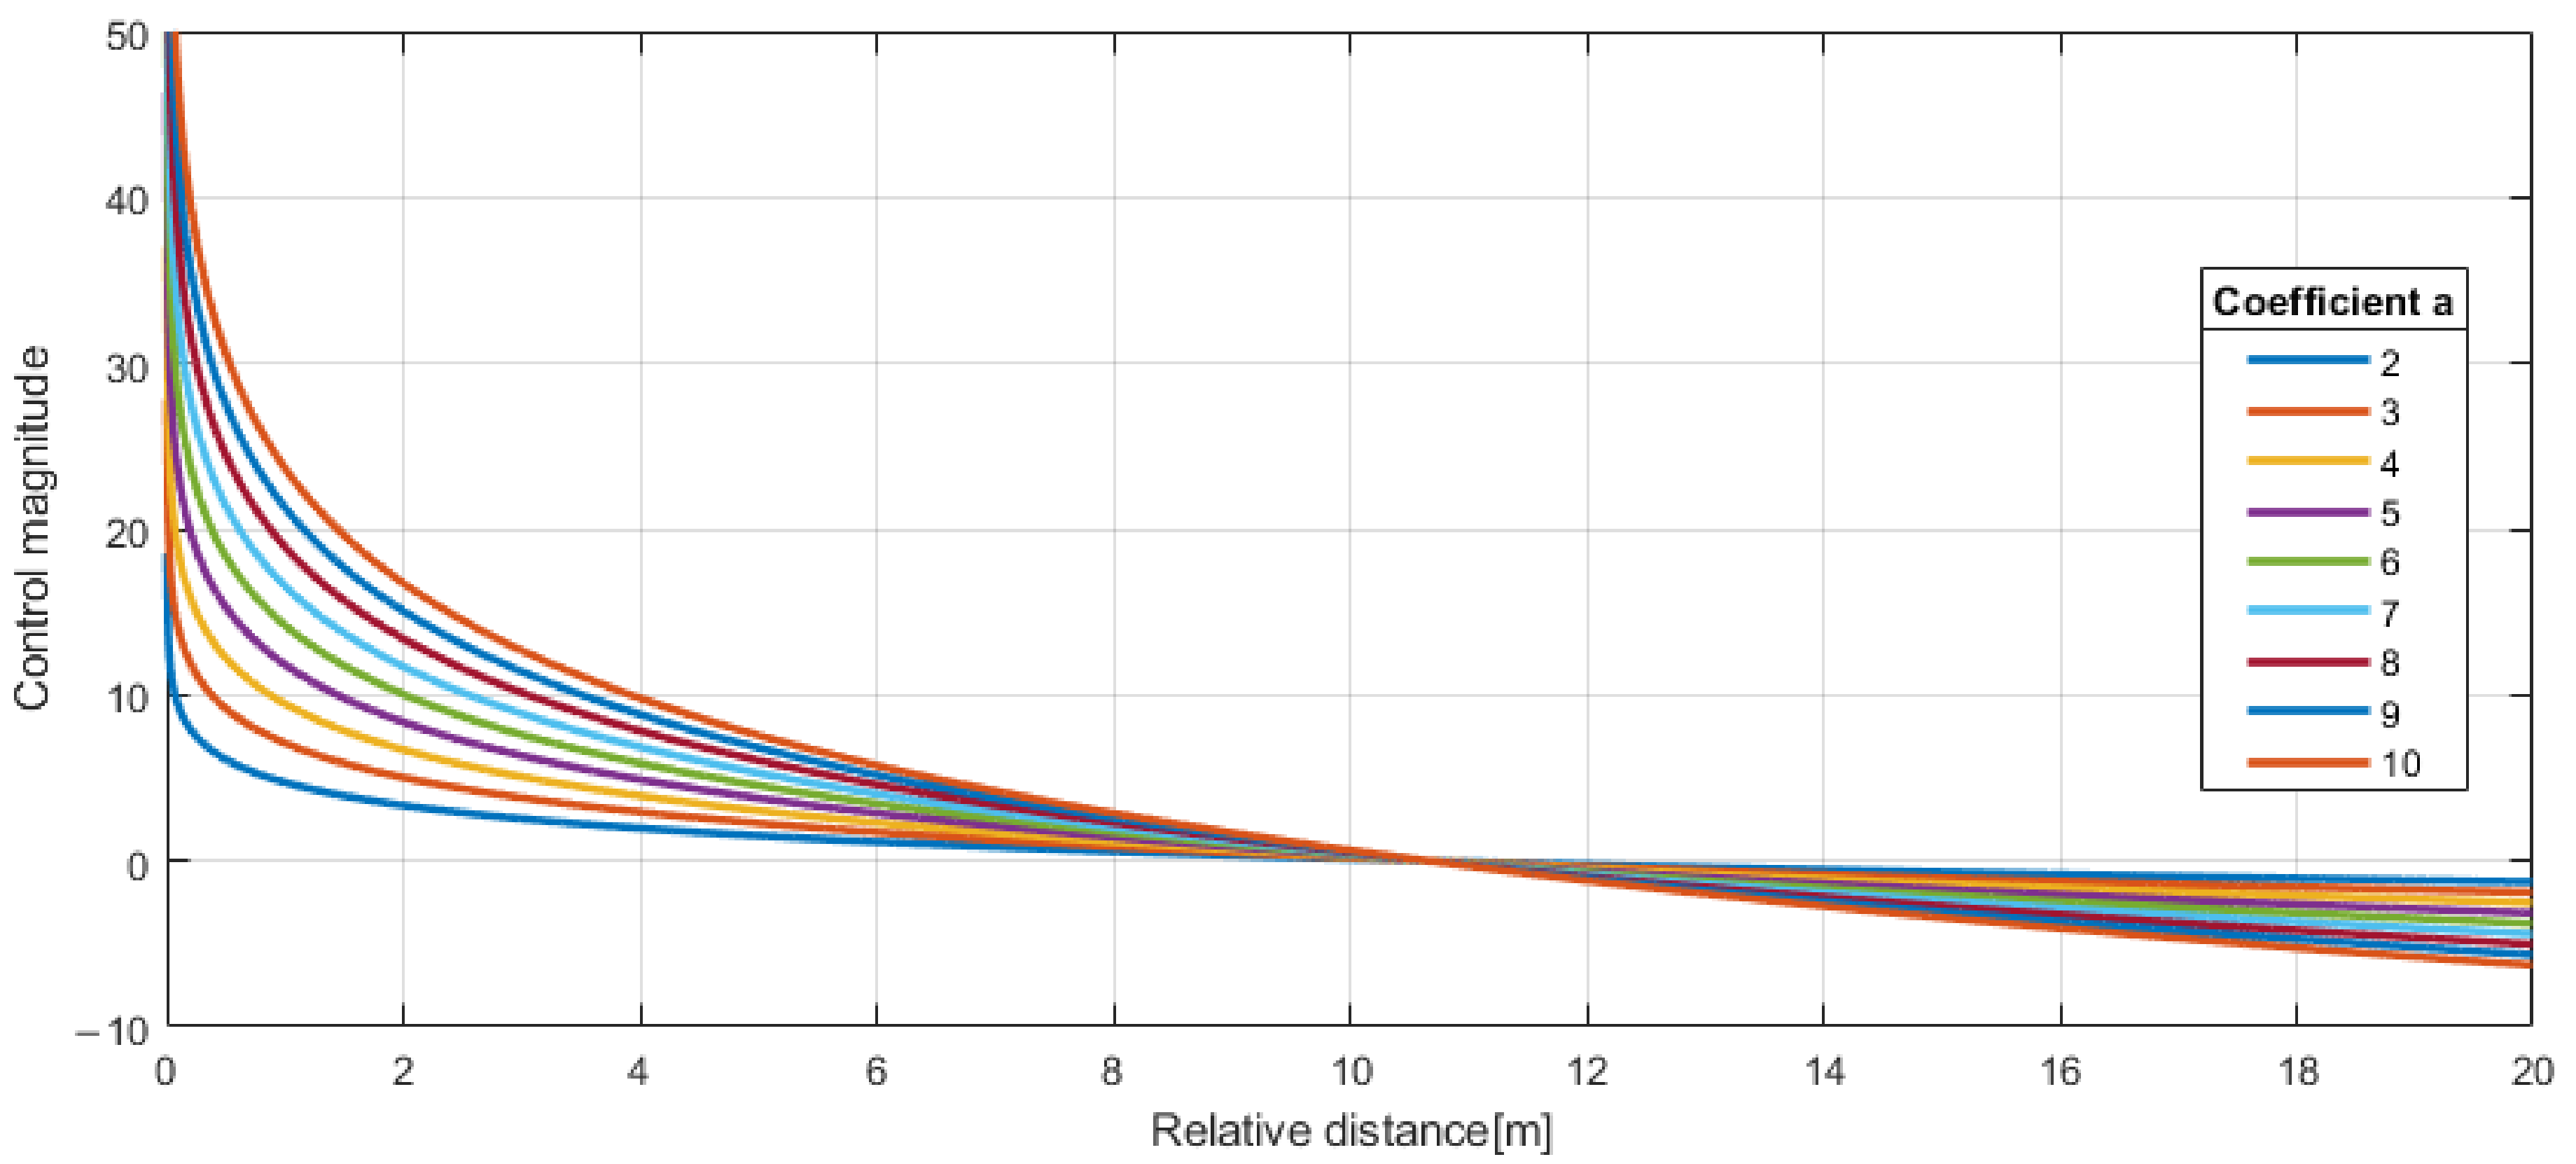
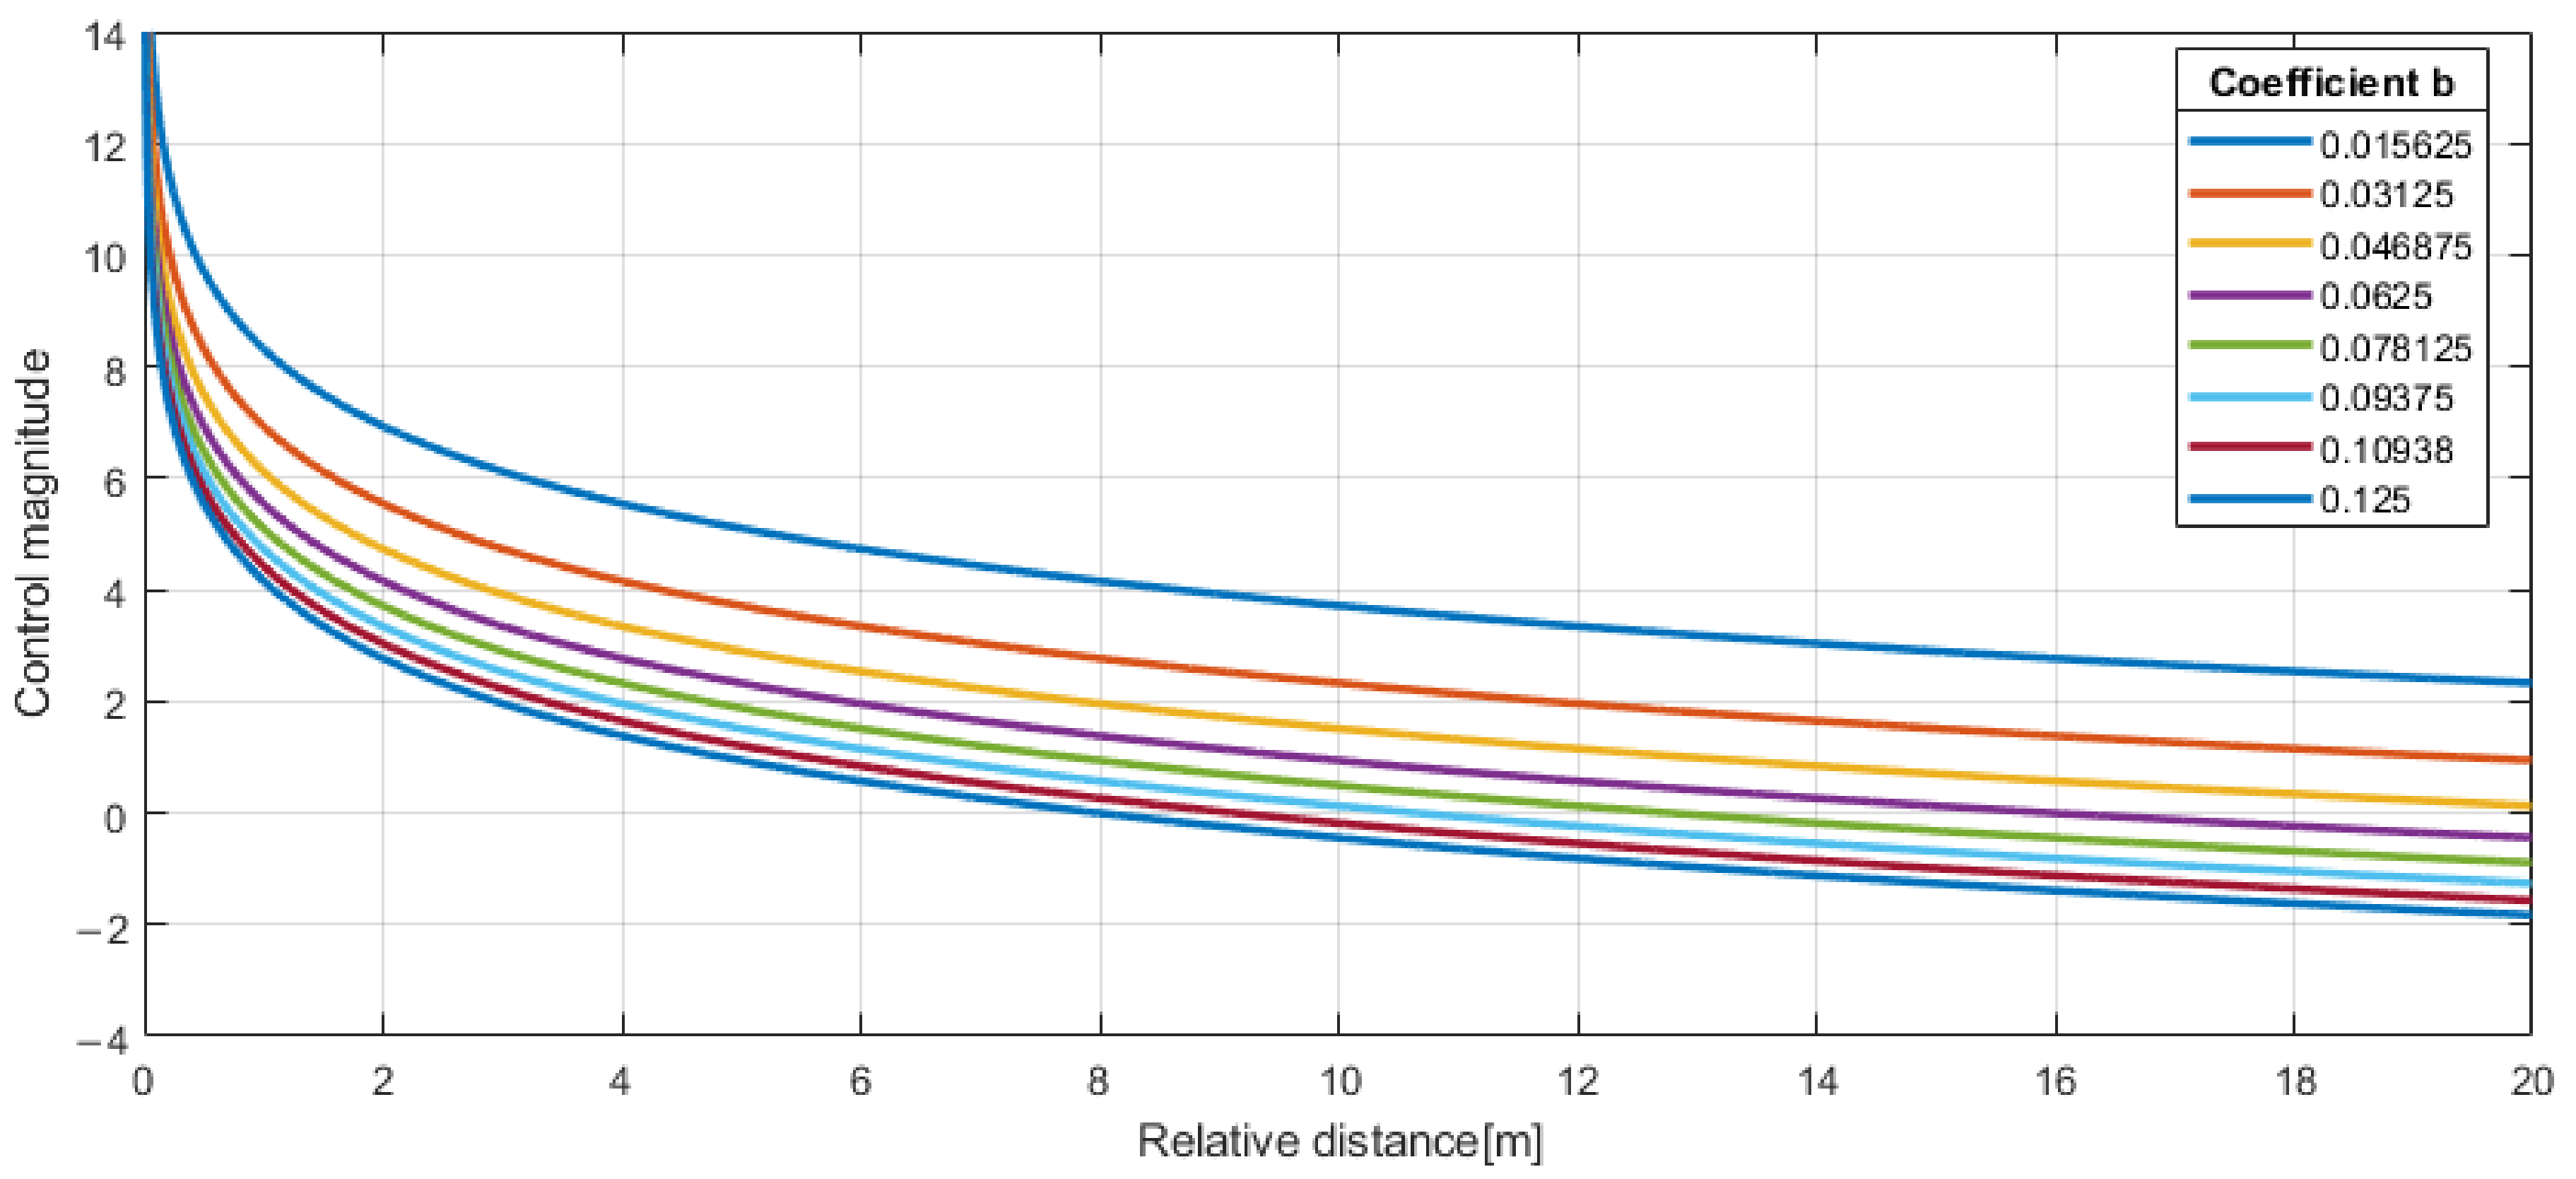
Figure A2 shows the potential function, which is a natural logarithmic function that changes as coefficient a increases, and Figure A3 provides a graph showing the minimum distance according to the increasing coefficient a. Note that, as coefficient a increases, the control magnitude increases at the same relative distance. This implies an increase in the repulsive force at the same distance, which is verified by the fact that the minimum distance in Figure A3 increases as coefficient a increases. As the repulsive force increases, the avoidance increases, resulting in increasing distance, ErrorWP, and battery consumption. As the safety boundary increases, efficiency decreases. Conversely, Figure A4 shows the potential function that changes as coefficient a is fixed and coefficient b increases, and Figure A5 provides a graph showing the change in the minimum distance at that time.
As coefficient b increases, the safety boundary at which the control magnitude becomes zero decreases, and the control magnitude becomes smaller at the same relative distance. This can be inferred from the result showing that the minimum distance—i.e., the closest distance between the two agents—decreases as coefficient b increases, as shown in Figure A5. As coefficient b increases, the repulsive force weakens; therefore, the safety boundary is reduced. However, note that the efficiency increases as the distance, ErrorWP, and battery consumption decrease.
Figure A2. Potential function according to coefficient a.
Jmse 10 02036 g0a2
Figure A3. Minimum distance according to coefficient a.
Jmse 10 02036 g0a3
Figure A4. Potential function according to coefficient b.
Jmse 10 02036 g0a4
Figure A5. Minimum distance according to coefficient b.
Jmse 10 02036 g0a5

Appendix A.2. Validation of VO Method

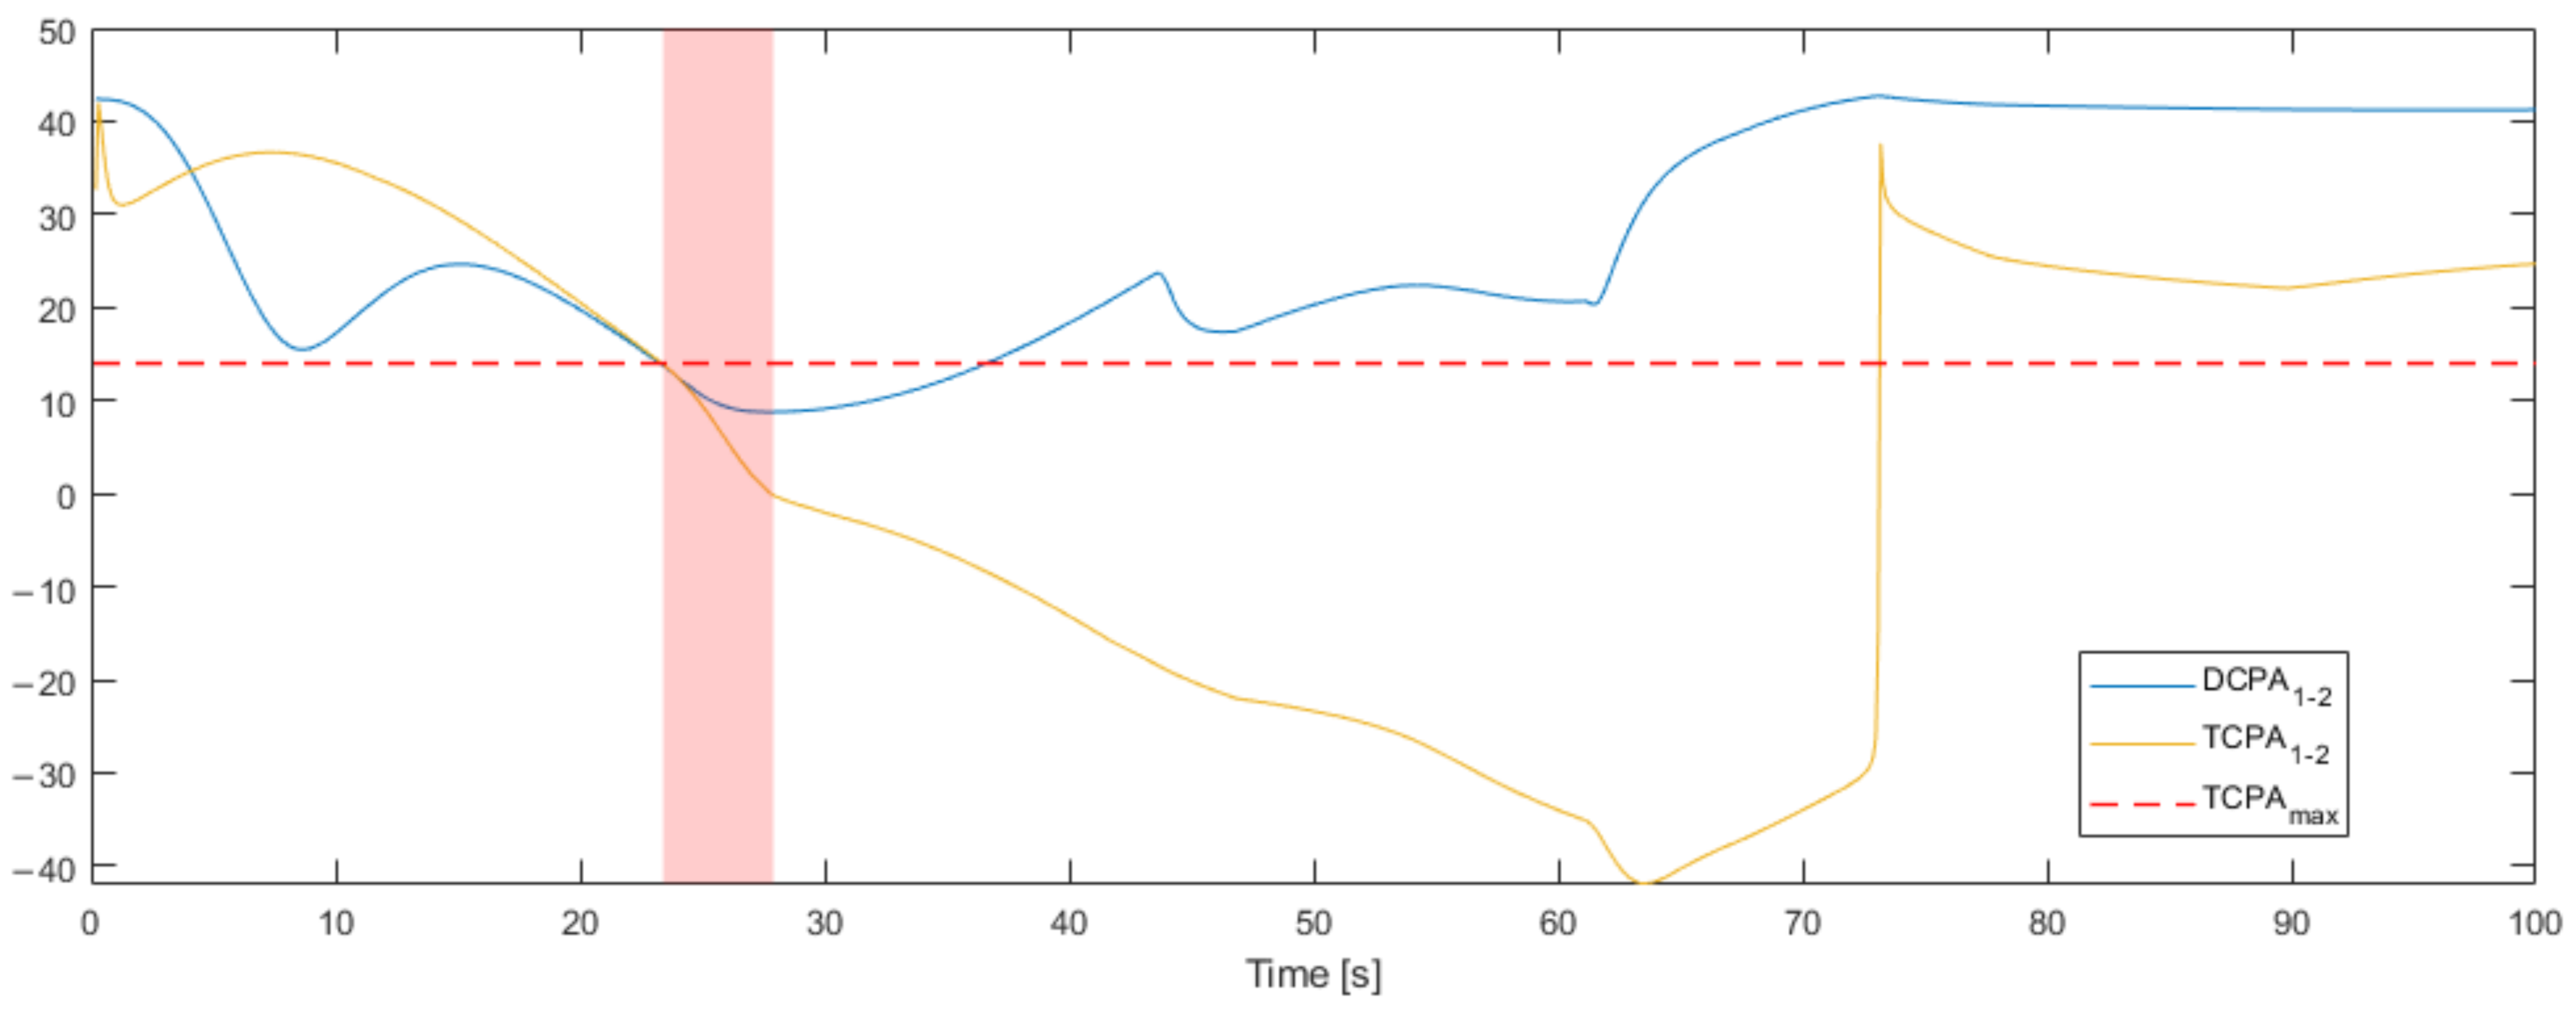
For the VO algorithm scenario, a simulation was performed to determine the difference in the agent movement according to the TCPAmax and DCPAmin. The conditions and corresponding results are summarized in Table A3 and Table A4, respectively. The conditions are the same as those for the simulation performed by changing the coefficients described in Appendix A.1, and only the collision-avoidance algorithm was changed to the VO. Figure A6 provides a graph showing the changes in the TCPA and DCPA over time for agent 1 when the TCPAmax is 14 s and DCPAmin is ∞ as one of the simulations.
Table A3. Conditions for VO simulation for validation.
ParameterValue
Simulation time100 s
Virtual matrix size2 × 2
Number of agents2
Table A4. Results of VO simulations for validation.
TCPAmax (s)DCPAmin (m)Minimum Distance
(m)
Distance (m)ErrorWP (m)Battery Usage (%)
Agent 1Agent 2Agent 1Agent 2Agent 1Agent 2
63.1048.7559.398.3410.870.1470.196
84.3748.8860.398.4011.130.1470.201
105.8249.2361.148.5011.370.1480.204
127.5549.5961.668.6311.590.1490.206
148.7549.4261.768.7711.830.1470.205
63.2248.8059.478.3410.890.1470.197
84.3748.8860.398.4011.130.1470.201
105.9949.2461.418.5311.430.1480.205
127.6549.4161.588.6211.600.1480.205
148.8149.4461.898.7511.820.1470.206
Figure A6. Changes in the TCPA and DCPA of agent 1 during simulation.
Jmse 10 02036 g0a6
According to Equation (17), when the TCPA is greater than or equal to 0 s and less than or equal to 14 s, which is the TCPAmax, and when the DCPA is less than ∞, which is the DCPAmin, a risk of collision is determined and avoided. The red background in Figure A6 represents the evasive maneuver being performed; i.e., agent 1 performs the evasive maneuver at the midpoint of 20–30 s.
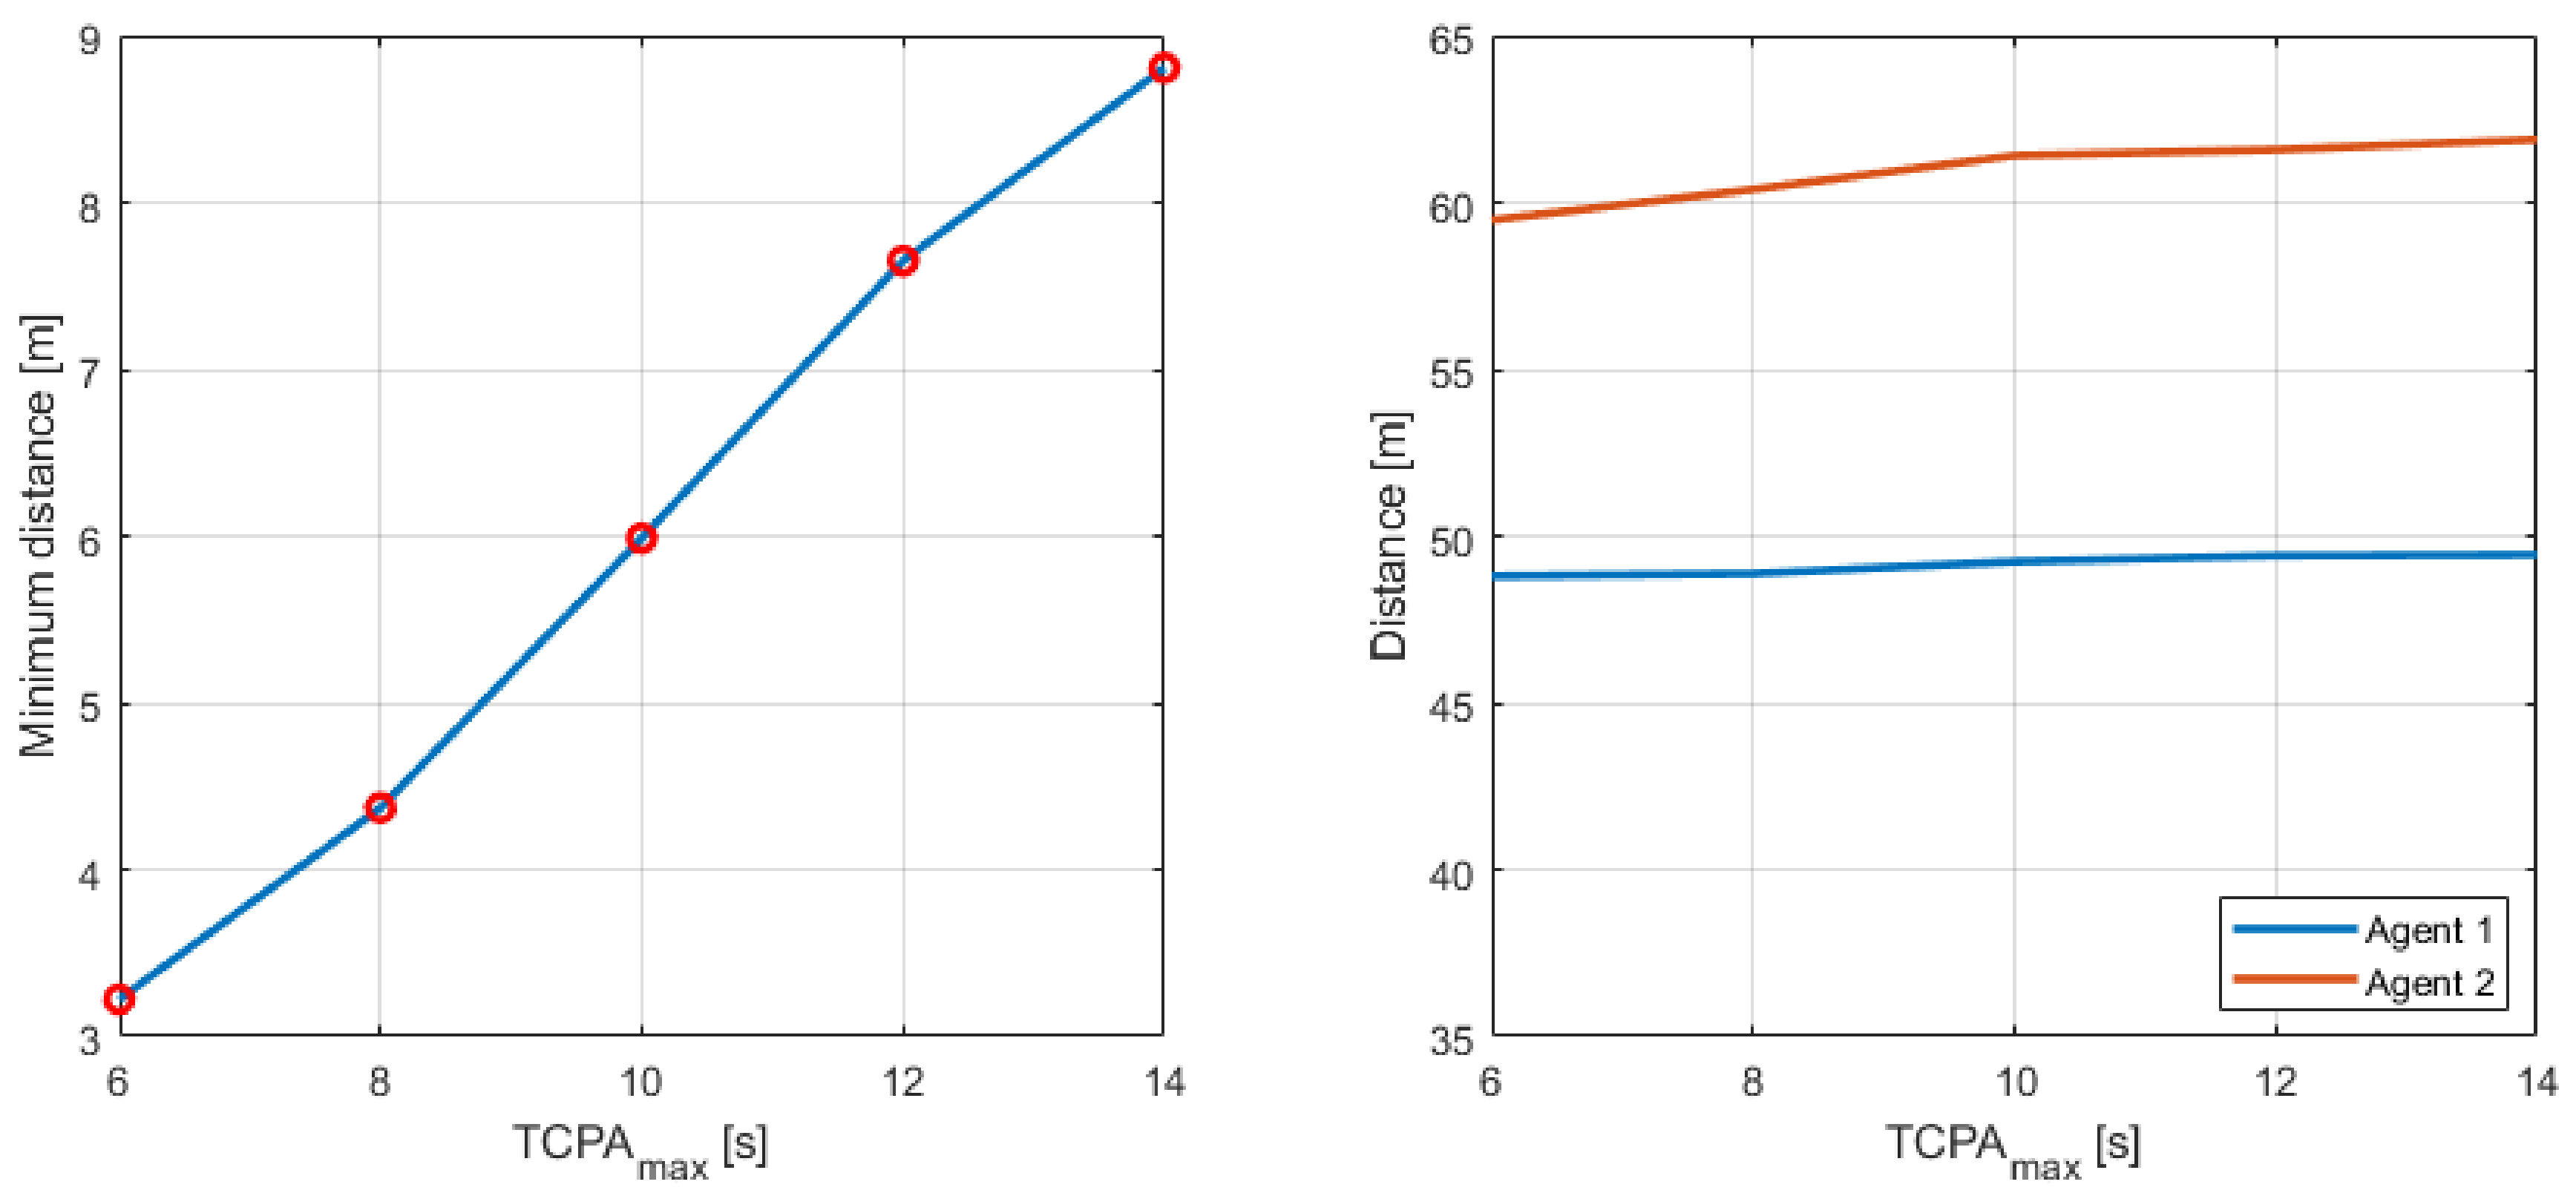
Figure A7 provides a graph showing the change in the minimum distance and distance according to the TCPAmax. As the TCPAmax increases, note that both the minimum distance and distance tend to increase because evasive maneuvers are performed in advance.
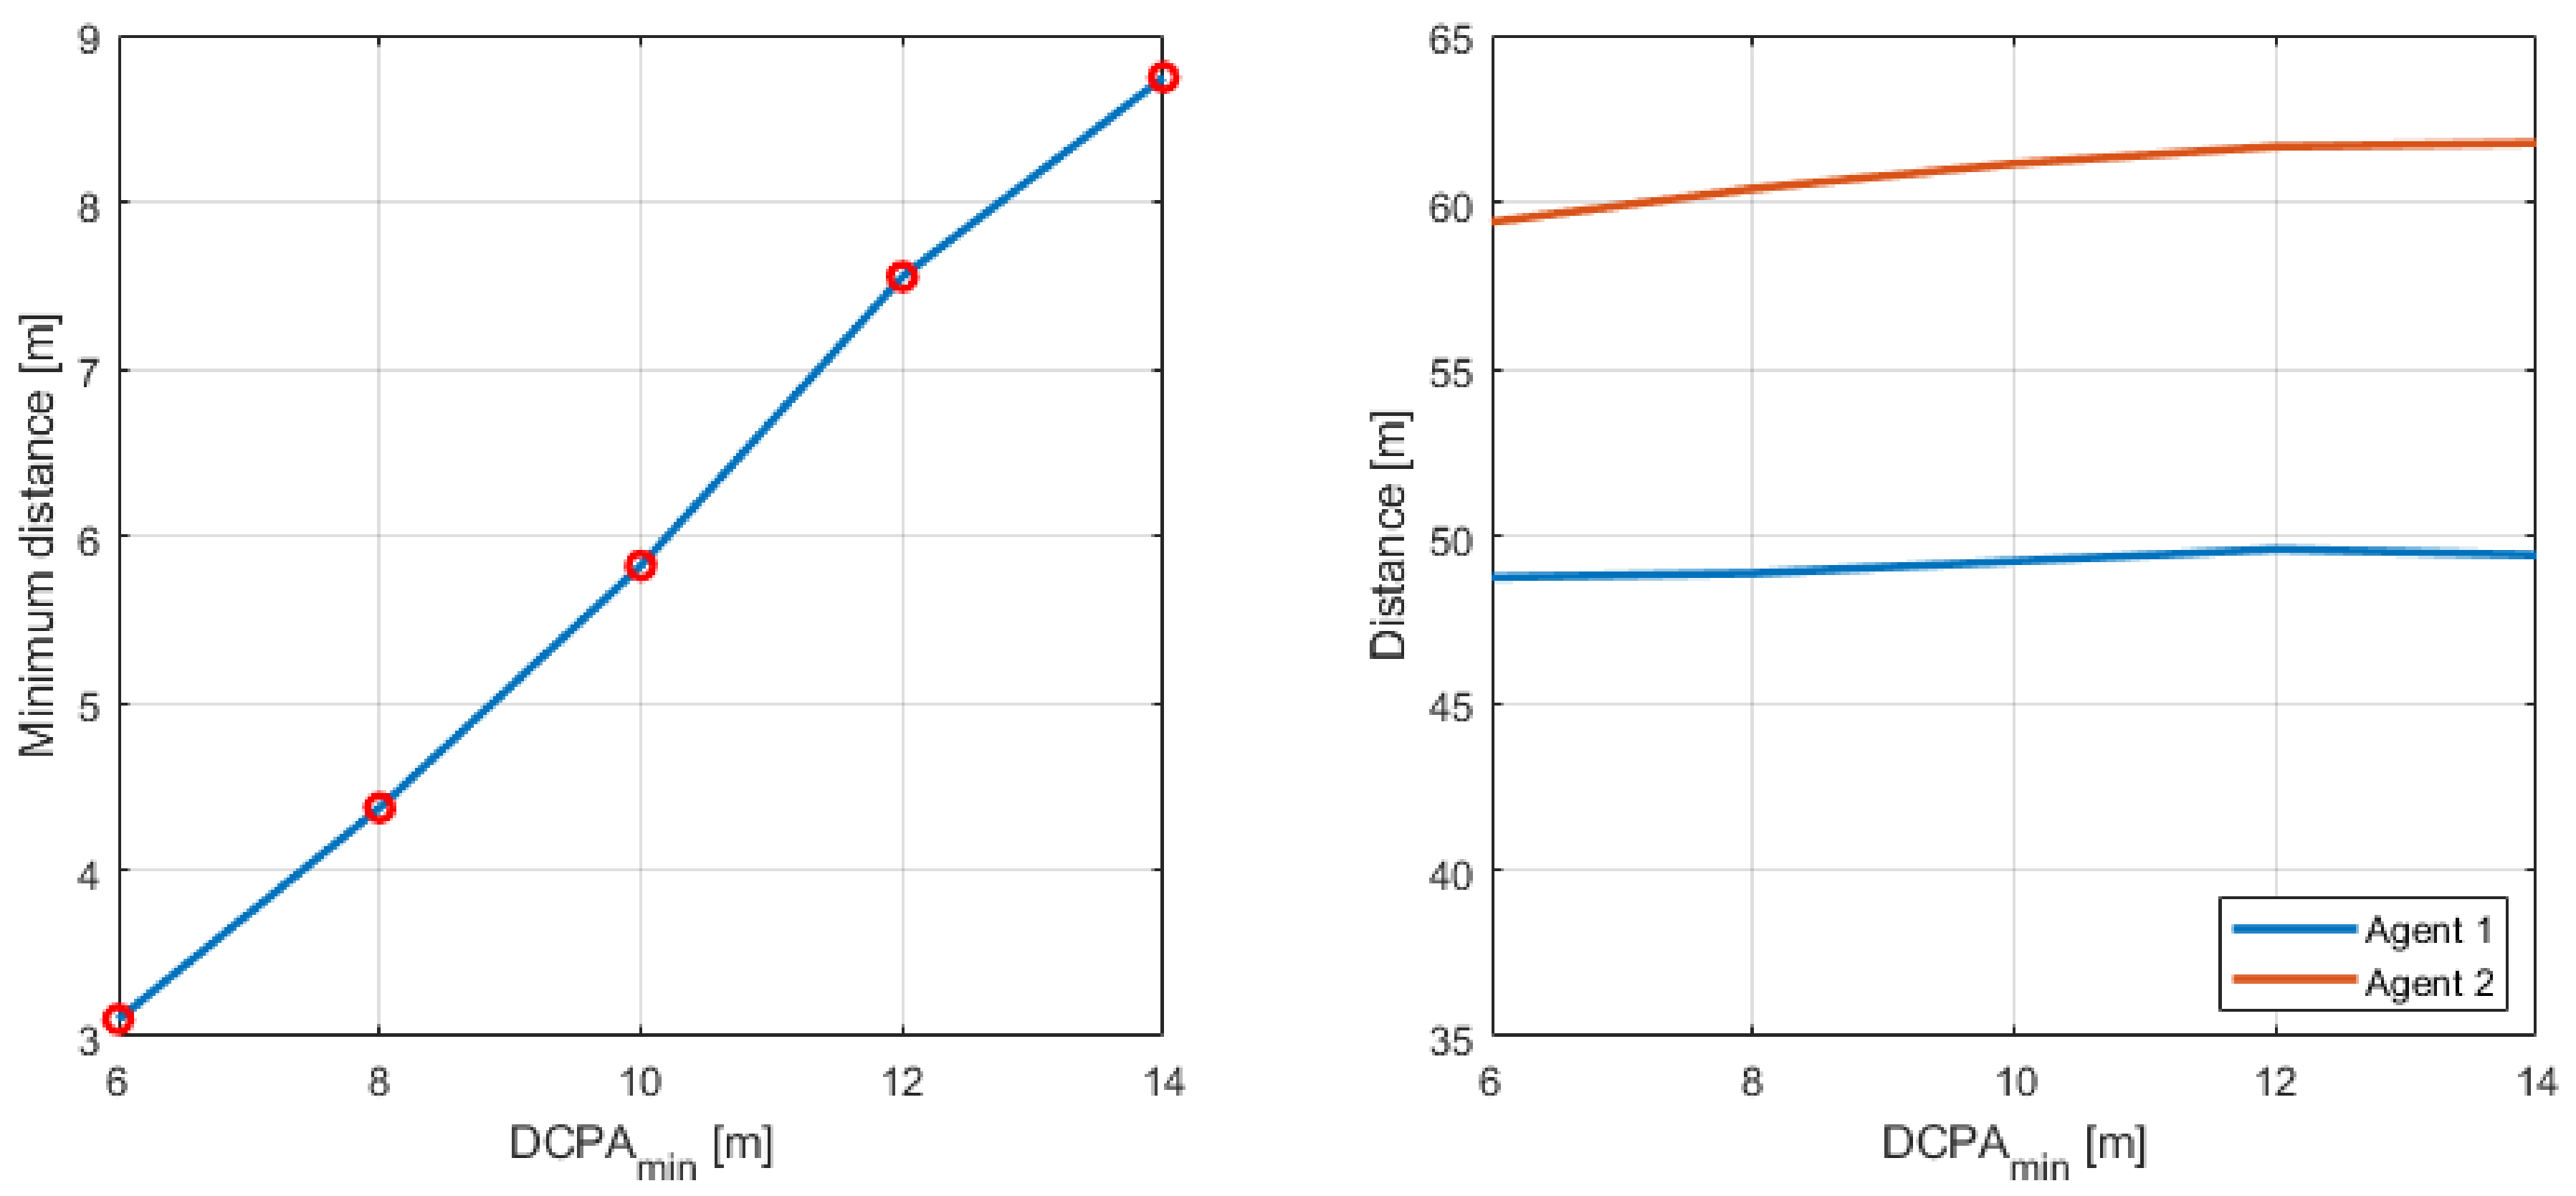
Figure A8 provides a graph showing the change in the minimum distance and distance according to the DCPAmin. As the DCPAmin increases, an evasive maneuver is performed, even if the distance from the CPA increases. Consequently, the minimum distance verifiably increases. However, in the case of the distance, it decreases slightly when the DCPAmin is 14 m, but note that the overall trend increases.
Figure A7. Minimum distance and distance according to the TCPAmax.
Jmse 10 02036 g0a7
Figure A8. Minimum distance and distance according to the DCPAmin.
Jmse 10 02036 g0a8

References

  1. Belleter, D.J.W.; Pettersen, K.Y. Underactuated leader-follower synchronisation for multi-agent systems with rejection of unknown disturbances. In Proceedings of the 2015 American Control Conference (ACC), Chicago, IL, USA, 1–3 July 2015. [Google Scholar]
  2. Cui, R.; Sam Ge, S.; Voon Ee How, B.; Sang Choo, Y. Leader–follower formation control of underactuated autonomous underwater vehicles. Ocean Eng. 2010, 37, 1491–1502. [Google Scholar] [CrossRef]
  3. Kanjanawanishkul, K. Coordinated path following for mobile robots using a virtual structure strategy with model predictive control. Automatika 2014, 55, 287–298. [Google Scholar] [CrossRef] [Green Version]
  4. Mehrjerdi, H.; Ghommam, J.; Saad, M. Nonlinear Coordination Control for a group of mobile robots using a virtual structure. Mechatronics 2011, 21, 1147–1155. [Google Scholar] [CrossRef]
  5. Chen, J.; Gan, M.; Huang, J.; Dou, L.; Fang, H. Formation control of multiple Euler-Lagrange systems via null-space-based behavioral control. Sci. China Inf. Sci. 2015, 59, 1–11. [Google Scholar] [CrossRef]
  6. Glotzbach, T.; Schneider, M.; Otto, P. Cooperative line of sight target tracking for heterogeneous unmanned Marine Vehicle Teams: From Theory to practice. Robot. Auton. Syst. 2015, 67, 53–60. [Google Scholar] [CrossRef]
  7. Lee, G.; Chwa, D. Decentralized behavior-based formation control of multiple robots considering obstacle avoidance. Intell. Serv. Robot. 2017, 11, 127–138. [Google Scholar] [CrossRef]
  8. Edwards, D.B.; Bean, T.A.; Odell, D.L.; Anderson, M.J. A leader-follower algorithm for multiple AUV formations. In Proceedings of the 2004 IEEE/OES Autonomous Underwater Vehicles (IEEE Cat. No.04CH37578), Sebasco, ME, USA, 17–18 June 2004. [Google Scholar]
  9. Wang, P.K. Navigation Strategies for multiple autonomous mobile robots moving in formation. J. Robot. Syst. 1991, 8, 177–195. [Google Scholar] [CrossRef]
  10. Fahimi, F. Sliding-mode formation control for underactuated surface vessels. IEEE Trans. Robot. 2007, 23, 617–622. [Google Scholar] [CrossRef]
  11. Lewis, M.A.; Tan, K.-H. High precision formation control of mobile robots using virtual structures. Auton. Robot. 1997, 4, 387–403. [Google Scholar] [CrossRef]
  12. Beard, R.W.; Lawton, J.; Hadaegh, F.Y. A coordination architecture for spacecraft formation control. IEEE Trans. Control Syst. Technol. 2001, 9, 777–790. [Google Scholar] [CrossRef]
  13. Beard, R.W.; Lawton, J.; Hadaegh, F.Y. A feedback architecture for formation control. In Proceedings of the 2000 American Control Conference. ACC (IEEE Cat. No.00CH36334), Chicago, IL, USA, 28–30 June 2000. [Google Scholar]
  14. Askari, A.; Mortazavi, M.; Talebi, H.A. UAV formation control via the virtual structure approach. J. Aerosp. Eng. 2015, 28, 04014047. [Google Scholar] [CrossRef]
  15. Russell Carpenter, J. Decentralized control of satellite formations. Int. J. Robust Nonlinear Control 2002, 12, 141–161. [Google Scholar] [CrossRef]
  16. Kim, S.-R.; Jo, H.-J.; Kim, J.-H.; Park, J.-Y. Formation control of swarming vessels using a virtual matrix approach and ISOT guidance algorithm. Processes 2021, 9, 1581. [Google Scholar] [CrossRef]
  17. Lee, H.J.; Rhee, K.P. Development of collision avoidance system by using expert system and search algorithm. Int. Shipbuild. Prog. 2001, 48, 197–212. [Google Scholar]
  18. Kijima, K.; Furukawa, Y. Automatic collision avoidance system using the concept of blocking area. IFAC Proc. Vol. 2003, 36, 223–228. [Google Scholar] [CrossRef]
  19. Larson, J.; Bruch, M.; Halterman, R.; Rogers, J.; Webster, R. Advances in Autonomous Obstacle Avoidance for Unmanned Surface Vehicles; Space and Naval Warfare Systems Center: San Diego, CA, USA, 2007. [Google Scholar]
  20. Xie, S.; Wu, P.; Peng, Y.; Luo, J.; Qu, D.; Li, Q.; Gu, J. The obstacle avoidance planning of USV based on improved artificial potential field. In Proceedings of the 2014 IEEE International Conference on Information and Automation (ICIA), Hailar, China, 28–30 July 2014. [Google Scholar]
  21. Kuwata, Y.; Wolf, M.T.; Zarzhitsky, D.; Huntsberger, T.L. Safe maritime autonomous navigation with Colregs, using velocity obstacles. IEEE J. Ocean. Eng. 2014, 39, 110–119. [Google Scholar] [CrossRef]
  22. Woo, J.; Kim, N. Collision avoidance for an unmanned surface vehicle using deep reinforcement learning. Ocean Eng. 2020, 199, 107001. [Google Scholar] [CrossRef]
  23. Woo, J.; Yu, C.; Kim, N. Deep reinforcement learning-based Controller for path following of an unmanned surface vehicle. Ocean Eng. 2019, 183, 155–166. [Google Scholar] [CrossRef]
  24. IWASAKI, H.; HARA, K. A fuzzy reasoning model to decide the collision avoidance action. J. Jpn. Inst. Navig. 1986, 75, 69–77. [Google Scholar]
  25. Kijima, K.; Furukawa, Y. Development of collision avoidance algorithm using fuzzy inference. In Proceedings of the Fifth ISOPE Pacific/Asia Offshore Mechanics Symposium, Daejeon, Korea, 17–20 November 2002. [Google Scholar]
  26. Park, J.; Kim, J. Predictive evaluation of ship collision risk using the concept of probability flow. IEEE J. Ocean. Eng. 2017, 42, 836–845. [Google Scholar] [CrossRef]
  27. Fujii, Y.; Tanaka, K. Traffic capacity. J. Navig. 1971, 24, 543–552. [Google Scholar] [CrossRef]
  28. Goodwin, E.M. A statistical study of ship domains. J. Navig. 1975, 28, 328–344. [Google Scholar] [CrossRef]
  29. Coldwell, T.G. Marine traffic behaviour in Restricted Waters. J. Navig. 1983, 36, 430–444. [Google Scholar] [CrossRef]
  30. Davis, P.V.; Dove, M.J.; Stockel, C.T. A Computer Simulation of Marine Traffic Using Domains and arenas. J. Navig. 1980, 33, 215–222. [Google Scholar] [CrossRef]
  31. Pietrzykowski, Z.; Uriasz, J. The ship domain—A criterion of navigational safety assessment in an open sea area. J. Navig. 2008, 62, 93–108. [Google Scholar] [CrossRef]
  32. Smierzchalski, R. On-line trajectory planning in collision situations at sea by evolutionary computation-experiments. IFAC Proc. Vol. 2001, 34, 407–412. [Google Scholar] [CrossRef]
  33. Zhu, X.; Xu, H.; Lin, J. Domain and its model based on Neural Networks. J. Navig. 2001, 54, 97–103. [Google Scholar] [CrossRef]
  34. Yan, X.; Jiang, D.; Miao, R.; Li, Y. Formation control and obstacle avoidance algorithm of a Multi-USV system based on virtual structure and artificial potential field. J. Mar. Sci. Eng. 2021, 9, 161. [Google Scholar] [CrossRef]
  35. Sun, X.; Wang, G.; Fan, Y.; Mu, D.; Qiu, B. A formation collision avoidance system for unmanned surface vehicles with leader-follower structure. IEEE Access 2019, 7, 24691–24702. [Google Scholar] [CrossRef]
  36. Woo, J.; Park, J.; Yu, C.; Kim, N. Dynamic model identification of unmanned surface vehicles using Deep Learning Network. Appl. Ocean Res. 2018, 78, 123–133. [Google Scholar] [CrossRef]
Figure 1. Wedge formation with virtual leader vessel, agents, and matrix (Kim et al., 2021 [16]).
Jmse 10 02036 g001
Figure 2. Conceptual description of command optimization.
Jmse 10 02036 g002
Figure 3. Concept of the APF method.
Jmse 10 02036 g003
Figure 4. Possible designs (2D and 3D) for the control magnitude for the repulsive force.
Jmse 10 02036 g004
Figure 5. APF simulation snapshot at 0, 15, 24, and 30 s.
Jmse 10 02036 g005
Figure 6. Comparison between APF and B-APF expressed in 3D.
Jmse 10 02036 g006
Figure 7. B-APF expressed in 2D.
Jmse 10 02036 g007
Figure 8. B-APF simulation snapshots at 0, 15, 24, and 30 s.
Jmse 10 02036 g008
Figure 10. Setting of VO.
Jmse 10 02036 g010
Figure 11. Example of non-collision situation.
Jmse 10 02036 g011
Figure 12. Example of collision situation.
Jmse 10 02036 g012
Figure 13. Conceptual descriptions of CPA, DCPA, and TCPA.
Jmse 10 02036 g013
Figure 14. (a) B-APF swarm simulation snapshots and (b) trajectory.
Jmse 10 02036 g014aJmse 10 02036 g014b
Figure 15. TCPA and DCPA from agent 1 using B-APF method.
Jmse 10 02036 g015
Figure 16. (a) VO swarm simulation snapshots and (b) trajectory.
Jmse 10 02036 g016aJmse 10 02036 g016b
Figure 17. TCPA and DCPA for agent 1 using VO method.
Jmse 10 02036 g017
Figure 18. Mean and standard deviation of minimum distance.
Jmse 10 02036 g018
Figure 19. (a) Snapshots of swarm simulation without collision-avoidance algorithm and (b) trajectory.
Jmse 10 02036 g019aJmse 10 02036 g019b
Figure 20. Comparison of B-APF and VO methods considering the averages of the (a) distance, (b) waypoint error, and (c) battery usage.
Jmse 10 02036 g020aJmse 10 02036 g020b
Figure 21. Cumulative time graph with minimum distance of less than 1 L and 2 L.
Jmse 10 02036 g021
Table 1. Simulation conditions for problematic situation.
ParameterValue
Simulation time50 s
Max. control size8
Virtual matrix size1 × 2
Number of agents2
Original coefficient a 4
b 2/64
Table 2. Calculation of attractive and repulsive forces.
Agent 1Agent 2
Attractive force F a t t 1 = p W P 1 p 1 F a t t 2 = p W P 2 p 2
Repulsive force F r e p 1 = a l n b p 2 p 1 F r e p 2 = a l n b p 1 p 2
Table 3. Simulation conditions for problematic situations.
ParameterValue
Simulation time50 s
Max. control size8
Number of agents2
Original coefficient a 4
b 2/64
Biased coefficient a 3
b 1/48
Table 4. Conditions of the large-scale swarm operation simulation.
ParameterValue
Simulation time3400 s
Max. control size8
Number of agents30
drow25 m
dcol25 m
TCPAmax20 s
DCPAmin24 m
V max1.5 m/s
Original coefficient a 4
b 2/64
Biased coefficient a 3
b 1/48
Table 5. Conditions of the swarm simulation according to phase.
PhaseTime (s)Virtual Matrix SizeFormation
Phase 10–20016 × 9Arrow
Phase 2200–70016 × 9Inverted arrow
Phase 3700–11008 × 16V
Phase 41100–16008 × 16Inverted V
Phase 51600–200013 × 11Multi-wedge
Phase 62000–240013 × 11Inverted multi-wedge
Phase 72400–300016 × 15T
Phase 83000–340015 × 15Circle
Table 6. Conditions of the large-scale swarm operation simulation.
Formation Formation
Arrow O O O O O O O O O O O O O O O O O O O O O O O O O O O O O O Inverted arrow O O O O O O O O O O O O O O O O O O O O O O O O O O O O O O
V O O O O O O O O O O O O O O O O O O O O O O O O O O O O O O Inverted V O O O O O O O O O O O O O O O O O O O O O O O O O O O O O O
Multi-wedge O O O O O O O O O O O O O O O O O O O O O O O O O O O O O O Inverted multi-wedge O O O O O O O O O O O O O O O O O O O O O O O O O O O O O O
T O O O O O O O O O O O O O O O O O O O O O O O O O O O O O O Circle O O O O O O O O O O O O O O O O O O O O O O O O O O O O O O
Table 7. Summarized results of large-scale swarm operation simulation.
B-APFVO
Distance (m)ErrorWP
(m)
Battery
Usage (%)
Distance
(m)
ErrorWP
(m)
Battery
Usage (%)
Average2523.1616.529.7892518.6517.379.615
Agent 12226.415.537.3112145.245.816.988
Agent 22293.124.527.5192092.344.456.524
Agent 32076.413.366.2942279.304.147.455
Agent 42012.195.316.1752155.245.576.754
Agent 52133.225.196.5152245.624.617.229
Agent 61879.952.785.0441799.022.794.655
Agent 72314.464.377.8702293.984.617.555
Agent 82075.633.986.5502052.363.626.216
Agent 92181.645.677.3641981.403.145.562
Agent 102035.522.266.0062093.283.436.293
Agent 112221.847.477.2132378.996.838.233
Agent 122000.675.496.2282143.986.767.265
Agent 132560.364.289.1262427.302.847.999
Agent 142137.9112.787.7202247.9215.448.101
Agent 152844.5522.8712.2772691.9322.0910.798
Agent 162422.164.648.3912235.0014.537.843
Agent 172769.5125.9611.4362752.4023.4611.251
Agent 182276.7815.448.0732448.3817.359.300
Agent 192716.559.6510.5352712.938.3910.295
Agent 202446.8119.269.7042385.8619.788.797
Agent 212680.0710.2610.6472739.348.9010.494
Agent 222615.3422.9010.6512537.758.069.470
Agent 233044.2021.5413.3863066.5324.8213.449
Agent 242542.9022.3210.5602532.698.169.516
Agent 252671.3412.9211.1032636.0326.5811.017
Agent 262833.1718.4312.3803428.1444.5016.750
Agent 273218.7637.3215.2163233.4741.3315.077
Agent 283402.2846.9416.7463081.7831.5214.084
Agent 293484.3658.7517.2793396.8367.5517.018
Agent 303576.8473.2518.3503344.4180.2016.462
Table 8. Comparison of the time taken to complete formations by method.
B-APFVO
PhaseStart
Time (s)
End
Time (s)
Time
Taken (s)
End
Time (s)
Time
Taken (s)
Difference (s)
Phases 1–2200695495610410−85
Phases 2–3700995295930230−65
Phases 3–411001480380152042040
Phases 4–5160017851851900300115
Phases 5–6200022802802240240−40
Phases 6–7240029705702905505−65
Phases 7–83000-----
Publisher’s Note: MDPI stays neutral with regard to jurisdictional claims in published maps and institutional affiliations.