Article

Daily Rhythmicity of Hepatic Rhythm, Lipid Metabolism and Immune Gene Expression of Mackerel Tuna (Euthynnus affinis) under Different Weather

1
Tropical Aquaculture Research and Development Center, South China Sea Fisheries Research Institute, Chinese Academy of Fishery Sciences, Sanya 572018, China
2
Key Laboratory of Efficient Utilization and Processing of Marine Fishery Resources of Hainan Province, Sanya Tropical Fisheries Research Institute, Sanya 572018, China
3
College of Science and Engineering, Flinders University, Adelaide, SA 5001, Australia
*
Author to whom correspondence should be addressed.
These authors contributed equally to this work.
J. Mar. Sci. Eng. 2022, 10(12), 2028; https://doi.org/10.3390/jmse10122028
Submission received: 12 November 2022 / Revised: 6 December 2022 / Accepted: 16 December 2022 / Published: 19 December 2022
(This article belongs to the Special Issue New Techniques in Marine Aquaculture)

Abstract

:
In order to investigate the rhythmic changes in gene expression in the liver of mackerel tuna (Euthynnus affinis) under sunny and cloudy conditions, this experiment had four sampling times (6:00, 12:00, 18:00 and 24:00) set on sunny and cloudy days to determine the expression of their immune, metabolic and rhythmic genes. The results showed that daily rhythmicity was present within most of the rhythm genes (CREB1, CLOCK, PER1, PER2, PER3, REVERBA, CRY2 and BMAL1), metabolic genes (SIRT1 and SREBP1) and immune genes (NF-kB1, MHC-I, ALT, IFNA3, ISY1, ARHGEF13, GCLM and GCLC) in this study under the sunny and cloudy condition (p < 0.05). The expression levels of CREB1, PER1, PER3, RORA, REVERBA, CRY1 and BMAL1 within rhythm genes were significantly different (p < 0.05) in the same time point comparison between sunny and cloudy conditions at 6:00, 12:00, 18:00 and 24:00; metabolic genes had the expression levels of LPL at 6:00, 12:00, 18:00 and 24:00 in the same time point comparison (p < 0.05); immune genes only had significant differences in the expression levels of IFNA3 at 6:00, 12:00, 18:00 and 24:00 (p < 0.05). This study has shown that rhythm, lipid metabolism and immune genes in the livers of mackerel tuna are affected by time and weather and show significant changes in expression.

1. Introduction

Due to the various changes caused by the Earth’s rotation and autotransfer, all organisms have biological clocks that are autonomous endogenous timing mechanisms within the organism that regulate its adaptation to exogenous rhythmic changes in light, temperature and other environmental factors [1,2]. The daily rhythmicity of animal behavior, physiology, metabolism and immunity is controlled by biological clocks that are genetically synchronized with environmental cycles and can maintain a 24 h rhythm even in the absence of environmental cues [3]. The biorhythmic center that controls periodic changes in biological functions is called the biorhythmic pacemaker [4]. At the molecular level, biological rhythms are regulated through feedback loops formed at the level of highly conserved transcripts [5]. The biological clock consists of biological clock genes and transcription factors involved in the transcription–translation feedback loop, including BMAL1, CLOCK, period genes (PER1/PER2/PER3) and cryptochrome genes (CRY1/CRY2) [2,6]. These genes are not only expressed and function in the cells of the biological rhythm centers, but are also present in all tissues and cells of the organism. Therefore, transcription factors have an important role in regulating circadian rhythms [7].
The physiology, metabolism and immunity of most fish are regulated by the biological clock [8]. Additionally, the liver, the main metabolic organ for lipids, is controlled by circadian rhythms [9]. Some studies have found that circadian rhythms exist in reptiles and birds [10,11]. Mammalian lipid metabolism also follows a circadian rhythm [12,13]. A correlation between metabolic pathways and circadian rhythms has also been found in studies of mice rhythmically oscillating [14]. Rhythmic gene expression for lipid metabolism in Atlantic bluefin tuna found in fish studies [15]. In recent years, studies have been conducted on the genetic correlation between mammalian immunity and daily rhythmicity. Studies show that mammals develop innate immune effects and daily rhythmicity during the feeding of mammals exposed to microorganisms associated with food [16]. However, there are fewer studies on the immune system and circadian rhythms in fish [17].
The mackerel tuna (Euthynnus affinis) is a species of tunas known as the eastern little tuna, skipjack tuna or kawakawa [18]. The production of mackerel tuna is entirely dependent on fishing, and a large proportion of mackerel tuna is 12–32 cm juveniles since the main fishing methods are seining and trawling. Although the production of mackerel tuna is still increasing, the Catch-MSY model estimates that it is currently overfished and will continue to obey the overfishing trend [19]. Therefore, from the perspective of marine resource conservation, it is necessary to carry out captive breeding of mackerel tuna. Currently, captive breeding of mackerel tuna has been reported only in Japan [18]. Our research team realized the land-based recirculating water culture of mackerel tuna [20]. Although the survival rate and better artificial domestication are guaranteed in artificial culture, there are still many problems. The situation of an unsynchronized circadian rhythm system of aquatic animals with the existing environment caused by the change of relative time under artificial culture conditions may lead to a state of stress and undesirable consequences, such as slow growth and reduction of disease resistance, which is a great obstacle to the development of artificial culture [21]. In this study, the mRNA expression levels of immune, metabolic and rhythm genes in the liver of mackerel tuna were investigated by RT-qPCR. The study aimed to elucidate the daily rhythm expression of lipid metabolism genes, immunity genes and rhythm genes in the liver of the mackerel tuna. This study is essential for this species to be cultivated in captivity to maintain its population and provides basic information to ensure the healthy, green and sustainable development of the mackerel tuna farming industry.

2. Materials and Methods

2.1. Animal

Mackerel tuna (total length: 32.38 ± 4.71 cm, weight: 1163.12 ± 284.60 g) were acclimated for more than six months in indoor ponds (8 × 5 m) with a recirculating water culture system and a natural light condition at the Tropical Aquatic Research and Development Centre, South China Sea Fisheries Research Institute, Chinese Academy of Fishery Sciences, Hainan, China. Fish were fed ad libitum once a day at 09:00 h, and miscellaneous fresh fish (4 × 2 cm pieces) were used as feed. The water quality parameters were maintained at ammonia nitrogen < 0.1 mg L−1, nitrite nitrogen < 0.02 mg L−1, pH 7.8, dissolved oxygen > 7.0 mg L−1, and salinity 33 psu.

2.2. Sample Collection

Samples were collected in two different weather conditions, sunny and cloudy. Four sampling times (6:00, 12:00, 18:00 and 24:00) were set for one daily cycle with three parallel ponds. The three fish were taken from each parallel pond. The environmental conditions at each sampling time are shown in Table 1. Fish were deprived of feed for 24 h before the sampling was conducted. Three fish were randomly selected for sampling at each time point. Samples were collected under dim red light at night. After anesthesia with eugenol (80 mg·L−1), the body length and weight were measured, and the liver tissue was quickly collected, snap-frozen in liquid nitrogen and preserved at −80 °C until use.

2.3. Total RNA Extraction and cDNA Synthesis

The tissue samples were homogenized in a centrifuge tube containing 1 mL of Trizol (Invitrogen, Carlsbad, CA, USA) and extracted total tissue RNA according to the instructions. The quality and quantity of total RNA were tested using agarose gel electrophoresis and a Micro UV spectrophotometer (Biotec Biotechnology Co., Ltd., Beijing, China). Reverse transcription was performed on 1 μg of total RNA using an EasyScript® All-in-One First-Strand cDNA Synthesis SuperMix (All-Strand Biotechnology Co., Ltd., Beijing, China).

2.4. Real-Time qPCR Analysis

Primers (Table 2) were designed by Primer Premier 5 [14] software based on the gene sequence of the mackerel tuna genome (Non-public data). GAPDH was used as the housekeeping gene. The qPCR was conducted with the Real-time qPCR analysis (Analytik Jena GmbH, Jena, Germany) using SYBR Green (Tiangen Biotech Co., Ltd., Beijing, China). The 20 μL of reaction, including 10 μL of 2× RealUniversal PreMix, 0.6 μL each of forward and reverse primers (10 μM), 2 μL of cDNA template and 6.8 μL of RNase-free ddH2O. Reaction conditions were: (1) Pre-denaturation at 95 °C for 15 min; (2) Amplification reaction, denaturation at 95 °C for 10 s, annealing at 56 °C for 20 s, extension at 72 °C for 30 s and 40 cycles. There were three repetitions of each test. The dissociation curves were analyzed to ensure only specific products were obtained with no formation of primer dimers in each reaction. At the end of the reaction, the relative expression level of the target gene was calculated using the 2−ΔΔCT method [16]. The reaction efficiency was 90–110%, and Pearson’s coefficients of determination (R2) were >0.97.

2.5. Statistical Analysis

All data were expressed as mean ± standard deviation. The data were analyzed by SPSS 26.0 statistical software and plotted by Origin2021. The test data all conformed to Shapiro–Wilk and Chi-squared tests. A two-way ANOVA was used to test the interaction effects of different weather and times of the day and was performed using SPSS software. A one-way ANOVA was used for multiple comparisons between different sample time points on the same day, and an independent sample t-test was used to analyze the significant differences between the sunny and cloudy days at the same time points. The significant difference level was set as p < 0.05. Data were then fitted to a cosine wave to determine the presence of a significant daily rhythm. Raw data were analyzed using Acro circadian analysis programs (University of South Carolina, USA; http://www.circadian.org/softwar.html; accessed on 7 October 2022).

3. Results

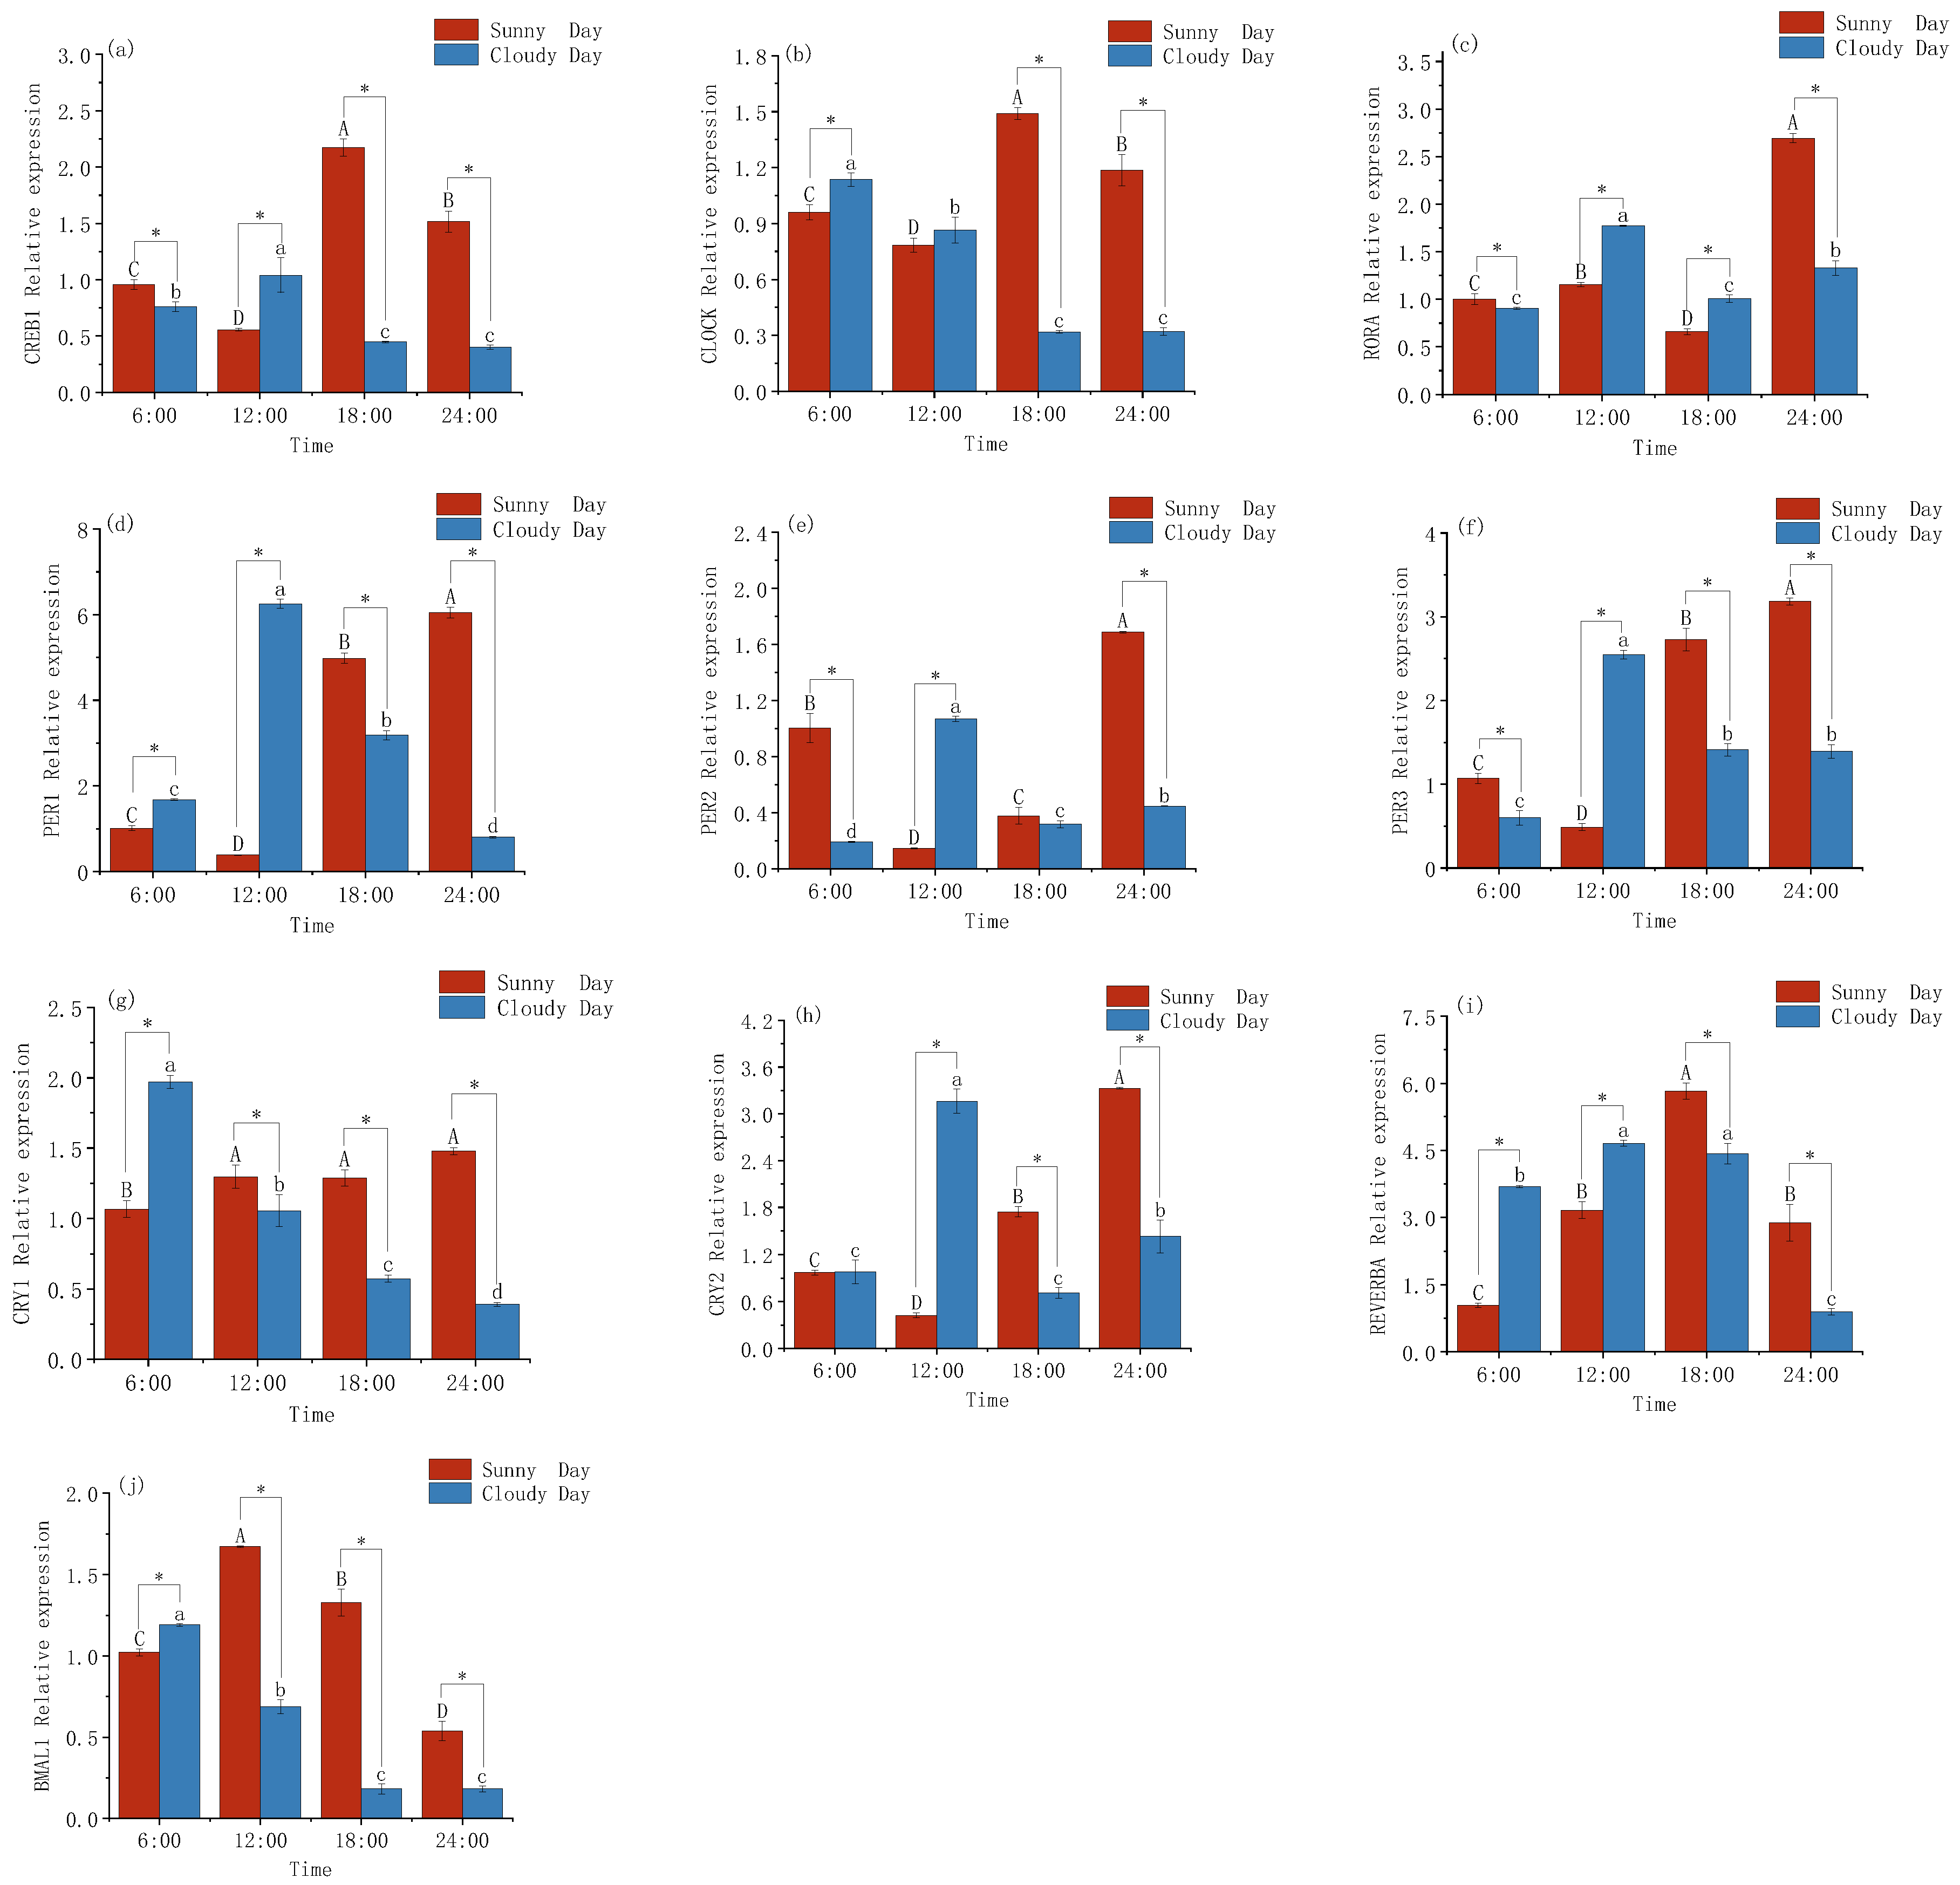
3.1. Changes in Gene Expression Levels in the Mackerel Tuna Rhythm

Under the sunny condition, the expression levels of CREB1, CLOCK, RORA, PER1, PER3 and CRY1 were not significantly rhythmic in the liver (Table 3). The expression levels of CREB1 and CLOCK were significantly higher at 18:00 than at the other time points (p < 0.05). The expression levels of RORA, PER1 and PER3 were significantly higher at 24:00 than at the other time points (p < 0.05; Figure 1a–f). The expression level of CRY1 was significantly lower at 6:00 than at the remaining time points (p < 0.05, Figure 1g). The expression levels of PER2, CRY2, REVERBA and BMAL1 were significantly rhythmic in the liver under the sunny condition (Table 3). The expression levels of PER2 and CRY2 were significantly higher at 24:00 than at the other time points (p < 0.05; Figure 1e,h; Table 3). The expression levels of REVERBA were significantly higher at 18:00 than at the other time points < 0.05; Figure 1i; Table 3). The expression levels of BMAL1 were significantly higher at 24:00 than at the other time points (p < 0.05; Figure 1h; Table 3).
Under the cloudy condition, the expression levels of RORA, PER2, CRY1 and CRY2 were not significantly rhythmic in the liver (Table 3). The expression levels of CREB1, PER1, PER3 and REVERBA were significantly higher at 12:00 than the other three time points under the cloudy condition (p < 0.05). The expression levels of CLOCK and BMAL1 were significantly higher at 6:00 than at the other time points (p < 0.05; Figure 1a,b,d,f,i,j; Table 3). The expression levels of RORA, PER2, CRY1 and CRY2 were significantly rhythmic in the liver under cloudy conditions (Table 3). The expression levels of RORA, PER2 and CRY2 were significantly higher at 12:00 than at the other three time points (p < 0.05). The expression level of CRY1 was significantly higher at 6:00 than at the other three time points (p < 0.05; Figure 1c,e,g,h; Table 3).
A comparison of rhythm genes’ expression levels at the same time point under different weather (sunny versus cloudy days) is shown in Figure 1. Expression levels of CREB1, RORA, PER1, PER3, CRY1, REVERBA and BMAL1 at all the time points were significantly different between sunny and cloudy days at the same time point (p < 0.05; Figure 1a,c,d,f,g,i,j). Expression levels of CLOCK at 6:00, 18:00 and 24:00 were significantly different between sunny and cloudy days at the same time point (p < 0.05; Figure 1b). The expression levels of PER2 at 6:00, 12:00 and PER2 at 6:00, 12:00 and 24:00 were significantly different between sunny and cloudy days at the same time point (p < 0.05; Figure 1e). The expression levels of CRY2 at 12:00, 18:00 and 24:00 were significantly different between sunny and cloudy days at the same time point (p < 0.05; Figure 1h).
The results of the two-way analysis of different weather and time of day on mackerel tuna rhythm genes are shown in Table 4. The main effect of time and weather was significant (p < 0.05); there was a significant interaction between time and different weather on the level of rhythm gene expression in mackerel tuna (p < 0.05).

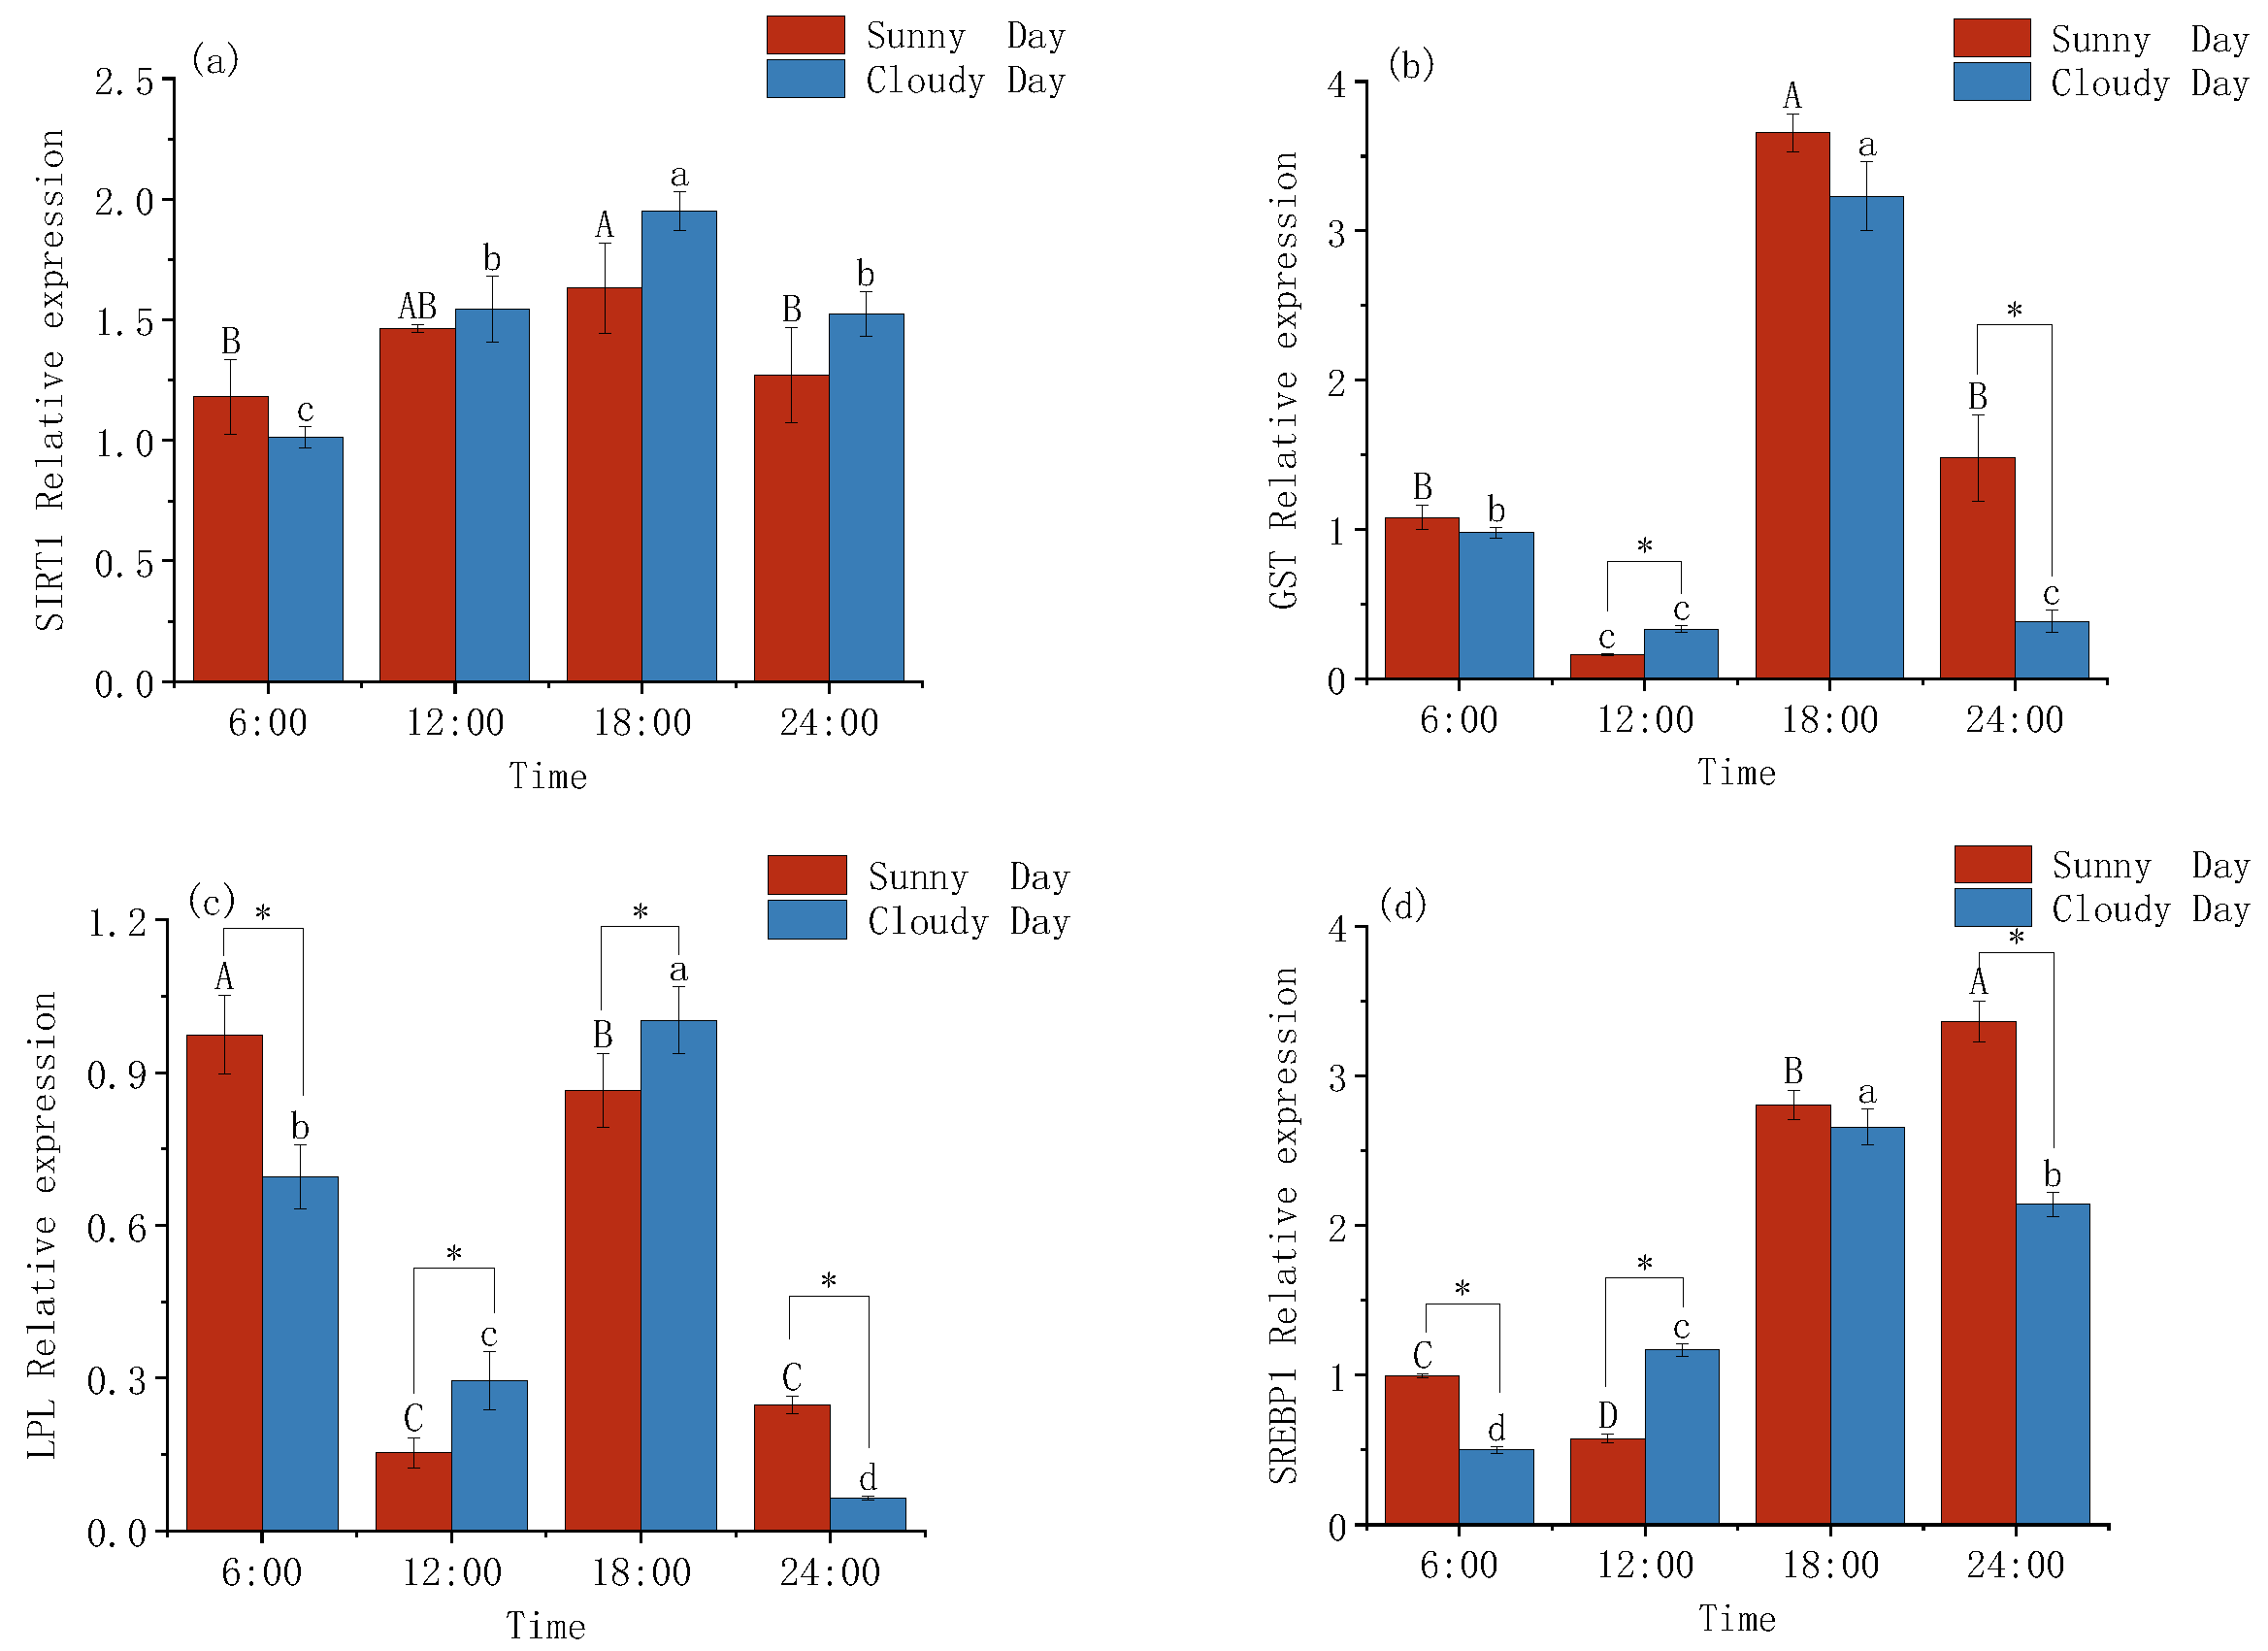
3.2. Changes in the Expression Levels of Lipid Metabolism in Mackerel Tuna

Under the sunny condition, the expression levels of SIRT1, GST and LPL were not significantly rhythmic in the liver (Table 5). The expression levels of SIRT1 and GST were significantly higher at 18:00 than the other three groups at different times in sunny conditions (p < 0.05).
Under the cloudy condition, the expression levels of GST and LPL were not significantly rhythmic in the liver (Table 5). The expression levels of GST and LPL were significantly higher (p < 0.05) than the other three groups at 18:00 under different times in the cloudy condition (Figure 2b,c; Table 5). The expression levels of SIRT1 and SREBP1 were significantly rhythmic in the liver under overcast conditions (Table 5).
The expression levels of metabolic genes at the same time point under different weather on sunny and cloudy days were significantly different in all four groups (p < 0.05). No significant differences could be seen between GST at 6:00 and 18:00 in the same time point comparison; GST expression levels were significantly higher under the cloudy condition than under the sunny condition at 12:00 (p < 0.05), and GST expression levels were significantly higher under the sunny condition than under the cloudy condition at 24:00 (p < 0.05; Figure 2b). The expression levels of LPL were significantly higher under sunny light conditions at 6:00 and 24:00 than under the cloudy condition (p < 0.05); the expression levels of LPL were significantly higher under cloudy light conditions at 12:00 and 18:00 than under cloudy light conditions (p < 0.05) (Figure 2c). The expression level of SREBP1 at 12:00 under the cloudy condition was significantly higher than that of the sunny condition (p < 0.05); the expression level of SREBP1 at 18:00 was not significantly different in the comparison at the same time point (Figure 2d).
The results of the two-way analysis of different weather and time of day on metabolic genes in mackerel tuna are shown in Table 6. The main effect of time and weather was significant (p < 0.05); time and different weather had a significant interaction effect (p < 0.05) on metabolic gene expression levels in mackerel tuna.

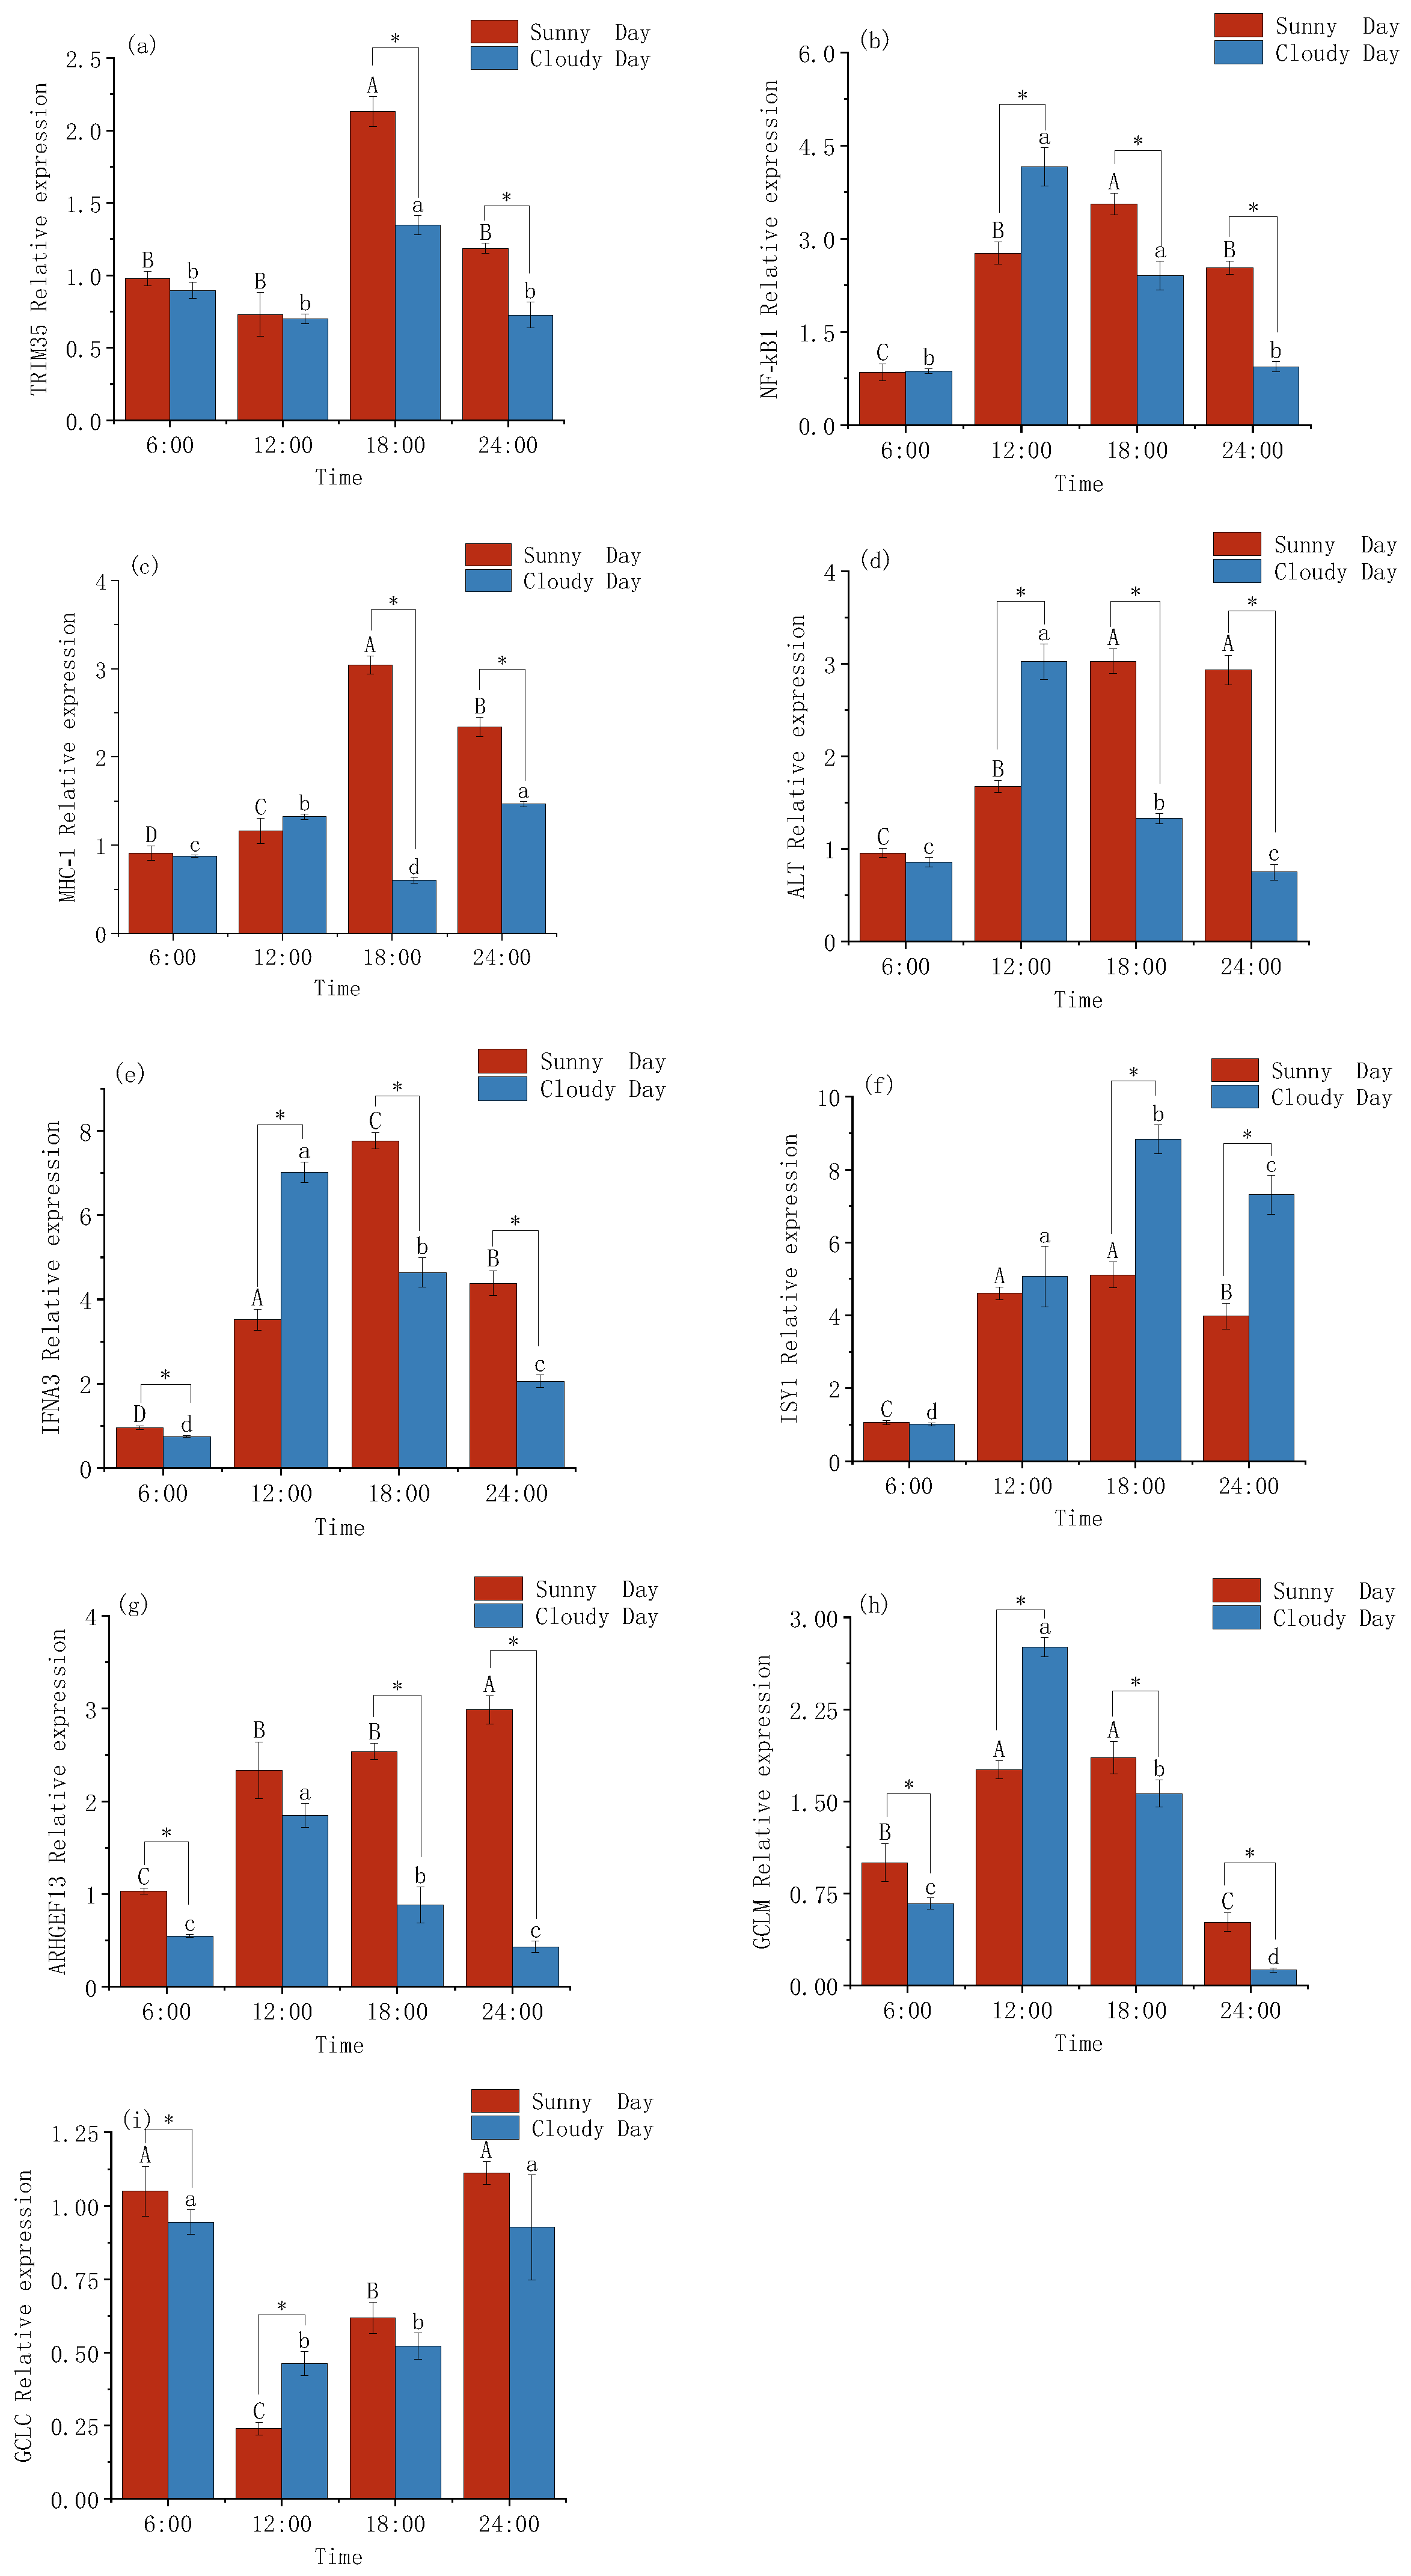
3.3. Changes in the Expression Levels of Immune Genes in Mackerel Tuna

Expression levels of TRIM35 under sunny conditions were not significantly rhythmic in the liver (Table 7). The expression level of TRIM35 at 18:00 was significantly higher (p < 0.05) than the other three groups at different times in sunny conditions (Figure 3a; Table 7). Expression levels of NF-kB1, MHC-I, ALT, IFNA3, ISY1, ARHGEF13 and GCLC were significantly rhythmic in the liver under sunny conditions (Table 7).
Under the cloudy condition, the expression levels of TRIM35, MHC-I and IFNA3 were not significantly rhythmic in the liver (Table 7). The expression levels of TRIM35 at 18:00 were significantly higher than the other three time points at different times in the cloudy condition (p < 0.05), the expression levels of MHC-I at 24:00 were significantly higher than the other three time points in the cloudy condition (p < 0.05), and the expression levels of IFNA3 at 12:00 were significantly higher than the other three time points in the cloudy condition (p < 0.05; Figure 2a,b,e; Table 7). The expression levels of NF-kB1, ALT, ISY1, ARHGEF13, GCLM and GCLC were significantly rhythmic in the liver under overcast conditions (Table 7).
The expression levels of TRIM35 at 6:00 and 12:00 were not significantly different between sunny and cloudy days at the same time point; the expression levels of TRIM35 at 18:00 and 24:00 were significantly higher (p < 0.05) under the sunny condition than the under cloudy condition (Figure 3a). The expression levels of NF-kB1 at 6:00 were not significantly different in the comparison at the same time point; NF-kB1 expression levels were significantly higher under the cloudy condition at 12:00 than under the sunny conditions (p < 0.05); NF-kB1 expression levels were significantly higher under the sunny condition at 18:00 and 24:00 than under the cloudy condition (p < 0.05) (Figure 3b). The expression levels of MHC-I at 6:00 and 12:00 were not significantly different in the same time point comparison; the expression levels of MHC-I at 18:00 and 24:00 under the sunny condition were significantly higher than those under the cloudy condition (p < 0.05) (Figure 3c). The expression levels of ALT at 6:00, 18:00 and 24:00 were significantly higher (p < 0.05) under the sunny condition than under the cloudy condition (Figure 3d). The expression levels of ISY1 at 6:00 and 12:00 were not significantly different in the comparison at the same time point; the expression levels of ISY1 at 18:00 and 24:00 under the cloudy condition were significantly higher than those under the sunny condition (p < 0.05; Figure 3f). The expression levels of ARHGEF1 were significantly higher (p < 0.05) under the sunny condition than under the cloudy condition at 6:00, 18:00 and 24:00; the expression levels of ARHGEF1 at 12:00 were not significantly different at the same time point comparison (Figure 3g). GCLM expression levels were significantly higher at 6:00, 18:00 and 12:00 in the same time point comparison between sunny and cloudy conditions (p < 0.05); the expression level of GCLM at 12:00 was significantly higher under cloudy conditions than under sunny conditions (p < 0.05; Figure 3h). The expression level of GCLC was significantly higher at 6:00 than in the same time point comparison between sunny and cloudy conditions (p < 0.05); The expression level of GCLC at 12:00 was significantly higher under cloudy conditions than under sunny conditions (p < 0.05; Figure 3i).
The results of the two-way analysis of different weather and time of day on immune genes in mackerel tuna are shown in Table 8. The main effects of time and weather were significant (p < 0.05), and there was a significant interaction between time and different weather on immune gene expression levels in mackerel tuna (p < 0.05).

4. Discussion

4.1. Rhythmic Gene Expression Patterns

In nature, in both animals and humans, there is a 24 h circadian rhythm called the biological clock [22]. CREB1 (cyclic adenosine monophosphate response element binding protein 1) is a protein that regulates gene transcription and can participate in cycle regulation by regulating the expression of downstream target genes [23]. In this study, the daily rhythmicity of CREB1 was only present under the cloudy condition, and the average CREB1 gene expression was found to be higher under the sunny condition than under the cloudy condition. The light intensity may stimulate the CREB1 gene expression in mackerel tuna, but the regulatory mechanism remains to be investigated.
The molecular mechanism of the biological clock is primarily the existence of a cell-autonomous transcriptional–translational feedback loop in which a pair of positive regulators (CLOCK and BMAL1) form a heterodimer that activates its transcription by binding to the negative regulators (PER and CRY promoters). Subsequently, the PER and CRY proteins bind to form a complex that enters the nucleus and acts on the CLOCK and BMAL1 heterodimers, thereby feeding back to repress its own transcription [24]. BMAL1 is thought to regulate the expression of rhythmic genes throughout the liver [25]. In this study, PER2, CRY2 and BMAL1 showed daily rhythmicity under the sunny condition and CLOCK, PER1, PER3 and BMAL1 showed daily rhythmicity under the cloudy condition. It has been shown that the expression levels of the rhythm genes PER1, PER2, CRY1, CRY2 and BMAL1 in the liver of the Atlantic bluefin tuna (Thunnus thynnus, L.) exhibit daily rhythmicity [26]. Similar to the results of the present study. However, in this study, PER1 showed daily rhythmicity only under cloudy conditions, while PER2 and CRY2 showed daily rhythmicity only under sunny conditions, which may be due to the different changes in light intensity under the cloudy and the sunny conditions, leading to an effect of light stimulation on the circadian system of fish. It has been shown that photoperiod has an effect on core biological clock gene expression in fish [27]. In this study, the expression levels of rhythm genes were at their highest under sunny conditions at 12:00, when light intensity was the strongest of the day, reflecting that light intensity at 12:00 under sunny conditions can cause up-regulation of the expression levels of rhythm genes in mackerel tuna to some extent.

4.2. Metabolic Gene Expression Patterns

The liver is the main organ of lipid metabolism in fish and plays a huge role in the body as a hub for fat transport, influencing the breakdown and absorption of nutrients and hormonal signaling [28]. Some hepatic metabolic pathways are driven by the circadian biological clock, resulting in a circadian rhythm, and disturbances in the biological clock can cause metabolic disorders in fish. SIRT1 is involved in a wide range of glucose and lipid metabolism pathways, as well as in the regulation of gene transcription and cellular senescence through the deacetylation of several metabolism-controlling transcription factors [29]. Current research on the SIRT1 gene focuses on humans, mice, livestock and poultry (pigs, sheep, chickens, etc.) [30]. Little research has been reported on the SIRT1 gene in fish. It has been found that there is a close correlation between the expression level of the SIRT1 gene and lipid metabolism in pigs [31]. In this study, there was no daily rhythm in the expression levels of the SIRT1 gene under sunny conditions, while there was a daily rhythm in the expression levels of SIRT1 under cloudy conditions. This may result from the involvement of CLOCK and BMAL1 in the regulation. It has been shown that SIRT1 interacts with BMAL1, PER2 and CRY1 in the liver of mice [32]. In rainbow trout [33], SIRT1 interacts with BMAL1, PER2, PER3, CLOCK and BMAL1, with CLOCK and BMAL1 controlling the rhythm of SIRT1, which is in agreement with the results of this study.
SREBP1 plays a key role in regulating lipid homeostasis, and REVERBA is a powerful transcriptional repressor that plays an important role in rhythms. In this study, SREBP1 showed a clear daily rhythm under sunny conditions, and both REVERBA and SREBP1 had a daily rhythm under cloudy conditions with similar trends, but REVERBA peaked at 12:00 and SREBP1 peaked at 18:00 when the rhythm genes regulate SREBP1 expression. This is probably due to the delayed expression levels of the SREBP1 metabolic gene, resulting in a peak at 18:00, but REVERBA plays a regulatory role in SREBP1 gene expression. It has been shown that REVERBA can regulate the expression of SREBP1 in the salmon liver, that SREBP1 exhibits daily rhythmicity, and that REVERBA has a regulatory effect on SREBP1 [15], which is consistent with the results of this experimental study. In the present study, SIRT1 and SREBP1 showed an up-regulation trend both under sunny and cloudy conditions, and the expression level of SIRT1 continued to increase with time. It has been shown that LPL is expressed in the liver of fish and can exhibit changes in lipid metabolism and deposition [34]. In this study, because of the high activity of mackerel tuna during the day under sunny or cloudy conditions, the mackerel tuna was active in the water at this time, prompting an increase in its metabolic levels and making its expression levels up-regulated during the day.

4.3. Immune Gene Expression Patterns

The TRIM family of proteins belongs to the RING family of E3 ubiquitin ligases. NF-kB is an important nuclear transcription factor involved in regulating the body’s immune response, and abnormal regulation can lead to immune diseases, metabolic diseases, etc. The TRIM family of proteins is involved in the regulation of the NF-kB signaling pathway as E3 ubiquitin ligases [35,36,37]. Interferon (IFN) receptor proteins are a class of cytokines secreted by host cells that regulate the immune response. When a pathogen is present, interferon is usually released by the host cell, which is sensed by surrounding undisturbed cells and activates appropriate cellular defense mechanisms to eliminate the pathogen [38]. The composition, signaling pathways, function and evolutionary relationships of the IFN were extensively studied in fish many years ago [39,40,41]. It has been shown that TRIM35 is a positive regulatory molecule in the natural immune signaling pathway [42]. In this study, TRIM35 did not show daily rhythmicity under sunny conditions, but there were significant differences between groups. The expression level of TRIM35 was up-regulated by sunny weather conditions. NF-kB1 showed significant daily rhythmicity in both sunny and cloudy conditions. However, under sunny conditions, the expression level of NF-kB1 showed an increasing trend and started to decrease by 24:00. IFNA3 showed daily rhythmicity only in sunny conditions. It has been shown that the expression of EcTRIM21 significantly increased the IFN promoter activity and simultaneously increased the transcriptional levels of interferon-related molecules, with a positive regulatory effect [43]. This is consistent with the results of the present experimental study.
MHC-I (major histocompatibility complex) plays an important role in adaptive immunity in vertebrates, primarily recognizing intracellular antigens and triggering adaptive immunity. This gene is currently expressed in different fish species, such as the Japanese flounder (Paralichthys olivaceus) [44], turbot (Scophthalmus maximus) [45] and rainbow trout (Oncorhynchus mykiss) [46]. Interferons increase the expression levels of MHC-I class molecules on the cell surface, and an increase in MHC-I molecules on the surface of virus-infected cells contributes to the delivery of antigens to T cells, causing lysis of target cells. It was found that the MHC-I protein is extremely important in immune recognition in zebrafish by positively regulating IFN immunity and inflammatory responses [47]. In the present study, both MHC-I and IFNA3 were expressed in daily rhythms under sunny conditions and were positively regulated. This is consistent with the present study results.
GCL (glutamate-cysteine ligase) is composed of different gene-edited GCLC (glutamate cysteine ligase catalytic subunit) and GCLM (glutamate cysteine ligase), with GCLC playing all catalytic roles and being subject to feedback inhibition by GSH and GCLM having regulatory functions [48]. It has been shown that altered single nucleotide polymorphisms in the GCLC and GCLM genes can regulate gene expression processes and thus participate in various disease processes [49]. In the present study, both GCLM and GCLC were rhythmic under overcast conditions, and expression levels were simultaneously downregulated at 12:00. It has been shown that the expression of NF-kB1 and GCLC are mutually regulated [50]. In the present study, NF-kB1 expression levels were down-regulated when GCLC expression levels were up-regulated, suggesting that the down-regulation of GCLC expression may be related to the inhibition of the signaling pathway.

5. Conclusions

In summary, the mRNA expression levels of rhythm and immune- and metabolism-related genes in the liver tissue of mackerel tuna were significantly changed under sunny and cloudy conditions, and some genes showed significant daily rhythmicity. Immune and metabolic genes can be regulated by rhythm genes and external factors through different signaling pathways and are jointly involved in regulating immunity and energy metabolism in mackerel tuna. This study provides practical implications for further understanding the regulation of lipid metabolism and immunity in mackerel tuna.

Author Contributions

Conceptualization, G.Y. and J.H.; Methodology, J.H.; Software, J.H.; Validation, J.H. and W.W.; Formal analysis, G.Y.; Investigation, Z.F.; Resources, Z.M.; Data curation, W.W.; Writing—original draft preparation, W.W.; Writing—review and editing, Z.M. and Z.F.; Visualization, J.H.; Supervision, G.Y.; Project administration, Z.M.; Funding acquisition, Z.M. All authors have read and agreed to the published version of the manuscript.

Funding

This work was supported by the Guangxi Innovation Driven Development Special Fund Project (grant no. Guike AA18242031), the Central Public-Interest Scientific Institution Basal Research Fund, CAFS (2020TD55), and the Central Public-Interest Scientific Institution Basal Research Fund South China Sea Fisheries Research Institute, CAFS (2021SD09).

Institutional Review Board Statement

The animal study protocol was approved by the Institutional Review Board (or Ethics Committee) of Animal Care and Use Committee of South China Sea fisheries Research Institute, Chinese Academy of Fishery Sciences (BIOL5312, 5 July 2021).

Informed Consent Statement

Not applicable.

Data Availability Statement

The original contributions presented in the study are included in the article. Further inquiries can be directed to the corresponding authors.

Conflicts of Interest

The authors declare no conflict of interest.

Ethics Statement

The experiment complied with the regulations and guidelines established by the Animal Care and Use Committee of the South China Sea fisheries Research Institute, Chinese Academy of Fishery Sciences.

References

  1. Feng, N.Y.; Bass, A.H. “Singing” Fish Rely on Circadian Rhythm and Melatonin for the Timing of Nocturnal Courtship Vocalization. Curr. Biol. 2016, 19, 2681–2689. [Google Scholar] [CrossRef] [PubMed] [Green Version]
  2. Hardin, P.E.; Panda, S. Circadian timekeeping and output mechanisms in animals. Curr. Opin. Neurobiol. 2013, 23, 724–731. [Google Scholar] [CrossRef] [PubMed] [Green Version]
  3. Mahman-Averbuch, H.; King, C.D. Disentangling the roles of circadian rhythms and sleep drive in experimental pain sensitivity. Trends Neurosci. 2022, 11, 796–797. [Google Scholar] [CrossRef] [PubMed]
  4. Patek, A.; Young, M.W.; Axelrod, S. Molecular mechanisms and physiological importance of circadian rhythms. Nat. Rev. Mol. Cell Biol. 2020, 21, 67–84. [Google Scholar] [CrossRef] [PubMed]
  5. Nakaya, M.; Wakamatsu, M.; Motegi, H.; Tanaka, A.; Sutherland, K.; Ishikawa, M.; Ozaki, M.; Shirato, H.; Hamada, K.; Hamada, T. A real-time measurement system for gene expression rhythms from deep tissus of freely moving mice under light-dark conditions. Biochem. Biophys. Rep. 2022, 32, 101344. [Google Scholar]
  6. Bertolucci, C.; Fazio, F.; Piccione, G. Daily rhythms of serum lipids in dogs: Influences of lighting and fasting cycles. Comp. Med. 2008, 58, 485–489. [Google Scholar]
  7. Takahashi, J.S.; Hee-Kyung, H.; Ko, C.H.; McDearmon, E.L. The genetics mammalian circadian order and disorder: Implications for physiology and disease. Nat. Rev. Genet. 2008, 10, 764–775. [Google Scholar] [CrossRef]
  8. Sato, F.; Kohsaka, A.; Bhawal, U.K.; Muragaki, Y. Potential Roles of Dec and Bmal1 Genes in Interconnecting Circadian Clock and Energy Metabolism. Int. J. Mol. Sci. 2018, 3, 781. [Google Scholar] [CrossRef] [Green Version]
  9. Lee, C.; Etchegaray, J.-P.; Cagampang, F.R.; Loudon, A.S.; Reppert, S.M. Posttranslational mechanisms regulate the mammalian circadian clock. Cell 2001, 107, 855–867. [Google Scholar] [CrossRef]
  10. Panda, S.; Hogenesch, J.B.; Kay, S.A. Circadian rhythms from flies to human. Nature 2002, 417, 329–335. [Google Scholar] [CrossRef]
  11. Chen, L.; Hu, C.; Lai, N.L.; Zhang, W.; Hua, J.; Lam, P.K.S.; Lam, J.C.W.; Zhou, B. Acute exposure to PBDEs at an environmentally realistic concentration causes abrupt changes in the gut microbiota and host health of zebrafish. J. Environ. 2018, 240, 17–26. [Google Scholar] [CrossRef]
  12. Shibata, S.; Tominaga, K. Brain neuronal mechanisms of circadian rhythms in mammalians. Yakuga Zasshi 1991, 111, 270–283. [Google Scholar] [CrossRef] [PubMed]
  13. Welsh, D.; Takahashi, J.; Kay, S. Suprachiasmatic nucleus: Cellautonomy and network properties. Annu. Rev. Physiol. 2010, 72, 551–577. [Google Scholar] [CrossRef] [PubMed] [Green Version]
  14. Le Martelot, G.; Claudel, T.; Gatfield, D.; Schaad, O.; Kornmann, B.; Sasso, G.L.; Moschetta, A.; Schibler, U. REV-ERB alpha participates in circadian SREBP signalling and bile acid homeostasis. PLoS Biol. 2009, 7, e1000181. [Google Scholar] [CrossRef] [PubMed] [Green Version]
  15. Eckel-Mahan, K.L.; Patel, V.R.; Mohney, R.P.; Vignola, K.S.; Baldi, P.; Sassone-Corsi, P. Coordination of the transcriptome and metabolome by the circadian clock. Proc. Natl. Acad. Sci. USA 2012, 109, 5541–5546. [Google Scholar] [CrossRef] [PubMed] [Green Version]
  16. Sanchez, R.E.A.; Franck, K.; de la Iglesia, H.O. Slepp timing and the circadian clock in mammals: Past, present and the road ahead. Semin. Cell Dev. Biol. 2022, 126, 3–14. [Google Scholar] [CrossRef] [PubMed]
  17. Brooks, J.F., II; Cassie, L.; Behrendt, K.; Ruhn, A.; Lee, S.; Raj, P.; Takahashi, J.S.; Hooper, L.V. The microbiota coordinates diurnal rhythms in innate immunity with the circadian clock. Cell 2021, 16, 4154–4167. [Google Scholar] [CrossRef]
  18. Yazawa, R.; Takeuchi, Y.; Satoh, K.; Machida, Y.; Amezawa, K.; Kabeya, N.; Shimada, Y.; Yoshizaki, G. Eastern little tuna, Euthynnus affinis (Cantor, 1849) mature and reproduce within 1 year of rearing in land-based tanks. Aquac. Res. 2016, 47, 3800–3810. [Google Scholar] [CrossRef]
  19. IOTC Secretariat. Assessment of Indian Ocean kawakawa (Euthynnus affinis) Using Data Poor Catch-Based Methods(2015). Available online: http://www.seafdec.org/documents/2020/02/pw-neritic-tuna_10-4.pdf (accessed on 7 November 2022).
  20. Shengjie, Z.; Rui, Y.; Gang, Y.; Qiaer, W.; Zhenhua, M. Growth of Longtail Tuna Thunnus tonggol and Small Tuna Euthymmus affinis in Circulating Water Ponds. Fish. Sci. 2021, 40, 339–346. [Google Scholar]
  21. Ceinos, R.M.; Chivite, M.; López-Patiño, M.A.; Naderi, F.; Soengas, J.L.; Foulkes, N.S.; Míguez, J.M. Differential circadian and light-driven rhythmicity of clock gene expression and behaviour in the turbot, Scophthalmus maximus. PLoS ONE 2019, 14, e0219153. [Google Scholar] [CrossRef]
  22. Reeds, S.G. Sensory Systems, Perception, and Learning. Circadian Rhythms in Fish. In Encyclopedia of Fish Physiology; Academic Press: Cambridge, MA, USA, 2011; pp. 736–743. [Google Scholar]
  23. Xiao, L.; Yong, D.; Yan-ling, Z. Research progress of CREB in angiogenesis, anti-apoptosis and lung cancer. Tianjin Med. 2019, 47, 431–435. [Google Scholar]
  24. Husse, J.; Eichele, G.; Oster, H. Synchronization of the mammalian circadian timing system: Light can control peripheral clocks independently of the SCN clock: Alternate routes of entrainment optimize the alignment of the body’s circadian clock network with external time. Bioessays 2015, 37, 1119–1128. [Google Scholar] [CrossRef] [PubMed] [Green Version]
  25. Betancor, M.B.; Spragu, M.; Minghetti, M.; Migaud, H.; Tocher, D.R.; Davie, A. Daily Rhythms in Expression og Genes of Hepatic Lipid Metabolism in Atlantic Salmon (Salmo salas L.). PLoS ONE 2014, 9, e106739. [Google Scholar] [CrossRef] [PubMed] [Green Version]
  26. Betancor, M.B.; Sprague, M.; Ortega, A.; de la Gándara, F.; Tocher, D.R.; Ruth, R.; Perkins, E.; Mourente, G. Central and peripheral clocks in Atlantic bluefin tuna (Thunnus thynnus, L.): Daily rhythmicity of hepatic lipid metabolism and digestive genes. Aquaculture 2020, 523, 735220. [Google Scholar] [CrossRef]
  27. Huang, T.S.; Ruoff, P.; Fjelldal, P.G. Effect of continuous light on daily levels of plasma melatonin and cortisol and expression of clock genes in pineal gland, brain, and liver in atlantic salmon postsmolts. Chronobiol. Int. 2010, 27, 1715–1734. [Google Scholar] [CrossRef] [PubMed]
  28. Mohamed, A.A.-R.; El-Houseiny, W.; EL-Murr, A.E.; Ebraheim, L.L.M.; Ahmed, A.I.; El-Hakim, Y.M.A. Effect of hexavalent chromium exposure on the liver and kidney tissues related to the expression of CYP450 and GST genes of Oreochromis niloticus fish: Role of curcumin supplemented diet. Ecotoxicol. Environ. Saf. 2020, 188, 109890. [Google Scholar] [CrossRef]
  29. Brunet, A.; Sweeney, L.B.; Sturgill, J.F.; Chua, K.F.; Greer, P.L.; Lin, Y.; Tran, H.; Ross, S.E.; Mostoslavsky, R.; Cohen, H.Y.; et al. Stress-dependent regulation of FOXO transcription factors by the SIRT1 deacetylase. Science 2004, 303, 2011–2015. [Google Scholar] [CrossRef] [Green Version]
  30. Finkel, T.; Deng, C.X.; Mostoslavsky, R. Recent progress in the biology and physiology of sirtuins. Nature 2009, 460, 587–591. [Google Scholar] [CrossRef] [Green Version]
  31. Bai, L.; Pang, W.-J.; Yang, Y.-J.; Yang, G.-S. Modulation of Sirt1 by resveratrol and nicotinamide alters proliferation and differentiation of pig preadipocytes. Mol. Cell. Biochem. 2008, 307, 129–140. [Google Scholar] [CrossRef] [Green Version]
  32. Asher, G.; Gatfield, D.; Stratmann, M.; Reinke, H.; Dibner, C.; Kreppel, F.; Mostoslavsky, R.; Alt, F.W.; Schibler, U. SIRT1 regulates circadian clock gene expression through PER2 deacetylation. Cell 2008, 134, 317–328. [Google Scholar] [CrossRef] [Green Version]
  33. Naderi, F.; Míguez, J.M.; Soengas, J.L.; López-Patiño, M.A. SIRT1 mediates the effect of stress on hypothalamic clock genes and food intake regulators in rainbow trout, Oncorhynchus mykiss. Comp. Biochem. Physiol. Part A Mol. Integr. Physiol. 2019, 235, 102–111. [Google Scholar] [CrossRef] [PubMed]
  34. Wang, L.; Kaneko, G.; Takahashi, S.I.; Watabe, S.; Ushio, H. Identification and gene expression profile analysis of a major type of lipoprotein lipase in adult madaka Oryzias latipes. Fish. Sci. 2015, 81, 163–173. [Google Scholar] [CrossRef]
  35. Kentsis, A.; Borden, K.L. Construction Fish & Shellfish Immunology. of macromolecular assemblages in eukaryotic processes and their role in human disease: Linking EINGs together. Curr. Protein Sci. 2000, 1, 49–73. [Google Scholar]
  36. Rajsbaum, R.; Garcia-Sastre, A.; Versteeg, G.A. TRIM munity: The roles of the TRIM E3-ubiquitin ligase family in innate antiviral immunity. Mol. Biol. 2014, 426, 1265–1284. [Google Scholar] [CrossRef] [PubMed] [Green Version]
  37. Borden, K.L. RING fingers and B-boxes: Zinc-binding protein-protein interaction domains. Biochem. Cell Biol. 1998, 76, 351–358. [Google Scholar] [CrossRef]
  38. Kong, Y.; Gao, C.; Du, X.; Zhao, J.; Li, M.; Shan, X.; Wang, G. Effects of single or conjoint administration of lactic acid bacteria as potential probiotics on growth, immune response and disease resistance of snakehead fish (Channa argus). Fish Shellfish Immunol. 2020, 102, 412–421. [Google Scholar] [CrossRef]
  39. Xiao, X.; Zhu, W.T.; Zhang, Y.Q.; Liao, Z.; Wu, C.; Yang, C.; Zhang, Y.; Xiao, S.; Su, J. Broad-spectrum robust direct bactericidal activity of fish IFN ϕ1 reveals an antimicrobial peptide-like function for type I IFNs in vertebrates. J. Immunol. 2021, 206, 1337–1347. [Google Scholar] [CrossRef]
  40. Gale, M., Jr. Interference with virus infection. J. Immunol. 2015, 195, 1909–1910. [Google Scholar] [CrossRef] [Green Version]
  41. Zou, J.; Secombes, C.J. Teleost fish interferons and their role in immunity. Dev. Comp. Immunol. 2011, 35, 1376–1387. [Google Scholar] [CrossRef]
  42. Langevin, C.; Levraud, J.; Boudinot, P. Fish antiviral tripartite motif (TRIM35) proteins. Fish Shellfish Immunol. 2019, 86, 724–733. [Google Scholar] [CrossRef]
  43. Zheng, J.; Zhi, L.; Wang, W.; Ni, N.; Huang, Y.; Qin, Q.; Huang, X. Fish TRIM21 exhibits antiviral activity against grouper iridovirus and nodavirus infection. Fish Shellfish Immunol. 2022, 127, 956–964. [Google Scholar] [CrossRef] [PubMed]
  44. Xu, T.; Chen, S. Genomic structure of DAA gene and polymorphism within MHC -DAA alleles in apanese flounder (Paralichthys olivaceus). Hereditas 2009, 31, 1020–1028. [Google Scholar] [PubMed]
  45. Zhang, Y.; Chen, S. Full length cDNA cloning and tissus expression of major histocompatibility complex (MHC)IIa from turbot Scophthalmus maximus. Oceanol. Limnol. Sin. 2007, 38, 221–226. [Google Scholar]
  46. Glamann, J. Complete coding sequence of rainbow trout Mhc II beta chain. Scand. Immunol. 1995, 41, 365–372. [Google Scholar] [CrossRef]
  47. Chen, J.; Wang, L.; Huang, J.; Li, X.; Guan, L.; Wang, Q.; Yang, M.; Qin, Q. Functional analysis of a novel MHC-Iα genotype in orange-spotted grouper: Effects on Singapore grouper iridovirus (SGIV) replication and apoptosis. Fish Shellfish Immunol. 2022, 121, 487–497. [Google Scholar] [CrossRef] [PubMed]
  48. Bansal, A.; Simon, M.C. Glutathione metabolism in cancer progression and treatment resistance. Cell. Biol. 2018, 217, 2291–2298. [Google Scholar] [CrossRef]
  49. Zhang, S.; Wu, Y.; Liu, Z.; Tao, Q.; Huang, J.; Yang, W. Hepatic pathology of biliary atresia: A new comprehensive evaluation method using liver biopsy. Turk. Gastroenterol. 2016, 27, 257–263. [Google Scholar] [CrossRef]
  50. Yang, H.; Magilnick, N.; Lee, C.; Kalmaz, D.; Ou, X.; Chan, J.Y.; Lu, S.C. Nrf1 and Nrf2 regulate rat glutamate-cysteine ligase catalytic subunit transcription indirectly via NF-kappaB and AP-1. Mol. Cell. Biol. 2005, 25, 5933–5946. [Google Scholar] [CrossRef]
Figure 1. Expression of liver rhythm genes during 24 h in different weather in mackerel tuna. (a): CREB1; (b): CLOCK; (c): RORA; (d): PER1; (e): PER2; (f): PER3; (g): CRY1; (h): CRY2; (i): REVERBA; (j): BMAL1. Red in each graph represents sunny days, and blue represents cloudy days. The presence of different letters indicates significance by ANOVA and Tukey’s tests (p < 0.05). * represents significant differences at the same time point (p < 0.05). Differences between those with different lowercase letters indicate significance (p < 0.05), while the opposite difference is not significant (p > 0.05); the same for the latter figure.
Jmse 10 02028 g001
Figure 2. Expression of hepatic metabolic genes during 24 h in different weather in mackerel tuna. (a): SIRT1; (b): GST; (c): LPL; (d): SREBP1. Red in each graph represents sunny days, and blue represents cloudy days. The presence of different letters indicates significance by ANOVA and Tukey’s tests (p < 0.05). * represents significant differences at the same time point (p < 0.05).
Jmse 10 02028 g002
Figure 3. Expression of liver immune genes in different weather conditions in mackerel tuna over a 24 h period. (a): TRIM35; (b): NF-kB1; (c): MHC-I; (d): ALT; (e): IFNA3; (f): ISY1; (g): ARHGEF13; (h): GCLM; (i): GCLC. Red in each graph represents sunny days, and blue represents cloudy days. The presence of different letters indicates significance by ANOVA and Tukey’s tests (p < 0.05). * represents significant differences at the same time point (p < 0.05).
Jmse 10 02028 g003
Table 1. Environmental indicators.
6:0012:0018:0024:00
Sunny dayWater temperature (°C)31.8 ± 0.1333 ± 0.2133.6 ± 0.1732.6 ± 0.22
Light intensity (Lx)2.7 ± 0.021116 ± 0.12913 ± 0.041 ± 0.01
DO (mg·L)7.76 ± 0.247.59 ± 0.197.6 ± 0.27.61 ± 0.25
Cloudy dayWater temperature (°C)31.6 ± 0.1133 ± 0.1632.9 ± 0.232.6 ± 0.16
Light intensity (Lx)1.9 ± 0.01698 ± 0.03192 ± 0.051.4 ± 0.01
DO (mg·L)7.62 ± 0.177.54 ± 0.117.55 ± 0.137.58 ± 0.09
Table 2. Relevant primer information.
GeneFull Names of Target GenesPrimer Sequence (5′-3′)Amplicon Size/bp
GAPDHGlyceraldehyde-3-phosphate dehydrogenaseF: ACACTCACTCCTCCATCTTTG100
R: TTGCTGTAGCCGAACTCAT
TRIM35Tripartite motif-containing 35F: GTCTGAAGAGCTGGTGGA85
R: TTACGAGGTGGTTTGTCC
NF-kB1Nuclear factor of kappa light polypeptide gene enhancer in B-cells 1F: CCCAAAGACTCCAGCATCA117
R: GCAGTTGTATCCCATCCTCAA
MHC-IMajor histocompatibility complex 1F: GCCCTCCTGCTCCTTCTT83
R: GGTTTGCCTCCTCCAATT
ALTAlanine aminotransferaseF: CAGGCTTACGGAGCAAAT100
R: TCGTGGTGGGATGAAGAT
IFNA3Interferon a3F: GGTCTGCGTCCCTGTATT102
R: AGCACTGTGACCCATTCG
ISY1Splicing factor ISY1 homologF: GTTCGGATCAAAGAGTTGGG90
R: CAGACTGGCTGGTGTATAATGG
ARHGEF13A-kinase anchor protein 13F: CCGTCAACTTCTACAAGGA85
R: CGCACAATGCTGCTACTC
SIRT1Sirtuin 1F: AGAAGAGGCTGCGGAAGT99
R: AGGCGTTTGCTGATTGGA
GCLMGlutamate cysteine ligase modifier subunitF: CTGAGCGACTGGTCTTCC93
R: CGTGATAGCGTCTGTTGG
GCLCGlutamate-cysteine ligase catalytic subunitF: CTGTTGAGAAGGGAGTGTC87
R: TGTTTCTGGTAAGGGTGC
GSTGlutathione s-transferaseF: CGCCAAGAAGAACAACAT117
R: TCTCGAAGAGCAGGGACT
LPLLipoprotein lipaseF: AGGATGCGACATACAGAACA112
R: GAAGAGGTGGATGGAACG
SREBP1Sterol regulatory element binding transcription factor 1F: GACTGACTTGACCGTGTTC112
R: CTCCTCCTCTTGTTCATCCT
CREB1cAMP responsive element binding protein 1F: TGCCCACTCCCATCTATC93
R: CTCCATCTGTGCCGTTATT
CLOCKClock circadian regulatorF: TGTGGACGACCTGGAGAC84
R: AGGAAACGGTAGTAGCAAG
PER1Period 1F: CCAAAGGCGGTTCAGTTA144
R: GAGGCTTCTTGTCTCCCAC
PER2Period 2F: TCTAATGGAGTCGTCAGGGAG119
R: AGCCGCTGGTTGAAGGAT
PER3Period 3F: TCATCGGACGGCATAAAG85
R: TGGGTGACTGGGAAATACTC
RORAHomo sapiens RAR-related orphan receptor AF: CTGGATAGGGTGGGTGGAA84
R: CGTTGGCCCGGATTAGAG
REV-ERBANuclear receptor subfamily 1 group D member 1F: CCTACAACCATCCCACAG88
R: ACCTTACATAGAAGCACCATA
CRY1Cryptochrome 1F: GTGGGCAGCCTCCTCTTA145
R: CCGTACTTGTCTCCGTGGTC
CRY2Cryptochrome 2F: CTACATGAAGCTCCGTAAGC108
R: CGGTCAAAGTTTGGGTTG
BMAL1Brain and muscle Arnt-like 1F: CGTCCAGTGGTAATGTCA176
R: CATGAGTGCTTCTCCTCC
Table 3. Cosinor analysis board for rhythm gene expression under sunny and cloudy conditions.
GeneWeatherAcro (p-Value)Acrophase
CREB1Sunny dayn.s.
Cloudy day<0.0112 ± 1.16
CLOCKSunny dayn.s.
Cloudy day<0.0056 ± 0.92
PER1Sunny dayn.s.
Cloudy day<0.00112 ± 0.79
PER2Sunny day<0.0010 ± 0.61
Cloudy dayn.s.
PER3Sunny dayn.s.
Cloudy day<0.050 ± 1.89
RORASunny dayn.s.
Cloudy dayn.s.
REVERBASunny day<0.00118 ± 0.43
Cloudy day<0.00112 ± 0.85
CRY1Sunny dayn.s.
Cloudy dayn.s.
CRY2Sunny day<0.0010 ± 0.83
Cloudy dayn.s.
BMAL1Sunny day<0.00112 ± 0.57
Cloudy day<0.0056 ± 0.81
n.s. denotes statistical differences between the sampling points. Acrophases (circadian peak times) were calculated by a non-linear regression fit of a cosine function. Data are expressed as acrophase ± 95% confidence intervals.
Table 4. Effects of light intensity and duration on the rhythm genes of mackerel tuna under different weather conditions.
p-Value
GenesTimeWeatherInteractions
CREB1<0.001<0.001<0.001
CLOCK<0.001<0.001<0.001
RORA<0.001<0.001<0.001
PER1<0.001<0.001<0.001
PER2<0.001<0.001<0.001
PER3<0.001<0.001<0.001
CRY1<0.001<0.001<0.001
CRY2<0.0010.339<0.001
REVERBA<0.001<0.001<0.001
BMAL1<0.0010.026<0.001
Results of the two-way ANOVA with SPSS for the measured factors. When interactions in the analysis are significant (p < 0.001), a between-group comparison and an independent samples t-test at the same time point are used (the same applies below).
Table 5. Cosinor analysis board for metabolic genes expression under the sunny and cloudy conditions.
GeneWeatherAcro (p-Value)Acrophase
SIRT1Sunny dayn.s.
Cloudy day<0.00118 ± 0.59
GSTSunny dayn.s.
Cloudy dayn.s.
LPLSunny dayn.s.
Cloudy dayn.s.
SREBP1Sunny day<0.050 ± 1.29
Cloudy day<0.00118 ± 0.77
n.s. denotes statistical differences between the different sampling points. Acrophases (circadian peak times) were calculated by a non-linear regression fit of a cosine function. Data are expressed as acrophase ± 95% confidence intervals.
Table 6. Effects of light intensity and duration on metabolic genes in mackerel tuna under different weather conditions.
p-Value
GenesTimeWeatherInteractions
SIRT1<0.0010.0350.022
GST<0.001<0.001<0.001
LPL<0.0010.007<0.001
SREBP1<0.001<0.001<0.001
Table 7. Cosinor analysis board for immune genes expression under sunny and cloudy conditions.
GeneWeatherAcro (p-value)Acrophase
TRIM35Sunny dayn.s.
Cloudy dayn.s.
NF-KB1Sunny day<0.00118 ± 0.5
Cloudy day<0.0112 ± 1.13
MHC-ISunny day<0.00518 ± 1.03
Cloudy dayn.s.
ALTSunny day<0.00518 ± 1.07
Cloudy day<0.00512 ± 1.03
IFNA3Sunny day<0.00118 ± 0.39
Cloudy dayn.s.
ISY1Sunny day<0.00118 ± 0.79
Cloudy day<0.00118 ± 0.64
ARHGEF13Sunny day<0.0518 ± 1.43
Cloudy day<0.00512 ± 1.03
GCLMSunny day<0.0512 ± 1.26
Cloudy day<0.00112 ± 0.75
GCLCSunny dayn.s.
Cloudy day<0.050 ± 1.36
n.s. denotes statistical differences between the different sampling points. Acrophases (circadian peak times) were calculated by a non-linear regression fit of a cosine function. Data are expressed as acrophase ± 95% confidence intervals.
Table 8. Effects of light intensity and duration on immune genes in mackerel tuna under different weather conditions.
p-Value
GenesTimeWeatherInteractions
TRIM35<0.001<0.001<0.001
NF-kB1<0.001<0.001<0.001
MHC-I<0.001<0.001<0.001
ALT<0.001<0.001<0.001
IFNA3<0.0010.022<0.001
ISY1<0.001<0.001<0.001
ARHGEF13<0.001<0.001<0.001
GCLM<0.001<0.001<0.001
GCLC<0.0010.2050.002
Publisher’s Note: MDPI stays neutral with regard to jurisdictional claims in published maps and institutional affiliations.

