Article

Stability Characteristics of Horizontal Wells in the Exploitation of Hydrate-Bearing Clayey-Silt Sediments

1
Sanya Offshore Oil and Gas Research Institute, Northeast Petroleum University, Sanya 572025, China
2
Key Laboratory of Gas Hydrate, Ministry of Natural Resources, Qingdao Institute of Marine Geology, Qingdao 266237, China
3
Laboratory for Marine Mineral Resources, Pilot National Laboratory for Marine Science and Technology, Qingdao 266237, China
4
College of Oceanography, Hohai University, Nanjing 210098, China
*
Authors to whom correspondence should be addressed.
J. Mar. Sci. Eng. 2022, 10(12), 1935; https://doi.org/10.3390/jmse10121935
Submission received: 17 November 2022 / Revised: 30 November 2022 / Accepted: 2 December 2022 / Published: 7 December 2022
(This article belongs to the Special Issue Advances in Marine Engineering: Geological Environment and Hazards II)

Abstract

:
The mechanical properties of hydrate-bearing strata in clayey-silt sediments are significantly different from those of either conventional reservoirs or hydrate-bearing sandy sediments, which poses great challenges for wellbore stability analyses. The stability characteristics of a deviated borehole during drilling in hydrate-bearing clayey-silt sediments (HBS-CS) remain to be studied. In this paper, an analysis of the wellbore stability characteristics of a deviated borehole using the Mohr–Coulomb (M-C) criterion and Drucker–Prager (D-P) criterion was carried out based on the elastic stress distribution model of the surrounding strata of the wellbore and the triaxial shear tests of the HBS-CS. The results imply that the collapse pressure and safety density window are symmetrically distributed with deviation angle and azimuth. Considering the effect of hydrate decomposition, the collapse pressure gradient could become higher and the instability risks would be amplified. Considering the combined effects of collapse, fracture pressure gradient, and the safety density window, it is suggested that the borehole be arranged along an azimuth of 60–120°, which could greatly reduce the risk in a drilling operation.

1. Introduction

Natural gas hydrate (NGH) is a kind of low-carbon fossil energy, and vigorously developing NGH is of great significance [1,2,3]. At present, more than 30 countries and/or regions have been actively involved in the development of NGH. In 1976, Russia began to exploit NGH from the permafrost of the Messoyakha [4,5]. In 2002, Japex jointly carried out the NGH pilot production in the Mackenzie delta of Canada in 2002 and 2007–2008 [6,7]. In 2008, the United States successfully exploited NGH on the northern slopes of Alaska by using CO2 replacement [8,9]. In 2013, Japan completed the world’s first offshore NGH development in the Nankai Trough [10,11]. In 2017 [12] and 2020 [13], China completed two rounds of NGH production trials from the clayey-silt sediment in the northern South China Sea.
To improve the gas productivity from HBS-CS, China’s second marine NGH production trial was carried out via a horizontal wellbore. In the process of wellbore construction, the whipstock section passes through the overlaying strata and extends horizontally in the NGH-bearing layer. One of the most crucial challenges during horizontal well drilling is to control the stability of the borehole [14,15,16], which is highly coupled with fluid circulation and fluid losses [17]. For the study of NGH production wellbore stability, Freij-Ayoub et al. (2016) established a wellbore stability analytic model for NGH production [18]. Zhang et al. (2018) analyzed the effect of temperature on the stability of the NGH production borehole [19]. Sun et al. (2018) analyzed the effects of drilling fluid, and the initial reservoir conditions based on the geological backgrounds of the first exploration in the Shenhu area, northern South China Sea [20]. Yuan et al. (2020) simulated the wellbore stability of a vertical wellbore during depressurization [21]. These studies mainly focus on the wellbore stability of vertical or horizontal wellbores. However, the stability of the wellbore of highly deviated sections was rarely reported. Additionally, the M-C criterion was mostly adopted in the failure evaluation, but the influence of intermediate principal stress was ignored, which might affect the calculation accuracy of wellbore stability.
In this paper, the stability characteristics of an inclined wellbore during drilling are analyzed. The failure criteria of the M-C and the D-P are deployed, respectively. Taking the collapse pressure, fracture pressure, and the safety density window as the main evaluation indices, the effects of hydrate saturation (Sh), the deviation angle, and the azimuth on the stability of the borehole are clarified. The results may have some significance for drilling design in the clayey-silt HBS in the northern South China Sea.

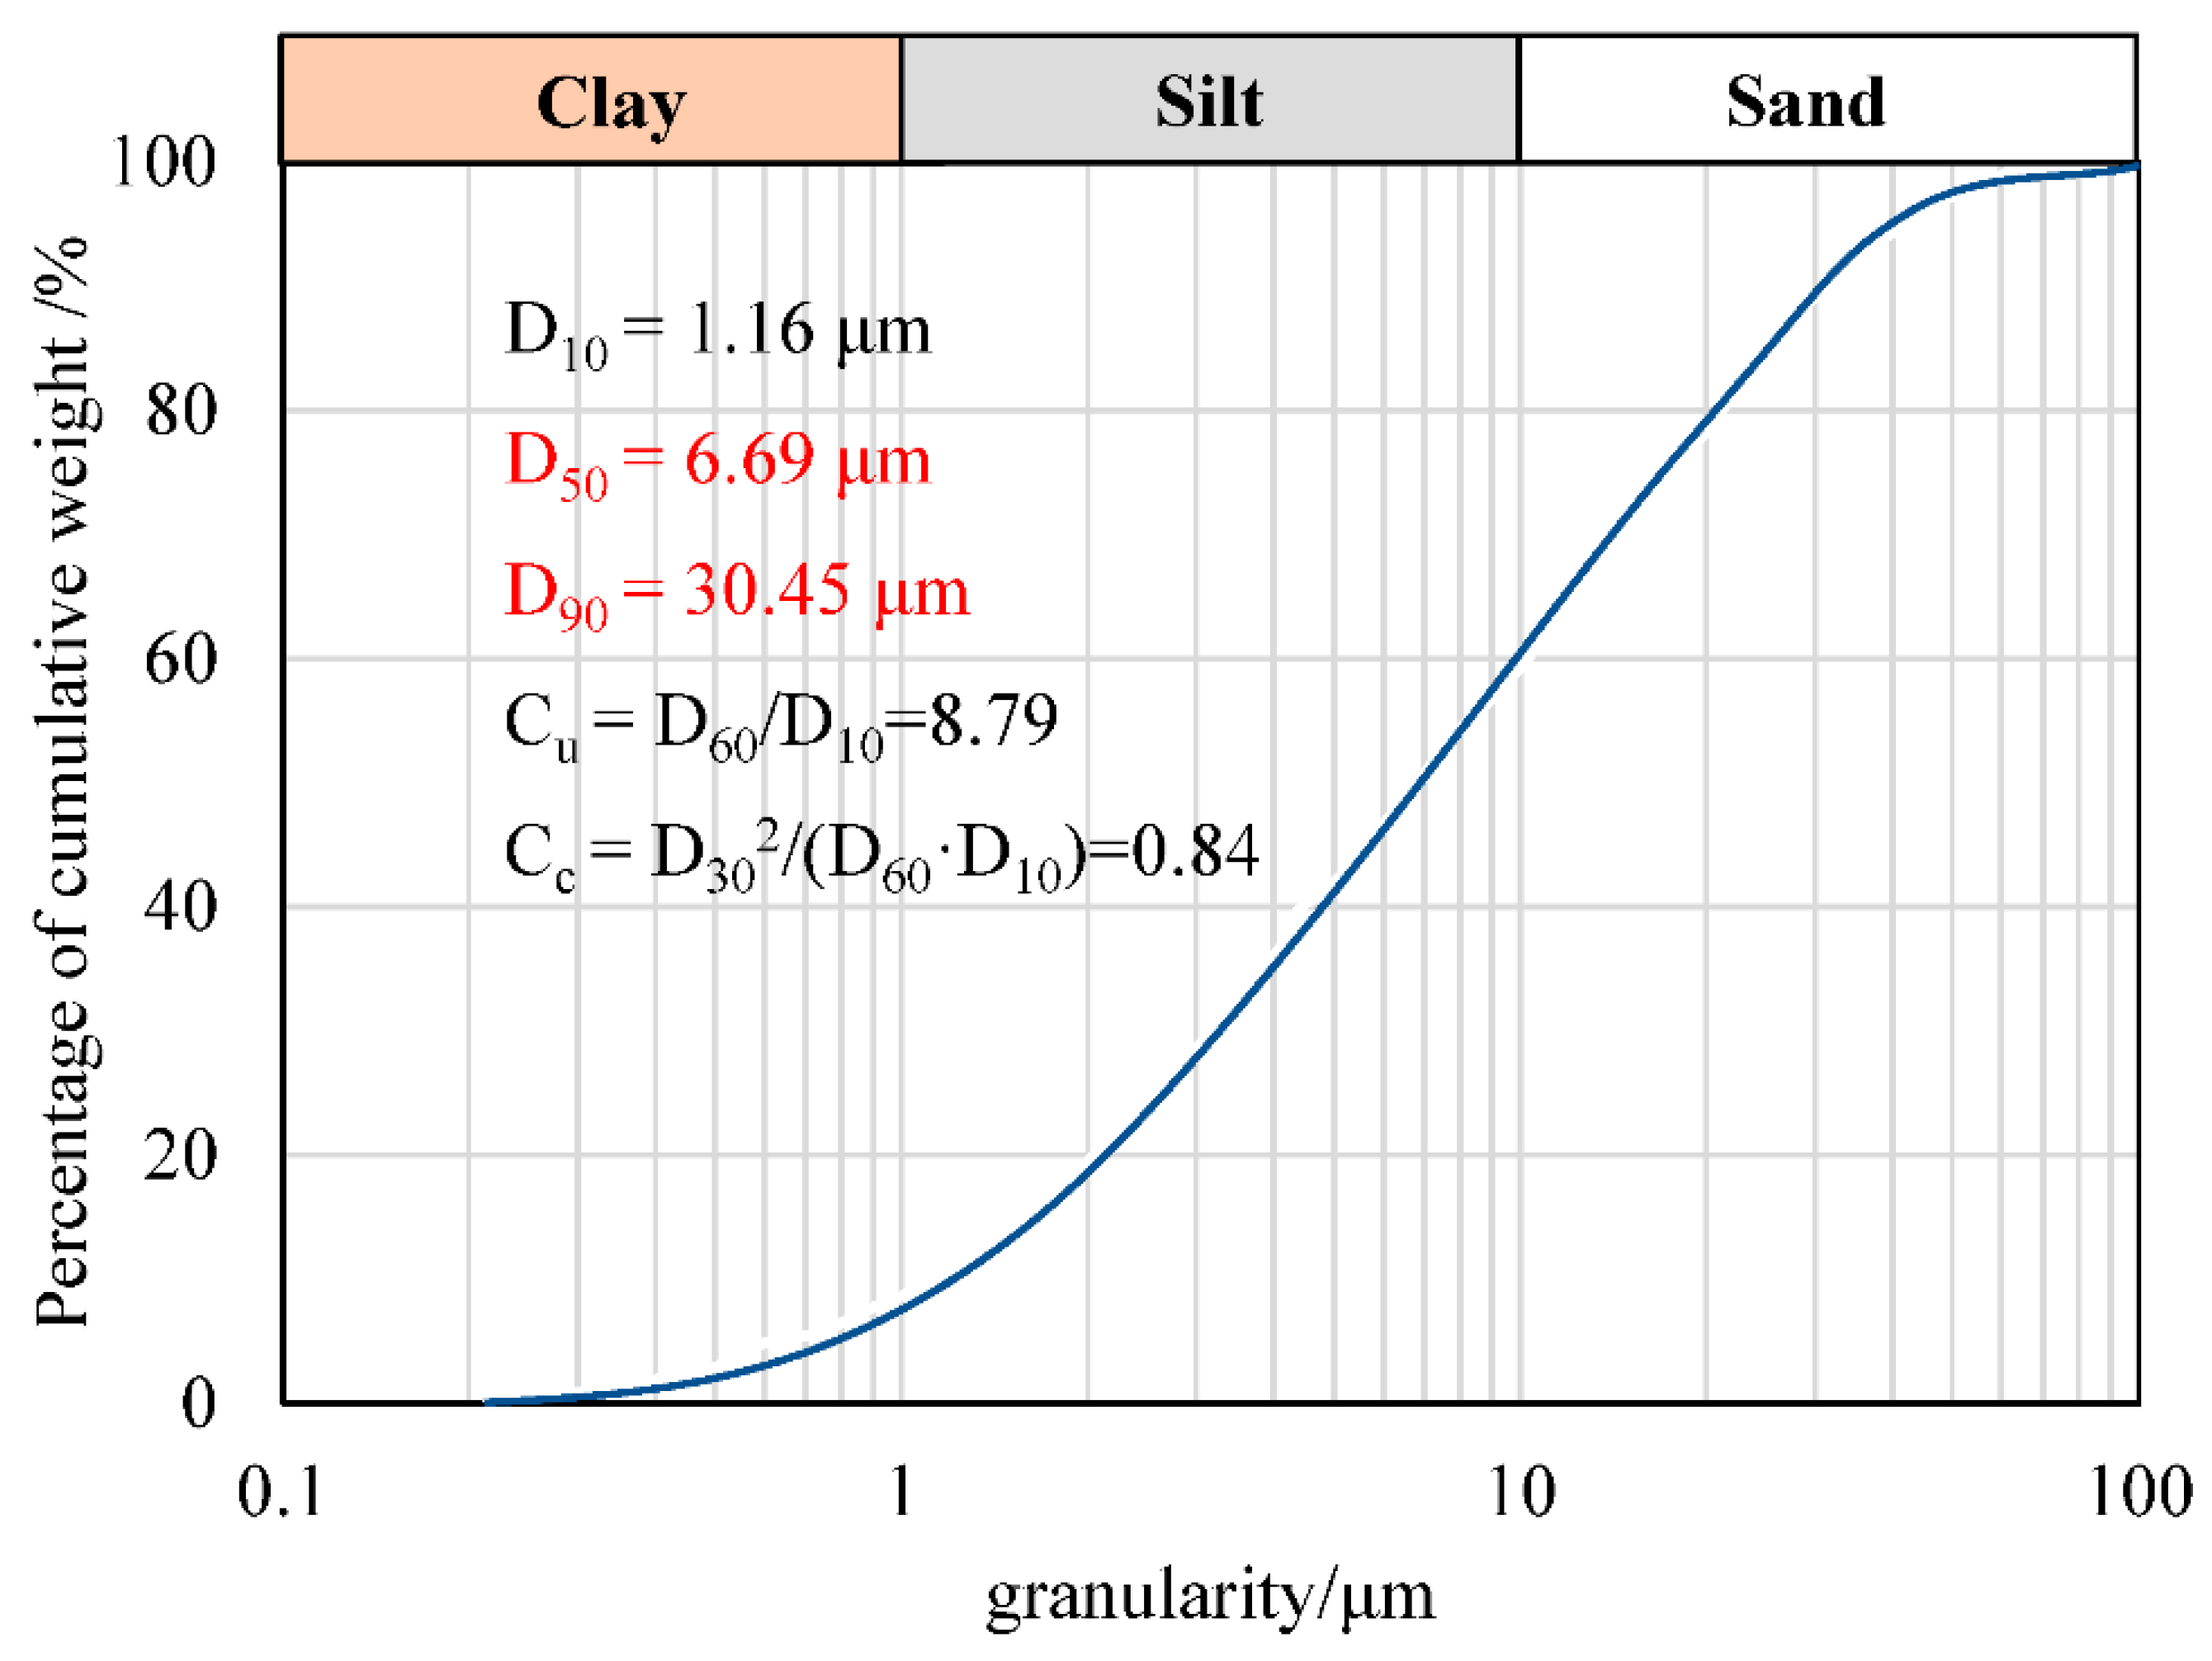
2. Mechanical Parameters of HBS-CS

The basic mechanical parameters of the HBS-CS were obtained from triaxial shear tests. A detailed description of the experimental devices can be found in our previous publication [22,23]. The steps of the triaxial shear tests are as follows: (1) HBS-CS skeleton prefabrication; (2) triaxial testing system installation; (3) apply confining pressure; and (4) hydrate formation, which has real-time monitoring of the hydrate saturation by time domain reflectometry, and finally the triaxial shear tests.
The sediment in the Shenhu area, northern South China Sea is mainly composed of argillaceous siltstone with poor cementation strength and a high content of silt and clay [23,24]. The particle size distribution of the sediment is shown in Figure 1, in which the medium grain size is about 7 μm. The actual Sh range is between 20% and 60% [14], and hence, the predetermined Sh is 15%, 30%, 45%, and 60% in the experiments. The effective confining pressure was set as 1 MPa, 2 MPa, and 4 MPa in the triaxial shear tests, respectively.
The basic mechanical parameters of HBS-CS were obtained, as shown in Table 1. It could be seen that the cohesion and the internal friction angle of the HBS-CS are much lower than that of the conventional natural gas reservoirs (Li et al., 2020), and the cohesion and friction angle increased with the increase in Sh. For a detailed analysis of mechanical properties, refer to the literature [25,26].

3. Model Description

3.1. Stress Distribution around the Wellbore

Currently, scholars have mainly investigated borehole stability in NGH-bearing sediments by referring to similar problems in conventional formations. NGH-bearing sediments are always regarded as elastic or elastic–plastic materials when doing borehole stability analysis. In the analysis of collapse pressure, the elastic model was often used [18,20,27,28]. Therefore, in this study, the HBS-CS formation is assumed to be an elastic material, and an elastic model is established to analyze the wellbore stability. The elastic model has few parameters and clear physical meaning. The calculation results of the model are analytical solutions rather than numerical solutions, and the calculation speed is extremely fast. It can be used for the rapid analysis of the situation in a well. It has great advantages in dealing with emergencies.

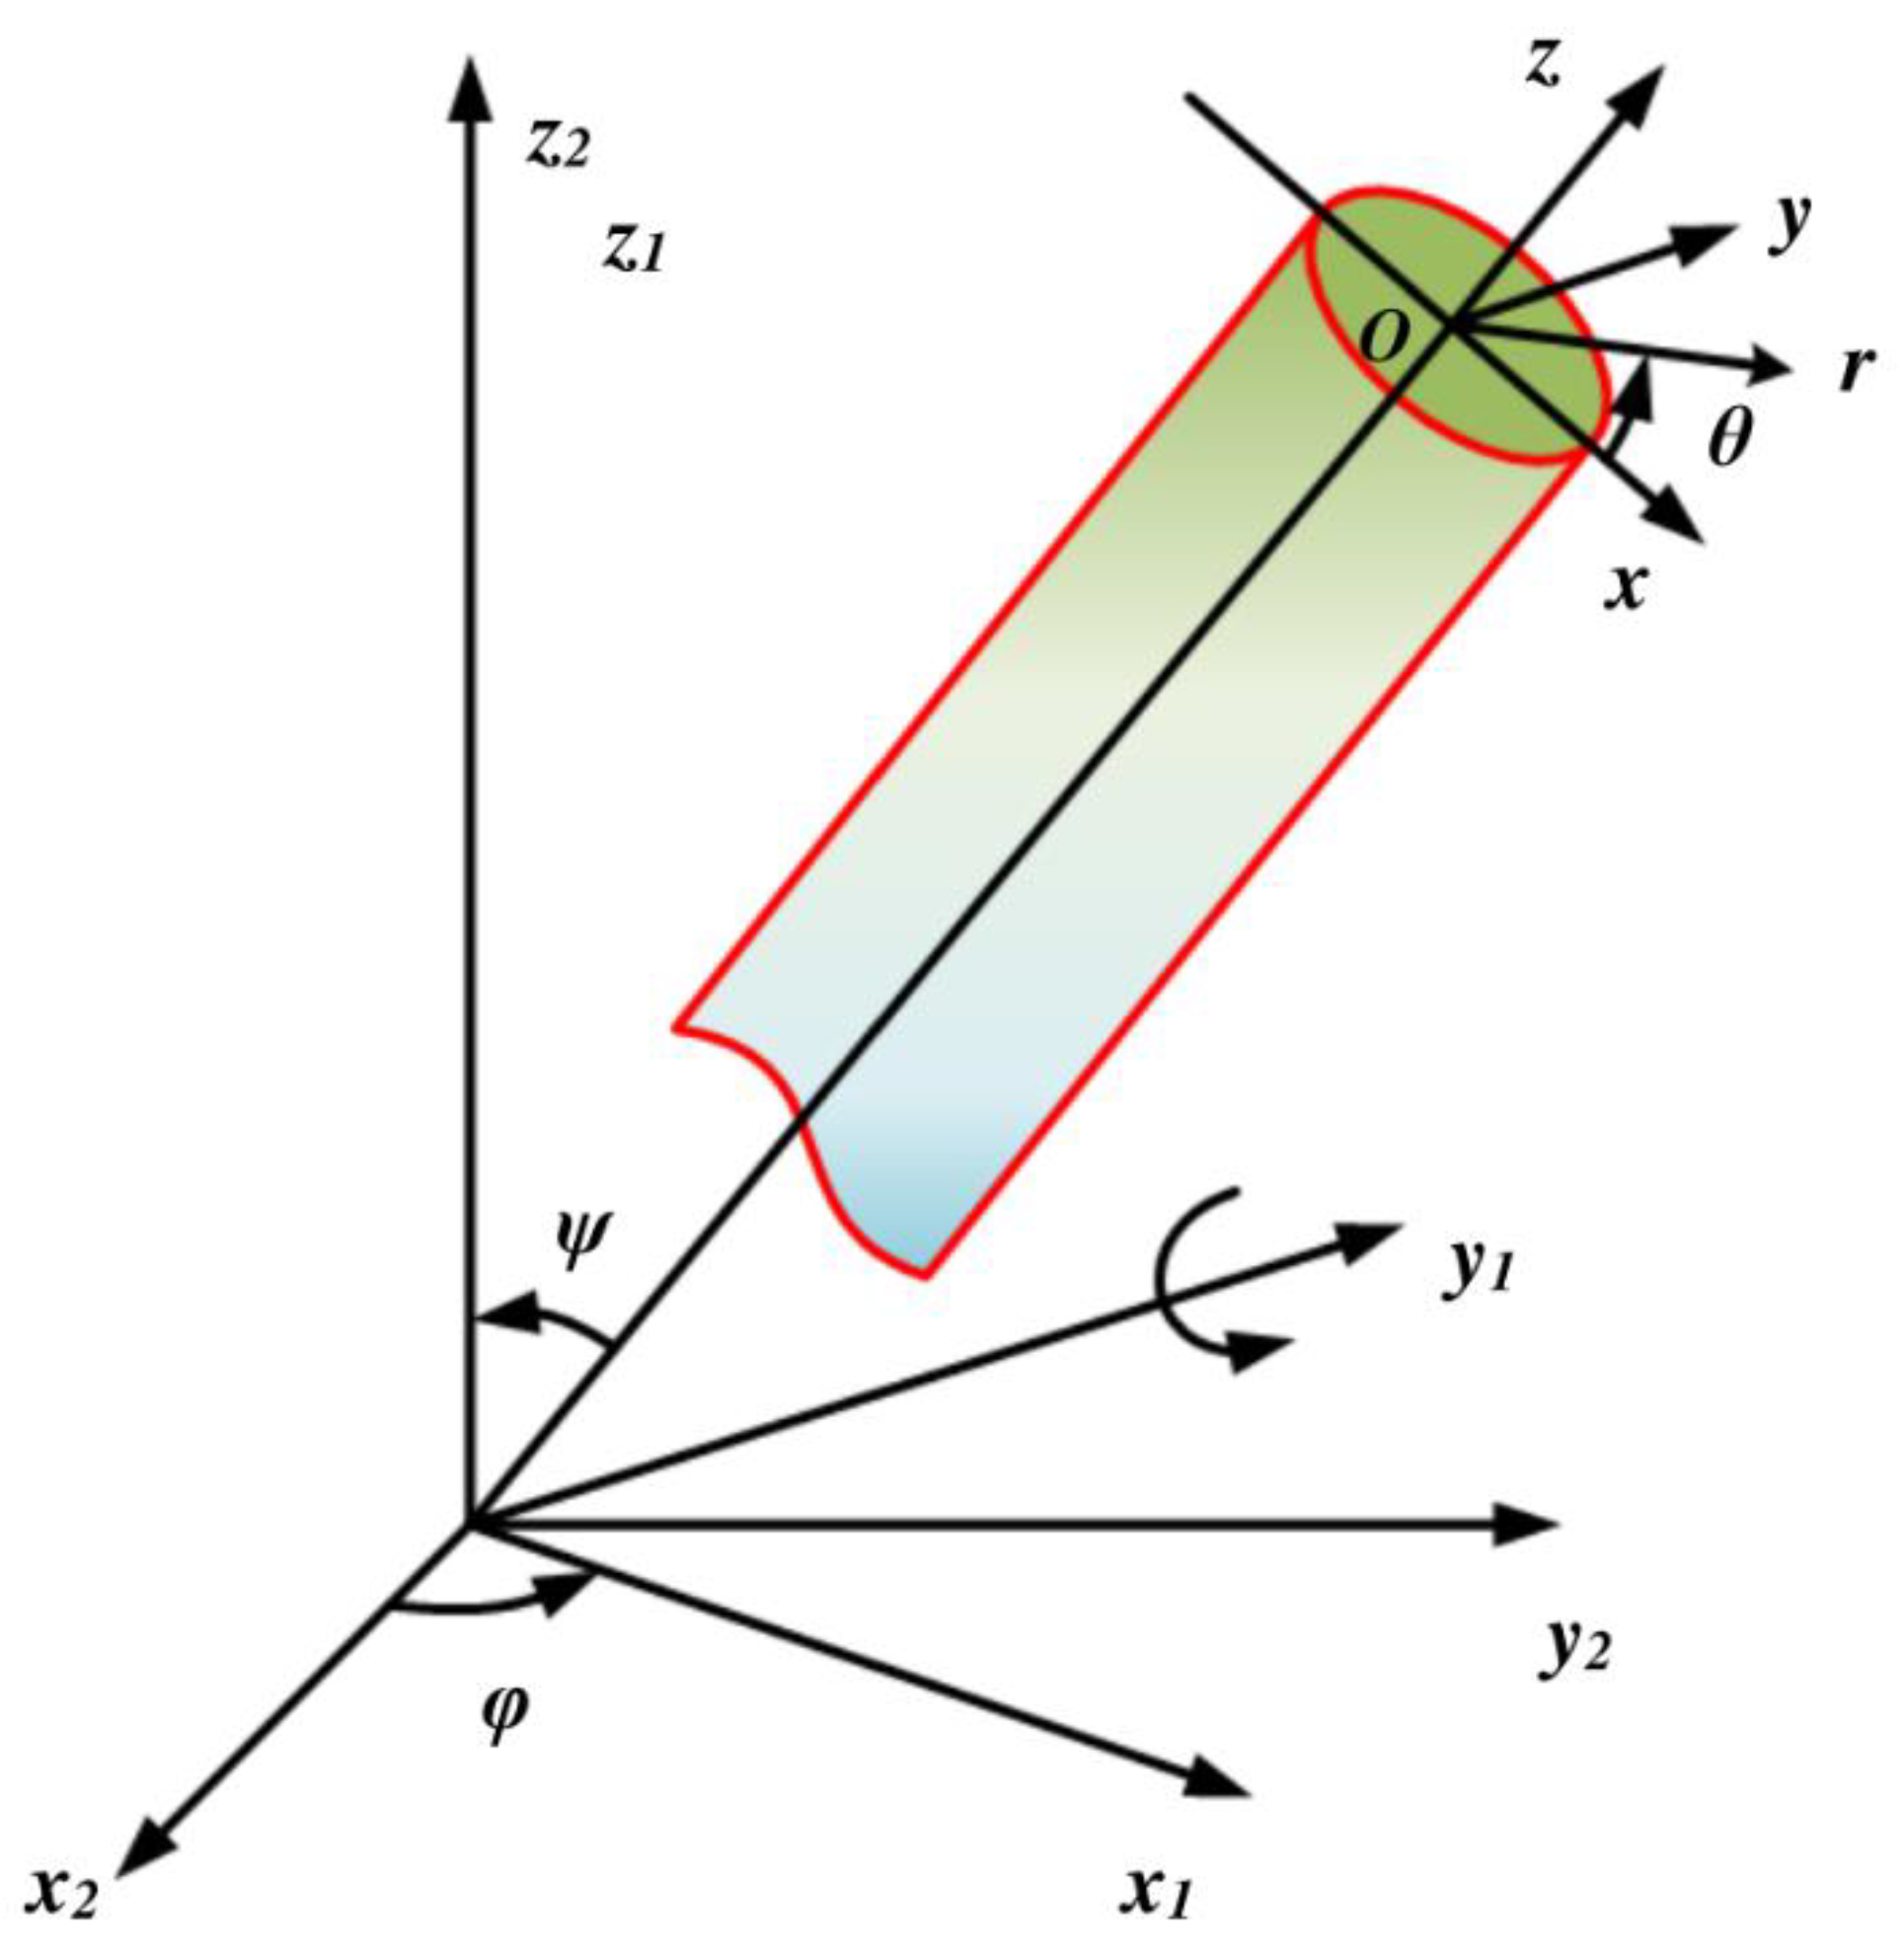
3.1.1. Conversion of Axis Coordinates of Wellbore

In the process of calculating the stress surrounding a deviated wellbore, the coordinate transformation should be carried out first. The principal in situ stress coordinate (x2, y2, z2) shall be converted into a wellbore axis coordinate system (x, y, z). The in situ stress coordinate system, corresponding to the Ox2 axis, Oy2 axis, and Oz2 axis is consistent with the principal ground stresses σH, σh, and σν directions, respectively. In the wellbore axis coordinate system, axis Oz corresponds to the deviated wellbore axis and axes Ox and Oy are located in a plane perpendicular to the well axis, and ψ, and φ are the deviation angle and azimuth, respectively (Figure 2).
The principal in situ stress coordinate system rotates with the wellbore axis, and the coordinate system transformation relationship can be derived from direction cosine, M(φ,ψ), for which the expressions are listed as follows:
M ( φ ) = ( cos φ sin φ 0 sin φ cos φ 0 0 0 1 ) M ( ψ ) = ( cos ψ 0 sin ψ 0 1 0 sin ψ 0 cos ψ )
M ( φ , ψ ) = M ( φ ) M ( ψ ) = ( cos φ cos ψ sin φ cos φ sin ψ sin φ cos ψ cos φ sin φ sin ψ sin ψ 0 cos ψ )
where φ is the deviation angle of the wellbore in °; ψ is the azimuth in °.
In the coordinate system (x, y, z), each stress components calculation formula is as follows:
( σ x x τ x y τ x z τ y x σ y y τ y z τ z x τ z y σ z z ) = M ( φ , ψ ) ( σ H 0 0 0 σ h 0 0 0 σ ν ) M ( φ , ψ ) T
where σH, σh, and σν represent the in situ stresses in MPa; σxx, σyy, and σzz are the principal stresses in MPa in directions, x, y, and z, respectively; and τ is the shear stress in MPa.
Since the wellbore section is circular, polar coordinates can be used for simplicity. The cartesian coordinates to polar coordinates transformation is performed as follows:
P ( θ ) = ( cos θ sin θ 0 sin θ cos θ 0 0 0 1 )
where θ is the wellbore rounded angle in °.
Referring to Equation (3), transform to polar coordinates (r, θ, z), and each stress component can be expressed as:
{ σ r = σ x x cos 2 θ + σ y y sin 2 θ + 2 τ x y sin θ cos θ σ θ = σ x x sin 2 θ + σ y y cos 2 θ 2 τ x y sin θ cos θ σ z = σ z z τ θ r = ( σ y y σ x x ) sin θ cos θ + τ x y ( cos 2 θ sin 2 θ ) τ z r = τ x z cos θ + τ y z sin θ τ z θ = τ x z sin θ + τ y z cos θ
where σr, σθ, and σz are the radial stresses of the reservoir, the tangential stress of the reservoir, and the vertical stress of the reservoir, respectively, in MPa.

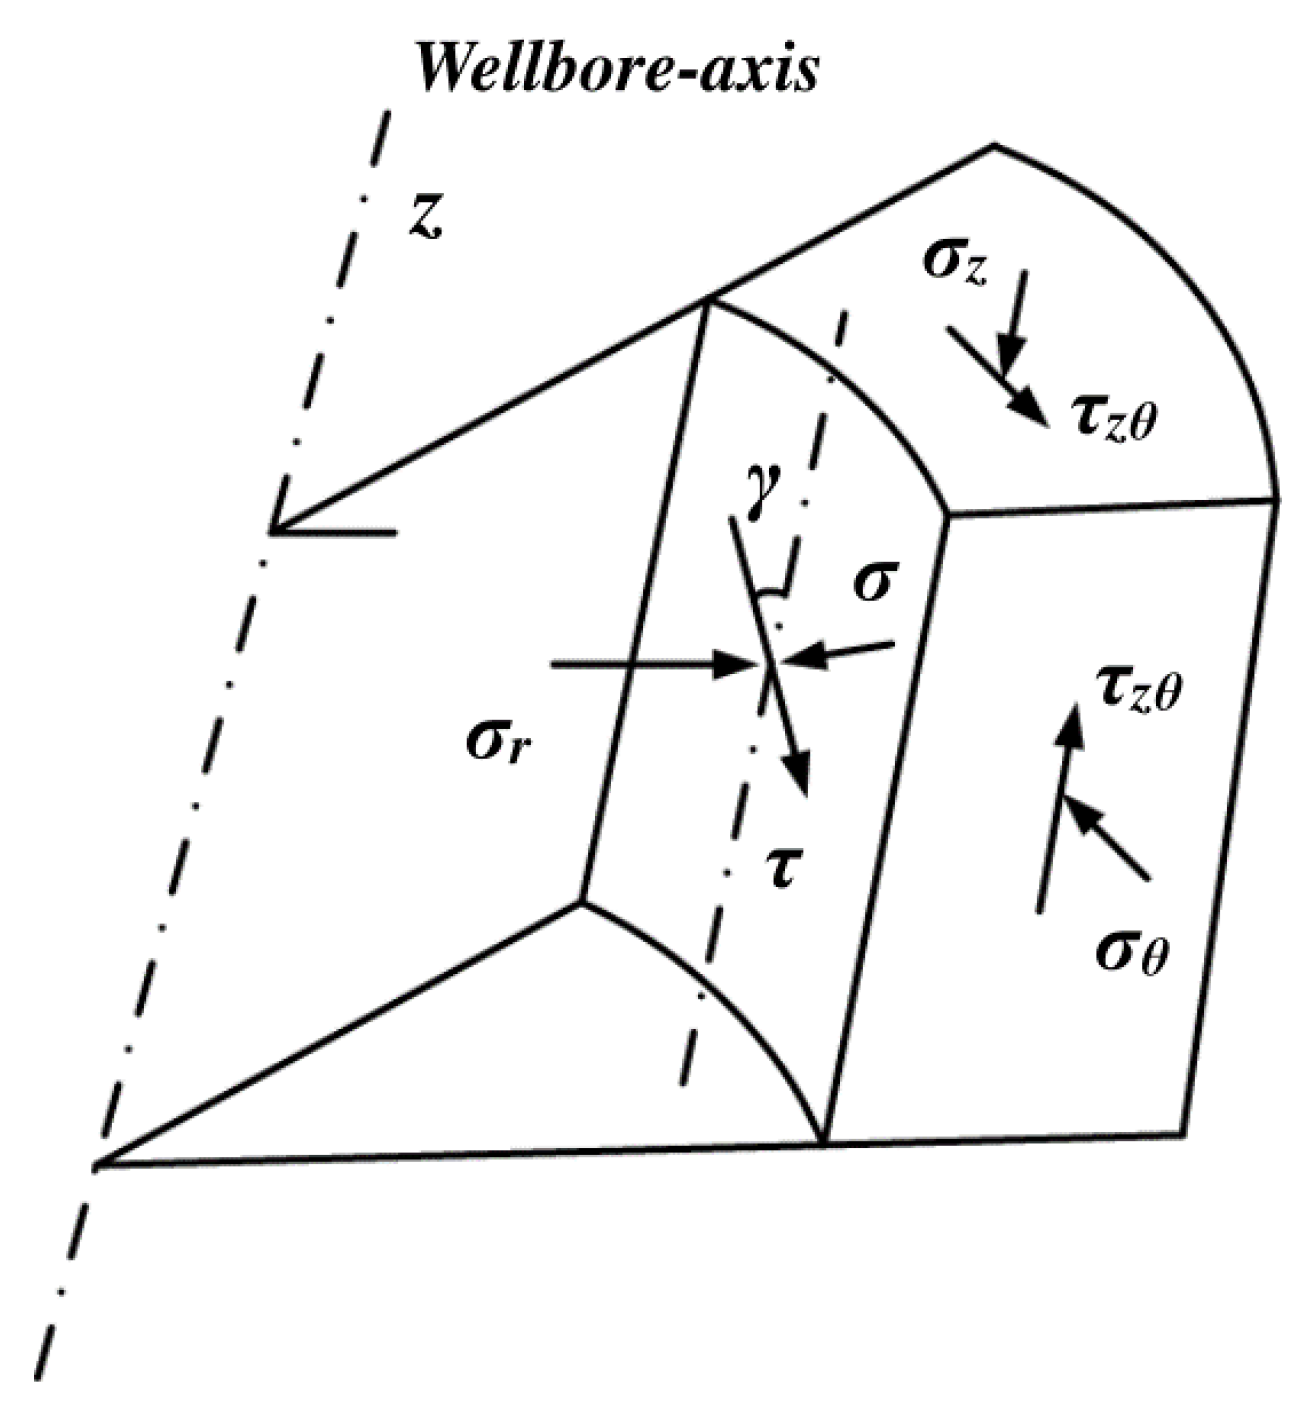
3.1.2. The Elastic Solution of the Stress around the Wellbore

In polar coordinates (r, θ, z), the problem of the redistribution of stresses generated by the principal in situ stress σH, σh, and σν on the surrounding strata of the wellbore is analyzed. It is assumed that the surrounding strata of the wellbore located in the HBS-CS are homogeneous, isotropic, linear–elastic, without creep, and independent from viscosity behavior. The stress of the original strata is in an isotropic state. The analytical solution is solved according to the principle of elasticity. The stress on the surrounding strata meets the plane-stress mechanics’ equilibrium and consistent equation [29], in which the plane-stress equilibrium equation can be expressed as:
{ σ r r + τ θ r r θ + σ r σ θ r = 0 τ θ r r + σ θ r θ + 2 τ θ r r = 0
The consistent equation is expressed as:
( 2 r 2 + r r + 2 r 2 θ 2 ) ( σ r + σ θ ) = 0
It is assumed that the pore pressure is independent of time and the borehole radius is at any position of the borehole. According to Equation (5), the stress components and boundary conditions could be obtained by the independent action of liquid column pressure, pi, and principal stress, σxx, σyy, τxy, τxz, and τyz. Equation (5) is substituted into Equations (6) and (7) to obtain the surrounding strata stresses of the wellbore (Table 2 and Table 3). In the vertical well, each component in Table 3 is 0.
The stresses of the surrounding strata can be solved according to Hooke’s law. The expression of Hooke’s law in direction z is as follows:
ε z = 1 E [ σ z z υ ( σ x x + σ y y ) ]
where εz and υ are the strain in direction z, and the Poisson’s ratio, respectively, and are dimensionless; E is the elastic modulus in MPa.
Neglecting the deformation of the formation in the vertical direction z, and substituting εz = 0 into Equation (8), the equation is transformed into:
σ z z = υ ( σ x x + σ y y )
Following this step, the component stresses of directions r and θ (Table 2) are summed to obtain the expression of the wellbore surrounding stress caused by the overburden pressure.
σ z = σ z z υ [ 2 ( σ x x σ y y ) R 2 r 2 cos 2 θ + 4 τ x y R 2 r 2 sin 2 θ ]
The linear superposition of all the stress components obtains the stress component at the shaft wall (r = R). The principal in situ stresses σH, σh, and σν are obtained by substituting the stress component of the wellbore axis coordinate system. These expressions are as follows:
{ σ r = p i σ θ = A σ H + B σ h + C σ ν p i σ z = D σ H + E σ h + F σ ν σ θ z = G σ H + H σ h + J σ ν σ r θ = σ r z = 0
where
{ A = cos ψ [ cos ψ cos 2 φ ( 1 2 cos 2 θ ) 2 sin 2 φ sin 2 θ ] + cos 2 φ ( 1 + 2 cos 2 θ ) B = cos ψ [ cos ψ sin 2 φ ( 1 2 cos 2 θ ) + 2 sin 2 φ sin 2 θ ] + cos 2 φ ( 1 + 2 cos 2 θ ) C = sin 2 ψ ( 1 2 cos 2 θ ) D = sin 2 ψ cos 2 φ 2 υ [ cos ψ sin 2 φ sin 2 θ ( sin 2 φ cos 2 ψ cos 2 φ ) cos 2 θ ] E = sin 2 ψ sin 2 φ + 2 υ [ cos ψ sin 2 φ sin 2 θ + ( cos 2 φ cos 2 ψ sin 2 φ ) cos 2 θ ] F = cos 2 ψ 2 υ sin 2 ψ cos 2 θ G = sin ψ sin 2 φ cos θ sin 2 ψ cos 2 φ sin θ H = ( sin ψ sin 2 φ cos θ + sin 2 ψ sin 2 φ sin θ ) J = sin 2 ψ sin θ
The rock unit on the deviated wellbore is shown in Figure 3. Since σr is the principal stress, the deviated shaft wall is still a principal stress surface. To judge the location of a rock failure, the other two principal stress planes must be solved first.
According to stress analysis, the relationship between the normal stress, σr, shear stress, τ, and each component is as follows:
{ σ = σ θ cos 2 γ + σ z sin 2 γ + 2 τ θ z sin γ cos γ τ = 1 2 ( σ z σ θ ) sin 2 γ + τ θ z cos 2 γ
by substituting / = 0 into Equation (13), the two principal stress expressions can be obtained. Considering the influence of the pore pressure, the expression of the stress distribution of the hydrate-deviated wellbore can be obtained as follows:
{ σ i = σ r = p i α p p σ j = 1 2 ( σ θ + σ z ) + 1 2 ( σ θ σ z ) 2 + 4 τ θ z 2 α p p σ k = 1 2 ( σ θ + σ z ) 1 2 ( σ θ σ z ) 2 + 4 τ θ z 2 α p p
where σθ and σz are the expressions as in Equation (11); pp is the pore pressure in MPa; α is the effective stress coefficient and is dimensionless.

3.2. Failure Criteria

In this study, two failure criteria were used, namely the M-C failure criterion and the D-P failure criterion [30,31]. The M-C failure criterion is the most widely used criterion when analyzing the stability of the boreholes during drilling [32,33]. The criterion, however, only considers the effect of maximum and minimum principal stresses and ignores the influence of the intermediate principal stress. On the other hand, the D-P failure criterion also takes into account the influence of the intermediate principal stress, and adds hydrostatic pressure, thereby overcoming the main weakness of the M-C failure criterion. The D-P failure criterion was also applied in the numerical analysis of formation stability at home and abroad.

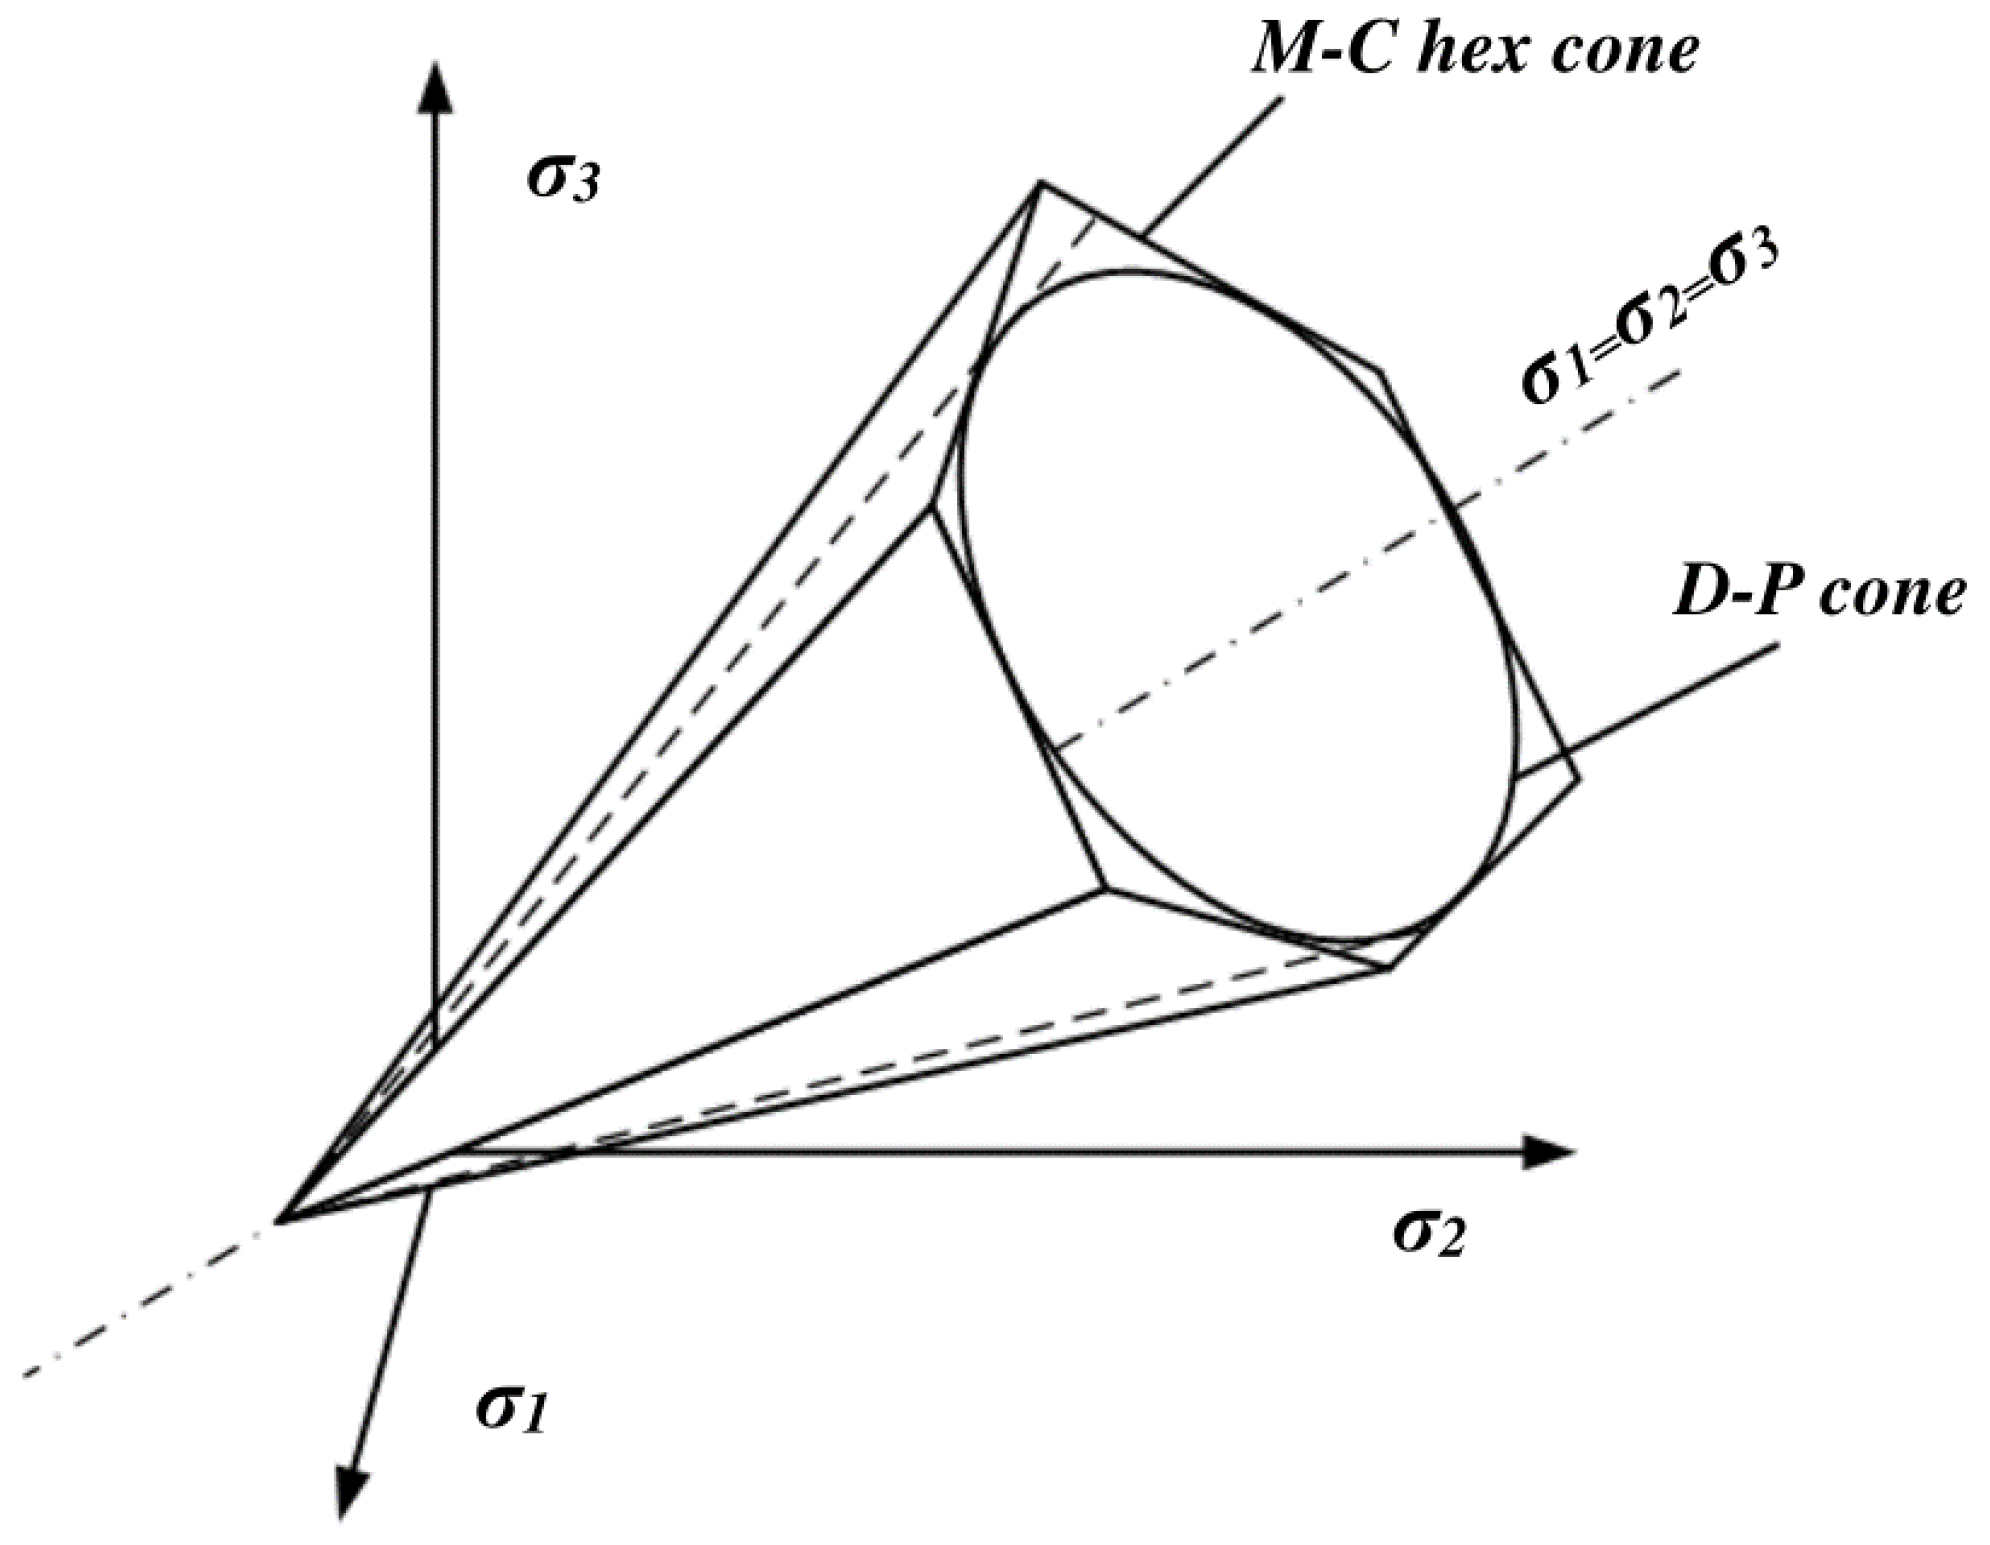
3.2.1. The M-C Failure Criterion

Coulomb proposed that the failure of rock was mainly caused by shear failure. The strength of the rock, namely the frictional strength, was supposed to be equal to the adhesion force of the rock, itself against the friction imposed by the shear, and the friction force generated by the normal force on the shear surface. The general form is as follows [34]:
τ = C + σ tan ϕ
where τ, σ, and C, all in MPa, are the shear stress, the normal stress on the shear plane, and the cohesive force, respectively; ϕ is the angle of internal friction in °.
To facilitate the calculation, the principal stress form is rewritten as:
σ 1 = σ 3 K 2 + 2 C K
where K2 is the influence coefficient of confining pressure on axial bearing capacity, K = cot ( π 4 ϕ 2 ) .

3.2.2. The D-P Failure Criterion

The D-P failure criterion is an extension of the M-C failure criterion and the von Mises failure criterion [35]. The difference from the M-C failure criterion is that the corner of the yield surface for the D-P failure criterion is smooth and conical in the principal stress space, eliminating the singular point caused by sharp angles, thereby facilitating numerical calculation of the stability of the wellbore (Figure 4).
The standard form of the D-P failure criterion is as follows [36]:
f = Q f I 1 ( σ i j ) + J 2 ( S i j ) + K f = 0
where f, I1(σij), and J2(Sij) are the plastic potential function, the first invariant of the stress tensor, and the second invariant of the stress partial tensor, respectively. Qf and Kf are a function of cohesion C, and internal friction angle ϕ, respectively, as follows: Q f = 3 sin ϕ 3 3 + sin 2 ϕ , K f = 3 C cos ϕ 3 + sin 2 ϕ .

3.3. Collapse Pressure and Fracture Pressure

Since the M-C failure criterion only considers the influence of the maximum and the minimum principal stresses and ignores the influence of the intermediate principal stress, it is necessary to establish the principal stress Equation (14) to obtain the maximum and the minimum principal stresses. Then, by substituting them into the M-C failure criterion Equation (16), the value of pi that makes the equation hold was obtained, which is the collapse pressure of the wellbore under the M-C failure criterion.
Similarly, by substituting these three principal stresses into the D-P failure criterion Equation (17), the collapse pressure of the hydrate wellbore can be obtained by the D-P failure criterion.
For the calculation of the fracture pressure, since only σk can be negative values in Equation (16), the fracture pressure calculation expression is as follows:
f ( p b ) = 1 2 ( σ θ + σ z ) 1 2 ( σ θ σ z ) 2 + 4 τ θ z 2 α p p + S t = 0
where St is the uniaxial tensile strength of the HBS-CS in MPa.
The above equations were substituted into Matlab to solve for the collapse and fracture pressure of the HBS-CS-deviated wellbore.

4. Wellbore Stability Analyses

The basic formation parameters are shown in Table 4. The collapse and fracture pressure of the deviated wellbore located in the HBS-CS are obtained.

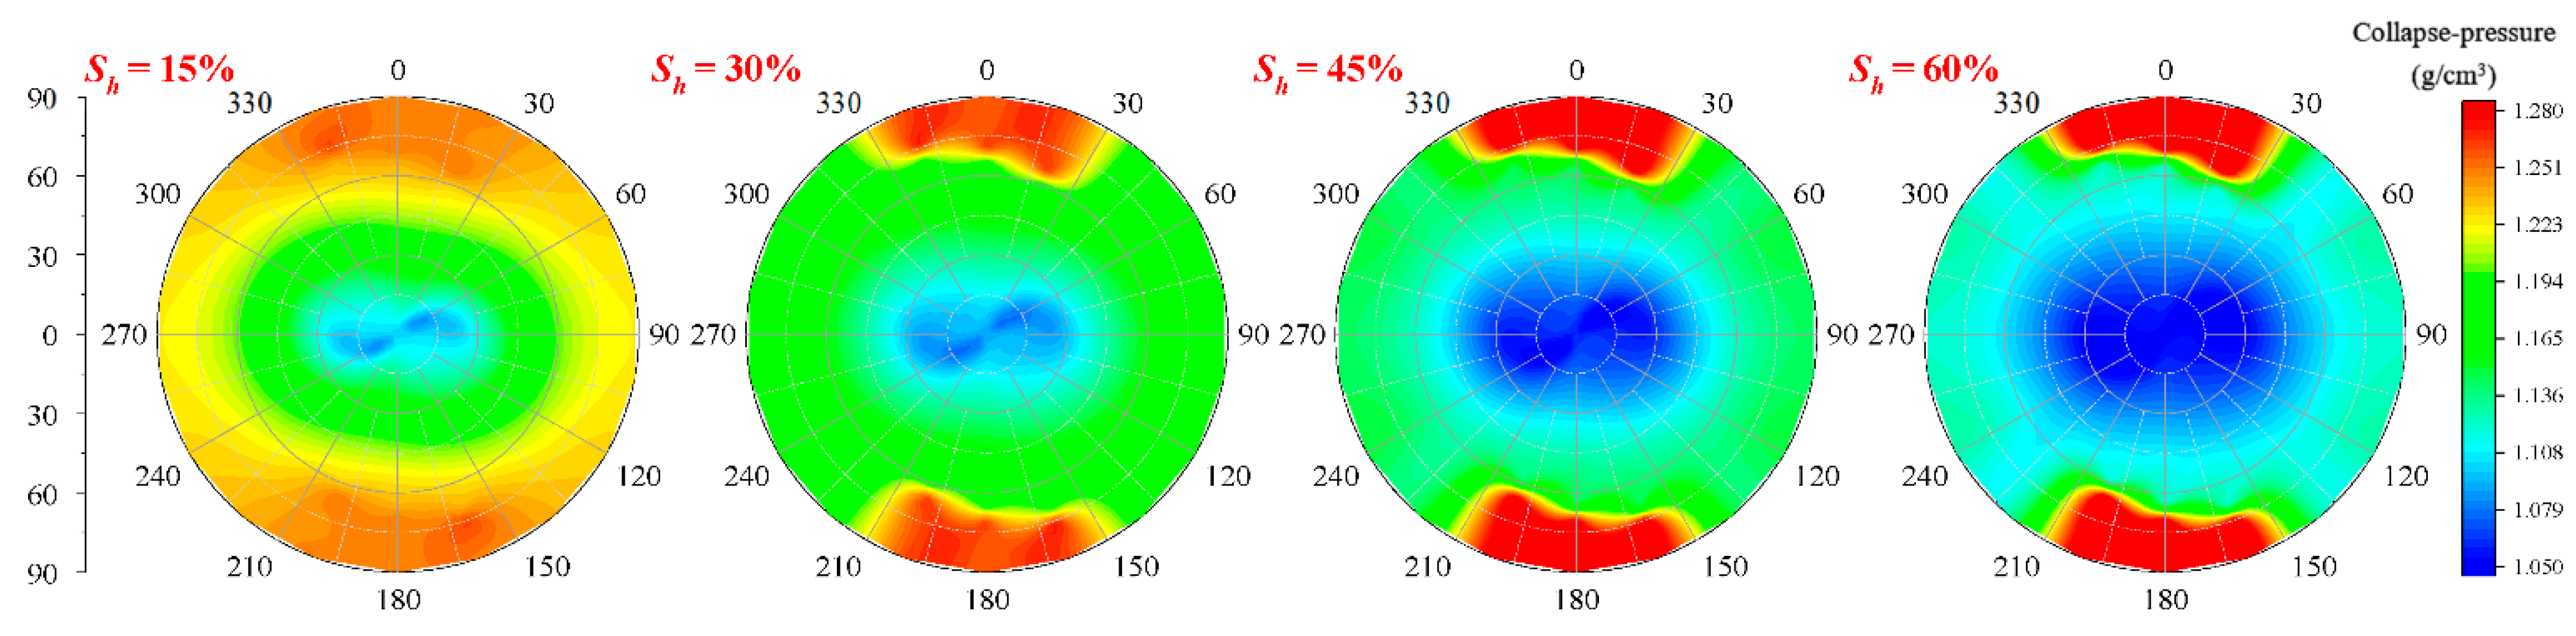
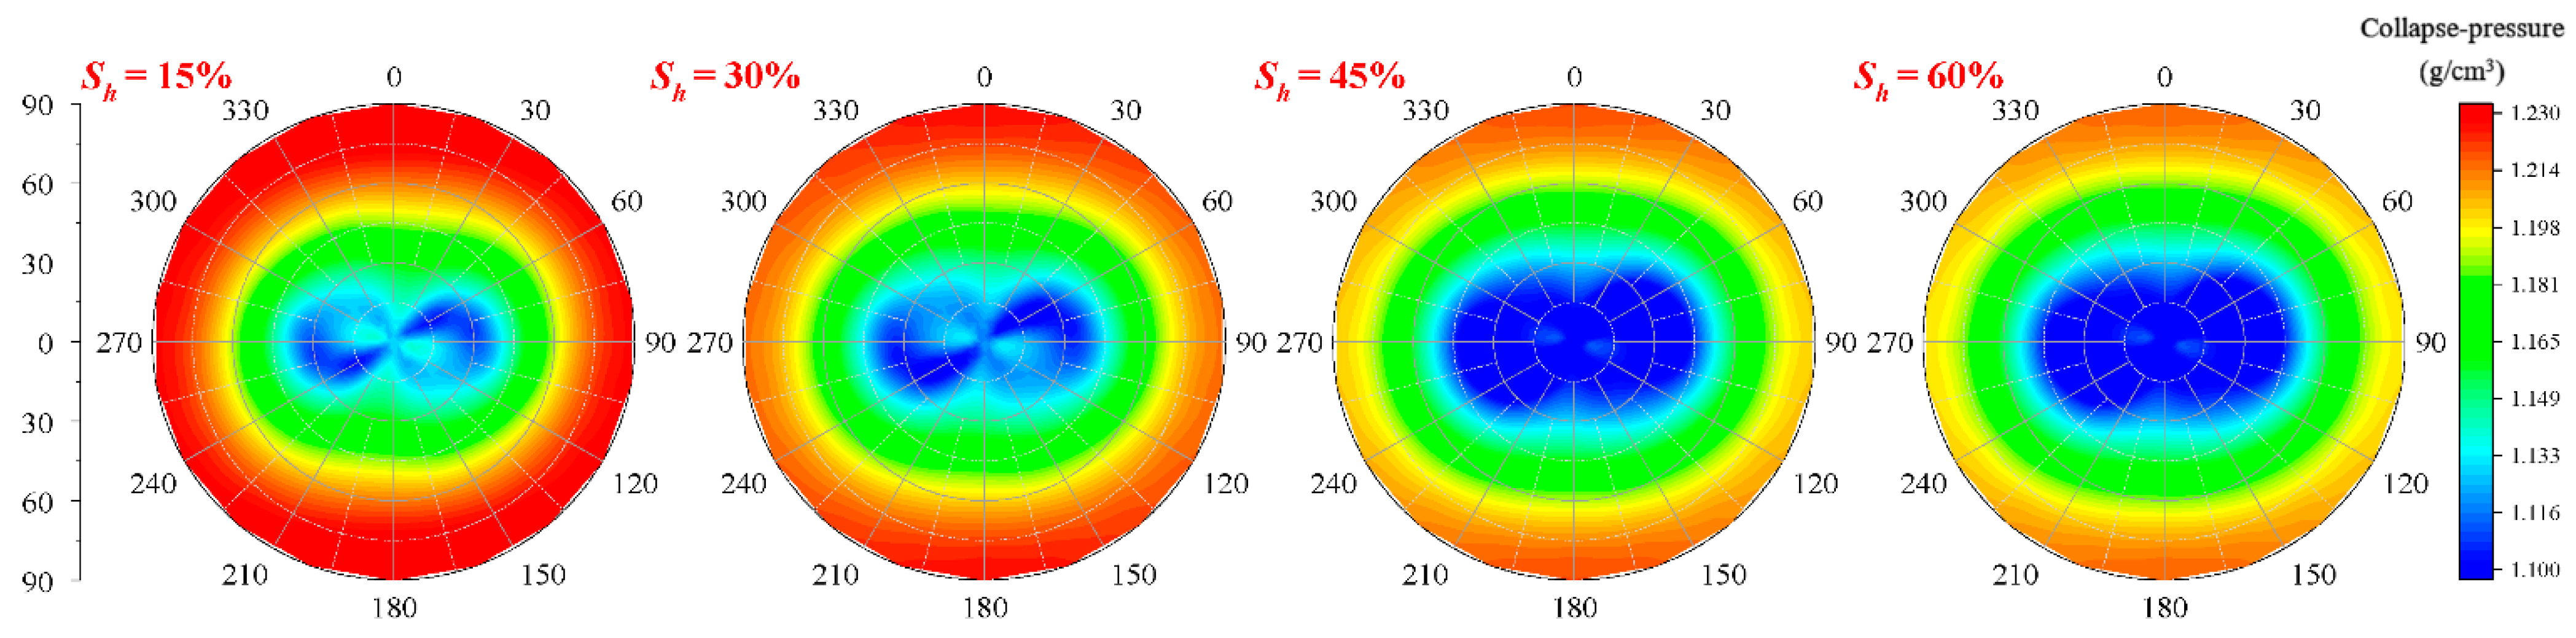
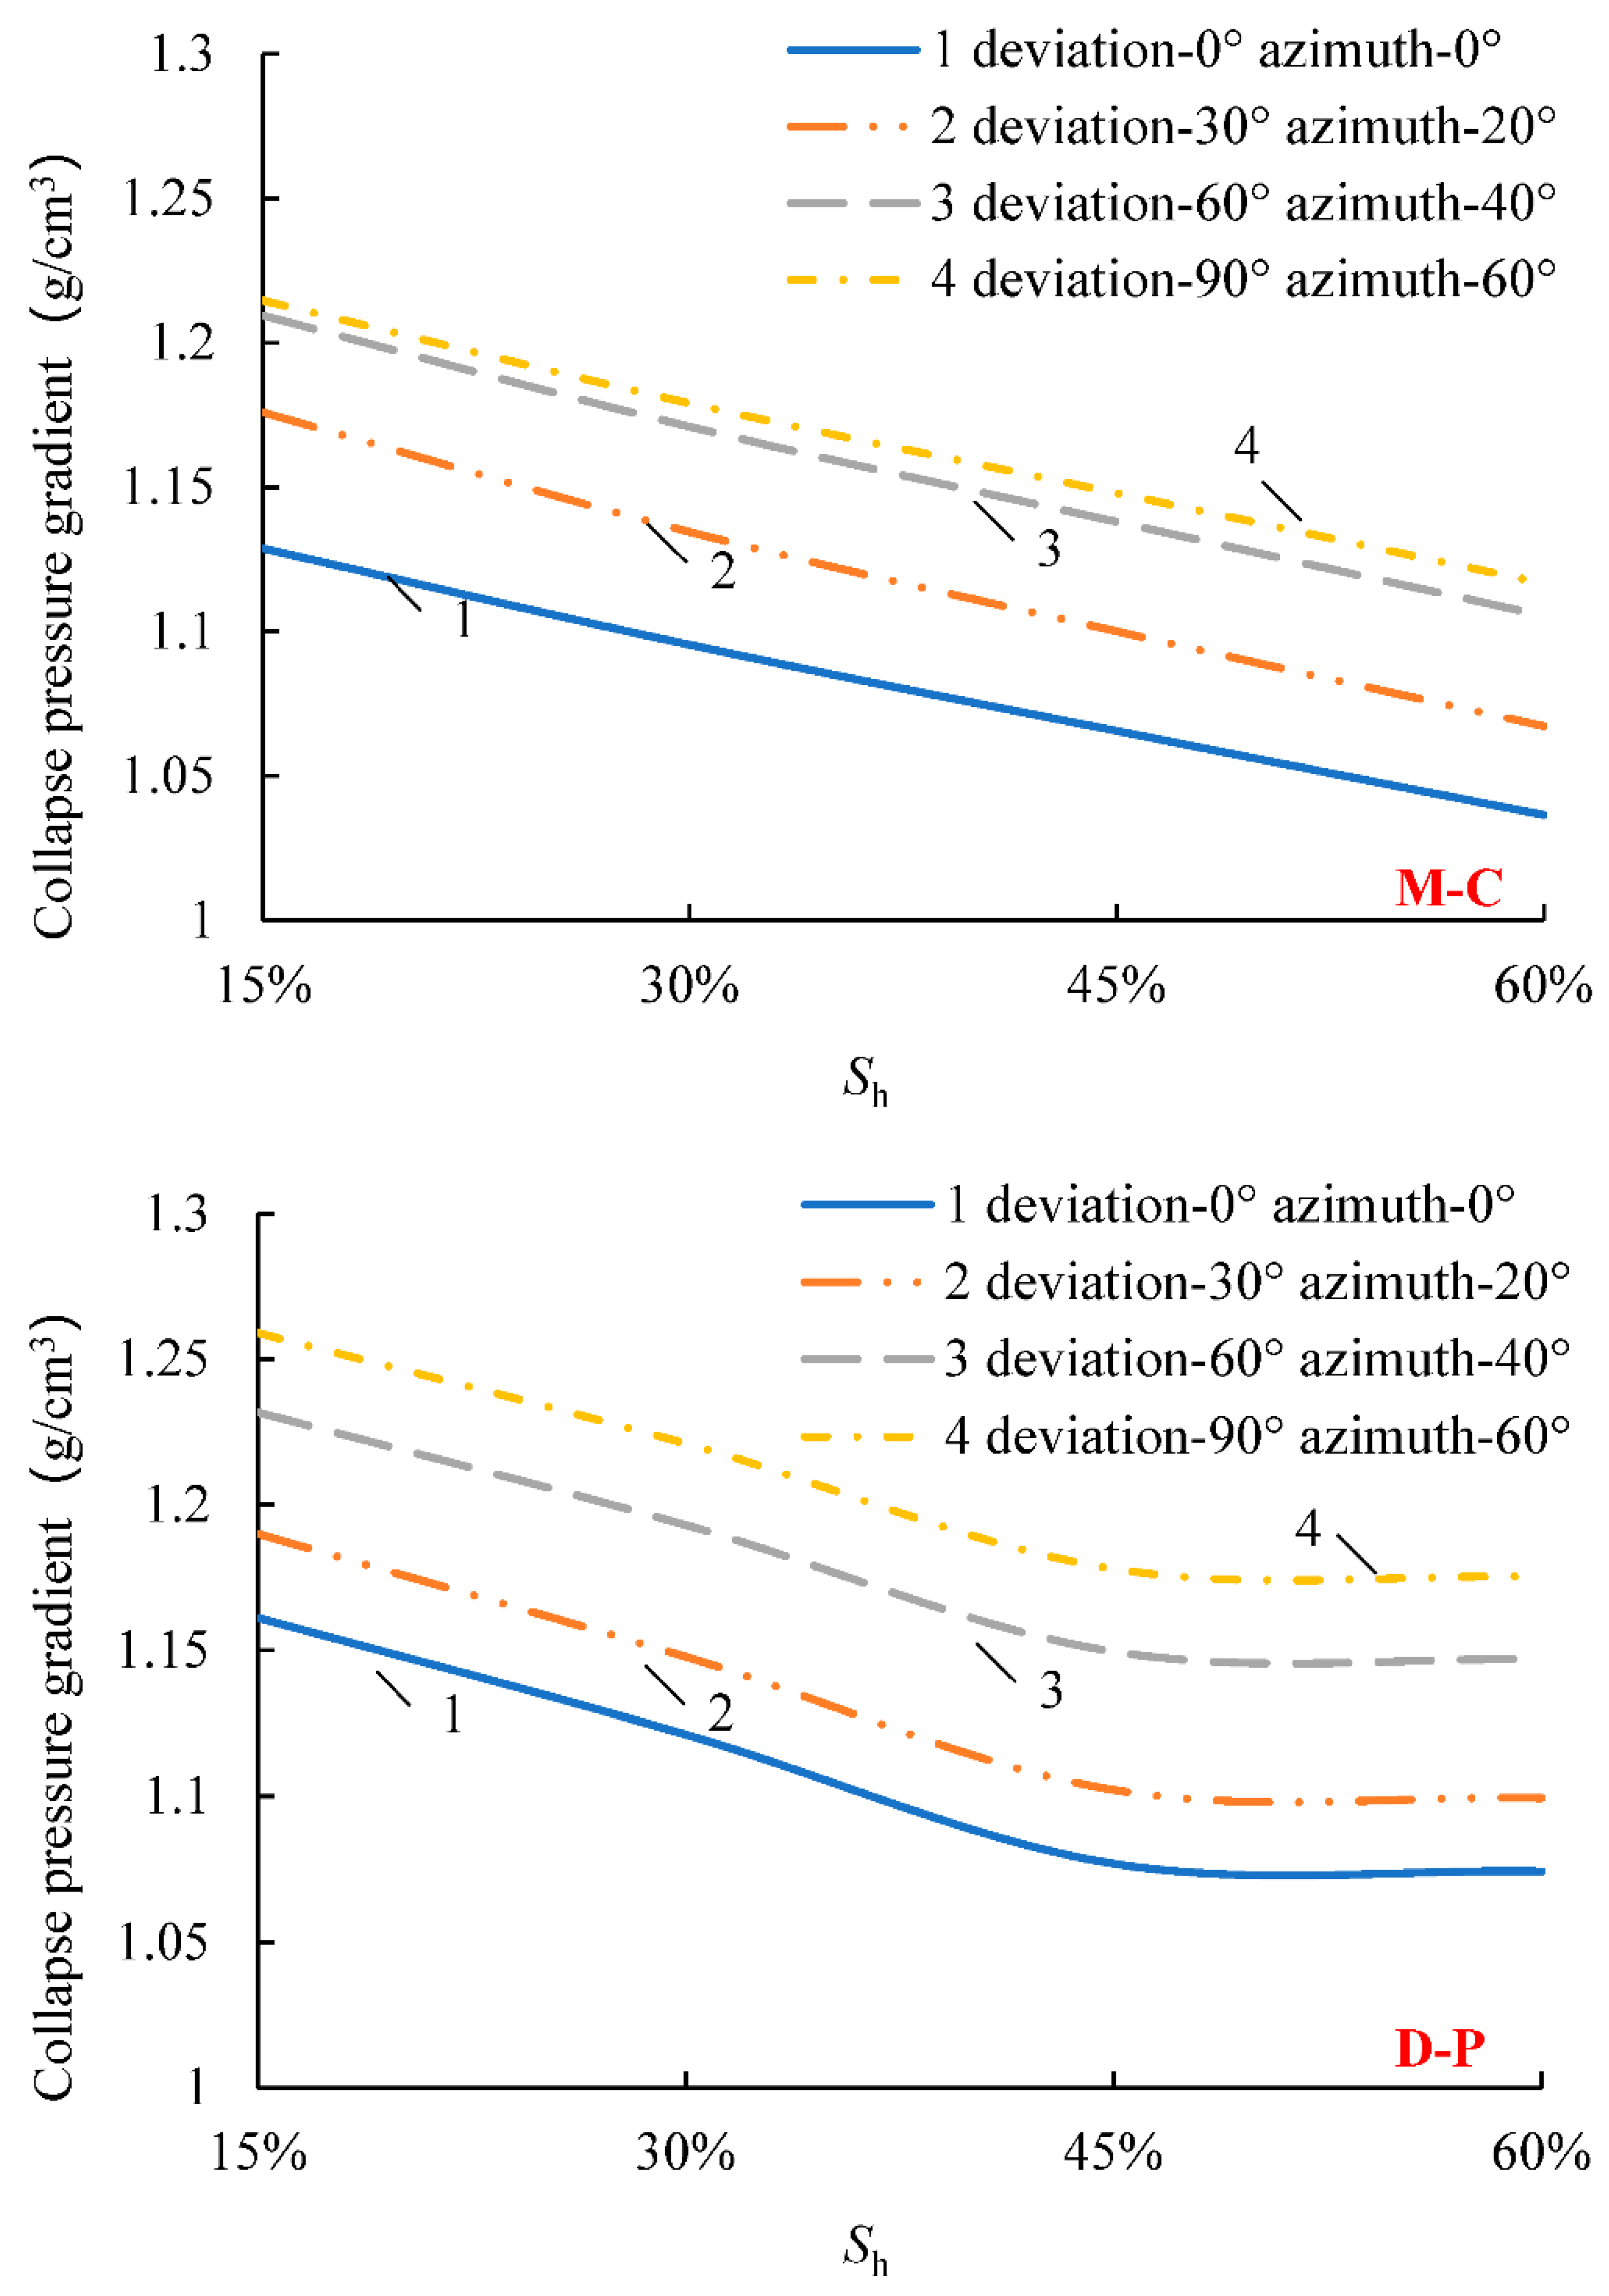
4.1. Effect of Sh on Collapse Pressure of Wellbore

To describe the stability characteristics of the deviated wellbore located in HBS-CS, the lower hemisphere projection method proposed by Zoback was adopted [39] to show the collapse pressure gradient distribution cloud diagram with different saturation at different azimuth and deviation angles. The cloud diagram of the collapse pressure gradient distribution around the deviated wellbore with different saturation by the M-C and D-P failure criteria are shown in Figure 5 and Figure 6, respectively.
A brief comparison between Figure 5 and Figure 6 implies that the collapse pressure gradient varies with the azimuth in a centrosymmetric distribution at different saturations. This is independent of the chosen failure criteria. The low collapse pressure gradient area is concentrated in the middle “8” region. However, there are differences in the distribution locations of the high collapse pressure gradient area for the different criteria. In the M-C failure criterion, the area where the azimuth ranges over 330°-30° and the deviation angle is greater than 75° has the largest collapse pressure gradient. On the other hand, the collapse pressure gradient is the highest in the annular region (the maximum principal stress direction, deviation angle > 60°; the minimum principal stress direction, deviation angle > 75°) by the D-P failure criterion.
The relationship between Sh and the collapse pressure gradient by the two criteria is shown in Figure 7. The collapse pressure gradient increased with decreasing Sh. When the saturation decreases from 60% to 15%, the collapse pressure gradient increases by 7–10%. Li et al. (2020) and Sun et al. (2018) obtained the same discovery from the analysis of stratum mechanical properties [17,20]. When the Sh decreases, the strength of HBS decreases, the plastic zone increases, and the wellbore stability becomes worse. Therefore, considering the influence of the hydrate decomposition on wellbore stability, the equivalent density of drilling fluid should be appropriately increased to meet the needs of the wellbore stability after hydrate decomposition.
By comparing the curves of the two criteria, the collapse pressure gradient decreases linearly with an increase in Sh under low saturation (<45%) by the two criteria. The reason is that with decreasing Sh, the formation pore–space increases, and the cementation ability of hydrate to the formation weakens, which results in a continuous increase in the collapse pressure gradient and the deterioration of the stability of the wellbore. At high saturation (>45%), the M-C failure criterion curve trend is the same as is seen at low saturation, while the D-P failure criterion curve is flat. At the same position, the calculated value of the D-P failure criterion is greater than that of the M-C failure criterion at low saturation, and the opposite is true at high saturation. It showed that the formation stability in high saturation is higher when the influence of the intermediate principal stress is fully considered. However, higher drilling fluid densities are required to maintain formation stability in low saturations.

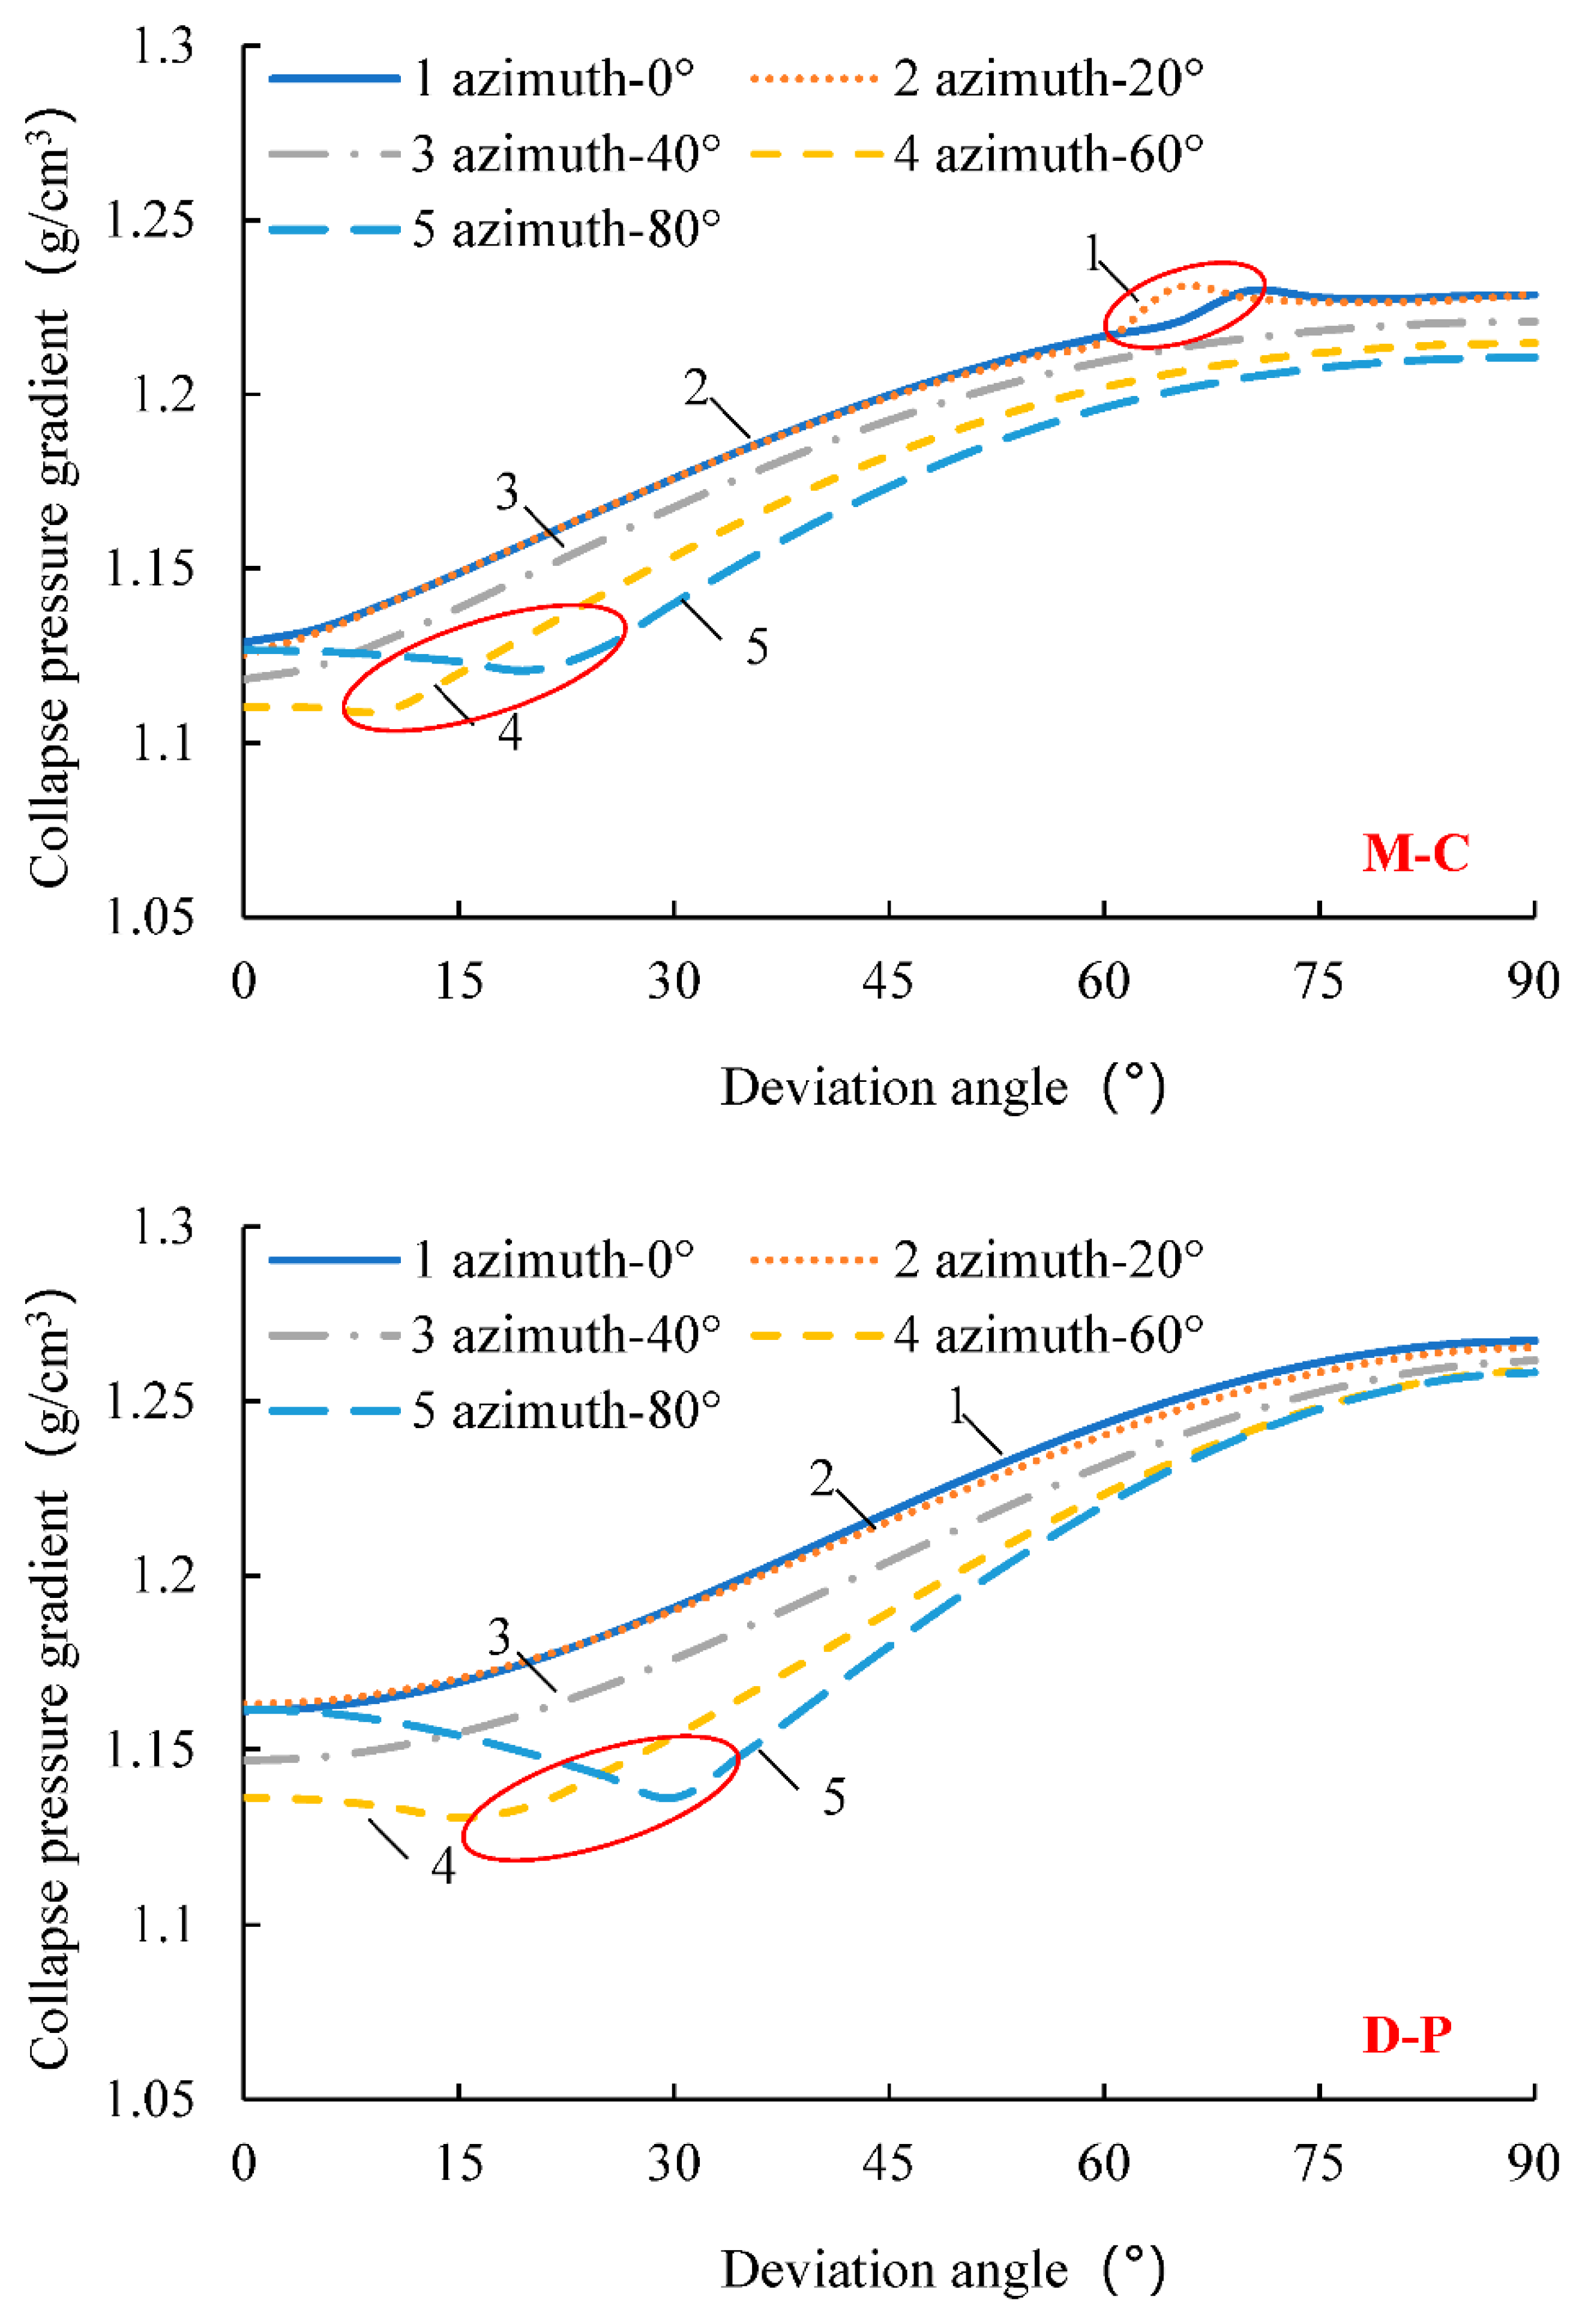
4.2. Influence of the Deviation Angle on the Collapse Pressure Gradient of the Wellbore

According to the formation basic parameters and the hydrate mechanics parameters, the influence of the deviation angle on the collapse pressure gradient was calculated. Taking 15% saturation as an example, the relationship curves between the deviation angle and the collapse pressure gradient by the two criteria were obtained (Figure 8). Within a quarter of the cycle (azimuth 0~90°), the trends of the two curves are the same, and the collapse pressure gradient rises, on the whole, with increasing deviation angle. When the azimuth is less than 60° (curves 1–3), the collapse pressure gradient continues to increase with increasing deviation angle. When the azimuth is higher than 60 ° (curves 4 and 5), the collapse pressure gradient decreases first and then increases with changing deviation angle, and the position of the inflection point is gradually delayed with increasing azimuth. The collapse pressure gradient increases by 7.2–9.2% from the vertical wellbore section (deviation angle 0°) to the horizontal wellbore section (deviation angle 90°). In other words, the safe density that satisfies the horizontal section can also ensure the wellbore stability of other sections, and will not collapse.
By comparing the two curves obtained from the two criteria, it is found that when the azimuth is higher than 60°, the inflection point of the collapse pressure gradient by the M-C failure criterion appears earlier than that of the D-P failure criterion. When the azimuth is 60° and 80°, the inflection points of the M-C failure criterion curve are 10° and 20°, while considering that the inflection point of the D-P failure criterion curve, under the influence of the intermediate principal stress, is 15° and 30°. The M-C failure criterion curve increases abnormally near 65°, while the D-P curve is smooth and without distortion. The reason for this is that the yield surface of the D-P failure criterion is smooth and without sharp corners, while the yield surface of the M-C failure criterion is hexagonal and with sharp corners (Figure 4). Hence, the D-P criterion is more suitable for the wellbore stability calculation.

4.3. Effect of the Azimuth on the Collapse Pressure Gradient of the Wellbore

According to the formation of the basic parameters and the hydrate mechanics parameters, the influence of the azimuth on the collapse pressure gradient was calculated. Taking 15% Sh as an example, the relationship between the azimuth and the collapse pressure gradient by the two criteria was obtained (see Figure 9). It was found that the collapse pressure gradient decreases and then increases with an increasing azimuth on the high inclination well sections (curves 2–6). The collapse pressure gradient reaches a minimum value in the direction of the minimum principal stress (azimuth of 90°). The same was reported in the literature [40]. With an increase in the deviation angle, the fluctuation of the curve is lower. That is, the difference in the collapse pressure gradient is not significant during drilling in any direction. When the deviation angle is 30° and 90°, the differences are 0.038 and 0.018 g/cm3, respectively. In the near-vertical sections (curve 1), the minimum collapse pressure gradient was obtained at an azimuth of 60°. In summary, the wellbore should be arranged along the azimuth between 60° and 120° for high wellbore stability.

4.4. Fracture Pressure Gradient and the Safe Drilling Fluid Density Window

The safe drilling fluid density window is defined as the difference between the collapse pressure gradient and the fracture pressure gradient. It is safer for drilling with a relatively wide safe drilling fluid density window. Therefore, the variation pattern of fracture pressure was analyzed first. According to the formation of the basic parameters and the hydrate mechanics parameters, and taking the 15% Sh as an example, the relationship curve between the azimuth and fracture pressure gradient was simulated, as shown in Figure 10. When the deviation angle was higher than 45° (curves 4–7), the fracture pressure gradient increased and then decreased with increasing azimuth, and the maximum value is in the direction of the minimum principal stress. When the deviation angle is less than 45° (curves 1–3), the fracture pressure gradient generally increases and then decreases with increasing azimuth, but the peak value exists between 120° and 150°. The azimuth corresponding to the peak decreases gradually with increasing deviation angle, closer to the direction of the minimum principal stress. During the drilling of horizontal wellbores, the drilling fluid density needs to meet the stability of the wellbore in all sections. Therefore, a drilling fluid density is selected in the yellow zone formed below the vertical and horizontal wellbore curves (curves 1 and 7), which can be safely drilled in any direction.
The cloud diagram of the safe density window is drawn by the lower hemisphere projection method, as shown in Figure 11. The safe density window has a center-symmetric strip distribution in the range of 0.368–0.660 g/cm3. The density window of the upper and lower belt regions is narrow, while the density window of the middle region is large. The maximum safe density window is the “crescent” region in the direction of the minimum principal stress. Drilling operations near this zone are most conducive to wellbore stability.

5. Conclusions and Suggestions

  • The window distribution cloud chart of the collapse pressure gradient and the safe drilling fluid density of HBS-CS has a centrosymmetric distribution with a deviation angle and azimuth.
  • Hydrate decomposition will lead to a higher collapse pressure and poorer stability of the formation. Therefore, the drilling fluid density should be appropriately increased by 7~10% during drilling to ensure the stability of formation after hydrate decomposition.
  • The collapse pressure gradient increases by 7.2–9.2% from the vertical wellbore to the horizontal wellbore. From the perspective of preventing wellbore collapse, the safe density that satisfies the horizontal section can also ensure the wellbore stability of other sections. To prevent the wellbore fracture, a safe density that satisfies both the horizontal and vertical sections is necessary to ensure wellbore stability in all sections.
  • Considering the combined effects of collapse, fracture pressure gradient, and safety density window, it is suggested that the borehole be arranged along the azimuth of 60–120°, which could greatly reduce the risk of the drilling operation.
The model can provide a safe density window in horizontal drilling design and guide the selection of drilling fluid for construction. In case of an emergency, such as a kick and overflow, the risk of wellbore instability can be calculated quickly by this model to guide the formulation of corresponding disposal measures. However, the parameters involved in the model are not comprehensive enough, and the calculation accuracy is slightly insufficient. Therefore, the elastic model is just the beginning of the HBS-CS wellbore stability study. Next, we will establish the plastic model and damage model and strive to improve the prediction accuracy of wellbore stability, helping NGH mining.

Author Contributions

Conceptualization, Q.H.; data curation, Y.L. and Y.Z.; methodology, X.S. and Y.L.; software, M.C. and Y.Z.; validation, M.C.; writing—original draft, X.S. and Q.H.; writing—review and editing, Q.H. All authors have read and agreed to the published version of the manuscript.

Funding

This study was supported by the Key R&D Projects of Hainan Province (Grant no. ZDYF2022SHFZ063) and the Shandong Special Fund of Pilot National Laboratory for Marine Science and Technology (Qingdao) (Grant no. 2021QNLM020002).

Institutional Review Board Statement

Not applicable.

Informed Consent Statement

Not applicable.

Data Availability Statement

Not applicable.

Conflicts of Interest

The authors declare no conflict of interest.

References

  1. Wan, Z.; Luo, J.; Yang, X.; Zhang, W.; Liang, J.; Zuo, L.; Sun, Y. The Thermal Effect of Submarine Mud Volcano Fluid and Its Influence on the Occurrence of Gas Hydrates. J. Mar. Sci. Eng. 2022, 10, 832. [Google Scholar] [CrossRef]
  2. Hu, G.; Bu, Q.; Lyu, W.; Wang, J.; Chen, J.; Li, Q.; Gong, J.; Sun, J.; Wu, N. A comparative study on natural gas hydrate accumulation models at active and passive continental margins. Nat. Gas Ind. B 2021, 8, 115–127. [Google Scholar] [CrossRef]
  3. Qin, X.-W.; Lu, J.-A.; Lu, H.-L.; Qiu, H.-J.; Liang, J.-Q.; Kang, D.-J.; Zhan, L.-S.; Lu, H.-F.; Kuang, Z.-G. Coexistence of natural gas hydrate, free gas and water in the gas hydrate system in the Shenhu Area, South China Sea. China Geol. 2020, 3, 210–220. [Google Scholar] [CrossRef]
  4. Makogon, Y.F. Natural gas hydrates—A promising source of energy. J. Nat. Gas Sci. Eng. 2010, 2, 49–59. [Google Scholar] [CrossRef]
  5. Makogon, Y.; Omelchenko, R. Commercial gas production from Messoyakha deposit in hydrate conditions. J. Nat. Gas Sci. Eng. 2013, 11, 1–6. [Google Scholar] [CrossRef]
  6. Kurihara, M.; Sato, A.; Funatsu, K.; Ouchi, H.; Yamamoto, K.; Numasawa, M.; Ebinuma, T.; Narita, H.; Masuda, Y.; Dallimore, S.R.; et al. Analysis of Production Data for 2007/2008 Mallik Gas Hydrate Production Tests in Canada. In Proceedings of the International Oil and Gas Conference and Exhibition in China, Beijing, China, 8–10 June 2010; p. SPE-132155-MS. [Google Scholar] [CrossRef]
  7. Dubreuil-Boisclair, C.; Gloaguen, E.; Bellefleur, G.; Marcotte, D. Non-Gaussian gas hydrate grade simulation at the Mallik site, Mackenzie Delta, Canada. Mar. Pet. Geol. 2012, 35, 20–27. [Google Scholar] [CrossRef]
  8. Boswell, R.; Yamamoto, K.; Collett, T.S.; Okinaka, N. Virtual Special Issue of Recent Advances on Gas Hydrates Scientific Drilling in Alaska. Energy Fuels 2022, 36, 7921–7924. [Google Scholar] [CrossRef]
  9. Li, X.-S.; Xu, C.-G.; Zhang, Y.; Ruan, X.-K.; Li, G.; Wang, Y. Investigation into gas production from natural gas hydrate: A review. Appl. Energy 2016, 172, 286–322. [Google Scholar] [CrossRef] [Green Version]
  10. Yu, T.; Guan, G.; Abudula, A.; Yoshida, A.; Wang, D.; Song, Y. Gas recovery enhancement from methane hydrate reservoir in the Nankai Trough using vertical wells. Energy 2018, 166, 834–844. [Google Scholar] [CrossRef]
  11. Liu, Z.; Wang, Z.; Sun, J.; Chen, L.; Wang, J.; Sun, B. Risk and preventive strategies of hydrate reformation in offshore gas hydrate production trials: A case study in the Eastern Nankai Trough. J. Nat. Gas Sci. Eng. 2022, 103, 104602. [Google Scholar] [CrossRef]
  12. Li, J.-F.; Ye, J.-L.; Qin, X.-W.; Qiu, H.-J.; Wu, N.-Y.; Lu, H.-L.; Xie, W.-W.; Lu, J.-A.; Peng, F.; Xu, Z.-Q.; et al. The first offshore natural gas hydrate production test in South China Sea. China Geol. 2018, 1, 5–16. [Google Scholar] [CrossRef]
  13. Ye, J.; Qin, X.; Xie, W.; Lu, H.; Ma, B.; Qin, H.; Liang, J.; Lu, J.; Kuang, Z.; Lu, C.; et al. Main progress of the second gas hydrate trial production in the South China Sea. Geol. China 2020, 47, 557–568. [Google Scholar] [CrossRef]
  14. Wei, N.; Zhao, J.; Liu, A.; Zhou, S.; Zhang, L.; Jiang, L. Evaluation of Physical Parameters and Construction of the Classification System of Natural Gas Hydrate in the Northern South China Sea. Energy Fuels 2021, 35, 7637–7645. [Google Scholar] [CrossRef]
  15. Rodger, P.M. Stability of gas hydrates. J. Phys. Chem. 1990, 94, 6080–6089. [Google Scholar] [CrossRef]
  16. Liu, C.; Li, Y.; Liu, L.; Hu, G.; Chen, Q.; Wu, N.; Meng, Q. An integrated experimental system for gas hydrate drilling and production and a preliminary experiment of the depressurization method. Nat. Gas Ind. B 2020, 7, 56–63. [Google Scholar] [CrossRef]
  17. Li, Y.; Cheng, Y.; Yan, C.; Song, L.; Liu, H.; Tian, W.; Ren, X. Mechanical study on the wellbore stability of horizontal wells in natural gas hydrate reservoirs. J. Nat. Gas Sci. Eng. 2020, 79, 103359. [Google Scholar] [CrossRef]
  18. Freij-Ayoub, R.; Tan, C.; Clennell, B.; Tohidi, B.; Yang, J. A wellbore stability model for hydrate bearing sediments. J. Pet. Sci. Eng. 2006, 57, 209–220. [Google Scholar] [CrossRef]
  19. Zhang, H.; Cheng, Y.; Li, Q.; Yan, C.; Han, X. Numerical analysis of wellbore instability in gas hydrate formation during deep-water drilling. J. Ocean Univ. China 2018, 17, 8–16. [Google Scholar] [CrossRef]
  20. Sun, J.; Ning, F.; Lei, H.; Gai, X.; Sánchez, M.; Lu, J.; Li, Y.; Liu, L.; Liu, C.; Wu, N.; et al. Wellbore stability analysis during drilling through marine gas hydrate-bearing sediments in Shenhu area: A case study. J. Pet. Sci. Eng. 2018, 170, 345–367. [Google Scholar] [CrossRef]
  21. Yuan, Y.; Xu, T.; Xin, X.; Xia, Y.; Li, B. Mechanical stability analysis of strata and wellbore associated with gas production from oceanic hydrate-bearing sediments by depressurization. Chin. J. Theor. Appl. Mech. 2020, 52, 544–555. [Google Scholar] [CrossRef]
  22. Dong, L.; Li, Y.; Liu, C.; Liao, H.; Chen, G.; Chen, Q.; Liu, L.; Hu, G. Mechanical Properties of Methane Hydrate-Bearing Interlayered Sediments. J. Ocean Univ. China 2019, 18, 1344–1350. [Google Scholar] [CrossRef]
  23. Jin, Y.; Wu, N.; Li, Y.; Yang, D. Characterization of Sand Production for Clayey-Silt Sediments Conditioned to Hydraulic Slotting and Gravel Packing: Experimental Observations, Theoretical Formulations, and Modeling. SPE J. 2022, 1–20. [Google Scholar] [CrossRef]
  24. Lu, J.; Lin, D.; Li, D.; Liang, D.; Wen, L.; Wu, S.; Zhang, Y.; He, Y.; Shi, L.; Xiong, Y. Microcosmic Characteristics of Hydrate Formation and Decomposition in the Different Particle Size Sediments Captured by Cryo-SEM. J. Mar. Sci. Eng. 2022, 10, 769. [Google Scholar] [CrossRef]
  25. Li, Y.; Liu, C.; Liao, H.; Lin, D.; Bu, Q.; Liu, Z. Mechanical properties of the clayey-silty sediment-natural gas hydrate mixed system. Nat. Gas Ind. B 2021, 8, 154–162. [Google Scholar] [CrossRef]
  26. Dong, L.; Liao, H.; Li, Y.; Meng, Q.; Hu, G.; Wang, J.; Wu, N. Analysis of the Mechanical Properties of the Reconstituted Hydrate-Bearing Clayey-Silt Samples from the South China Sea. J. Mar. Sci. Eng. 2022, 10, 831. [Google Scholar] [CrossRef]
  27. Tan, C.P.; Clennell, M.B.; Freij-Ayoub, R.; Tohidi, B.; Yang, J. Mechanical and Petrophysical Characterisation and Wellbore Stability Management in Gas Hydrate-Bearing Sediments. In Proceedings of the Alaska Rocks 2005, the 40th US Symposium on Rock Mechanics (USRMS), Anchorage, Alaska, 25–29 June 2005; OnePetro: Richardson, TX, USA, 2005. [Google Scholar]
  28. Birchwood, R.; Noeth, S.; Hooyman, P.; Winters, W.; Jones, E. Wellbore Stability Model for Marine Sediments Containing Gas Hydrates. In Proceedings of the American Association of Drilling Engineers National Conference and Exhibition, Houston, TX, USA, 5–7 April 2005. [Google Scholar]
  29. Risnes, R.; Bratli, R.K.; Horsrud, P. Sand Stresses Around a Wellbore. Soc. Pet. Eng. J. 1982, 22, 883–898. [Google Scholar] [CrossRef]
  30. Yan, C.; Ren, X.; Cheng, Y.; Song, B.; Li, Y.; Tian, W. Geomechanical issues in the exploitation of natural gas hydrate. Gondwana Res. 2020, 81, 403–422. [Google Scholar] [CrossRef]
  31. Liu, X.; Sun, Y.; Guo, T.; Rabiei, M.; Qu, Z.; Hou, J. Numerical simulations of hydraulic fracturing in methane hydrate reservoirs based on the coupled thermo-hydrologic-mechanical-damage (THMD) model. Energy 2021, 238, 122054. [Google Scholar] [CrossRef]
  32. Sujatono, S. Determination of cohesion and friction angle on sedimentary rock based on geophysical log. Géoméch. Geophys. Geo-Energy Geo-Resour. 2022, 8, 1–10. [Google Scholar] [CrossRef]
  33. Jiang, H.; Xie, Y. A note on the Mohr–Coulomb and Drucker–Prager strength criteria. Mech. Res. Commun. 2011, 38, 309–314. [Google Scholar] [CrossRef]
  34. Labuz, J.F.; Zang, A. Mohr–Coulomb Failure Criterion. Rock Mech. Rock Eng. 2012, 45, 975–979. [Google Scholar] [CrossRef] [Green Version]
  35. Kesarev, A.G.; Vlasova, A.M. Generalized von Mises Criterion as a Tool for Determining the Strength Properties of Hexagonal Materials. Phys. Met. Met. 2022, 123, 186–192. [Google Scholar] [CrossRef]
  36. Zhao, Y.; Wang, Y.; Tang, L. The compressive-shear fracture strength of rock containing water based on Druker-Prager failure criterion. Arab. J. Geosci. 2019, 12, 542. [Google Scholar] [CrossRef]
  37. Chen, L.; Feng, Y.; Okajima, J.; Komiya, A.; Maruyama, S. Production behavior and numerical analysis for 2017 methane hydrate extraction test of Shenhu, South China Sea. J. Nat. Gas Sci. Eng. 2018, 53, 55–66. [Google Scholar] [CrossRef]
  38. Li, G.; Moridis, G.J.; Zhang, K.; Li, X.-S. Evaluation of the Gas Production Potential of Marine Hydrate Deposits in the Shenhu Area of the South China Sea. In Proceedings of the Offshore Technology Conference, Houston, TX, USA, 3–6 May 2010; p. OTC-20548-MS. [Google Scholar] [CrossRef]
  39. Zoback, M.D. Reservoir Geomechanics; Cambridge University Press: Cambridge, UK, 2010. [Google Scholar]
  40. Li, W.; Gao, D.; Yang, J. Study of mud weight window of horizontal wells drilled into offshore natural gas hydrate sediments. J. Nat. Gas Sci. Eng. 2020, 83, 103575. [Google Scholar] [CrossRef]
Figure 1. Particle size distribution of the filler.
Jmse 10 01935 g001
Figure 2. Coordinate transformation diagram of a deviated well axis.
Jmse 10 01935 g002
Figure 3. Schematic diagram of the stress distribution of the rock element on a deviated wellbore.
Jmse 10 01935 g003
Figure 4. A comparison between the three-dimensional failure surface derived from the M-C criterion and the D-P criterion.
Jmse 10 01935 g004
Figure 5. Cloud diagram of the collapse pressure gradient distribution under M-C failure criterion.
Jmse 10 01935 g005
Figure 6. Cloud diagrams for the collapse pressure gradient distribution under the D-P failure criterion.
Jmse 10 01935 g006
Figure 7. Hydrate saturation and collapse pressure gradient relationship curves by the two criteria.
Jmse 10 01935 g007
Figure 8. The deviation angle and the collapse pressure gradient relationship curves by the two criteria.
Jmse 10 01935 g008
Figure 9. The azimuth and the collapse pressure gradient relationship curves by the two criteria.
Jmse 10 01935 g009
Figure 10. The azimuth and the fracture pressure gradient curves of the wellbore.
Jmse 10 01935 g010
Figure 11. Window distribution cloud diagram for safe drilling fluid density.
Jmse 10 01935 g011
Table 1. Mechanical parameters of the hydrate.
Shσ3/MPaσ1/MPaCohesion
C/MPa
Friction Angle
ϕ
15%11.620.095310.340
23.17
45.95
30%12.480.42611.612
24.16
47.03
45%13.540.81112.275
25.12
48.17
60%14.291.07113.568
26.00
49.15
Table 2. Stress distribution expression for the surrounding strata caused by pi, σxx, σyy, τxy, τxz, and τyz.
σrσθτθr
R 2 r 2 p i R 2 r 2 p i /
( 1 R 2 r 2 ) σ x x 2 + ( 1 4 R 2 r 2 + 3 R 4 r 4 ) σ x x 2 cos 2 θ ( 1 + R 2 r 2 ) σ x x 2 ( 1 + 3 R 4 r 4 ) σ x x 2 cos 2 θ ( 1 + 2 R 2 r 2 3 R 4 r 4 ) σ x x 2 sin 2 θ
( 1 R 2 r 2 ) σ y y 2 ( 1 4 R 2 r 2 + 3 R 4 r 4 ) σ y y 2 cos 2 θ ( 1 + R 2 r 2 ) σ y y 2 + ( 1 + 3 R 4 r 4 ) σ y y 2 cos 2 θ ( 1 + 2 R 2 r 2 3 R 4 r 4 ) σ y y 2 sin 2 θ
( 1 4 R 2 r 2 + 3 R 4 r 4 ) τ x y sin 2 θ ( 1 + 3 R 4 r 4 ) τ x y sin 2 θ ( 1 + 2 R 2 r 2 3 R 4 r 4 ) τ x y cos 2 θ
Table 3. Stress distribution expression for the surrounding strata caused by τxy, and τyz.
τrzτθz
τ x z ( 1 R 2 r 2 ) cos θ τ x z ( 1 + R 2 r 2 ) sin θ
τ y z ( 1 R 2 r 2 ) sin θ τ y z ( 1 + R 2 r 2 ) cos θ
Table 4. Basic parameter values [37,38].
ParameterValue
Maximum principal stress, g/cm31.203
Minimum principal stress, g/cm31.159
Overburden rock stress, g/cm31.282
Poisson’s ratio0.45
Effective stress factor0.6
Publisher’s Note: MDPI stays neutral with regard to jurisdictional claims in published maps and institutional affiliations.

