Article

Efficiency and Wave Run-Up of Porous Breakwater with Sloping Deck

School of Civil Engineering, The University of Queensland, St. Lucia, Brisbane, QLD 4072, Australia
*
Author to whom correspondence should be addressed.
J. Mar. Sci. Eng. 2022, 10(12), 1896; https://doi.org/10.3390/jmse10121896
Submission received: 29 September 2022 / Revised: 24 November 2022 / Accepted: 28 November 2022 / Published: 5 December 2022
(This article belongs to the Special Issue Recent Advances in Floating Structures)

Abstract

:
In order to protect fragile shoreline and coastal assets during extreme storms, a combined floating breakwater-windbreak has been proposed to reduce both wind and wave energies in the sheltered area. The 1 km-long breakwater has a porous hull with internal tubes to allow free passage of water; thereby further dissipating wave energy. The deck of the structure is designed to have a slope of 25 degrees facing the upstream side, and arrays of cylindrical tubes are placed on the sloping deck to form a windbreak. A reduced-scale (1:50) model test was carried out in a wave flume to examine wave sheltering performance under significant wave heights Hs = 3.0 m to 7.5 m and peak wave periods Tp = 9.4 s to 14 s sea states. Both regular and random wave conditions with different wave heights were considered. It is found that transmission coefficients ranging from 0.4 to 0.6 can be achieved under tested wave conditions. Porous breakwater hull increases the wave dissipation coefficients and is effective in reducing the wave reflection at the upstream side. The wave run-up length is dependent on the Iribarren number if the reduction induced by vertical freeboard is considered. Based on experimental data, empirical formulae have been proposed to predict the wave run-up responses in regular waves, probability of non-zero wave run-up occurrence, modified Weibull distribution of the wave run-up peaks and extreme wave run-up in random waves.

1. Introduction

Breakwaters have been employed to protect coastlines and coastal assets from strong waves. In recent years, novel concepts of breakwaters such as floating breakwaters [1], Bragg breakwaters [2] and flexible membrane-type breakwater [3] have been proposed to improve the performance of breakwaters. Windbreaks have been built onshore to protect buildings from extreme winds. However, the two barrier structures of breakwater and windbreak have never been used together to shield fragile coastlines and coastal structures that have to contend with both extreme wave and wind loads in severe storms. This prompted Wang et al. [4] to propose a novel concept of placing a windbreak on the deck of a breakwater to create a sheltered area from both wind and waves as shown in Figure 1. The design comprises a rectangular breakwater with a triangular windbreak on its deck as shown in Figure 2. The windbreak part of the structure, which is designed based on the optimal performance of the windbreak, determines the deck slope and the freeboard. From the perspective of the breakwater, it should be able to withstand the impact load of the wave run-up. It is important to predict the maximum wave run-up length and the frequency of the wave run-up occurrence under random sea states, so that the deck area under wave impact can be designed accordingly. Besides, the freeboard height should be sufficient to avoid wave overtopping during severe storms. Previous studies have shown that for gentle slopes, empirical equations have been used to estimate the wave run-up heights. The well-known Hunt formula [5] suggests that the wave run-up height is proportional to the Iribarren number ξ = tan   α H / L 0 , in which α is the beach slope, H the wave height, and L0 the shallow water wavelength. Other formulae with similar forms but with slightly different regression coefficients may be found in references [6,7,8,9,10,11]. The proposed empirical formulae are only applicable for mild slopes or small wave heights, such as H/L = 0.05 or 0.07 in reference [7], ξ o p < 3.2   in reference [8], ξ o p < 2.0   in reference [9], in which ξ o p is the deep water Iribarren number. For random wave conditions, a common extreme wave run-up with 2% exceedance level is commonly selected as a typical parameter in references [7,8,9]. In addition to the extreme wave run-up heights, the distribution of random wave run-up heights under random wave conditions has also been studied. Most commonly used distribution functions are Gaussian [12], Rayleigh [12,13,14] and Weibull [15,16,17] distributions. In particular, the Weibull distribution has been found to be a satisficing model for the description of other random wave responses, such as the air gap height studied in references [18,19].
Studies on steep slopes reveal nonlinear relationships between wave run-up parameters and the Iribarren number, e.g., in references [17,20]. For example, a wave power harvesting device known as OWEC (overtopping wave energy converter) has been studied in references [14,21,22,23]. This type of system includes a steep slope to minimize wave breaking on the slope, and a low crest freeboard. These studies of wave rum-ups on steep slopes have revealed nonlinear relationships between wave run-up and the Iribarren number. In addition, modified empirical formulae have been proposed for non-conventional coastal structures other than the conventional beaches and rubble mound breakwaters, so that the effects of modified structural designs may be taken into consideration. For example, Park and Cox [24] introduced a modified Iribarren number to predict the storm surge on the slope of a berm.
The empirical formulae in previous studies cannot be directly applied to the designed breakwater-windbreak structure since they do not include a vertical freeboard. In this study, reduced scale model tests have been performed in the wave flume of the Hydraulics Lab in the University of Queensland. Based on the experimental data, this paper aims at proposing modified Iribarren number-based empirical formulae that include the influence of freeboard. Following a similar approach as in [24], the current study first attempts to apply the existing empirical formulae directly to investigate their applicability. Next, modified formulae are proposed to consider the influence of the freeboard on the wave run-ups based on experimental data.
The rest of the paper is arranged as follows: Section 2 describes the novel design of the breakwater-windbreak structure; Section 3 introduces the model test setup; Section 4 presents a summary of test data post-processing procedure; Section 5 presents the calculated wave reflection, transmission and dissipation coefficients as a validation of the breakwater concept; Section 6 discusses the wave run-up response on the steep slope with a vertical freeboard, and presents modified formulae on the description and prediction of wave run-up lengths on the slope.

2. Concept of Floating Breakwater-Windbreak

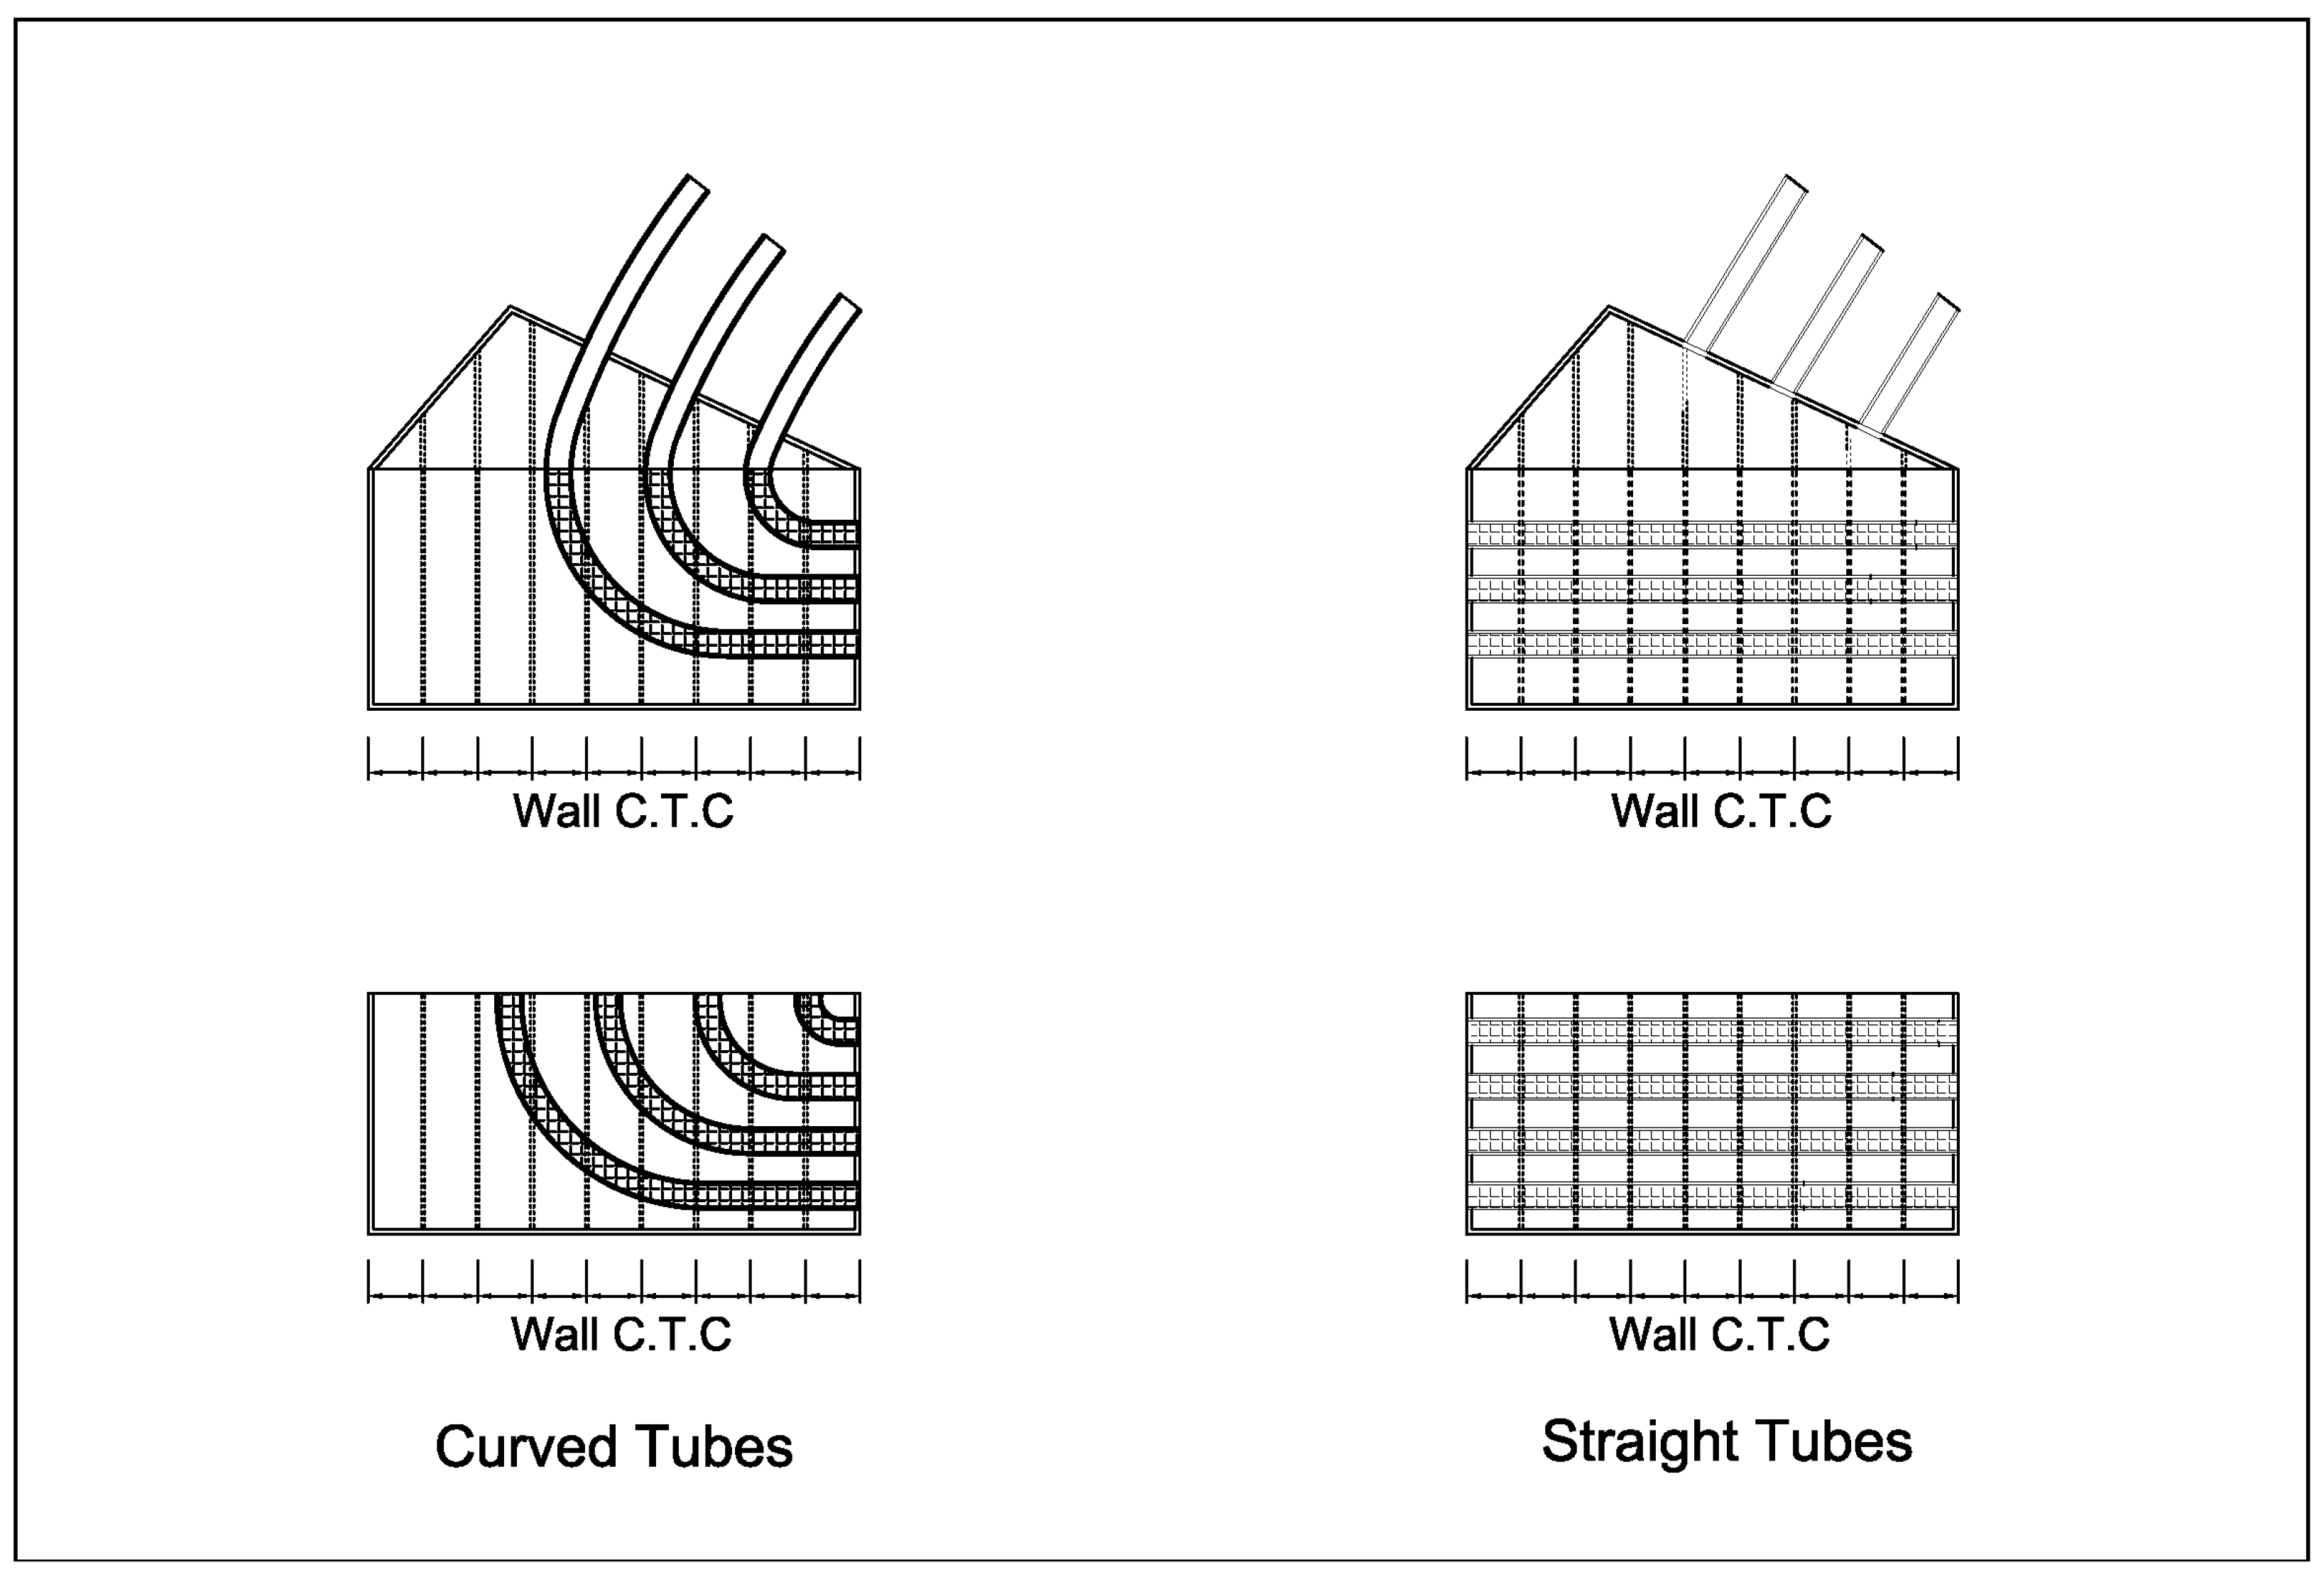
The novel concept of a combined breakwater-windbreak structure will be discussed briefly while more details on the design can be found in reference [4]. The structure is designed to protect its downstream area from extreme wind and wave actions. The hull is designed to be in the shape of arches in the plan view, so that the concrete breakwater is kept in compression under incoming waves. The angle of each arch is 84 degrees. The breakwater is designed to be porous by installing internal tubes inside the structure; thereby allowing water to freely enter and exit from the openings on the vertical walls of the breakwater. Two designs of the internal tubes are proposed and tested as shown in Figure 2. The first design involves curved L-shape tubes with their openings on the front wall and connected to the hollow tubes on the deck that serve as the windbreak. The second design involves straight tubes through the breakwater; thereby allowing the water to enter from the front wall and to exit through the openings of the back wall. The diameter of each tube is 2.5 m, resulting in an overall porosity of 8.4%. Numerical studies have shown that both designs have the advantages of lower wave loads due to the porous hull [25,26] under regular wave conditions.
The windbreak comprises alternately arranged array of tubes on a triangular shaped deck from a cross-section view as shown in Figure 2. In Figure 2, the top two sketches show the sectional view of the structure, while the lower two sketches show the sectional view of the part of structure under the sloping deck that acts as the breakwater. As the windbreak efficiency is primarily decided by its projected area perpendicular to the direction of the coming wind, the triangular shaped deck is better than the rectangular shaped deck with the same projected area but half volume; thereby reducing the weight and material cost of the structure. Detailed parametric studies have been performed to ensure the wind sheltering performance of the windbreak with current design parameters [4,27].

3. Experimental Setup and Test Matrix

Experimental studies as described herein are dedicated to two purposes: the validation of the breakwater concept especially the influence of the internal tubes on the breakwater performance, and the wave run-up response under regular and random waves. The wave data of a selected site in the Gold Coast of Australia is used as the design sea states: Hs = 3.0 m, Tp = 9.3 s–14 s in 1-year return period, and Hs = 7.5 m, Tp = 14.0 s in 100-year return period.
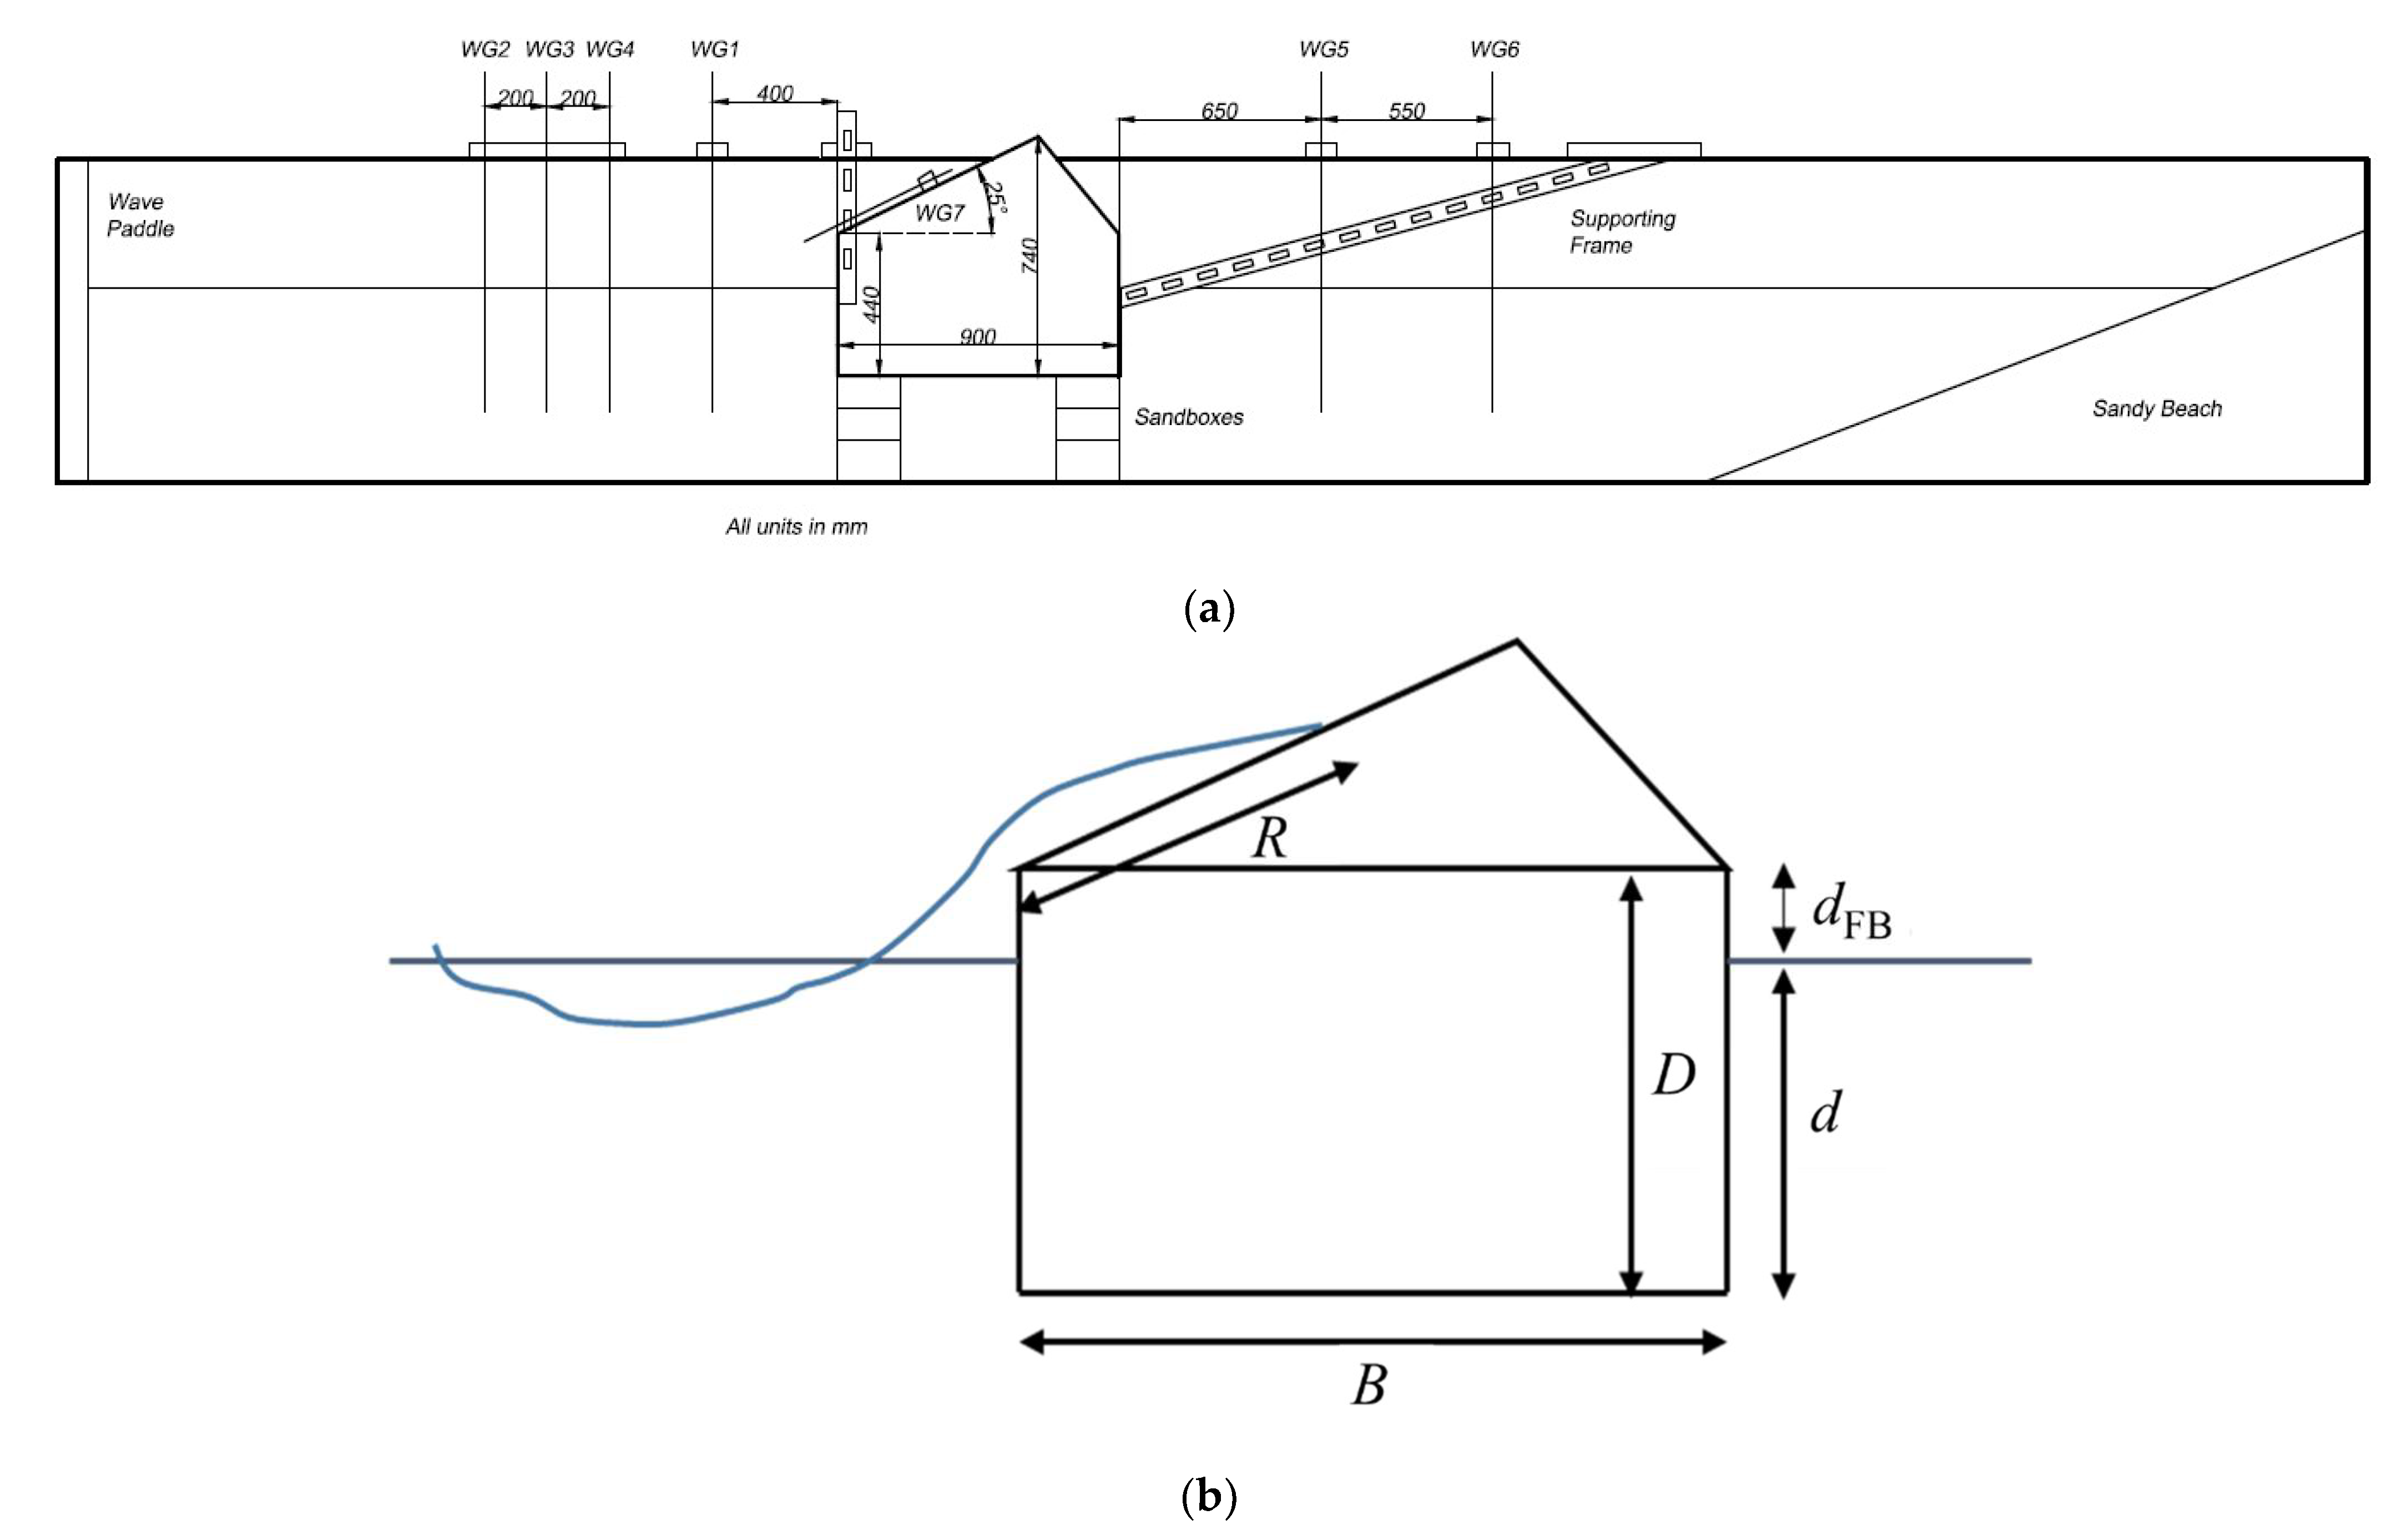
The experiments were carried out in the wave flume of the Hydraulics Lab in the University of Queensland, Australia. The wave flume measures 24 m long × 1 m wide × 1 m deep. A model scale of 1:50 was adopted with a constant water depth of 0.60 m (30.0 m in full scale), so that the tested wave conditions are in the range of Hs = 0.06 m to 0.15 m, Tp = 1.33 s to 1.98 s. The model was placed at the mid-point of the flume between the wave paddle and the absorptive beach at the other end. It was kept stationary by bolting it to rigid frames that were clamped to the wave flume as well as supported at the bottom by small wooden boxes filled with sand as shown in Figure 3a. The size of the sand boxes is less than 10% when compared with the shortest tested wavelength so that the boxes do not induce significant wave diffraction. In the experiment, the model was raised vertically and fixed at different levels with the view to investigate the influence of different drafts and freeboard heights. A total of 7 wave gauges were employed in the test. Three wave gauges numbered #2 to #4 were placed at the upstream and two wave gauges #5 and #6 at the downstream to measure the incident wave height and the transmitted wave height, respectively. These measurements allow one to determine the wave reflection and transmission coefficients. Wave gauge WG1 was placed near the structure to measure the wave elevation immediately before wave run-up. The wave gauge was not placed directly in front of the model wall to avoid the impact of water running back down from the tilted deck or water exiting the tubes which will lead to inaccurate measurements of the wave elevation. In addition, wave gauge WG7 was placed on the tilted deck and calibrated to measure the wave run-up length on the deck. The positions of all wave gauges are shown in Figure 3a.
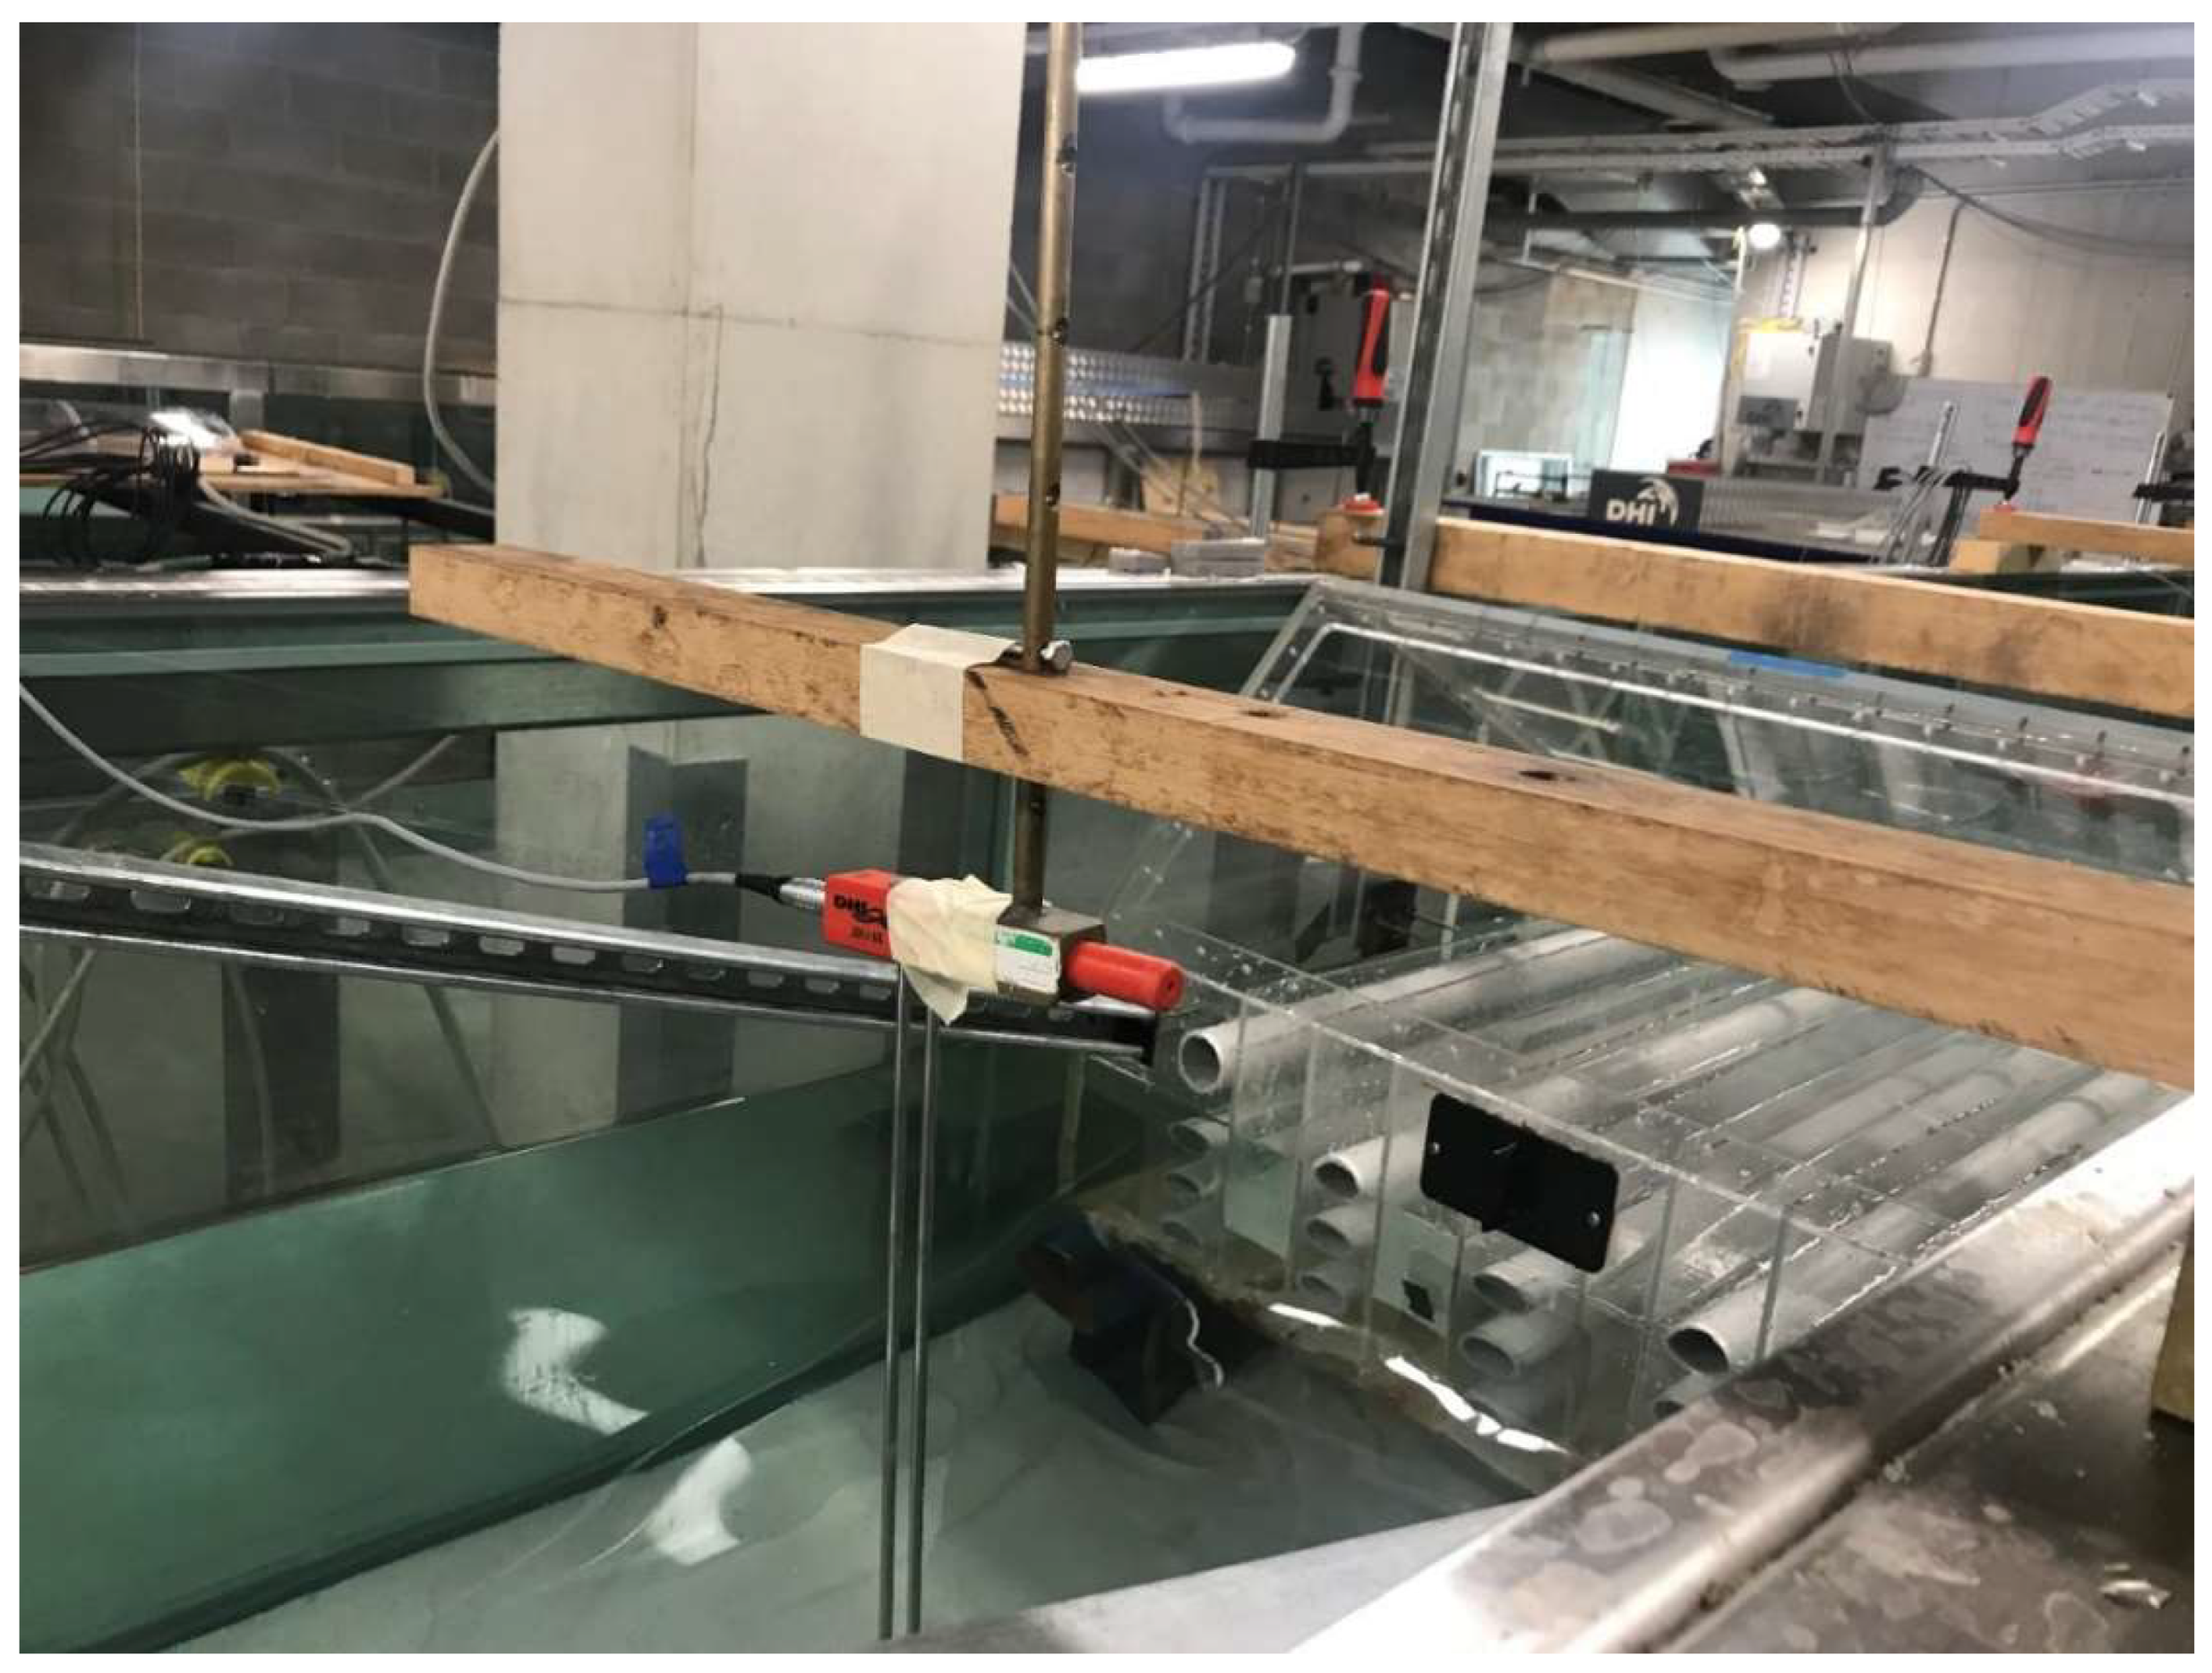
Three different models were tested in the experiment: two porous breakwater models as shown in Figure 2, and one model without any porosity (physically modelled by blocking the tube openings). The tubes are made from acrylic or PVC and installed as shown in Figure 4. Besides the designed draft d = 0.27 m, deeper drafts of d = 0.32 m, 0.37 m and 0.42 m were also tested to investigate the breakwater performance with various freeboards that influence the wave run-up. The uppermost layer of tube in the 3-tube section and 4-tube section is 0.075 m and 0.025 m below still water level, respectively. The centre-to-centre distance between two adjacent tube layers are 0.1 m. When the structure is moved to a different elevation, the draft d and the freeboard height dFB change accordingly. Three wave heights of H = 0.06 m, 0.10 m and 0.15 m were considered in the regular wave tests. These three wave heights were adopted as significant wave heights with peak wave periods Tp = 1.33 s and Tp = 1.98 s. An active wave absorption scheme is adopted in wave generation to reduce the effect of re-reflection in the upstream area. Table 1 presents the geometry and dimensions of the model in reduced scale and Table 2 shows the values of test parameters. The main dimensions and notations of the breakwater are shown in Figure 3b, in which the width, depth, draft and freeboard are denoted as B, D, d and dFB, respectively. In particular, R denotes the wave run-up distance along the deck. The wave run-up length R can be easily converted to wave run-up height, a commonly used parameter in the literature, by trigonometric relationships. In this paper, we use L instead of the vertical wave run-up height mainly because the length R along the deck directly affects the deck structural design.

4. Test Data Processing

For reflection and transmission coefficients in regular wave tests, the two-point method developed by Suzuki and Goda [28] is adopted to separate the incoming and reflection wave components in the recorded time series. For the coefficients in random wave tests, the three-point least square method proposed by Mansard and Funke [29] is used to separate the incident and reflected wave spectrums. Frequency-dependent reflection and transmission functions K r ( ω ) and K t ( ω ) can be calculated from:
K r ( ω ) = S r ( ω ) S i ( ω )
K t ( ω ) = S t ( ω ) S i ( ω )
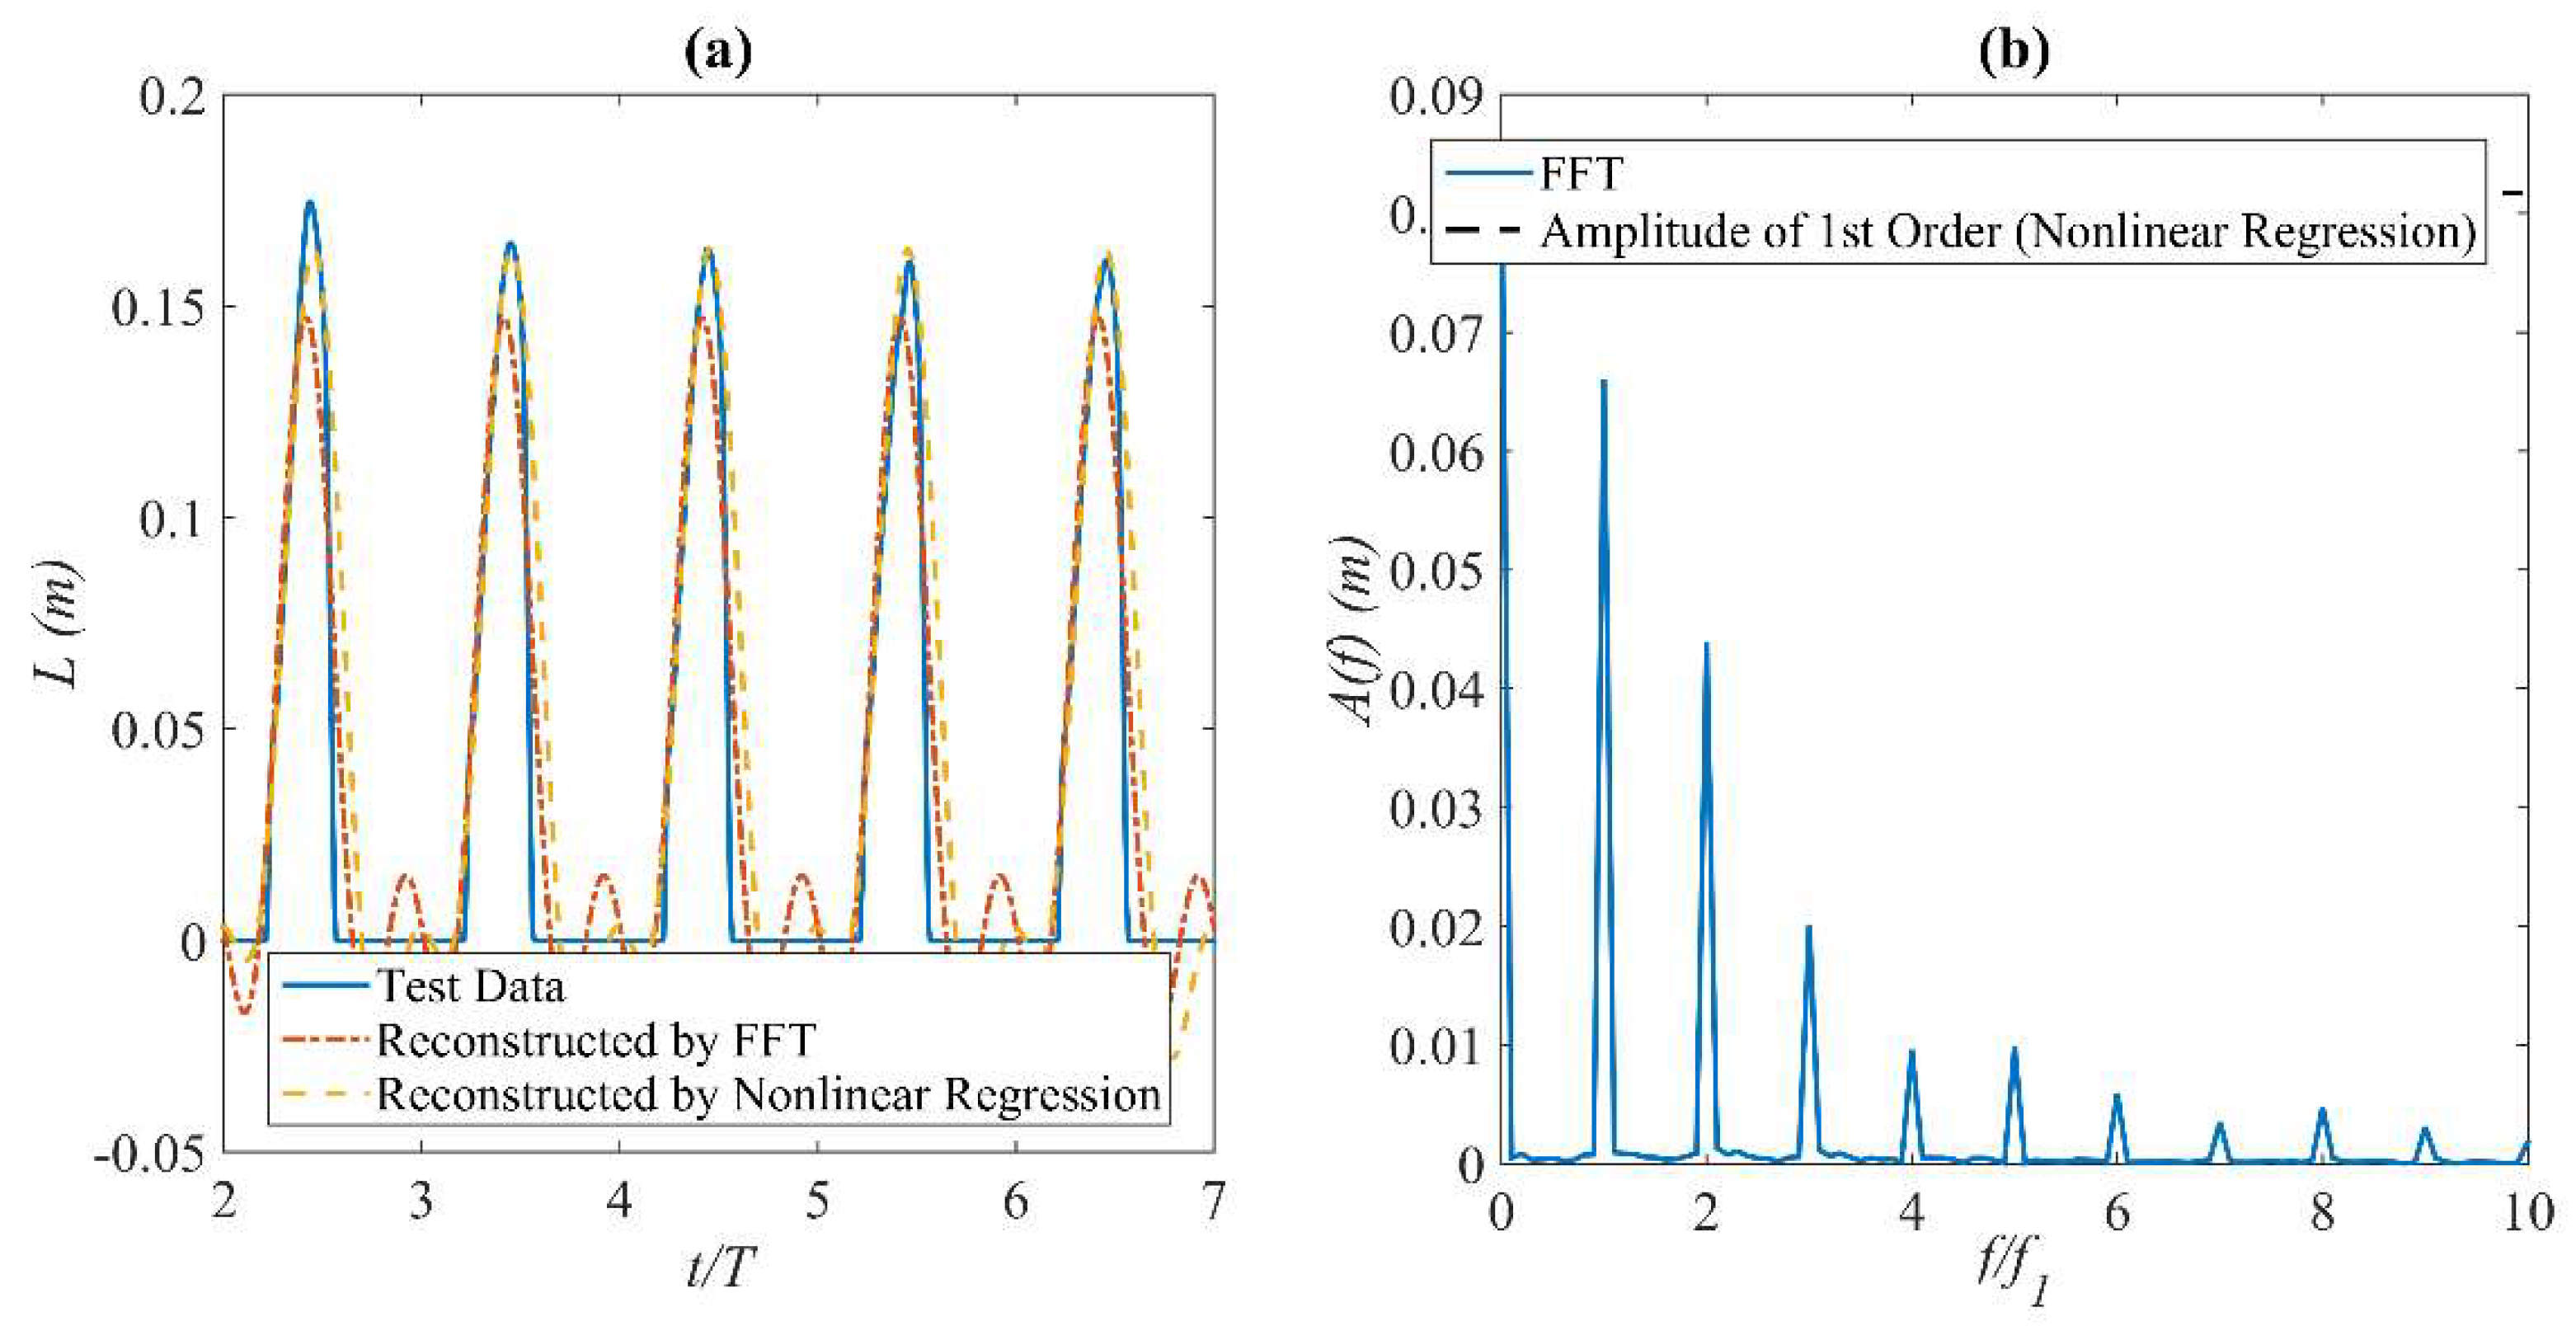
where S i ( ω ) , S r ( ω ) and S t ( ω ) are the incoming, reflected and transmitted wave spectra, respectively. The dissipation coefficient K d ( ω ) can be readily computed since the square sum of the three coefficients is equal to 1.0. In the experiment, the wave run-up length is measured by placing the wave gauge WG7 along the surface of the sloping deck. The wave gauge measures the wave run-up distance along the deck by measuring its average submerged volume. As shown in Figure 5, the recorded wave run-up height is not fully sinusoidal because the wave run-up length is always positive. This leads to inaccurate amplitudes and noises when the test data was processed by the standard FFT. As shown in Figure 5a,b, higher order noise is shown in the FFT result. When comparing the 1st order wave amplitude derived from FFT and the measured data by reconstructing the time series based on wave amplitude and period derived from FFT, it can be seen that the FFT result is lower than the measured data. To minimize this effect, the original test data is further processed by fitting it to a second order Fourier series. A weighted nonlinear regression is performed to find the coefficients a 1 , a 2 , φ 1 , φ 2
b = ( a 0 , a 1 , a 2 , φ 1 , φ 2 ) = a r g m i n i = 1 N w i [ y i f ( t i , b ) ] 2
where b is the array containing all regression parameters, w i is the weight function, f ( t i , b ) is the applied regression function assumed as a second-order Fourier series given by
f ( t , b   ) = a 0 + i = 1 2 a i cos ( ω i t i + φ i )
and the weight function
w i = {                               1 ,                   wave   run-up 0.001 ,                   otherwise
is used to exclude the zeroes and wave run-down data from the data fitting, so that a function that accurately describes the wave run-up process can be obtained. As shown in Figure 5a, the wave amplitude derived from the nonlinear regression analysis is closer to the measured data when it is reconstructed into time series. This process is used to determine the frequency-dependent wave run-up length from experimental data under regular wave conditions.

5. Experimental Results of Breakwater Efficiency

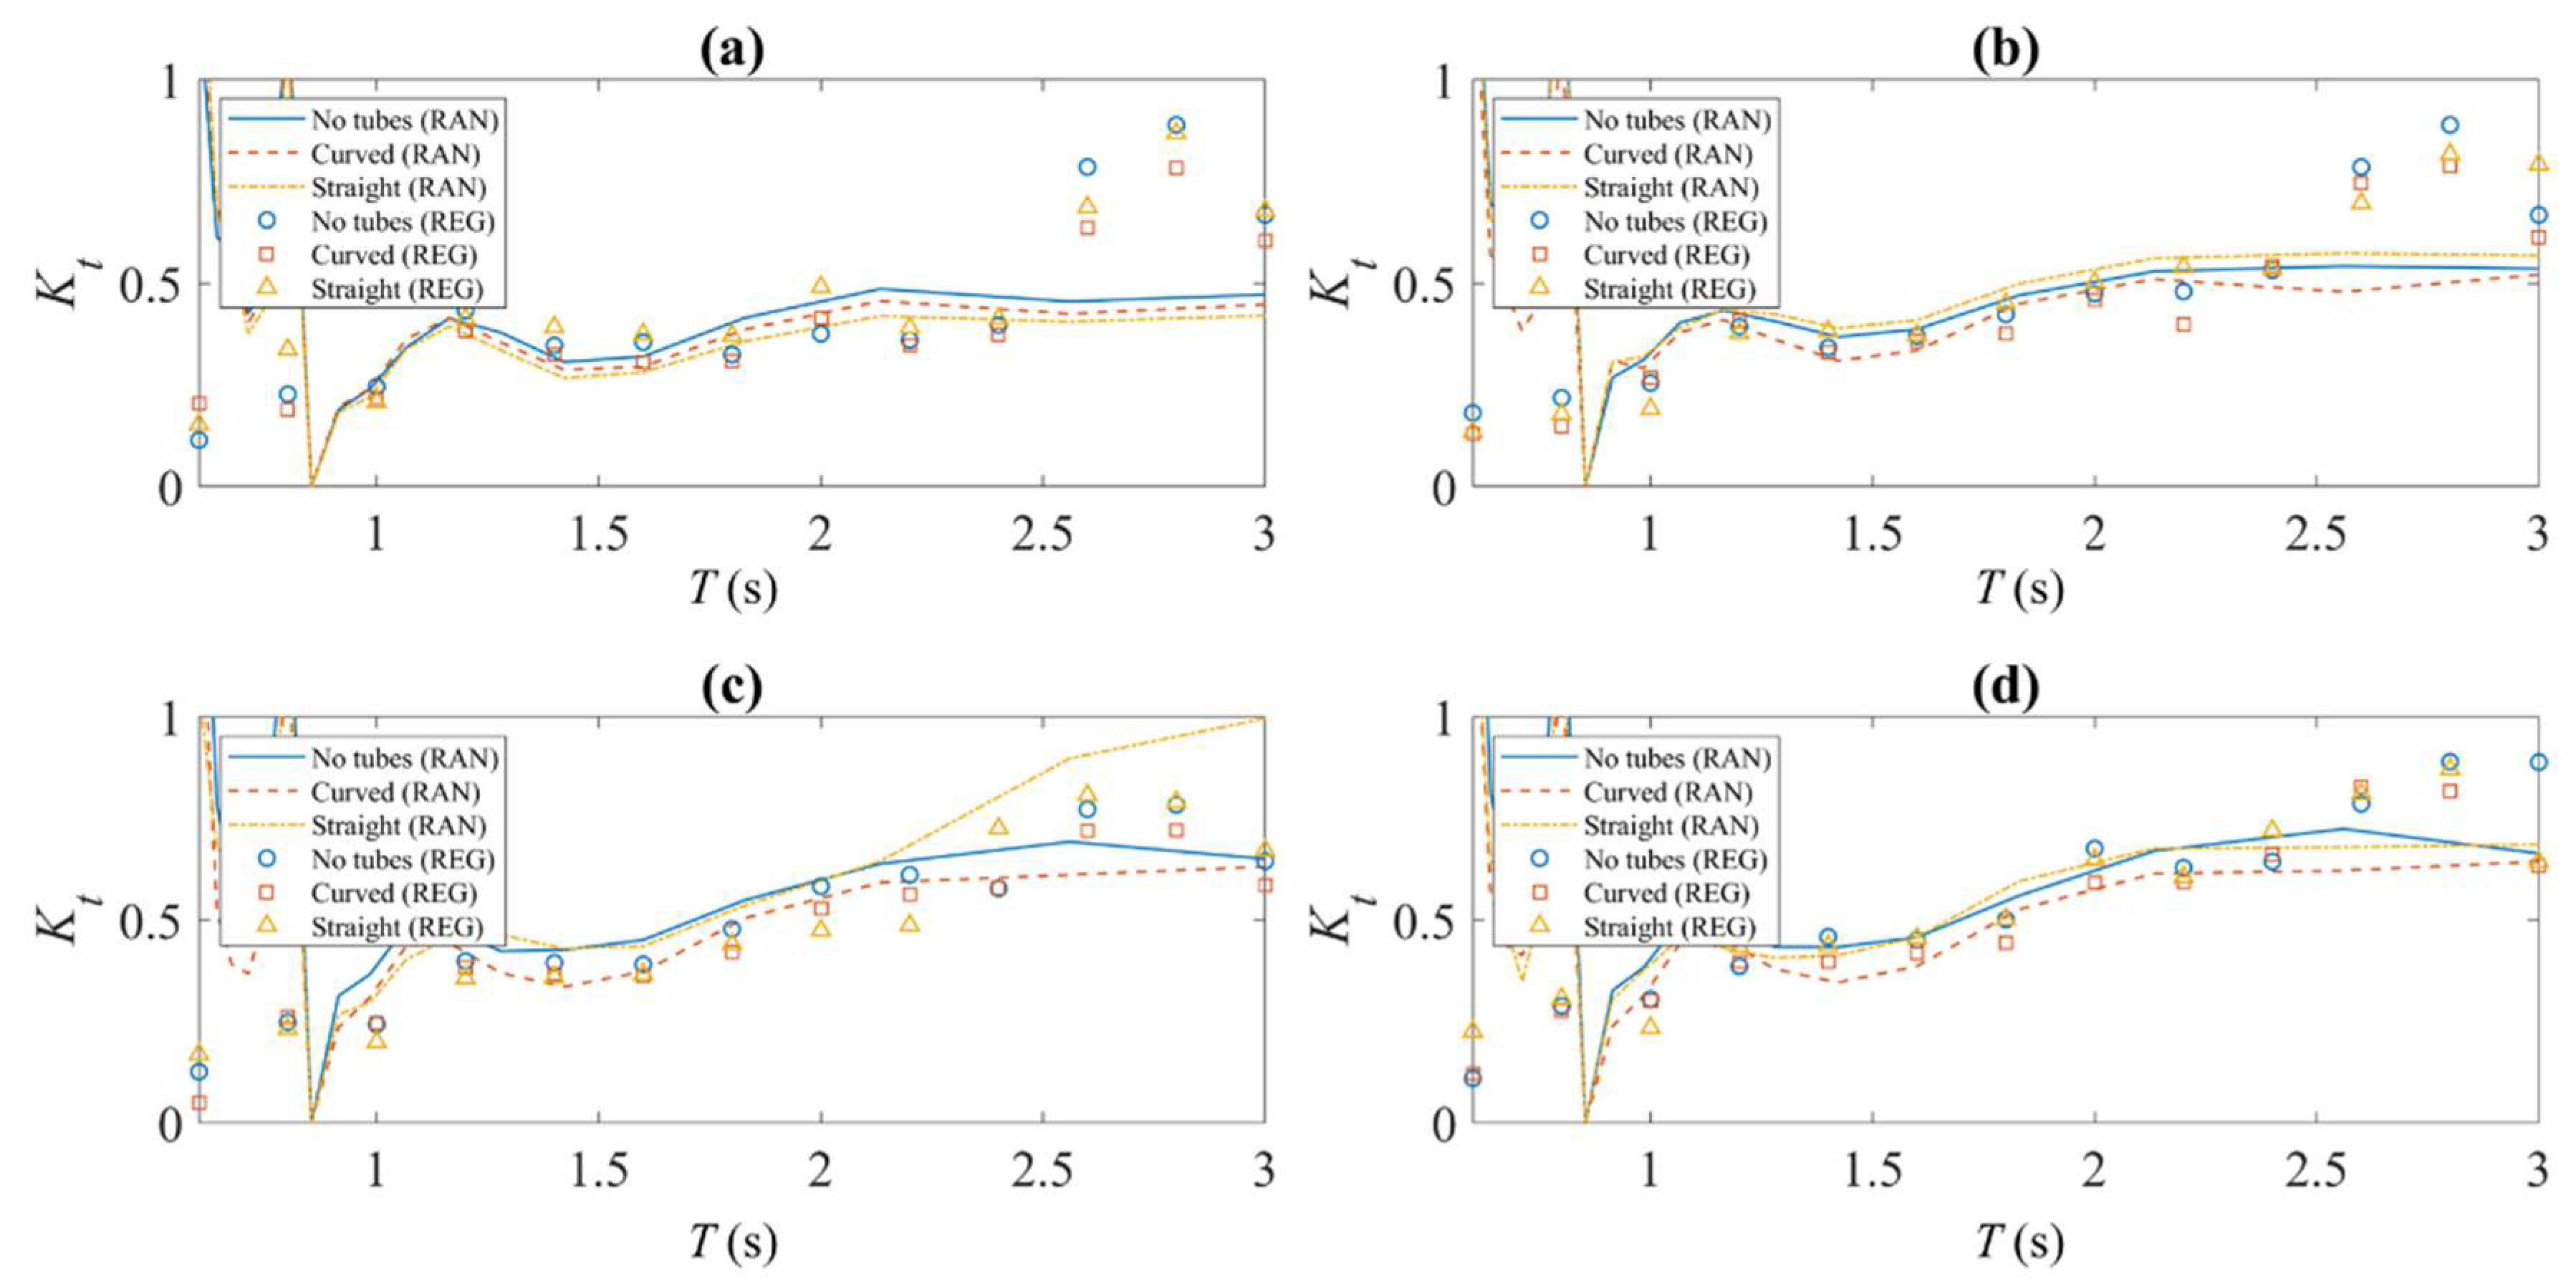
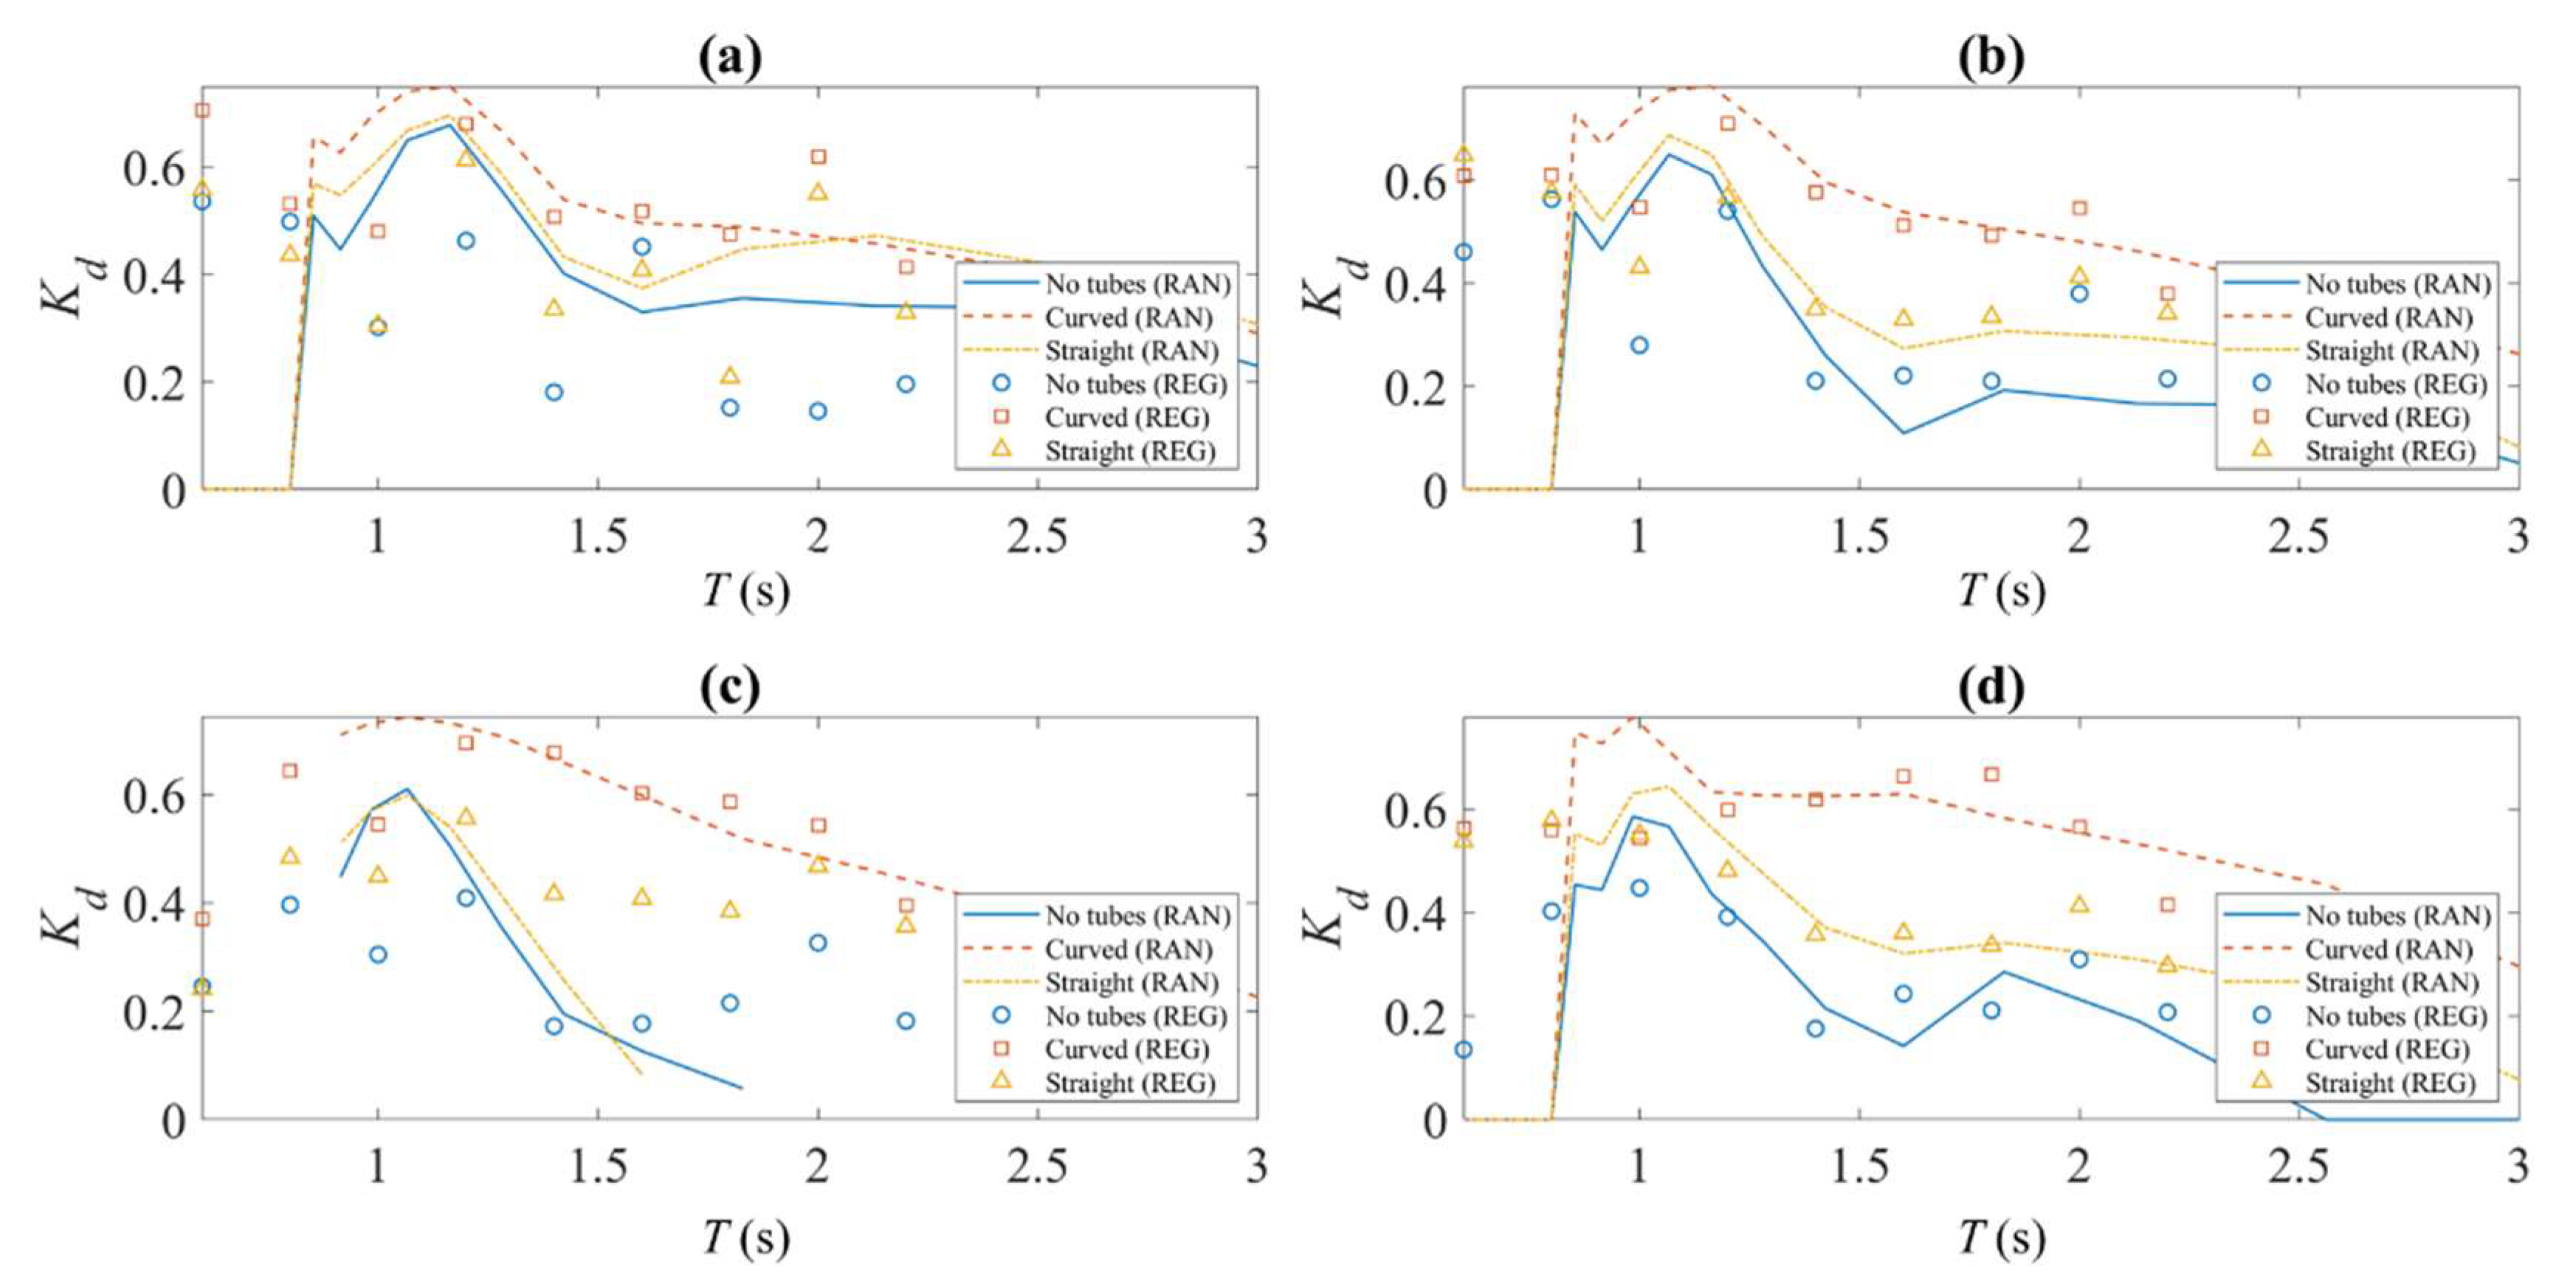
Figure 6, Figure 7 and Figure 8 show the wave reflection coefficients Kr, wave transmission coefficients Kt and wave dissipation coefficients Kd under linear waves as calculated from the measured wave elevations. Results under regular wave conditions with wave height H = 0.06 m and random wave with Hs = 0.06 m and Tp = 1.98 s are indicated by symbols and line types, respectively. The figures show that the results of regular and random waves are in good agreement except for the wave periods that range from T = 0.6 s to 1.0 s that are not covered by the narrow banded JONSWAP spectrum as applied in random wave tests. As a result, the calculated Kr and Kt are more impacted by random noises in the test, leading to fluctuations in the results. The results of random waves in that wave period range are therefore not accurate and regular wave test results should be used in further applications. For the same reason, the dissipation coefficients are not calculated in this range for random waves. In addition, the figures show that the draft has only a small influence on the breakwater performances. An increase of wave reflection for long wave periods ranging from T = 2.0 s to 3.0 s can be seen from Figure 6a,d, but only an average of 20% increase is achieved by changing the draft from d = 0.27 m to 0.42 m, while the model is 55% heavier. It is not an economic choice to build a breakwater all the way down to the seabed, and hence the rationale for using a floating breakwater.
With regard to different tube settings, Figure 6 shows that both the straight tubes and curved tubes are able to reduce the wave reflection coefficients while the wave transmission coefficients are not being negatively influenced. In fact, the wave transmission coefficients are also reduced in most test cases, even if the straight tubes allow the water free passage to the downstream side. The wave dissipation coefficients of the porous breakwaters are consequently higher. In addition, the results show that the curved tubes induce a smaller reflection coefficient at most wave periods and drafts. In summary, the breakwater with curved tubes is a more efficient concept for a low-reflection breakwater.
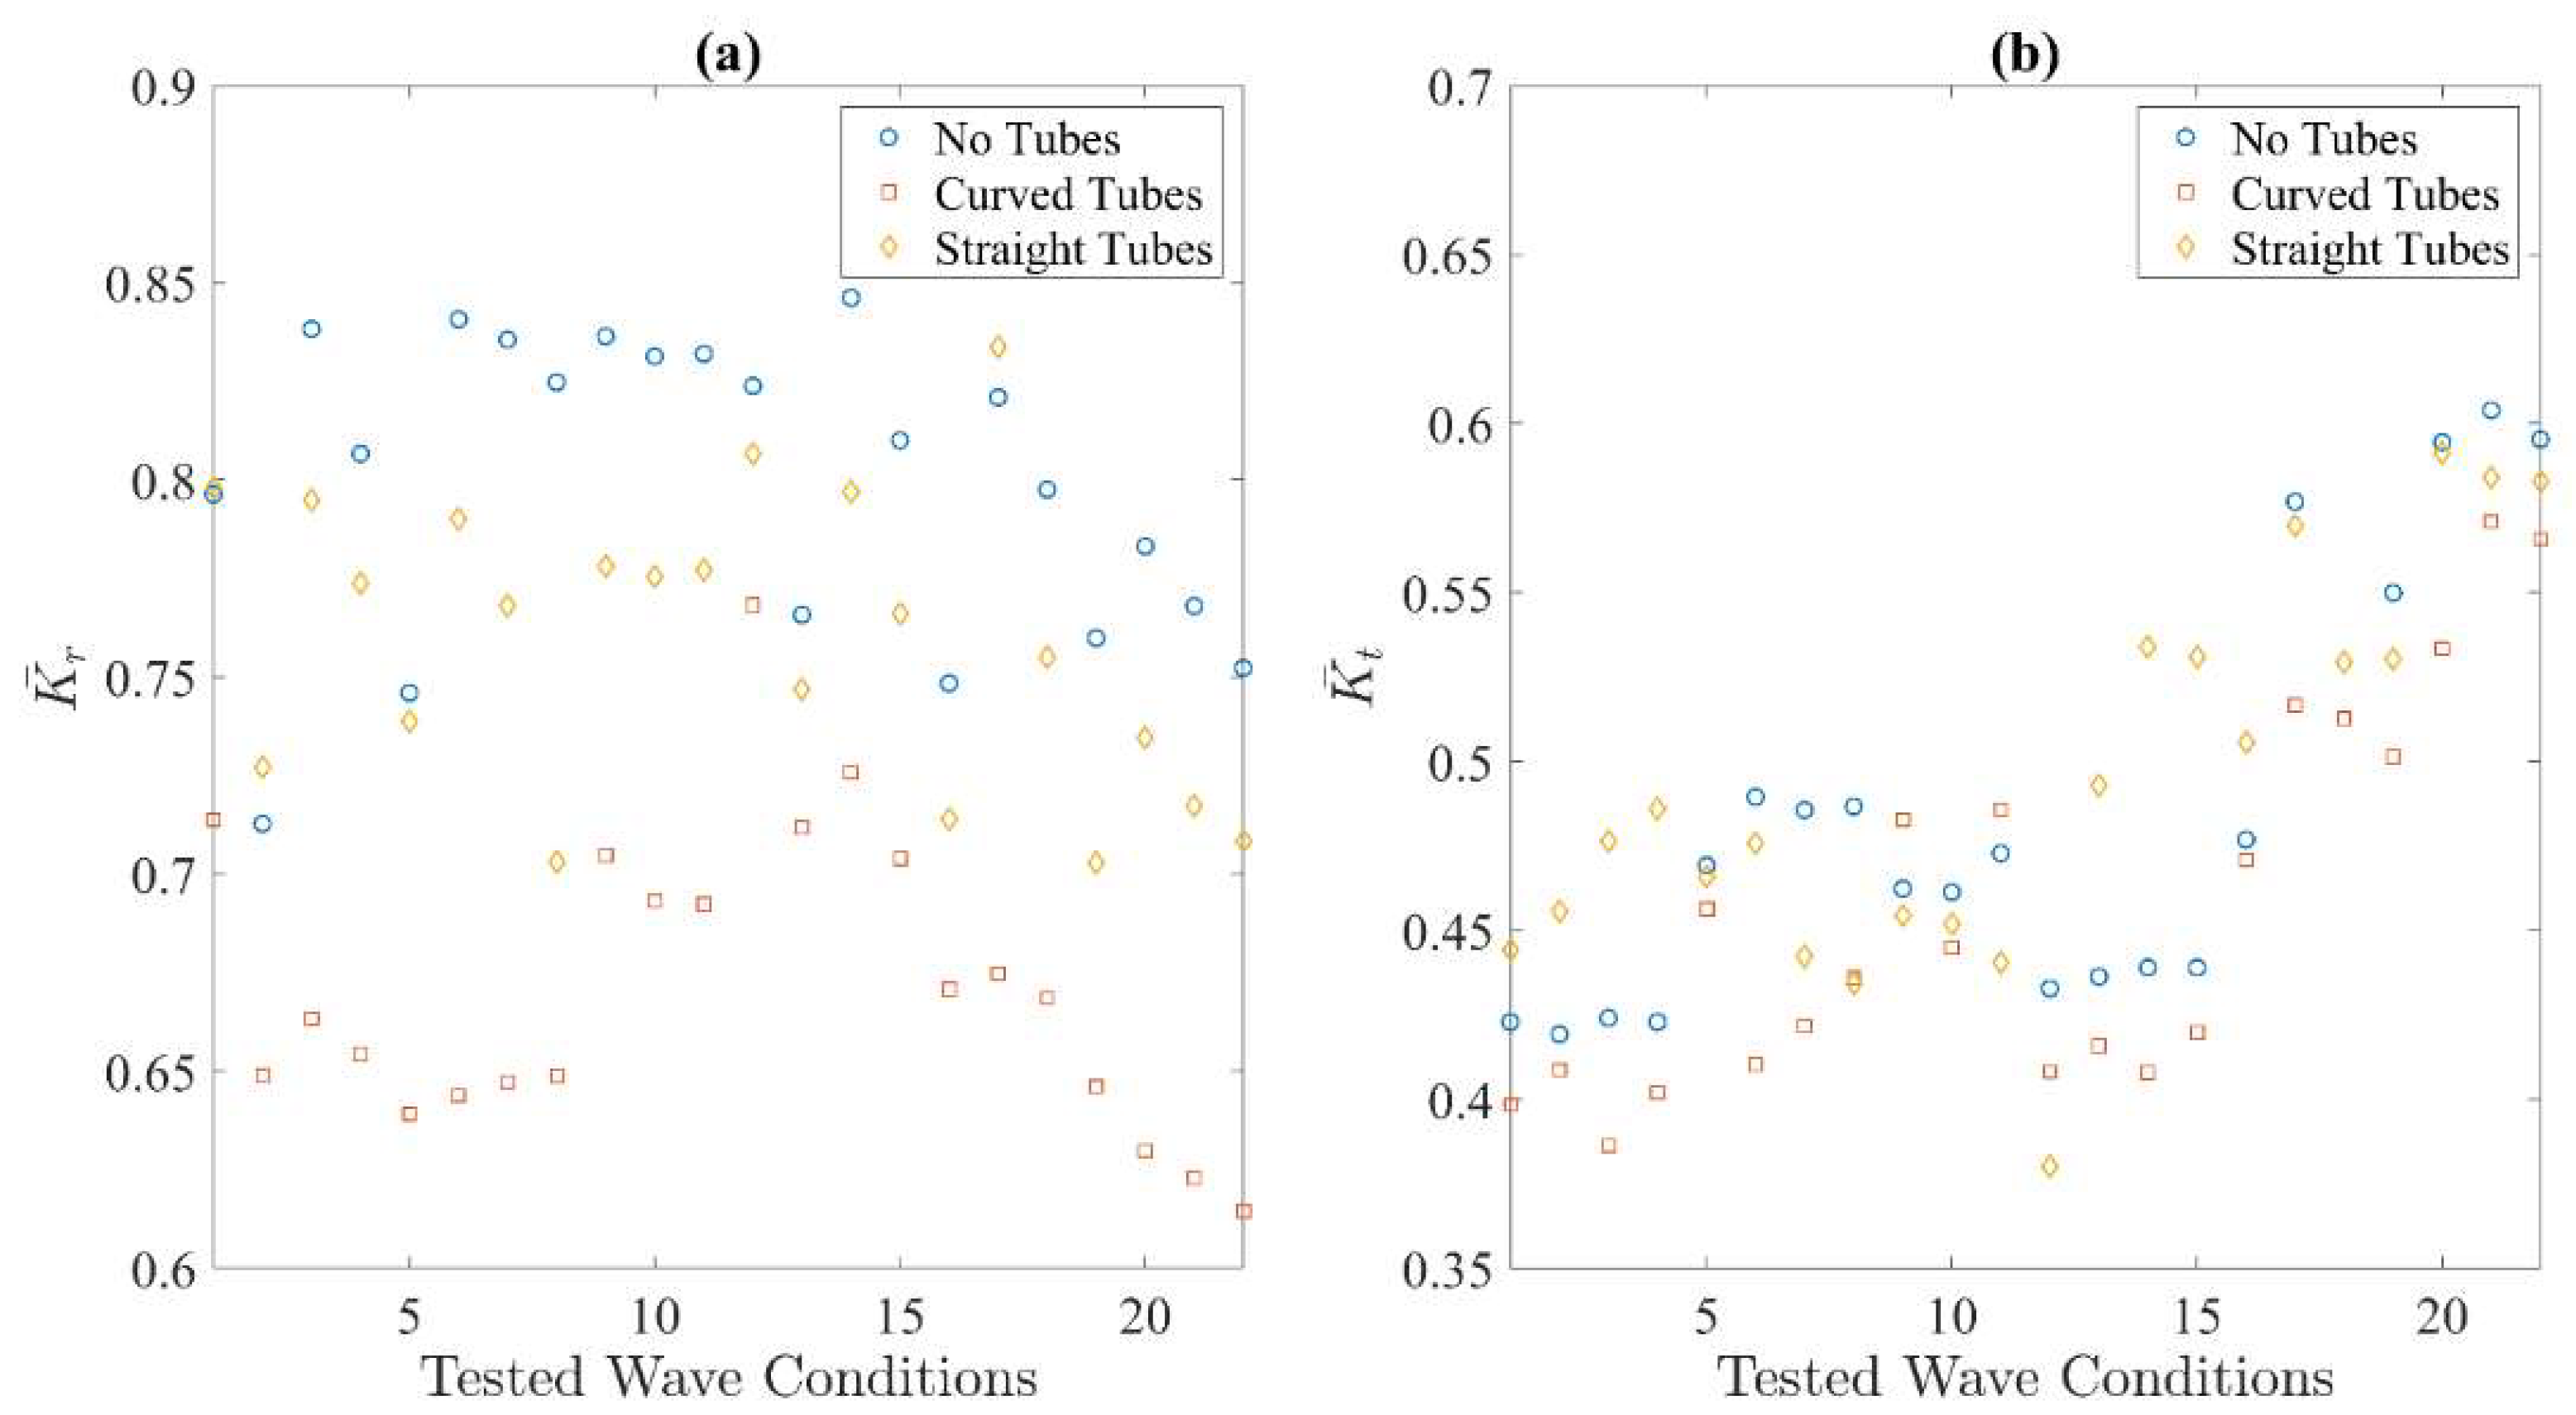
Figure 9 shows the average reflection and transmission coefficients for all tested random wave conditions with various significant wave heights Hs, wave periods Tp and drafts d. Wave conditions No. 1–No. 11 (see Table 3) are short waves with Tp = 1.33 s, while the others are long waves with Tp = 1.98 s. In shorter waves, the average transmission coefficient is less than 0.5, while in long waves a Kt from 0.4 to 0.6 can be achieved. By comparing the results of different models, it is clear that the reflection coefficient is reduced by the porous breakwater but the transmission coefficients are only slightly affected. These observations are identical with those obtained from regular wave tests. The regular and random wave tests both confirm a lower reflection induced by porous breakwaters, and the curved tubes are found to be more effective.
The reduced scale model test is subjected to potential scaling effects. Referring to [30], the relative significance of flow resistance can be separated into three components: inertial, turbulent and linear force. Additionally, flow regime can be determined accordingly. From the detailed calculation in [31], it is found that both the current model test and the full-scale scenario it simulates have the same flow regime (identified as ‘coarse gravel’ in [30]), and therefore the scaling effect is minimized.

6. Analysis of Wave Run-Up on Sloping Deck

6.1. Analysis of Regular Wave Test Results

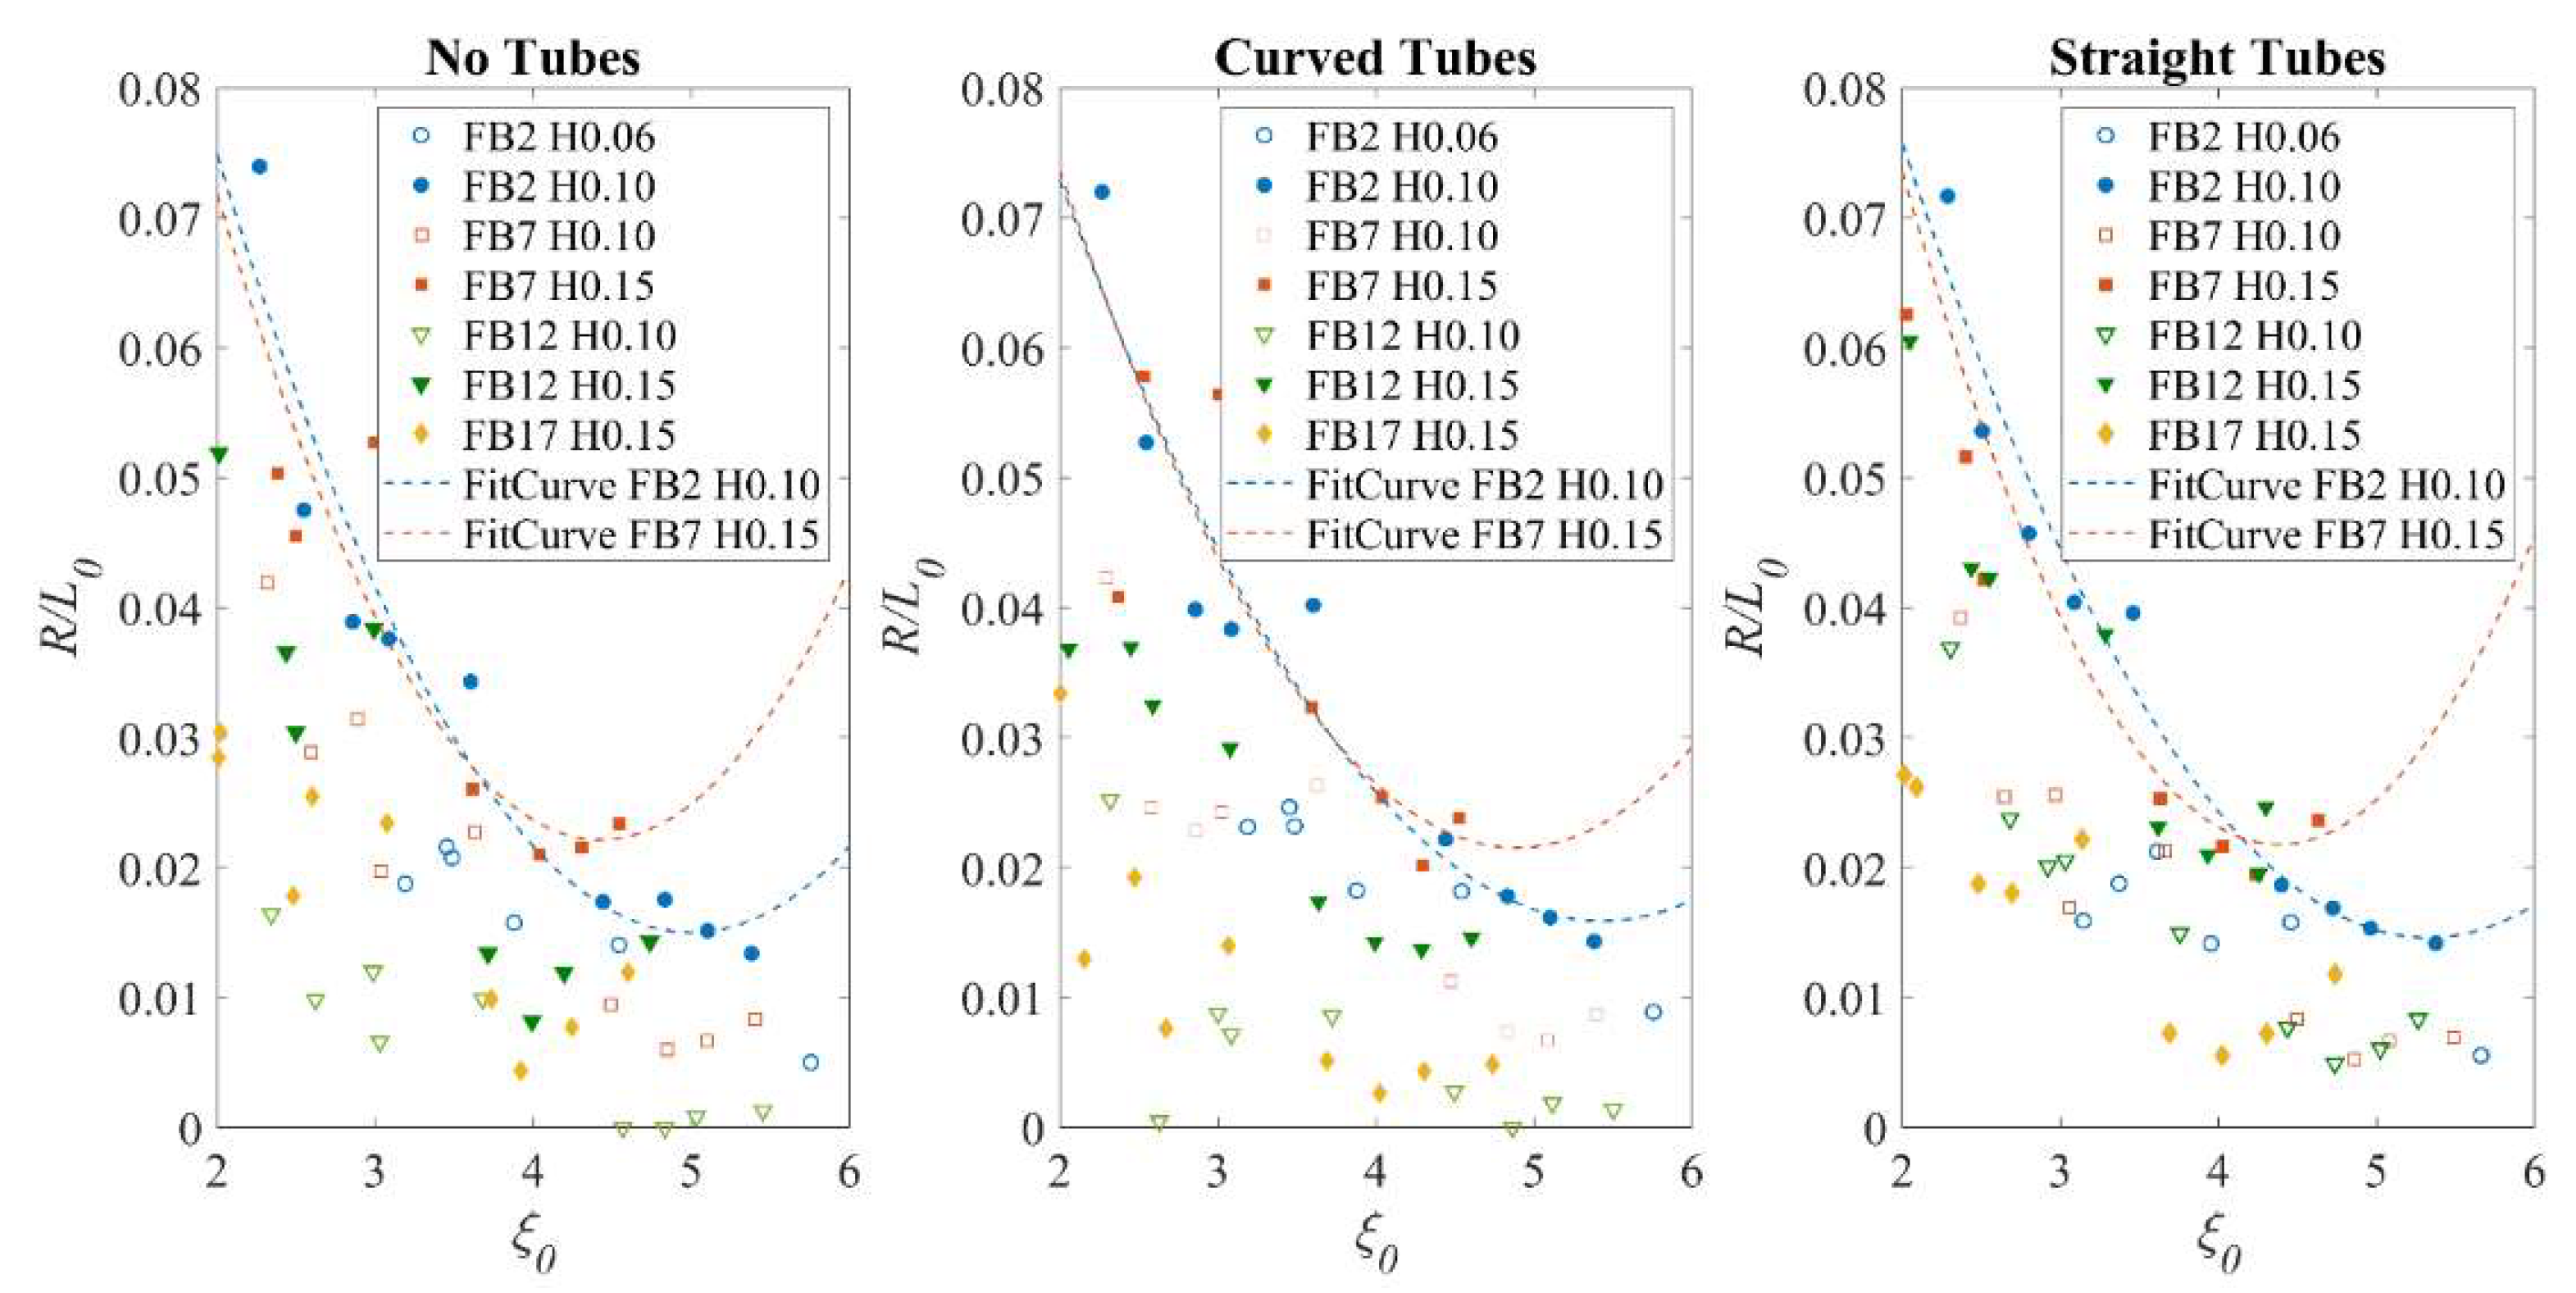
As the first step, following similar practices as in [20], the wave run-up distance R measured for cases with different combinations of dFB and H is plotted with non-dimensional parameter R/L0 versus Iribarren number ξ0 calculated by using deep water wave length L0 in Figure 10. The measured dimensionless wave run-up lengths under various dFB and H are highly scattered and cannot be fitted into a single polynomial curve. This indicates that the wave run-up is highly sensitive to independent parameters dFB and H. Only when the freeboard dFB is small when compared with the incident wave height (2 cm freeboard with 0.10 m incoming wave height and 7 cm freeboard with 0.15 m wave height), the relationship between R and ξ0 can be fitted by a second-order polynomial. When the freeboard is higher, it is observed that the wave run-up height is reduced as compared to the cases with close-to-zero freeboard. In view of this observation, we propose to modify the empirical formula in previous studies by adding a correction term that reflects the reduction of wave run-up due to vertical freeboard in the following form:
R mod L 0 = R 0 + Δ R L 0 = C 0 + C 1 ξ 0 + C 2 ξ 0 2
where the modified run-up length Rmod comprises R0, the wave run-up length without freeboard effect, and Δ R , the reduced run-up length due to freeboard effect. Δ R is close to 0 when the freeboard is negligible, and Equation (6) reduces to the same form as found in the literature.
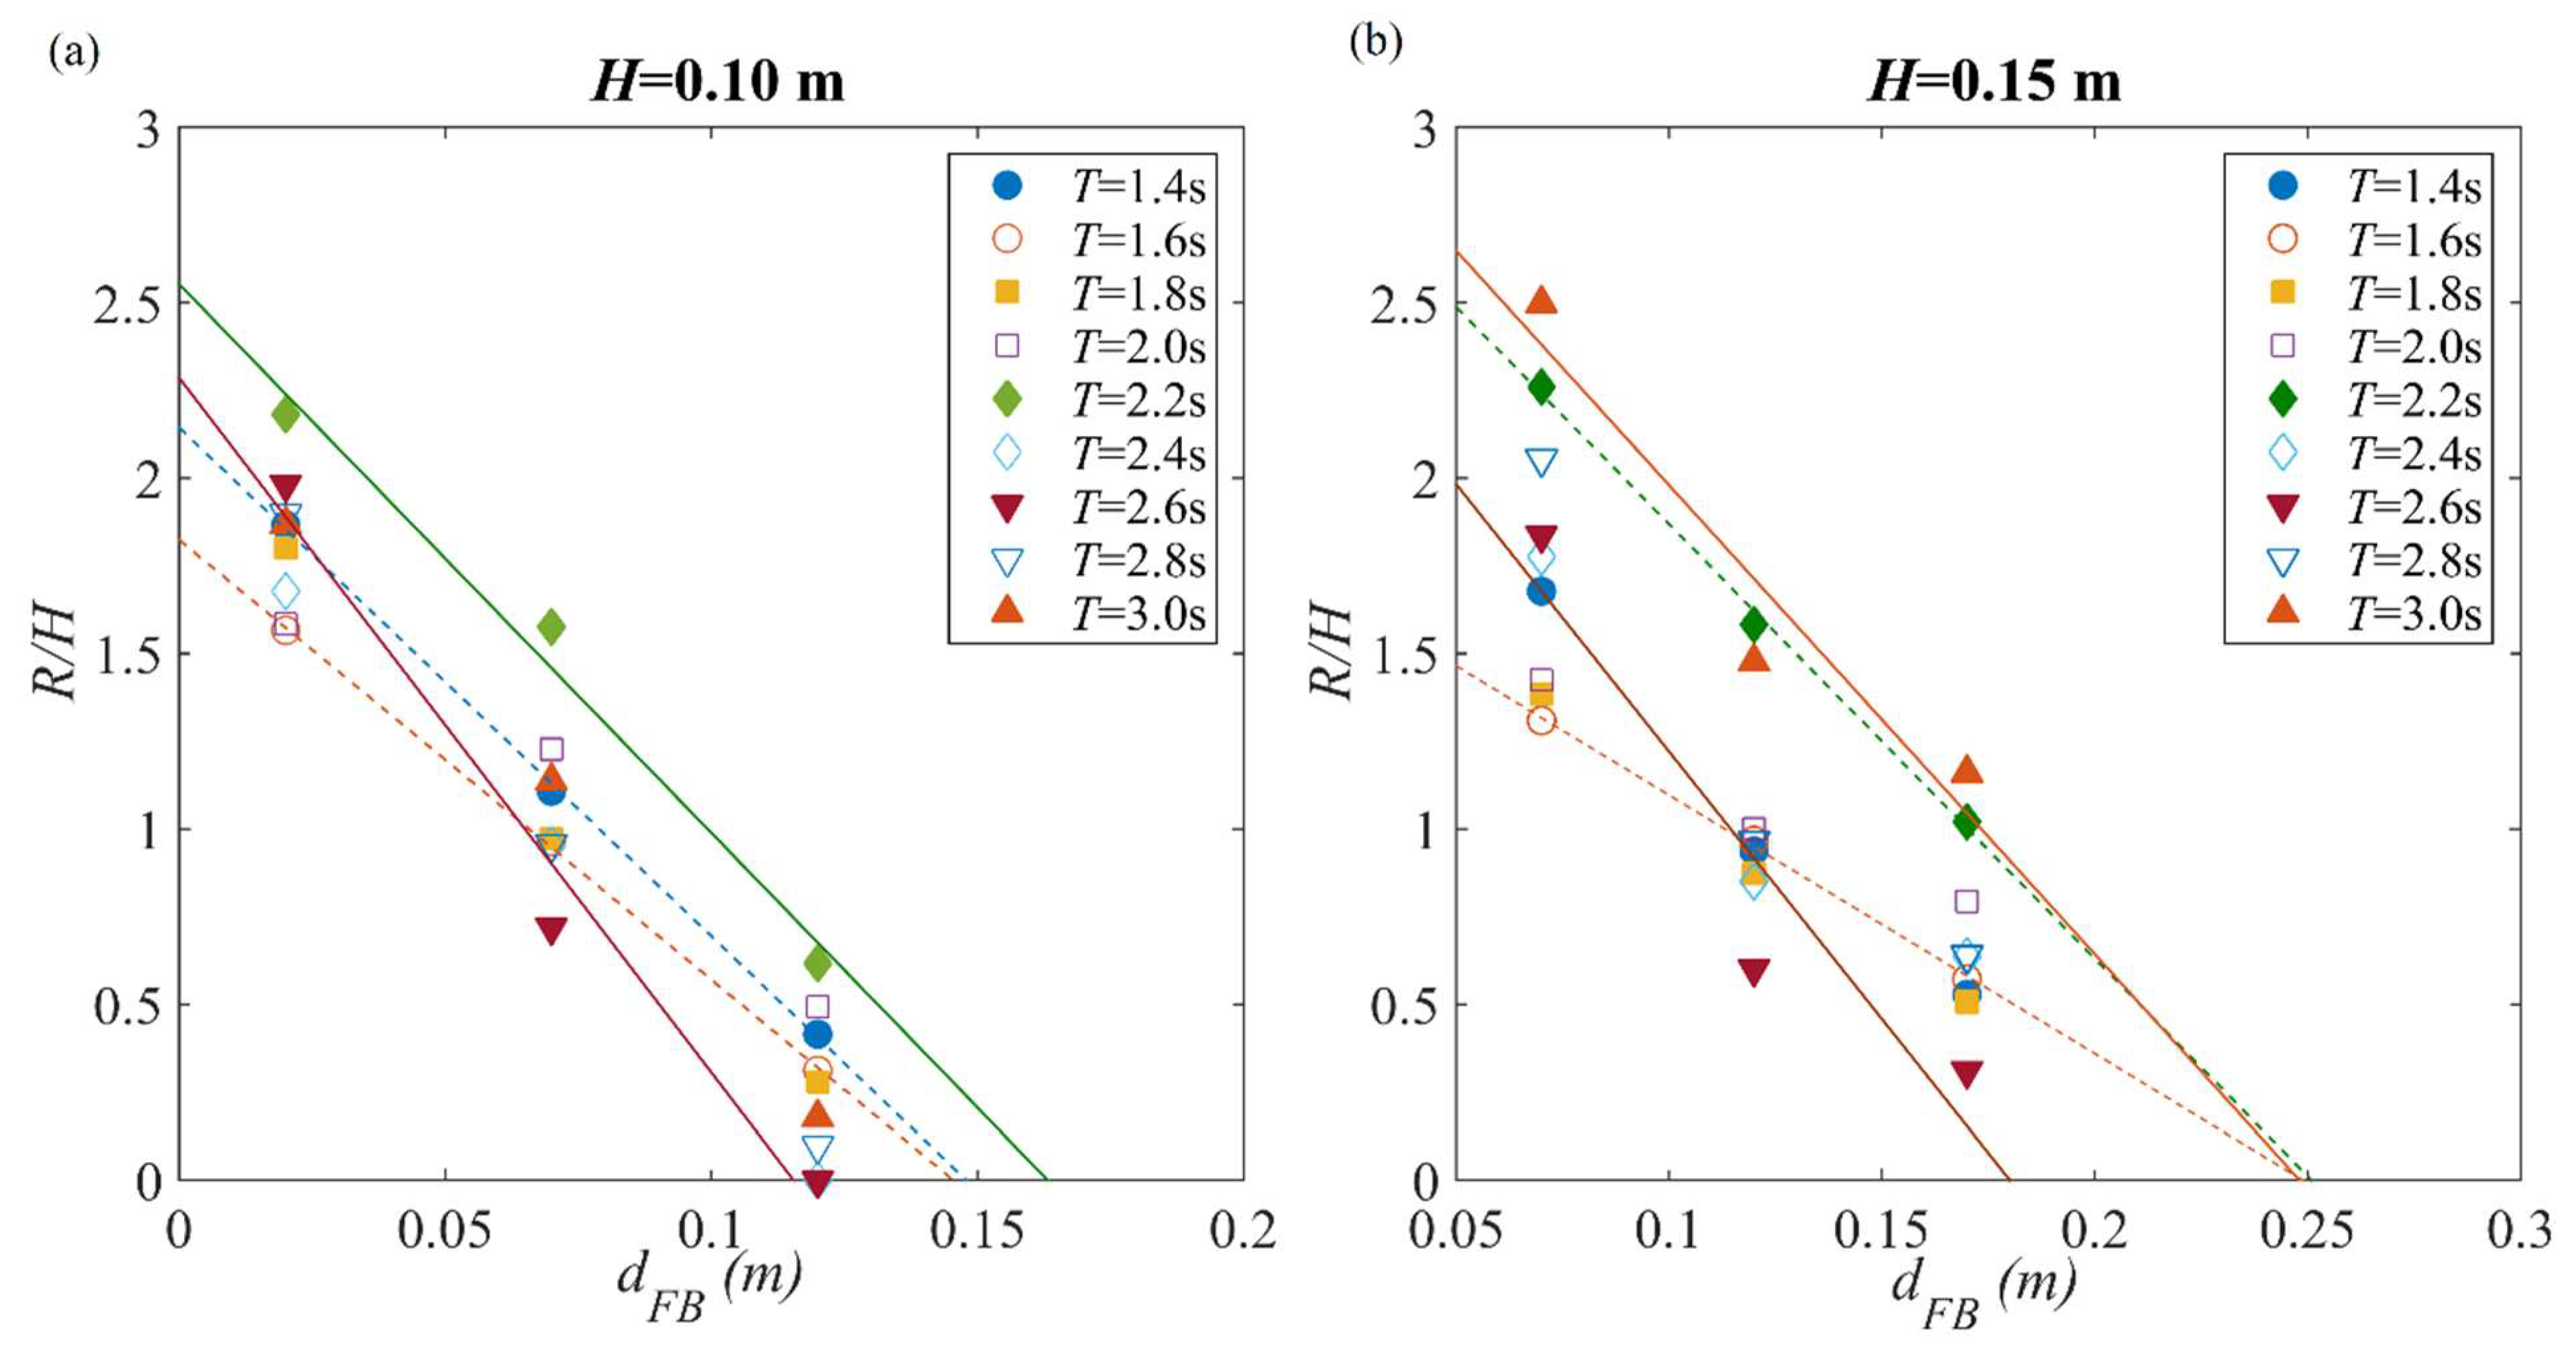
The effective application of Equation (6) then requires an empirical formula of Δ R . To further investigate the dependency of wave run-up on freeboard dFB and wave height H, Figure 11 plots the relationship between wave run-up RAO (the wave run-up length normalized by the incident wave height) R/H and the dFB at fixed wave heights H = 0.10 m and H = 0.15 m. The results show that R and Δ R are sensitive to wave height H and wave period T. For any given T, R/H decreases approximately linearly with the increase of dFB. Based on the experimental data obtained herein, a linear relationship is proposed to fit the data (R/H, dFB) for each combination of H and T:
R H = B 0 + B 1 ( T ) d FB
It is noticed that the frequency dependent slope of each data group, B1, can be calculated by either experimental or numerical approach. The intersection of the linear fitting function and X-axis is the largest freeboard height that allows wave run-up to take place. It can be numerically obtained by calculating the maximum wave run-up on the vertical wall of an assumed structure with the same hull but with a very large freeboard. The intersection with Y-axis is R0, the wave run-up height without freeboard. Both scenarios can be simply numerically simulated, and the linear fitting functions in Figure 11 can be determined by these two intersection points without model test data. Consequently, it is possible to apply Equations (6) and (7) when the experimental data is not sufficient to derive the empirical parameters. It should be noted that the proposed linear relationship does not necessarily hold for all wave periods and wave heights, and alternative calibrated equation can be proposed if more experimental data is collected that shows a nonlinear relationship between wave run-up RAO and freeboard height.
In view of Equations (6) and (7), it is proposed that the normalized wave run-up height with non-zero freeboard is related to the Iribarren number by a second-order polynomial, i.e.,
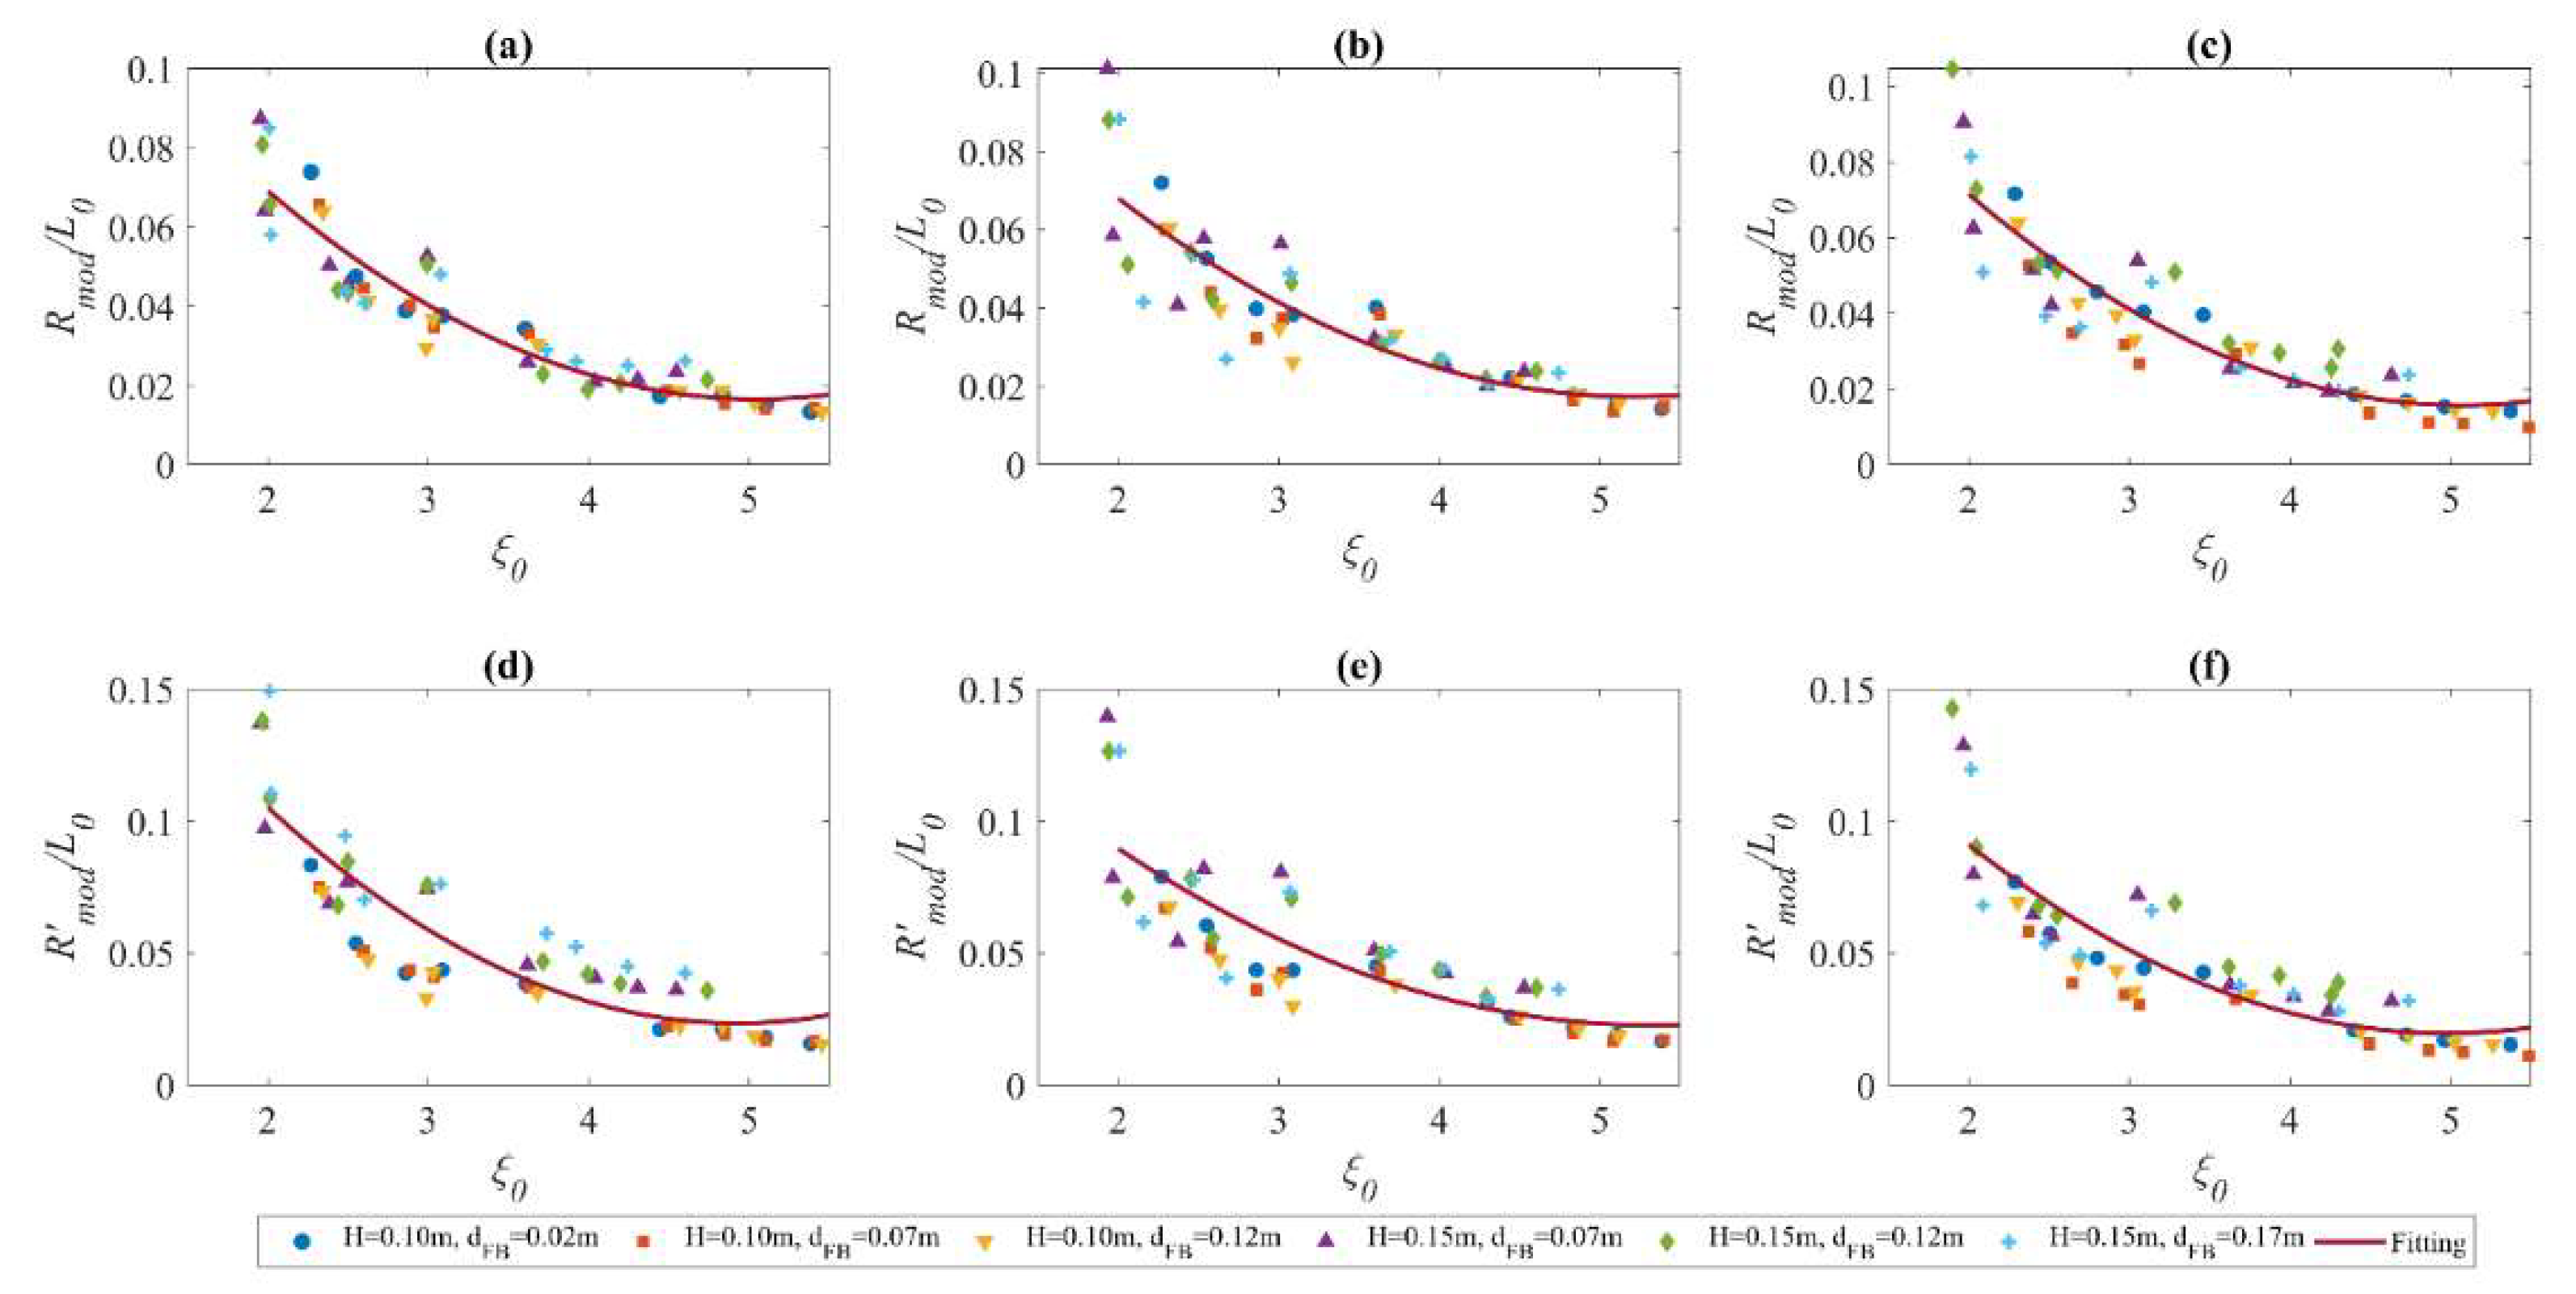
R mod L 0 = R 0 + d F B B 1 ( T ) H L 0 = C 0 + C 1 ξ 0 + C 2 ξ 0 2
By multiplying both sides of the equation with L0/H, Equation (8) shows that the wave run-up RAO R/H is related to the fourth order of the Iribarren number. The equation is kept in the above form so that a lower order polynomial can be fitted and plotted for ease of view. Referring to [19,20], a nonlinear relationship between R/H and the Iribarren number usually shows up when the sloping deck is steep and the resultant ξ 0 is relatively large, which is the case of this study.
As shown in Figure 10, the influence of the freeboard can be neglected if its height is smaller when compared with the incident wave height. In the present model test, a freeboard of up to 0.02 m and 0.07 m may be neglected under incident wave heights of 0.10 m and 0.15 m, respectively. These freeboard heights can be used as a reference value, so that freeboards lower than these aforementioned values may be neglected. Otherwise, the run-up length has to be modified with a freeboard correction term calculated with a relative freeboard height with respect to these reference freeboard heights instead of absolute freeboard heights. Equation (8) may also be written as:
R mod L 0 = R 0 + Δ d F B B 1 ( T ) H L 0 = C 0 + C 1 ξ 0 + C 2 ξ 0 2
where Δ d F B is the freeboard increment as compared to negligible freeboard height. By applying Equations (8) and (9), the scattered data with various freeboards, wave heights and wave periods in Figure 10 has been summarized and fitted into a single function as in Figure 12. Figure 12a–f show the fitted results with the compensation term calculated by both relative and absolute freeboard heights, and all regression parameters and R-square values are summarized in Table 4. While tube settings should theoretically have some influence on wave run-up as it changes the upstream wave elevation close to the breakwater front wall, it is not observed in present experimental data. Instead, Figure 12 shows that similar regression curves may be obtained for all tube settings, but the data is more scattered with the presence of tubes. Further test data will be needed to establish a clear relationship between tube settings and wave run-up.

6.2. Analysis of Random Wave Test Results

The analysis in Section 6.1 shows that the influence of the tubes does not qualitatively change the behaviour of the wave run up. As a result, the following analysis of the random wave test data will only focus on test results on the breakwater with no tubes, since data for porous breakwaters can be analysed by using the same approach to yield empirical formulae with similar forms but different parameters. Table 5 shows the 12 out of 22 random wave tests selected from Table 3. In these cases, the significant wave heights are sufficiently higher than freeboard and frequent wave run-ups are observed and recorded. The wave conditions are renumbered in Table 5. The maximum wave run-up reduces with respect to freeboard height under incident wave with Tp = 1.33 s, but it remains constant for tests with Tp = 1.98 s. The maximum wave run-up height is at approximately 0.45 m, which implies that at most 70% of the deck area is under wave impact during extreme storms. No wave overtopping was discovered in the tested wave conditions.
The wave run-up records are compared with the measured wave elevation at the proximity of the breakwater wall (wave gauge WG1 in Figure 3a). Without the freeboard, it is considered that all the wave peaks occurred at the toe of the slope will eventually travel up to the slope and induce a wave run-up peak. With a freeboard, however, the smaller wave peaks will be blocked by the vertical freeboard. As a result, the number of measured wave run-up peaks Nr, defined as the local maxima between two zero-upcrossing points, is always lower than the number of wave crests Nw measured near the front wall of the breakwater. With an increased freeboard height, fewer wave run-up peaks are measured in the same time range. A wave run-up probability Prun-up is thus defined by Nr/Nw. For example, 204 wave run-up peaks and 274 wave crests are recorded in Test No. 1, which is interpreted as a 74% of wave run-up probability. The wave force induced by the wave run-up and resulting greenwater impact on the sloping deck will be considered as an accidental loading in the breakwater structure design.
As discussed in Section 6.1, the wave run-up only occurs when the wave height near the front wall exceeds the freeboard. Taking the wave height amplification near the structure into consideration, the following approximate relationship is proposed to estimate the probability of wave run-up occurrence:
P ( run-up ) = N r N w P ( H 0 > d F B C a )
where Ca is an amplification factor related to wave amplification near the structure, and H0 is the incident wave height from far field. As the incident wave height following a JONSWAP spectrum is Rayleigh distributed, the probability of exceedance can be analytically calculated, and no measurement is required. While wave elevation amplification near the breakwater wall is known to be strongly frequency-dependent, a constant amplification factor is used in Equation (10) for simplification. For this study, a constant Ca = 1.4 for all wave periods is selected. Figure 13 plots the estimated wave run-up probability P(H0 > 0.7 dFB) and recorded run-up probability P(run-up). The results show that the selected empirical Ca yields a conservative estimation of wave run-up probability.
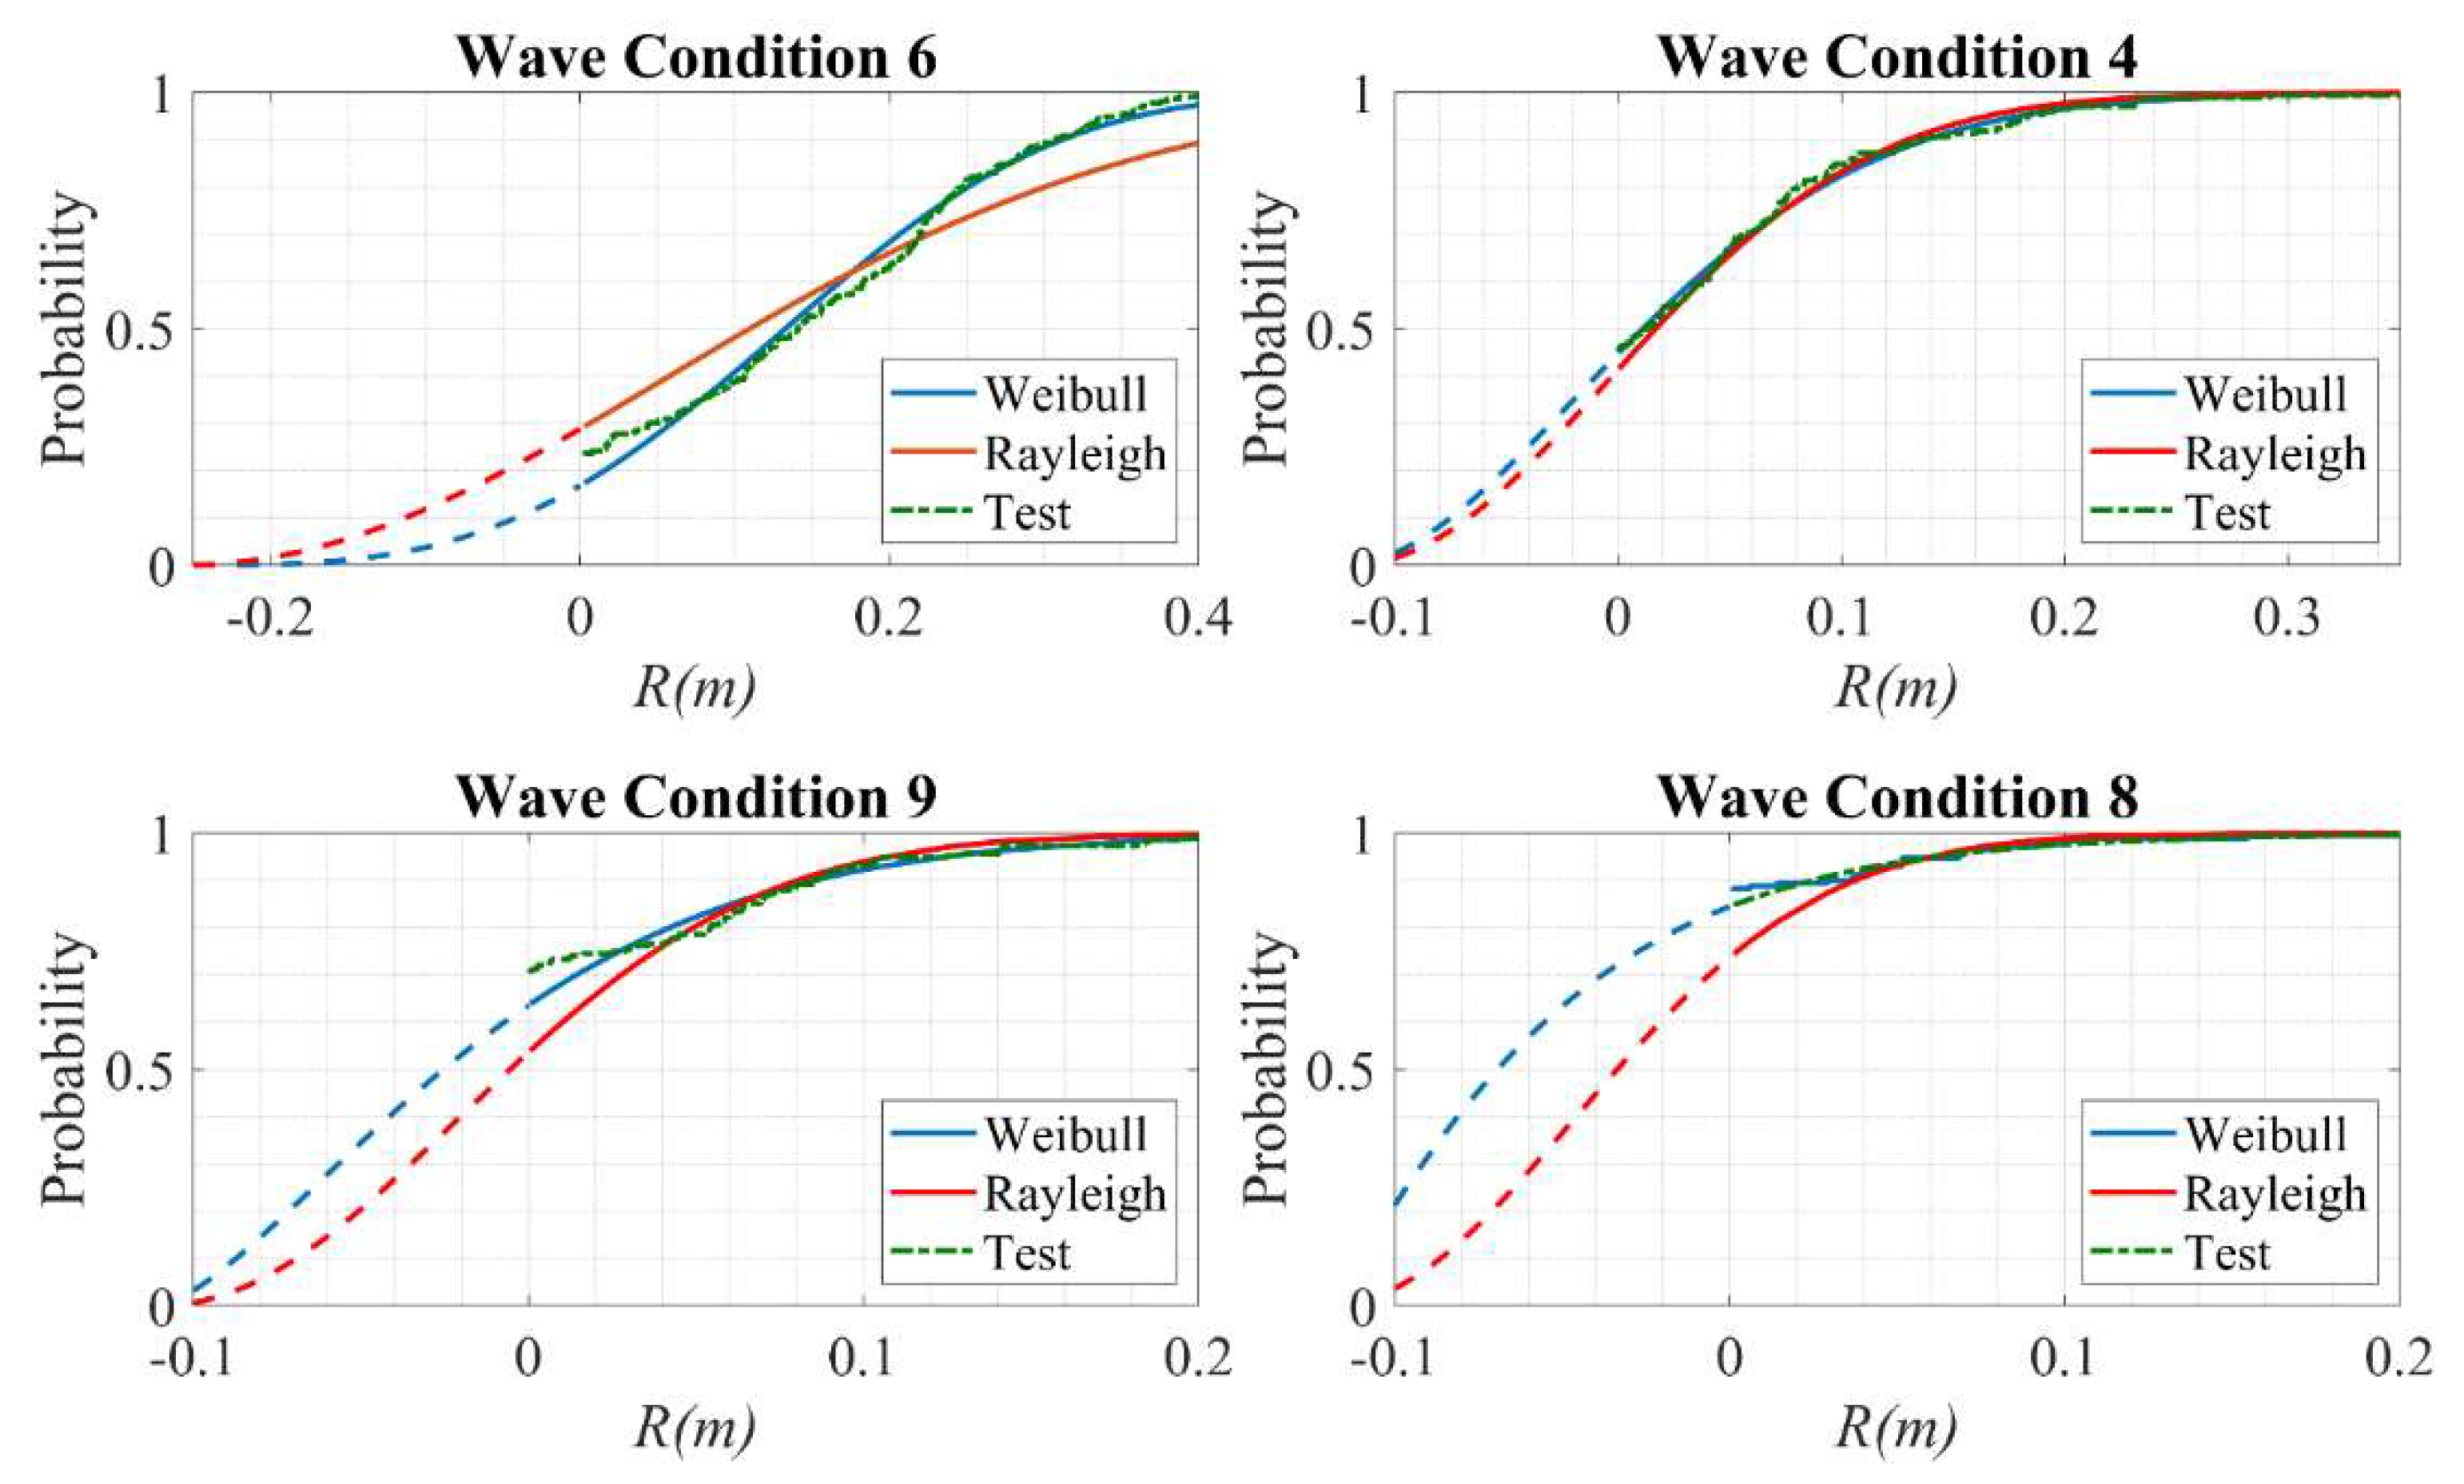
Equation (10) describes the probability of a non-zero wave run-up under a certain sea state. The probability distribution of the non-zero peak wave run-up length is discussed next. Attempts to fit the wave run-up peaks into a Rayleigh distribution and a Weibull distribution are made. Like the studies of regular wave test data in Section 6.1, we introduce the reduced wave run-up length Δ R to the empirical formulae to account for the freeboard effect. The resultant probability distribution function (PDF) or cumulative distribution function (CDF) consequently shift to the left-hand side and cover an area of negative X-axis. Physically, the negative part of the curve means that the wave run-up remains in the height of the vertical front wall and does not reach the bottom of the sloping deck. Since the zero reference of wave run-up in this study is at the bottom of the deck, the run-up is considered ‘negative’. As a result, the peak value distribution should be written in the form of CDFs shifted to the left:
F ( R , Δ R , σ ) = 1 e ( R + Δ R ) 2 2 σ 2   ( Rayleigh )
F ( R , Δ R , a , b ) = 1 e ( R + Δ R ) a b   ( Weibull )
where ∆ R , a and b are the regression parameters to be decided.
As the wave run-up probability can be calculated from experimental data, Δ R can be determined by:
1 F ( 0 , Δ R , a , b ) = P ( run-up )
where P ( run-up ) is given by Equation (10).
The peak value distribution of four wave conditions selected from Table 5 is presented in the form of CDFs in Figure 14. Other results are not shown to avoid repetition. The selected wave conditions represent various levels of wave run-up occurrence at 75%, 55%, 30% and 10%, respectively, and the plots are arranged according to wave run-up occurrence in a descending order. The negative wave run-up lengths R correspond to waves that do not reach the deck and are plotted in dashed lines to show that they are not physical wave run-up data. The results indicate that a two-parameter Weibull distribution is suitable to describe the random peak value distribution of wave run-up. Once the PDF or CDF are calculated, it is simple to obtain the probability of exceedance at any exceedance level.
Finally, we explore the application of modified empirical formula of beach wave run-up to estimate the run-up extremes under random wave conditions. In previous literature, the 2% exceedance level of wave run-up height z 2 % is found empirically to be proportional to Iribarren number, with one example of proposed formula as given in [8]:
z 2 % H s = C p ξ p
in which Hs is the significant wave height and ξ p the Iribarren number calculated with shallow water assumption and peak wave period. Similarly, a segmented linear model was proposed by Van Gent [10]. This model is expressed as
z 2 % H s = c 0 ξ ,     ξ p
z 2 % H s = c 1 c 2 ξ ,     ξ p
p = 0.5 c 1 c 0
c 2 = 0.25 c 1 2 c 0
where c0, c1, c2 are all empirical parameters. Alternative forms of linear equations calculated with root mean square wave height Hrms instead of Hs and/or mean zero-crossing period Tz instead of Tp have also been proposed before. With a determined probability distribution function, the above statistical parameters are linearly related, and the difference induced by the applied statistical parameters would only change the regression coefficients. As a result, similar linear regression equations in the aforementioned references are not listed here. Further, nonlinear regression models trying to relate z2% and ξ p is also proposed. For example, in [16], the model is described by
z 2 % H s = a ξ p b
as a power function with empirical parameters a and b, or [19]:
z n % H m 0 = C 0 + C 1 H m 0 g T p 2 + C 2 ( H m 0 g T p 2 ) 2
as a second-order polynomial with respect to H/L0, where L0 is the shallow water wave length. Consequently, the above second order equation is equivalent to a fourth order relationship with Iribarren number. In the foregoing equations, the wave run-up height is defined as the vertical distance from the mean water level to the highest point of run-up. Referring to [8], the applicable range of Equation (14) is restricted to mild slopes with ξ p < 2 . The experimental data in this study is mostly above the high limit, with ξ p inside a range of [1.9, 3.0].
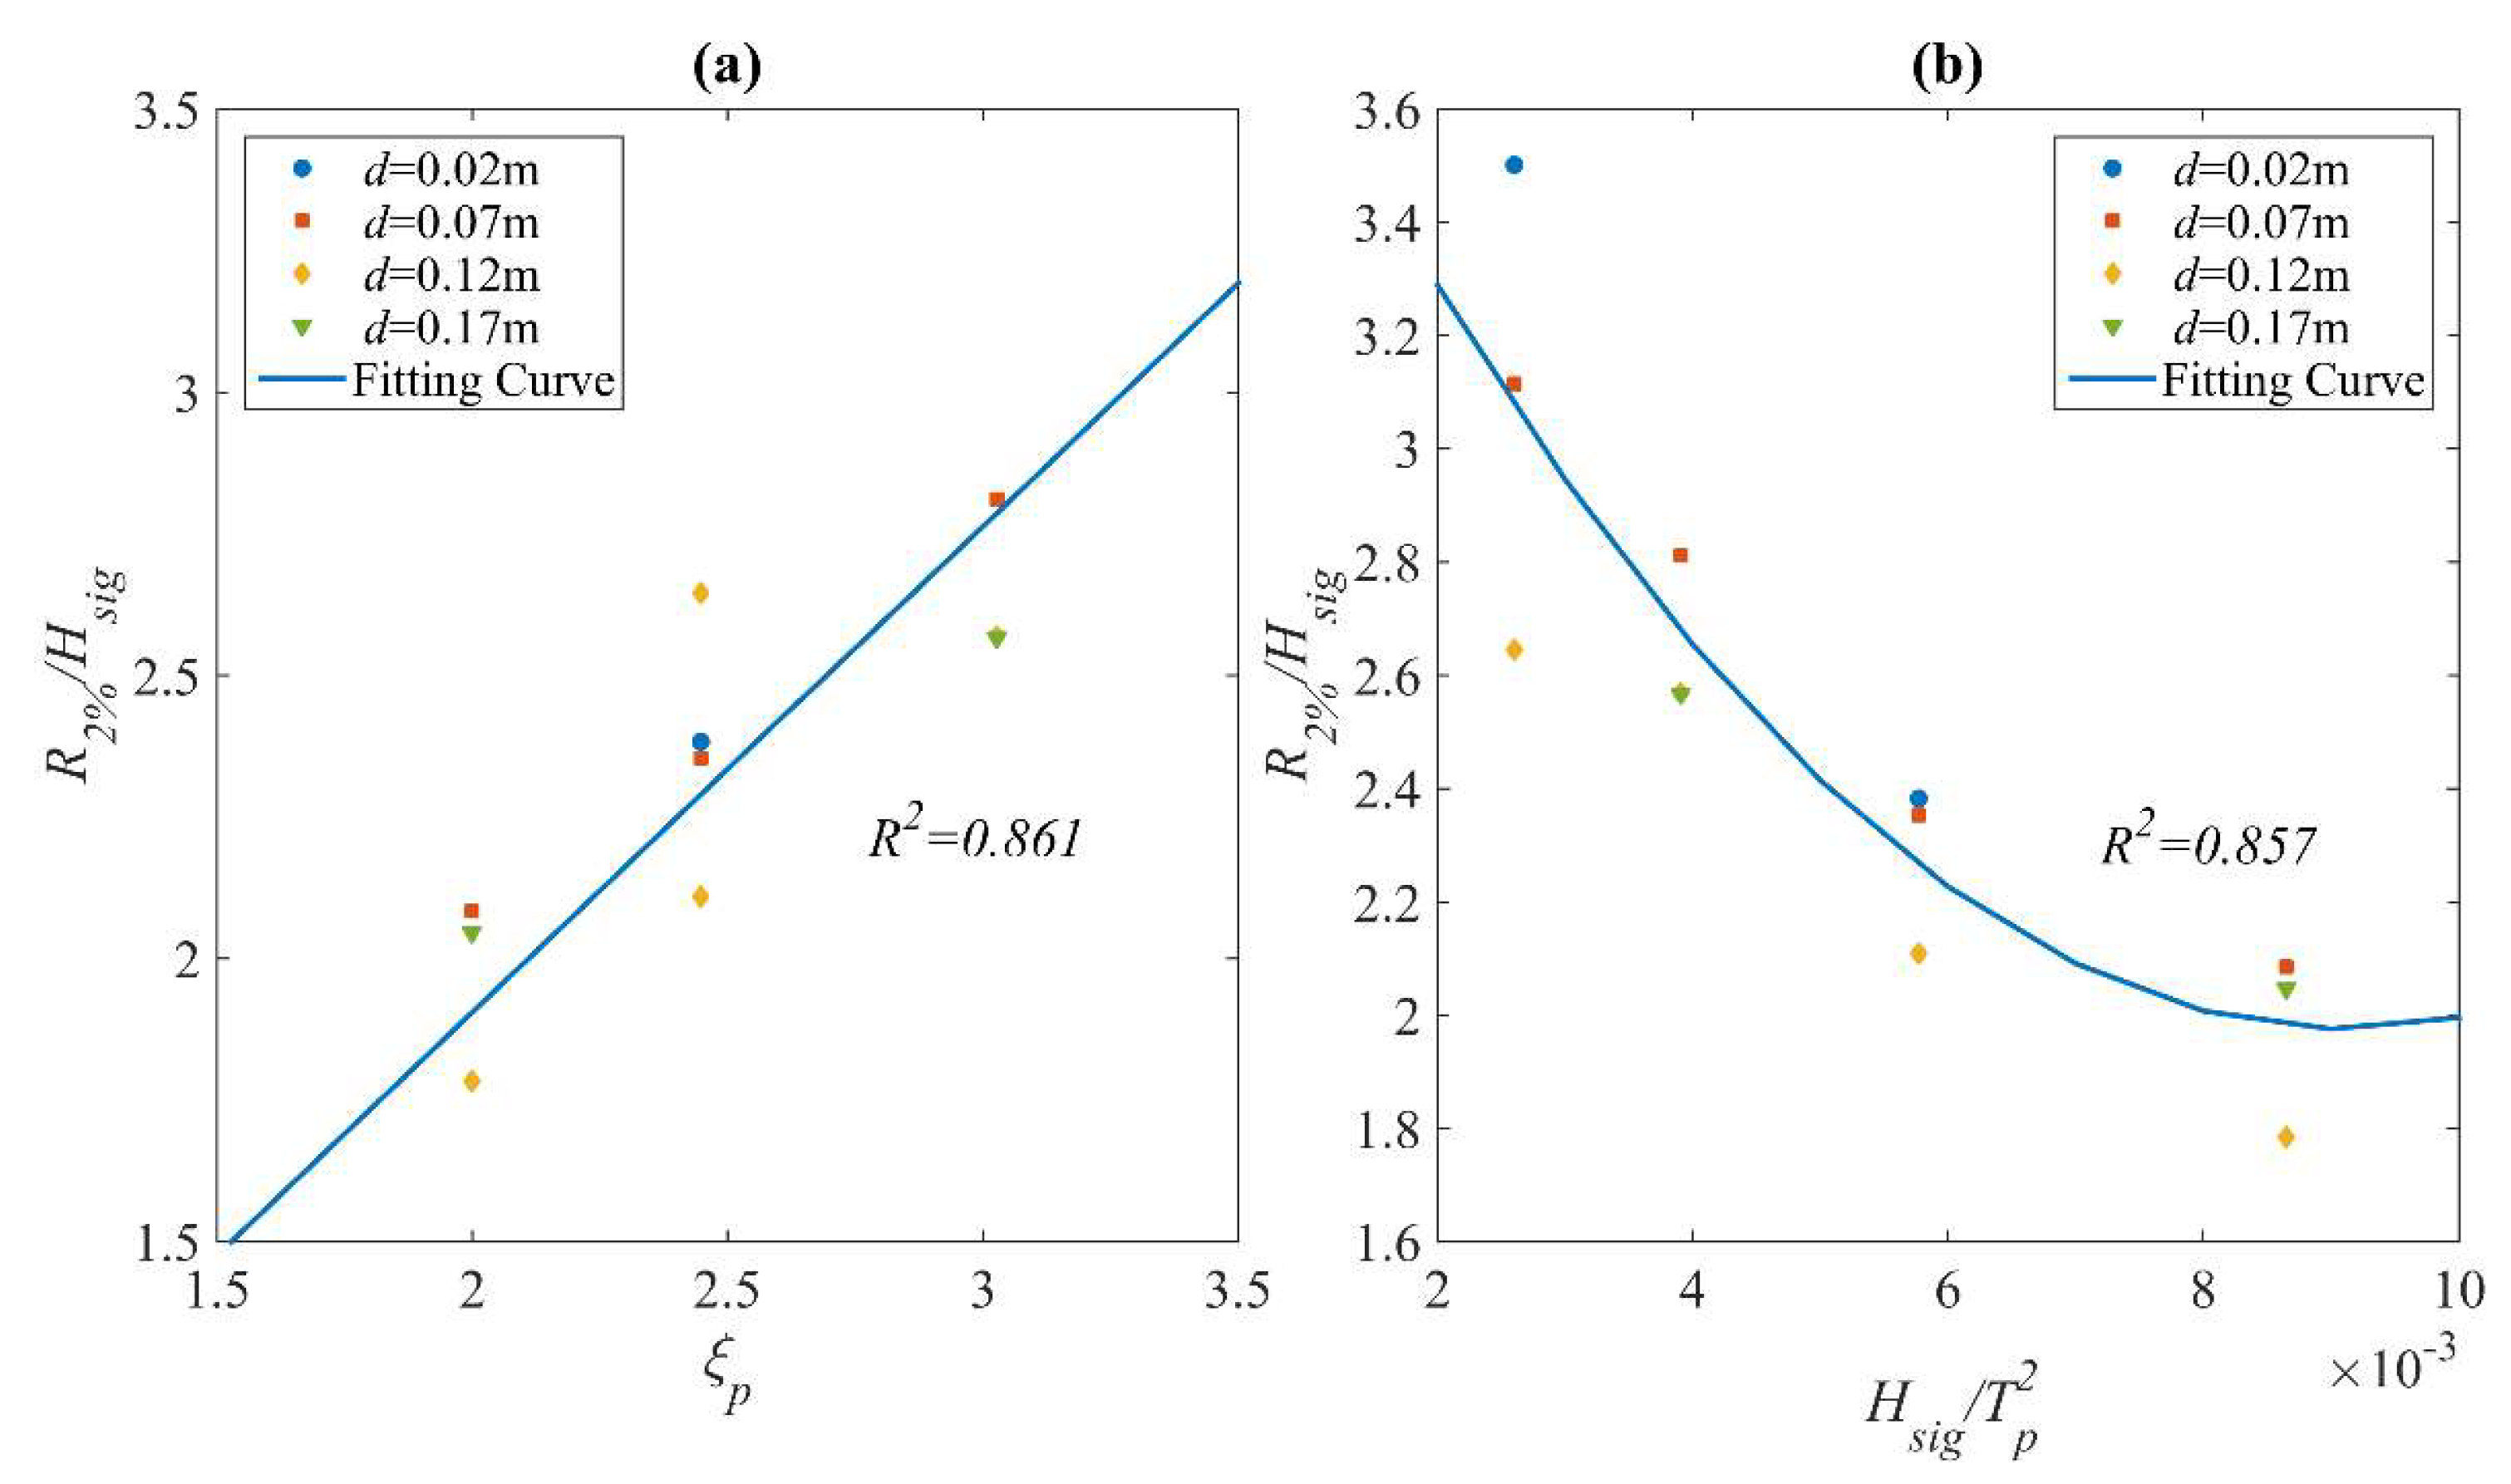
Like in Section 6.1, a correction term is added to the originally measured wave run-up distance. The extreme waver run-up length R 2 % is calculated not by the number of run-ups Nr, but by the number of waves Nw near the structure. Among the four abovementioned empirical formula, Equations (14) and (20) are found to be the most suitable for the obtained experimental data. The modified formula is given by:
R 2 % + k ¯ ( H s ) Δ d H s H s = C 0 ξ p + C 1
R 2 % + k ¯ ( H s ) Δ d H s H s = C 0 + C 1 H s g T p 2 + C 2 ( H s g T p 2 ) 2
in which R 2 % is the wave run-up length calculated with the total number of waves, and k ¯ is the average of all frequency-dependent slopes in Figure 11a,b, ξ p is the Iribarren number calculated using Tp. The results of regression analysis by using the formulae given in Equations (21) and (22) are presented in Figure 15. In Equation (21), the Iribarren number can be calculated with either the deep water wavelength or intermediate water wavelength, and both result in a fit with similar quality, but with slightly different regression coefficients.

7. Conclusions

Experimental studies have been carried out for a newly designed breakwater-windbreak structure for two main purposes: (1) to evaluate the performance of the breakwater, with a focus on investigating the effect of internal tubes (L-shaped or straight); and (2) to study the wave run-up behaviour on a sloping deck with a non-zero freeboard. A series of empirical formulae was proposed to calculate wave run-up length based on existing studies and findings of the current experimental data. With these empirical equations, it is possible to estimate the wave run-up in any given regular and random sea states for the designed structure.
The following conclusions may be drawn from this study:
(1)
The breakwater is proved to provide a calm sea state for the operations of protected coastal and offshore structures in the sheltered area. The random wave test results show an average wave transmission coefficient of about 0.5, which means only one fourth of the wave energy is transferred to the downstream side. In addition, the tubes installed inside the breakwater hull can reduce the wave reflection at the upstream side; thereby creating a less rough sea at the front of the breakwater. From higher wave dissipation coefficients obtained, it can be concluded that the mechanism of internal water tubes is mainly that of a viscous effect, and no obvious side effects (e.g., increasing wave height in the downstream) have been observed. In addition, the L-shaped tubes are more efficient in reducing wave reflection.
(2)
It is found that both the regular and random wave run-up data can be treated in traditional empirical methods, on the condition that the reduced wave run-up on the deck due to positive freeboard heights is considered. After adding the correction term, several empirical equations in existing literature estimating the wave run-up on smooth slopes or beaches have been found applicable. The corrected terms are found to be sensitive to wave heights and periods, and the relationship among these parameters can be established by using either experimental data or numerical simulation.
(3)
Under random wave condition, it is found that the possibility of a non-zero wave run-up on the deck is related to the incoming wave exceeding a certain freeboard limit. This is consistent with the behaviour of wave run-up under regular wave condition, which suggests that the wave run-up could be forecasted by accurately predicting the wave elevation near the breakwater. After taking the imaginary negative wave run-ups into consideration, the peak value distribution of the wave run-up data follows the Weibull distribution. Its extreme value follows the empirical equations proposed by Van der Meer [8] and Ahrens [19] and can be estimated accordingly. Once the possibility of occurrence, probability distribution and extreme value are all known, stochastic analysis with any target function can be performed and an optimized freeboard can be decided.
From the experimental observations, highly nonlinear wave surface elevation has been observed. Considering the large cost of time and computation resources required for CFD studies, empirical methods as proposed herein based on experimental data would be more applicable in similar problems, as a primary estimation of wave run-up length. This paper also provides a general approach of considering the effect of freeboard on wave run-up behaviour, which can be used for the analysis of other coastal and offshore structures and is not limited to the specific breakwater structure in this paper.

Author Contributions

M.H.: Visualisation, Software, Methodology, Formal Analysis, Writing—Original Draft; C.M.W.: Conceptualisation, Methodology, Supervision, Funding Acquisition, Writing—Review and Editing. All authors have read and agreed to the published version of the manuscript.

Funding

The authors acknowledge the financial support of the Blue Economy Cooperative Research Centre, established and supported under the Australian Government’s Cooperative Research Centres Program, grant number CRC-20180101.

Institutional Review Board Statement

Not applicable.

Informed Consent Statement

Not applicable.

Data Availability Statement

Data in this paper is available upon request.

Conflicts of Interest

The authors declare no conflict of interest.

References

  1. Dai, J.; Wang, C.M.; Utsunomiya, T.; Duan, W. Review of recent research and developments on floating breakwaters. Ocean Eng. 2018, 158, 132–151. [Google Scholar] [CrossRef]
  2. Gao, J.; Ma, X.; Dong, G.; Chen, H.; Liu, Q.; Zang, J. Investigation on the effects of Bragg reflection on harbor oscillations. Coast. Eng. 2021, 170, 103977. [Google Scholar] [CrossRef]
  3. Guo, Y.C.; Mohapatra, S.C.; Soares, C.G. Review of developments in porous membranes and net-type structures for breakwaters and fish cages. Ocean Eng. 2020, 200, 107027. [Google Scholar] [CrossRef]
  4. Wang, C.M.; Han, M.; Lyu, J.; Duan, W.; Jung, K. Floating forest: A novel breakwater-windbreak structure against wind and wave hazards. Front. Struct. Civ. Eng. 2021, 15, 1111–1127. [Google Scholar] [CrossRef]
  5. Hunt, I.A. Design of seawalls and breakwaters. J. Waterw. Harb. Div. 1959, 85, 123–152. [Google Scholar] [CrossRef]
  6. Battjes, J.A. Surf similarity. In Proceedings of the 14th International Coastal Engineering Conference, Copenhagen, Denmark, 24–28 June 1974; Volume 1, pp. 466–480. [Google Scholar]
  7. Wassing, F. Model investigation on wave run-up carried out in the Netherlands during the past twenty years. In Proceedings of the 6th International Coastal Engineering Conference, Gainesville, FL, USA, 29 January 1957; American Society of Civil Engineers: Reston, VI, USA, 1957; pp. 700–714. [Google Scholar]
  8. De Waal, J.P.; van der Meer, J.W. Wave runup and overtopping on coastal structures. In Proceedings of the 23rd International Coastal Engineering Conference, Venice, Italy, 29 January 1990; American Society of Civil Engineers: Reston, VI, USA, 1992; Volume 2, pp. 1758–1771. [Google Scholar]
  9. van der Meer, J.W.; Stam, C.-J.M. Wave runup on smooth and rock slopes of coastal structures. J. Waterw. Port Coast. Ocean Eng. 1992, 118, 534–550. [Google Scholar] [CrossRef]
  10. Holman, R.A. Extreme value statistics for wave run-up on a natural beach. Coast. Eng. 1986, 9, 527–544. [Google Scholar] [CrossRef]
  11. van Gent, M.R. Wave runup on dikes with shallow foreshores. J. Waterw. Port Coast. Ocean Eng. 2001, 127, 254–262. [Google Scholar] [CrossRef]
  12. Atkinson, A.L.; Power, H.E.; Moura, T.; Hammond, T.; Callaghan, D.P.; Baldock, T.E. Assessment of runup predictions by empirical models on non-truncated beaches on the south-east Australian coast. Coast. Eng. 2017, 119, 15–31. [Google Scholar] [CrossRef] [Green Version]
  13. van der Meer, J.W.; Janssen, J. Wave run-up and wave overtopping at dikes and Revetments, Delft Hydraulics, publication no. 485. In VdM VML EB MT2; Delft Hydraulics: Delft, The Netherlands, 1994. [Google Scholar]
  14. Lander, V.; van der Meer, J.W.; Troch, P. Probability distribution of individual wave overtopping volumes for smooth impermeable steep slopes with low crest freeboards. Coast. Eng. 2012, 64, 87–101. [Google Scholar]
  15. van der Meer, J.W. Wave run-up and wave overtopping at dikes. In Wave Forces on Inclined and Vertical Structures; Kobayashi, N., Demirbilek, Z., Eds.; ASCE: New York, NY, USA, 1995. [Google Scholar]
  16. Franco, L.; De Gerloni, M.; van der Meer, J.W. Wave overtopping on vertical and composite breakwaters. In Proceedings Coastal Engineering; ASCE: New York, NY, USA, 1994; pp. 1030–1045. [Google Scholar]
  17. Mase, H.; Iwagaki, Y. Run-up of random waves on gentle slopes. In Proceedings of the 19th Conference on Coastal Engineering, Houston, TX, USA, 29 January 1984; American Society of Civil Engineers: Reston, VI, USA, 1984; pp. 593–609. [Google Scholar]
  18. Naess, A.; Stansberg, C.T.; Gaidai, O.; Baarholm, R.J. Statistics of extreme events in airgap measurements. J. Offshore Mech. Arct. Eng. 2009, 131, 041107. [Google Scholar] [CrossRef]
  19. Sweetman, B. Practical airgap prediction for offshore structures. J. Offshore Mech. Arct. Eng. 2004, 126, 147–155. [Google Scholar] [CrossRef] [Green Version]
  20. Ahrens, J.P. Irregular Wave Runup on Smooth Slopes; Q CETA No. 81-17; U.S. Army Corps of Engineers, Coastal Engineering Research Centre: Ft. Belvoir, VA, USA, 1981. [Google Scholar]
  21. Hughes, S.A.; Nadal, N.C. Laboratory study of combined wave overtopping and storm surge overflow of a levee. Coast. Eng. 2009, 56, 244–259. [Google Scholar] [CrossRef]
  22. Lander, V.; Troch, P. Wave overtopping at smooth impermeable steep slopes with low crest freeboards. J. Waterw. Port Coast. Ocean Eng. 2012, 138, 372–385. [Google Scholar]
  23. Kofoed, J.P.; Burcharth, H.F. Estimation of overtopping rates on slopes in wave power devices and other low crested structures. In Coastal Engineering 2002: Solving Coastal Conundrums; World Scientific: Singapore, 2003; pp. 2191–2202. [Google Scholar]
  24. Park, H.; Cox, D.T. Empirical wave run-up formula for wave, storm surge and berm width. Coast. Eng. 2016, 115, 67–78. [Google Scholar] [CrossRef] [Green Version]
  25. Han, M.M.; Wang, C.M. Modelling wide perforated breakwater with horizontal slits using Hybrid-BEM method. Ocean Eng. 2021, 222, 108630. [Google Scholar] [CrossRef]
  26. Han, M.M.; Wang, C.M. Coupled analytical-numerical approach for determining hydrodynamic responses of breakwater with multiple OWCs. Mar. Struct. 2021, 80, 103097. [Google Scholar] [CrossRef]
  27. Lyu, J.; Mason, M.S.; Wang, C.M. Predicting far-lee wind flow characteristics behind a 2D wedge-shaped obstacle: Experiments, numerical simulations and empirical equations. Build. Environ. 2021, 194, 107673. [Google Scholar] [CrossRef]
  28. Goda, Y.; Suzuki, Y. Estimation of incident and reflected waves in random wave experiments. Coast. Eng. 1976, 15, 828–845. [Google Scholar] [CrossRef] [Green Version]
  29. Mansard, E.P.D.; Funke, E.R. The measurement of incident and reflected spectra using a least squares method. In Proceedings of the 17th Conference on Coastal Engineering, Sydney, Australia, 29 January 1980; ASCE: New York, NY, USA, 1980; Volume 1, pp. 154–172. [Google Scholar]
  30. Gu, Z.; Wang, H. Gravity waves over porous bottoms. Coast. Eng. 1991, 15, 497–524. [Google Scholar] [CrossRef]
  31. Han, M.M.; Wang, C.M. Hydrodynamics study on rectangular porous breakwater with horizontal internal water channels. J. Ocean Eng. Mar. Energy 2020, 6, 377–398. [Google Scholar] [CrossRef]
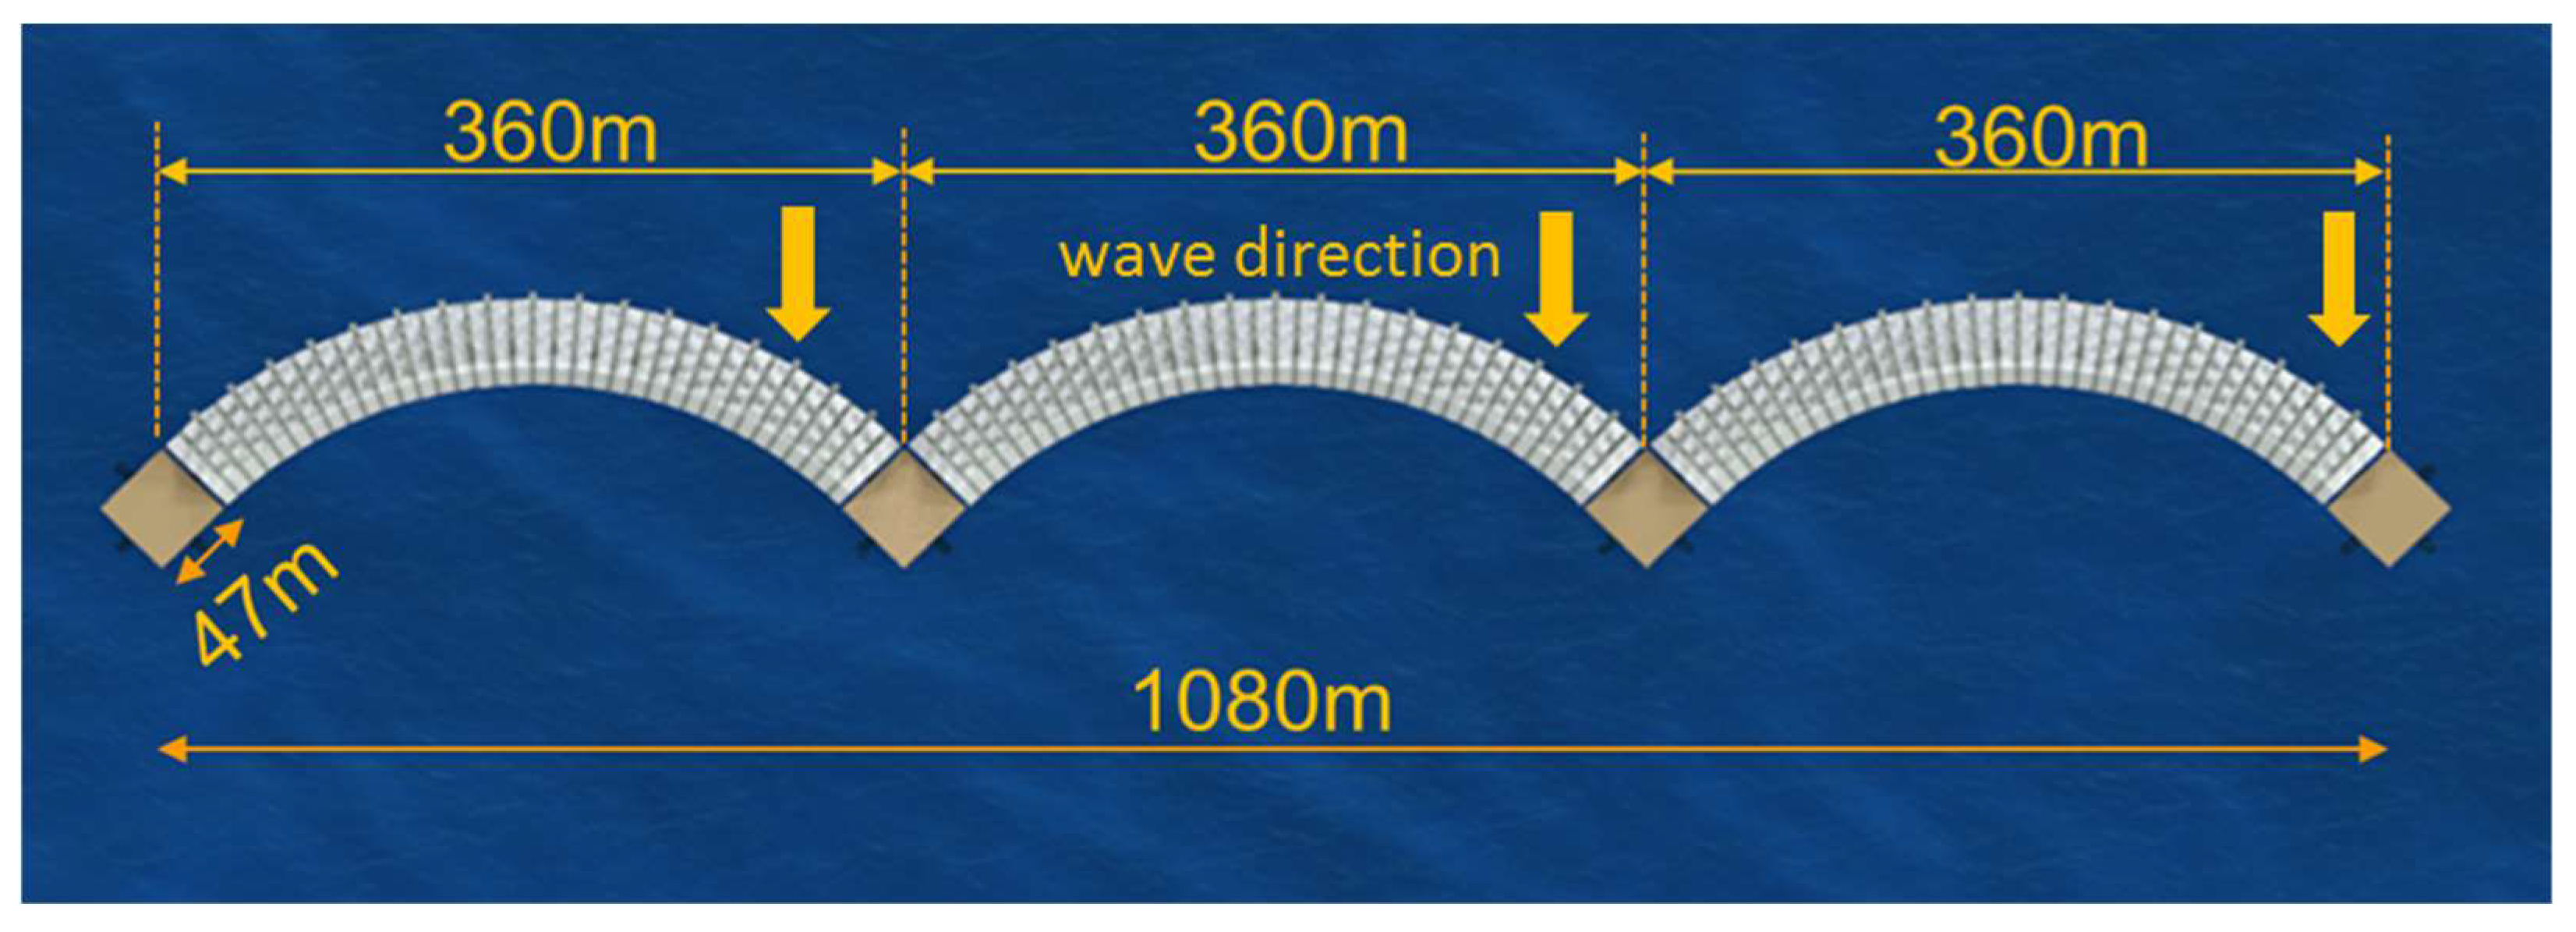
Figure 1. Conceptual design of modular floating concrete breakwater-windbreak (wave direction marked by arrows).
Jmse 10 01896 g001
Figure 2. Sectional view of breakwater structure showing two types of internal tube designs (C.T.C. stands for centre-to-centre).
Jmse 10 01896 g002
Figure 3. Model test details, (a) Model test setup [26], reprinted with permission from [25], 2022, Elsevier, License No.5401640097608; (b) Breakwater main dimensions.
Jmse 10 01896 g003
Figure 4. Test model fixed from motion by frames and iron bars as viewed from the back.
Jmse 10 01896 g004
Figure 5. Example of processing wave run-up data in regular waves, (a) comparison of FFT results and regression results; (b) high frequency noise and reduced peak in FFT.
Jmse 10 01896 g005
Figure 6. Reflection coefficients for various drafts (a) d = 0.42 m; (b) d = 0.37 m; (c) d = 0.32 m; (d) d = 0.27 m for a given wave height H = 0.06 m.
Jmse 10 01896 g006
Figure 7. Transmission coefficients for various drafts (a) d = 0.42 m; (b) d = 0.37 m; (c) d = 0.32 m; (d) d = 0.27 m for a given wave height H = 0.06 m.
Jmse 10 01896 g007
Figure 8. Dissipation coefficients for various drafts (a) d = 0.42 m; (b) d = 0.37 m; (c) d = 0.32 m; (d) d = 0.27 m for a given wave height H = 0.06 m.
Jmse 10 01896 g008
Figure 9. (a) Average reflection coefficients and (b) average transmission coefficients of all tested random sea states.
Jmse 10 01896 g009
Figure 10. Relationship between wave lengths normalized run-up and Iribarren number for different tube designs, (freeboard heights are in cm in the legends).
Jmse 10 01896 g010
Figure 11. Linearized relationship between freeboard height dFB and wave run-up RAO R/H, linear fitting curves shown with corresponding colour of the data, (a) H=0.10m; (b) H=0.15m.
Jmse 10 01896 g011
Figure 12. Relationship between modified normalized run-up and Iribarren number, using curve fit with Equation (8): (a) Blocked tubes; (b) Straight tubes; (c) Curved tubes and with Equation (9): (d) Blocked tubes; (e) Straight tubes; (f) Curved tubes.
Jmse 10 01896 g012
Figure 13. Comparison between possibility of wave run-up occurrence and possibility of incoming wave height exceedance in each tested wave conditions.
Jmse 10 01896 g013
Figure 14. Representing peak value distribution of wave run-up with shifted Rayleigh and Weibull distribution, compared with test data.
Jmse 10 01896 g014
Figure 15. (a) Linear (Equation (21)) and (b) nonlinear (Equation (22)) regression models of extreme wave run-up.
Jmse 10 01896 g015
Table 1. Model geometry and dimensions, reprinted with permission from [25], 2022, Elsevier, License No.5401650993570.
ParameterQuantity
Length (Lb)0.9 m
Width (B)0.9 m
Model Depth (D)0.44 m
Draft (d)0.27–0.42 m
Freeboard height (dFB)0.17–0.02 m
Mass (without Tubes)67.91 kg
Deck tilting angle α25 deg
Deck height0.3 m
Tube diameter0.05 m
Table 2. Model Test Parameters.
Model Test Parameters
Regular Wave TestsWave height H = 0.06 m, 0.10 m, 0.15 m
Wave period T = 0.6 s to 3.0 s
Draft d = 0.42 m, 0.37 m, 0.32 m, 0.27 m
Random Wave TestsSignificant wave height Hs = 0.06 m, 0.10 m, 0.15 m
Peak wave period Tp = 1.33 s, 1.98 s
Internal Tube SetupNo tubes, straight tubes and curved tubes
Table 3. Random wave conditions in Figure 9.
Wave Condition No.Tp (s)dFB (m)Hs(m)
11.330.020.06
20.10
30.070.06
40.10
50.15
60.120.06
70.10
80.15
90.170.06
100.10
110.15
121.980.020.06
130.10
140.070.06
150.10
160.15
170.120.06
180.10
190.15
200.170.06
210.10
220.15
Table 4. Regression Coefficients of Curve Fitting in Figure 12.
Fitted Curve No.C0C1C2R-Square
a0.0056−0.05700.16060.88
b0.0049−0.05100.15050.77
c0.0059−0.05990.16770.82
d0.0095−0.09400.25510.77
e0.0061−0.06460.19450.69
f0.0080−0.08010.21920.75
Table 5. Parameters of selected tested random wave conditions.
Wave Condition No.D
(m)
Hs
(m)
Tp
(s)
Rmax
(m)
10.020.101.330.320
20.020.101.980.447
30.070.101.330.209
40.070.101.980.369
50.070.151.330.413
60.070.151.980.445
70.120.101.330.118
80.120.101.980.222
90.120.151.330.217
100.120.151.980.421
110.170.151.330.177
120.170.151.980.405
Publisher’s Note: MDPI stays neutral with regard to jurisdictional claims in published maps and institutional affiliations.