Article

Regional Differences and Dynamic Changes in Sea Use Efficiency in China

1
Business School, Ningbo University, Ningbo 315211, China
2
Marine Economic Research Center, Donghai Academy, Ningbo University, Ningbo 315211, China
*
Author to whom correspondence should be addressed.
J. Mar. Sci. Eng. 2022, 10(12), 1848; https://doi.org/10.3390/jmse10121848
Submission received: 7 November 2022 / Revised: 25 November 2022 / Accepted: 28 November 2022 / Published: 1 December 2022
(This article belongs to the Special Issue Integrated Coastal Zone Management II)

Abstract

:
This study aims to identify the overall level of China’s sea use efficiency (SUE) from 2006 to 2018 as well as regional differences and dynamic changes The super-efficiency weighted slacks-based measure (Super-WSBM) model and the global Malmquist–Luenberger (GML) index are employed. Results indicate that the SUE is at a medium-efficiency level. The inspection period revealed a decline period (2006–2008), a steady increase period (2008–2013), and a rapid increase period (2013–2018), exhibiting a “checkmark” type of growth. SUE has significant regional differences, and the degree of polarization has increased. Shanghai, Guangdong, and Shandong are high-efficiency regions, but unlike Shandong, which has experienced a rapid growth, the SUE of Shanghai and Guangdong has declined to varying degree, in Shanghai being particularly significant; Jiangsu and Tianjin are medium-efficiency regions, and SUE has experienced a rapid growth; Fujian, Hebei, and Zhejiang are inferior-efficiency regions, and SUE has slightly increased; Liaoning, Hainan, and Guangxi are low-efficiency regions. Except for a slight decline in Hainan, Liaoning and Guangxi experienced small increases. Thus, a sea use policy must be formulated on the basis of local conditions to promote the coordinated development of the marine economy. Moreover, the negative external impact of sea use on the marine environment must be observed, and marine resources within the range of the sea must be utilized.

1. Introduction

The blue ocean along the coastline of China is a prized possession. As a major maritime country, China has a mainland coastline of 18,000 km and a sea area of nearly 3 million km2, and is rich in marine resources. For a long time after the founding of New China in 1949, the lack of order, limits, and royalties on using sea areas caused significant damage to marine resources [1,2]. In 1993, the Ministry of Finance and the State Oceanic Administration promulgated and implemented the Interim Provisions on the Administration of Sea Areas Use to explore a system of paid sea use. In 2002, the Law on the Administration of Sea Areas was officially implemented. A chapter on royalties for sea use was established, which explicitly states that “any entity or individual that uses a sea area shall pay royalties for the use according to the rates as provided by the State Council”. Thereafter, paid sea use has entered a new stage with laws to follow [3]. With the establishment and improvement of the paid use system, China’s sea use scale continues to expand. In 2017, national sea use royalties totaled CNY 6.485 billion, an increase of nearly 54 times compared with 2002. The orderly exploitation of the sea has also further promoted the development of the marine economy. In 2019, the marine GDP reached over CNY 8.9 trillion, accounting for 9.0% of the nation’s total. Moreover, in coastal regions, the proportion of gross marine product (GMP) to the total GDP reached 17.1%.
Paid sea use is vital to the promotion of China’s strategy of being “a strong maritime country”. Intuitively, the sea grants abundant marine resources and thus is the most fundamental material resource for marine economy development. The development of marine industries, whether referring to the primary ones (represented by marine fishery) or the tertiary industry (represented by coastal tourism), depends highly on the exploitation and utilization of the seas [4,5,6]. However, seas are public goods with non-excludability and rivalry and are likely to cause the “tragedy of the commons” during resource exploitation. From the environmental economics perspective, the “tragedy of the commons” in sea use is essentially an external problem rooted in the ambiguity of marine property rights [7]. The paid use system of the sea aims to solve this problem by adjusting the property rights system in a market-oriented way to realize the optimal allocation and proper utilization of marine resources [8,9]. Thus, the paid use system plays a vital role in promoting the sustainable development of the marine economy and the protection of the marine environment. In addition, clarifying the ownership and use rights of the sea will improve the attention of the government and the public, and enhance the protection of maritime rights and interests.
Once the use rights of the sea have been clarified, the key to promoting sustainable development of the marine economy lies in how to improve the sea use efficiency (SUE). Western economists believe that, theoretically, the study of SUE is based on the property of public resources and public goods. They explore ways and approaches to optimize the management and allocation of such public resources mainly on the basis of theories of the tragedy of the commons, anti-tragedy of the commons, externality theory, and property rights theory [10,11]. In terms of SUE, foreign scholars mostly discussed the efficiency of a certain marine industry with research results focusing on marine fishery and transportation. For example, Tingley (2005) comprehensively used the data envelopment analysis (DEA) and stochastic frontier approach (SFA) to measure the efficiency of marine fishery production in the English Channel and further analyzed the factors affecting technical efficiency by using the Tobit model [12]. Idda (2009) used the DEA estimated fishing capacity, technical efficiency, scale efficiency, and capacity utilization in a particular small-scale fishery in the Mediterranean, and argued that overcapacity is a problem that generally affects small-scale fisheries [13]. Jamnia (2015) applied the SFA to analyze the technical efficiency of fisheries in the Chabahar region of southern Iran [14]. Kamble (2010) employed the DEA to quantitatively measure the transport efficiency of 12 major seaports in India and found that 6 seaports reached an effective state [15]. Cullinane et al. (2006) used DEA and SFA to evaluate the production efficiency of the top 30 container ports in the world and unveiled that the production efficiency of the port is closely related to the port scale and privatization rate [16]. Fancello (2021) applies DEA to 35 Mediterranean container ports in order to identify the potential key success factors on which to intervene to improve their competitiveness potential and response to new market needs [17].
Since the implementation of the paid use system of the sea, China’s scholars have discussed the existing problems in the implementation of the system and have put forward corresponding solutions and suggestions. For example, by using the centralization index of the Lorentz curve, the information entropy model, and rescaled range analysis (R/S) method, Lei et al. (2017) quantitatively evaluated the spatiotemporal differences in the scale and structure of paid use of the sea in China from 2002 to 2015 and predicted the dynamic trend. On the basis of the research conclusion, they put forward the corresponding suggestions on sea management policy [18]. Cai et al. (2012) reviewed the implementation of China’s sea area’s paid use system through data on the management of sea use. They studied the modes and supporting measures of the paid transfer of sea areas as well as the charging of royalties for the use of the sea and proposed that future development should start by refining the standard of sea use royalty and building a market-oriented transfer mechanism of sea areas [19]. In terms of the quantitative evaluation of SUE, most of the existing research takes a specific sea area as an example and calculates the corresponding index by constructing an index system and confirming the weight. For instance, Ke et al. (2018) used the comprehensive index method to evaluate the sea use intensity of the Liaoning coastal economic zone. The results revealed that the overall use intensity of the sea was low, while showing an upward trend, and there existed regional heterogeneity [20]. Ma et al. (2012) evaluated the current situation of sea use in Dalian through the analytic hierarchy process (AHP). On the basis of the score of the evaluation, each area was divided into three types: areas to improve intensive conservation and comprehensive benefits, key development areas, and areas for protection and careful development [21]. Although this research contributes to the quantitative evaluation of SUE, there remains subjective judgments in the calculation process of quantitative evaluation methods, including the comprehensive index method and AHP. In the selection of research objects, a lack of systematic consideration of SUE at the national level persists. Zhang et al. (2018) conducted an empirical investigation on the paid use system of sea areas on the basis of the relevant data from 2002 to 2017. Although they described the current situation, it failed to make objective judgments on the SUE [22].
Given the shortcomings of existing studies, this paper systematically examines the regional differences and dynamic changes in China’s SUE from 2006 to 2018 under the framework of total factor analysis by applying the super-efficiency weighted slacks-based measure (super-WSBM) model and the global Malmquist–Luenberger (GML) index. This paper makes the following marginal contributions. First, in the selection of research samples, this paper takes 11 provinces (cities) along the coast of China as the research object to systematically investigate the regional differences and dynamic changes in SUE in China. Second, in the application of the research method, this paper employs the super-WSBM model that deals with undesirable outputs as the method to measure efficiency. It takes into account not only the “bad” output, such as inorganic nitrogen and reactive phosphate, produced during the use of the sea, but also the pollution degree of these “bad” outputs. Third, in the selection of research data, this paper obtains the average concentration of the two major pollutants (inorganic nitrogen and reactive phosphate) in coastal waters from the Bulletin on Environmental Quality of Offshore Waters in China and takes them as undesirable outputs. Compared to the existing research that uses the discharge of pollutants from industrial wastewater or waste gas in coastal areas as undesirable outputs, the data used in this paper are more specific, thus making the calculation results more accurate and objective.

2. Materials and Methods

2.1. Super-WSBM Model

The Super-WSBM model, which considers undesirable outputs, is used to measure the static efficiency values of sea use. This model was developed from the traditional DEA, which can only evaluate efficiency values from a single input-oriented or output-oriented perspective and cannot consider input reductions and output increases simultaneously. As remedy, Tone (2001) proposed a slacks-based measure (SBM) method for evaluating decision-making units (DMUs), namely, the SBM model [23]. However, when multiple DMUs are on the frontier of DEA simultaneously (that is, the efficiency values are the same as 1), the SBM model cannot further compare the efficiency values. Thus, Tone (2002) proposed the super-efficiency SBM (super-SBM) model on the basis of modified slack variables. The super-SBM model can evaluate and rank the effective units of the SBM model and further distinguish the efficiency differences between the decision-making units that are SBM-efficient [24]. In the actual production process in the sea, along with the increase of marine economic output, undesirable outputs, such as inorganic nitrogen and reactive phosphate, will be produced, and the pollution degree of these undesirable outputs differ. Thus, the undesirable outputs and their weights are introduced into the super-SBM model and the super-WSBM model is constructed. Referring to the research results of Wang et al. (2019) [25], the super-WSBM model used in this paper is defined as follows:
m i n ρ = 1 + 1 m i = 1 m s i / x i k 1 1 r = 1 s 1 w r + + q = 1 s 2 w q b r = 1 s 1 w r + s r + / y r k + q = 1 s 2 w q b s q b / u q k s . t .   x i k j = 1 , j k n x i j λ j s i   y r k j = 1 , j k n y r j λ j + s r +   u q k j = 1 , j k n u q j λ j s q b   λ j , s i , s r + , s q b , w r + , w q b 0
In Formula (1), ρ is the value of SUE to be measured, m is the input of each DMU (referring to the 11 coastal provinces and cities in this paper), s 1 and s 2 are the desirable and undesirable outputs, x, y, and u are, respectively, the elements in the input matrix, desirable output matrix, and undesirable output matrix, and w r + and w q b are the weights of the desirable and undesirable outputs, respectively.

2.2. GML Index

The GML index is used in this paper to evaluate the dynamic change rate of SUE. To be consistent with the super-WSBM model, this paper takes 11 coastal provinces (cities) as DMUs and uses the input x, desirable output y, and undesirable output b of each DMU in period t to construct the production feasible set:
P t x t = y t , b t : x t p r o d u c e y t , b t
Let the global production technology set be:
P G x = P 1 x 1 P 2 x 2 P T x T
With reference to Oh (2010) [26], the GML index can be defined as:
G M L t , t + 1 x t , y t , b t , x t + 1 , y t + 1 , b t + 1 = 1 + D G x t , y t , b t 1 + D G x t + 1 , y t + 1 , b t + 1
In Formula (4), D G x t , y t , b t is the global directional distance function obtained by using the super-WSBM model. When the GML index is greater than 1, it indicates that the SUE is increasing during the examination period, equal to 1, which indicates that it remains unchanged, and less than 1 indicates a decline.

2.3. EC Index and BPC Index

The GML index can be divided into the efficiency change (EC) index reflecting the change in technical efficiency, and the best practice change (BPC) index reflecting technological progress. The EC index reflects the change in technical efficiency in the two periods: when the ratio is greater than 1, it indicates an increase in the technical efficiency; equal to 1 indicates no change, and less than 1 indicates a decline. The BPC index reflects the movement of the frontier of DEA in the two periods, and when the ratio is greater than 1 it indicates the frontier is moving forward and represents technological progress, equal to 1 indicates a constant, and less than 1 indicates the frontier is moving back and represents technological regression. The product of the EC index and BPC index is the GML index, and the two are defined as follows:
E C t , t + 1 x t , y t , b t , x t + 1 , y t + 1 , b t + 1 = 1 + D t x t , y t , b t 1 + D t + 1 x t + 1 , y t + 1 , b t + 1
B P C t , t + 1 x t , y t , b t , x t + 1 , y t + 1 , b t + 1 = 1 + D G x t , y t , b t / 1 + D t x t , y t , b t 1 + D G x t + 1 , y t + 1 , b t + 1 / 1 + D t + 1 x t + 1 , y t + 1 , b t + 1

3. Indicator Selection and Data Sources

The SUE calculated on the basis of the super-WSBM model is, in essence, the input-output ratio, specifically, it aims to reap as much desirable output and few undesirable outputs as possible. In the calculation, input and output indicators are needed. The input indicators measure the sea use factors that produce a certain amount of economic value. Following existing research on natural resource use efficiency, theories of neoclassical economics, and the basic framework of the labor force, capital, and land, this paper constructs the input indicators needed during the calculation process, which can be specified as follows.
First, labor. Consistent with existing research [27,28,29], marine employment is adopted to represent the labor force input during the sea use.
Second, capital. As Gai (2019) believes that marine economic production activities do not directly depend on the investment of the current period but largely on the local fixed capital stock, measuring capital consumption through marine capital stock is preferable [27]. Given that the marine capital stock is not available in official statistics, this paper, after referring to the method adopted by Wu (2014), applies the capital–output ratio to estimate the marine capital stock [30]. The formula is K = Y × K N / Y N , where K, Y, YN, and YN mean the regional marine capital stock, the total output value of marine economy after excluding the influence of price, the whole-region capital stock, and the regional GDP after excluding the influence of price, respectively.
Here, the data on the total output value of the marine economy and the regional GDP come from the China Marine Statistical Yearbook and China Statistical Yearbook, respectively; the whole-region capital stock is calculated through the perpetual inventory method proposed by Zhang (2004) [31], i.e., K i t = 1 δ K i t 1 + I i t , where δ indicates the depreciation rate, at 9.6%, and I i t means the total capital formation adjusted on the basis of the fixed asset investment price index; by referring to the research results of Young (2000), the initial capital stock is obtained after dividing the total fixed capital formation of the base period by 10% [32]; the gross fixed capital formation and the fixed asset investment price index are extracted from the China Statistical Yearbook.
Third, land; that is, sea area. By referring to the research results of Zhang (2018) and Guan (2019), two indicators (namely, the cumulative sea area to which use right is confirmed and the amount of royalties are charged for the sea use) are adopted to comprehensively reflect the input of land factors during the process of the sea use [22,28].
In the process of the sea use, it delivers desirable outputs and undesirable outputs, with the desirable better interpreted as the economic value of the sea, which is represented by GMP in the paper. To remove the effect of inflation, the raw data are processed according to the GDP deflator. On the selection of undesirable output indicators, the existing research mostly takes the emission of pollutants in industrial wastewater or exhaust gas in coastal areas as the undesirable output. This is, however, overly general, without specializing the sea, and possibly leading to the deviation of the final result. Considering the inadequacy of existing studies, by observing the histograms showing the concentrations of major pollutants in the offshore waters in the Bulletin on Environmental Quality of Offshore Waters in China issued by the Ministry of Ecology and Environment in previous years, the paper obtains the average concentration data of two major pollutants (inorganic nitrogen and reactive phosphate) in the offshore waters of coastal regions and takes them as undesirable output indicators. In the weighting of output indicators, first, the desirable output and undesirable output are set to 1:1; then, given that the inorganic nitrogen failed to meet the standard and caused pollution far more than reactive phosphate did in offshore waters in China, the two indicators included in the undesirable output are set to be 2:1. Finally, the three output indicators, of the gross marine product, the average concentration of inorganic nitrogen, and the average concentration of reactive phosphate, are set to be 3:2:1. The types of variables and data sources are shown in Table 1.

4. Result

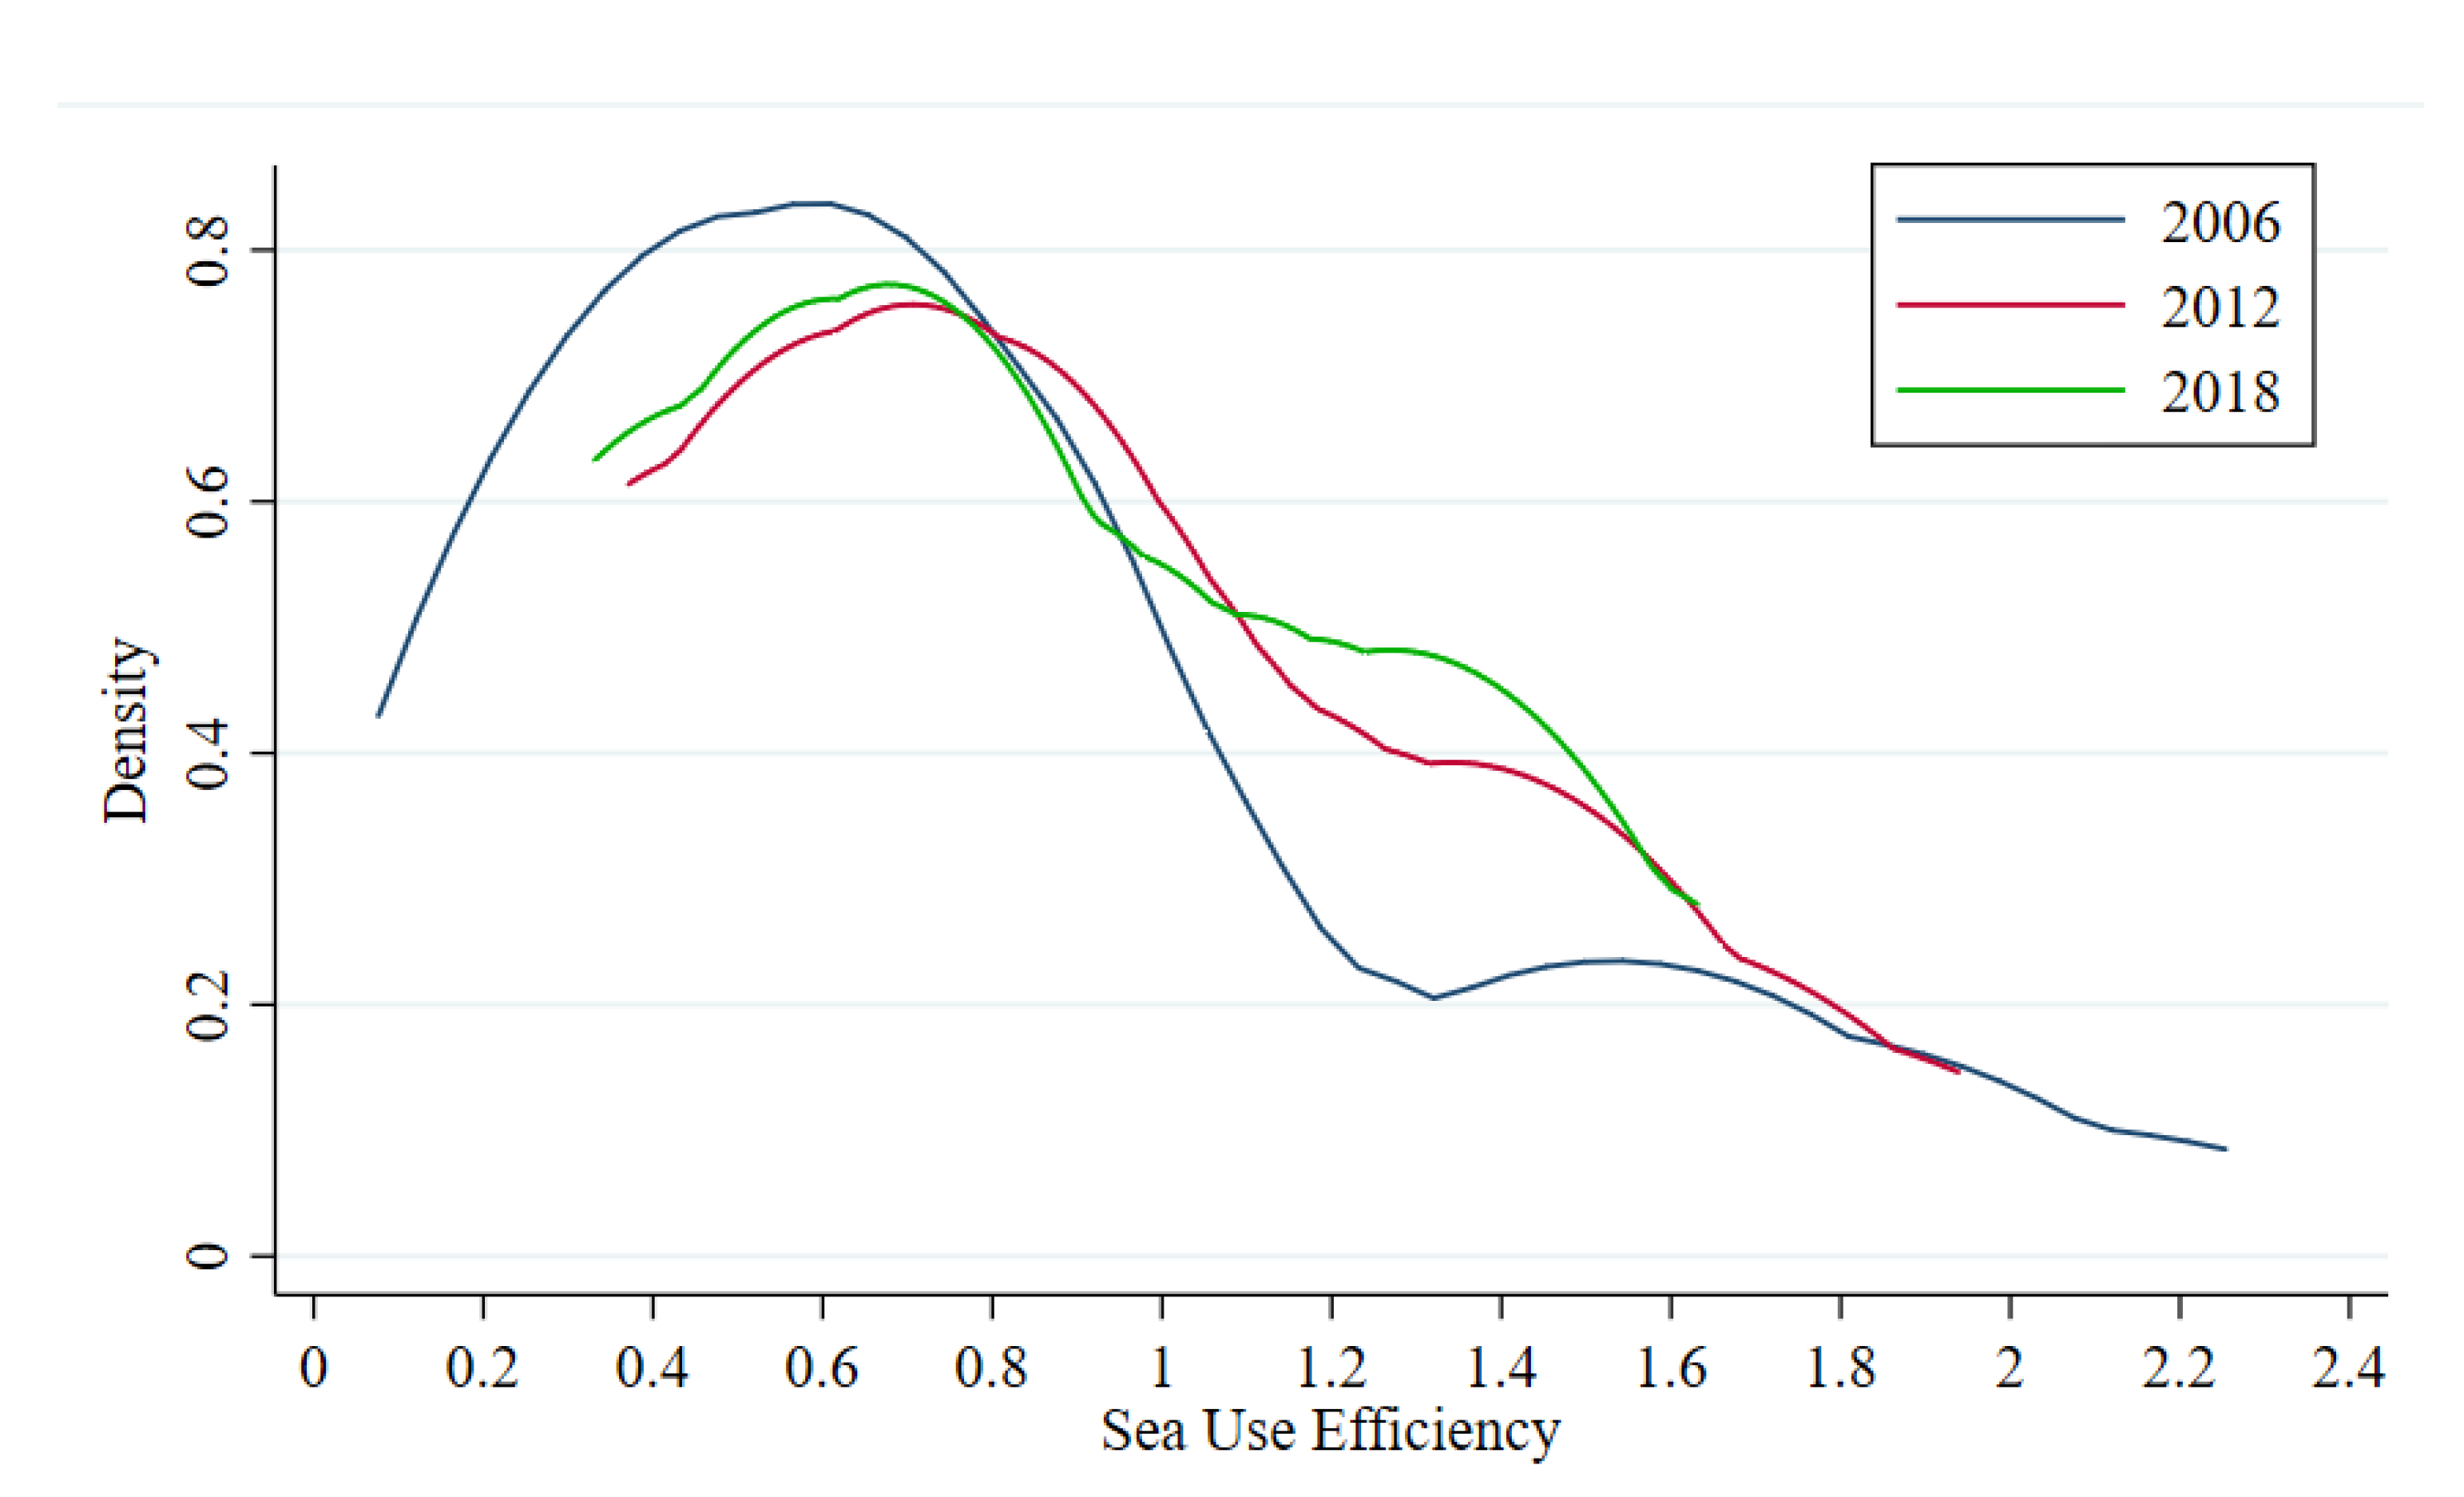
4.1. General Evaluation of SUE

On the basis of the super-WSBM model defined in Formula (1) and data listed in Figure 1, the MaxDEA 8 Ultra was employed to calculate the SUE in the 11 coastal provinces (cities) from 2006 to 2018. To evaluate the overall situation across China, the calculation results of SUE in each region for the three years at the beginning (2006), middle (2012), and end (2018) of the examination period were selected. After analyzing the results through the kernel density estimation, a kernel density distribution map was obtained and is shown in Figure 1. In Figure 1, the x-coordinate represents the SUE values and the y-coordinate shows the corresponding density values. The figure exhibits that:
(1)
In the center of the density function, the center value in 2006 is the lowest, roughly 0.6, and the center values in 2012 and 2018 are not very different, both within the range of 0.7–0.8. The results indicate that, on the one hand, from the overall national level, the SUE is at the medium level, not reaching the high status; on the other hand, there exists a growth trend in the efficiency from low to medium level.
(2)
The peak is highest in 2006, indicating a more concentrated distribution of SUE values in 2006.
(3)
In terms of the number of wave crests, there exist two crests in 2006 and 2018 and one in 2012. Thus, a polarization of SUE transpired in 2006 and 2018. Further observation of the peak values shows that the value of the second peak in 2018 is significantly larger than that in 2006 and the gap between the two peaks is smaller. Therefore, during the examination period, the polarization of SUE has intensified, showing a “club convergence” pattern with L–L and H–H clusters.
(4)
In the tail part, the kernel density distribution maps for all three years show a right-skewed distribution. Thus, more areas are distributed on the right than on the left, signifying that more areas have SUE values greater than the average.

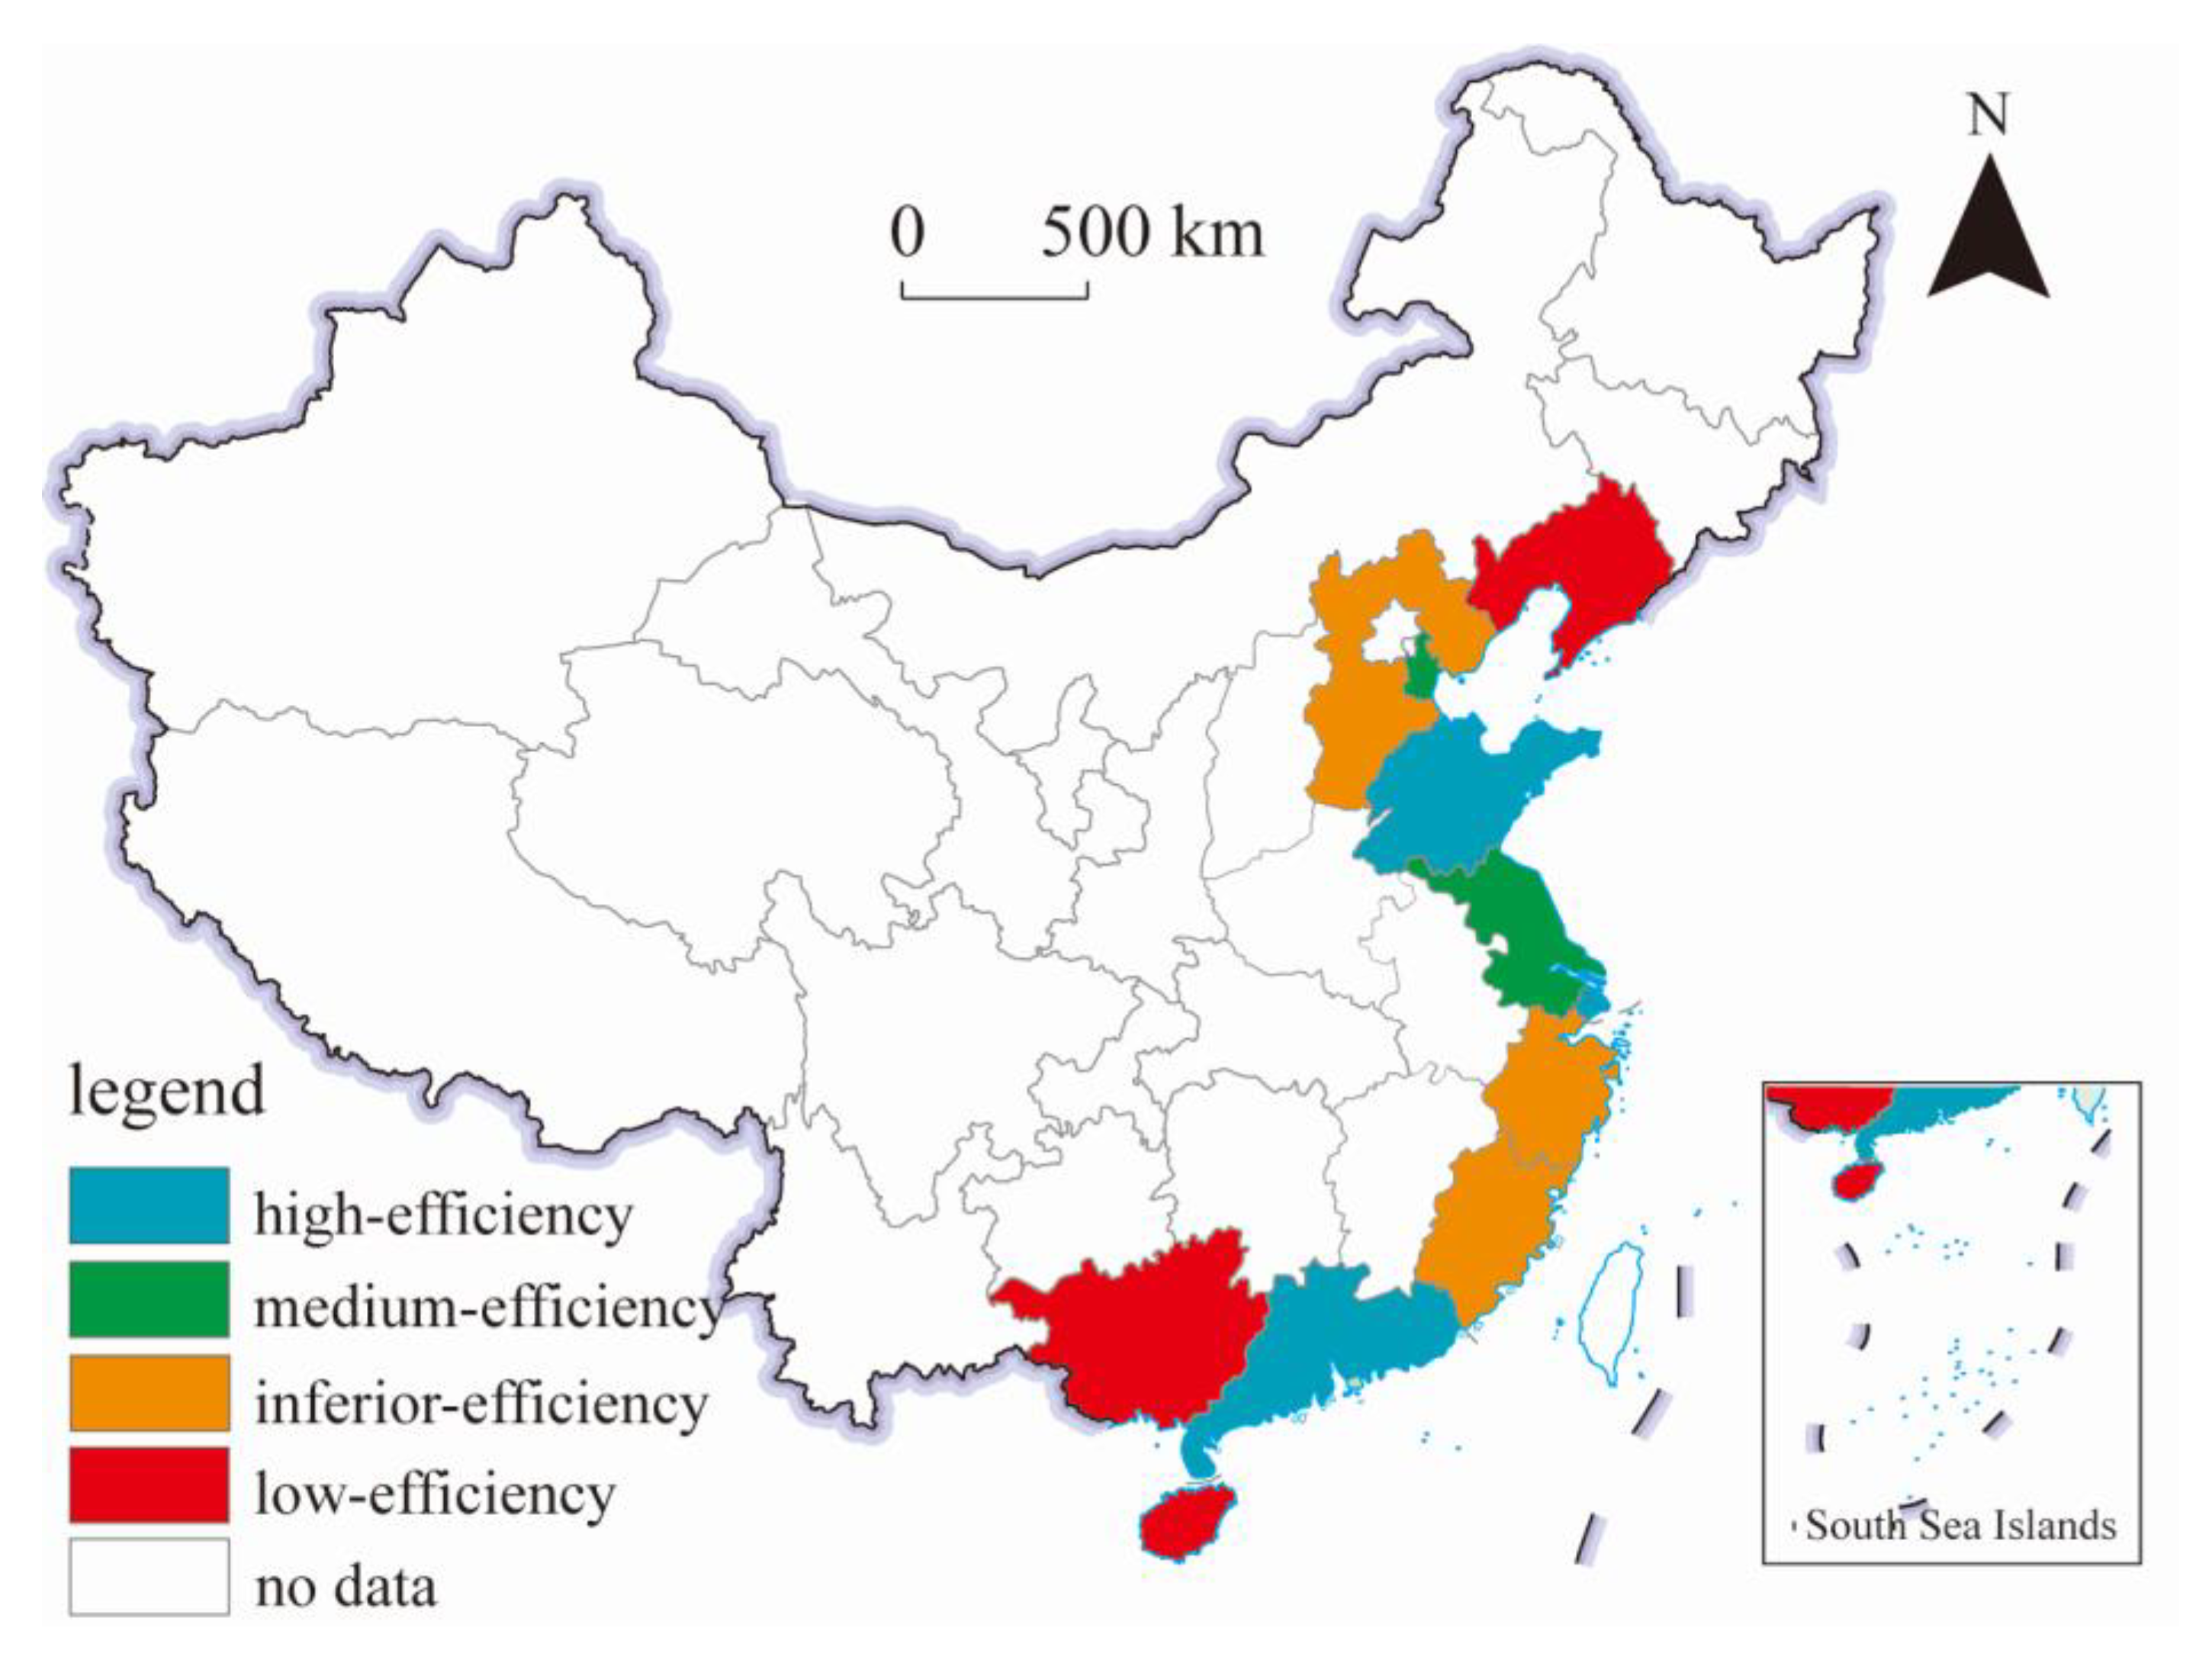
4.2. Regional Differences in SUE

Table 2 displays in detail the measured results and the ranking of the SUE of 11 coastal provinces (cities) in China from 2006 to 2018. Referring to Wang (2014) [33], and taking into account the actual situation of China’s sea use, this paper divides coastal provinces and cities into high-efficiency regions (mean value ≥ 1), medium-efficiency regions (0.7 ≤ mean value < 1), inferior-efficiency regions (0.5 ≤ mean value < 0.7), and low-efficiency regions (mean value < 0.5), on the basis of the mean value of SUE. The spatial distribution is exhibited in Figure 2.
(1)
Shanghai (1.8607), Guangdong (1.4084), and Shandong (1.1920) are high-efficiency regions where their SUE has reached the frontier every year, among which Shanghai keeps far ahead. These three places boast a solid economic foundation for marine development as a result of the early exploitation of their waters. According to the 2018 data, they accounted for more than half of the country’s GMP (gross marine product). They also play a central role in China’s three major marine economic circles (northern, eastern, and southern marine economic circles), respectively, equipped with advanced technologies and brilliant talents for marine development. When combined with various policies to support marine development, the above three locations have taken the lead in SUE and have maintained it for a long time.
(2)
Jiangsu (0.9619) and Tianjin (0.9295) are medium-efficiency regions. Their SUE reached the frontier in 2008 and 2010. As developed provinces in eastern China, they pay increasing attention to the marine economy although they lag behind Shanghai, Guangdong, and Shandong in terms of time of sea exploitation. Given their solid economic foundation and abundant marine resources, they have made ongoing efforts to increase research and investment in marine development technology, formulating a series of favorable policies to attract talents for marine economy development. Concurrently, they have strived to utilize the spillover effect from their neighbors, Shandong and Shanghai, so that their sea use efficiencies continue to rise and remain at a medium level.
(3)
Fujian (0.6200), Hebei (0.5983), and Zhejiang (0.5632) are inferior-efficiency regions. Their SUE failed to reach the frontier during the examination. Similar to Jiangsu and Tianjin, as developed provinces in coastal areas, Fujian and Zhejiang have advantages in marine technology and scale of marine economy. However, given the poor marine ecological environment near the East China Sea where Zhejiang and Fujian are located, as well as the lack of marine ecological environmental protection in the process of exploitation, undesirable outputs such as inorganic nitrogen and reactive phosphate are excessively high, followed by a lower SUE. Compared with other coastal areas, Hebei is endowed with fewer marine resources, with only three coastal cities in the province. In addition, the sea development does not count as the focus of its overall economic development. It places little emphasis on the integrated use of its waters, causing its marine economic development to stagnate. Therefore, a large gap exists between its SUE and that of its neighbors, Tianjin and Shandong.
(4)
Liaoning (0.4242), Hainan (0.3908), and Guangxi (0.3722) are low-efficiency regions where their SUE in the examination period was far from reaching the frontier. Despite their generous investment in production factors during their marine development, their GMP is incredibly out of proportion with the input due to the problematic marine industry structure. Liaoning and Guangxi are lacking in the advanced marine industry, as fishery remains the primary marine industry with low added-value from the marine economic output. Hainan has a sound marine ecological environment and depends heavily on tourism for its marine development. However, such over-dependence on tourism brings about the laggard development of strategic emerging marine industries that can really drive the overall growth of the regional marine economy. Furthermore, its unreasonable marine industry structure results in obviously insufficient regional marine economic output.

4.3. Dynamic Changes in SUE
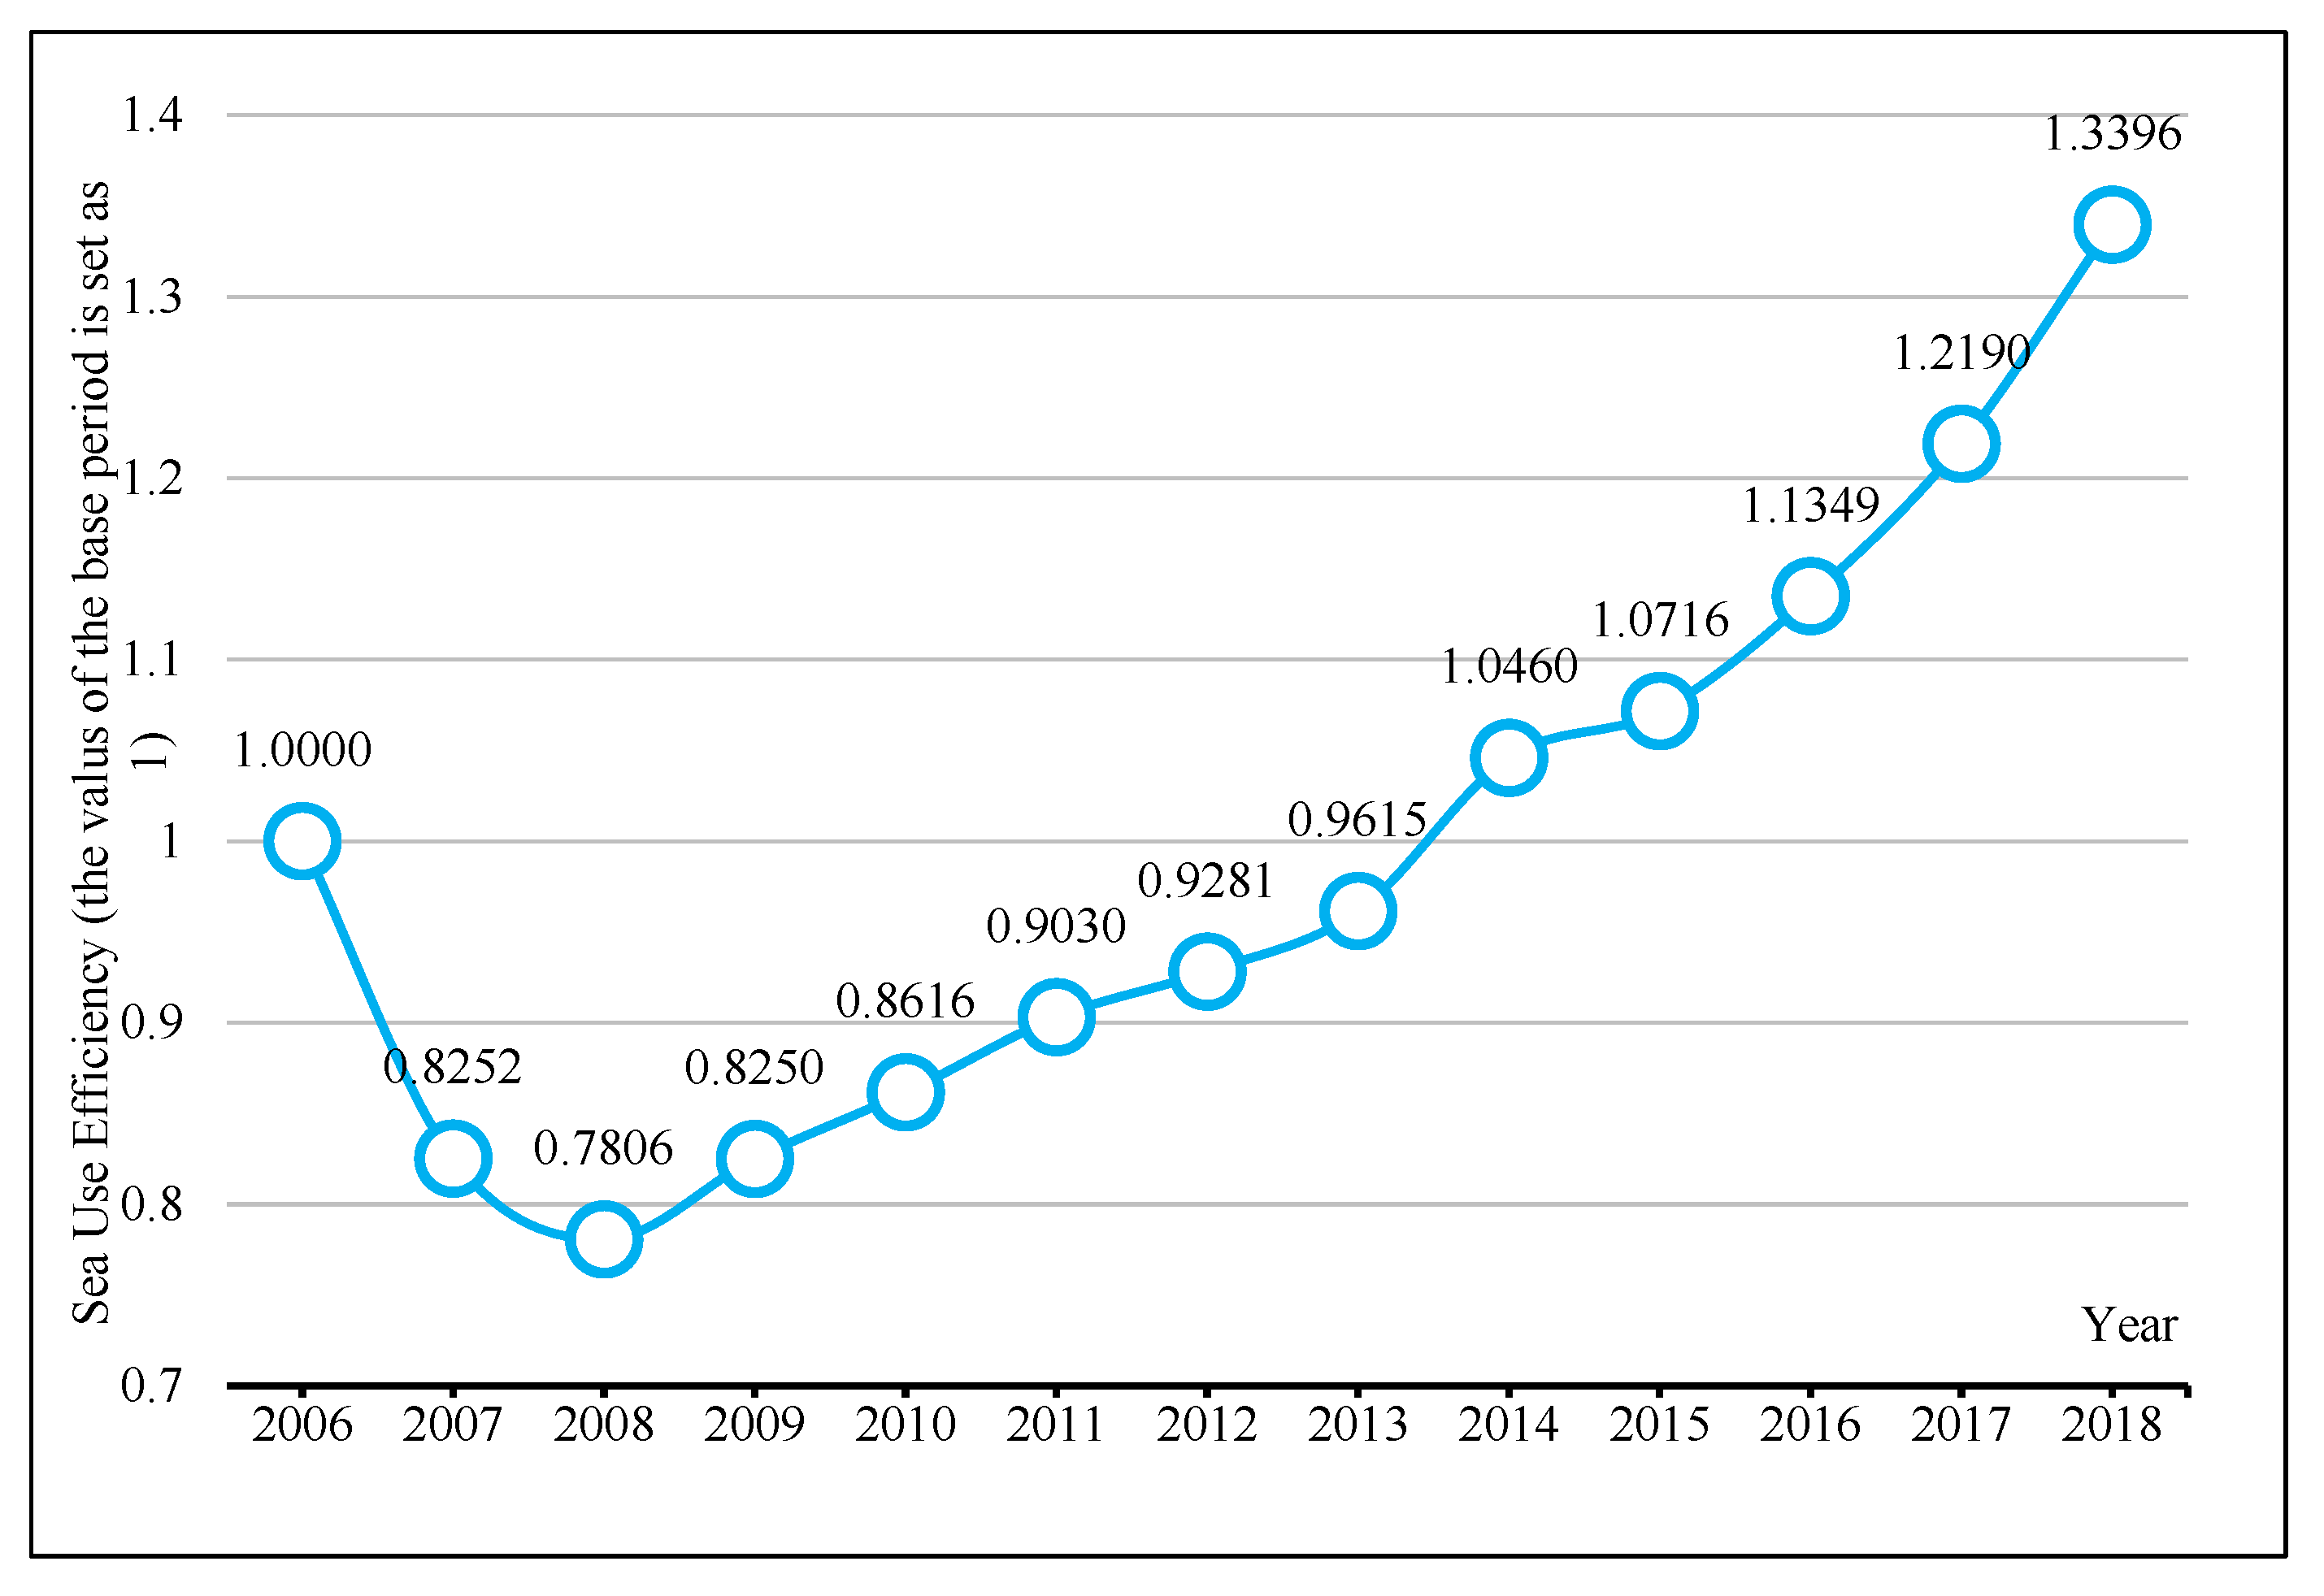
Table 3 shows the geometric mean of the GML index and its sub-indexes of the SUE in China’s coastal areas for each period from 2006 to 2018. The results reveal that the geometric mean of the GML index for 2006–2018 is 1.0247, indicating that the overall trend of China’s SUE rose rapidly, with an average annual growth rate of 2.47%. The results of sub-indexes show that the geometric mean of EC index and BPC index are 1.0054 and 1.0191, respectively, indicating that the technical efficiency and technical progress of China’s sea use have increased during the examination period, given that the average annual growth rate of technical progress (1.91%) is significantly higher than that of technical efficiency (0.54%).
The GML index displays the change rate of SUE, which does not intuitively reflect the variation trend of sea use during the examination period. To solve this problem, this paper refers to Qiu’s (2008) approach [34], taking the base period (2006) as 1 and multiplying it by the GML index value year-by-year to obtain the variation trend in China’s SUE from 2006 to 2018, as shown in Figure 3. The overall development trend of China’s SUE shows a “checkmark” type during the examination period. Combined with the GML index results listed in Table 3, the change in China’s SUE during the examination period can be divided into three stages:
(1)
Declining period (2006–2008): In this period, although the human, material, and financial resources invested in the process of marine exploitation were increasing, the paid use system of the sea remained in the initial implementation phase where the supporting mechanisms were not in place. As a result, the system arrangement of the sea property rights system did not play an efficient role in promoting the SUE. Concurrently, the development of China’s marine economy remained in its infancy where the technologies for marine exploitation were disadvantaged, and the marine industry was dominated by the marine secondary industry with low added-value and a great impact on the marine ecological environment. Consequently, the growth rate of marine economic output failed to match the growth rate of its input. Coupled with the lack of attention to marine environmental protection, the damage to marine ecology further imposed negative externalities on the improvement of SUE.
(2)
Steady increase period (2008–2013): In this period, as various supporting mechanisms were in place, the implementation of the paid use system of the sea was greatly promoted, and the system arrangement of sea property played a better role in promoting the SUE. As a result, the SUE in China rose steadily in this period with the geometric mean of the GML index being 1.0428 and the average annual growth rate maintained within 2–5%.
(3)
Rapid increase period (2013–2018): At the 18th National Congress of the Communist Party of China, the national strategy of “building China into a strong marine country” was formulated. The strategy proposes that the construction of a strong marine country should be promoted from various aspects, including marine economy, marine sciences and technologies, and the marine environment. Consequently, China’s marine industries thrived, and the SUE experienced a rapid rise. Over the years, the geometric mean of the GML index was 1.0686 and the average annual growth rate exceeded 5%, indicating a continuous rise in SUE.
Figure 4 further shows the changes in SUE in the 11 coastal provinces (cities) from 2006 to 2018. The figure reveals that: (1) places of high efficiency, such as Shanghai, Guangdong, and Shandong, have experienced significant differences in the change rate of SUE during the examination period. The SUE in Shanghai and Guangdong has declined, and the decline in Shanghai was particularly significant, with an average annual decline rate of 4.78%. In contrast with these two areas, the SUE in Shandong showed significant growth during the examination period and was in the leading position with an average annual growth rate of 7.55%. (2) In the medium-efficiency group, Jiangsu and Tianjin showed a significant increase in SUE, with an average annual growth rate of 7.85% and 6.31%, respectively. (3) As places with inferior efficiency, Fujian, Hebei, and Zhejiang also experienced a rise in SUE during this period despite the minimal growth rate (annual rate of 5% or less). (4) In the low-efficiency group, except for a slight decline in Hainan, a rise in the SUE transpired in Liaoning and Guangxi within the examination period.

5. Discussions

Marine resources are a kind of public good. The non-exclusive entry and use of public goods will inevitably lead to excessive development and even destruction. As a kind of commons, the sea is competitive and non-exclusive; thus, its resources or properties have many owners. Each owner has the right to use the sea, but none of them has the right to prevent others from using it. However, these owners tend to overuse the resources, causing the depletion of marine resources [35]. Paid use of marine resources is the key to solve this problem. Paid use enables the value of marine resources to be reflected in the value of marine products, thus raising the cost of raw materials for marine resource users. In addition, the user of marine resources will reduce the consumption of marine resources and increase the SUE through technological innovation, process improvement, and management, etc. In addition, they will invest additional labor to maintain the reproduction capacity of marine resources, which will promote the concept of marine resources having value. In short, they have to pay for the use of marine resources if they want to continue to gain benefits by producing marine products.
The following suggestions are given to further improve the SUE and promote a sustainable marine economy.
First, each region should implement differentiated development strategies on the basis of its own advantages and local conditions and further promote the inter-regional flow of production factors, including capital, technology, and labor through policy guidance and integrated planning. This can break the institutional barriers of regional division and strengthen the synergy among regions. High-efficiency regions, such as Shanghai, Guangdong, and Shandong, must be promoted to bring spillover effects to other regions. Regions with low-efficiency sea use should draw development experience from the ones with high efficiency and simultaneously the latter should give support to the former to promote their SUE. Subsequently, the gaps in SUE among different regions can be narrowed and comprehensive and coordinated development in the marine economy in the coastal regions can be achieved.
Second, the property right system of sea resources should be innovated and an all-directional and multi-level transaction mechanism of sea use rights must be constructed. At the first level, the government should take the lead in dealing with the transfer of sea-use rights. This includes not only the initial distribution of the rights of use from the higher government (mainly the central government) to the lower government (mainly the local government) but also the process of reallocation of regional sea use rights from the government to sea-use enterprises (individuals). Concurrently, a transaction market of sea use rights should be constructed, and the market should take the lead in dealing with the secondary sea use rights transaction between sea users (including enterprises and individuals), whereas the government must play the role of “night watchman” to clearly define the sea use rights, formulate transaction rules, maintain transaction order, and control the total number of transactions. The institutional support will promote and realize the value of the sea and improve SUE rationally and orderly.
Third, more endeavors should be made to protect the marine environment, and the exploitation of marine resources should not exceed its capacity. The value of the sea should not be realized at the expense of damaging the marine ecosystem. Coastal areas must not only use limited sea resources wisely, but also gain more support for marine environmental protection through a series of measures. This includes strengthening financial support for marine environmental protection, eliminating high pollution and high emission projects, formulating and improving laws and regulations on marine ecological environmental protection, and cultivating public awareness of marine environmental protection in coastal areas to realize a green marine economy.

6. Conclusions and Remarks on Future Research

This paper takes 11 Chinese coastal provinces (cities) as the research objects to measure the regional differences and dynamic changes of China’s SUE from 2006 to 2018. Under the framework of total factor analysis, the paper employs a super-WSBM model that deals with undesirable outputs and the GML index to obtain the results, which are then displayed in charts and figures. The main conclusions of this paper are as follows:
(1)
Nationally speaking, at the end of the examination period the central value in the density function of SUE was distributed between 0.7 and 0.8, which has not reached the high-efficiency level. During the examination period, the efficiency of sea use has experienced a declining period (2006–2008), a steady increase period (2008–2013), and a rapid increase period (2013–2018). The increase in China’s SUE during the examination period is mainly driven by the advancement in technologies and shows a “checkmark” type with an average annual growth rate of 2.47%.
(2)
Looking from a regional view, significant regional differences exist in the efficiency of sea use, and the degree of polarization has been strengthened. Shanghai (1.8607), Guangdong (1.4084), and Shandong (1.1920) are high-efficiency regions. However, in contrast to Shandong, where the efficiency has risen rapidly, Shanghai and Guangdong show different degrees of decline in SUE, with the decline in Shanghai being particularly significant; Jiangsu (0.9619) and Tianjin (0.9295) belong to medium-efficiency regions with high growth in SUE. Fujian (0.6200), Hebei (0.5983), and Zhejiang (0.5632) are regions with inferior efficiency where a small increase in SUE can be seen; Liaoning (0.4242), Hainan (0.3908), and Guangxi (0.3722) are regions with low efficiency; excluding Hainan, where a slight decline in efficiency transpired, Liaoning and Guangxi experienced a small rise in efficiency during the examination period.
The authors believe that this paper may contribute to the existing research in terms of research objects, methods, and data, but some shortcomings remain. First, due to the lack of data, the research object of this paper is set at the provincial level of China’s coastal areas, and no discussion on this matter exists at a smaller level. If more detailed data at the city level or even county level can be obtained, further research on this topic can be carried out to reflect the actual situation of the SUE more objectively and comprehensively in China’s coastal areas. Second, given that the super-WSBM model measures the static efficiency values of SUE in each region, comparing them in time series is not feasible, thus the factors that influence the SUE are not studied here. Further research can be carried out on this topic once the SUE of various regions at different times can be measured under the same frontier.

Author Contributions

Conceptualization, Q.Z. and X.Y., methodology, Q.Z. and X.Y., formal analysis, X.Y., investigation, X.Y., writing—original draft preparation, Q.Z., writing—review and editing, X.Y., funding acquisition, X.Y. All authors have read and agreed to the published version of the manuscript.

Funding

This research was funded by the Natural Science Foundation of Zhejiang (No. LQ22G030002), the National Natural Science Foundation of China (No. 71874092); the Key Projects of Philosophy and Social Sciences Research of Ministry of Education of China (No. 2022JZDZ009).

Institutional Review Board Statement

Not applicable.

Informed Consent Statement

Not applicable.

Data Availability Statement

Not applicable.

Conflicts of Interest

The authors declare no conflict of interest.

References

  1. Yang, X.; Liu, N.; Zhang, P.; Guo, Z.; Ma, C.; Hu, P.; Zhang, X. The current state of marine renewable energy policy in China. Mar. Policy 2019, 100, 334–341. [Google Scholar] [CrossRef]
  2. Yu, H. A new stage in China’s marine management. Ocean Coast. Manag. 1993, 19, 185–190. [Google Scholar] [CrossRef]
  3. Yang, L.; Wu, L.; Yan, S. Market-based sea use management in China: Features and countermeasures. Mar. Policy 2020, 120, 104091. [Google Scholar] [CrossRef]
  4. He, S.; Zhai, R.; Pan, Y. Modeling analysis of the relationship between the exploitation and utilization of marine resources and the sustainable development of the marine economy. J. Coast. Res. 2018, 83, 964–969. [Google Scholar] [CrossRef]
  5. Wang, L.; Zhang, H. The impact of marine tourism resources development on sustainable development of marine economy. J. Coast. Res. 2019, 94, 589–592. [Google Scholar] [CrossRef]
  6. Greiner, R.; Young, M.; McDonald, A.; Brooks, M. Incentive instruments for the sustainable use of marine resources. Ocean Coast. Manag. 2000, 43, 29–50. [Google Scholar] [CrossRef]
  7. Scheiber, H.N. The “commons” discourse on marine fisheries resources: Another antecedent to Hardin’s “tragedy”. Theor. Inq. Law 2018, 19, 489–505. [Google Scholar] [CrossRef]
  8. Chang, J.I.; Choi, H.J.; Choi, S. Challenges of the coastal use fee and levy system in Korea. J. Coast. Res. 2018, 85, 1511–1515. [Google Scholar] [CrossRef]
  9. Englander, G. Property rights and the protection of global marine resources. Nat. Sustain. 2019, 2, 981–987. [Google Scholar] [CrossRef]
  10. Posner, E.A.; Sykes, A.O. Economic foundations of the law of the sea. Am. J. Int. Law 2010, 104, 569–596. [Google Scholar] [CrossRef]
  11. Ostrom, E. Governing the Commons: The Evolution of Institutions for Collective Action; Cambridge University Press: Cambridge, UK, 1990. [Google Scholar]
  12. Tingley, D.; Pascoe, S.; Coglan, L. Factors affecting technical efficiency in fisheries: Stochastic production frontier versus data envelopment analysis approaches. Fish. Res. 2005, 73, 363–376. [Google Scholar] [CrossRef]
  13. Idda, L.; Madau, F.A.; Pulina, P. Capacity and economic efficiency in small-scale fisheries: Evidence from the Mediterranean Sea. Mar. Policy 2009, 33, 860–867. [Google Scholar] [CrossRef]
  14. Jamnia, A.; Mazloumzadeh, S.; Keikha, A. Estimate the technical efficiency of fishing vessels operating in Chabahar region, Southern Iran. J. Saudi Soc. Agric. Sci. 2015, 14, 26–32. [Google Scholar] [CrossRef] [Green Version]
  15. Kamble, S.S.; Raoot, A.D.; Khanapuri, V.B. Improving port efficiency: A comparative study of selected ports in India. Int. J. Shipp. Transp. Logist. 2010, 2, 444–470. [Google Scholar] [CrossRef]
  16. Cullinane, K.; Wang, T.-F.; Song, D.-W.; Ji, P. The technical efficiency of container ports: Comparing data envelopment analysis and stochastic frontier analysis. Transp. Res. Part A Policy Pract. 2006, 40, 354–374. [Google Scholar] [CrossRef]
  17. Fancello, G.; Serra, P.; Aramu, V.; Vitiello, D.M. Evaluating the efficiency of Mediterranean container ports using data envelopment analysis. Compet. Regul. Netw. Ind. 2021, 22, 163–188. [Google Scholar] [CrossRef]
  18. Lei, L.; Gao, Q.X.; Yang, C. The variations and trend analyses of sea area use in China. Resour. Sci. 2017, 39, 2030–2039. [Google Scholar] [CrossRef] [Green Version]
  19. Yueying, C.; Quanming, Z.; Weiwei, W. Situations and Suggestions on Paid Use of Sea Area in China. Ocean Dev. Manag. 2012, 29, 9–13. [Google Scholar] [CrossRef]
  20. Lina, K.; Hongqing, W.; Shusheng, Y. Study on Sea Areas Intensive Use in Liaoning Coastal Economic Zone from 2004 to 2014. Trans. Oceanol. Limnol. 2018, 4, 148–156. [Google Scholar] [CrossRef]
  21. Hongwei, M.; Shaoquan, G.; Weiwei, W. Evaluation of marine utilization: A case study of Dalian City. Mar. Environ. Sci. 2012, 2, 282–284. [Google Scholar]
  22. Si, Z.; Miao, W. Empirical Research on Paid Use of Sea Area in China: 2002–2017. China Soft Sci. 2018, 8, 148–164. [Google Scholar] [CrossRef]
  23. Tone, K. A slacks-based measure of efficiency in data envelopment analysis. Eur. J. Oper. Res. 2001, 130, 498–509. [Google Scholar] [CrossRef] [Green Version]
  24. Tone, K. A slacks-based measure of super-efficiency in data envelopment analysis. Eur. J. Oper. Res. 2002, 143, 32–41. [Google Scholar] [CrossRef] [Green Version]
  25. Zhaofeng, W.; Qingfang, L. The spatio-temporal evolution of tourism eco-efficiency in the Yangtze River Economic Belt and its interactive response with tourism economy. J. Nat. Resour. 2019, 9, 1945–1961. [Google Scholar] [CrossRef]
  26. Oh, D.H. A global Malmquist-Luenberger productivity index. J. Product. Anal. 2010, 34, 183–197. [Google Scholar] [CrossRef]
  27. Mei, G.; Yarong, Z. Spatial Evolution of Marine Ecological Efficiency and Its Influential Factors in China Coastal Regions. Sci. Geogr. Sin. 2019, 4, 616–625. [Google Scholar] [CrossRef]
  28. Hongjun, G.; Zhenzhen, S.; Haonan, G. An analysis of Spatial-temporal Evolution of Marine Economy Green Total Factors Productivity and Its Influencing Factors in China. J. Ocean Univ. China Soc. Sci. 2019, 6, 40–53. [Google Scholar] [CrossRef]
  29. Lin, Z.; Yushuo, Z.; Xinying, J. An evaluation of Chinese marine economy efficiency based on SBM and Malmquist productivity indexes. Resour. Sci. 2016, 3, 461–475. [Google Scholar] [CrossRef]
  30. Qingfeng, W.; Zhuchang, T. Estimating of Capital Stock without Investment Information. J. Quant. Tech. Econ. 2014, 9, 150–160. [Google Scholar] [CrossRef]
  31. Jun, Z.; Guiying, W.; Jipeng, Z. The Estimation of China’s provincial capital stock: 1952—2000. Econ. Res. J. 2004, 10, 35–44. [Google Scholar]
  32. Young, A. Gold into base metals: Productivity growth in the People’s Republic of China during the reform period. J. Political Econ. 2003, 111, 1220–1261. [Google Scholar] [CrossRef] [Green Version]
  33. Hefeng, W.; Yishao, S.; Changying, Y. Land use efficiencies and their changes of Shanghai’s development zones employing DEA model and Malmquist productivity index. Geogr. Res. 2014, 9, 1636–1646. [Google Scholar]
  34. Bin, Q.; Shuai, Y.; Peijiang, X. Research on Technology Spillover of FDI and China’s Manufacturing Productivity: Based on the Panel Data. J. World Econ. 2008, 8, 20–31. [Google Scholar] [CrossRef]
  35. Xuan, Y.; Sen, L.; Weiteng, S.; Qi, C. The tiered transaction system for sea use rights in China: Theoretical basis and market construction. Mar. Policy 2022, 147, 105403. [Google Scholar] [CrossRef]
Figure 1. Kernel density analysis of SUE.
Jmse 10 01848 g001
Figure 2. Spatial distribution of SUE in coastal areas of China. Note: The map above is made from the base map downloaded from the standard map service website of the National Bureau of Surveying, Mapping, and Geographic Information with the review number GS (2019)1825.
Jmse 10 01848 g002
Figure 3. Changing trends of SUE in China, 2006–2018.
Jmse 10 01848 g003
Figure 4. Rate of SUE change in coastal provinces (cities) of China, 2006–2018.
Jmse 10 01848 g004
Table 1. Measurement index system of SUE.
Indicator TypeVariableData Sources
InputMarine employment
(10,000)
China Marine Statistical Yearbook
Marine capital stock
(CNY 100 million)
China Marine Statistical Yearbook and China
Statistical Yearbook
Cumulative sea area with
confirmed use rights (hectare)
China Marine Statistical Yearbook and Bulletin on Sea Area Use Management in China
Royalty charged
(CNY 10,000)
China Marine Statistical Yearbook
OutputGross marine product
(CNY 100 million)
China Marine Statistical Yearbook
Average concentration of
inorganic nitrogen in offshore
seawater (mg/L)
Bulletin on Environmental Quality of Offshore Waters in China
Average concentration of reactive phosphate in offshore seawater (mg/L)Bulletin on Environmental Quality of Offshore Waters in China
Table 2. Value and ranking of SUE in coastal provinces (cities) of China, 2006–2018.
YearTypeLiaoningHebeiTianjinShandongJiangsuShanghaiZhejiangFujianGuangdongGuangxiHainan
2006SUE0.44510.59190.68831.17120.52451.96690.57800.53091.45480.36320.4089
Ranking9543816721110
2007SUE0.50390.63080.61461.18980.54941.87850.65670.67731.28050.44940.5418
Ranking1067381542119
2008SUE0.50780.58160.55731.17421.04791.94970.63230.62681.25890.43610.4297
Ranking9783415621011
2009SUE0.45090.69420.63161.14791.03861.89140.63380.56701.36080.38010.4049
Ranking9573416821110
2010SUE0.39330.51881.05581.24181.01601.96210.57080.56261.37030.37600.3947
Ranking1084351672119
2011SUE0.40670.48371.01731.18901.04801.94230.55560.59811.32940.33050.3525
Ranking9853417621110
2012SUE0.43250.48921.03851.23871.05701.93870.55930.64031.43160.37140.5282
Ranking1095341762118
2013SUE0.41410.59371.06561.17921.04201.95150.51120.61381.42430.37760.3482
Ranking9743518621011
2014SUE0.39620.68311.19371.22981.06161.92910.54030.63911.40850.34660.3511
Ranking9643518721110
2015SUE0.33530.60871.11791.15801.04961.88450.51520.61061.45800.34160.3132
Ranking1074351862911
2016SUE0.37650.58061.04191.20821.03981.62480.52230.59751.51800.34040.3369
Ranking9743518621011
2017SUE0.44670.64251.03201.17741.02591.63850.53060.72971.52420.36890.3389
Ranking9743518621011
2018SUE0.40520.60251.02961.19101.00491.63130.51520.66671.48950.35610.3312
Ranking9743518621011
The charts reveal significant regional differences in China’s SUE.
Table 3. GML index and decomposed results of SUE in China’s coastal areas.
PeriodGMLECBPC
2006–20070.82521.07820.7654
2007–20080.94591.00950.9369
2008–20091.05690.99131.0662
2009–20101.04441.00341.0408
2010–20111.04810.97001.0805
2011–20121.02781.07660.9547
2012–20131.03600.96271.0761
2013–20141.08791.02451.0619
2014–20151.02450.94431.0849
2015–20161.05911.00981.0487
2016–20171.07411.03841.0344
2017–20181.09890.96621.1374
2006–20181.02471.00541.0191
Note: The values listed in the table are the geometric means of the coastal provinces (cities).
Publisher’s Note: MDPI stays neutral with regard to jurisdictional claims in published maps and institutional affiliations.

