Article

Experimental Study on Dynamic Parameters of Calcareous Sand Subgrade under Long-Term Cyclic Loading

1
Yazhou Bay Innovation Institute, Hainan Tropical Ocean University, Sanya 572025, China
2
College of Marine Science and Technology, Hainan Tropical Ocean University, Sanya 572022, China
3
College of Environmental Science and Engineering, Ocean University of China, Qingdao 266003, China
*
Author to whom correspondence should be addressed.
J. Mar. Sci. Eng. 2022, 10(12), 1806; https://doi.org/10.3390/jmse10121806
Submission received: 31 October 2022 / Revised: 17 November 2022 / Accepted: 18 November 2022 / Published: 22 November 2022
(This article belongs to the Special Issue Advances in Marine Engineering: Geological Environment and Hazards)

Abstract

:
A long-term cyclic loading test of calcareous sand from an island reef in the South China Sea was conducted under conditions of unequal consolidation and drainage. The axial cumulative strain and dynamic characteristics of coral sand samples with different physical and mechanical properties were studied under different stress levels, yielding a model prediction formula. The results show that (1) the axial cumulative strain and dynamic elastic modulus increase with increasing vibration times of the cyclic load, whereas the dynamic damping ratio decreases with increasing cyclic vibration time; (2) the axial cumulative strain, elastic modulus, and damping ratio are affected by dynamic stress amplitude, load frequency, confining pressure, consolidation stress, compactness and moisture content; and (3) based on dynamic triaxial test results, the axial cumulative strain model of calcareous sand under cyclic loading and its permanent deformation prediction formula are established by introducing the cyclic stress ratio. Two parameters, the elastic modulus evolution parameter and the damping ratio evolution parameter, are introduced, and the axial cumulative strain is normalized. The results of this research have significance for understanding the long-term deformation and dynamic response of coral sand subgrade soil under cyclic vibration loads.

1. Introduction

Calcareous sand is a special soil medium of marine biogenesis and is distributed widely throughout the South China Sea. It is composed mainly of coral detritus and other marine biological detritus, with a calcium carbonate content above 90%. As a result of its biogenesis and sedimentary conditions, its physical and mechanical properties are notably different from those of general continental and coastal sedimentary soils, and particle breakage and deformation occur readily under long-term loading [1,2,3,4].
In recent years, the gradual development of the South China Sea and the implementation of island and reef engineering constructions have led to calcareous sand being used widely in the construction of airport runways, ports, subgrades, and other structures. In a marine environment, a calcareous sand foundation is not only vulnerable to waves, tides, earthquakes, and other cyclic loads [5,6,7], but also will lead to permanent deformation and uneven settlement under traffic load. Previous studies have investigated the dynamic characteristics and permanent deformation of calcareous sand foundations under long-term dynamic loads. Some researchers [8,9,10] conducted indoor triaxial cyclic loading tests on calcareous sand under different working conditions, showing that particle breakage caused by long-term loading increases the porosity of calcareous sand. Under cyclic compression, even when the cyclic load level is lower than the static strength, calcareous sand exhibits substantial permanent deformation. The residual strain depends on the average stress acting on the specimen and the cyclic stress in the limit state. Yu Haizhen and Wang Ren [11] discussed the influence of dynamic stress, confining pressure, consolidation stress ratio, relative density, gradation, and vibration frequency on the dynamic characteristics of calcareous sand through a large number of dynamic triaxial tests. Li Jianguo [12,13] conducted experimental studies on the dynamic characteristics of saturated calcareous sand under wave loading, providing a preliminary comparison with the dynamic characteristics of quartz sand. The results show that under the action of wave load, the dynamic strength of saturated calcareous sand and quartz sand shows the same change rule with the direction angle of initial principal stress, and their dynamic strength gradually decreases with the increase of the direction angle of initial principal stress. Coop et al. [14] and Donohue et al. [15] studied particle breakage in calcareous sand and found that breakage increases with increasing cyclic loading time. Li Xue et al. [16] and Wang Gang et al. [17] conducted an in-depth study on particle breakage in calcareous sand, concluding that the degree of breakage increases with increasing cyclic shear time, whereas the growth rate gradually decreases. He Shaoheng et al. [18] conducted a series of long-term drained cyclic loading triaxial tests with different confining pressures and cyclic dynamic stress ratios and established a cyclic residual cumulative strain model of coral sand that can reflect the initial consolidation conditions and cyclic stress ratios. Studies simulating calcareous sand subgrades under vibration load have also been conducted: Zhou Sizhen [19] used node dynamic loading and surface dynamic loading to simulate aircraft loading, showing that under these two simplified dynamic loads, the vertical displacement value of node dynamic loading is larger and can maximize the safety of airport subgrade structures. Qin Lei [20] studied the characteristics of aircraft loading, simulating two simplified aircraft load forms with a moving constant load and moving sinusoidal load, and analyzing the dynamic response of airport subgrade under both kinds of action. Zhou Sujie [21] used repeated sinusoidal loading to simulate aircraft loading, considering the deformation and settlement of airport subgrade. The results of the abovementioned research are consistent with actual engineering settlement and monitoring values are also consistent with estimations.
In this paper, a dynamic triaxial apparatus was used to conduct long-term drainage cyclic loading tests for the unsaturated calcareous sand subgrade. The cumulative strain development law of calcareous sand under different confining pressures, dynamic stress amplitudes, consolidation stress ratios, subgrade soil compactness, load frequencies, and moisture contents is studied. Combined with a hyperbolic model, a prediction formula for the permanent deformation of calcareous sand under aircraft loading is presented. This formula provides a theoretical basis for the construction of a calcareous sand subgrade in the Nanhai island and reef project.

2. Materials and Methods

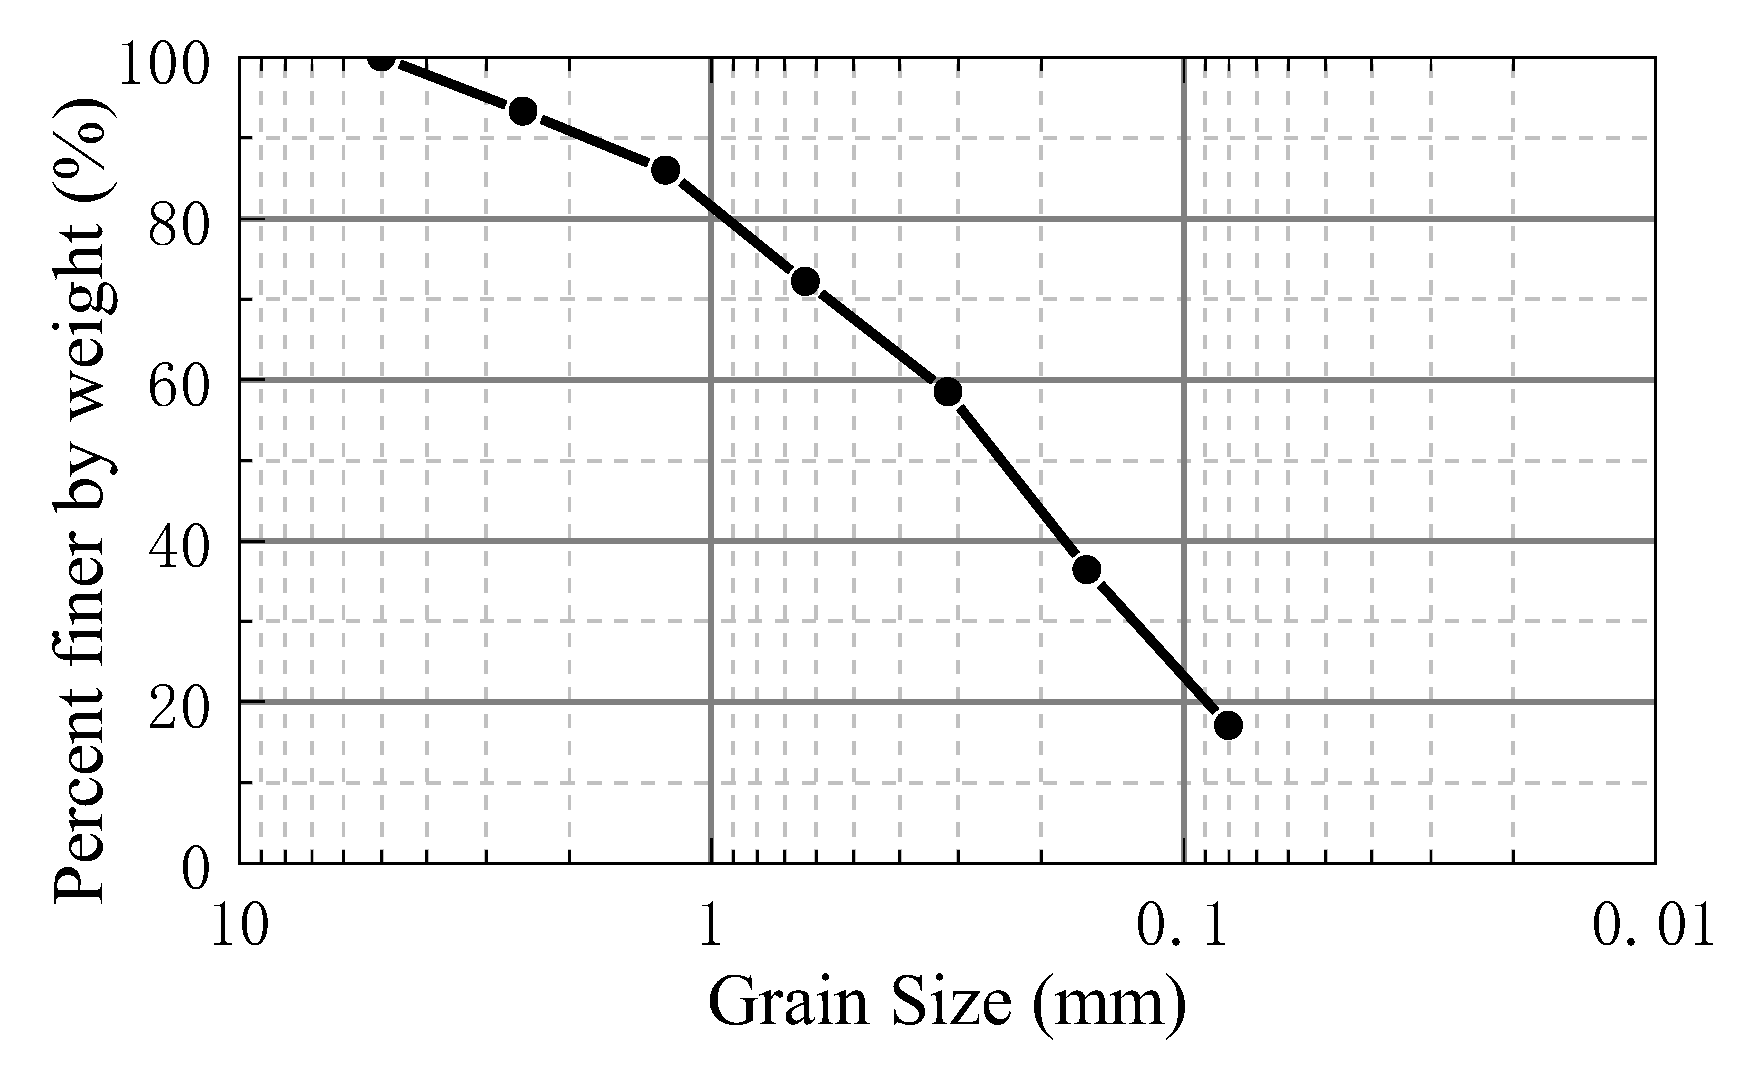
2.1. Experimental Materials and Instruments
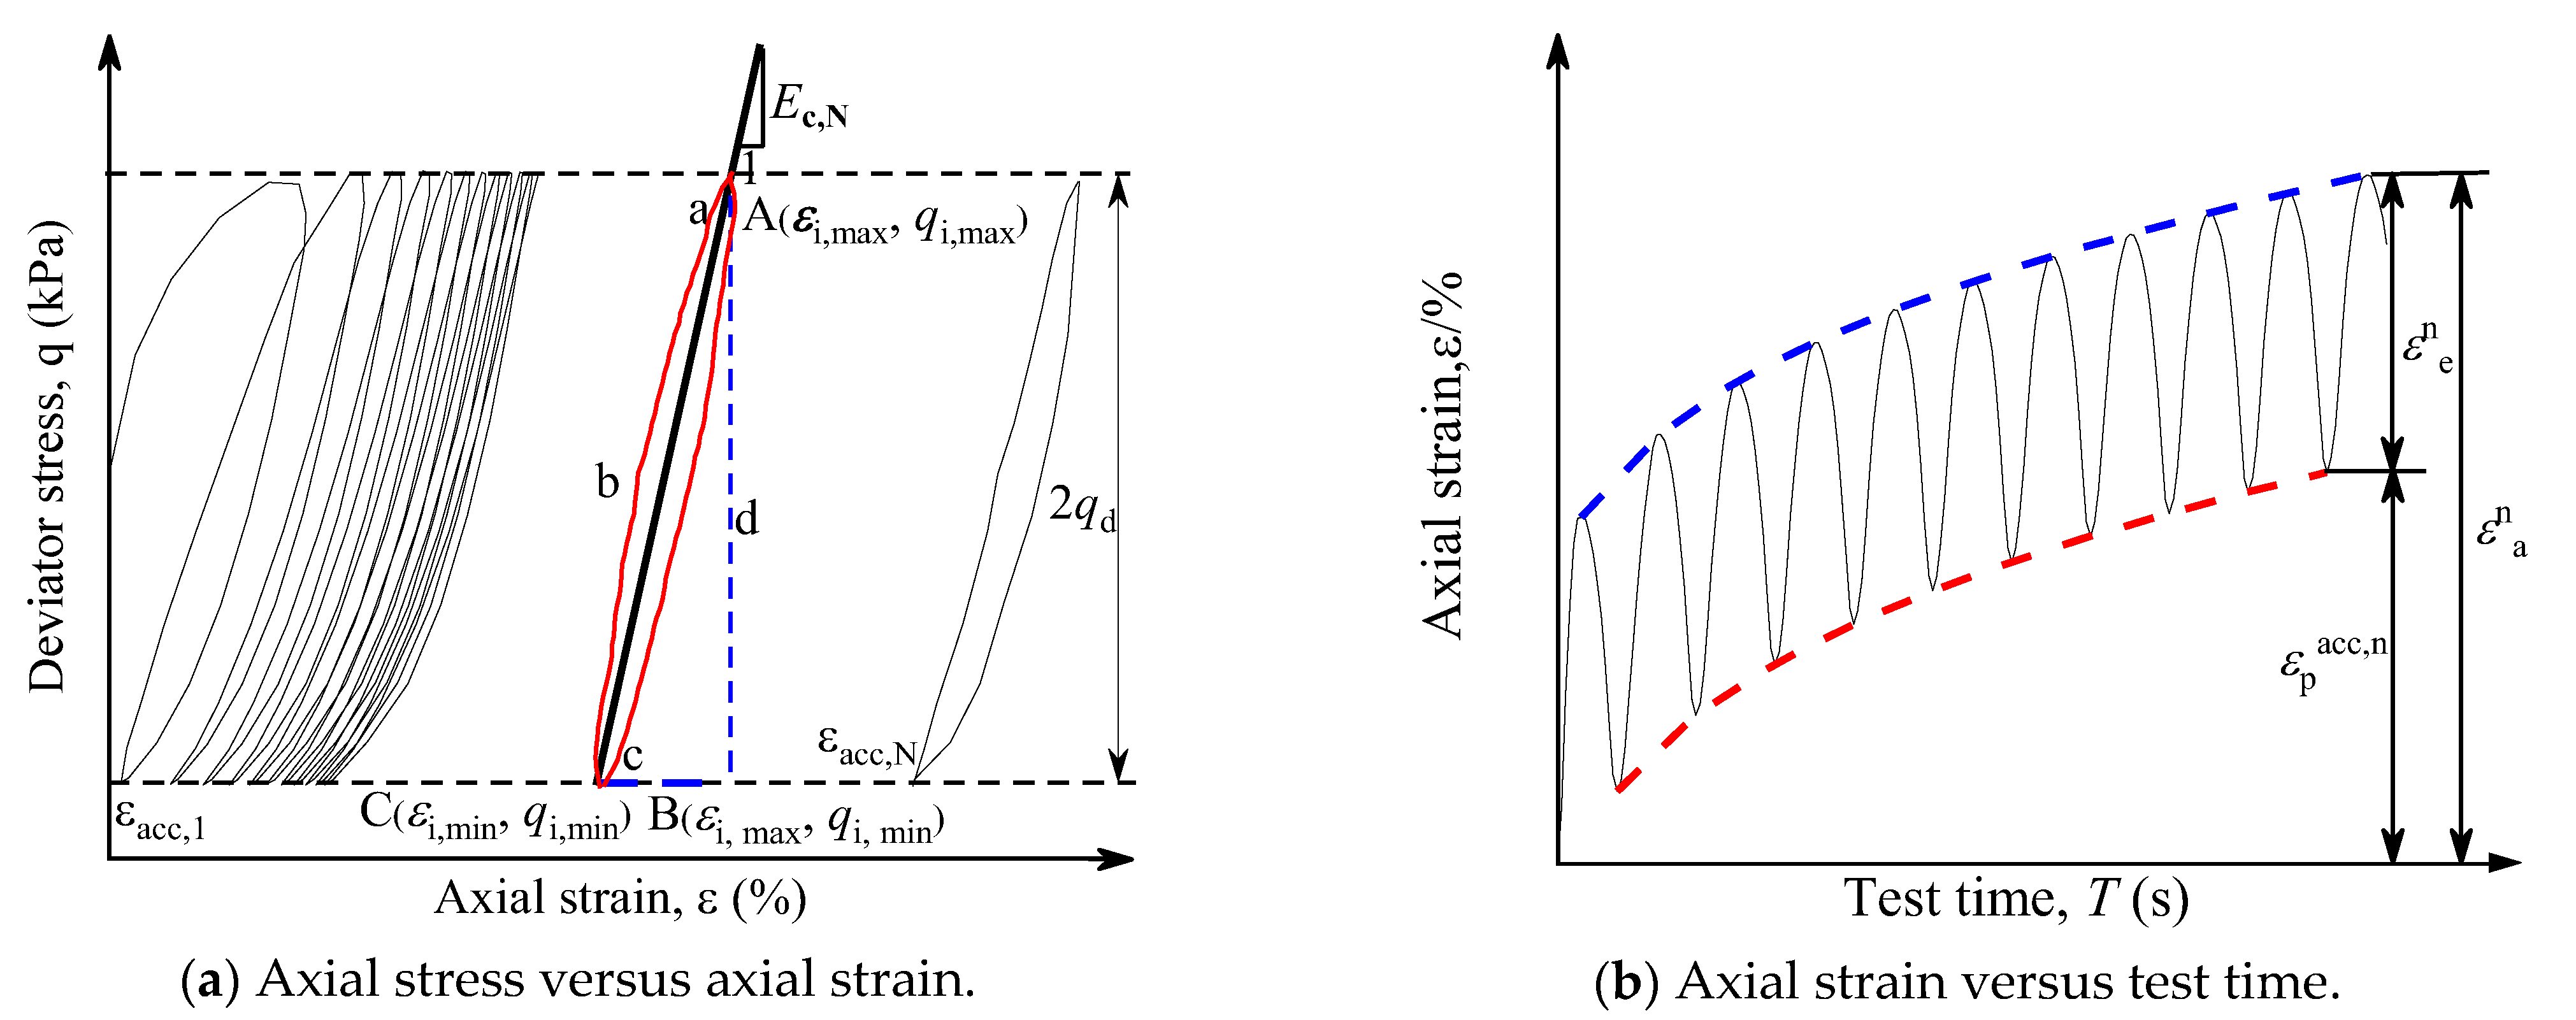
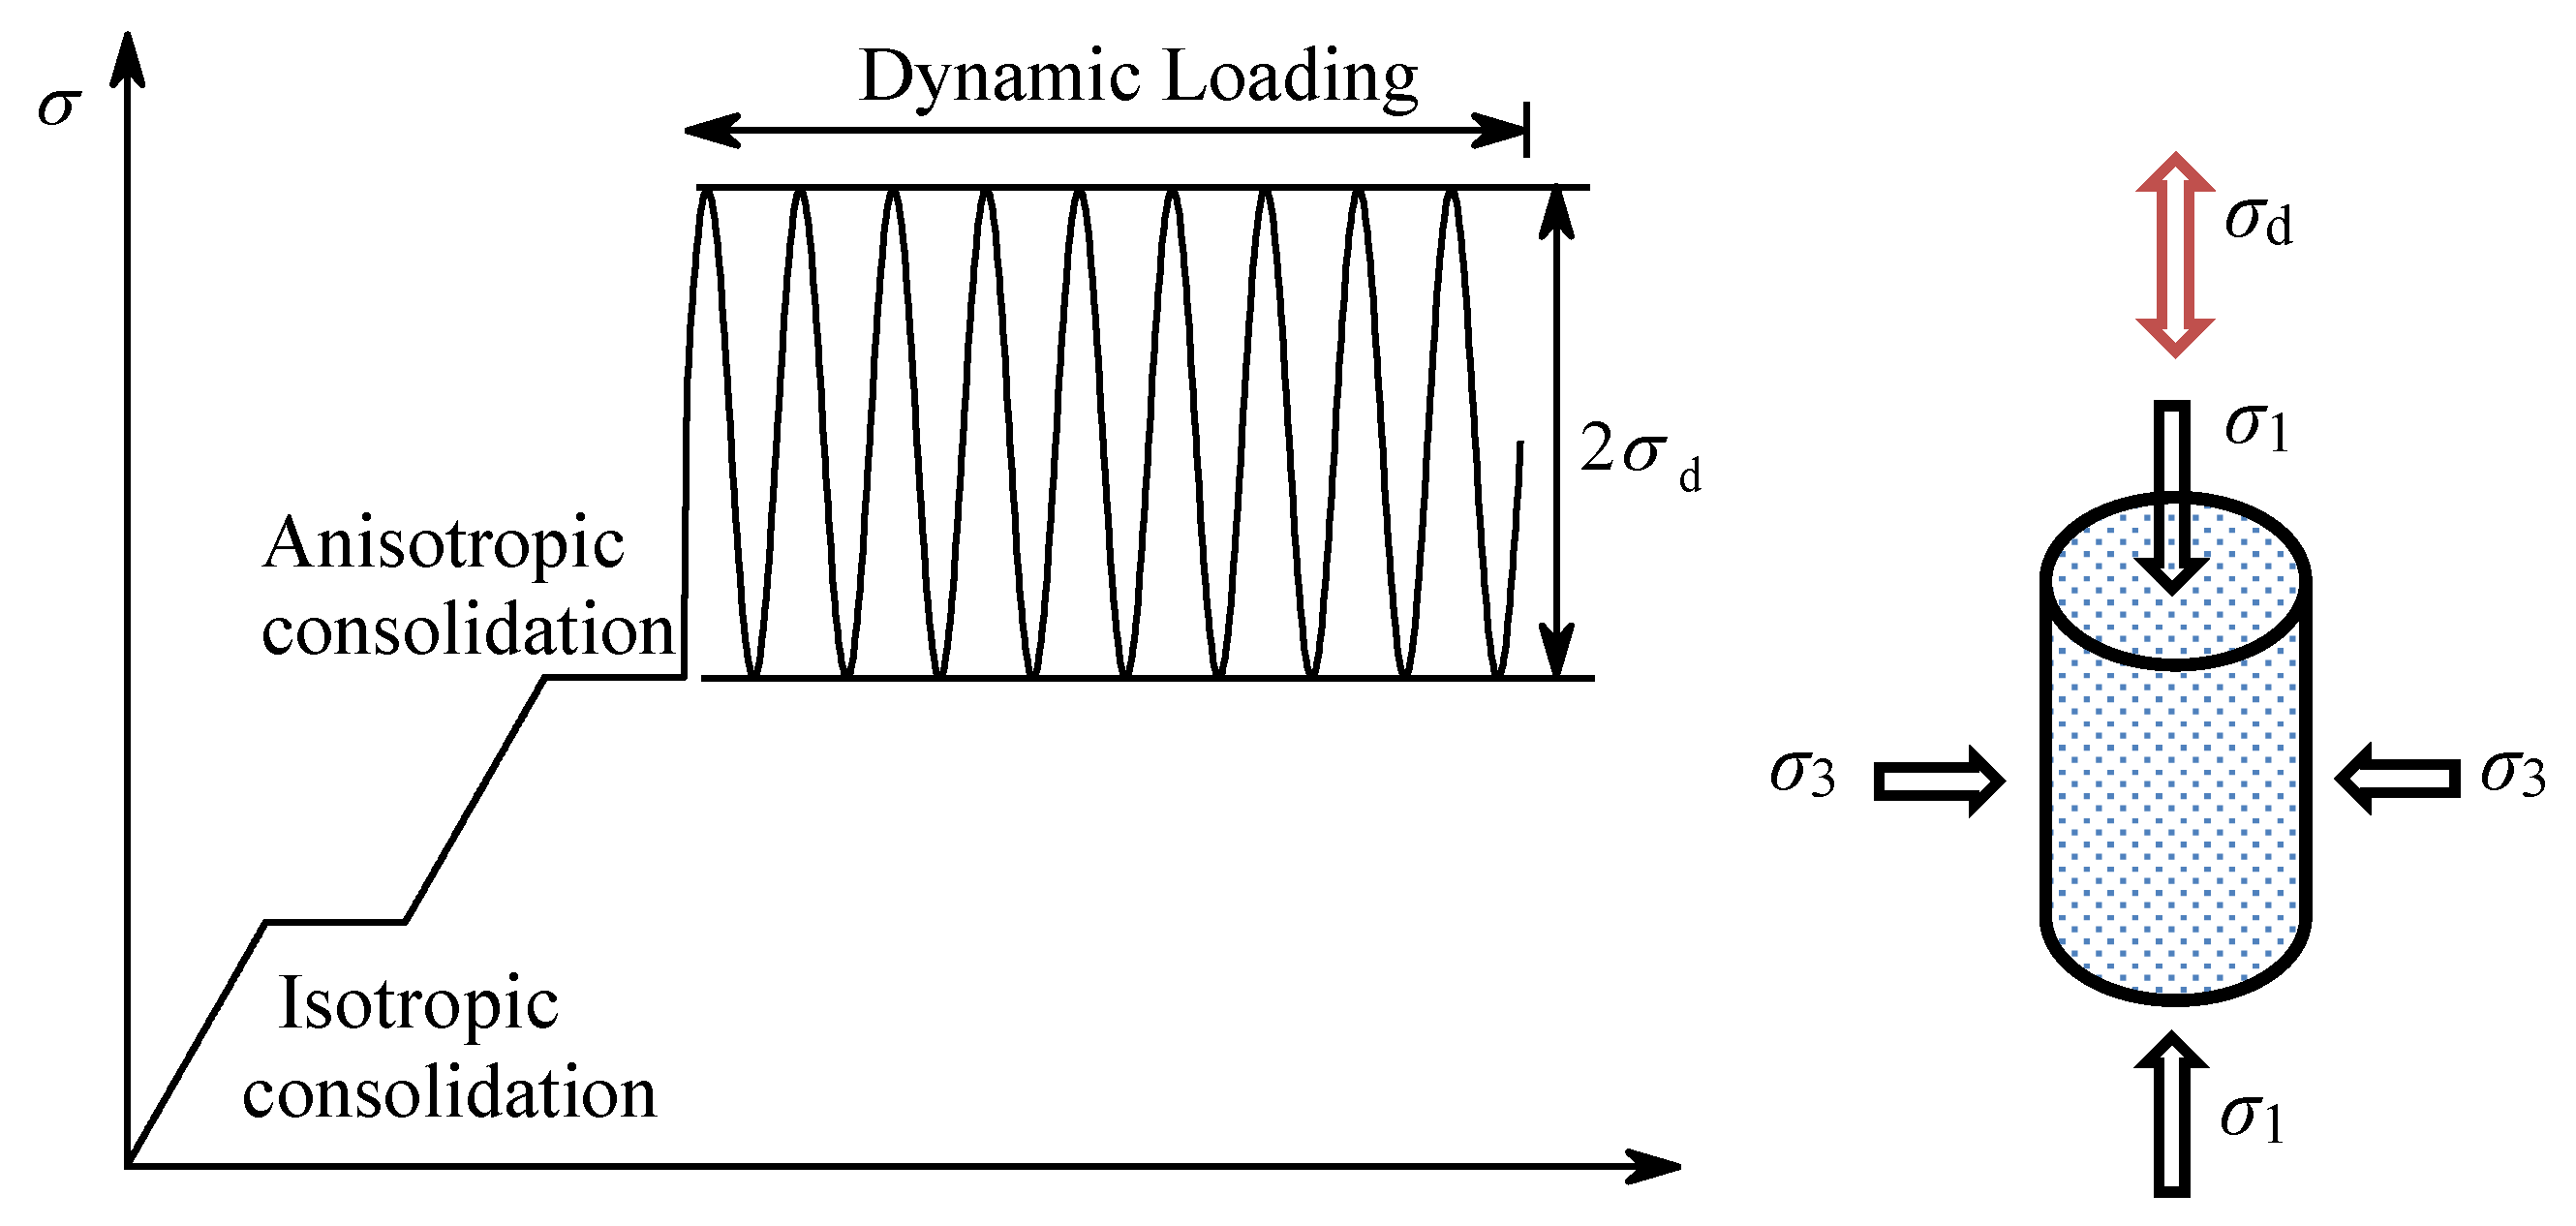
The calcareous sand sample used in this test was obtained from a reef in the South China Sea. Calcareous sand contains inorganic elements Al, P, S, Cl, Sr, metalloid element Si, transition metal element Sc, and trace metal elements Fe, Co, Mg, and the content of Ca is 93.53%. The sand sample was washed using distilled water and dried, after which large pieces of gravel and impurities were removed. Calcareous sand particles with a particle size of less than 5 mm were selected for the dynamic triaxial loading test. The specific gravity of the sample was 2.75, its maximum void ratio was 1.27, and its minimum void ratio was 0.66. The particle grading curve is shown in Figure 1. The British GDS dynamic triaxial test system was adopted as the test equipment. The system comprises a confining pressure volume controller, back pressure volume controller, data acquisition instrument, and host and test loading platforms. The maximum axial load can reach 10 kN, the maximum loading frequency is 5 Hz, and the maximum confining pressure is 2000 kPa.

2.2. Test Method

The diameter and height of the sample were set at 50 mm and 100 mm, respectively. According to the requirements of compactness and moisture content, sand samples were prepared according to the grade shown in Figure 1, placed in a beaker, and sealed with a plastic film and plastic bag for 24 h such that moisture was evenly distributed throughout the sand; these uniform sand samples were then compacted to the specified height in three parts, and filter paper, permeable stone, and a top cap were placed in sequence for the consolidation loading test.
The stress control adopted in the test was divided into three parts: isotropic consolidation, eccentric consolidation, and cyclic loading, as shown in Figure 2. During the cyclic loading stage, a sinusoidal waveform was used to simulate the unidirectional pulse vibration of aircraft loading. To consider permanent deformation of subgrade soil under different degrees of compactness, the test was set to the drainage condition, the number of cyclic loading n was set to 10,000, and compactness K can be calculated according to Equation (1):
K = ρ / ρ m a x
where ρ is the sample density and ρ m a x is the maximum dry density of the sample. As airport runways are often subject to complex stress states, and as aircraft loading is accompanied by a large vertical dead load, airport runways are not in an isotropic consolidation state. Herein, the consolidation stress ratio Kc = 1.5, 2, 2.5 is proposed to simulate the real consolidation stress state of airport subgrade soil, where KC can be calculated according to Equation (2):
K c = σ 1 / σ 3
where σ 3 and σ 1 represent the confining pressure and axial pressure of the specimen, respectively, at the consolidation stage.
Considering the above test parameters and actual working conditions, and referring to Zhou Sujie’s [21] effective simulation of loading due to an A320-200 aircraft, the test scheme was designed as shown in Table 1.

3. Results and Analyses

On the one hand, the effects of long-term dynamic loading on calcareous sand are reflected in its dynamic characteristics, for example, the dynamic elastic modulus and damping ratio; on the other hand, they are reflected in its cumulative deformation. As shown in Figure 3a, the irrecoverable residual strain caused by cyclic loading and unloading means that the loading and unloading curves cannot be closed. The closed area formed by the n-1 unloading curve and the nth loading curve is termed the hysteretic circle, whereas the closed ellipse surrounded by curve abcd is the hysteretic circle formed by cyclic loading. The slope of the line connecting vertices A ( ε i , m a x , q i , m a x ) and C ( ε i , m i n , q i , m i n ) of the major axis of ellipse abcd is the secant modulus of the corresponding hysteresis loop. The secant modulus of the nth hysteresis loop is defined as the dynamic elastic modulus E c , N of the sample under cyclic vibration. This is calculated as shown in Equation (3):
E c , N = q i , m a x q i , m i n ε i , m a x ε i , m i n
The damping ratio D of the sample can be calculated according to Equation (4):
D = S a b c d π S A B C
where Sabcd is the area of the hysteresis loop abcd and SABC is the area of triangle abc.
Figure 3b shows the development pattern of the axial strain in coral sand under cyclic loading. The total axial strain of coral sand under the nth cyclic loading contains both recoverable elastic strain ε e n and unrecoverable cumulative axial strain ε p a c c , n .

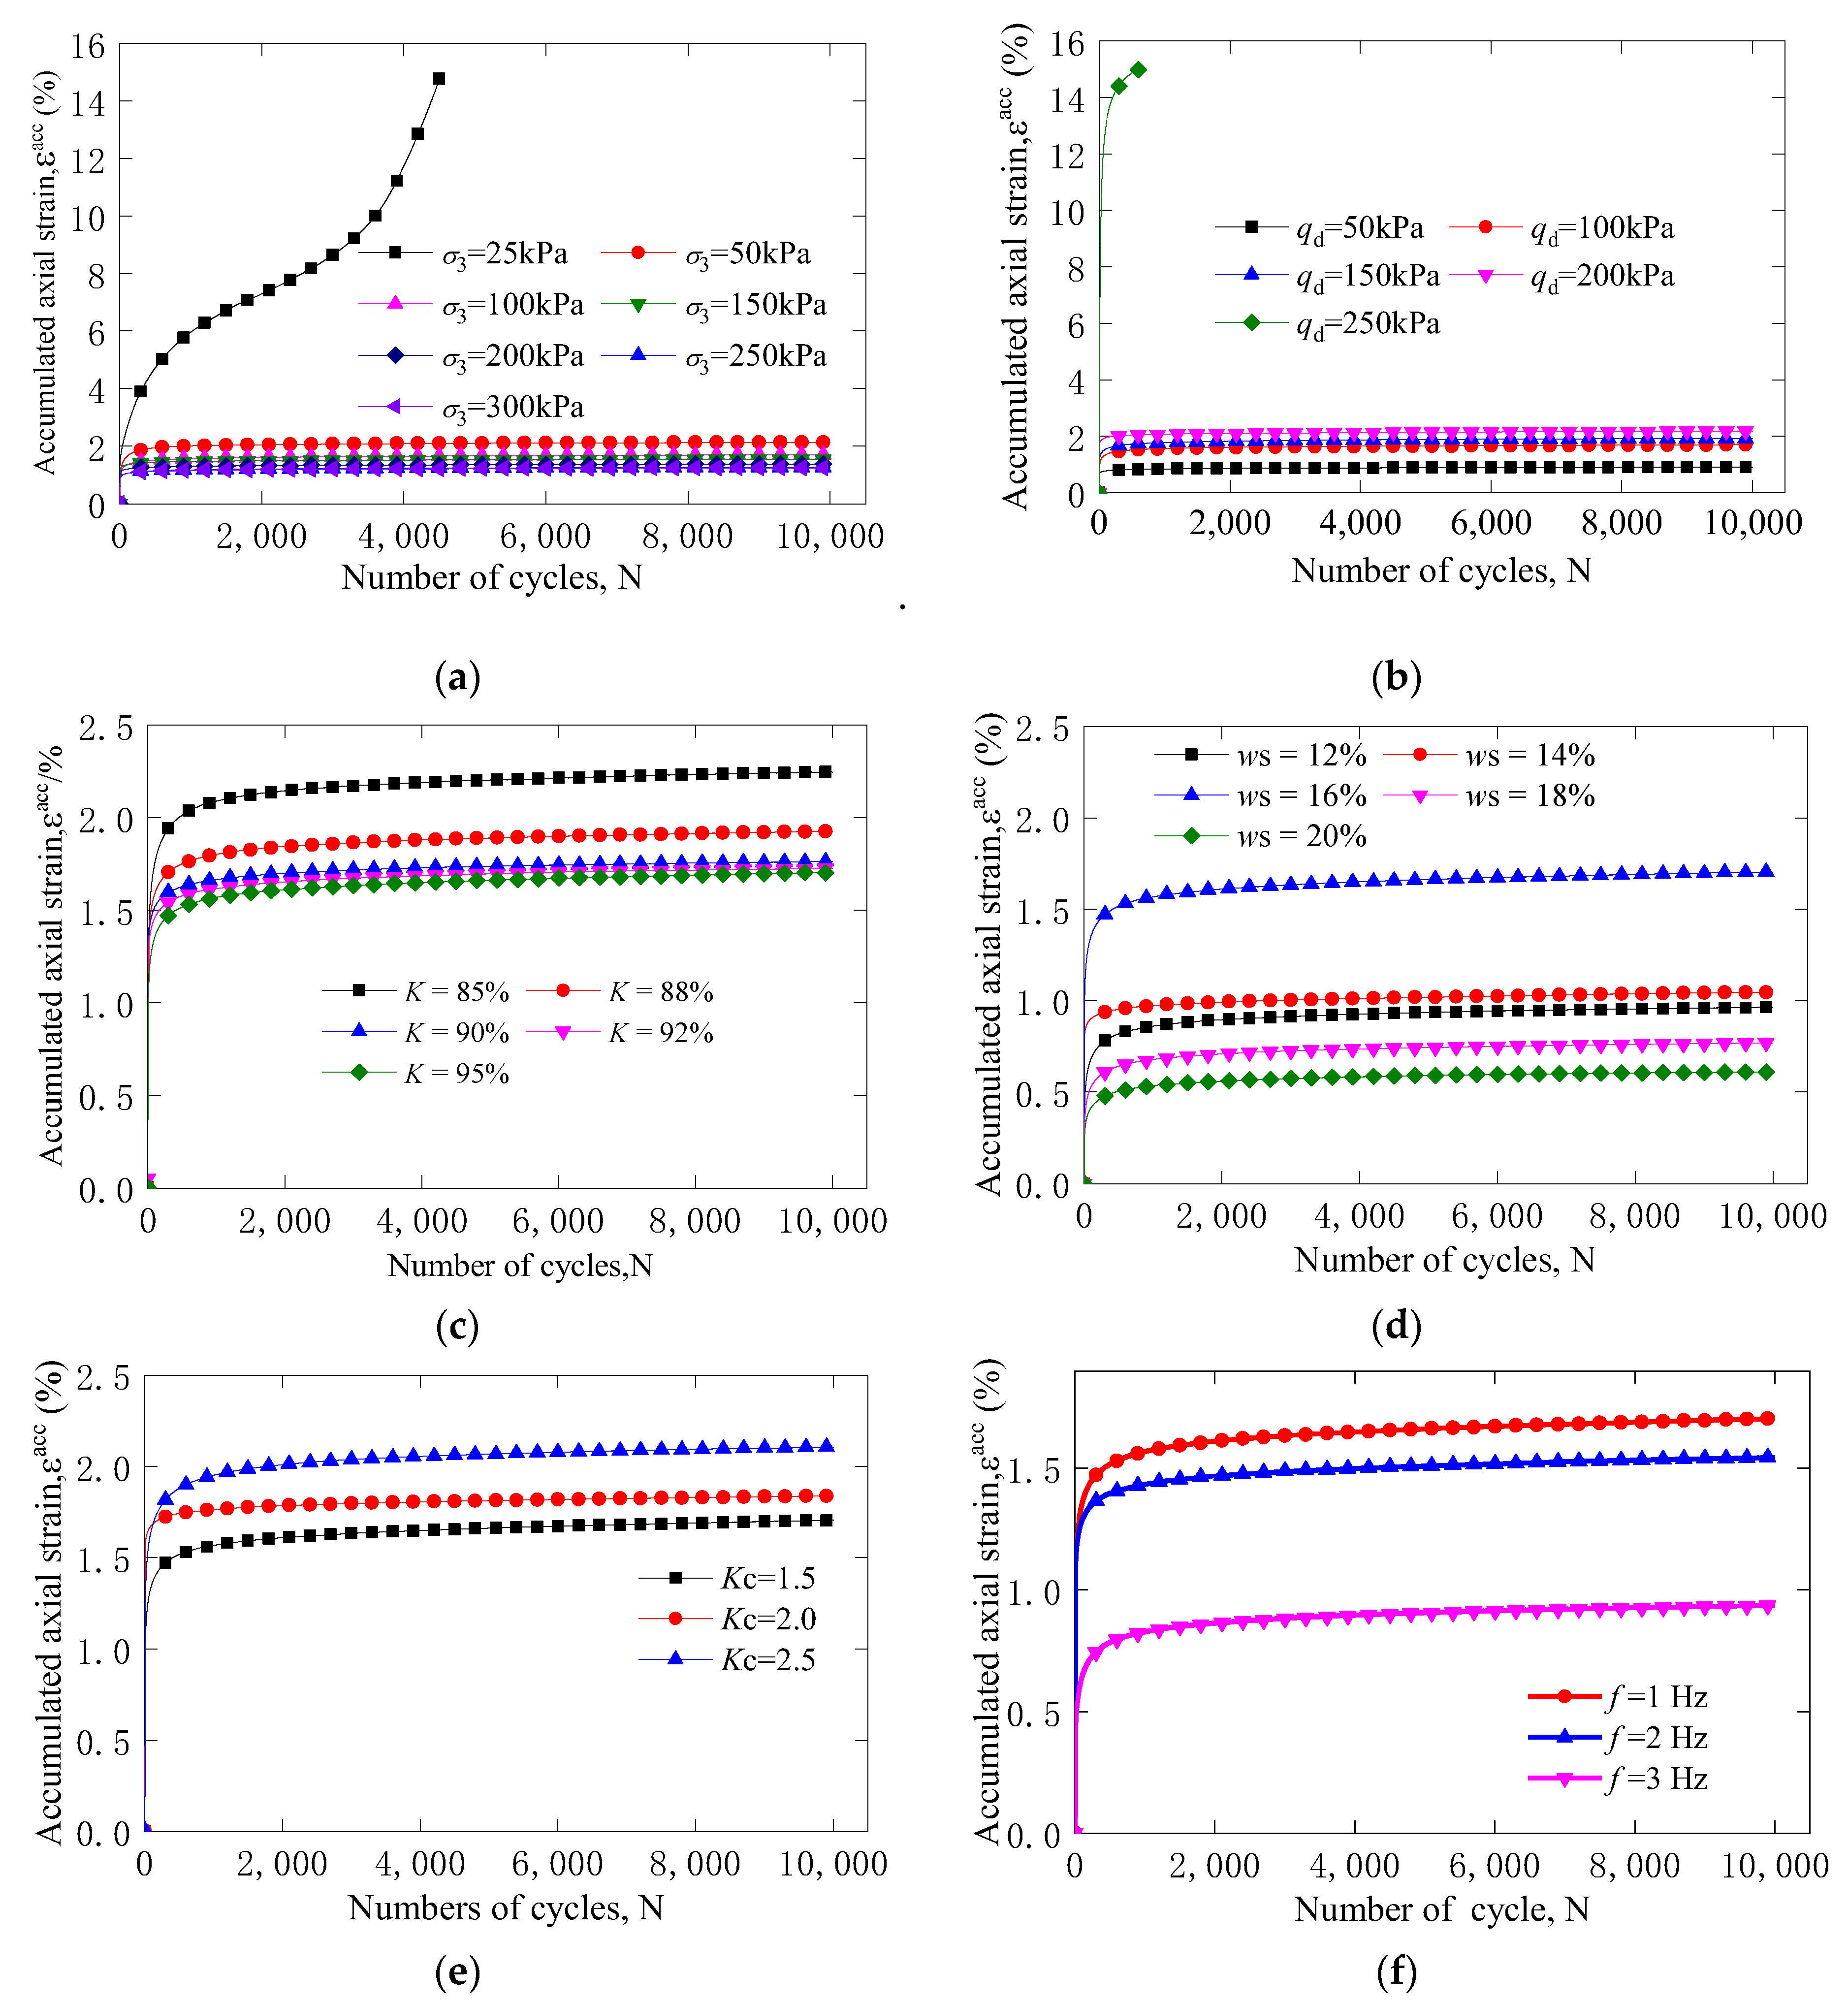
3.1. Development Law of Axial Cumulative Strain

Figure 4 shows the relationship curve between the axial cumulative strain and vibration time in calcareous sand under different confining pressures, stress ratios, compactness, moisture contents, and load vibration frequencies and amplitudes. This shows that the relationship between the axial strain and vibration times of calcareous sand subgrade can be divided into two types: stable and failure. For the stable type, the cumulative axial strain slowly and nonlinearly increases, tending to be stable when the number of vibrations is greater than 1000; for the failure type, the cumulative axial strain rapidly increases with the increase of loading times until failure.
As shown in Figure 4a, at a confining pressure of 25 kPa, the axial cumulative strain of the sample is destructive, whereas confining pressures of 50, 100, 150, 200, 250, and 300 kPa are associated with an axial cumulative strain between 1% and 2%, which corresponds to a stable state. Figure 4b demonstrates that load amplitudes of 50, 100, 150, and 200 kPa are associated with an axial cumulative strain between 0.5% and 2%. When the vibration load amplitude reaches 250 kPa and the number of vibrations is 614, the axial cumulative strain reaches 15%, causing damage to the specimen. As shown in Figure 4c–e, the axial cumulative strain increases with the increasing consolidation stress ratio and decreases with the increasing vibration load frequency and compactness. Figure 4f shows that water contents between 14% and 20% cause the axial cumulative strain to increase and then decrease. When the water content reaches 16%, the axial cumulative strain is the largest, that is, 1.6%.

3.2. Development Law of Elastic Modulus

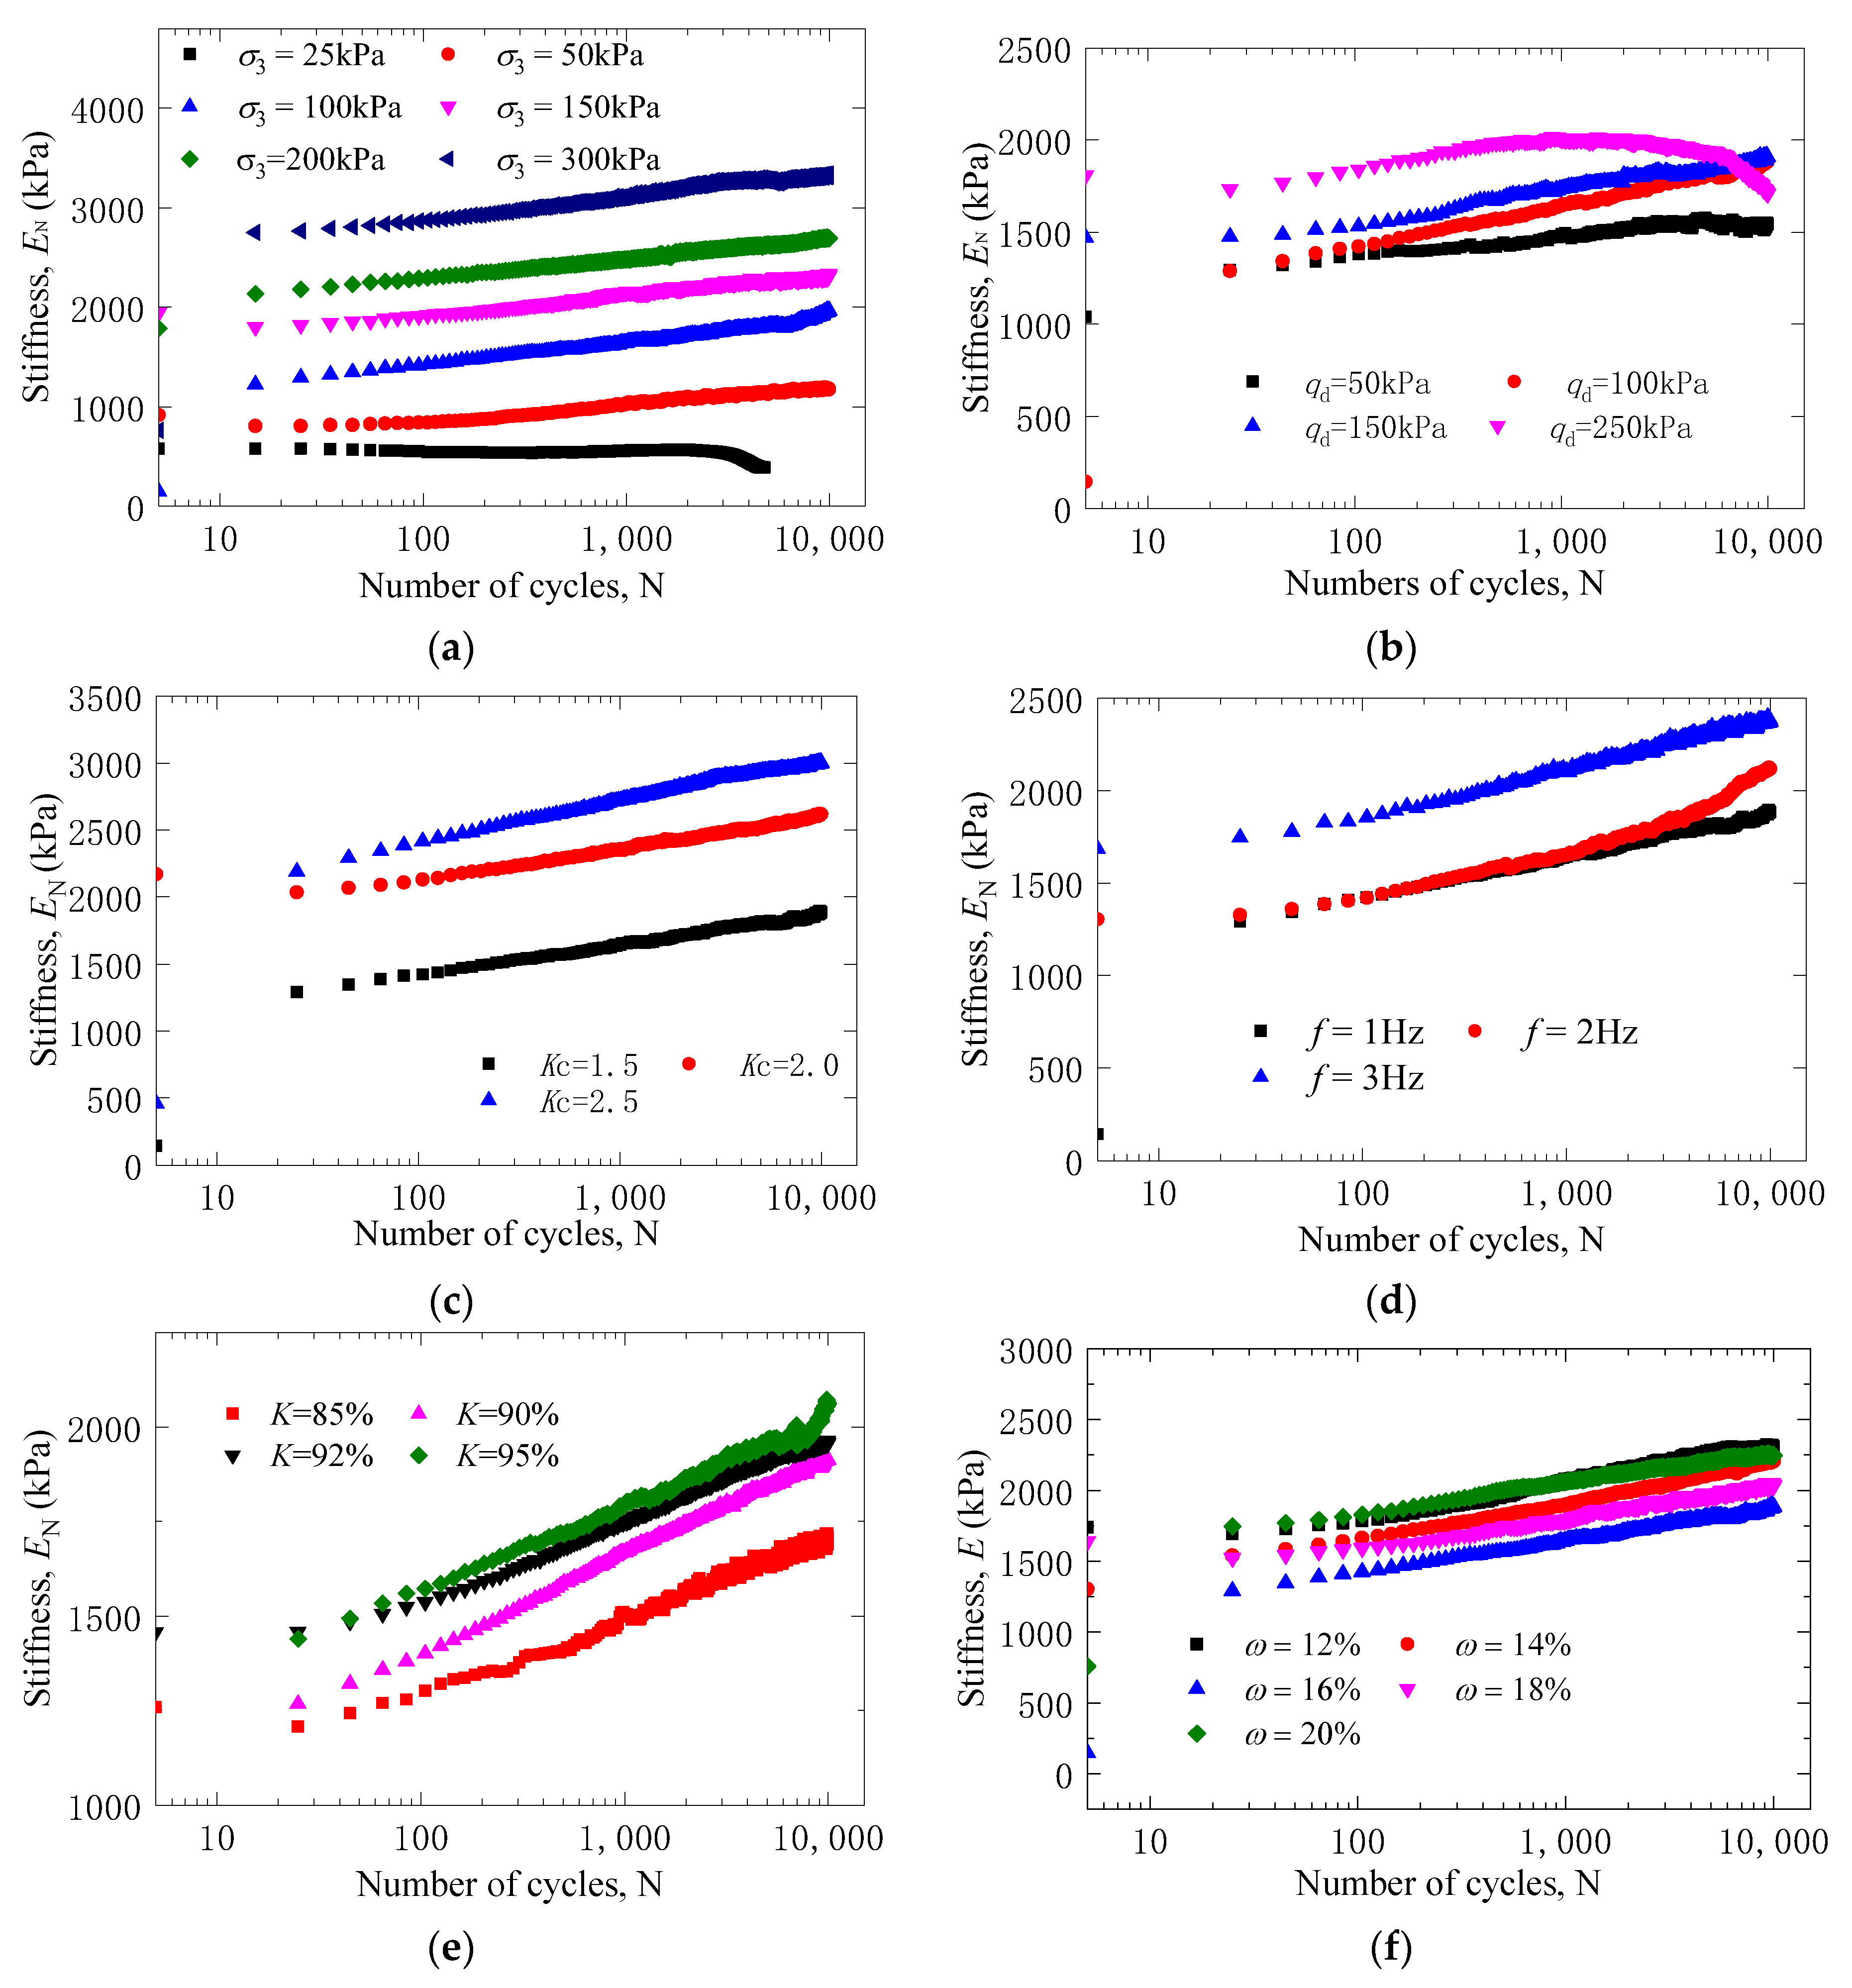
3.2.1. Influence of Confining Pressure

Figure 5 shows the relationship between the elastic modulus and the vibration times of calcareous sand under different confining pressures, stress ratios, compactness, moisture contents, and load vibration frequencies and amplitudes. As shown in Figure 5a, when the confining pressure is greater than 50 kPa, the elastic modulus of the sample linearly increases with increasing cyclic vibration time, exhibiting stable behavior; when the confining pressure is less than 50 kPa, the elastic modulus initially increases and then gradually decreases with increasing cyclic vibration time, showing destructive behavior. It can further be noted that when the confining pressure increases from 50 to 300 kPa, the initial elastic modulus of the sample increases from 750 to 2700 kPa; under the same cyclic vibration times, greater confining pressures and larger elastic modulus values are noted. This is because a greater confining pressure strengthens the deformation resistance of the sample.

3.2.2. Influence of Cyclic Load Amplitude

The cyclic load amplitude is an important index of dynamic load. As shown in Figure 5b, when the cyclic load amplitude reaches 50–200 kPa, the elastic modulus of the sample also increases. When the load amplitude is 250 kPa, the elastic modulus of the sample increases and then decreases with increasing amplitude until the sample fails. This occurs because low vibration amplitudes are associated with larger load amplitudes, increased density, and enhanced deformation resistance. When the vibration amplitude increases, the sample is initially compacted, and then gradually destroyed with increasing vibration time.

3.2.3. Influence of Consolidation Stress Ratio

The relationship curve of the elastic modulus of specimens with different consolidation stress ratios changes with the number of cycles, as shown in Figure 5c. As the consolidation stress ratio increases from 1.5 to 2.5, the initial elastic modulus increases from 1250 to 2100 kPa. Under the same cyclic vibration, a greater consolidation stress ratio is associated with a higher elastic modulus. This is because of the compaction effect of consolidation stress, the density of the soil, enhanced occlusion and friction between soil particles, and an improved ability to resist deformation.

3.2.4. Influence of Cyclic Load Frequency

The relationship curve of the elastic modulus of the specimen against the number of cycles under different cyclic loading frequencies is shown in Figure 5d; high-frequency loads under the same vibration frequency correspond to a higher elastic modulus because the load frequency directly reflects the vibration speed of the load. At higher load frequencies, the time of rearrangement and plastic flow of soil particles is shorter, and the deformation of the sample is smaller, such that the dynamic elastic modulus increases. On the contrary, the response time of particle rearrangement increases under low-frequency cyclic loads, while greater deformation occurs under similar stress levels and the elastic modulus is smaller.

3.2.5. Influence of Compaction Degree

The relationship curve of the elastic modulus of samples with different compactness versus the number of cycles is shown in Figure 5e. The elastic modulus increases as the number of cycles increases. When the compactness increases from k = 85% to 95%, the initial elastic modulus increases from 1200 to 1400 kPa, and the corresponding elastic modulus under the same vibration time also increases. This reflects the compactness of the sample: with increasing compactness, the elastic modulus also increases.

3.2.6. Influence of Water Content

Dynamic triaxial tests were carried out at five different moisture contents (12%, 14%, 16%, 18%, and 20%). The relationship curve of the elastic modulus versus the cycle time is shown in Figure 5f. This demonstrates that the elastic modulus of samples with different moisture contents increases with increasing cyclic vibration time. Under the same cyclic vibration time, when the optimal moisture content is 16%, the minimum elastic modulus of the sample is 1250 kPa. When the moisture content is below the optimal level, the elastic modulus decreases with the increasing moisture content, but when the moisture content is higher than the optimal level, the elastic modulus increases with increasing moisture content.

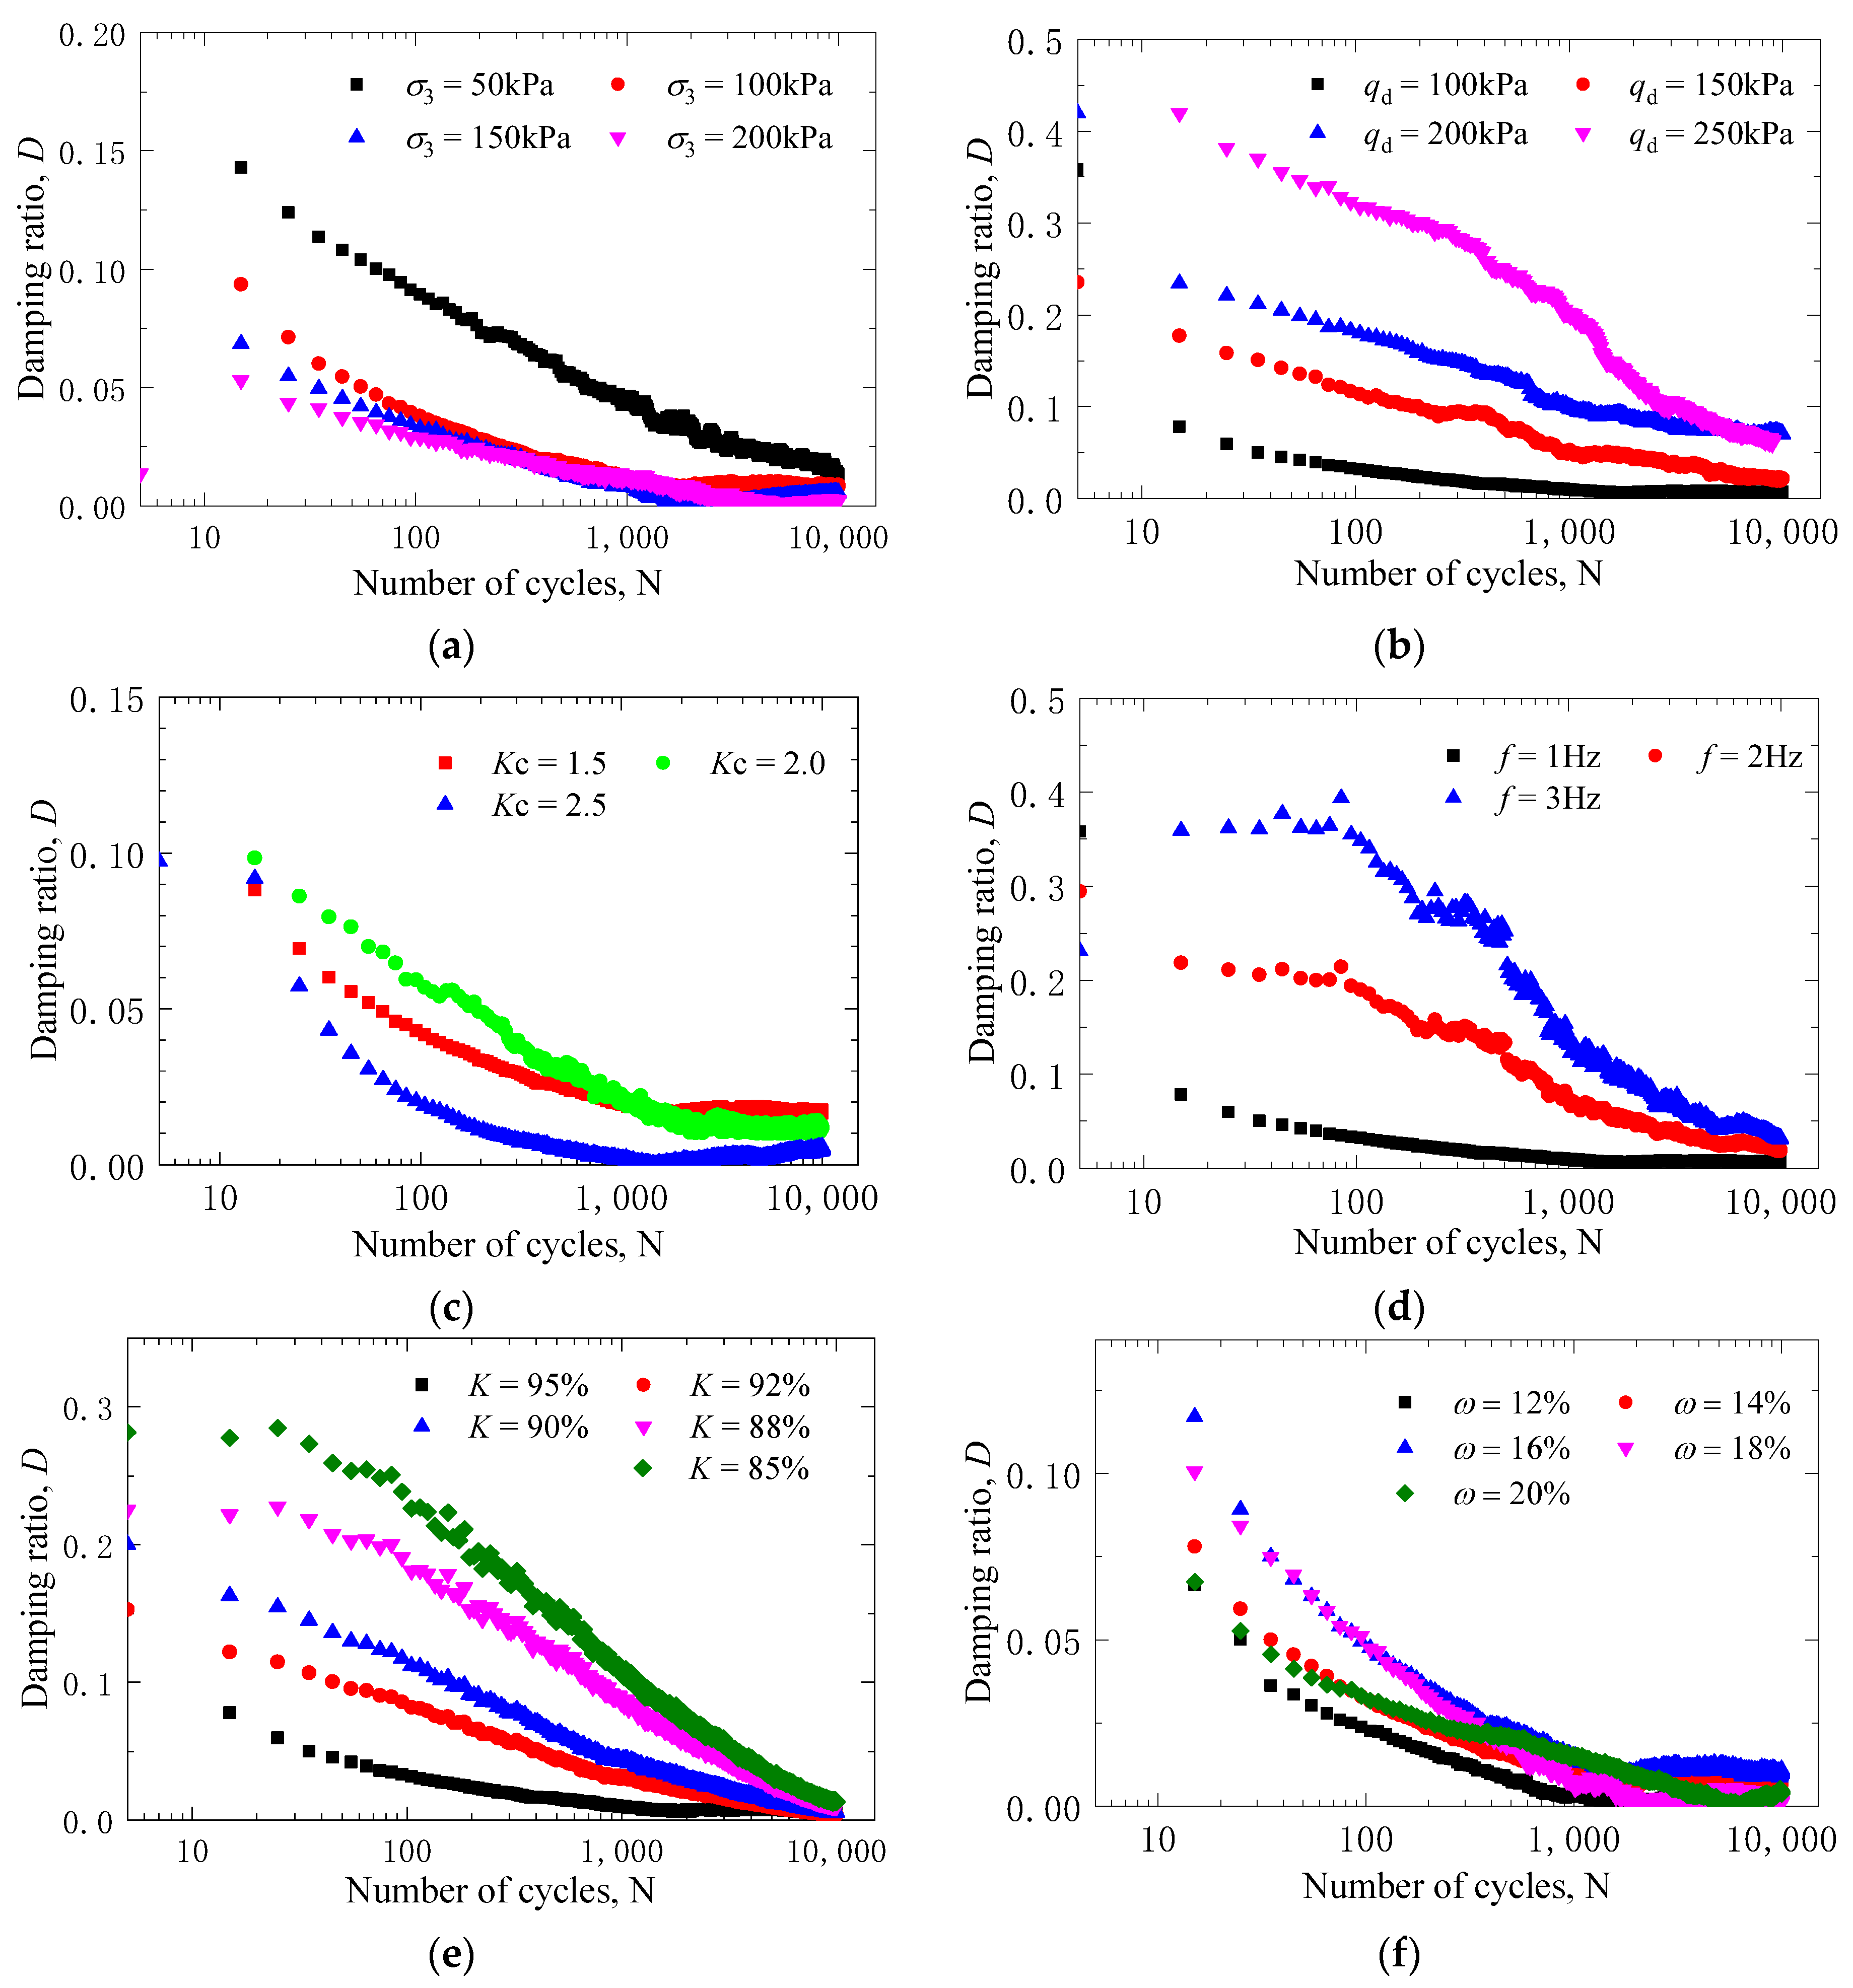
3.3. Development Law of Damping Ratio

3.3.1. Influence of Confining Pressure

The variations in the damping ratio of the confining pressure for specimens according to the cyclic loading time are shown in Figure 6a. In general, an increase in the number of loading cycles causes the damping ratio to gradually decrease. For the same number of vibrations, smaller confining pressures are associated with larger damping ratios and greater rates of damping ratio reduction. When the number of cycles increases to more than 5000, the damping ratio tends to be stable and less than 0.05. When the transverse restraint of the specimen is strong, soil particles more closely occlude, and lower energy dissipation is observed under the same dynamic load.

3.3.2. Influence of Cyclic Load Amplitude

The cyclic load amplitude is an important index of dynamic load. As shown in Figure 6b, when the cyclic load amplitude reaches 50–200 kPa, the elastic modulus of the sample also increases. When the load amplitude is 250 kPa, the elastic modulus of the sample increases and then decreases with an increase in amplitude until failure occurs. This is because low vibration amplitudes are associated with larger load amplitudes, increased density, and enhanced deformation resistance. When the vibration amplitude increases, the sample is initially compacted and then gradually destroyed with an increase in vibration time.

3.3.3. Influence of Consolidation Stress Ratio

The relationship curve between the elastic modulus of specimens with different consolidation stress ratios changes with the number of cycles (Figure 6c). As the consolidation stress ratio increases from 1.5 to 2.5, the initial elastic modulus increases from 1250 to 2100 kPa. Under the same cyclic vibration, a greater consolidation stress ratio is associated with a higher elastic modulus. This is because of the compactness effect of consolidation stress, soil density, enhanced occlusion and friction between soil particles, and improved ability to resist deformation.

3.3.4. Influence of Cyclic Load Frequency

The variations in the damping ratio with the number of loading cycles under different frequency loadings are shown in Figure 6d. It can be seen that the load frequency has an obvious effect on the damping ratio of the sample. When the cyclic load frequency decreases from 3 to 1 Hz, the initial damping ratio of the sample decreases from 0.35 to 0.1. At the same cyclic vibration time, larger load frequencies correspond to larger damping ratios. However, increasing the cyclic vibration time causes the damping ratio of different samples to gradually decrease to a stable value. The frequency mainly reflects the speed of load action. Lower frequencies denote that the load is closer to a static load. Low-frequency loads can effectively transfer more energy and reduce energy dissipation, such that a low-frequency load corresponds to a low damping ratio.

3.3.5. Influence of Compaction Degree

The influence of the damping ratio of specimens with different compactness on the cyclic loading time is shown in Figure 6e. Dynamic triaxial tests were conducted for samples with compactness of 85%, 88%, 90%, 92%, and 95%. The results of these tests demonstrate that a decrease in compactness from 95% to 85% causes the initial damping ratio of the sample to decrease from 0.3 to 0.1. This shows that the damping ratio of a high-pressure compactness specimen is lower than that of a low-pressure compactness specimen, whereas the damping ratio decreases with increasing cyclic vibration time. This is because higher compactness causes denser soil particles to become occluded, and smaller residual deformation to occur under cyclic loads. As the cyclic vibration time of the load increases, the sample becomes gradually compacted, and the damping ratio decreases until the compactness of the sample becomes stable.

3.3.6. Influence of Water Content

The influence of the damping ratio of samples with different moisture contents on the cyclic loading time is shown in Figure 6f. In general, the damping ratio of the sample reaches its maximum at the optimal moisture content of 16%, at which time the initial damping ratio also reaches its maximum value of 0.12. When the moisture content is lower than the optimal moisture content, the damping ratio of the sample increases with increasing moisture content. When the moisture content is higher than the optimal moisture content, the damping ratio of the sample decreases with increasing moisture content. This is primarily because low moisture contents and relatively high density correspond to a large particle bite and small load energy dissipation under cyclic loading. The increasing moisture content results in soil particles becoming relatively prone to particle reorganization and plastic flow under pore water lubrication. This causes a gradual increase in the residual deformation and nonlinearity of the sample and an increased damping ratio; when the moisture content is high, the pore water pressure of the sample increases. The residual deformation of the soil skeleton under effective stress is small, whereas the damping ratio is relatively large.

4. Evolution Model

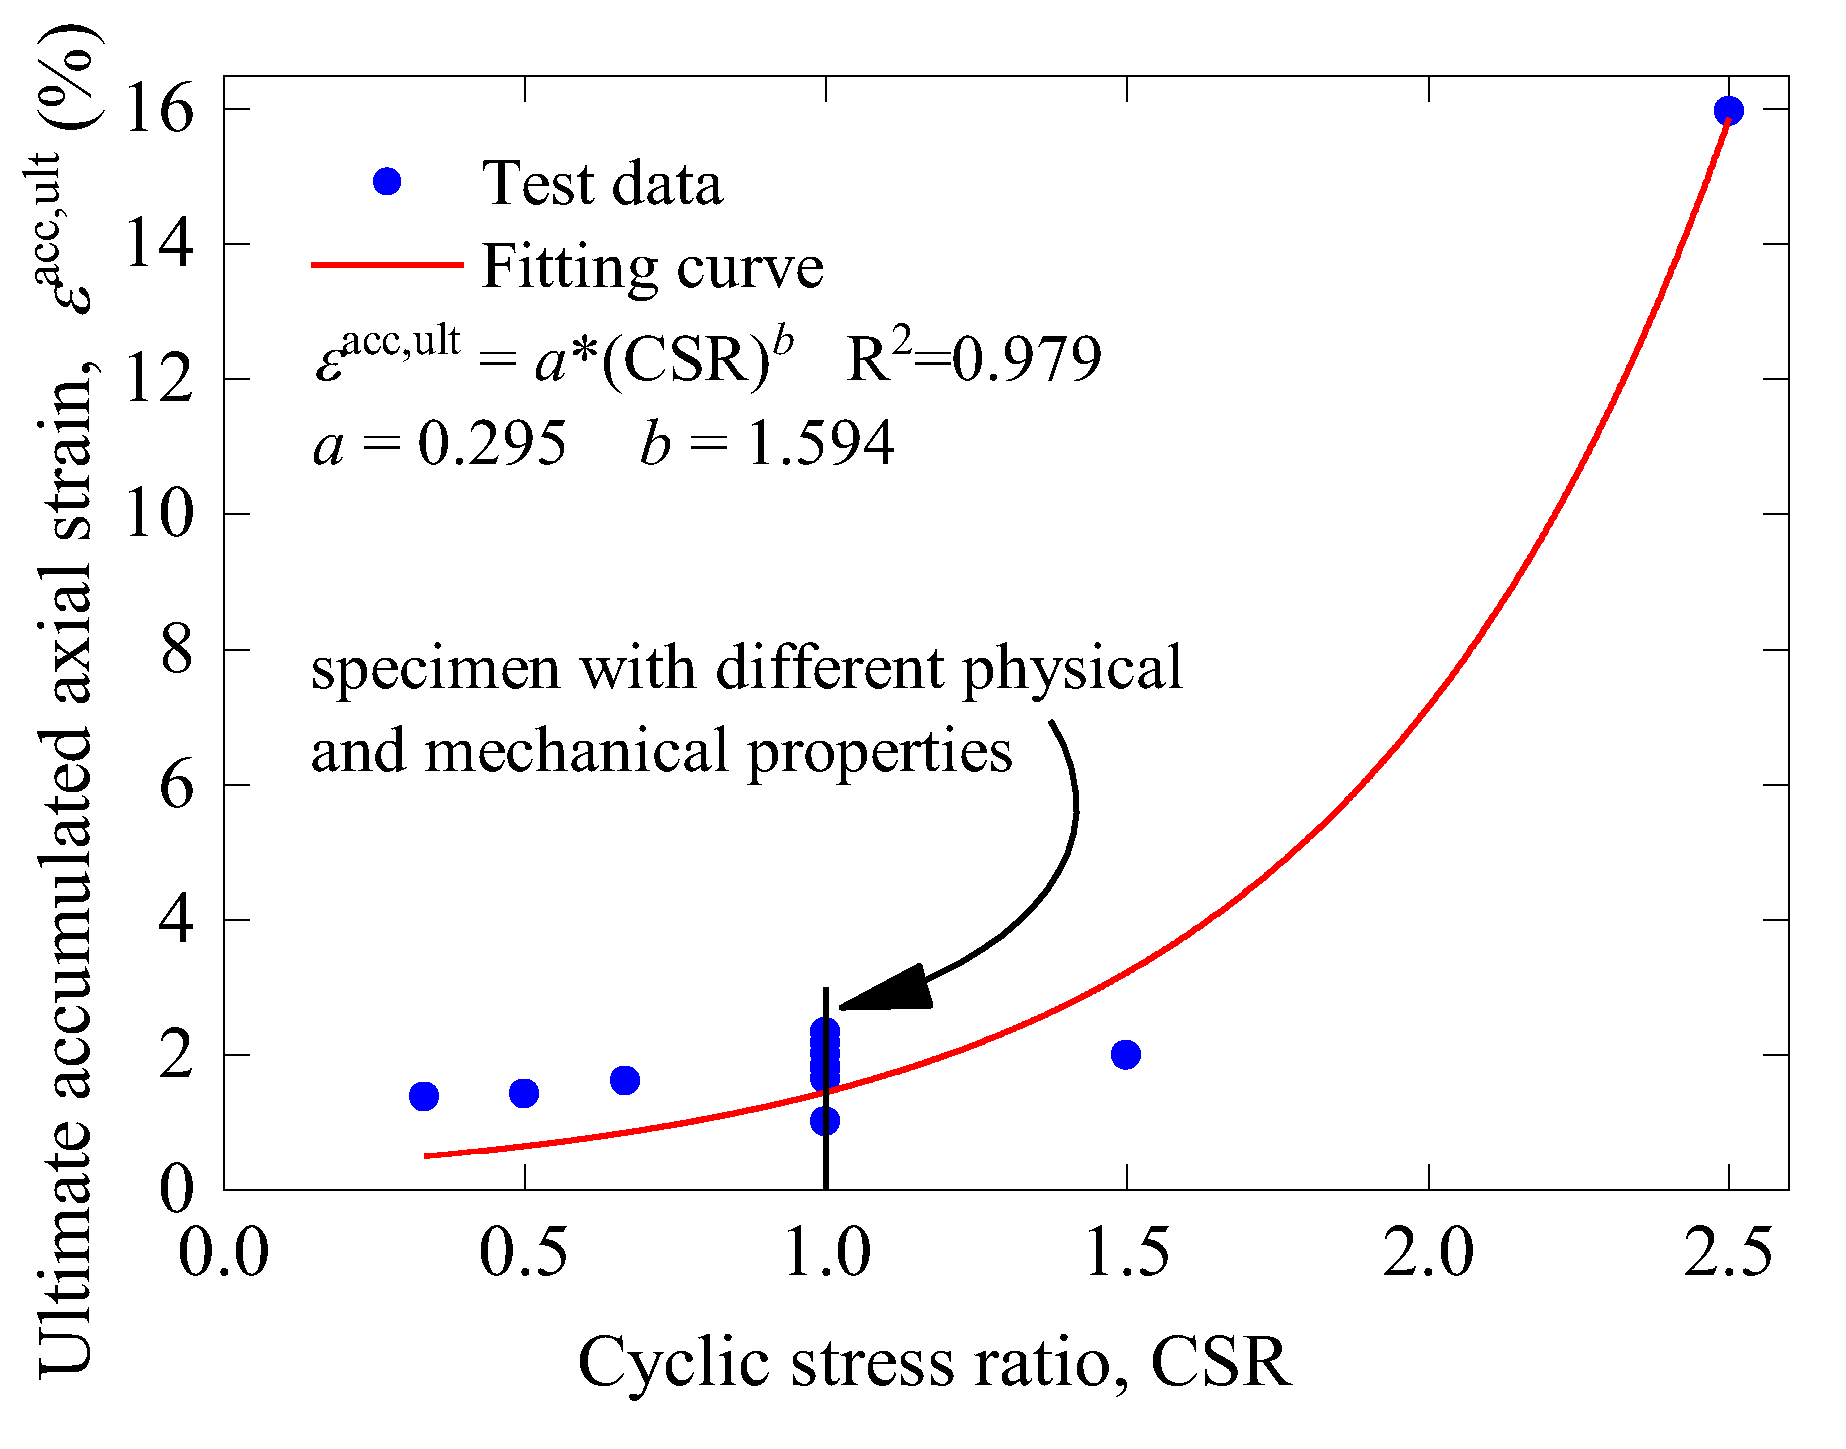
4.1. Normalized Model of Permanent Deformation

In practical engineering, the subgrade soil of an airport runway must be stable and resist deformation under long-term cyclic loading, such that its permanent deformation eventually tends to a smaller stable value. As shown in Equations (5) and (6), the hyperbolic model established by Zhang Feng et al. [22] can be used to describe the axial cumulative strain of the specimen as follows:
ε a c c , N = ( N C A + B N C ) 1 C
where the loading number N tends to be positive infinity and the permanent deformation of the specimen under cyclic loading can be obtained according to Equation (2), as shown in Equation (3):
ε a c c , u l t = ( 1 B ) 1 C
where ε a c c , N is the axial cumulative strain of the specimen under the nth vibration, and ε a c c , u l t is the permanent strain of the specimen. A, B, and C are regression parameters obtained by linear regression, whose values are related to the stress conditions (such as confining pressure and cyclic load characteristics) and the physical and mechanical properties (such as density, moisture content, and pre-consolidation stress) of the specimen.
Figure 7 shows the permanent deformation of coral sand samples with different physical and mechanical properties under different load conditions. For the same stress level, the deformation of samples with different physical and mechanical properties exhibits good consistency, such that a permanent deformation of approximately 2% is observed. We therefore assume that the compactness, water content, consolidation stress ratio, and load frequency of samples are important parameters to consider when studying permanent deformation characteristics. The permanent deformation of coral sand subgrade soil depends on the amplitude of the cyclic load and the confining pressure. The cyclic stress ratio ( C S R ) parameter is introduced to analyze and predict permanent deformation. The C S R is defined as the ratio of cyclic stress amplitude to confining pressure, and can be calculated as follows:
C S R = q d / σ 3
As shown in Figure 7, the relationship between the ultimate axial cumulative strain and the C S R of coral sand can be accurately fitted using an exponential function, and the model is as follows (8):
ε a c c , u l t = a C S R b
This prediction formula accurately reflects the deformation of calcareous sand subgrade soil under cyclic loading. Under low stress, coral sand exhibits better resistance to deformation and smaller permanent deformation. When the stress level increases, the sample exhibits more significant permanent deformation under cyclic loading because of the fragility and low strength of coral sand particles.

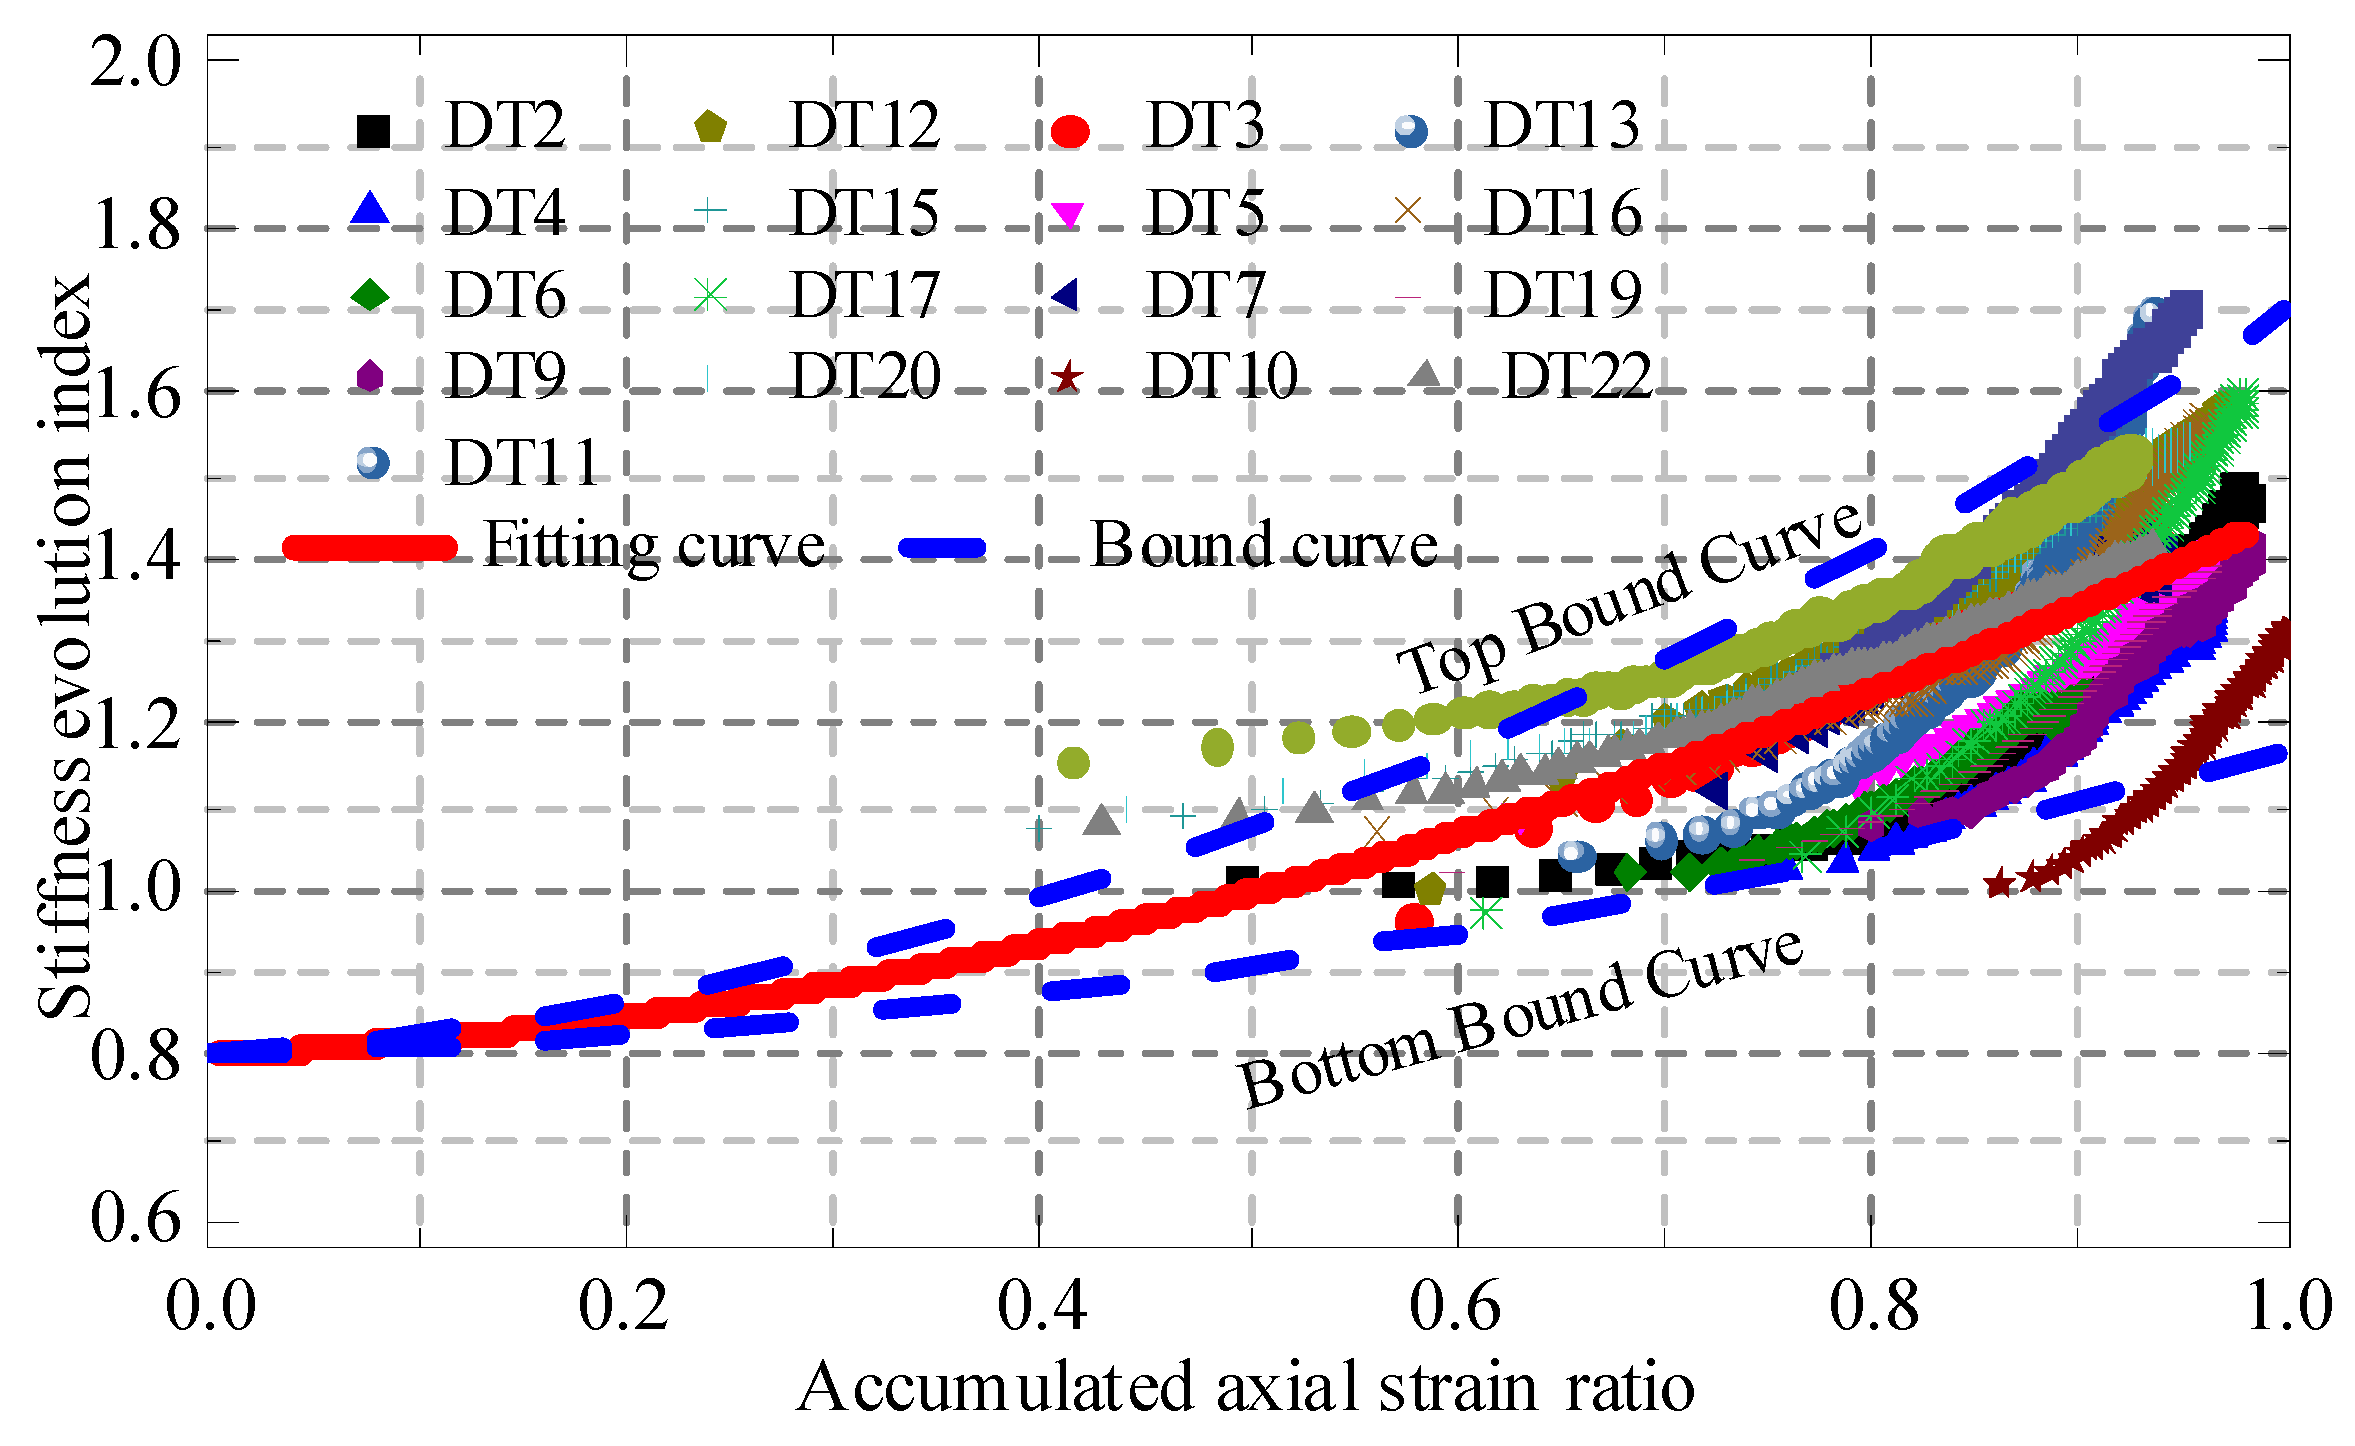
4.2. Elastic Modulus Normalization Model

According to Idriss [23], the parameter δ E , N was introduced to study the relationship between the elastic modulus and the axial cumulative strain ratio. δ E , N is defined as the ratio of the elastic modulus to the initial elastic modulus under a certain cycle vibration and can be calculated according to the following Equation (9):
δ E , N = E N / E 1
where E N and E 1 represent the elastic modulus and initial elastic modulus, respectively, of a specimen under a certain cyclic loading. Thus, samples with different physical and mechanical properties and cyclic loads can be normalized. Figure 8 shows the relationship between the axial cumulative strain ratio δ a c c , N   and the elastic modulus growth ratio δ E , N of different specimens. All data points occur within a specific range, and the best fit curve and the upper and lower envelope can be determined according to Equations (10)–(12):
Top bound curve:
δ E , N = 0.8 + 0.1901 δ a c c , N + 0.7127 δ a c c , N 2
Fitting curve:
δ E , N = 0.8 + 0.1271 δ a c c , N + 0.5278 δ a c c , N 2
Bottom bound curve:
δ E , N = 0.8 + 0.0693 δ a c c , N + 0.3016 δ a c c , N 2

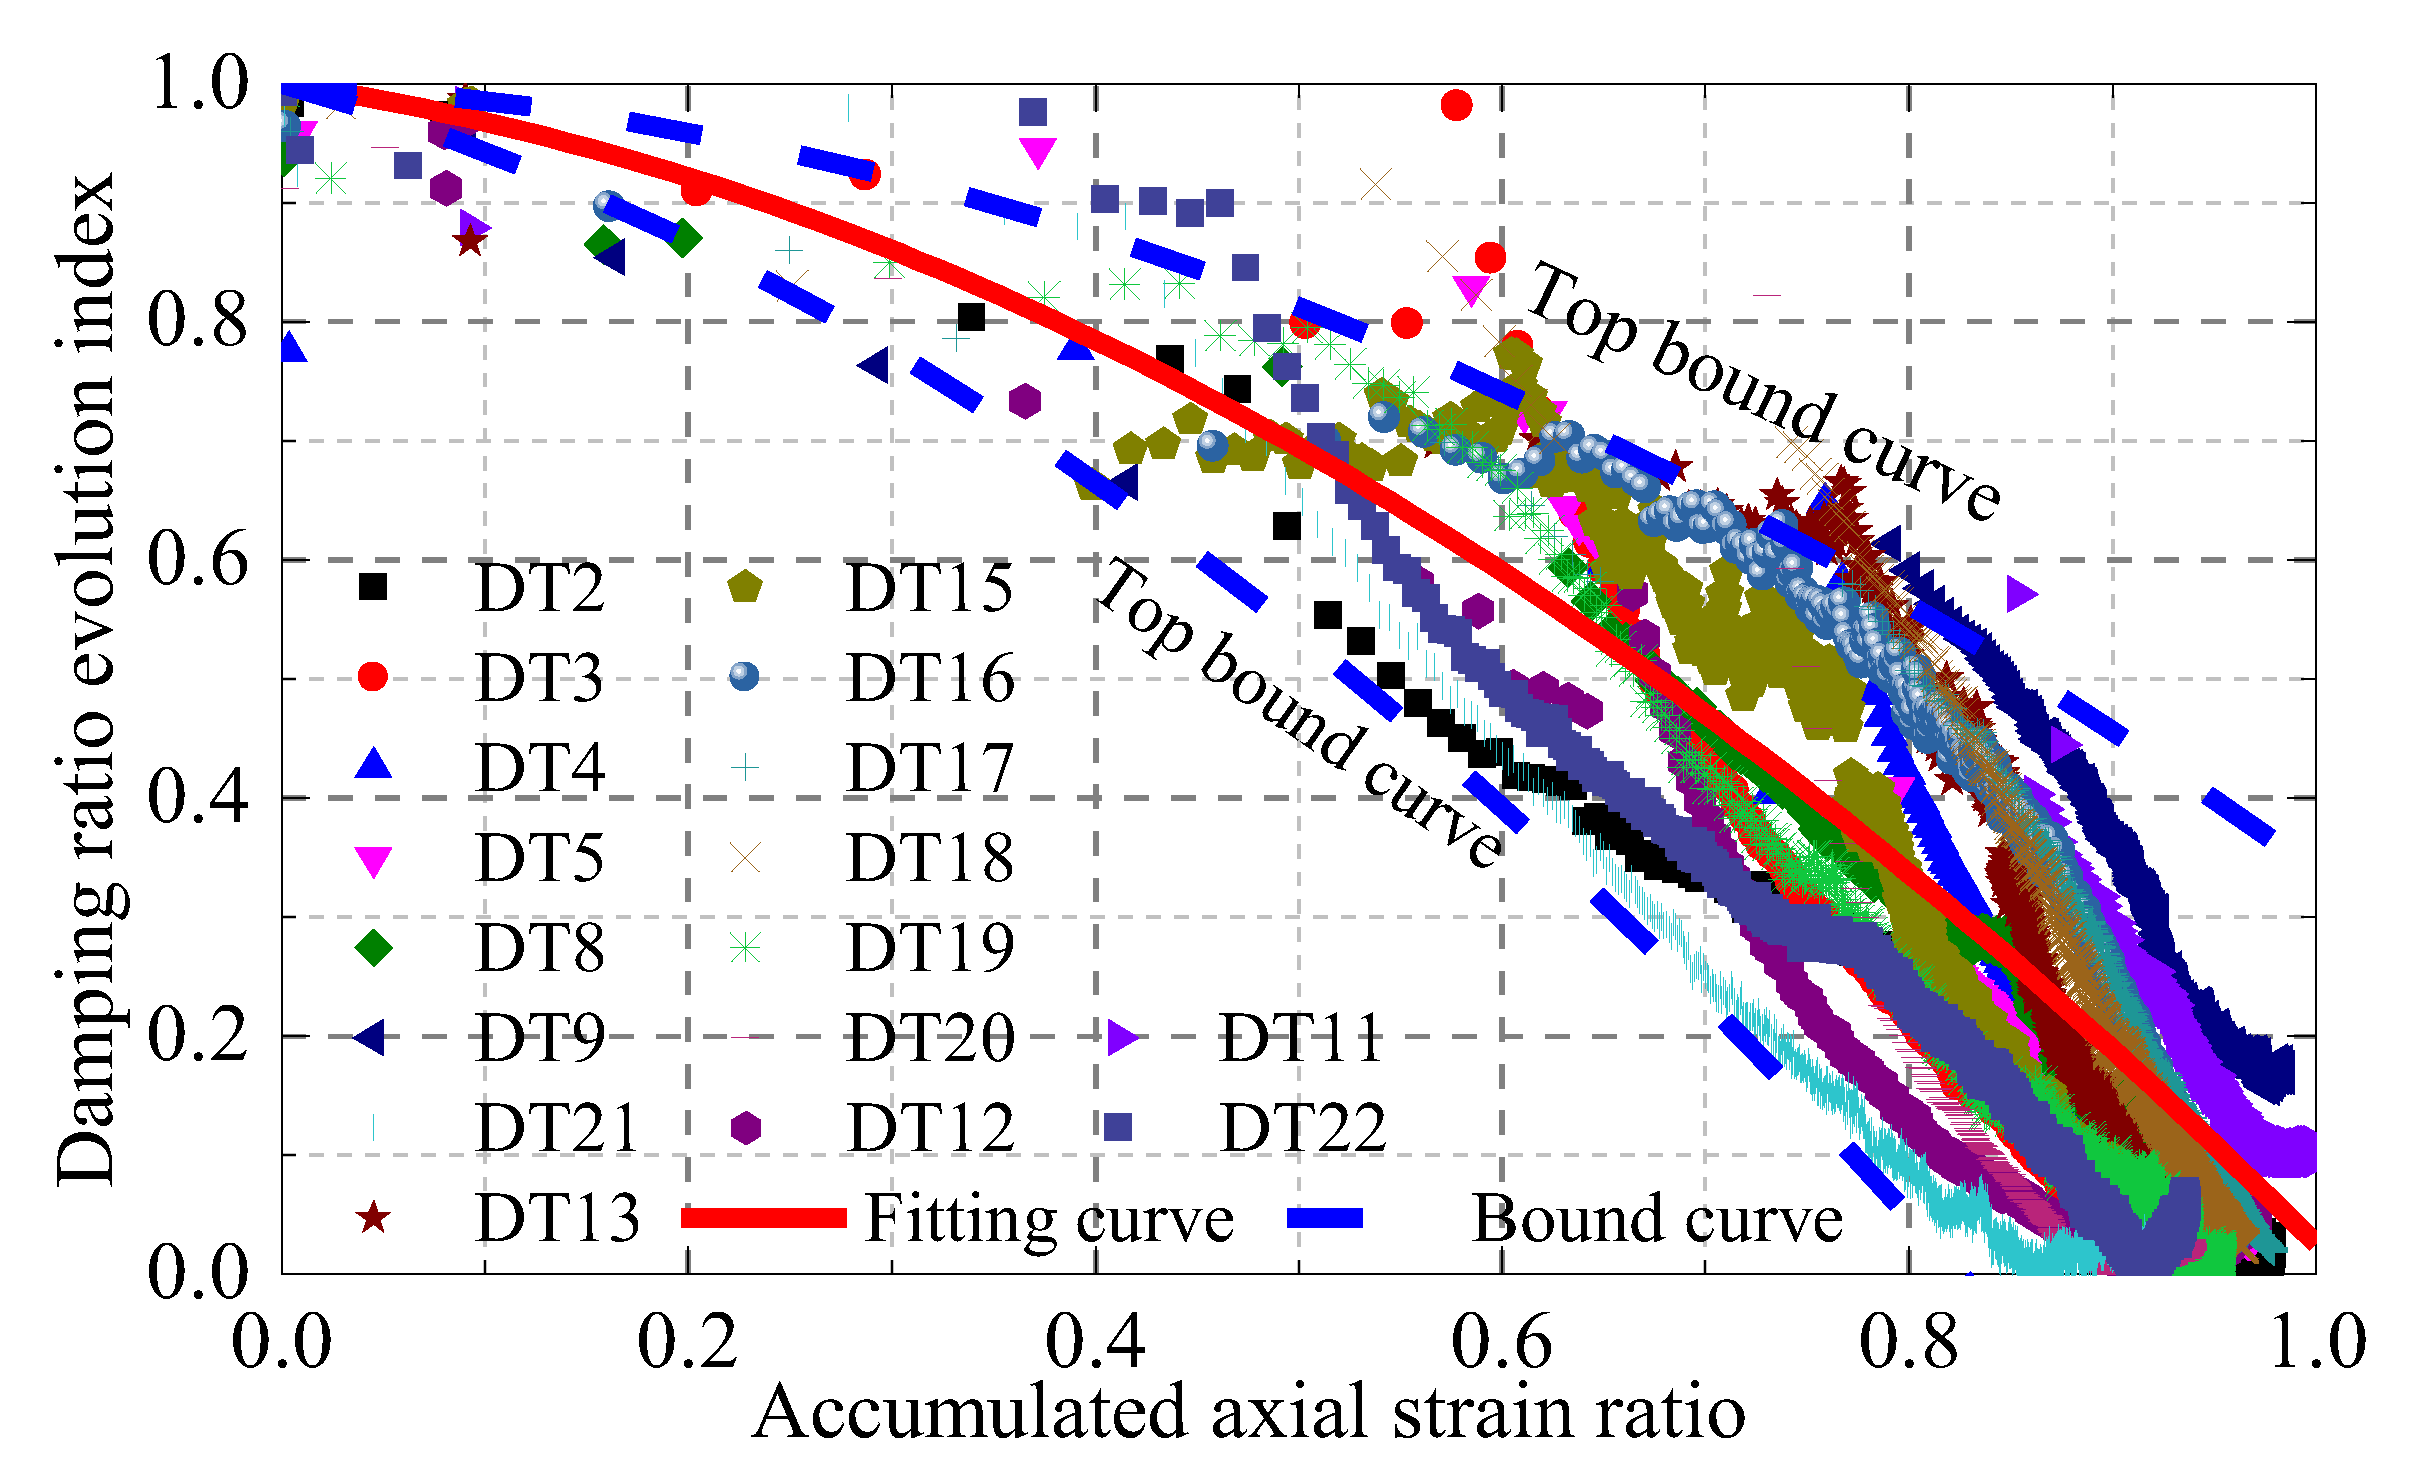
4.3. Damping Ratio Normalization Model

According to research by Ling Xianzhang [24], the parameter   δ D , N was introduced to study the relationship between the elastic modulus and the axial cumulative strain ratio.   δ D , N is defined as the ratio of the damping ratio to the initial damping ratio under a certain cycle vibration and can be calculated according to Equation (13):
δ D , N = D N D 1
where D N and D 1 refer to the damping ratio and initial damping ratio, respectively, of a sample under a certain cyclic loading. The normalized analysis of specimens with different physical and mechanical properties and cyclic load is conducted as shown in Figure 9, where the relationship between the axial cumulative strain ratio δ a c c , N   and the damping ratio evolution parameters δ D , N of different specimens are shown. With increasing δ a c c , N , δ D , N   gradually decreases and the test data points fall within a specific range, such that the best fit curve and the upper and lower envelope can be determined using the following Equations (14)–(16):
Top bound curve:
δ E , N = 1 0.0884 δ a c c , N 0.5729 δ a c c , N 2
Fitting curve:
δ E , N = 1 0.2473 δ a c c , N 0.7268 δ a c c , N 2
Bottom bound curve:
δ E , N = 1 0.4834 δ a c c , N 0.8829 δ a c c , N 2

5. Conclusions

In this study, the evolution of the dynamic characteristics and deformation of coral sand samples with different confining pressure, compactness, water contents, and pre-consolidation stress under cyclic loading of different amplitudes and frequencies were studied using GDS dynamic triaxial apparatus. Based on the hyperbolic function, a model of the development of axial cumulative strain and the dynamic characteristics of coral sand subgrade soil has been established, and a relevant prediction formula has been given. The permanent deformation, elastic modulus, and damping ratio of coral sand subgrade soil under cyclic loading were predicted, and the following conclusions can be made:
(1)
The dynamic triaxial test shows that the stiffness of calcareous sand increases with increased cyclic loading, whereas the damping ratio decreases with increased cyclic loading. When cyclic loading approaches infinity, the stiffness of the sample tends to be stable, and the damping ratio becomes less than 0.05.
(2)
The initial value and rate of change of stiffness and damping ratio vary under different parameters. When the vibration number of the cyclic load is kept constant, the dynamic stress amplitude is larger, the confining pressure is lower, water and salt contents are higher, and the change of stiffness and damping ratio from the initial to the given cycle increases.
(3)
At higher dynamic stress amplitudes, the frequency is higher, the confining pressure, consolidation stress, and compactness are lower, and the moisture content is closer to its optimal value. Furthermore, the axial cumulative strain is higher, the elastic modulus is lower, and the damping ratio is higher.
(4)
The permanent deformation of the calcareous sand subgrade can be calculated by inputting the cyclic load stress. Moreover, according to the field settlement deformation monitoring data, the dynamic elastic modulus and damping ratio evolution of the subgrade can be calculated, and then the long-term service performance of the subgrade can be reasonably predicted.

Author Contributions

Investigation, writing—original draft preparation and data curation, L.Z.; formal analysis, writing—review and editing, visualization, resources, investigation, data curation, project administration, and funding acquisition, Z.W. All authors have read and agreed to the published version of the manuscript.

Funding

This research was supported by the Hainan Provincial Natural Science Foundation of China (Grant No. 421RC592), and the National Natural Science Foundation of China (Grant No. 42162024).

Data Availability Statement

The data used during the study are available from the first author and corresponding author by request.

Conflicts of Interest

The authors declare no conflict of interest.

References

  1. Shahnazari, H.; Rezvani, R. Effective parameters for the particle breakage of calcareous sands: An experimental study. Eng. Geol. 2013, 159, 98–105. [Google Scholar] [CrossRef]
  2. Wang, X.Z.; Jiao, Y.-Y.; Wang, R.; Hu, M.; Meng, Q.; Tan, F. Engineering characteristics of the calcareous sand in Nansha Islands, South China Sea. Eng. Geol. 2011, 120, 40–47. [Google Scholar] [CrossRef]
  3. Shahnazari, H.; Rezvani, R.; Tutunchian, M.A. Post-cyclic volumetric strain of calcareous sand using hollow cylindrical torsional shear tests. Soil Dyn. Earthq. Eng. 2019, 124, 162–171. [Google Scholar] [CrossRef]
  4. Wang, X.; Weng, Y.; Wei, H.; Meng, Q.; Hu, M. Particle obstruction and crushing of dredged calcareous soil in the Nansha Islands, South China Sea. Eng. Geol. 2019, 261, 105274. [Google Scholar] [CrossRef]
  5. Wang, X.; Zhu, C.-Q.; Wang, X.Z. Experimental study on the coefficient of lateral pressure at rest for calcareous soils. Mar. Georesour. Geotechnol. 2020, 38, 989–1001. [Google Scholar] [CrossRef]
  6. Chen, W.; Jeng, D.; Chen, W.; Chen, G.; Zhao, H. Seismic-induced dynamic responses in a poro-elastic seabed: Solutions of different formulations. Soil Dyn. Earthq. Eng. 2020, 131, 106021. [Google Scholar] [CrossRef]
  7. Yu, J.; Zhu, Y.; Yao, W.; Liu, X.; Ren, C.; Cai, Y.; Tang, X. Stress relaxation behaviour of marble under cyclic weak disturbance and confining pressures. Measurement 2021, 182, 109777. [Google Scholar] [CrossRef]
  8. Datta, M.; Rao, G.V.; Gulhati, S. Development of pore water in a dense calcareous sand under repeated compressive stress cydes. In Proceedings of the International Symposium on Soils under Cyclic and Transient Loading, Suansea, Wales, UK, 7–11 January 1980; pp. 33–47. [Google Scholar]
  9. Knight, K. Contribution to the performance of calcareous sands under cyclic loading. In Proceedings of the International Conference on Calcareous Sediments, Perth, WA, Australia, 15–18 March 1988; pp. 877–880. [Google Scholar]
  10. Kaggwa, W.S.; Poulos, H.G.; Carter, J.P. Response of carbonate sediments under cyclic triaxial test conditions. In Proceeding of the 1st International Conference on Calcareous Sediments, Perth, WA, Australia, 15–18 March 1988; Volume 1, pp. 97–107. [Google Scholar]
  11. Haizhen, Y.; Ren, W. The cyclic strength test research on calcareous sand. Rock Soil Mech. 1999, 4, 3–5. (In Chinese) [Google Scholar]
  12. Jianguo, L.; Ren, W.; Haizhen, Y. Experimental research on effect of initial principal stress orientation on dynamic properties of calcareous sand. Rock Soil Mech. 2005, 5, 723–727. (In Chinese) [Google Scholar]
  13. Jianguo, L. Experimental Research on Dynamic Behavior of Saturated Calcareous Sand under Wave Loading; Institute of Rock and Soil Mechanics, Chinese Academy of Sciences: Wuhan, China, 2005. (In Chinese) [Google Scholar]
  14. Coop, M.R.; Sorensen, K.K.; Bodas Freitas, T.M.; Georgoutsos, G. Particle breakage during shearing of a carbonate sand. Géotechnique 2004, 54, 157–163. [Google Scholar] [CrossRef]
  15. Donohue, S.; O’sullivan, C.; Long, M. Particle breakage during cyclic triaxial loading of a carbonate sand. Géotechnique 2009, 59, 477–482. [Google Scholar] [CrossRef]
  16. Li, X.; Liu, J. One-dimensional compression feature and particle crushability behavior of dry calcareous sand considering fine-grained soil content and relative compaction. Bull. Eng. Geol. Environ. 2021, 80, 4049–4065. [Google Scholar] [CrossRef]
  17. Gang, W.; Jingjing, Z.; Xing, W. Evolution of particle crushing of carbonate sands under cyclic triaxial stress path. Chin. J. Geotech. Eng. 2019, 41, 755–760. (In Chinese) [Google Scholar]
  18. Shaoheng, H.; Zhi, D.; Tangdai, X. Long-term behaviour and degradation of calcareous sand under cyclic loading. Eng. Geol. 2020, 276, 105756. [Google Scholar] [CrossRef]
  19. Sizhen, Z. Dynamic Analysis of Mining Tunnel and Airport Runway under Aircraft Moving Loads. Ph.D. Thesis, Beijing Jiaotong University, Beijing, China, 2012. (In Chinese). [Google Scholar]
  20. Lei, Q. Study on Deformation of Airport Pavement Foundation under the Action of Airport Loads and Groundwater. Ph.D. Thesis, Zhengzhou University, Zhengzhou, China, 2017. (In Chinese). [Google Scholar]
  21. Sujie, Z. Study on Dynamic Response and Deformation of Airport Pavement Foundation under the Action of Aircraft Loads. Ph.D. Thesis, Nanjing University of Aeronautics and Astronautics, Nanjing, China, 2018. (In Chinese). [Google Scholar]
  22. Feng, Z. Heavy Track Induced Dynamic Response and Permanent Deformation of Subgrade in Deep Seasonally Frozen Region. Ph.D. Thesis, Harbin Institute of Technology, Harbin, China, 2012. (In Chinese). [Google Scholar]
  23. Idriss, I.M.; Dobry, R.; Singh, R.D. Nonlinear behavior of soft clays during cyclic loading. J. Geotech. Eng. Div. ASCE 1978, 104, 1427–1447. [Google Scholar] [CrossRef]
  24. Ling, X.; Li, Q.; Wang, L.; Zhang, F.; An, L.; Xu, P. Stiffness and damping ratio evolution of frozen clays under long-term low-level repeated cyclic loading: Experimental evidence and evolution model. Cold Reg. Sci. Technol. 2013, 86, 45–54. [Google Scholar] [CrossRef]
Figure 1. Grain size distribution curve of calcareous sand sample.
Jmse 10 01806 g001
Figure 2. Schematic of the loading process.
Jmse 10 01806 g002
Figure 3. Schematic of axial stress–strain under cyclic loading.
Jmse 10 01806 g003
Figure 4. Accumulated axial strain under different test conditions. (a) Accumulated axial strain versus number of loading cycles under different confining pressures. (b) Accumulated axial strain versus number of loading cycles under different loading amplitudes. (c) Accumulated axial strain versus number of loading cycles under different K c (d) Accumulated axial strain versus number of loading cycles under different loading frequencies. (e) Accumulated axial strain versus number of loading cycles under different densities,   K . (f) Accumulated axial strain versus number of loading cycle under different moisture content.
Jmse 10 01806 g004
Figure 5. Stiffness under different testing conditions. (a) Stiffness versus number of cyclic loading under different confining pressures. (b) Stiffness versus number of cyclic loading under different loading amplitudes. (c) Stiffness versus number of cyclic loading under different Kc. (d) Stiffness versus number of cyclic loading under different loading frequencies. (e) Stiffness versus number of cyclic loading under different relative densities, K. (f) Stiffness versus number of cyclic loading under different moisture content.
Jmse 10 01806 g005
Figure 6. Damping ratio under different test conditions. (a) Damping ratio versus number of cyclic loading under different confining pressures. (b) Damping ratio versus number of cyclic loading under different loading amplitudes. (c) Damping ratio versus number of cyclic loading under different Kc. (d) Damping ratio versus number of cyclic loading under different loading frequencies. (e) Damping ratio versus number of cyclic loading under different densities, K. (f) Damping ratio versus number of cyclic loading under different moisture content.
Jmse 10 01806 g006
Figure 7. The ultimate accumulated axial strain versus the cyclic stress ratio.
Jmse 10 01806 g007
Figure 8. Relationship between the accumulated axial strain ratio and the stiffness evolution index.
Jmse 10 01806 g008
Figure 9. Relationship between the accumulated axial strain ratio and the damping ratio evolution index.
Jmse 10 01806 g009
Table 1. Summary of cyclic triaxial test conditions.
Sample NumberConfining PressureCyclic
Loading
Consolidation
Stress Ratio
Relative
Density
Loading
Frequency
Moisture
Content
σ 3 / kPa q d / kPa K c K F/HzWs/%
DT-1251001.595116
DT-2501001.595116
DT-31001001.595116
DT-41501001.595116
DT-52001001.595116
DT-63001001.595116
DT-7100501.595116
DT-81001501.595116
DT-91002001.595116
DT-101002501.595116
DT-11100100295116
DT-121001002.595116
DT-131001001.585116
DT-141001001.588116
DT-151001001.590116
DT-161001001.592116
DT-171001001.595216
DT-181001001.595316
DT-191001001.595112
DT-201001001.595114
DT-211001001.595118
DT-221001001.595120
Publisher’s Note: MDPI stays neutral with regard to jurisdictional claims in published maps and institutional affiliations.

