Abstract
The keel brick wall belongs to the rural residential exterior wall unique to the southeast coastal region of China. The wooden keel inside the wall and the external tie members can improve the stability of the whole wall. However, due to the age of construction, the wooden keel inside the existing residential keel brick walls has basically rotted and lost the tie with the external members, which seriously reduces the stability of the whole wall. Moreover, the collapse of keel brick walls caused by typhoons has become more and more frequent in recent years, seriously endangering the lives and properties of residents. Therefore, it is necessary to carry out reinforcement and repair for the existing residential buildings with keel brick walls. In this paper, the keel brick walls of rural houses in Ningbo area were taken as the research object, a framework for evaluating the performance of keel brick walls against typhoons was established, tests on the lateral force resistance of keel brick walls reinforced with high ductility concrete and mortar were carried out. With the help of typhoon full-track simulation and wind field simulation technology, the 600-year near-surface typhoon wind speeds affecting Ningbo area were obtained. A joint probability distribution model of multi-directional extreme wind speed was constructed using t-Copula function to determine the mixed wind climate of Ningbo area. The extreme wind loads that keel brick walls can withstand under four types of reinforcement were finally given. The results show that the high ductility concrete reinforcement has great advantages over mortar reinforcement and avoids brittle damage of the masonry structure. The keel brick walls reinforced with single-sided mortar can withstand wind loads of a 3-year return period, the keel brick walls reinforced with single-sided high ductile concrete can withstand extreme wind loads of a 110-year return period, while the keel brick walls reinforced with double-sided mortar as well as double-sided high ductile concrete can withstand extreme wind loads of well over a 110-year return period.
1. Introduction
The keel brick belongs to the unique residential building materials in the southeast coastal region of China and has significant heritage and cultural value, as shown in Figure 1, possessing the advantages of light weight, waterproof, energy saving, and good overall stability [1]. Unfortunately, the process of firing keel bricks is now lost. In terms of the cross-sectional shape shown in Figure 2, the stacked keel bricks resemble modern hollow bricks with large holes and the side walls of the grooves are mostly 1 cm~2 cm thick, so the mass is very light. In terms of the masonry process, the keel brick exterior wall has superior waterproof performance, because the grooves are upward during masonry, so that the rainwater penetrating into the brick joints through the capillary principle is blocked by the wall cavity, and the excess rainwater flowing into the grooves will be absorbed by the rice husk soil in the cavity, thus making the rainwater not penetrate into the interior. The keel brick exterior wall is generally masoned into a double-layer structure with a cavity of about 5 cm~8 cm thick between the layers, which makes the keel brick wall has good heat insulation and thermal preservation. The wooden keel inside the wall and the external tie members can improve the stability of the whole wall, so the keel brick wall will not collapse even if it is tilted at a large angle. However, due to the time since construction, the wooden keel inside the existing residential keel brick walls has basically rotted and lost the tie with the external members, which seriously reduces the stability of the whole wall. Moreover, the collapse of keel brick walls caused by typhoons has become more and more frequent in recent years, seriously endangering the lives and properties of residents. According to UN Sustainable Development Goal 11, we should put efforts on “retain and repair”, rather than “demolish and replace”. Failure of such masonry buildings could lead to direct and indirect costs to the economy and society. Therefore, there is an urgent need to carry out reinforcement and repair for the existing residential buildings with keel brick walls in southeast coast of China, and to evaluate the in-service performance of ageing keel brick walls against typhoons with different reinforcement schemes.
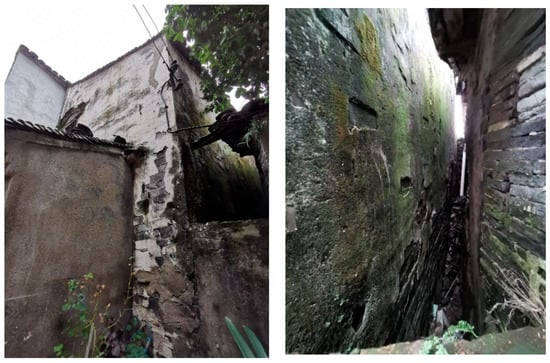
Figure 1.
Rural residential building in southeast coast of China with keel brick walls.
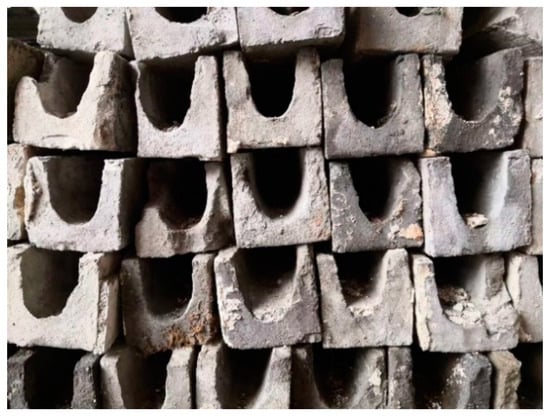
Figure 2.
Cross-sectional shape of keel bricks.
The traditional reinforcement schemes for masonry structures include reinforced concrete facing reinforcement, concrete slab wall reinforcement, additional ring beam and structural column reinforcement and so on [2]. These methods can improve the lateral force resistance of masonry structures, but there are disadvantages, such as long construction period and large disturbance to the original structure. In recent years, new methods have also been applied in the strengthening of existing masonry walls [3,4], such as reinforcement mesh cement mortar surface layer, paste fiber composite material, reinforced shotcrete layer, etc. These measures can significantly improve the lateral force resistance of masonry walls and overcome the shortcomings of traditional reinforcement methods, but the reinforcement layer is easy to peel or fall off due to the brittle nature of the material itself. Therefore, it is of great practical significance to adopt an efficient and economical reinforcement method to improve the lateral force resistance of masonry walls.
Engineered cementitious composite (ECC) was first proposed by Li and Leung [5] at the University of Michigan, USA, which exhibits good tensile strain hardening and multiple crack development characteristics under tensile and shear loading [6,7]. Currently, ECC has been widely used in practical projects such as bridges, highways, and tunnels in Europe and the United States [8]. In order to promote the application of ECC in strengthening projects, a group from Xi’an University of Architecture and Technology has prepared high ductility concrete (HDC) using ECC design theory and applied it to the strengthening and repair of masonry walls and concrete members [9,10]. HDC has high toughness and high crack resistance, which can effectively improve the structural brittleness and increase the structural ductility and deformation capacity. Deng et al. [11] used HDC to strengthen a hollow block masonry wall to improve the brittle damage mode of the wall and improve the seismic performance of the wall. Zhang et al. [12] found that HDC improved the brittle damage characteristics of the shear wall and effectively improved its shear bearing capacity, deformation capacity and energy dissipation capacity by conducting a proposed static test on a high axial compression ratio shear wall strengthened by HDC. Through the proposed static test of unreinforced brick wall reinforced by HDC, Deng et al. [13] found that the HDC facing can form a restraining effect on the wall, delay the cracking of the wall, and improve the bearing capacity and ductility of the wall. In summary, if HDC is used to reinforce the existing residential buildings with keel brick walls in the southeast coastal area of China, it will greatly improve the living conditions of local residents and reduce safety risks.
In addition, the southeast coast of China is seriously affected by typhoon disasters every year. For example, the Super Typhoon Lekima hit Ningbo in 2019, causing 408 houses collapsed and 1594 houses damaged citywide. Compared with urban houses, rural houses are less wind-resistant, especially some old masonry houses in disrepair, which are highly susceptible to typhoon damage. It is necessary to evaluate the performance of keel brick walls against typhoons with different reinforcement schemes. Benefiting from the rapid growth of the Monte Carlo method and computer technology, extreme typhoon wind speed simulation has mushroomed in the past twenty years, which is mainly composed of two parts: (1) typhoon track simulation and (2) wind field simulation. Vickery et al. [14] pioneered a full-track method to generate synthetic hurricane tracks from genesis to lysis based on the historical track records in the National Hurricane Center’s North Atlantic hurricane database (HURDAT). The development and utilization of the full-track models for wind hazard assessment have since been considered and expanded (Powell et al. [15], James and Mason [16], Emanuel et al. [17], Lee and Rosowsky [18], Vickery et al. [19], Li and Hong [20,21], Chen and Duan [22]). So far, storm tracks can be synthesized rapidly from purely statistical intensity algorithms. However, the effects of natural or anthropogenic climate change could not be encompassed through the above empirical models. Today, some novel intensity models considering environment variables that can be obtained from reanalysis or global climate models have the potential to estimate the future wind hazards under future climate projections. Jing and Lin [23] developed a hidden Markov model (MeHiM), which is dependent on the surrounding large-scale environment such as vertical wind shear, relative humidity, and ocean feed-back from reanalysis to simulate the whole process of hurricane intensity evolution. Huang et al. [24] verified the applicability of MeHiM in the Northwest Pacific Ocean and presented a general framework of typhoon full-track simulation. For engineering applications, the wind field model can be classified as the gradient wind field model (Lee and Rosowsky [18]) and the planetary boundary layer (PBL) model (Vickery et al. [19]). Meng et al. [25] proposed an analytical model with an upper inviscid layer of cyclostrophic balance and a lower friction layer to calculate the wind field in a moving typhoon boundary layer. Thompson and Cardone [26] upgraded a PBL model by increasing the spatial resolution to simulate a wider variety of radial pressure and wind profile forms. These PBL models have been widely applied in the assessment of hurricane/typhoon wind hazards for the coastal region of the United States and China [20,21].
The main objective of this paper is to evaluate the performance of rural residential keel brick walls against typhoons with different reinforcement schemes. The keel brick walls of rural houses in Ningbo area were taken as the research object, a framework for evaluating the performance of keel brick walls against typhoons was firstly established, tests on the lateral force resistance of keel brick walls reinforced with HDC and mortar were then carried out. With the help of typhoon full-track simulation and wind field simulation technology, the 600-year near-surface typhoon wind speeds affecting Ningbo area were obtained. A joint probability distribution model of multi-directional extreme wind speed was constructed using t-Copula function to determine the wind climate of Ningbo area. The extreme wind loads that keel brick walls can withstand under four types of reinforcement were finally analyzed and discussed.
2. Framework for Evaluating the Performance of Keel Brick Walls against Typhoons
The overall evaluation framework can be divided into three major components, as shown in Figure 3. Firstly, the tests on the lateral force resistance of keel brick walls should be carried out. The test scheme includes four types of reinforcement, i.e., single-sided HDC, single-sided mortar, double-sided HDC and double-sided mortar, respectively. Mortar reinforcement was used as a control test. Then the mixed wind climate of Ningbo area needs to be analyzed, including constant wind climate and typhoon climate, so that the multi-directional extreme wind speed in Ningbo area under different return periods can be determined. Finally, the evaluation of the performance of keel brick walls against typhoons can be carried out. Based on the equivalent static wind load theory, the extreme wind loads that keel brick walls can withstand under four types of reinforcement can be given.
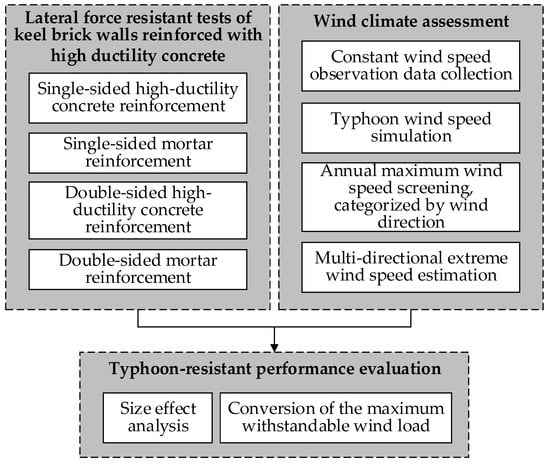
Figure 3.
Framework for evaluating the performance of keel brick walls against typhoons.
3. Lateral Force Resistant Tests of Keel Brick Walls Reinforced with High Ductility Concrete
3.1. Material Parameters
The keel bricks used in this test for masonry keel brick walls were collected from local rural residential buildings in Ningbo, and the size of keel brick is 75 mm × 75 mm × 200 mm. Masonry mortar and plastering mortar were prepared according to the cement mortar of M1, M10, respectively. The mix proportion used for HDC is, cement:fly ash:sand:water = 1:1:0.72:0.58; the cement type is P.O42.5R, which belongs to early strength ordinary silicate cement. The sand was taken from the local fine river sand with a maximum particle size of 1.2 mm, the fly ash was Grade I, and the water reducing agent was naphthalene high efficiency water reducing agent. Two percent of PVA fiber was used by volume. Figure 4 and Figure 5 exhibit the process of the cubic compressive strength test of masonry mortar and HDC. The average value of the compressive strength of HDC, plastering mortar and masonry mortar measured by using 100 mm × 100 mm × 100 mm cube test block are 48.8 MPa, 10.1 MPa, 1.6 MPa, respectively.

Figure 4.
Compressive strength test of masonry mortar. (a) Demolding form; (b) loading; (c) destruction form.

Figure 5.
Compressive strength test of HDC. (a) Demolding form; (b) loading; (c) destruction form.
3.2. Specimen Design
In this test, a total of four keel brick wall specimens were masoned, all of which were masoned in full compliance with the groove upward. The wall size is 1500 mm × 1500 mm × 75 mm, and the elevation of the wall specimens is shown in Figure 6. It should be noted that during the field research, it was found that the masonry mortar of the keel brick walls in the existing residential buildings had basically fallen off. Therefore, in order to more realistically reflect the mechanical properties of the existing keel brick walls, very little masonry mortar was used during the masonry of the wall specimens, and brick gaps were deliberately left, as shown in Figure 7. After the wall masonry was completed, the four wall specimens were reinforced separately. According to the reinforcement scheme, they can be divided into: 1 cm thick single-sided HDC (No. HDC1), 1 cm thick double-sided HDC (No. HDC2), 2 cm thick single-sided mortar (No. M1), and 2 cm thick double-sided mortar (No. M2). After each group of specimens was maintained for 7 days to reach the expected test strength, the lateral force loading test can be carried out.
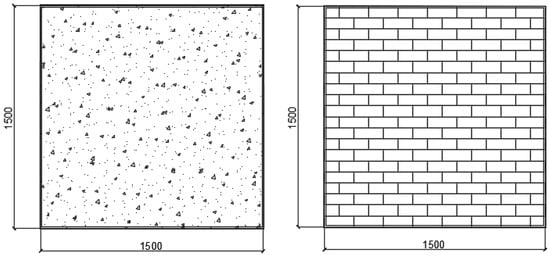
Figure 6.
Elevation view of wall specimen (unit: mm).
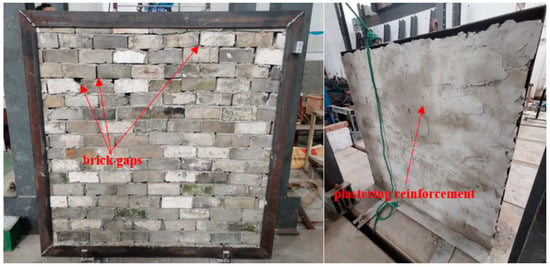
Figure 7.
Wall specimen and plastering reinforcement.
3.3. Test Methods and Procedures
The effect of various reinforcement schemes on the lateral force resistance of keel brick walls was investigated by static loading tests. The test loading device (elevation) is shown in Figure 8, where the wall specimen was fixed on a steel frame supported around, a horizontal conversion steel plate was placed on the upper part of the wall, and a jack was placed on the steel plate. The concentrated loads applied by the jack were transformed into uniform loads applied to the wall by the steel plate, which can simulate the lateral loads applied to the wall under real conditions. The load was controlled by hydraulic jack to achieve step-by-step loading (loading amplitude of 0.5 kN) until the final destruction of the specimen.
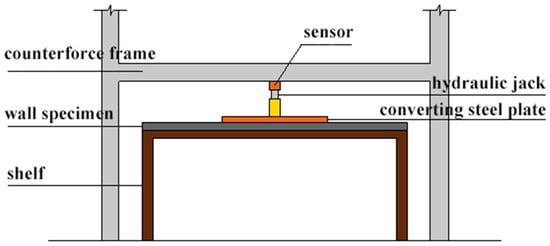
Figure 8.
Loading test device (elevation view).
3.4. Test Results
During the loading of specimen M1, the overall deflection of the wall was not obvious, the cracks on the mortar surface gradually expanded with the increase in the load, and, finally, after loading to 4.5 kN, the wall suffered brittle damage along the cracks, as shown in Figure 9. The damage of specimen HDC1 was characterized as ductile damage. Before loading to the critical damage load of 11 kN, the four corners of the HDC surface were gradually delaminated and buckled with the increasing load, as shown in Figure 10a, and after loading to the critical damage load of 11 kN, the wall showed obvious deflection, as shown in Figure 10b, accompanied by phenomena such as falling masonry mortar and falling bricks.
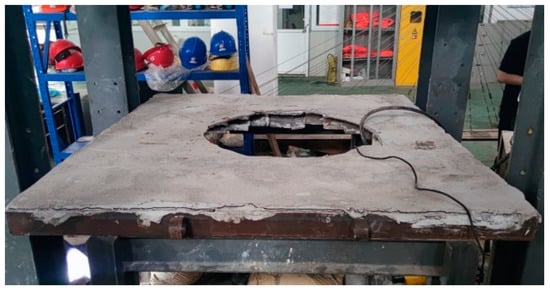
Figure 9.
Brittle damage of specimen M1.
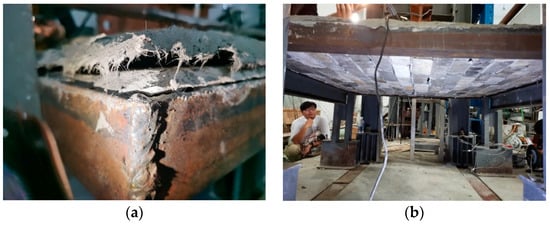
Figure 10.
Ductile damage of specimen HDC1. (a) Corner buckling; (b) downward deflection in the middle of the wall.
The main damage characteristic of specimen M2 was brittle damage. During the loading process, the overall deflection of the wall was not obvious, and the cracks on the lower mortar surface gradually expanded as the load increased step by step, as shown in Figure 11a, and after loading to 16 kN, the wall finally suffered brittle damage along the cracks. Figure 11b shows the damage range of the specimen M2. The main damage characteristic of specimen HDC2 was ductile damage. There was no obvious crack during the loading process, before loading to the critical damage load of 21 kN, or in the lower HDC surface layer as the load increased gradually; after loading to the critical damage load of 21 kN, the lower HDC surface appeared to obviously deflect downward. It was found by observation that the internal keel bricks had been partly detached from the wall, but the lower HDC surface pocketed the keel bricks and did not fall off due to its good ductility, as shown in Figure 12a. At this time, the second loading began, the upper HDC surface gradually deflected with the increasing load, which eventually led to the overall falling damage of the lower HDC surface, as shown in Figure 12b.
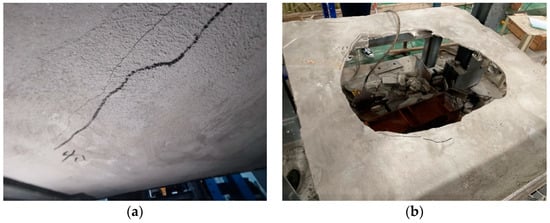
Figure 11.
Brittle damage of specimen M2. (a) Cracks on the lower mortar surface; (b) damage area.
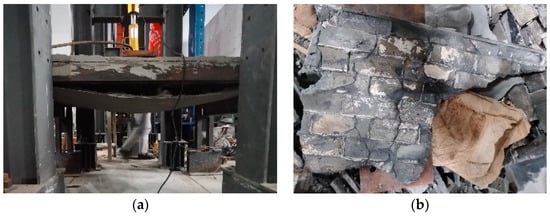
Figure 12.
Ductile damage of specimen HDC2. (a) Downward deflection of the lower HDC surface; (b) lower HDC surface falling off.
The damage loads of M1, HDC1, M2, and HDC2 are 4.5 kN, 11 kN, 16 kN, and 21 kN, respectively. Whether using single-sided or double-sided reinforcement, the lateral force resistance of specimens reinforced with HDC is significantly greater than that of specimens reinforced with cement mortar, because HDC has stable strain-hardening characteristics, and its ultimate tensile strain can reach more than 3%. To sum up, HDC has excellent deformation ability similar to steel, which can effectively improve the brittleness of masonry structures and increase structural ductility.
4. Mixed Wind Climate Assessment
4.1. Constant Wind Speed Observation Data Collection
There is a need to carry out wind climate assessment to determine the multi-directional extreme wind speed at the location of the keel brick residential buildings with different return periods. The Ningbo area is influenced by East Asian monsoon and Northwest Pacific typhoon all year, which belongs to the mixed wind climate region [27]. The daily maximum wind speed data (10-min time interval) and the corresponding wind direction records of Ningbo meteorological station (58562 Yinzhou) from 1 January 1967 to 31 December 2019 were used as samples in this paper, and the data were extracted from China Meteorological Data System (http://data.cma.cn/, accessed on 1 July 2022). According to the meteorological data specification, the collected wind speed data has been carefully calibrated by adjusting the observation height, observation time interval, and so on, to the standard condition. Figure 13 shows the division of 16 wind angles. D1 is the northerly wind direction, rotated clockwise every 22.5° as a wind direction, divided into D1, D2, …, D16. The observed daily maximum 10-min average wind speed series were categorized into 16 wind direction angles. By excluding the typhoon wind speed data, the annual maximum wind speed series of constant winds in each wind direction can be filtered.
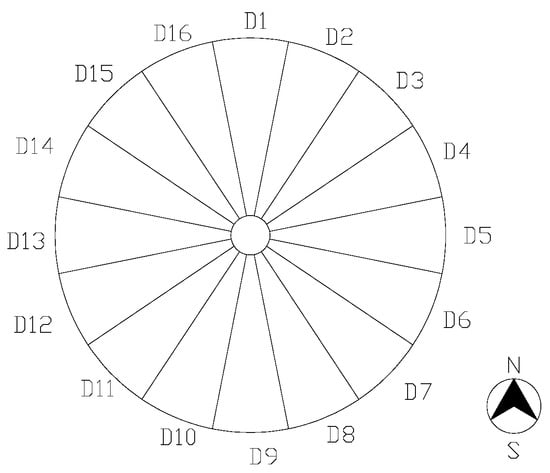
Figure 13.
Definition of wind direction azimuth.
4.2. Typhoon Wind Speed Simulation
This paper adopted the typhoon full-track simulation and applied a wind field model to obtain the near-surface typhoon wind speeds affecting Ningbo area, due to the limitation of the sample size of historical typhoon wind speed observations [27,28,29]. The full-track simulation process of single typhoon is shown in Figure 14, which can be divided into four steps. A typhoon genesis is randomly chosen following the historical statistics of typhoon occurrence at the first step. Then a track model and an intensity model are used to mimic the evolution of a typhoon process at a time step of 6 h. The third step is applying a filling rate model for the landfalling segment of the track. The final step is to activate Yan Meng wind field model if the simulated typhoon is within a radius of 250 km of Ningbo area. The Vickery empirical model [30] was used to determine the values of key wind field parameters such as the maximum wind speed radius Rmax and Holland pressure profile parameter B. The roughness length was taken as 0.05 m. Six-hundred-year Monte Carlo simulations were conducted to ensure enough annual extreme values for statistical analysis so as to estimate the typhoon climate in Ningbo area; the specific procedures can be referred to the literature [24,27,28,29].
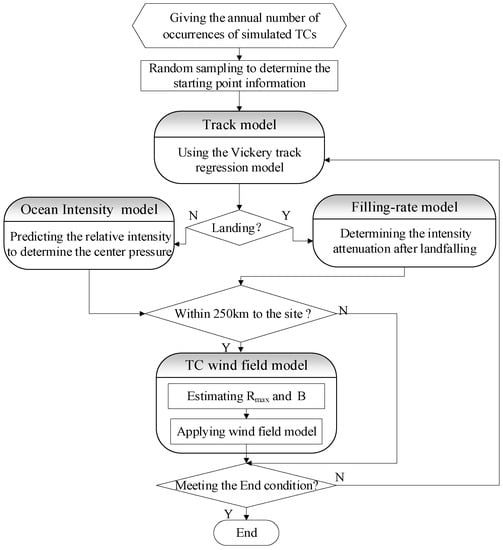
Figure 14.
Flow chart of full-track simulation of single typhoon.
4.3. Multi-Directional Extreme Wind Speed Estimation
Constructing a joint probability distribution function for the multi-directional extreme wind speed is an effective way to consider the wind direction correlation. Most traditional multi-dimensional joint distribution functions are simple extensions of one-dimensional distribution functions that require variables to obey the same marginal distribution, whereas the Copula function allows arbitrary forms of marginal distributions to be connected to produce a valid multi-dimensional distribution. Let the N-dimensional extreme wind speed variables Vd1, Vd2, …, VdN denote the extreme wind speed in the D1, D2, …, DN wind direction, respectively, then the joint distribution function considering the wind direction correlation can be expressed as
where is the joint distribution function of Vd1, Vd2, …, VdN. According to Sklar’s theorem [31], let , , …, be the marginal distribution function of the N-dimensional extreme wind speed variables Vd1, Vd2, …, VdN, there exists a multi-dimensional Copula function , , , satisfying
Assuming that the probability density function of the Copula function is , then the joint probability density function of the extreme wind speed variables Vd1, Vd2, …, VdN can be expressed as
The expressions of the commonly used multi-dimensional Copula functions and the range of parameter values are shown in Table 1. Assuming that the correlation structures between the N-dimensional extreme wind speed variables all obey the same class of Copula function, this paper directly adopted t-Copula function to consider the wind direction correlation. Cook [32] argued that the variation of the extreme wind speed with the exceedance probability basically follows the same scale for each wind direction, i.e., the rose diagram of the extreme wind speed either enlarges or shrinks with the change in the exceedance probability, but the basic shape remains the same. Based on this assumption, the multivariate extreme value problem can be simplified to a univariate extreme value problem to solve. Assuming that the exceedance probabilities p are equal at each wind angle, the extreme wind speed for each wind direction under the R-year return period can be uniquely solved by the following equation

Table 1.
Commonly used multi-dimensional Copula functions.
Based on t-Copula function, the joint probability distribution models of annual maximum wind speed series of constant wind and typhoon under 16 wind directions were constructed, respectively, and the multi-directional extreme wind speeds under different return periods were calculated by using this joint distribution model, and the specific procedures can be referred to the literature [27,33].
Figure 15 shows the comparison between the 10/50-year extreme wind speed and the design wind speed given by the code in Ningbo area. It can be found that the extreme wind speed of typhoon is significantly greater than the extreme wind speed of constant wind in each wind direction, indicating that the wind climate in Ningbo area is mainly controlled by typhoon. The design wind speed given by the code is on the risky side. Table 2 gives the estimated extreme wind speeds at 16 wind angles for 10/50/100-year return periods considering wind direction correlation. By comparing the extreme wind speed of each wind direction azimuth, it can be found that wind direction D2 is the most unfavorable wind direction, and its 50-year extreme wind speed value is 39.5 m/s.
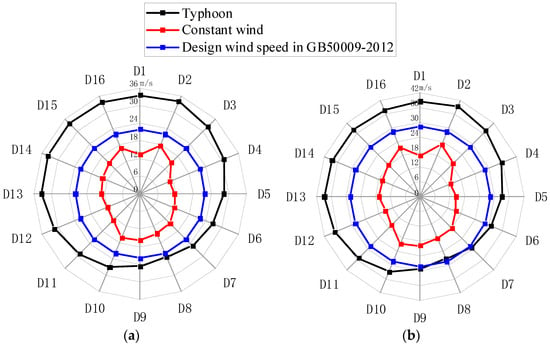
Figure 15.
Comparison of the extreme wind speed with the design wind speed given by the code in Ningbo. (a) Ten-year return period; (b) fifty-year return period.

Table 2.
Extreme wind speed of each wind direction angle under different return periods (unit m/s) (considering wind direction correlation).
5. Typhoon-Resistant Performance Evaluation
5.1. Size Effect Analysis
Related studies [34] have shown that changing the dimensions of masonry walls will have significant effects on the mechanical properties of the structure such as lateral stiffness, horizontal bearing capacity, and ductile energy dissipation. Therefore, the research in this paper needs to consider the influence of wall size effect. According to the study [34], the relationship between different wall aspect ratios and their lateral force resistance conversion coefficients was obtained as shown in Table 3 below, by taking the lateral force resistance at wall aspect ratio of 1 as the reference value.

Table 3.
Correspondence table of different wall aspect ratios and their lateral force conversion coefficients [34].
The case study of this paper was based on a keel brick wall in an actual residential building with a wall size of 2500 mm × 1500 mm (height to width ratio of 5:3). Taking the lateral force resistance at the wall aspect ratio of 1 as the base value, the actual wall lateral force resistance accounts for 58% of the wall aspect ratio of 1 (as shown in Figure 16). The lateral force resistance of 1500 mm × 1500 mm walls with different reinforcement schemes derived from the tests in Section 3 are 4.5 kN, 11 kN, 16 kN, and 21 kN, respectively, then the actual lateral force resistance when considering the size effect conversion to 2500 mm × 1500 mm walls are 2.67 kN, 6.52 kN, 9.49 kN, and 12.45 kN, respectively.
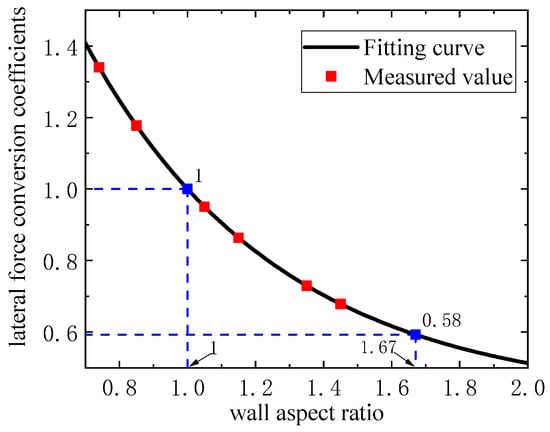
Figure 16.
Corresponding relationship of different wall aspect ratios and their lateral force conversion coefficients.
5.2. Conversion of the Maximum Withstandable Wind Load
Considering that the existing residential buildings with keel brick walls are basically one-story or two-story buildings with building heights less than 6 m, the wind loads acting on the keel brick walls can be approximated to be equivalent to static loads for analysis. The actual lateral force resistance of a 2500 mm × 1500 mm (height to width ratio of 5:3) wall under different reinforcement schemes can be converted into the actual maximum withstandable wind loads by equivalent static wind load theory. According to the current load code in China [35], the standard values of maximum wind loads that can be withstood under different reinforcement schemes can be converted into the maximum withstandable wind speed by Equation (5), the results are shown in Table 4.
where is the standard value of wind load (); is the wind vibration coefficient at the height of z, = 2.0; is the body shape coefficient, taken as 0.8; is the height variation coefficient, taken as 1.0; is the basic wind pressure; is the air density; and is the basic wind speed.

Table 4.
The maximum withstandable wind speed of keel brick walls under different reinforcement schemes.
Figure 17 shows the maximum wind speed that the keel brick wall can withstand for different reinforcement schemes (as shown in Table 4) compared with the extreme wind speed values for different return periods (as shown in Table 5) in the most unfavorable wind direction (D2) in Ningbo area. From the figure, it can be seen that the maximum wind speed that the keel brick wall with single-sided mortar reinforcement can withstand is close to the extreme wind speed of the 3-year return period under the most unfavorable wind direction in Ningbo area. In other words, the keel brick wall with single-sided mortar reinforcement can withstand the wind load of 3-year return period in Ningbo area. The maximum wind speed of the keel brick wall reinforced with single-sided HDC is close to the extreme wind speed of 110-year return period under the most unfavorable wind direction in Ningbo, i.e., the keel brick wall reinforced with single-sided HDC can withstand the wind load of 110-year return period. It can be seen that HDC reinforcement has great advantages over mortar reinforcement and avoids brittle damage of the structure. The maximum wind speed of the keel brick wall reinforced by double-sided mortar and double-sided HDC is much higher than the extreme wind speed of 110-year return period in Ningbo area, and the effect of using double-sided HDC reinforcement is still better than that of double-sided mortar reinforcement.
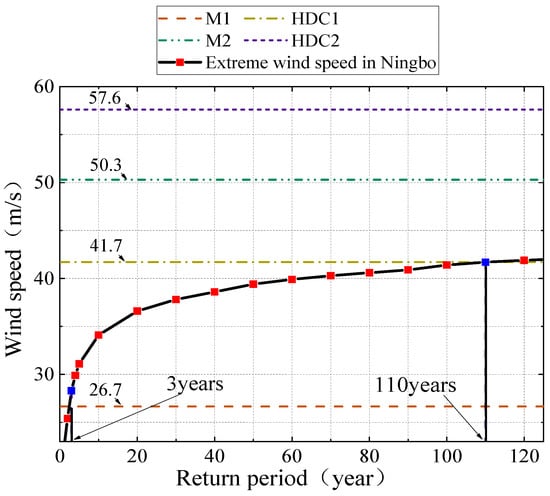
Figure 17.
Maximum wind speed that the keel brick wall can withstand under different reinforcement schemes.

Table 5.
Extreme wind speeds in the most unfavorable wind direction (D2) corresponding to different return periods in Ningbo.
6. Conclusions
This paper presents a general framework for evaluating the performance of keel brick walls against typhoons with different reinforcement schemes. Tests on the lateral force resistance of keel brick walls reinforced with single-sided HDC, single-sided mortar, double-sided HDC and double-sided mortar were carried out, respectively. With the help of typhoon full-track simulation and wind field simulation technology, the 600-year near-surface typhoon wind speeds affecting Ningbo area were obtained. A joint probability distribution model of multi-directional extreme wind speed was constructed using t-Copula function so as to determine the mixed wind climate of Ningbo area. The extreme wind loads that keel brick walls can withstand under four types of reinforcement were evaluated. The specific findings are as follows:
- (1)
- The wind climate in Ningbo area is mainly controlled by typhoon, and the design wind speed given by the current load code is on the risky side. The corresponding 10-, 50-, and 100-year return period extreme wind speeds under the most unfavorable wind direction are 34.1 m/s, 39.5 m/s, and 41.4 m/s, respectively;
- (2)
- Statistical key parameters and generated typhoon tracks from Monte Carlo simulations were compared with corresponding historical statistics from the CMA best-track dataset, showing good performance of the full-track model;
- (3)
- The HDC reinforcement has great advantages over mortar reinforcement, avoiding brittle damage of masonry structures and improving structural ductility, which is worth promoting in engineering applications. Taking a 2500 mm × 1500 mm wall as a real case, the keel brick wall reinforced with single-sided mortar can withstand wind loads of 3-year return period, the keel brick wall reinforced with single-sided HDC can withstand extreme wind loads of 110-year return period, while the keel brick wall reinforced with double-sided mortar as well as double-sided HDC can withstand extreme wind loads of well over 110-year return period.
It is worth adding that only experimental means were used to explore the damage patterns of keel brick walls under different reinforcement schemes in this paper. Since keel brick is a construction material unique to southeastern coastal China and the firing process has been lost, no published papers have been seen in which other researchers have conducted reinforcement tests on it. It was found that the damage behavior of the keel brick walls under different reinforcement schemes was different through the tests and the choice of reinforcement material determines the damage pattern of the keel brick wall. Therefore, the subsequent research work will be targeted on studying the ultimate tensile stresses of mortar and HDC and using them as damage criteria. The discussion of failure criteria is beyond the purpose of this paper, but will be focused on in subsequent studies.
Author Contributions
Conceptualization, Q.L.; Writing—original draft preparation, J.L. and P.L.; Writing—review and editing, R.W.; Supervision, J.Z. All authors have read and agreed to the published version of the manuscript.
Funding
This study was supported by National Natural Science Foundation of China (51820105012, 42207075), Natural Science Foundation of Zhejiang Province (LQ20E080001), Public Welfare Science and Technology Plan Project of Ningbo City (2022S174), Natural Science Foundation of Ningbo City (20221JCGY010691), Major Project of Ningbo Science and Technology Innovation 2025 (2020Z056).
Institutional Review Board Statement
Not applicable.
Informed Consent Statement
Not applicable.
Data Availability Statement
Some or all data and models that support the findings of this study are available from the corresponding author upon reasonable request.
Acknowledgments
We thank the Ningbo Kaihong Engineering Consulting Co. for providing the research object for this paper.
Conflicts of Interest
The authors declare no conflict of interest.
References
- Wang, B.; Liu, Y. Study on longgu (v-shape) brick and its wall structure: Vernacular dwelling of Ningbo. Archit. J. 2013, 10, 49–52. (In Chinese) [Google Scholar]
- JGJ 116-2009; Technical Specification for Seismic Strengthening of Building. China Architecture Industry Press: Beijing, China, 2009. (In Chinese)
- Zeng, L.H.; Jiang, C.Y. Study on reinforced concrete beam stiffness and deflection strengthened with high-performance ferrocement laminate after the fire. J. Hunan Univ. (Nat. Sci.) 2017, 44, 37–43. (In Chinese) [Google Scholar]
- Xu, M.F. Experimental Study on Compressive and Seismic Performance of Concrete of Small-Sized Hollow Block Masonry Reinforced with HPFL; College of Civil Engineering, Hunan University: Changsha, China, 2011; pp. 27–57. (In Chinese) [Google Scholar]
- Li, V.C.; Leung, C.K.Y. Steady-state and multiple cracking of short random fiber composites. J. Eng. Mech. 1992, 118, 2246–2264. [Google Scholar] [CrossRef]
- Li, V.C. On engineered cementitious composites (ECC) a review of the material and its applications. J. Adv. Concr. Technol. 2003, 1, 215–230. [Google Scholar] [CrossRef]
- Li, V.C.; Wang, S.; Wu, C. Tensile strain-hardening behavior of PVA-ECC. Aci Mater. J. 2001, 98, 483–492. [Google Scholar]
- Xu, S.L.; Li, H.D. A review on the development of research and application of ultra high toughness cementitious composites. China Civ. Eng. J. 2008, 41, 45–60. (In Chinese) [Google Scholar]
- Deng, M.K.; Zhang, Y.X.; Hu, H.B. Experimental study on seismic behavior of reinforced concrete column strengthened with high ductile concrete. J. Build. Struct. 2017, 38, 86–94. (In Chinese) [Google Scholar]
- Deng, M.K.; Yang, S.; Liang, X.W. Experimental studies on seismic behavior of confined masonry walls strengthened with single HDC layer. China Civ. Eng. J. 2018, 51, 10–19. (In Chinese) [Google Scholar]
- Deng, M.K.; Zhang, W.; Li, N. Study on seismic behavior of concrete block masonry walls strengthened with high ductile concrete. J. Hunan Univ. (Nat. Sci.) 2020, 47, 85–93. (In Chinese) [Google Scholar]
- Zhang, Y.X.; Deng, M.K.; Gao, D.K. Tests for aseismic performance of a high axial compression ratio RC shear wall reinforced with high ductile concrete. J. Vib. Shock 2020, 39, 49–56. (In Chinese) [Google Scholar]
- Deng, M.K.; Yang, S.; Wang, L. Experimental and bearing capcity studies on the seismic behavior of unreinforced masonry walls strengthened with HDC layers. Eng. Mech. 2018, 35, 101–111,123. (In Chinese) [Google Scholar]
- Vickery, P.J.; Skerlj, P.F.; Twisdale, L.A. Simulation of Hurricane Risk in the U.S. Using Empirical Track Model. J. Struct. Eng. 2000, 126, 1222–1237. [Google Scholar] [CrossRef]
- Powell, M.; Soukup, G.; Cocke, S.; Gulati, S.; Morisseau-Leroy, N.; Hamid, S.; Dorst, N.; Axe, L. State of Florida hurricane loss projection model: Atmospheric science component. J. Wind Eng. Ind. Aerodyn. 2005, 93, 651–674. [Google Scholar] [CrossRef]
- James, M.K.; Mason, L.B. Synthetic Tropical Cyclone Database. J. Waterw. Port Coast. Ocean Eng. 2005, 131, 181–192. [Google Scholar] [CrossRef]
- Emanuel, K.; Ravela, S.; Vivant, E.; Risi, C. A Statistical Deterministic Approach to Hurricane Risk Assessment. Bull. Am. Meteorol. Soc. 2006, 87, 299–314. [Google Scholar] [CrossRef]
- Lee, K.H.; Rosowsky, D.V. Synthetic hurricane wind speed records: Development of a database for hazard analysis and risk studies. Nat. Hazards Rev. 2007, 8, 23–34. [Google Scholar] [CrossRef]
- Vickery, P.J.; Wadhera, D.; Twisdale, L.A.; Lavelle, F.M. U.S. Hurricane Wind Speed Risk and Uncertainty. J. Struct. Eng. 2009, 135, 301–320. [Google Scholar] [CrossRef]
- Li, S.H.; Hong, H.P. Observations on a Hurricane Wind Hazard Model Used to Map Extreme Hurricane Wind Speed. J. Struct. Eng. 2015, 141, 04014238. [Google Scholar] [CrossRef]
- Li, S.H.; Hong, H.P. Typhoon wind hazard estimation for China using an empirical track model. Nat. Hazards 2016, 82, 1009–1029. [Google Scholar] [CrossRef]
- Chen, Y.; Duan, Z. A statistical dynamics track model of tropical cyclones for assessing typhoon wind hazard in the coast of southeast China. J. Wind Eng. Ind. Aerodyn. 2018, 172, 325–340. [Google Scholar] [CrossRef]
- Jing, R.; Lin, N. Tropical Cyclone Intensity Evolution Modeled as a Dependent Hidden Markov Process. J. Clim. 2019, 32, 7837–7855. [Google Scholar] [CrossRef]
- Huang, M.F.; Wang, Q.; Li, Q.; Jing, R.; Lin, N.; Wang, L. Typhoon wind hazard estimation by full-track simulation with various wind intensity models. J. Wind Eng. Ind. Aerodyn. 2021, 218, 104792. [Google Scholar] [CrossRef]
- Meng, Y.; Matsui, M.; Hibi, K. An analytical model for simulation of the wind field in a typhoon boundary layer. J. Wind Eng. Ind. Aerodyn. 1995, 56, 291–310. [Google Scholar] [CrossRef]
- Thompson, E.F.; Cardone, V.J. Practical Modeling of Hurricane Surface Wind Fields. J. Waterw. Port Coast. Ocean Eng. 1996, 122, 195–205. [Google Scholar] [CrossRef]
- Li, Q.; Jia, H.T.; Qiu, Q.; Lu, Y.Z.; Zhang, J.; Mao, J.H.; Fan, W.J.; Huang, M.F. Typhoon-induced fragility analysis of transmission towers in Ningbo area considering the effects of long-term corrosion. Appl. Sci. 2022, 12, 4774. [Google Scholar] [CrossRef]
- Li, Q.; Jia, H.T.; Zhang, J.; Mao, J.H.; Fan, W.J.; Huang, M.F.; Zheng, B. Typhoon loss assessment in rural housing in Ningbo based on township-level resolution. Appl. Sci. 2022, 12, 3463. [Google Scholar] [CrossRef]
- Li, Q.; Mao, J.H.; Huang, M.F. Extreme wind speed estimation of mixed climate combined with typhoon full path simulation. J. Vib. Shock 2020, 39, 84–89. (In Chinese) [Google Scholar]
- Vickery, P.J.; Wadhera, D. Statistical models of Holland pressure profile parameter and radius to maximum winds of hurricanes from flight-level pressure and H* Wind data. J. Appl. Meteorol. Clim. 2008, 47, 2497–2517. [Google Scholar] [CrossRef]
- Nelson, R.B. An introduction to Copulas; Springer Series in Statistics; Springer: New York, NY, USA, 2006. [Google Scholar]
- Cook, N.J. Note on directional and seasonal assessment of extreme winds for design. J. Wind Eng. Ind. Aerodyn. 1983, 12, 365–372. [Google Scholar] [CrossRef]
- Huang, M.F.; Li, Q.; Tu, Z.B.; Lou, W.J. Multi-directional extreme wind speed estimation in Hangzhou using Copula functions. J. Zhejiang Univ. (Eng. Sci.) 2018, 52, 828–835. (In Chinese) [Google Scholar]
- Liu, C. Size Effect on Mechanical Property of Frames Infilled with Dry-Stacked Masonry Walls; Harbin Institute of Technology: Shenzhen, China, 2014. (In Chinese) [Google Scholar]
- GB50009-2012; Building Structure Load Code. China Standards Press: Beijing, China, 2012. (In Chinese)
Publisher’s Note: MDPI stays neutral with regard to jurisdictional claims in published maps and institutional affiliations. |
© 2022 by the authors. Licensee MDPI, Basel, Switzerland. This article is an open access article distributed under the terms and conditions of the Creative Commons Attribution (CC BY) license (https://creativecommons.org/licenses/by/4.0/).