Article

The Influence of Crest Width and Working States on Wave Transmission of Pile–Rock Breakwaters in the Coastal Mekong Delta

1
Southern Institute of Water Resources Research, Ho Chi Minh City 70000, Vietnam
2
Division of Computational Mechatronics, Institute for Computational Science, Ton Duc Thang University, Ho Chi Minh City 70000, Vietnam
3
Faculty of Electrical and Electronics Engineering, Ton Duc Thang University, Ho Chi Minh City 70000, Vietnam
4
Department of Civil and Environmental Engineering, University of South Florida, Tampa, FL 33620, USA
5
Department of Civil and Environmental Engineering, University of South Carolina, Columbia, SC 29208, USA
6
Independent Researcher, Melbourne 3000, Australia
7
Laboratory of Environmental Sciences and Climate Change, Institute for Computational Science and Artificial Intelligence, Van Lang University, Ho Chi Minh City 70000, Vietnam
8
Faculty of Environment, Van Lang University, Ho Chi Minh City 70000, Vietnam
*
Author to whom correspondence should be addressed.
J. Mar. Sci. Eng. 2022, 10(11), 1762; https://doi.org/10.3390/jmse10111762
Submission received: 27 October 2022 / Revised: 9 November 2022 / Accepted: 12 November 2022 / Published: 16 November 2022
(This article belongs to the Section Coastal Engineering)

Abstract

:
The coastline of the Ca Mau and Kien Giang provinces in the Vietnamese Mekong Delta has been severely eroded in recent decades. Pile–Rock Breakwaters (PRBWs) are among the most widely adopted structures for controlling shoreline erosion in this region. These structures are effective for wave energy dissipation, stimulating sediment accumulation, and facilitating the restoration of mangrove forests. These breakwaters are generally considered to be the best-engineering practice; however, there is currently insufficient scientific evidence with regard to specific structural design aspects. This can lead to PRBW structures being compromised when deployed in the field. This study used a physical model of a PRBW in a laboratory to investigate several design parameters, including crest width and working states (i.e., submerged, transition, and emerged), and investigated their relationship with the wave transmission coefficient, wave reflection coefficient, and wave energy dissipation. To investigate these relationships further, empirical formulas were derived for PRBWs under different sea states and crest widths to aid the design process. The results showed that the PRBW width had a significant influence on the wave energy coefficients. The findings revealed that the crest width of the breakwater was inversely proportional to the wave transmission coefficient (Kt) under the emerged state. The crest width was also proportional to the wave reduction efficiency and wave energy dissipation in both working states (i.e., the submerged and emerged states). The front wave disturbance coefficient (Kf) was found to be proportional to the wave reflection coefficient, and the wave height in front of the structure was found to increase by up to 1.4 times in the emerged state. The wave reflection coefficient requires special consideration to reduce the toe erosion in the structure. Lastly, empirical equations including linear and non-linear formulas were compared with previous studies for different classes of breakwaters. These empirical equations will be useful for understanding the wave transmission efficiency of PRBWs. The findings of this study provide important guidance for PRBW design in the coastal area of the Mekong Delta.

1. Introduction

Shoreline erosion in the Mekong Delta has been rapidly accelerating in both spatial and temporal scales in recent decades. The driving forces for shoreline erosion are complex and have been broadly researched. Reducing the energy of incoming waves using breakwater structures has sparked debates in the scientific community, particularly for deltaic coastlines since sedimentation serves an essential ecosystem function for the living shoreline. Sediment reduction in the Vietnamese Mekong Delta due to upstream dam construction has also been studied extensively, and constitutes a process that also contributes to shoreline erosion in the Mekong delta [1,2,3,4,5]. Moreover, other driving forces, including changing wind wave climatology with climate change, sea level rise, sand mining, and land subsidence due to the over-extraction of groundwater, have exacerbated shoreline erosion in the region [6,7,8]. Waves coming from the water’s surface and traveling from the open sea to coastal areas can have a strong influence on coastal topography [9].
The coastlines of Ca Mau and Kien Giang have experienced a relatively higher rate of erosion. Therefore, several pilot projects were implemented to adopt different types of breakwaters to protect the Ca Mau coast, using techniques such as geotubes, non-metallic reinforced hollow breakwaters, hollow cylinders, and pile–rock breakwaters (PRBW) [10,11,12]. Among them, the PRBW shows significant advantages in terms of wave reduction, stimulating sedimentation, mangrove restoration, and stability under strong wave condition during the monsoon season (Figure 1).
Over a ten-year period of observation, PRBWs have been widely adopted in the region because they are easily manageable and have a low cost of maintenance support, which makes them practical from an engineering point of view. For example, this structure is suitable for soft soil foundation conditions, stable seabed protection against scouring, and is highly effective for wave energy dissipation [12]. The porous medium created by filling the PRBW structure with rocks allows fine-grained sediments to pass through, thereby stimulating onshore sedimentation and helping to restore an area of mangrove forest (Figure 1). Presently, this structure has been widely constructed on the Mekong coast at a stretch of 70 km in length, particularly at Ca Mau and Kien Giang, which account for about 65 km. There are many locations being recovered for mangrove forestation in the west sea in Ca Mau province because of the established performance of PRBW in terms of wave reduction and sedimentation [13,14,15]. However, this breakwater had been designed on the basis of engineering best practice, lacking sufficient scientific background with regard to the structural design, stability, capacity of wave reduction, and optimal percentage of porosity. Despite the availability of current standards such as TCVN 9901:2014 or TCVN 12261:2018, these standards do not cover all design aspects. For instance, no design guidelines for the crest width and height of PRBW are available. This has led to many construction challenges faced during the PRBWs’ construction on the west coast of the Mekong Delta.
There are a few studies that have investigated the effectiveness of PRBWs in terms of wave reduction and sedimentation. For instance, Nhan [16] employed numerical modeling with a MIKE21/3-coupled model Flexible Mesh (FM) with hydrodynamic and sediment transport modules to simulate two-dimensional hydrodynamic and wave actions on a 300 m long PRBW shore but did not consider the details of the structural design, the processes of the waves overtopping, or wave transmission through the structure in numerical modeling. The PRBW design in analytical and numerical analysis mainly focuses on stability without considering the crest width and working states (i.e., submerged, transition, and emerged). The previously mentioned results from numerical modeling were not justified with lab experiments, which remain to be undertaken to confirm the results. Furthermore, Hur [17] and Hur et al. [18] investigated the effect of the slope gradient of submerged breakwaters by using a three-dimensional numerical model setup and three-dimensional wave basin experiments. Recently, Le Xuan et al. [12] tested the efficiency of PRBWs with regard to wave transmission, wave reflection, and energy dissipation and constructed an empirical formula using experimental results from the laboratory. A wide range of working states (i.e., water level and crest freeboard) and incident wave conditions were tested to build the empirical formula using the fixed crest width of a PRBW. However, these studies have not investigated the variation of crest width with respect to the wave transmission coefficient, wave reflection coefficient, and wave energy dissipation.
A numerical-modeling study was also undertaken to investigate wave propagation through porous breakwaters. Tsai et al. [19] developed a numerical model for testing the efficiency of a submerged permeable breakwater for wave energy dissipation. The degree of wave propagation can be deduced by deriving governing equations based on the linearized equation of unsteady flow in a porous medium. The experimental results show that the waves started decaying in front of the breakwater, then decreased rapidly over the breakwater, and the decay process interfered with wave transmission due to the permeability and resistance of the porous medium.
Notably, Wu and Hsiao [20] studied the interaction of a solitary wave and a submerged permeable breakwater using both experimental and numerical modeling. They suggested that the maximum turbulent intensity usually occurs at the front side and top corner of the breakwater. The energy reflection coefficients are dominated by porosity and decrease with increasing porosity. The crest width of the submerged breakwater has significant effects on the energy transmission and dissipation coefficients. As the crest width of the breakwater increases, the energy transmission coefficients decrease and the energy dissipation coefficients increase. Moreover, Gao et al. [21] applied a fully nonlinear Boussinesq model and FUNWAVE 2.0 to generate focused transient wave groups and their interactions with the harbor. By employing the Morlet wavelet transform and discrete Fourier transform techniques, the ability of focused transient wave groups to trigger the harbor resonance phenomenon was revealed.
Based on the existing literature, the impact of a breakwater’s width and crest width on a PRBW’s efficiency in terms of wave energy dissipation is currently unknown. Therefore, the main objective of this study was to investigate the relationship between the crest width and working states (i.e., submerged, transition, and emerged) with three wave energy coefficients (i.e., the wave transmission, wave reflection, and energy dissipation) by developing physical models in the laboratory. Based on this analysis, empirical formulas were developed to deliver linear and non-linear equations that can be applied to PRBWs in the West coast of the Mekong Delta.
This paper is structured as follows. In Section 2, we describe the experimental setup and the results of investigating wave transmission through a PRBW based on observations in the laboratory. Section 3 describes the results and provides a discussion regarding the experimental analysis and development of the empirical formulas, as well as a comparison of the wave transmission coefficients using different equations for three types of breakwaters. Finally, in Section 4, we draw conclusions from the laboratory experiments and provide recommendations for future work.

2. Laboratory Experiments

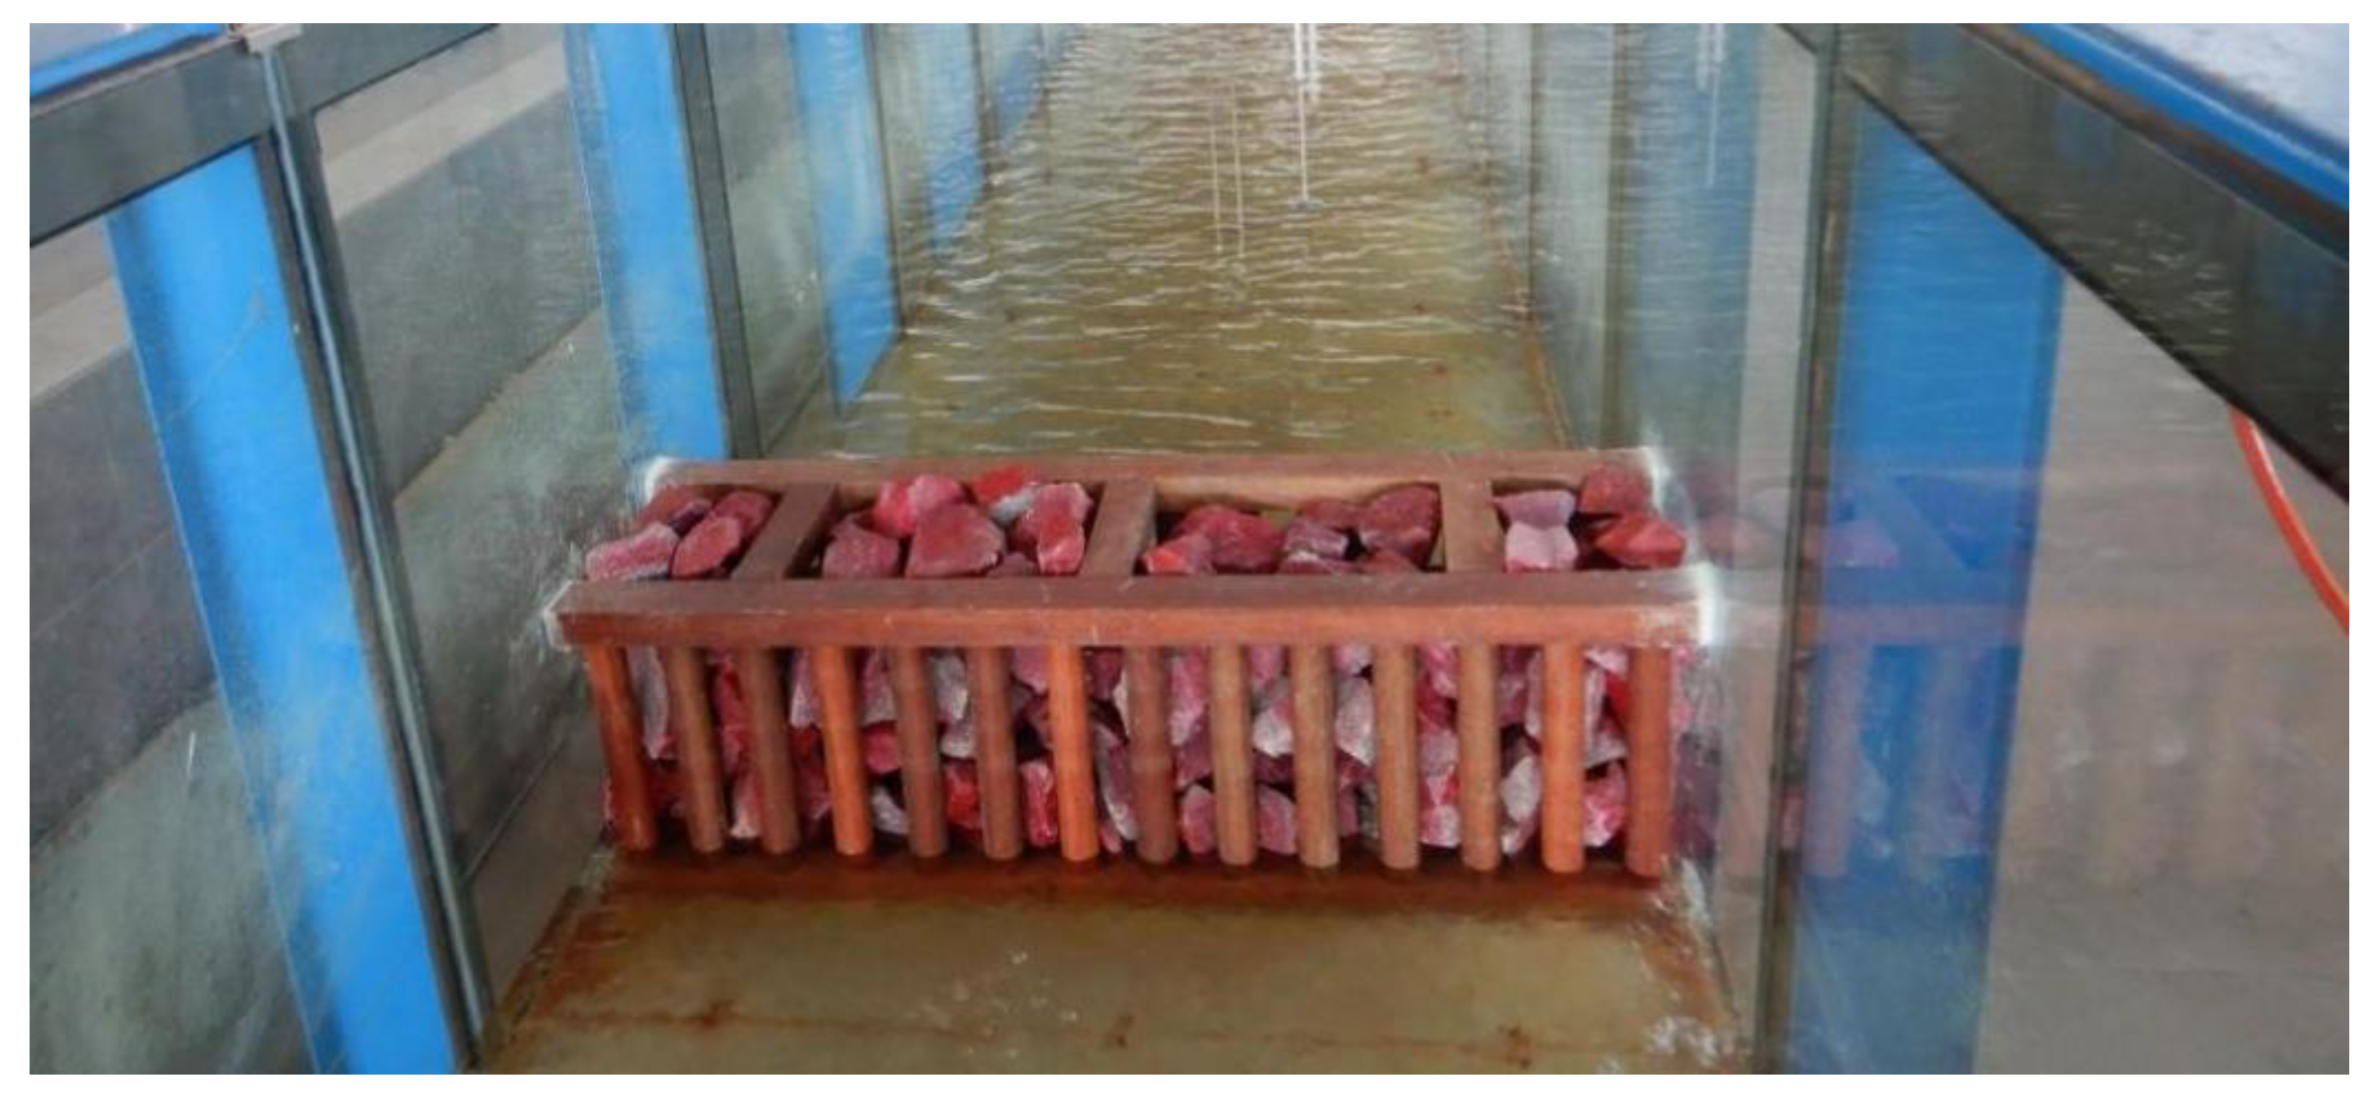
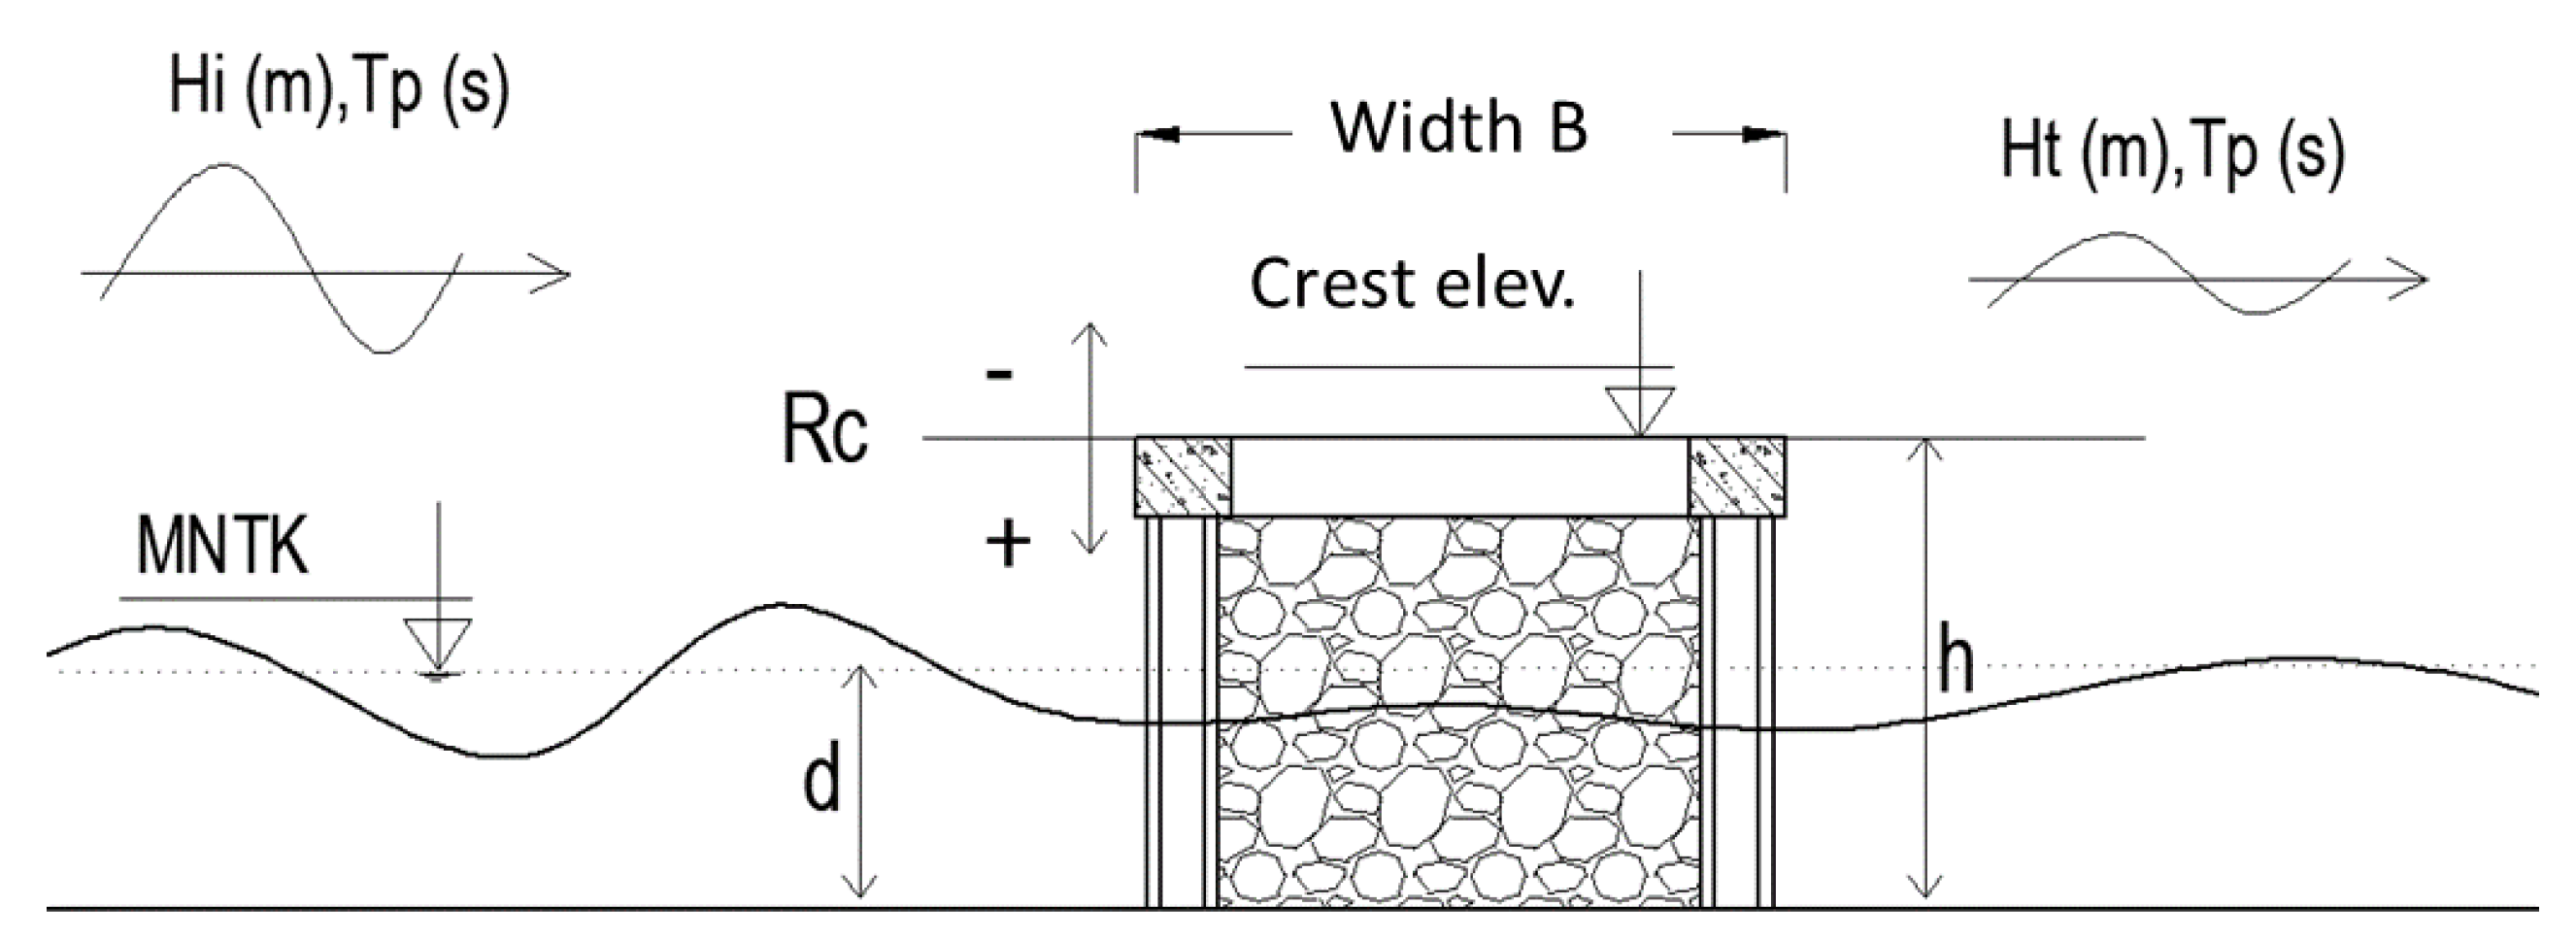
2.1. Experiment Equipment Setup

The experiment was carried out in the wave flume of the Marine Hydrodynamics Laboratory, located at the Southern Institute of Water Resources Research (Figure 2a), in 2021. The required experimental equipment was provided by HR Wallingford (UK). The length of the wave flume was 35 m, the width was 1.2 m, and the height was 1.5 m. The wave generator system was equipped with the ability to absorb reflected waves (active reflection compensation). The wave generator could generate random or uniform waves with a height of up to 0.30 m and a peak period of 3.0 s. Waves were measured by using many wave gauges with a frequency of 50 Hz (accuracy ±0.1 mm). Additional descriptions of the experimental wave flume setup are detailed in Le Xuan et al. [12]. In this experiment, a wave-absorbing apparatus was set up at the end of the wave flume using aluminum slag material placed in an iron cage with a slope of 1/5 (Figure 2b). The validation results of the wave absorber for all test cases (change of water level and wave parameters) showed that the waves reflected from the absorber were less than 10%.
The physical model’s scale was selected to ensure both technical considerations and economic resource utilization. A larger model ratio usually leads to higher reliability of experimental results, but a large-scale physical model setup is expensive. We selected the model ratio based on wave flume capacity and in accordance with satisfying the hydrodynamic boundary conditions (waves and optimum water level). The model’s scale also ensures the similarity of Froude numbers and the turbulent flow in the flume (i.e., (Reynolds Number, Re) > 104). The laboratory model was set up following Froude’s law to ensure turbulent hydrodynamic conditions. The model’s scale was selected as follows: NL = 7 (scale of length and height), N t = N l = 2.64 (scale of time), N v = N l = 2.64 (scale of velocity), and N m = N L 3 = 343 (scale of mass). The size of the rock for the experiment also ensures that the flow condition through the rock layer is as much as will remain turbulent with [Re] > 104 according to the formula:
R e = ρ v D ε μ
where v is the wave velocity flowing through the hole, D is the diameter of the rock, μ is the absolute viscosity of the water (0.001002 Kg/ms), and ε is the porosity of the rock layer for the experiment ( ε = 0.4 ) . Based on the dimensional analysis, the Reynolds number of Re = 20,559 (Re > [Re]) satisfies the minimum velocity by the lowest wave amplitude under the most extreme case and the smallest diameter of rocks corresponding to a Re number that ensures turbulent flow conditions through the rock layer.

2.2. Installation of Equipment and Model Setup

The experimental model employs a wave transition zone, which is an inclined face having a slope of 1/25. It is 3 m from the wave generator and 5 m from the breakwater direction (see Figure 3). The transition zone propagates waves from deep waves to shallow waves, thus simulating the nearshore topography along the Mekong Delta coast (Figure 3, bottom panel).
Five wave gauges were installed in front and behind the breakwater—WG1, WG2, WG3, WG4, and WG5—on the seaside to measure the incoming wave, and two wave gauges (WG6 and WG7) on the lee side to measure transmitted waves through the breakwater. Four wave gauges, WG1, WG2, WG3, and WG4, were installed to detect the reflected and incident waves using the least squares method. In addition, to measure the current, an E40 probe was used in combination with the wave gauge at the same position as WG5 (Figure 3).
The structure and dimensions of the typical PRBW in the Mekong Delta have a crest width of 2.5 m and a crest elevation of 1.6 m. PRBWs are cast with pre-stressed concrete piles with a diameter of 0.30 m having a length of 8 m, as shown in Figure 4. In this experiment, the structure of the centrifugal piles is linked with overhead beams in the physical model. The casings are made of wood to ensure the convenience of fitting them inside the flume and high precision of components’ dimensions (Figure 5). The rocks were selected to have effective diameters of 4–7 cm to ensure they did not become too flat or too thin. The edges of rocks were relatively even and rough (Table 1). The rocks’ edges affect the friction characteristics of their surfaces. After sieving the rocks, the required volume method was implemented to determine the porosity of the rocks and they were mixed according to proportion. The porosity of the physical model was about P = 40%.

2.3. Experimental Scenarios

2.3.1. Wave Conditions

The PRBW was designed for monsoon conditions. The input wave parameters were selected from in situ measurement data and simulation results of a numerical model. The typical wave height for the Mekong Delta ranges between 0.5 m–1.5 m, and the wave period (Tp) varies between 3 s to 7 s. The model scale NL = 1/7 was selected so that the wave height should be greater than or equal to 5 cm and maximum height does not exceed 30 cm. Minimum Tp was maintained greater than or equal to 1 s so that waves did not exceed wave flume capacity, and the maximum Tp was 3 s to ensure precision in the calculations. To confirm that the experimental wave spectrum shape was consistent with the field case and to collect enough experimental sets of data for analysis, each experiment was run for a duration of 500 × Tp (s). The generated wave’s frequency range was calculated to lie between 0.01 Hz and 1.5 Hz with a split of 0.01 s/value.

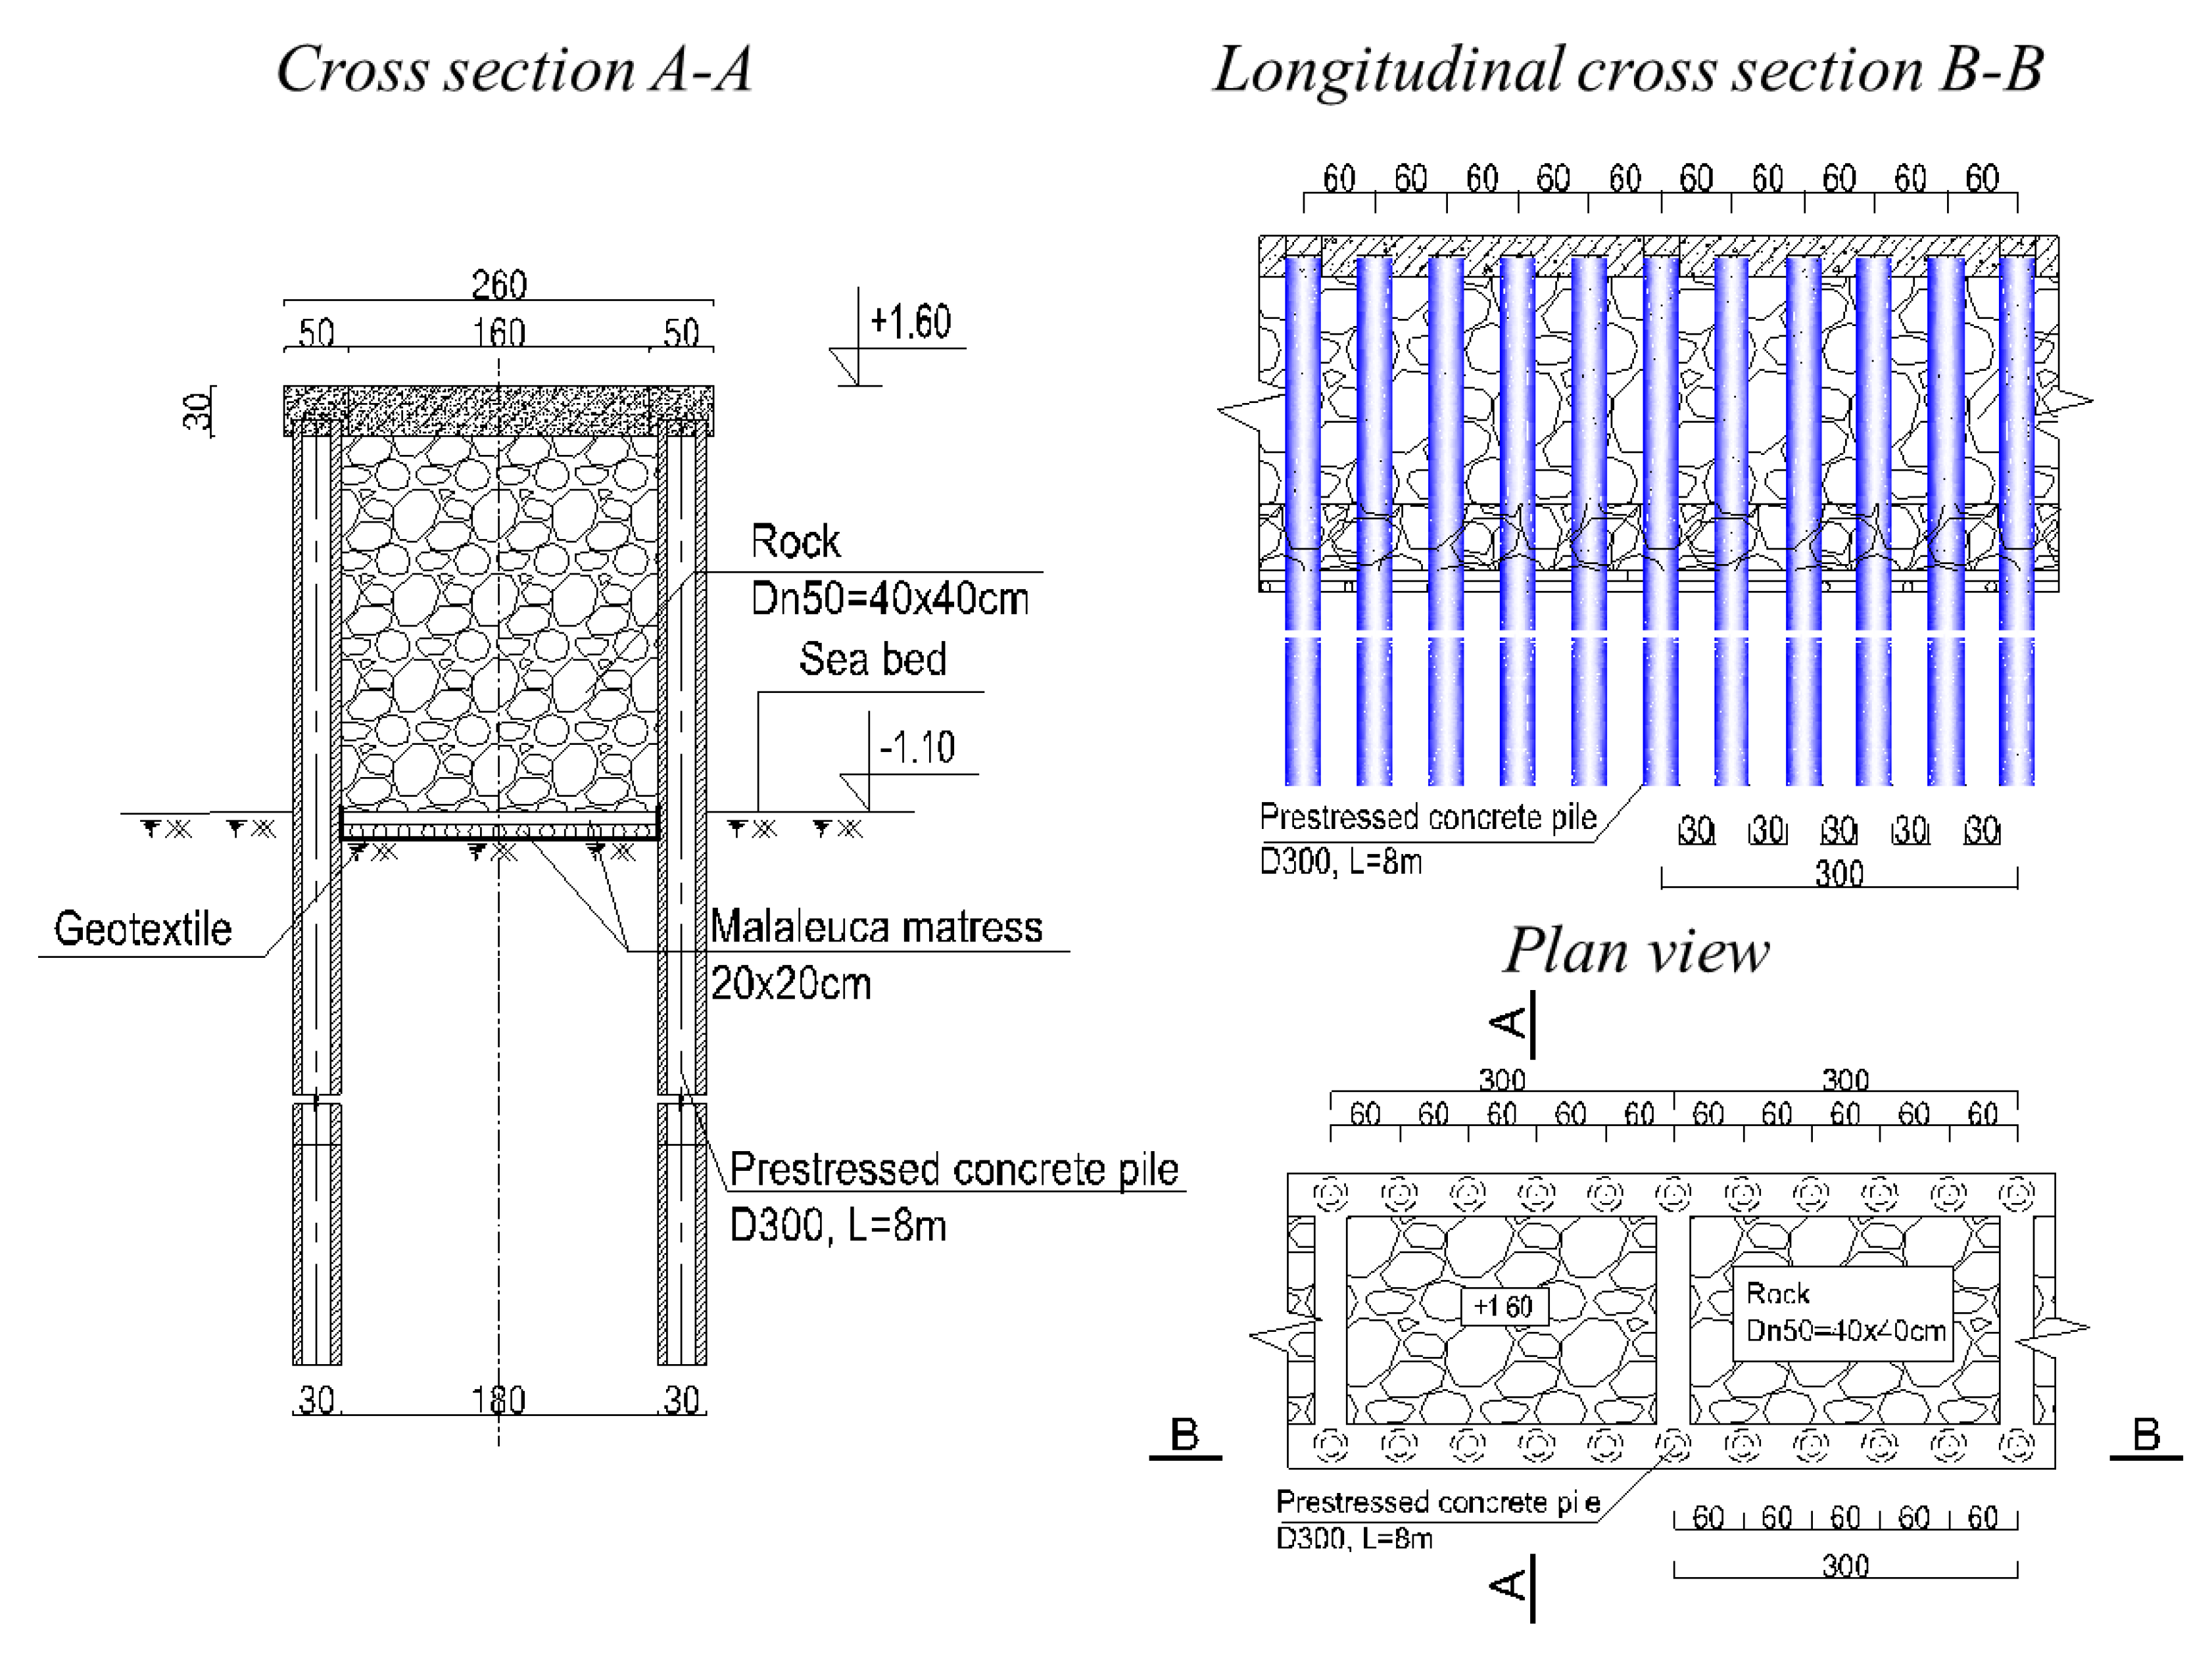
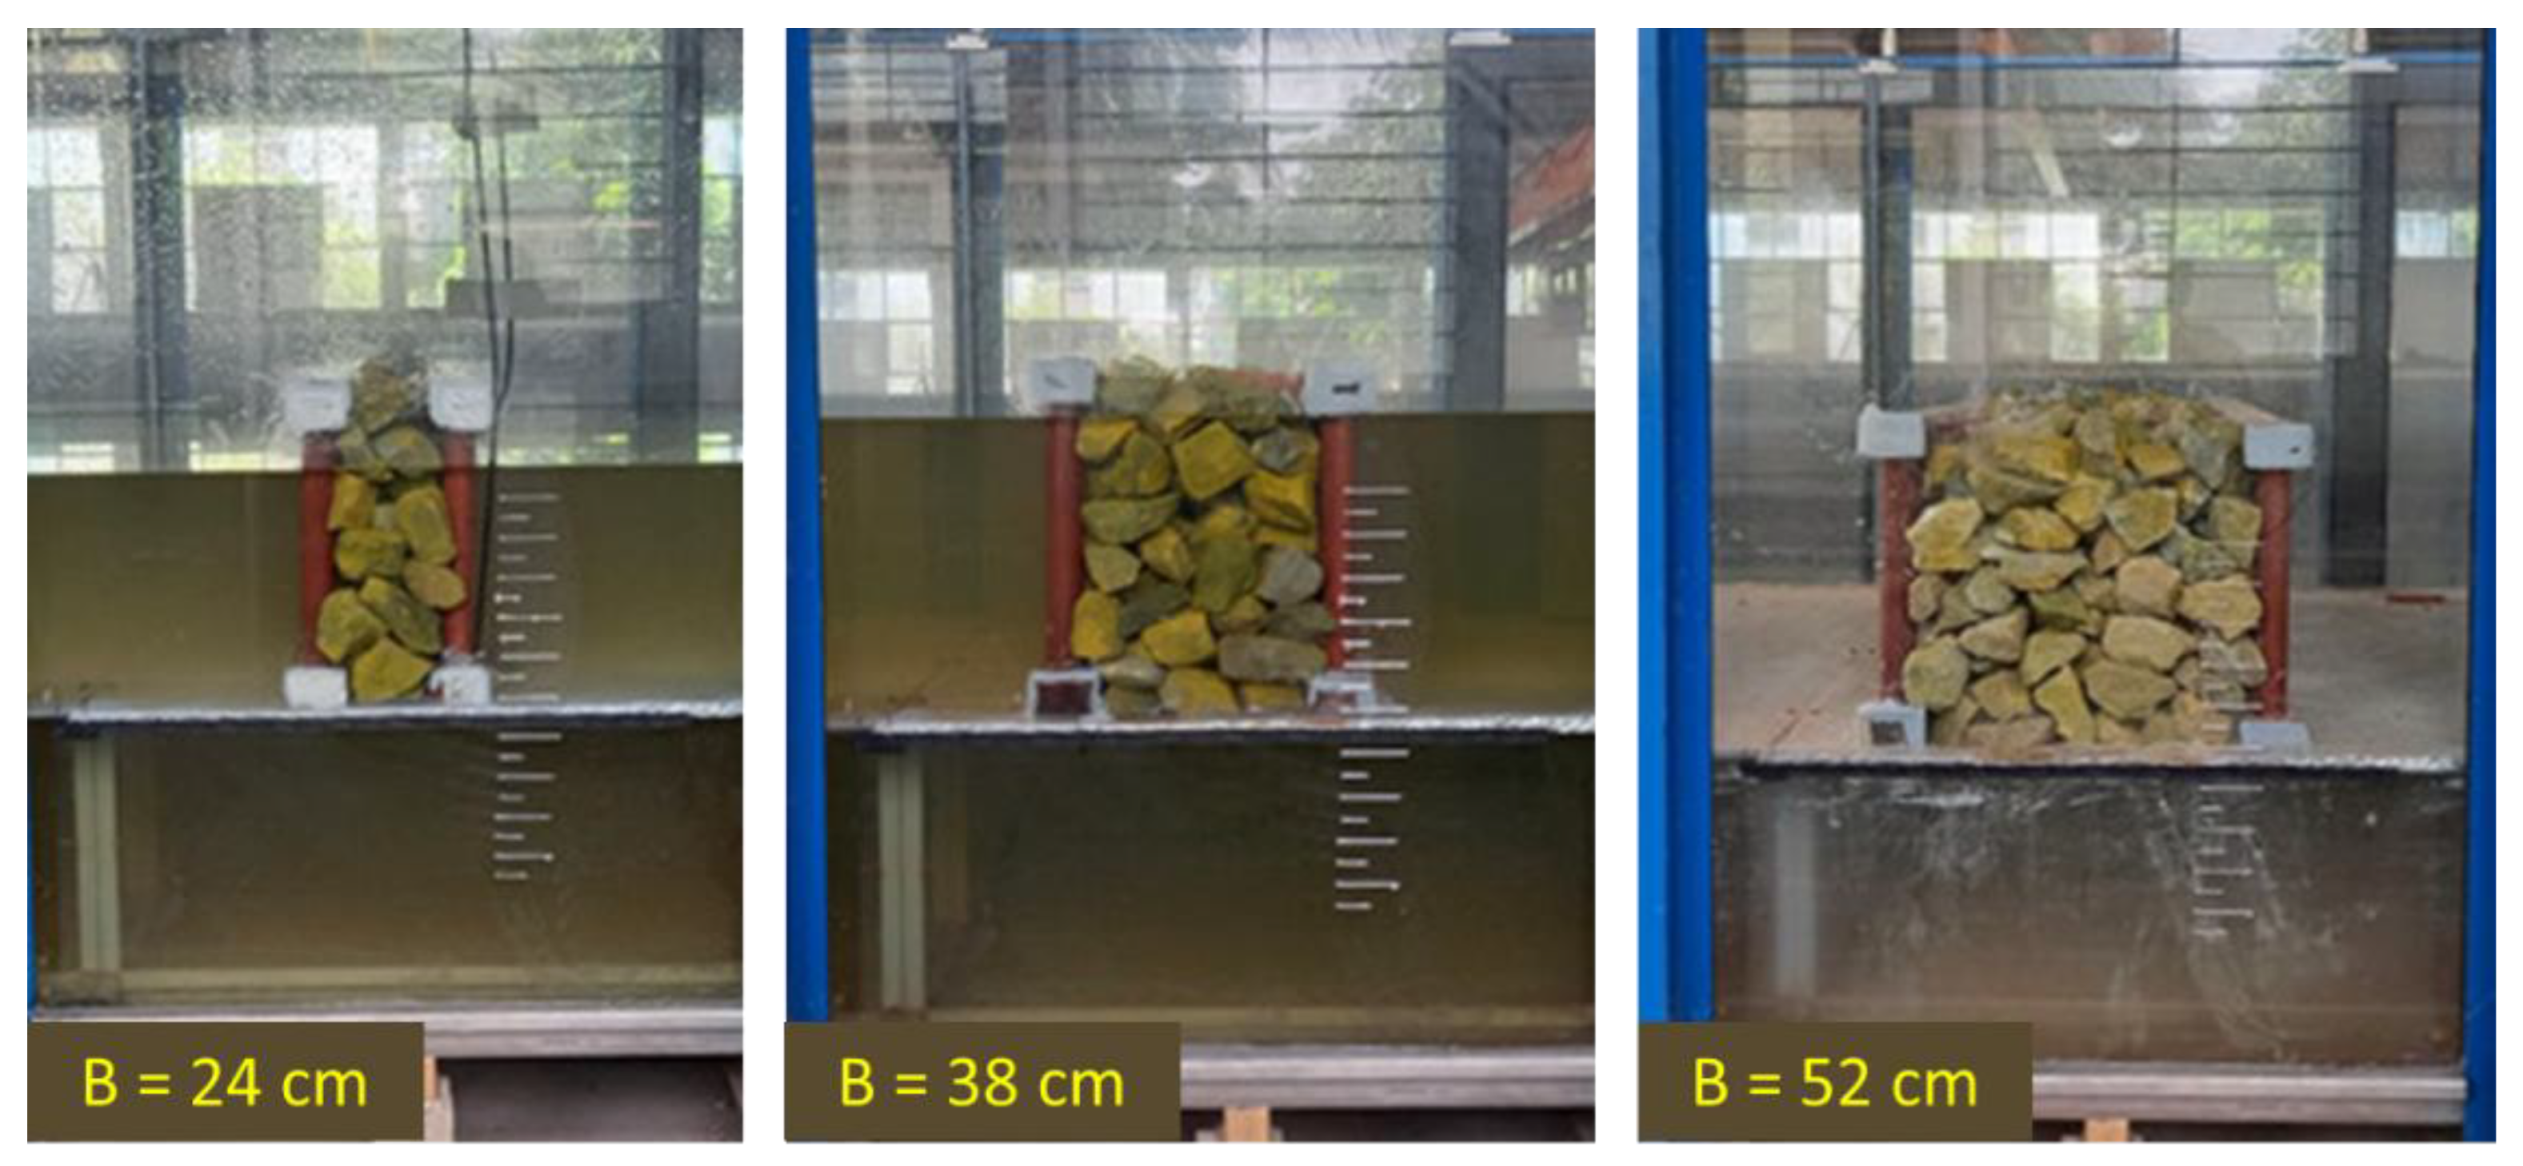
2.3.2. Experimental Structures

The PRBW was tested with three crest widths of 24 cm (B24), 38 cm (B38), and 52 cm (B52) (Figure 6), corresponding to the actual crest built in the Mekong Delta of 1.7 m, 2.7 m, and 3.7 m. In order to better understand the relationship between the crest width, working states (i.e., submerged, transitional, and emerged), and the wave transmission, wave reflection, and energy dissipation of PRBW, we fixed additional dimensions such as height, rock distribution, distance, and diameter between centrifuge piles per row based on the scale in the field.

2.3.3. Testing Scenarios

To investigate the relationship between the crest widths, working states (i.e., submerged, transition, and emerged), and the wave transmission, wave reflection, and energy dissipation of PRBW, there were many scenarios implemented to test with different sea states and crest widths. The experimental scenarios are shown in detail in Table 2. There are 280 experiment tests, including (Table 2):
  • One test without PRBW and three tests with three crest widths (B24, B38, and B52);
  • Seven tests with a changing water level and crest freeboard (Rc);
  • Tests changing ten parameters of the waves (Hs, Tp, and L).

3. Results and Discussion

3.1. Wave Spectrum Validation

During wave propagation, in the transition zone from deep to shallow water, there are significant changes in water depth. Wave breaking happens in the transition zone. After breaking at the transition zone, the wave continues to propagate into the shallow water in front of the structure. The purpose of creating the transition zone is to force the wave to break many times, creating incident wave conditions in front of the structure with a similar wave energy spectrum to that nearshore of the Mekong Delta.
The changes in the wave spectrum through the transition zone are shown in Figure 7. From the deep-water zone (wave gauge WG1), the wave spectrum had a sharp peak with an energy value of 0.023 m2/Hz (Figure 7a), and through the transition zone, the spectral peak energy was significantly reduced to 0.011 m2/Hz at wave gauge WG5. After the wave broke, the spectrum had transformed to a flattened shape with many low peaks (Figure 7b). Thus, the energy decreased significantly due to the breaking of the wave.
The wave spectrum generated in the model after passing through the transition zone was also compared to the actual pattern observed in the field at Ganh Hao coast, Bac Lieu province. In the typical shallow water conditions of the Mekong Delta, the similarity of the wave spectrums between the field observations and physical model is shown in Figure 8. The wave spectrums in both locations were flattened and scattered to multi-peaked values. In the case of the field observations, high-energy peaks were observed in the middle, while small peaks were observed on either side in the frequency bands. The wave spectrum from the physical model confirms that it has simulated the field wave conditions in order to increase the reliability of the study of waves’ interactions with the breakwater.

3.2. Experimental Analysis

Incident waves, water level, crest freeboard, and crest widths with a total of 280 experimental scenarios have been tested. A typical sketch of the experiment regarding the effects of wave propagation on the PRBW is shown in Figure 9.
The structure of the PRBW is a porous media vertical seawall construction. The distance between the centrifugal piles and the porosity of the filling rocks affect the wave energy dissipation and reflection ability of the structure. According to the law of the conservation of energy, the energy can be expressed mathematically using the energy balance formula devised by Van der Meer and Daemen [22]:
E i = E t + E r + E d
where Ei, Et, Er, and Ed are the energies of the incoming wave, the transmitted wave, the reflected wave, and the dissipated wave, respectively. From this, the energy balance function can be rewritten as:
1 = ( H t H i ) 2 + ( H r H i ) 2 + E d E i
1 = K t 2 + K r 2 + K d
where
K t = H m 0 , t H m 0 , i —the wave transmission coefficient is determined by the ratio of the wave height behind the breakwater (Hm0,t) and the wave height in front of the breakwater (Hm0,i);
K r = H m 0 , r H m 0 , i —the reflected wave coefficient is determined by the ratio of the reflected wave height in front of the breakwater (Hm0,r) and the wave height in front of the breakwater (Hm0,i);
Kd is determined based on the transformation from Formula (3):
K d = 1 K t 2 K r 2
The front wave disturbance coefficient in front of the breakwater is determined by the difference of the wave height at position WG5 with and without the structure:
K f = H m 0 , i , b e f H m 0 , i , a f t

3.2.1. The Effect of Crest Width on the Wave Transmission Coefficient

The PRBW operates under three states: the submerged (Rc < 0), the transition (Rc = 0), and the emerged states (Rc > 0). The correlation between the relative crest freeboard (Rc/Hm0,i) and the wave transmission coefficient (Kt) through the PRBW is shown in Figure 10. It can be seen that Kt ranges from 0.2 to 0.7 and is inversely proportional to the crest width (B) of the PRBW. However, the curve tends to converge when the breakwater operates under the submerged state (Rc/Hm0,i << 0). This demonstrates that the effect of the crest width decreases when the PRBW operates under the submerged state. When the PRBW operates under the emerged state (Rc/Hm0,i > 0), the wave transmission coefficient decreases gradually when increasing Rc, and when Rc/Hm0,i > 1.5, the reduction of Kt is not significant. On the other hand, the crest width of the PRBW increases linearly with different widths from 24 cm to 38 cm and 52 cm, while the wave transmission coefficient decreases non-linearly, corresponding to the increase in crest width.
Figure 10 shows that the wave transmission coefficient is at its largest with Kt = 0.4–0.75 for the crest width of B = 24. Meanwhile, the wave transmission coefficients for B = 38 cm and B = 52 cm are similar, with Kt = 0.2–0.65. This shows that when the crest width of the PRBW increases from B = 24 cm to B = 38 cm, the Kt reduces significantly from Kt = 0.4 to Kt = 0.2, corresponding to the emerged state; when the crest width continues to increase B ≥ 38 cm corresponding to the actual width of the PRBW ≥ 1.7 m, then the wave transmission coefficient changes insubstantially.
The crest widths affected the wave transmission coefficient (Kt) in all three working states (Figure 11), in which the wave transmission coefficient in the submerged state changes slightly with wide ranges of the ratio of B/Hi (i.e., the blue curve has a small slope). The B/Hi ratio is inversely proportional to the wave transmission coefficient. A higher ratio of B/Hi corresponds to a lower transmission coefficient. In the emerging state, the wave transmission coefficient ranges from 0.2 to 0.45. In the transition state, the range of Kt varies from 0.35 to 0.6, and for the submerged state, Kt ranges from 0.55 to 0.75.

3.2.2. The Effect of Crest Width on the Wave Reflection Coefficient

Figure 12 shows the relationship between the relative crest freeboard (Rc/Hm0,i) and wave reflection coefficient (Kr) for different crest widths. The wave reflection coefficients range from 0.15 to 0.45 in all cases of crest width. The wave reflection coefficient is proportional to the relative crest freeboard. However, the wave reflection coefficient fluctuates inconsiderably from 0.15–0.25 when the PRBW operates under a submerged state (Rc/Hm0,I < 0), but Kr alters remarkably from 0.2–0.45 when the PRBW operates under emerged state (Rc/Hm0,i > 0). When increasing the crest width from B = 24 cm to B = 38 cm and B = 52 cm under the same conditions (i.e., the waves, water level, and type of rock used for the structure), the wave reflection coefficient between the three cases changes slightly. This demonstrates that the wave reflection coefficient of the PRBW is not significantly affected by the crest widths.
The combination of the reflected waves in front of the PRBW and the incoming waves through the process of interference and resonance creates a change in the wave propagation on the PRBW. Figure 13 shows the increase in the spectral peak energy in front of the PRBW. Kf is the front wave disturbance coefficient, which is the ratio of the wave height right in front of the breakwater to the incident wave height. The increase in spectral peak energy leads to a change in the wave height in front of the structure, which can be increased by 1.4 times compared to the case without the structure, as described in Figure 14, which is consistent with the study of Le Xuan et al. [12].
The incremental wave height in front of the PRBW is proportional to the relative crest freeboard (Rc/Hm0,i) (Figure 14). When the PRBW is still operating in the submerged state (Rc/Hm0,i < 0), the front wave disturbance coefficient is approximately one and increases gradually when the PRBW operates under the transition state to the emerged state. The increment of the incoming wave disturbance coefficient (Kf) is due to the reflected wave in front of the structure, as such, the Kf is proportional to the wave reflection coefficient (Figure 15).

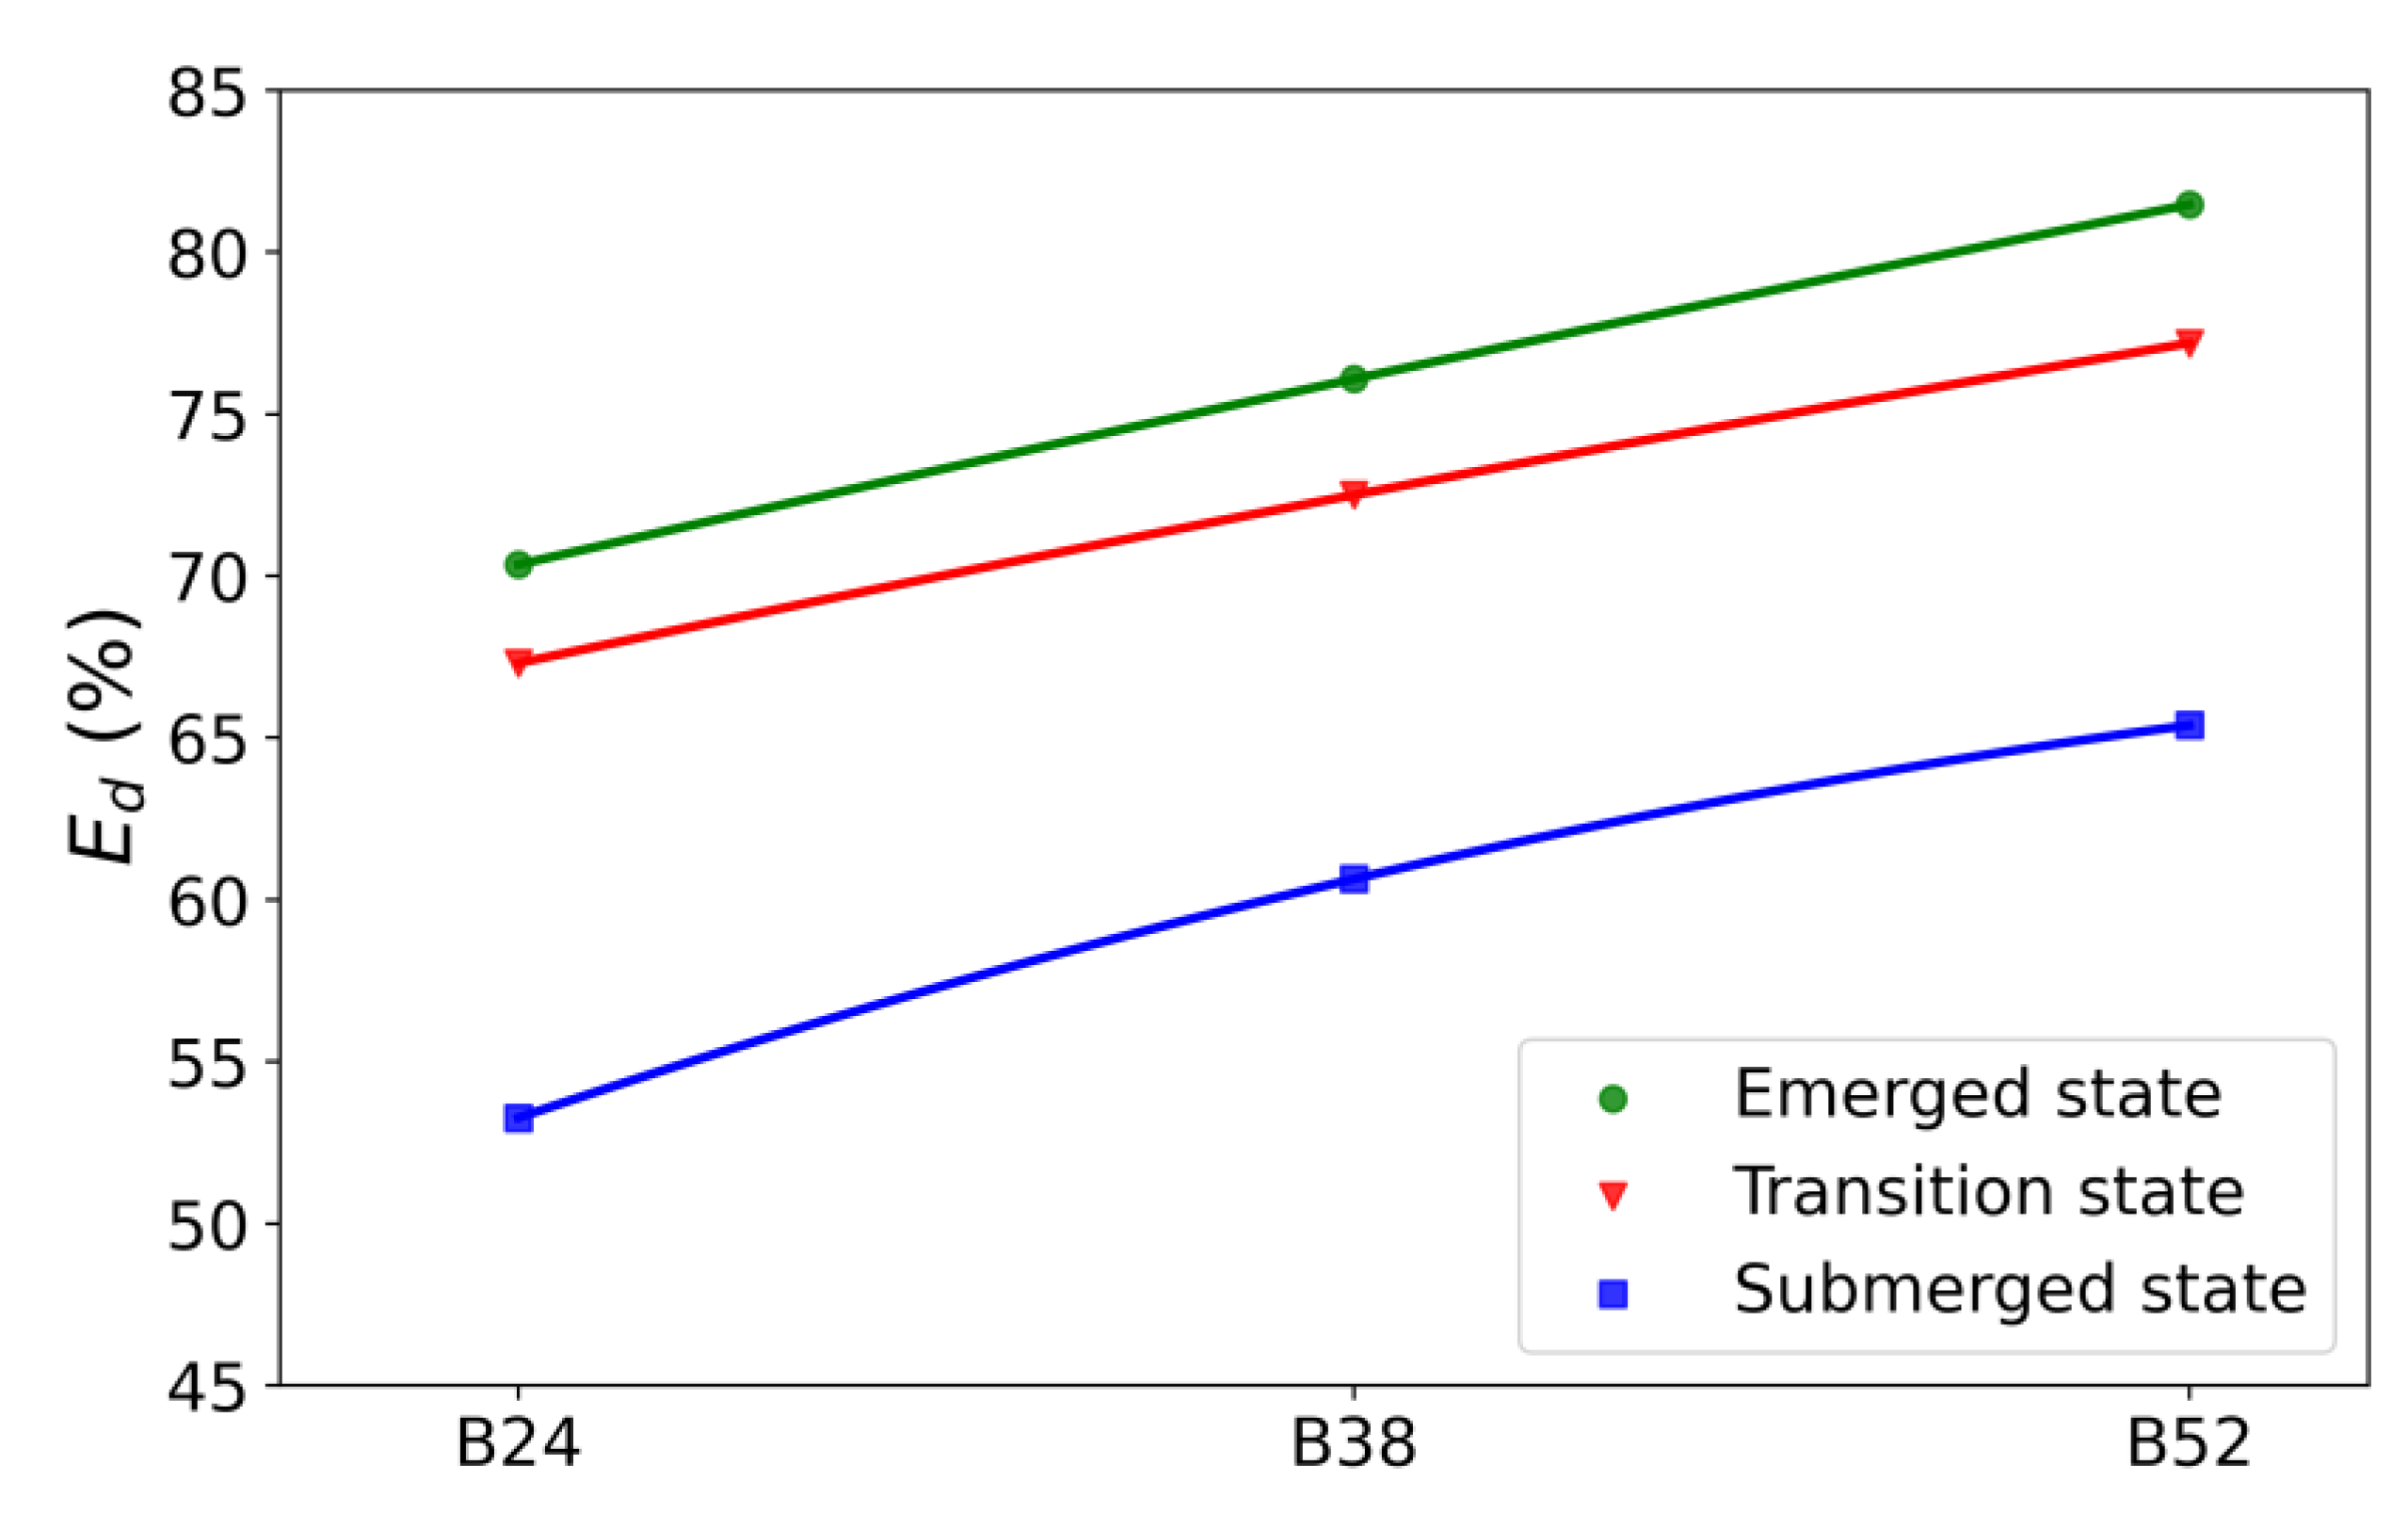
3.2.3. The Effect of Crest Width on Energy Dissipation

For the PRBW structure, waves are dissipated by the process of passing through the piles of columns, the layer of rocks, and by friction with the rocks. The results show that the percentage of wave energy dissipated by the PRBW structure ranges from 40% to more than 80% of the incident wave energy. More wave energy is dissipated due to the larger the crest width; the maximum energy dissipation corresponds to the largest crest width (B = 52 cm) (Figure 16). In the submerged state, when the relative crest freeboard is less than 0, the percentage of energy dissipation gradually increases from 40% to 70% for the three crest widths. In the emerged state, when the relative crest freeboard is greater than 1, the dissipated wave energy tends to slightly increase and starts decreasing when Rc/Hm0,i ≥ 1.5 for all cases. That means the dissipated energy only depends on the width and porosity of the PRBW.
Figure 17 shows the average percentage of wave dissipation energy with the working states of the PRBW (i.e., submerged, transition, and emerged states) with different crest widths. The average percentages of wave dissipation energy in the transition and emerged states are superior to that of the submerged state.
The largest wave energy dissipation under the emerged state is approximately 70.35–81.47%, and the lowest dissipation energy in the submerged state is about 53.27–65.39%. However, in the case of the submerged state, the wave dissipation energy also increases with the expansion of crest width, with average values of about 53.27%, 60.64%, and 65.39% corresponding to the widths B = 24, B = 38, and B = 52 cm, respectively. When the crest width of the PRBW increases by 14 cm, the wave dissipation energy of the structure increases by about 5% and obtains the maximum value of about 65.39%, corresponding to the maximum crest width under the submerged state.

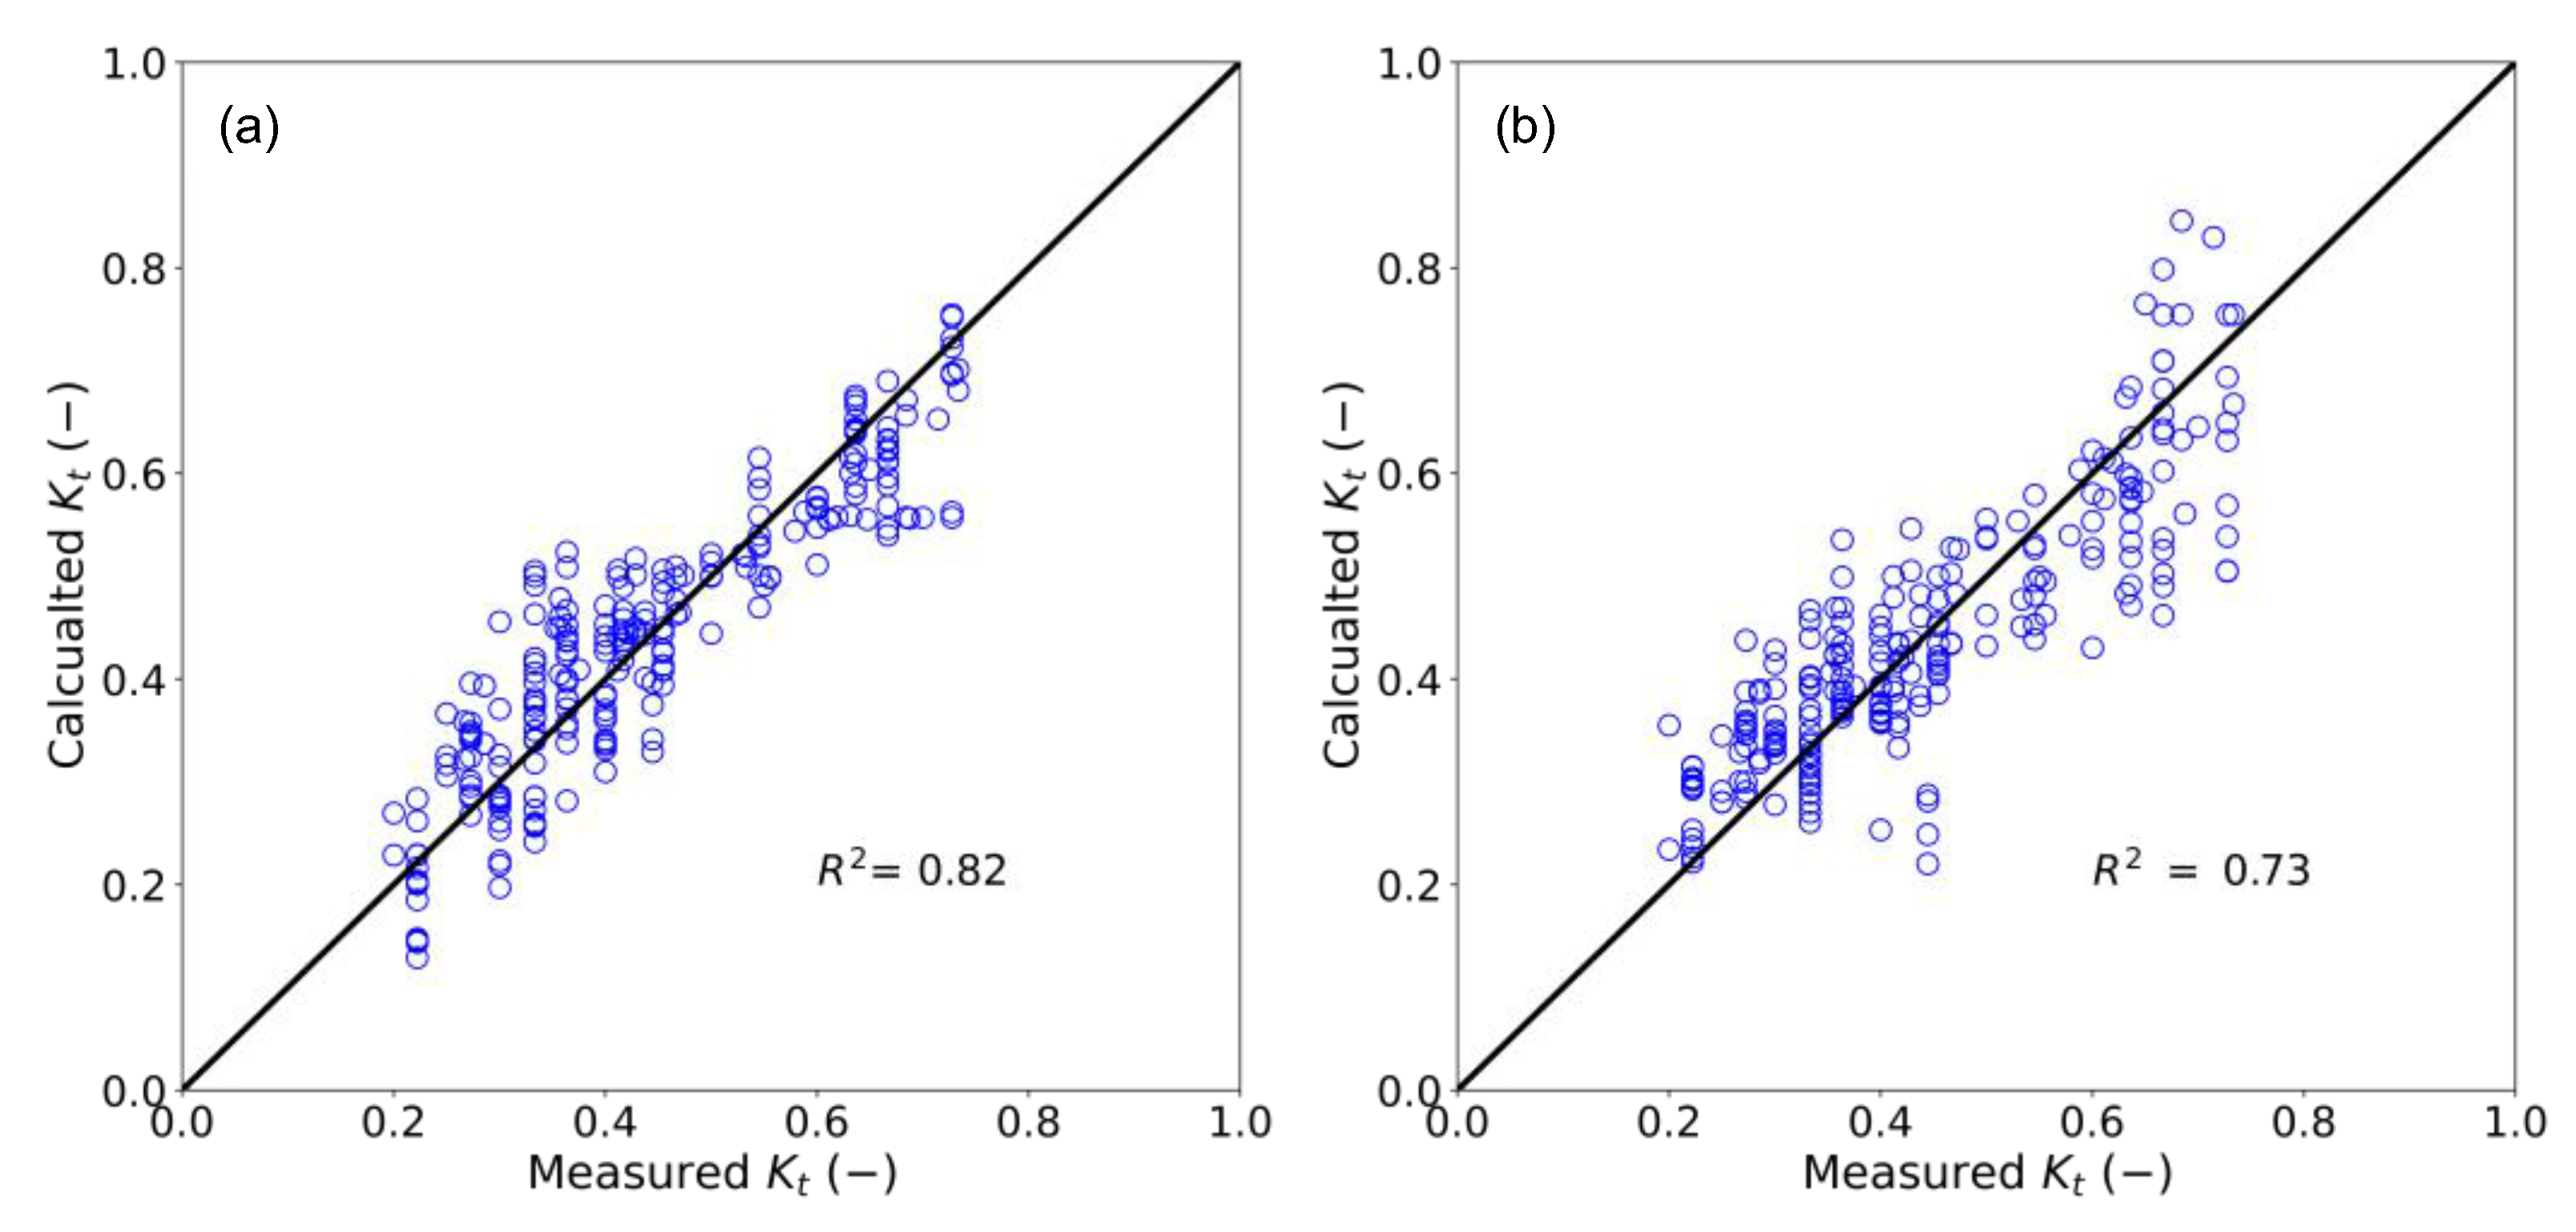
3.3. Development of Experimental Equations for the Wave Transmission Coefficient

The analysis of the parameters affecting wave propagation is the basis for building empirical formulas. Following Buckingham’s Π-theorem, we have a wave transmission coefficient Kt (a dependent variable) that is completely determined by the values of a set of several independent variables including crest freeboard (Rc), incident wave height (Hm0,i), wave length (Lm), water depth (D), crest width (Bn), and the nominal stone diameter (Dn50).
Hence, we investigated the correlation between seven variables with one dependent variable and six independent variables, as shown in Figure 18. Looking at the first row of Figure 18, it can be seen that the crest freeboard (Rc) and water depth (D) are strongly dependent on the wave transmission coefficient (Kt), with correlations of −0.86 and 0.86, respectively. Accordingly, the crest width (B) and wave length (Lp) have correlations with Kt of −0.35 and 0.37, respectively. Rc and B are inversely proportional to Kt, while D and Lp are proportional to Kt. The wave height (Hs) has less of an influence on the Kt, with a correlation of −0.02 (Figure 18). Therefore, we have performed a principal dimensionless variable analysis to generate the general formula as follows:
K t = F ( R c H m 0 , i , B H m 0 , i , B D n 50 , H m 0 , i D n 50 , D L )
From (6), we have evaluated the factors affecting Kt, including Rc/Hm0,i, D/L, Bn/Dn50, Hm0,i/Dn50, and D/L, but the contributions of these variables are different, as shown in Figure 18. Therefore, we focused on the distribution of the dimensionless variables to build the empirical formula.
In order to cover a wide range of factors, we derive two empirical equations based on the multivariate regression analysis, including linear and non-linear equations:
K t = a R c H m 0 , i + b D L m + c B D n 50 + d
where a, b, c, and d are the empirical constants characterizing the influence of the respective factors, namely, relative crest freeboard (Rc/Hm0,i), D/Lm, and (B/Dn50) to Kt.
a, b, c, and d are determined through the linear regression analysis method with the data obtained from the experimental results.
The values a, b, c, and d are defined based on the maximum correlation coefficient R2. For this linear equation, we obtained experimental data with R2 = 0.82, as shown in Figure 19a. The defined constants are a = −0.1619; b = 0.4817, c = −0.0161, and d = 0.6284.
Substituting a, b, and c into (7), we obtain an empirical formula that determines the wave propagation coefficient:
K t = 0.1619 R c H m 0 , i + 0.4817 D L m 0.0161 B D n 50 + 0.6284
The range of application of the formula is:
−1.07 ≤ Rc/Hm0,I ≤ 1.98
0.413 ≤ D/Lm ≤ 0.191
4.2 ≤ B/Dn50 ≤ 13.0
For the non-linear equation, we have developed an equation with multiple independent variables, including crest width B. The equation is as follows:
K t = a ( H m 0 , i B n ) α + b *
in which:
a = a + b R c D n 50 ( H m 0 , i B n ) 1 α b = c ( H m 0 , i D n 50 ) β + d D L m + e B D n 50 + f
The values a, b, c, and d will be selected so that the correlation coefficient R2 is highest (R2 = 0.73), as shown in Figure 19b, and the results of the constants are as follows: a = 0.000363; b = −0.088, c = −2.641, d = 1.161, e = −0.033, f = 3.019, α = −3.70, and β = −0.1.
The range of application of the formula is:
0.20 ≤ Kt ≤ 0.73
−1.07 ≤ Rc/Hm0,I ≤ 1.98
−2.25 ≤ Rc/Dn50 ≤ 5.25
0.16 ≤ Hm0,i/B ≤ 0.92
4.22 ≤ B/Dn50 ≤ 13.00
1.12 ≤ Hm0,i/Dn50 ≤ 5.52
0.041 ≤ D/Lm ≤ 0.191

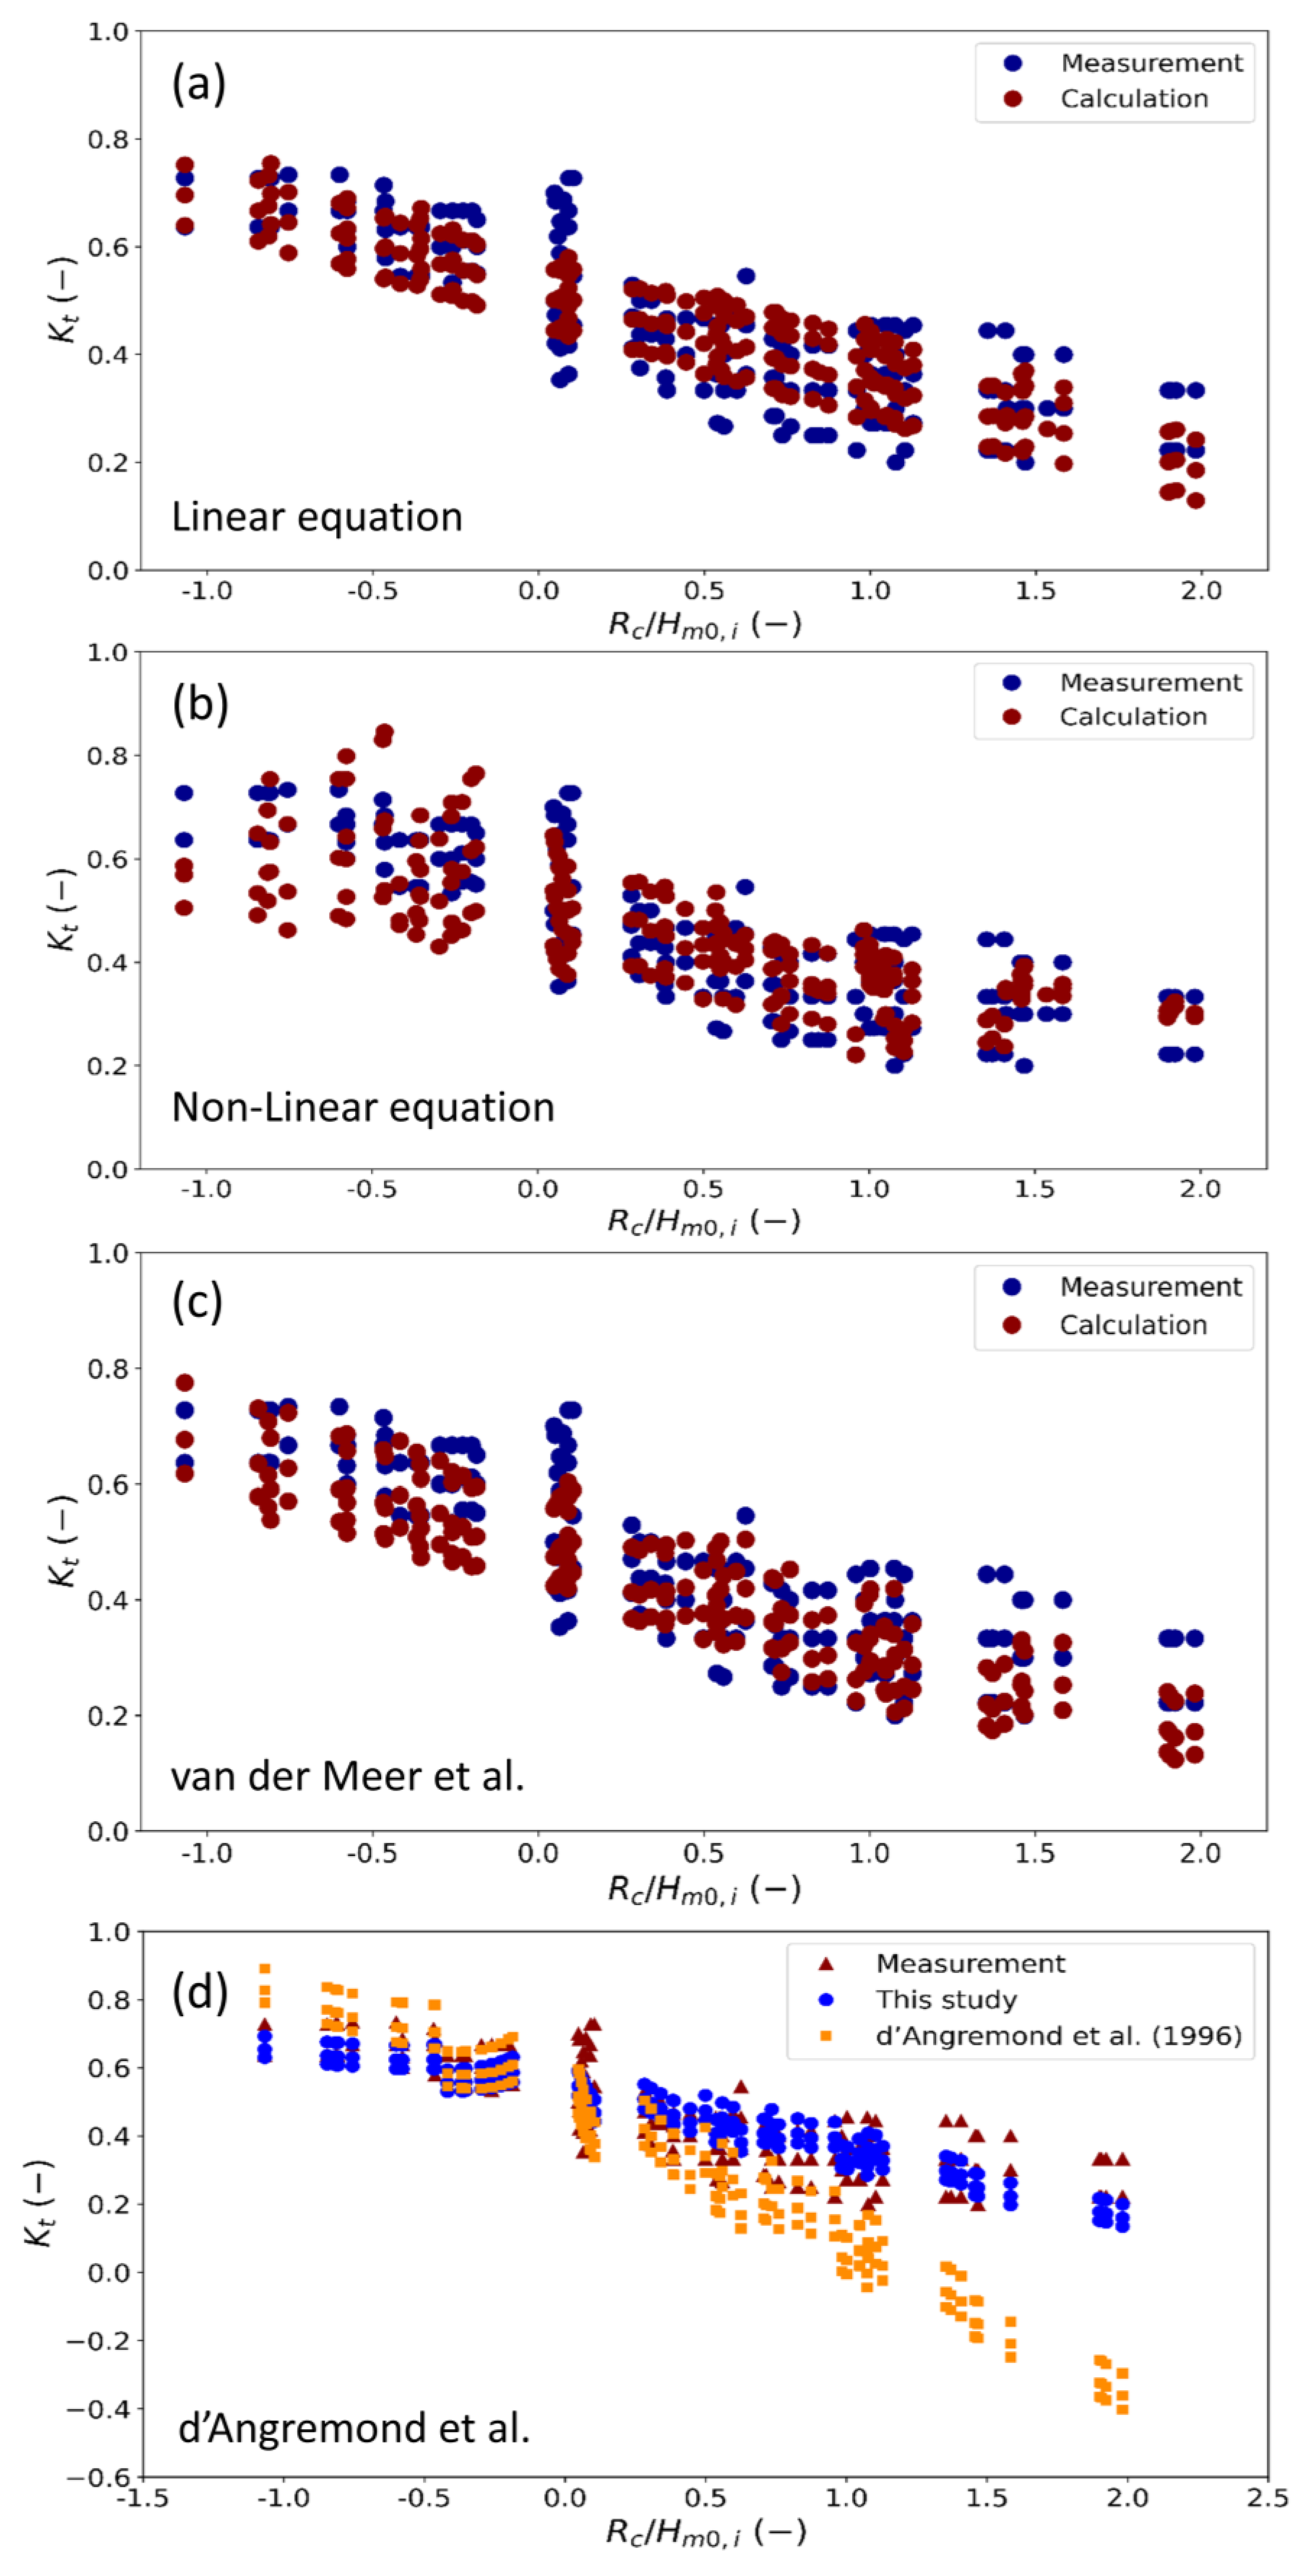
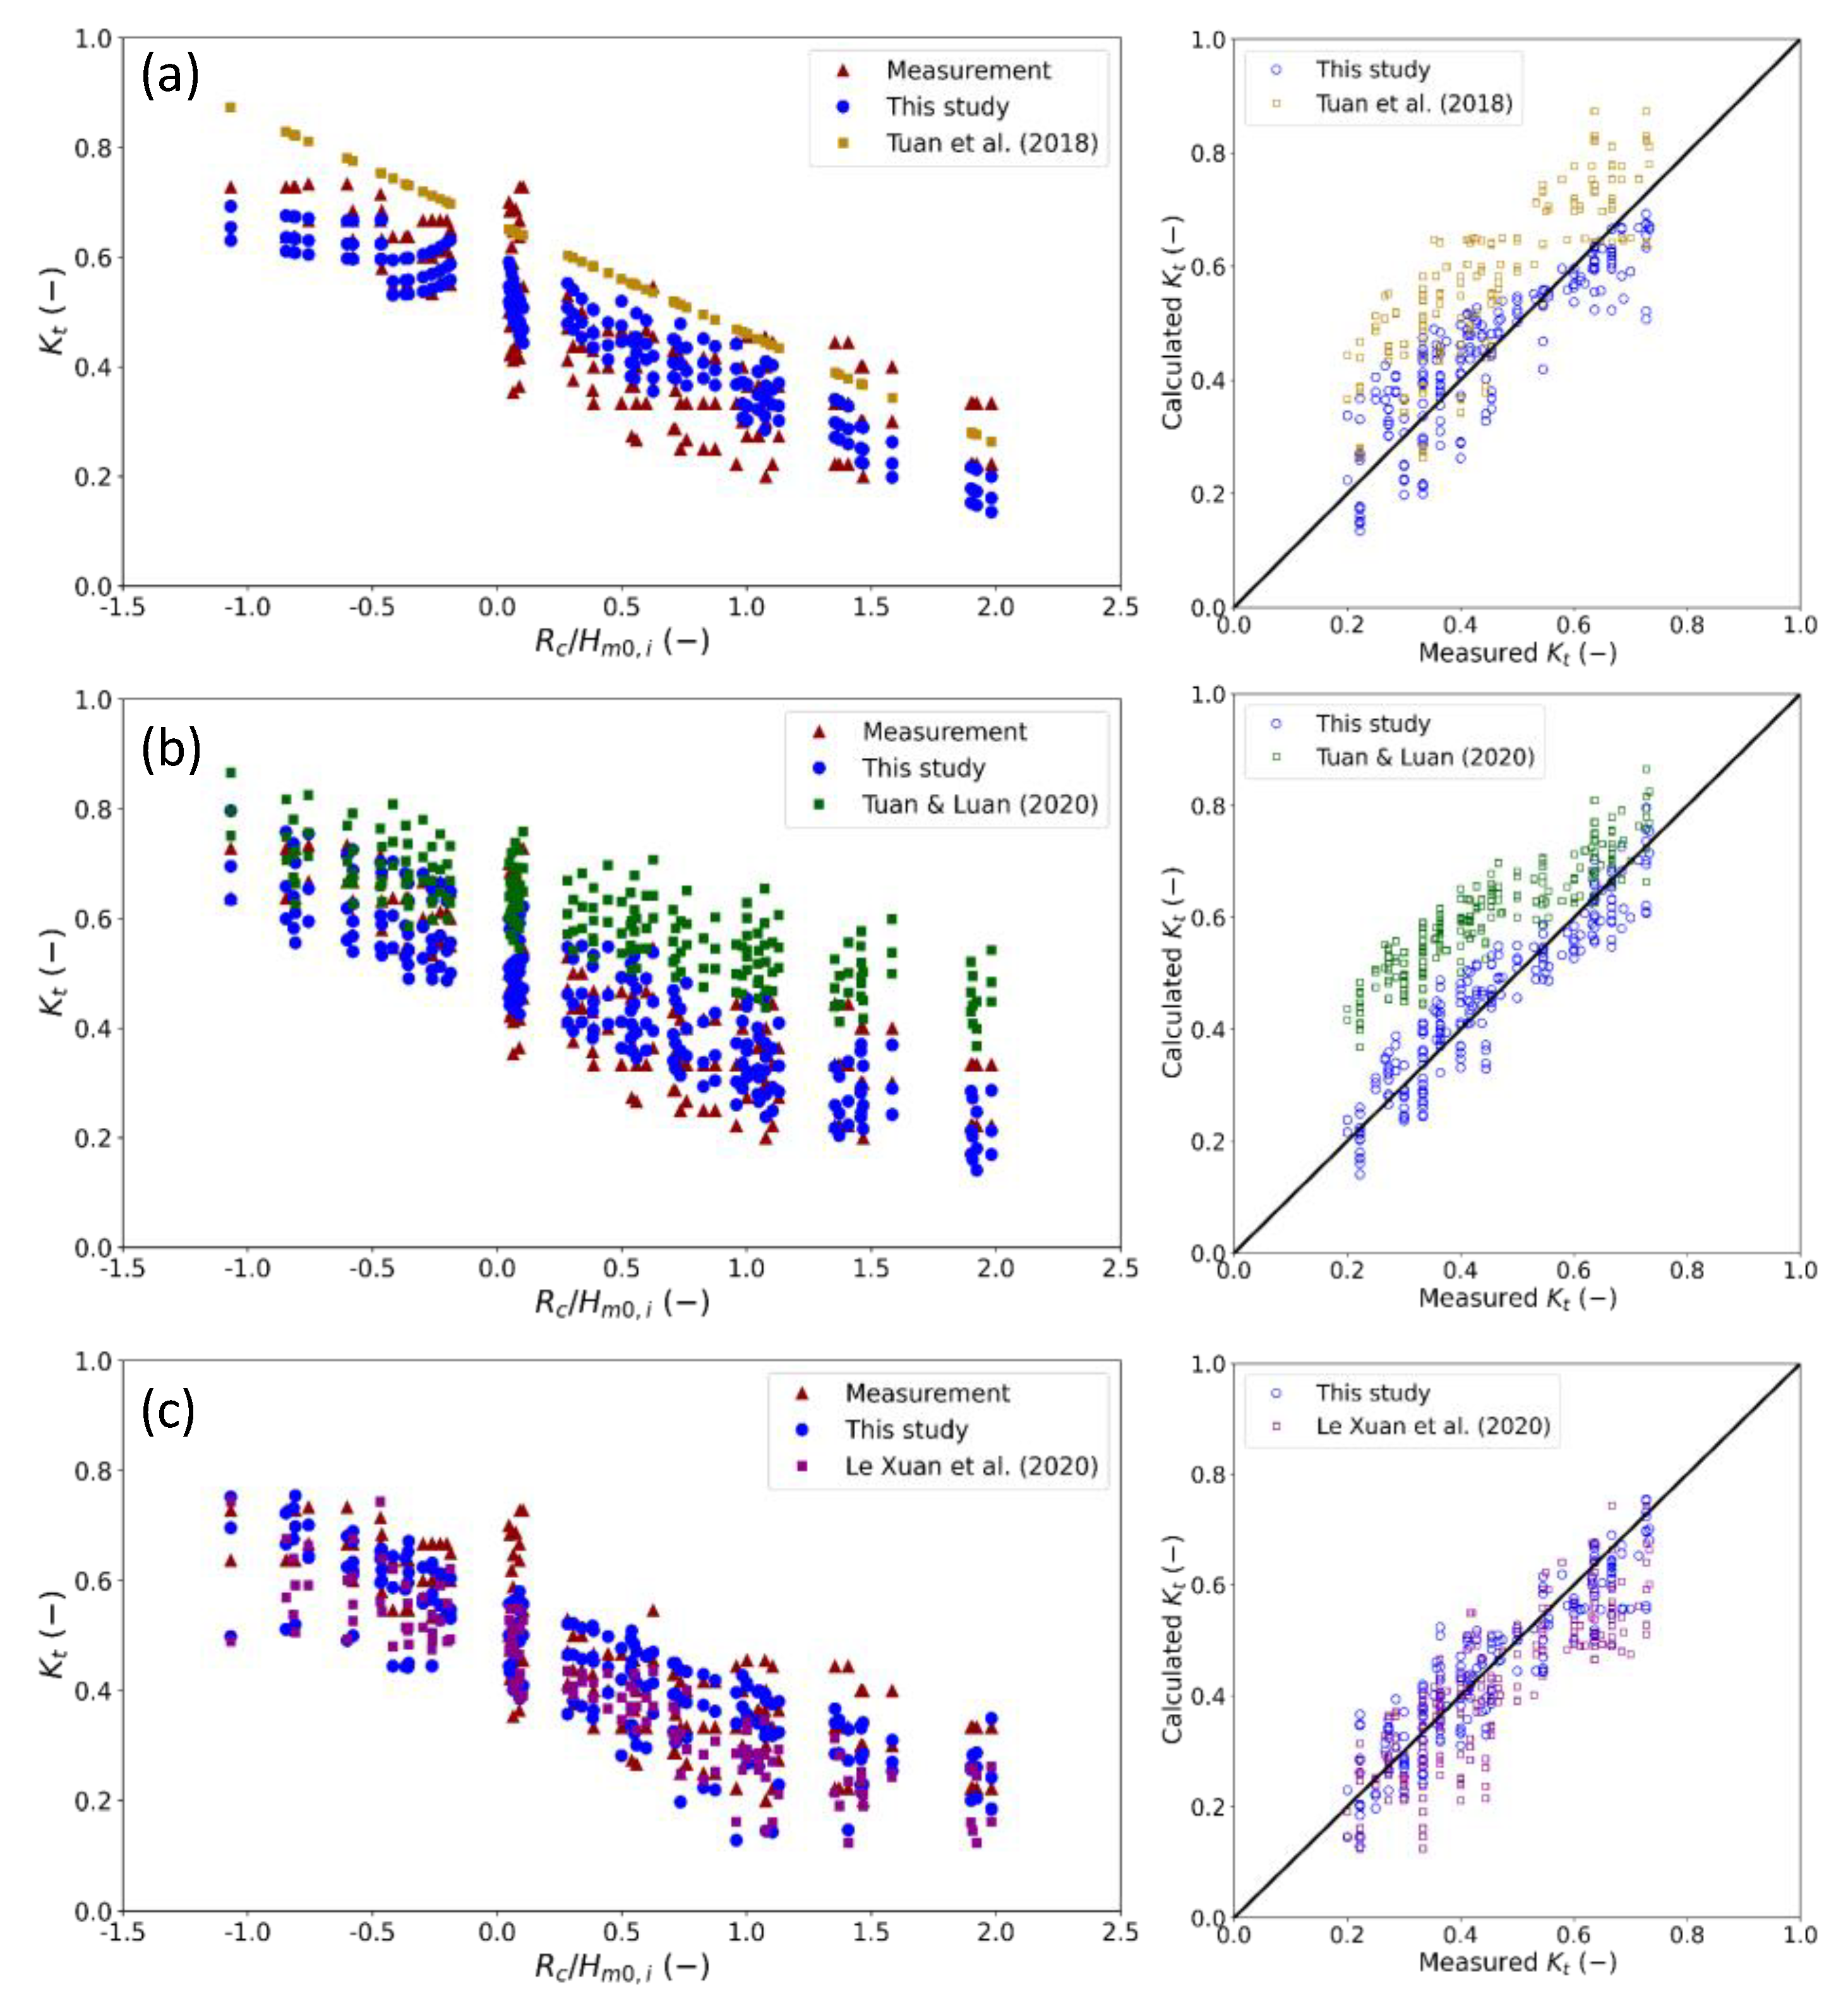
3.4. Comparison of Different Empirical Formulas for Pile–Rock Breakwaters

To evaluate the feasible application of different empirical formulas for pile–rock breakwaters and verify our proposed equations, we have applied two empirical formulas developed by d’Angremond et al. [23] and Van Der Meer et al. [24] for pile–rock breakwaters and compared the wave transmission coefficient (Kt) obtained from our empirical formulas with the Kt calculated from three formulas obtained from previous studies, including those of Le Xuan et al. [12], Tuan and Luan [25], and Tuan et al. [26]. We applied these empirical equations without any changes or adjustments of the parameters or equations and calculated Kt from these equations with our variables and wave conditions for the pile–rock breakwater used in this study. This was because Tuan et al. [26] had built an empirical equation that applied the formula from [23] for a perforated hollow breakwater to consider the surf similarity parameter or breaking wave Iribarren number ξ0 but did not involve the crest width in the equation. Moreover, Tuan and Luan [25] employed the equation from [24] for bamboo fences in the Mekong delta. Le Xuan et al. [12] applied both empirical formulas from Van Der Meer and Daemen [22,23] for pile–rock breakwaters but did not consider the variation of the crest width.
We have evaluated our proposed formulas, including our linear and non-linear equations, by comparing the Kt from our study with those from [23,24] in terms of the statistical performance, including adjusted R-squared (R2), MSE, and RMSE. From Table 3, it can be seen that for the linear equations, the statistical indices are similar to those of the two previous formulas [22,23].
Figure 20 shows a comparison between the wave transmission coefficients (Kt) against Rc/Hm0,i for the case of the linear equation, non-linear equation, and the comparison with the Kt calculated from [23] and [24]. It can be seen that there is good agreement between the Kt from the empirical formula and experimental data shown in Figure 20a,b. In addition, the trend from the linear and non-linear equations is consistent with the trend of Kt obtained from d’Angremond et al. [23] and Van Der Meer et al. [24] (Figure 20c,d), but it also has a slight difference in statistical parameters, as described in Table 3. The best statistical performance was obtained from Van der Meer’s formula with an adjusted R-squared value, R2 = 0.88, MSE = 0.0028, and RMSE = 0.053. Since this equation is in a general form, it can be applied to many types of breakwaters and explain 88% of the experimental data. The following linear equation’s statistical performance is R2 = 0.82, MSE = 0.0033, and RMSE = 0.058. The next one is d’Angremond’s et al. [23] formula with R2 = 0.78, MSE = 0.0041, and RMSE = 0.064. This formula had the best fit applied for a pile–rock breakwater with a range of −0.5 < Rc/Hm0,i < 0.3, and is not highly suitable for a range of −0.5 < Rc/Hm0,i < 2.0. Therefore, d’Angremond’s formula, it can be applied for submerged breakwaters; however, this formula may not be used for the emerged breakwater. The non-linear equation yields a lower adjusted R-squared (R2) value compared to the three equations mentioned above, with R2 = 0.73, MSE = 0.0044, and RMSE = 0.066 (see Table 3). However, the non-linear equation is valuable because it can fit well in a range of 0 < Rc/Hm0,i < 2, while the linear equation is unable to fit this range corresponding to the breakwater’s working conditions in submerged or semi-submerged states (Rc ≤ 0). This analysis confirms that our developed formulas are suitable for pile–rock breakwaters with linear and non-linear equations. This experiment also provides a data set for further studies that investigate different types of formulas for breakwaters.
In order to define the suitability of the previous formulas developed by Le Xuan et al. [12], Tuan and Luan [25], and Tuan et al. [26] for PRBWs, we have calculated Kt from these equations and evaluated the statistical indices as follows. Both formulas from [25,26] yield very low adjusted R-squared values and relatively high MSE and RMSE with values of R2 = 0.04, MSE = 0.0224, RMSE = 0.150, and R2 = 0.22, and MSE = 0.0285 and RMSE = 0.169, respectively (see Table 3). This means that these formulas should not be applied for pile–rock breakwaters. Therefore, we also recommend not applying these equations for PRBWs. The Kt obtained from the formula of Le Xuan et al. [12] is highly similar to the experimental data in this study but not so high with respect to its R2 = 0.61, MSE = 0.0086, and RMSE = 0.093 because of the same structure of the pile–rock breakwater. Nonetheless, Le Xuan et al.’s [12] equation can explain 61% of the experimental data while our equations can explain from 73% to 82% of the experimental data.
Figure 21 shows a comparison of the correlation of the Kt and relative crest freeboard and scatter plots between previous studies carried out by Le Xuan et al. [12], Tuan and Luan [25], and Tuan et al. [26] compared to the current study. The Kt from Tuan et al.’s study [26] (Figure 21a, left) decreases over time as the Rc/Hm0,i increases, and these values are found to be larger than the measurement data as well as the values in the current study (Figure 21a, right). The reason for this is that the porosity of the perforated hollow breakwater is very large, which leads to high wave energy transmission through the breakwater. In the study of Tuan and Luan [25] that experimented with a bamboo fence permeable breakwater, the values of the Kt also tend to decrease over time when Rc/Hm0,i increases (Figure 21b, left). However, most of the Kt values are overestimated compared to this study and its measurement values (Figure 21b, right). This is because the bamboo fence was built using bamboo poles and brushwood bundles, which have very low wave resistance. Therefore, their wave energy transmission capacity is very high. Figure 21c shows that the value of Kt is similar to those in Le Xuan et al. [12] because the breakwater in this study has the same structural shape as that in [12]. The centrifugal piles and rocks inside could significantly dissipate the wave energy compared to those in [25,26].

4. Conclusions

This study evaluated the effect of a PRBW’s width on the wave transmission, reflection, and energy dissipation coefficients using a 2D physical model in a wave flume in a laboratory. The results showed a significant influence of the crest width dimensions on the wave energy coefficients. A correlation was developed between the parameters that govern the efficiency of wave reduction, wave reflection, and wave energy dissipation. The results show that the crest width of the breakwater is inversely proportional to the wave transmission coefficient (Kt) and shows a clear tendency under an emerged state. The crest width of the breakwater was found to be directly proportional to the wave reduction efficiency and wave energy dissipation capacity of the breakwater in all working states (i.e., submerged and emerged states). The crest width was also found to have an influence on the wave reflection coefficient. The incident wave disturbance coefficient in front of the structure was found to be proportional to the reflected wave coefficient and the wave in front of the structure could increase in height by 1.4 times in the emerged state.
The results of this study serve as the basis for future PRBW designs that seek to enhance PRBWs’ efficiency under different natural conditions in the coastal Mekong Delta. It is necessary to consider this study’s findings when undertaking a structural stability analysis of breakwaters under nearshore wave conditions. We highly recommend applying a crest width of 2.7 m in a prototype (corresponding to B38 in the physical model) and operating the breakwater under an emerged state. Moreover, this study also developed empirical formulas and compared the wave transmission coefficients with previous studies with different types of breakwaters. The non-linear equation can fit well in a submerged state working with a range of 0 < Rc/Hm0,i < 2, while a linear equation is unable to fit this range due to the breakwater’s working condition in submerged or semi-submerged states (Rc ≤ 0). This study confirms that our developed formulas are suitable for PRBWs designed with linear and non-linear equations.
PRBW structures are suitable for application in other regions across the world with soft soil foundations and wave and tidal conditions similar to the west coast of the Mekong Delta. The empirical equations developed in this study are useful for designing breakwater structures without the need for physical experiments.

Author Contributions

Conceptualization, N.-M.N., D.D.V. and T.L.D.; methodology, D.D.V., T.L.D. and D.T.A.; software, T.L.D., N.T.P. and P.N.T.; validation, N.-M.N. and D.T.A.; formal analysis and data curation, T.L.D., N.T.P. and P.N.T.; investigation and resources, D.D.V., D.W., T.L.D. and N.-M.N.; writing—original draft preparation, N.-M.N., D.T.A., T.D.D. and A.H.T.; writing—review and editing, N.-M.N., D.T.A., T.D.D., D.W. and A.H.T.; visualization, T.L.D., N.T.P. and P.N.T.; supervision and project administration, D.T.A. and N.-M.N.; funding acquisition, N.-M.N. All authors have read and agreed to the published version of the manuscript.

Funding

The research work described herein was funded by the Ministry of Science and Technology (MOST) in the national project (No. ĐTĐL.CN-47/18) “Physical model experiment for investigating coastal protection measures of Mekong Delta”.

Institutional Review Board Statement

Not applicable.

Informed Consent Statement

Not applicable.

Data Availability Statement

The datasets generated during and/or analyzed in this study are available from the corresponding author upon reasonable request.

Acknowledgments

Many thanks to the Southern Institute of Water Resources Research for providing all data, model licenses, and necessary information. The authors greatly appreciate the editor and sincerely thank the three anonymous reviewers for their constructive comments provided to improve the manuscript.

Conflicts of Interest

The authors declare no conflict of interest.

References

  1. Kondolf, G.M.; Rubin, Z.K.; Minear, J.T. Dams on the Mekong: Cumulative Sediment Starvation. Water Resour. Res. 2014, 50, 5158–5169. [Google Scholar] [CrossRef]
  2. Kondolf, G.M.; Annandale, G.; Rubin, Z. Sediment Starvation from Dams in the Lower Mekong River Basin: Magnitude of the Effect and Potential Mitigation Opportunities. In Proceedings of the 36th IAHR World Congress, The Hague, The Netherlands, 28 June–3 July 2015. [Google Scholar]
  3. Minderhoud, P.S.J.; Coumou, L.; Erkens, G.; Middelkoop, H.; Stouthamer, E. Mekong Delta Much Lower than Previously Assumed in Sea-Level Rise Impact Assessments. Nat. Commun. 2019, 10, 3847. [Google Scholar] [CrossRef] [PubMed] [Green Version]
  4. Thanh, V.Q.; Reyns, J.; Van, S.P.; Anh, D.T.; Dang, T.D.; Roelvink, D. Sediment Transport and Morphodynamical Modeling on the Estuaries and Coastal Zone of the Vietnamese Mekong Delta. Cont. Shelf Res. 2019, 186, 64–76. [Google Scholar]
  5. Thanh, V.Q.; Reyns, J.; Wackerman, C.; Eidam, E.F.; Roelvink, D. Modelling Suspended Sediment Dynamics on the Subaqueous Delta of the Mekong River. Cont. Shelf Res. 2017, 147, 213–230. [Google Scholar] [CrossRef]
  6. Van Manh, N.; Dung, N.V.; Hung, N.N.; Kummu, M.; Merz, B.; Apel, H. Future Sediment Dynamics in the Mekong Delta Floodplains: Impacts of Hydropower Development, Climate Change and Sea Level Rise. Glob. Planet. Change 2015, 127, 22–33. [Google Scholar] [CrossRef] [Green Version]
  7. Erban, L.E.; Gorelick, S.M.; Zebker, H.A. Groundwater Extraction, Land Subsidence, and Sea-Level Rise in the Mekong Delta, Vietnam. Environ. Res. Lett. 2014, 9, 084010. [Google Scholar] [CrossRef]
  8. Dang, T.D.; Cochrane, T.A.; Arias, M.E. Future Hydrological Alterations in the Mekong Delta under the Impact of Water Resources Development, Land Subsidence and Sea Level Rise. J. Hydrol. Reg. Stud. 2018, 15, 119–133. [Google Scholar] [CrossRef]
  9. Gao, J.; Ma, X.; Dong, G.; Chen, H.; Liu, Q.; Zang, J. Investigation on the Effects of Bragg Reflection on Harbor Oscillations. Coast. Eng. 2021, 170, 103977. [Google Scholar] [CrossRef]
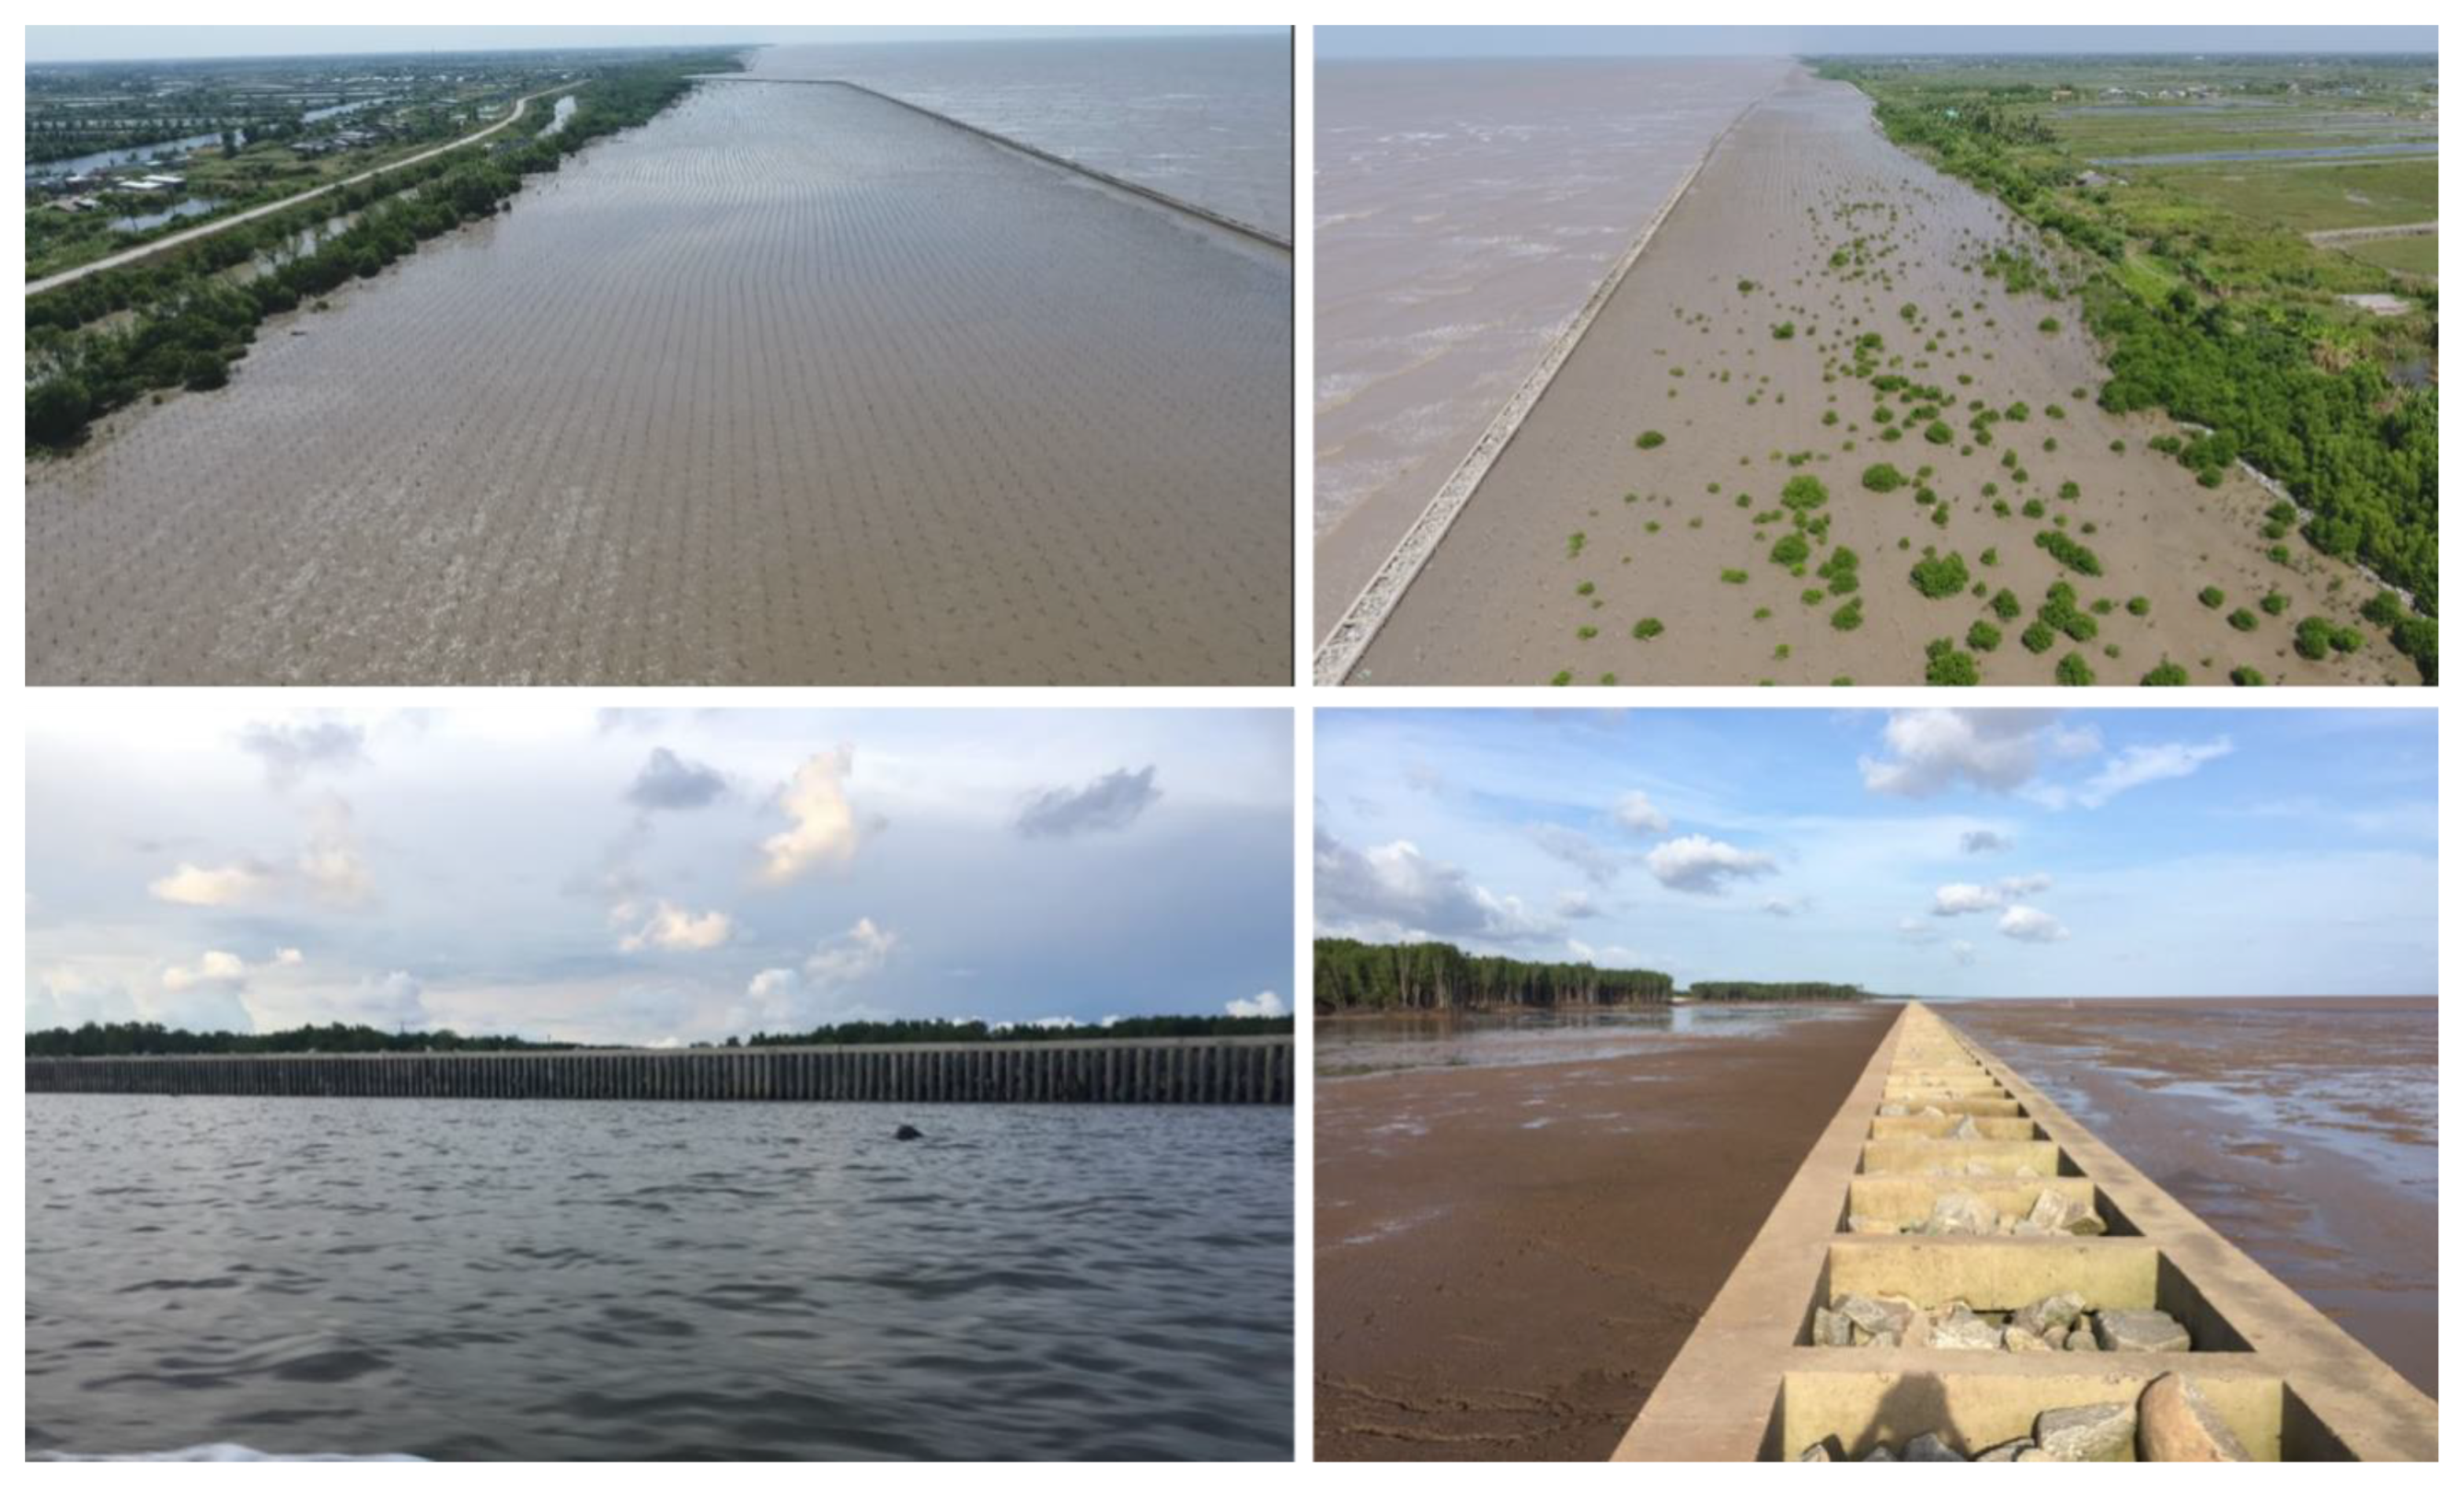
  10. Albers, T.; San, D.C.; Schmitt, K. Shoreline Management Guidelines: Coastal Protection in the Lower Mekong Delta. Dtsch. Ges. Für. Int. ZsGiZ GmbH Manag. Nat. Resour. Coast. Zone Soc. Trang. Prov. 2013, 1, 1–124. [Google Scholar]
  11. Tran, V.T.; Nguyen, H.H.; Pham, D.H.; Nguyen, D.N.; Nguyen, T.T. Hollow Cylinder Breakwater for Dissipation of Wave Energy to Protect the West Coast of Ca Mau Province in Vietnam. In Vietnam Symposium on Advances in Offshore Engineering; Springer: Singapore, 2018; pp. 599–605. [Google Scholar]
  12. Le Xuan, T.; Ba, H.T.; Le Manh, H.; Do Van, D.; Nguyen, N.M.; Wright, D.P.; Bui, V.H.; Mai, S.T.; Anh, D.T. Hydraulic Performance and Wave Transmission through Pile-Rock Breakwaters. Ocean Eng. 2020, 218, 108229. [Google Scholar] [CrossRef]
  13. Nguyen, T.P.; Van Tam, N.; Parnell, K.E. Community Perspectives on an Internationally Funded Mangrove Restoration Project: Kien Giang Province, Vietnam. Ocean Coast. Manag. 2016, 119, 146–154. [Google Scholar] [CrossRef]
  14. Nguyen, T.P.; Parnell, K.E. Gradual Expansion of Mangrove Areas as an Ecological Solution for Stabilizing a Severely Eroded Mangrove Dominated Muddy Coast. Ecol. Eng. 2017, 107, 239–243. [Google Scholar] [CrossRef]
  15. Luom, T.T.; Phong, N.T.; Anh, N.T.; Tung, N.T.; Tu, L.X.; Duong, T.A. Using Fine-Grained Sediment and Wave Attenuation as a New Measure for Evaluating the Efficacy of Offshore Breakwaters in Stabilizing an Eroded Muddy Coast: Insights from Ca Mau, the Mekong Delta of Vietnam. Sustainability 2021, 13, 4798. [Google Scholar] [CrossRef]
  16. Nhan, N.H. Assessing the impact of embankment to create beach in the west coast of Ca Mau province. Assess. Impact. Embankment Create Beach West Coast Ca Mau Prov. 2013, 17, 4–18. (In Vietnamese) [Google Scholar]
  17. Hur, D.-S. Deformation of Multi-Directional Random Waves Passing over an Impermeable Submerged Breakwater Installed on a Sloping Bed. Ocean Eng. 2004, 31, 1295–1311. [Google Scholar] [CrossRef]
  18. Hur, D.-S.; Lee, K.-H.; Choi, D.-S. Effect of the Slope Gradient of Submerged Breakwaters on Wave Energy Dissipation. Eng. Appl. Comput. Fluid Mech. 2011, 5, 83–98. [Google Scholar] [CrossRef] [Green Version]
  19. Tsai, C.-P.; Chen, H.-B.; Lee, F.-C. Wave Transformation over Submerged Permeable Breakwater on Porous Bottom. Ocean Eng. 2006, 33, 1623–1643. [Google Scholar] [CrossRef]
  20. Wu, Y.-T.; Hsiao, S.-C. Propagation of Solitary Waves over a Submerged Permeable Breakwater. Coast. Eng. 2013, 81, 1–18. [Google Scholar] [CrossRef]
  21. Gao, J.; Ma, X.; Zang, J.; Dong, G.; Ma, X.; Zhu, Y.; Zhou, L. Numerical Investigation of Harbor Oscillations Induced by Focused Transient Wave Groups. Coast. Eng. 2020, 158, 103670. [Google Scholar] [CrossRef]
  22. van der Meer, J.W.; Daemen, I.F. Stability and Wave Transmission at Low-Crested Rubble-Mound Structures. J. Waterw. Port Coast. Ocean Eng. 1994, 120, 1–19. [Google Scholar] [CrossRef]
  23. d’Angremond, K.; Van Der Meer, J.W.; De Jong, R.J. Wave Transmission at Low-Crested Structures. In Proceedings of the 25th International Conference on Coastal Engineering, Orlando, FL, USA, 2–6 September 1996; pp. 2418–2427. [Google Scholar]
  24. Van der Meer, J.W.; Briganti, R.; Zanuttigh, B.; Wang, B. Wave Transmission and Reflection at Low-Crested Structures: Design Formulae, Oblique Wave Attack and Spectral Change. Coast. Eng. 2005, 52, 915–929. [Google Scholar] [CrossRef]
  25. Quang, T.T.; Trong, L.M. Monsoon Wave Transmission at Bamboo Fences Protecting Mangroves in the Lower Mekong Delta. Appl. Ocean Res. 2020, 101, 102259. [Google Scholar] [CrossRef]
  26. Tuan, T.Q.; San, D.C.; Duong, D.V. Research on the Wave Reduction Efficiency of Perforated Hollow Breakwater on the Wave Flume. J. Waterw. Port Coast. Ocean Eng. 2018. Available online: https://vawr.org.vn/Upload/BaibaoKH/thieu-quang-tuan-49-2018.pdf (accessed on 25 October 2022). (In Vietnamese).
Figure 1. Examples of pile–rock breakwater structures constructed along the west coast of the Vietnamese Mekong Delta.
Jmse 10 01762 g001
Figure 2. The wave flume house (a) and absorber at the lee side of wave flume (b).
Jmse 10 01762 g002
Figure 3. Sketch of experimental layout and equipment installation in the wave flume (note: diagram is not to scale).
Jmse 10 01762 g003
Figure 4. Cross-section, longitudinal, and plan view and dimensions of the pile–rock breakwater (units: cm).
Jmse 10 01762 g004
Figure 5. Experimental pile–rock breakwater set up in the wave flume in the laboratory.
Jmse 10 01762 g005
Figure 6. Width of the dike structure of centrifugal piles and poured rock in the experimental scenarios.
Jmse 10 01762 g006
Figure 7. Wave spectrum in front of and behind the transition slope face at wave gauge WG1 (a) and WG5 (b).
Jmse 10 01762 g007
Figure 8. Wave spectrum from observation at Ganh Hao coast in 2019 (a) and experiment (b).
Jmse 10 01762 g008
Figure 9. The sketch of the experiment regarding the effects of wave propagation on the PRBW.
Jmse 10 01762 g009
Figure 10. The relationship between the relative crest freeboard (Rc/Hm0,i) and the wave transmission coefficient (Kt).
Jmse 10 01762 g010
Figure 11. The relationship between B/Hi and wave transmission coefficient (Kt).
Jmse 10 01762 g011
Figure 12. The relationship between relative crest freeboard (Rc/Hm0,i) and wave reflection coefficient (Kr).
Jmse 10 01762 g012
Figure 13. Front wave disturbance spectrum (Hf) and incident wave spectrum (Hi).
Jmse 10 01762 g013
Figure 14. The relationship between front wave disturbance coefficient (Kf) and relative crest freeboard (Rc/Hm0,i).
Jmse 10 01762 g014
Figure 15. The relationship between wave reflection coefficient (Kr) and front wave disturbance coefficient (Kf).
Jmse 10 01762 g015
Figure 16. The relationship between relative crest freeboard (Rc/Hm0,i) and percentage of energy dissipation (Ed).
Jmse 10 01762 g016
Figure 17. The relationship between crest width (B) and the average percentage of wave dissipation energy (Ed) at three working states of the breakwater.
Jmse 10 01762 g017
Figure 18. Correlation matrix of independent variables for building empirical formulas.
Jmse 10 01762 g018
Figure 19. Regression analysis for (a) linear and (b) non-linear empirical equations.
Jmse 10 01762 g019
Figure 20. The comparison of Kt against the relative crest freeboard using different empirical equations. The comparison of measurement data and calculated values from linear equation (a), non-linear equation (b), applied van der Meer equation (c) and applied d’Angremond equation (d).
Jmse 10 01762 g020
Figure 21. The correlation of Kt and relative crest freeboard and scatter plots obtained from different formulas compared with our study. The comparison of Kt from measurement data with this study and other previous studies including Tuan et al. (2018) (a), Tuan & Luan (2020) (b) and Le Xuan et al. (2020) (c).
Jmse 10 01762 g021
Table 1. Actual construction and experimental model dimensions.
DimensionScenariosActual (cm)Model (cm)
Height-28040
Length-850120
Width (B)B2417024
B3827038
B5237052
Rock mix-30–504–7
Centrifugal pile diameter-304
Table 2. Experimental scenarios of different crest widths, water depths, and wave parameters.
ScenariosWater Depth D (cm)
and Crest Freeboard Rc (cm)
Wave Parameters
No PRBW
B24
B38
B52
D = 20 cm (Rc = +20 cm)
D = 25 cm (Rc = +15 cm)
D = 30 cm (Rc = +10 cm)
D = 35 cm (Rc = +5.0 cm)
D = 40 cm (Rc = +0.0 cm)
D = 45 cm (Rc = −5.0 cm)
D = 50 cm (Rc = −10 cm)
Hs = 12 cm; Tp = 1.51 s
Hs = 12 cm; Tp = 1.89 s
Hs = 12 cm; Tp = 2.27 s
Hs = 12 cm; Tp = 2.65 s
Hs = 17 cm; Tp = 1.89 s
Hs = 17 cm; Tp = 2.27 s
Hs = 17 cm; Tp = 2.65 s
Hs = 22 cm; Tp = 2.27 s
Hs = 22 cm; Tp = 2.65 s
Hs = 27 cm; Tp = 2.65 s
Table 3. Statistical performance of various formulas from different studies.
Empirical EquationsR2MSERMSE
van der Meer et al. (2005)0.880.00280.053
d.Angremond et al. (1996)0.780.00410.064
Linear equation (current study)0.820.00330.058
Non-linear equation (current study)0.730.00440.066
Tuan et al. (2018)0.040.02240.150
Tuan and Luan. (2020)0.220.02850.169
Le Xuan et al. (2020)0.610.00860.093
Note: R2 is adjusted R-squared, R2 = 1—(MSerror/MStotal), MSerror: mean square due to error, and MStotal: mean square total.
Publisher’s Note: MDPI stays neutral with regard to jurisdictional claims in published maps and institutional affiliations.

