


Research on Uncertainty Evolution of Ship Collision Status Based on Navigation Environment


Abstract
1. Introduction
2. Selection of Indexes and Calculation of Probabilities
2.1. Ship Collision Probability Model
2.2. Evaluation Index of Key Navigational Environment Impact Factors
2.3. Grading of Navigational Environment Impact Factors
2.4. Calculation of the Impact Probability of Ship Collision Accidents
3. Model of Evolutionary Trends in Navigational Environmental Factors
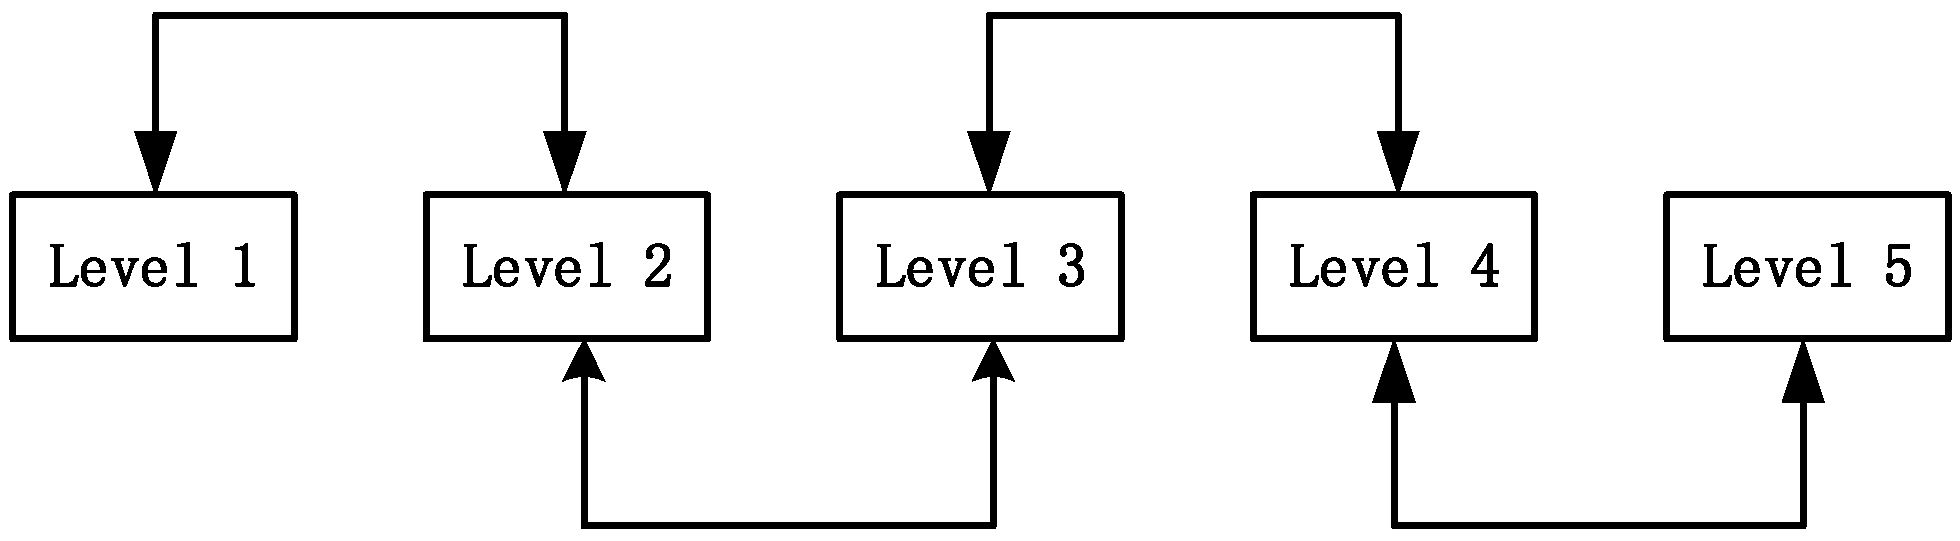
3.1. State Extraction of Navigational Environment Impact Factors
3.2. Uncertainty Evolutionary Rules of the Navigational Environment
3.3. Distance Model between the Uncertainty Evolution and the Ideal Worst Value
3.4. Uncertainty Evolutionary Mechanism Analysis of the Navigational Environment
4. Case Study
4.1. Study Water Area
4.2. Analysis of Ship Collision Probability
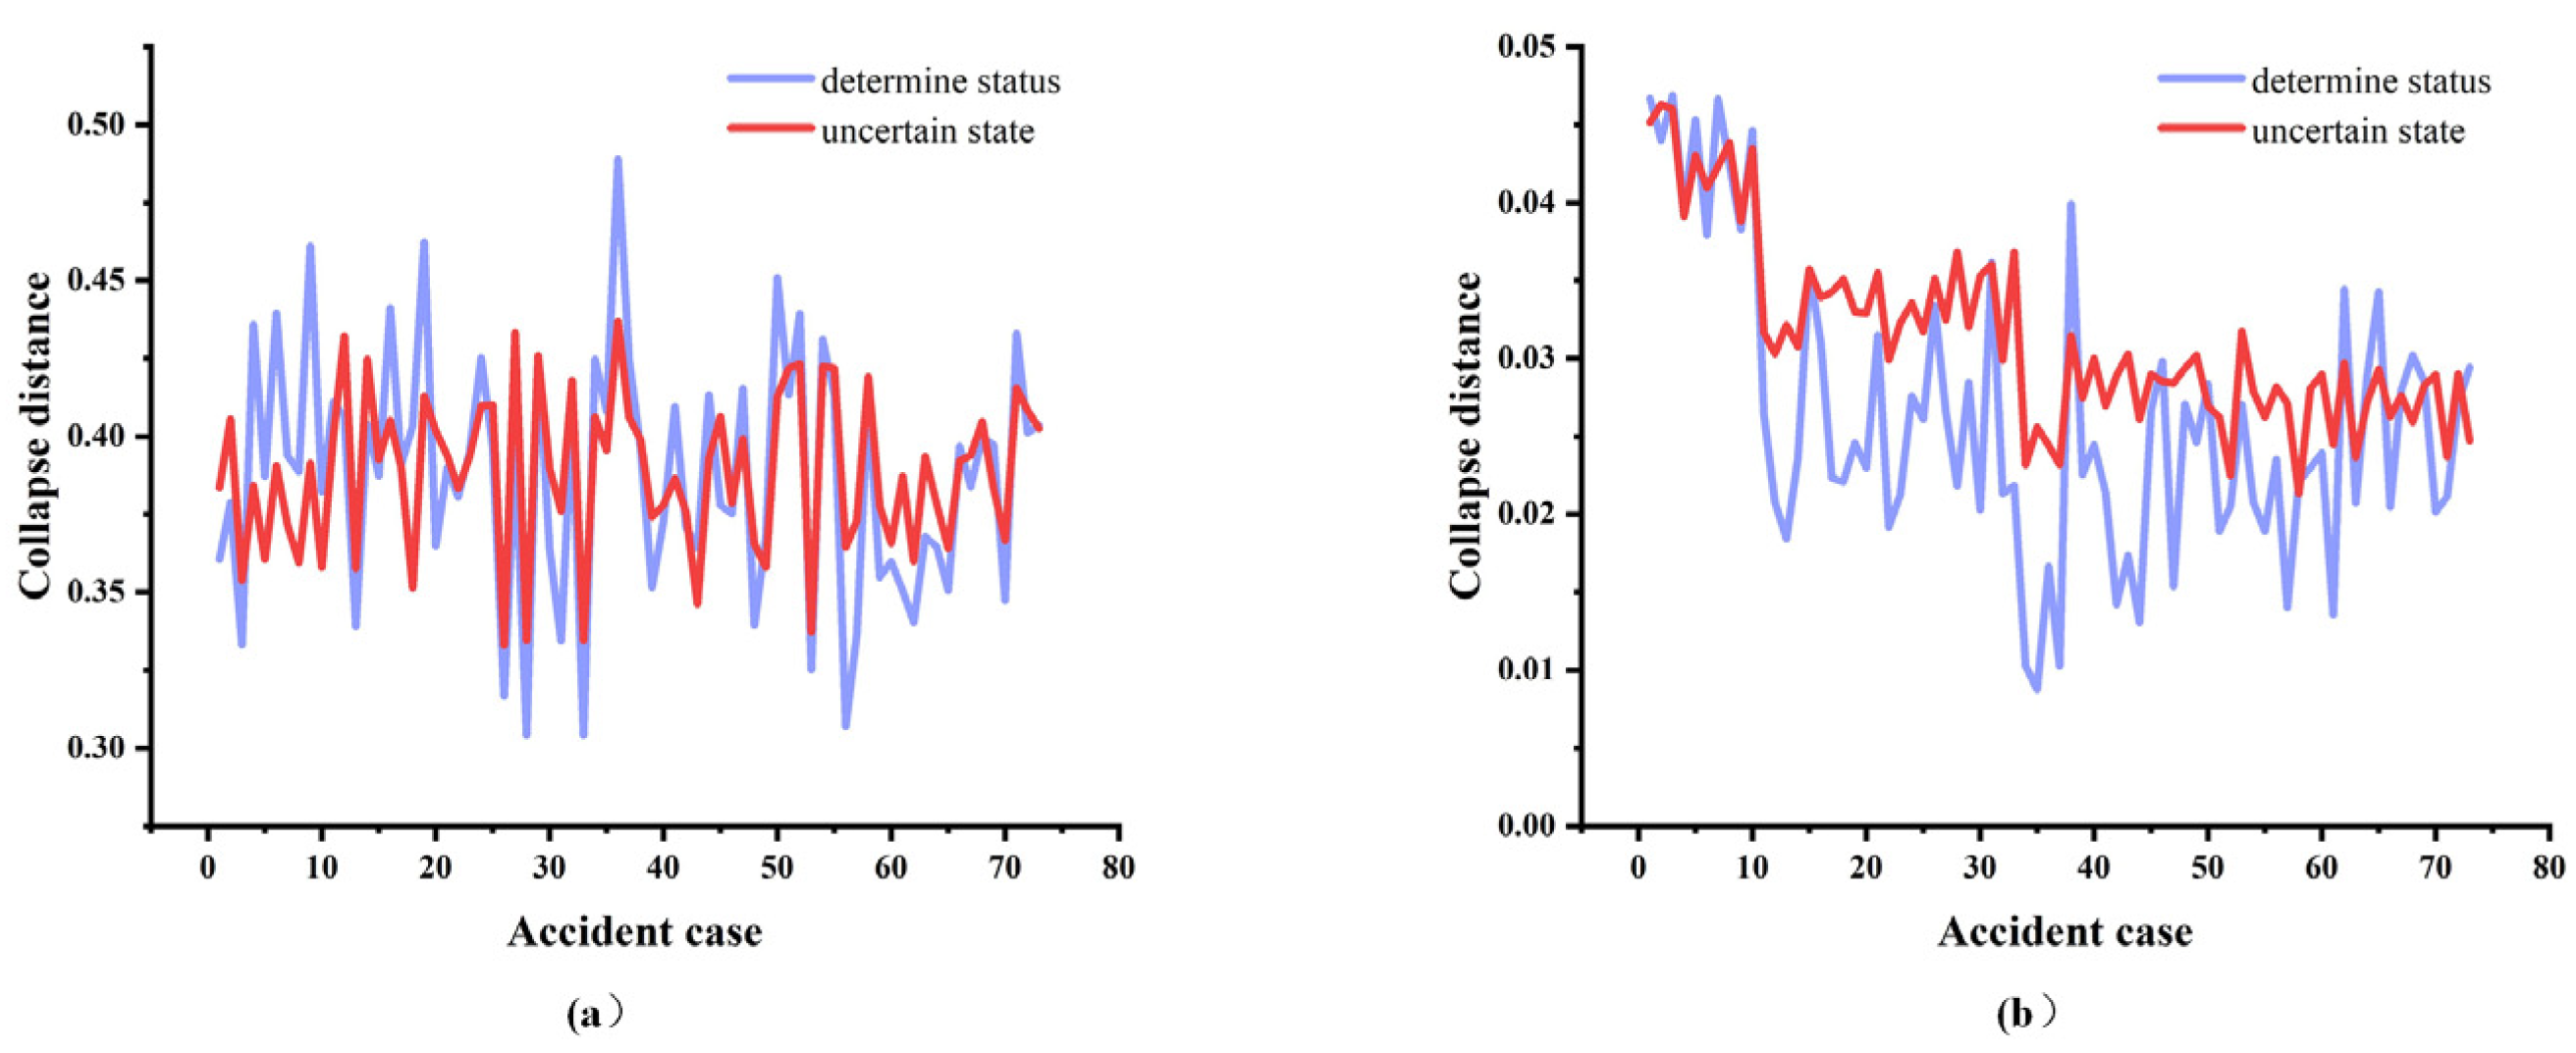
4.3. Uncertainty Evolution Laws
5. Conclusions and Prospects
- (1)
- In view of maritime safety, ship navigation is always influenced by one or several impact factors. The environmental system stress determines whether a ship’s collision risk develops toward collapse. To describe such a collapse trend, the brittleness parameter of the key impact factors at different levels was described by the impact probability of accidents. The brittleness parameter can directly measure the degree of collapse of the navigational environment system and impact factors. Moreover, Bayes conditional probability was introduced to calculate the brittleness parameter, aiming to reflect the relationship between the distributions of the key factors among different levels of historical accidents as well as the probability of natural occurrence. This relationship also determines the subsequent evolution laws of collapse distance. The results show that the hydrometeorology wind factor has the greatest impact on ship collision risk during the evolution process.
- (2)
- The probabilities of the natural occurrence of key navigational environment impact factors at different levels change randomly. In accident statistics, the number of accidents at a level of a key impact factor is also random. As a result, the calculation of ultimate impact probabilities tends to be uncertain. The impact probability of all impact factors is uncertain to some extent due to the uncertainty of the impact probability distribution of a single key impact factor. However, the impact probability of all impact factors was finally determined by the ratio between the number of key impact factors at different levels as well as the probability of natural occurrence in the system. The impact probability at the levels of the adjacent extrema decreased or increased with a posterior decrease in the uncertainty. Because of this, primary attention should be given to the extrema of the impact probabilities of the key impact factors in the system when studying accident mechanisms.
Author Contributions
Funding
Institutional Review Board Statement
Informed Consent Statement
Data Availability Statement
Conflicts of Interest
References
- Ivanovsky, N.; Chernyi, S.; Sokolov, S.; Anton, Z.; Anton, Z. Algorithm design for ship’s steering with specified limitations under various weather conditions. Brodogr. Teor. I Praksa Brodogr. I Pomor. Teh. 2021, 72, 19–32. [Google Scholar] [CrossRef]
- Wang, J.; Zou, Z.; Wang, T. Path following of a surface ship sailing in restricted waters under wind effect using robust H∞ guaranteed cost control. Int. J. Nav. Archit. Ocean. Eng. 2019, 11, 606–623. [Google Scholar] [CrossRef]
- Chen, C.; Sasa, K.; Prpić-Oršić, J.; Mizojiri, T. Statistical analysis of waves’ effects on ship navigation using high-resolution numerical wave simulation and shipboard measurements. Ocean. Eng. 2021, 229, 108757. [Google Scholar] [CrossRef]
- Tian, Y.; Sun, X. Risk evaluation Index system of navigation environment of Qiongzhou strait based on FAHP. In Proceedings of the International Conference on Transportation Information and Safety (ICTIS), Wuhan, China, 25–28 June 2015; pp. 729–731. [Google Scholar]
- Qi, L.; Ji, Y.; Balling, R.; Xu, W. A cellular automaton-based model of ship traffic flow in busy waterways. J. Navig. 2021, 74, 605–618. [Google Scholar] [CrossRef]
- Chou, C.C.; Su, Y.L.; Li, R.F.; Tsai, C.L.; Ding, J.F. Key navigation safety factors in Taiwanese harbors and surrounding waters. J. Mar. Sci. Technol. 2015, 23, 12. [Google Scholar]
- Ozturk, U.; Cicek, K. Individual collision risk assessment in ship navigation: A systematic literature review. Ocean. Eng. 2019, 180, 130–143. [Google Scholar] [CrossRef]
- Li, B. Navigation risk assessment scheme based on fuzzy Dempster–Shafer evidence theory. Int. J. Adv. Robot. Syst. 2018, 15, 1729881418799572. [Google Scholar] [CrossRef]
- Liu, J.; Jiang, X.; Huang, W.; He, Y.; Yang, Z. A novel approach for navigational safety evaluation of inland waterway ships under uncertain environment. Transp. Saf. Environ. 2022, 4, tdab029. [Google Scholar] [CrossRef]
- Chen, P.; Huang, Y.; Mou, J.; Van Gelder, P.H.A.J.M. Probabilistic risk analysis for ship-ship collision: State-of-the-art. Saf. Sci. 2019, 117, 108–122. [Google Scholar] [CrossRef]
- Chen, Y.; Xie, C.; Chen, S.; Huang, L. A New Risk-based Early-warning Method for Ship Collision Avoidance. IEEE Access 2021, 9, 108236–108248. [Google Scholar] [CrossRef]
- Fujii, Y.; Shiobara, R. The analysis of traffic accidents. J. Navig. 1971, 24, 534–543. [Google Scholar] [CrossRef]
- MacDuff, T. The probability of vessel collisions. Ocean. Ind. 1974, 9, 9. [Google Scholar]
- Zhou, X. A comprehensive framework for assessing navigation risk and deploying maritime emergency resources in the South China Sea. Ocean. Eng. 2022, 248, 110797. [Google Scholar] [CrossRef]
- Chen, S.; Wu, L.; Xie, C.; Zhou, L.; Wang, R.; Liu, Z.; Zho, Q.; Zhu, L. Risk Evaluation of Navigation Environment Based on Dynamic Weight Model and Its Application. J. Mar. Sci. Eng. 2022, 10, 770. [Google Scholar] [CrossRef]
- Xie, C.; Huang, L.; Wang, R.; Deng, J.; Shu, Y.; Jiang, D. Research on quantitative risk assessment of fuel leak of LNG-fuelled ship during lock transition process. Reliab. Eng. Syst. Saf. 2022, 221, 108368. [Google Scholar] [CrossRef]
- Xie, C.; Huang, L.; Deng, J.; Wang, R.; Hao, G. Hazard assessment and hazard mitigation of fuel leak inside a ship elevator for LNG-fueled vessel. Ocean. Eng. 2022, 259, 111943. [Google Scholar] [CrossRef]
- Liang, M.; Liu, R.W.; Li, S.; Xiao, Z.; Liu, X.; Lu, F. An unsupervised learning method with convolutional auto-encoder for vessel trajectory similarity computation. Ocean. Eng. 2021, 225, 108803. [Google Scholar] [CrossRef]
- Li, Y.; Long, M.; Zuo, L.; Li, W.; Zhao, W. Brittleness evaluation of coal based on statistical damage and energy evolution theory. J. Pet. Sci. Eng. 2019, 172, 753–763. [Google Scholar] [CrossRef]
- Wang, H.; Jiang, H.; Yin, L. Cause mechanism study to human factors in maritime accidents: Towards a complex system brittleness analysis approach. Procedia-Soc. Behav. Sci. 2013, 96, 723–727. [Google Scholar] [CrossRef]


| Category | Navigational Environment Impact Factors |
|---|---|
| Hydrometeorology factors | Wind |
| Currents | |
| Waves | |
| Tides | |
| Visibility | |
| Channel condition factors | Channel width |
| Channel length | |
| Channel depth | |
| Bending degree of channel | |
| Channel crossing | |
| Channel barriers | |
| Traffic impact factors | Vessel traffic flow |
| Traffic flow density | |
| Safety clearance of ships | |
| Navigation AIDs |
| Category | Impact Factor |
|---|---|
| Hydrometeorology factors | Wind |
| Visibility | |
| Channel conditions factors | Channel crossing ratio |
| Channel width | |
| Traffic impact factors | Ship density |
| Traffic flow |
| Impact Factors | Level 1 | Level 2 | Level 3 | Level 4 | Level 5 |
|---|---|---|---|---|---|
| Wind | 0–1 | 1–2 | 2–4 | 4–6 | >6 |
| Visibility | >3000 | 1000–3000 | 500–1000 | 200–500 | <500 |
| Channel crossing ratio | <0.5 | 0.5–1 | 1–1.5 | 1.5–2 | >2 |
| Channel width | >500 | 300–500 | 200–300 | 100–200 | <100 |
| Ship density (number of ships) | <50 | 50–80 | 80–100 | 100–150 | >150 |
| Traffic flow (ships/day) | <20 | 20–25 | 25–30 | 30–36 | >36 |
| Impact Factor | Level 1 | Level 2 | Level 3 | Level 4 | Level 5 |
|---|---|---|---|---|---|
| Wind | 0.384 | 0.221 | 0.184 | 0.109 | 0.102 |
| Visibility | 0.361 | 0.282 | 0.171 | 0.122 | 0.064 |
| Channel crossing ratio | 0.366 | 0.228 | 0.197 | 0.123 | 0.086 |
| Channel width | 0.144 | 0.197 | 0.289 | 0.246 | 0.124 |
| Ship density | 0.123 | 0.285 | 0.269 | 0.216 | 0.107 |
| Traffic flow (ships/day) | 0.094 | 0.298 | 0.304 | 0.178 | 0.126 |
| Impact Factors | Level 1 | Level 2 | Level 3 | Level 4 | Level 5 |
|---|---|---|---|---|---|
| Wind | 0.0029 | 0.0149 | 0.0417 | 0.0779 | 0.0672 |
| Visibility | 0.0061 | 0.0437 | 0.0320 | 0.0292 | 0.0599 |
| Channel crossing ratio | 0.0135 | 0.0349 | 0.0306 | 0.0512 | 0.0255 |
| Channel width | 0.0228 | 0.0542 | 0.0209 | 0.0100 | 0.0398 |
| Ship density | 0.0334 | 0.0404 | 0.0122 | 0.0165 | 0.0461 |
| Traffic flow | 0.0350 | 0.0276 | 0.0252 | 0.0231 | 0.0326 |
| Evolutionary Zone | All Changes | 1 Constant | 2 Constants | 3 Constants | 4 Constants | 5 Constants | 6 Constants |
|---|---|---|---|---|---|---|---|
| Safety zone | 54 | 57 | 51 | 58 | 54 | 53 | 54 |
| Danger zone | 12 | 10 | 15 | 13 | 14 | 12 | 15 |
| Fuzzy zone | 7 | 6 | 7 | 2 | 5 | 8 | 4 |
Publisher’s Note: MDPI stays neutral with regard to jurisdictional claims in published maps and institutional affiliations. |
© 2022 by the authors. Licensee MDPI, Basel, Switzerland. This article is an open access article distributed under the terms and conditions of the Creative Commons Attribution (CC BY) license (https://creativecommons.org/licenses/by/4.0/).
Share and Cite
Huang, L.; Chen, Y.; Wu, L.; Xie, C.; Chen, S. Research on Uncertainty Evolution of Ship Collision Status Based on Navigation Environment. J. Mar. Sci. Eng. 2022, 10, 1741. https://doi.org/10.3390/jmse10111741
Huang L, Chen Y, Wu L, Xie C, Chen S. Research on Uncertainty Evolution of Ship Collision Status Based on Navigation Environment. Journal of Marine Science and Engineering. 2022; 10(11):1741. https://doi.org/10.3390/jmse10111741
Chicago/Turabian StyleHuang, Liwen, Yingfan Chen, Lei Wu, Cheng Xie, and Shuzhe Chen. 2022. "Research on Uncertainty Evolution of Ship Collision Status Based on Navigation Environment" Journal of Marine Science and Engineering 10, no. 11: 1741. https://doi.org/10.3390/jmse10111741
APA StyleHuang, L., Chen, Y., Wu, L., Xie, C., & Chen, S. (2022). Research on Uncertainty Evolution of Ship Collision Status Based on Navigation Environment. Journal of Marine Science and Engineering, 10(11), 1741. https://doi.org/10.3390/jmse10111741