
Sedimentological Analysis of Regional Differentiation and Sediment Provenance in the Lu’erhuan River Sea Area of Qinzhou Bay, Guangxi Province


Abstract
1. Introduction
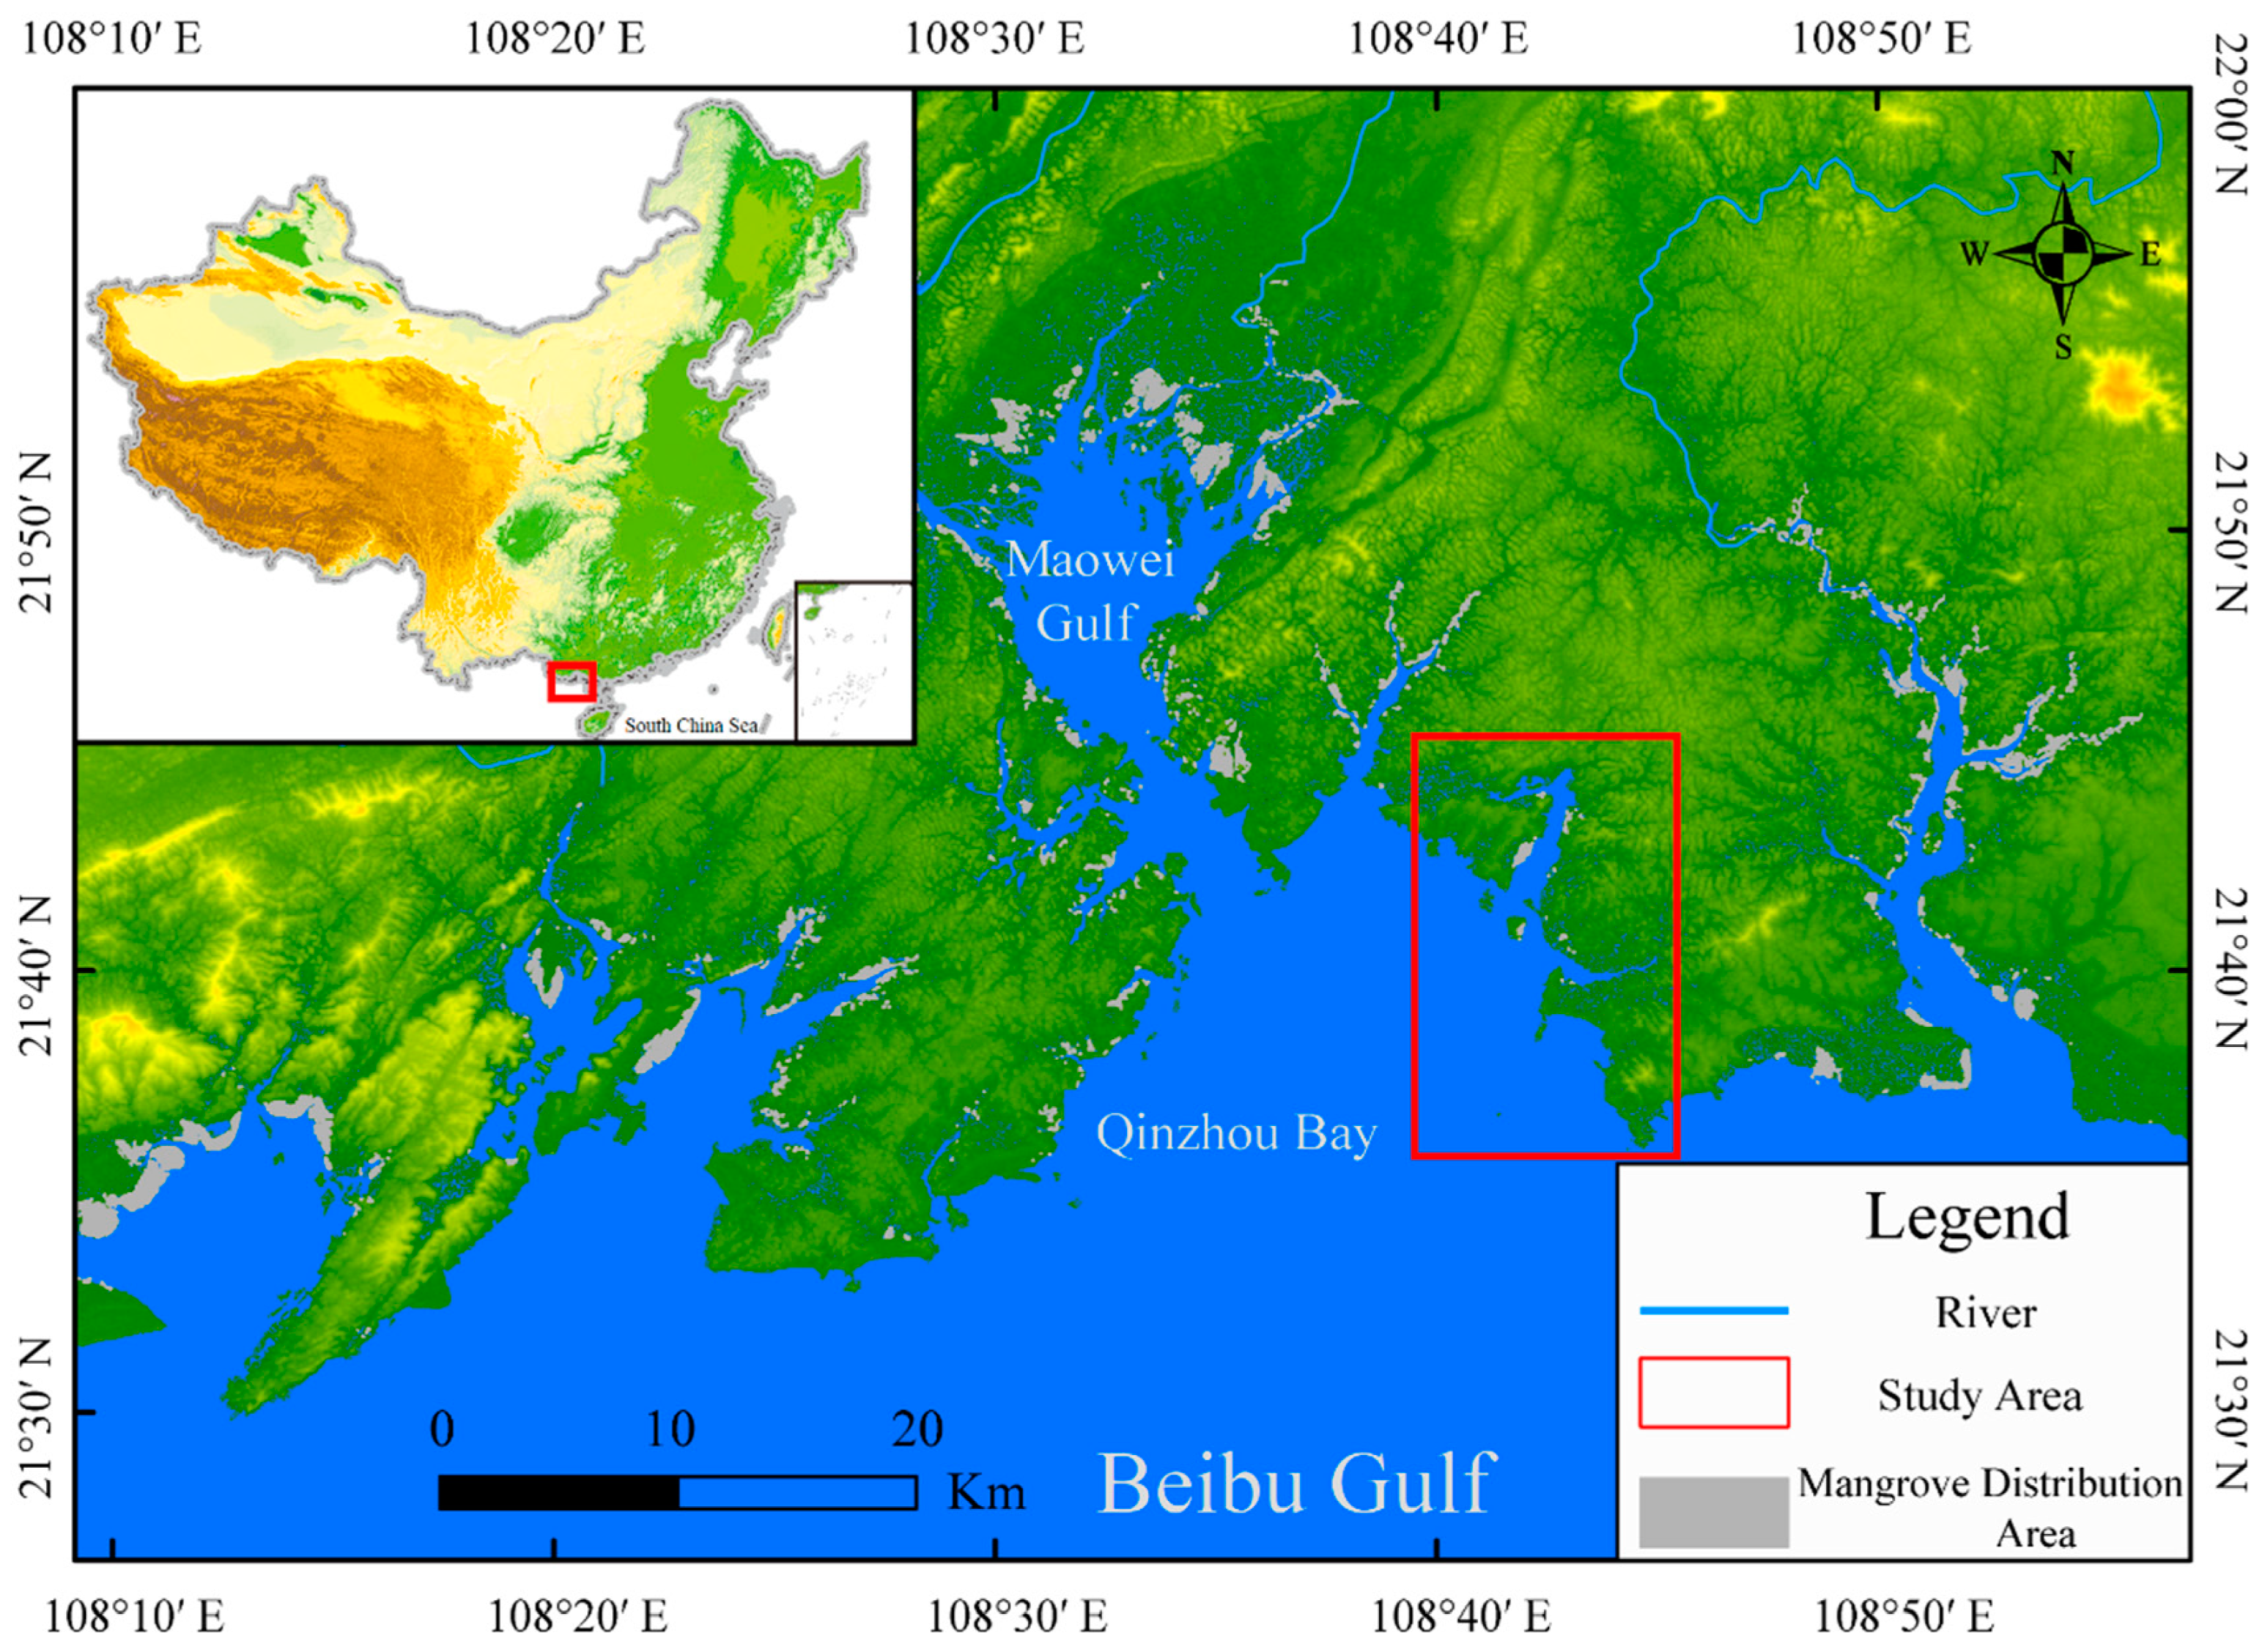
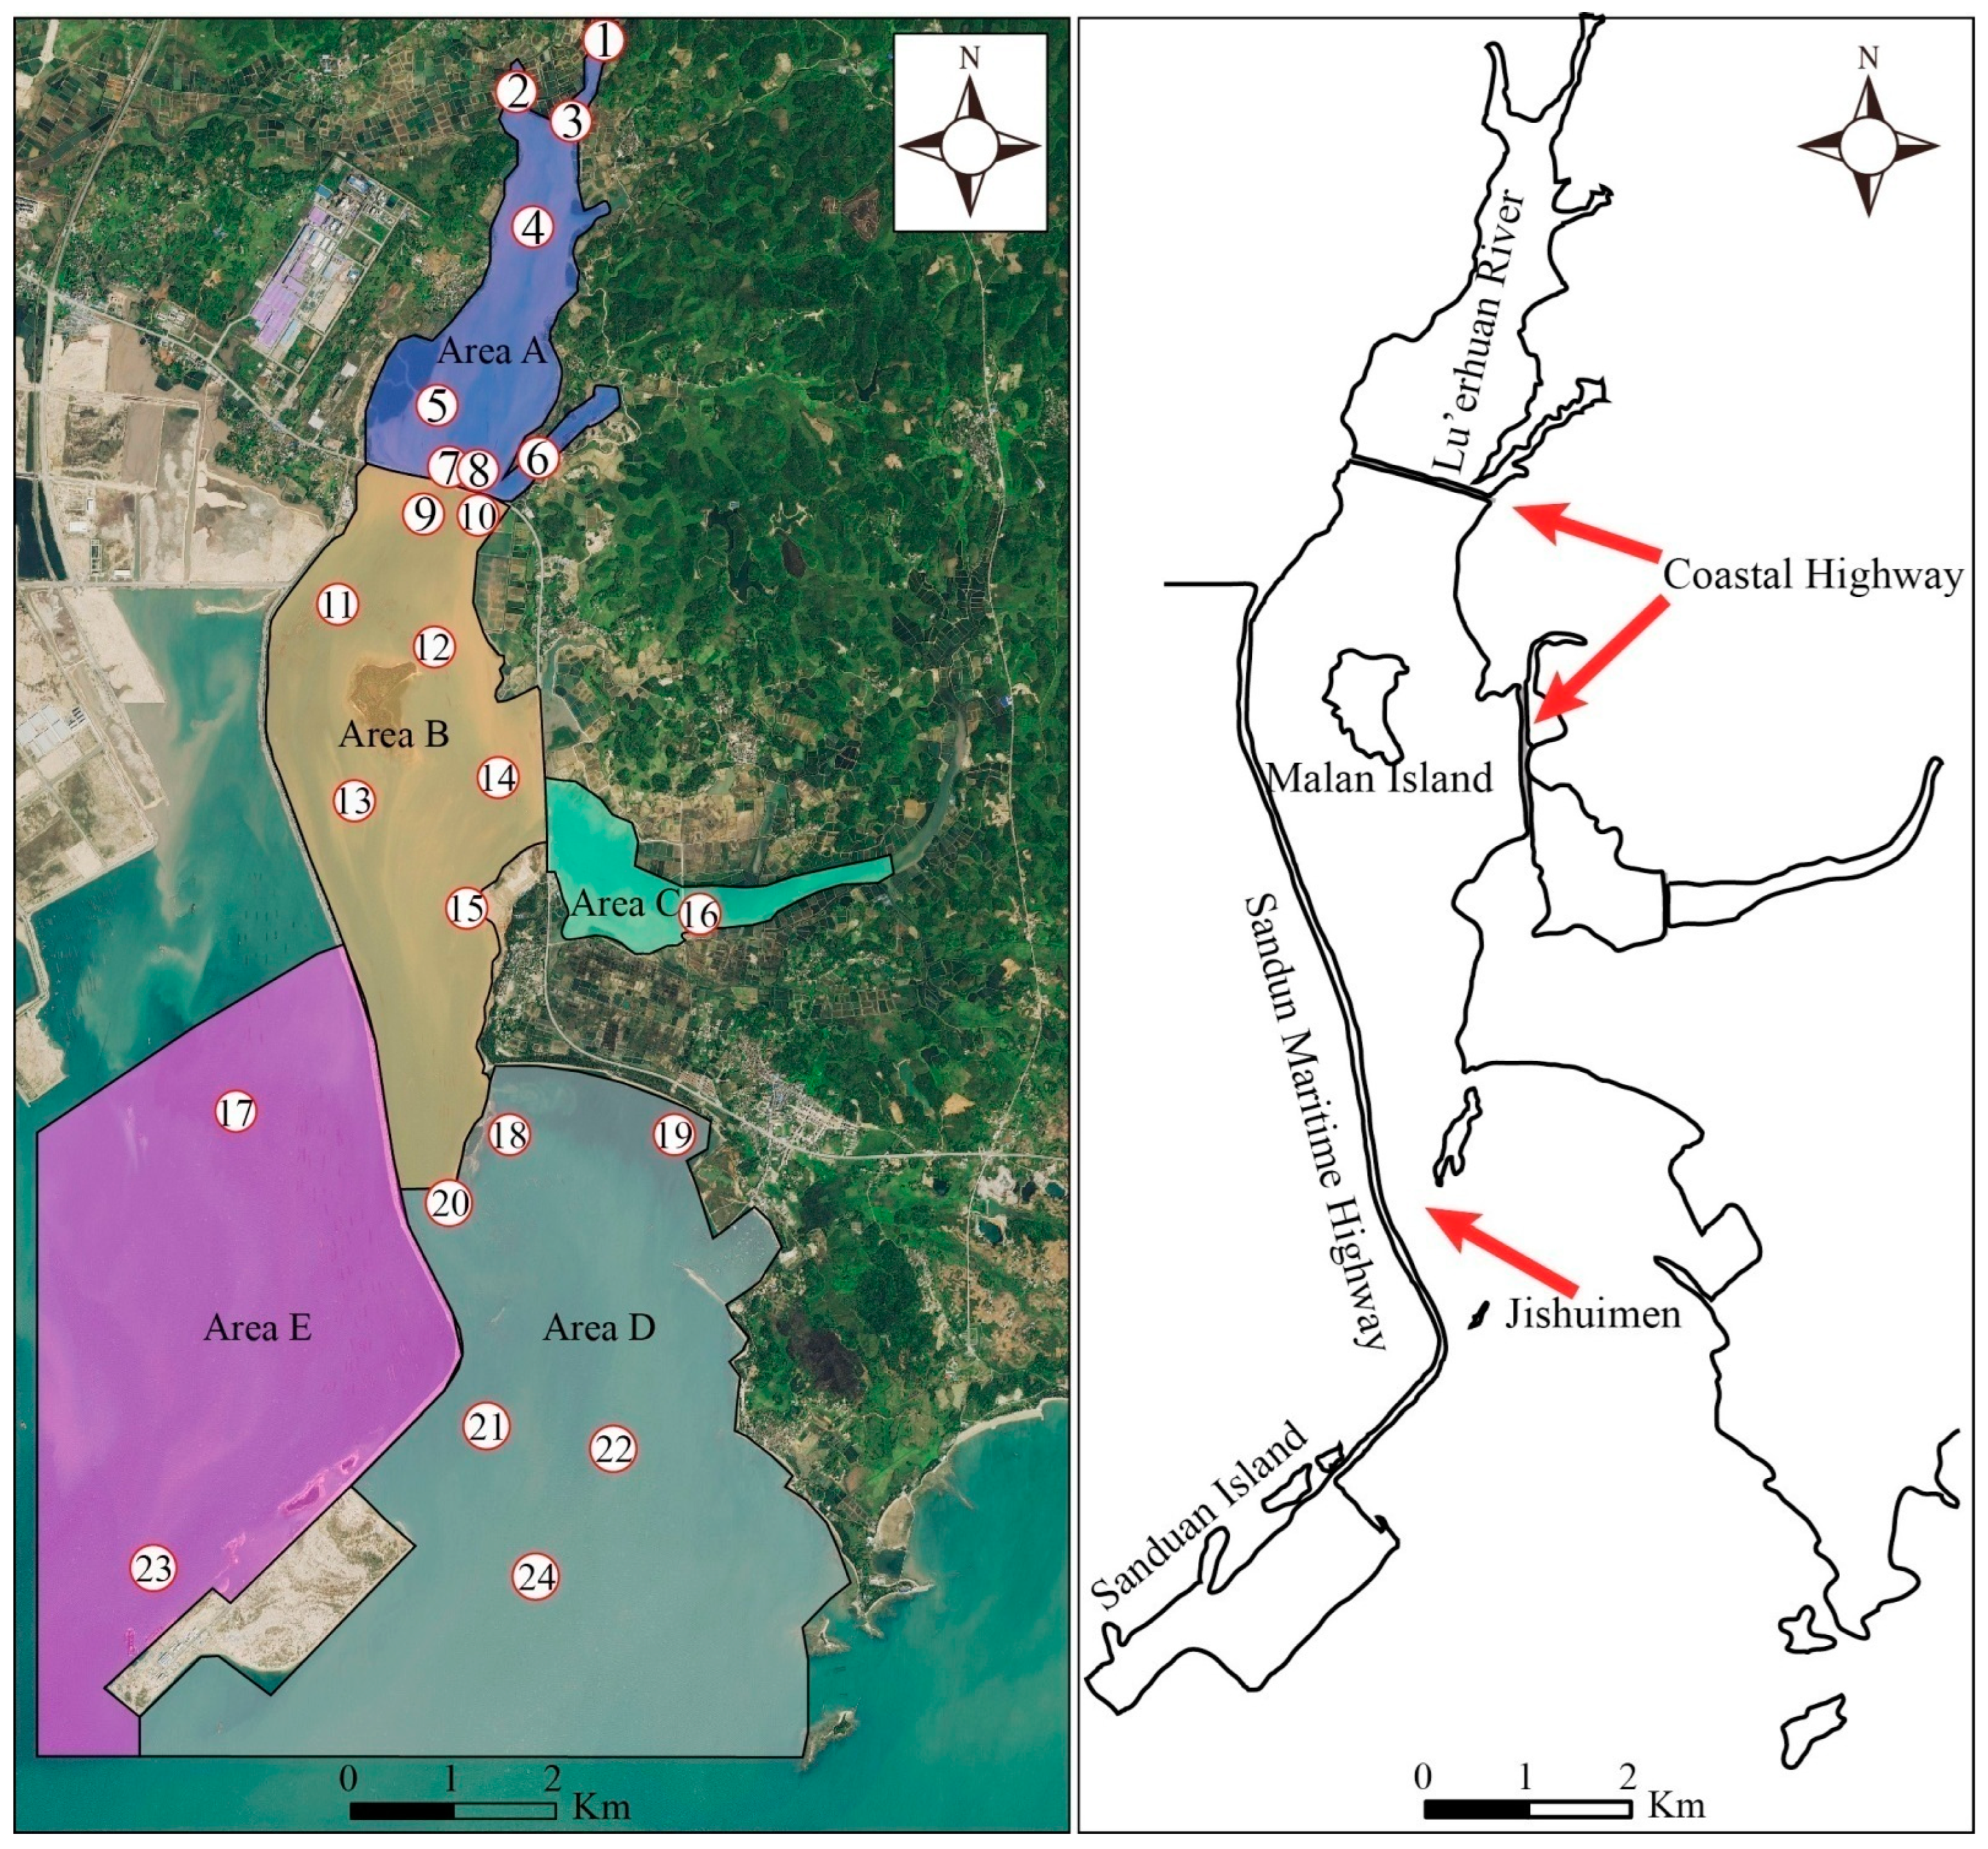
2. The Study Area
3. Material and Methods
3.1. Sampling of Surface Sediments
3.2. Sedimentological and Geochemical Analyses
4. Results
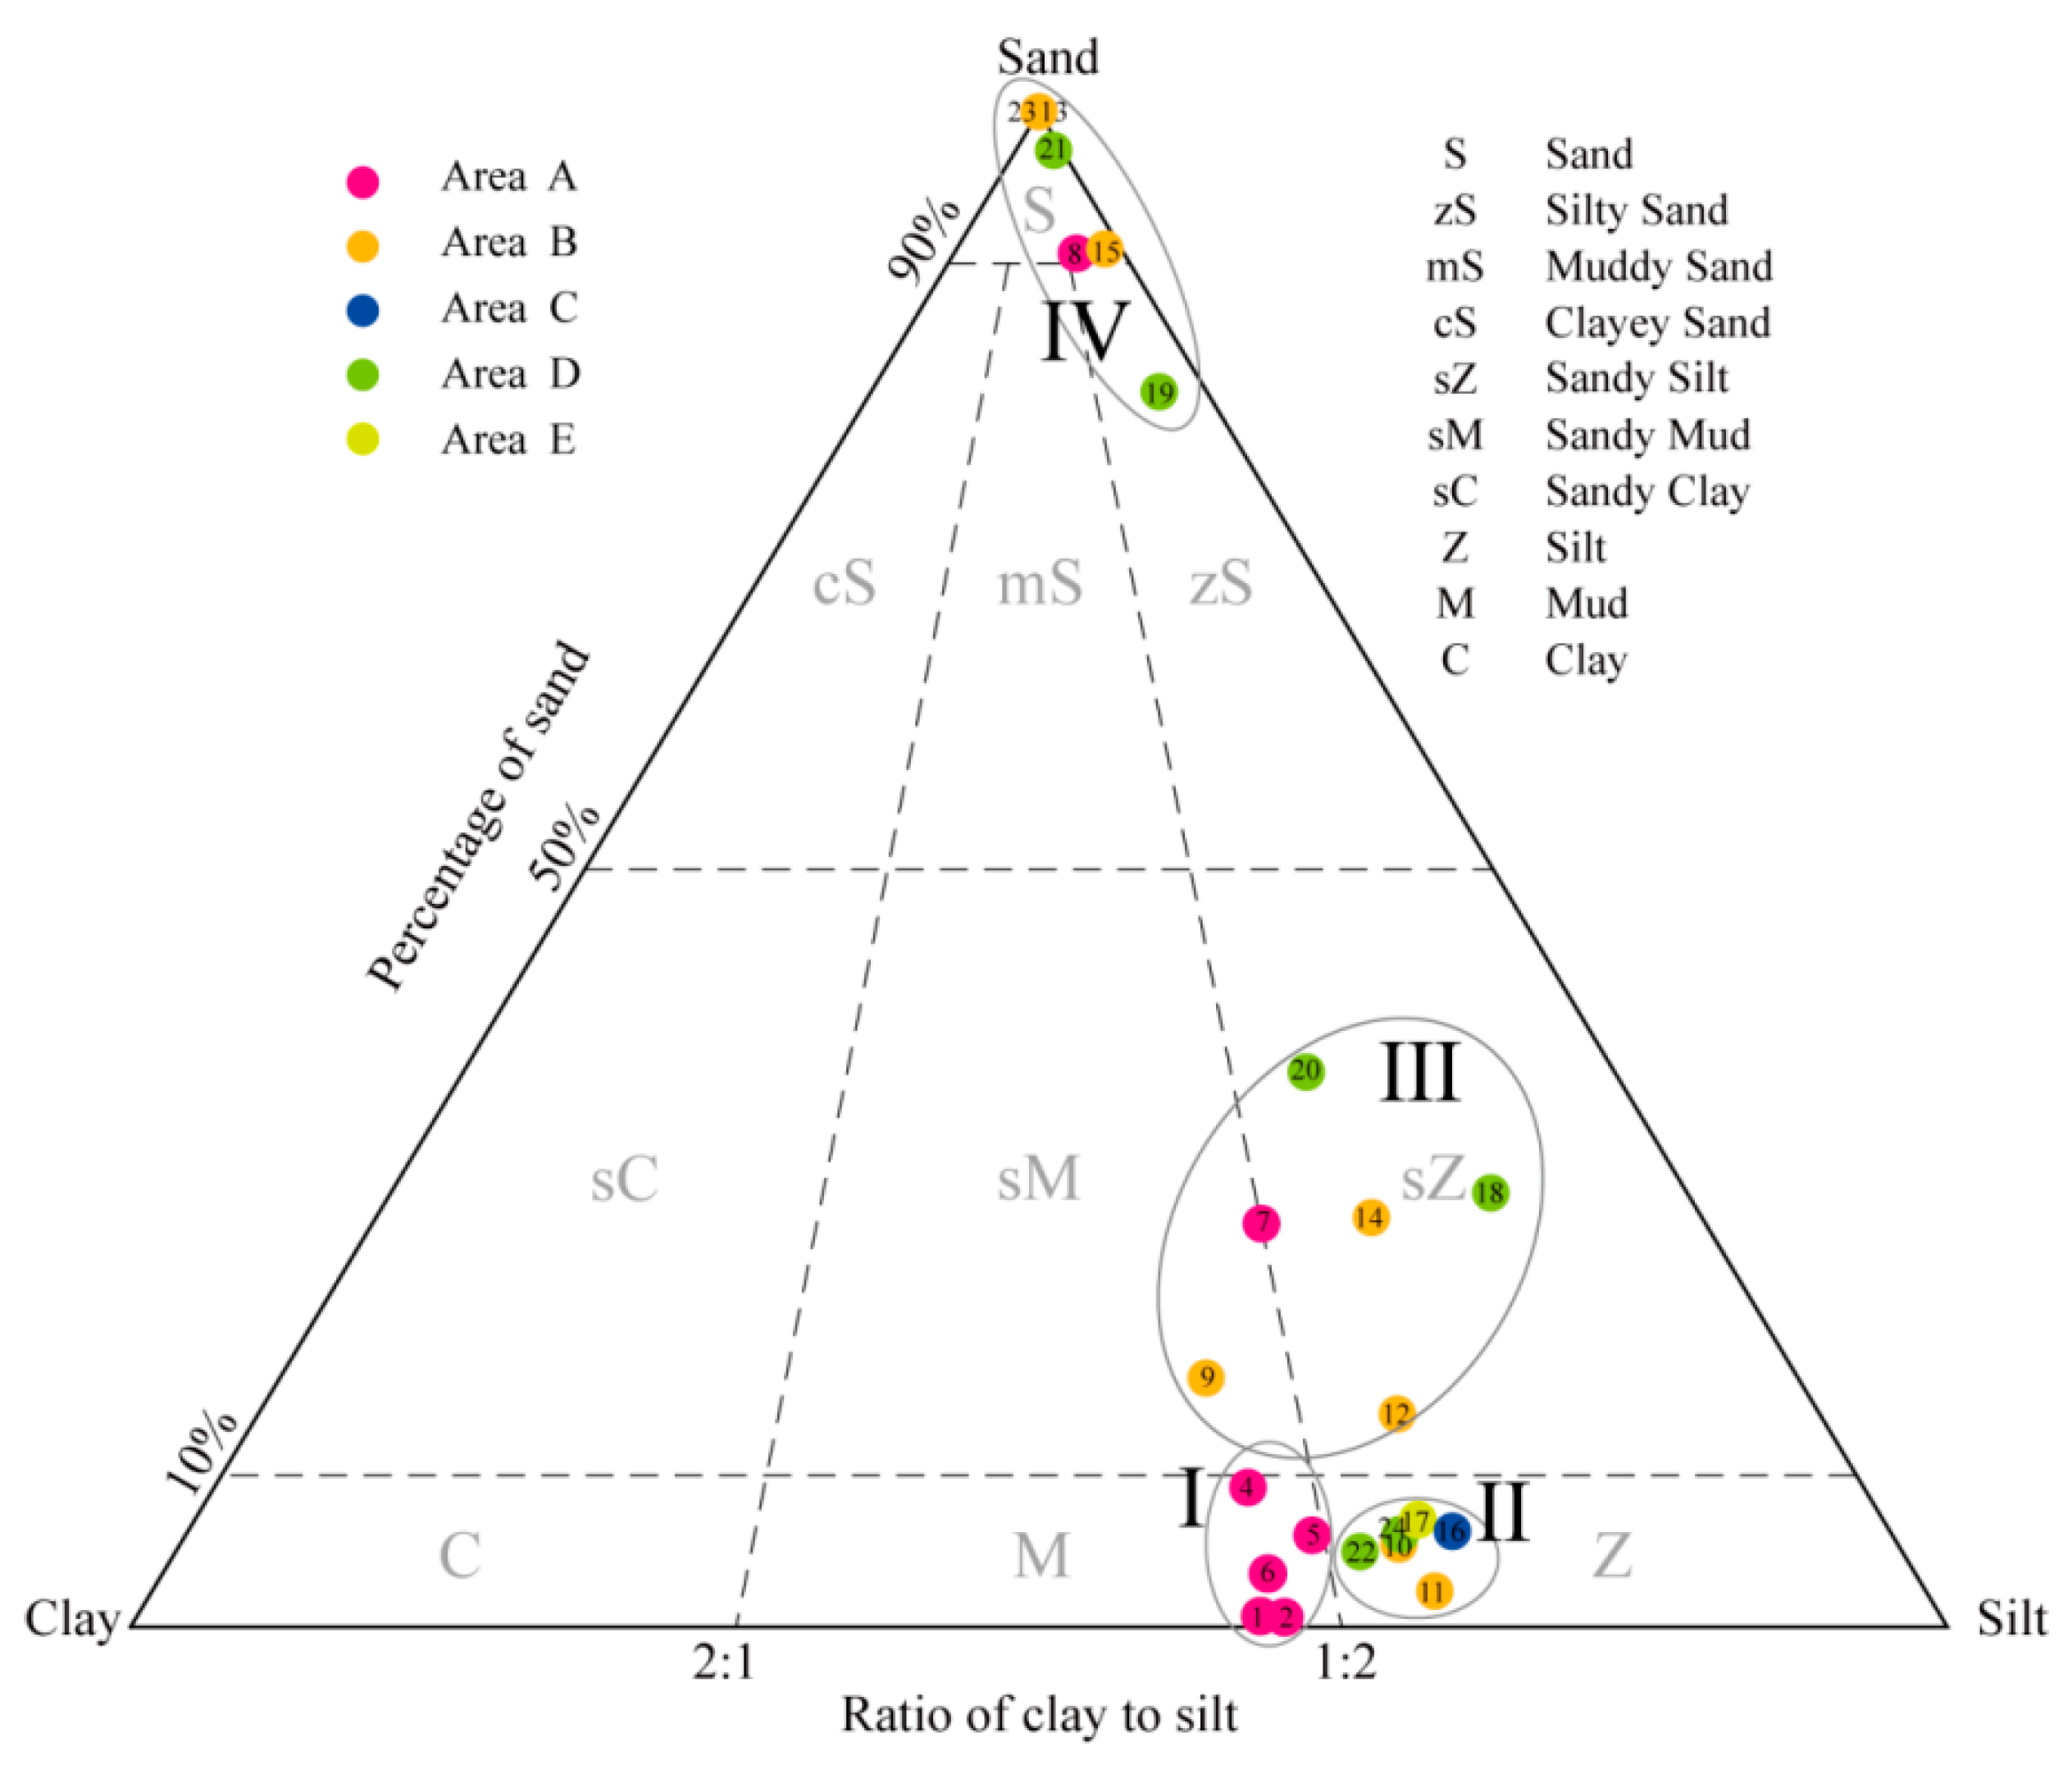
4.1. Surface Sediment Types
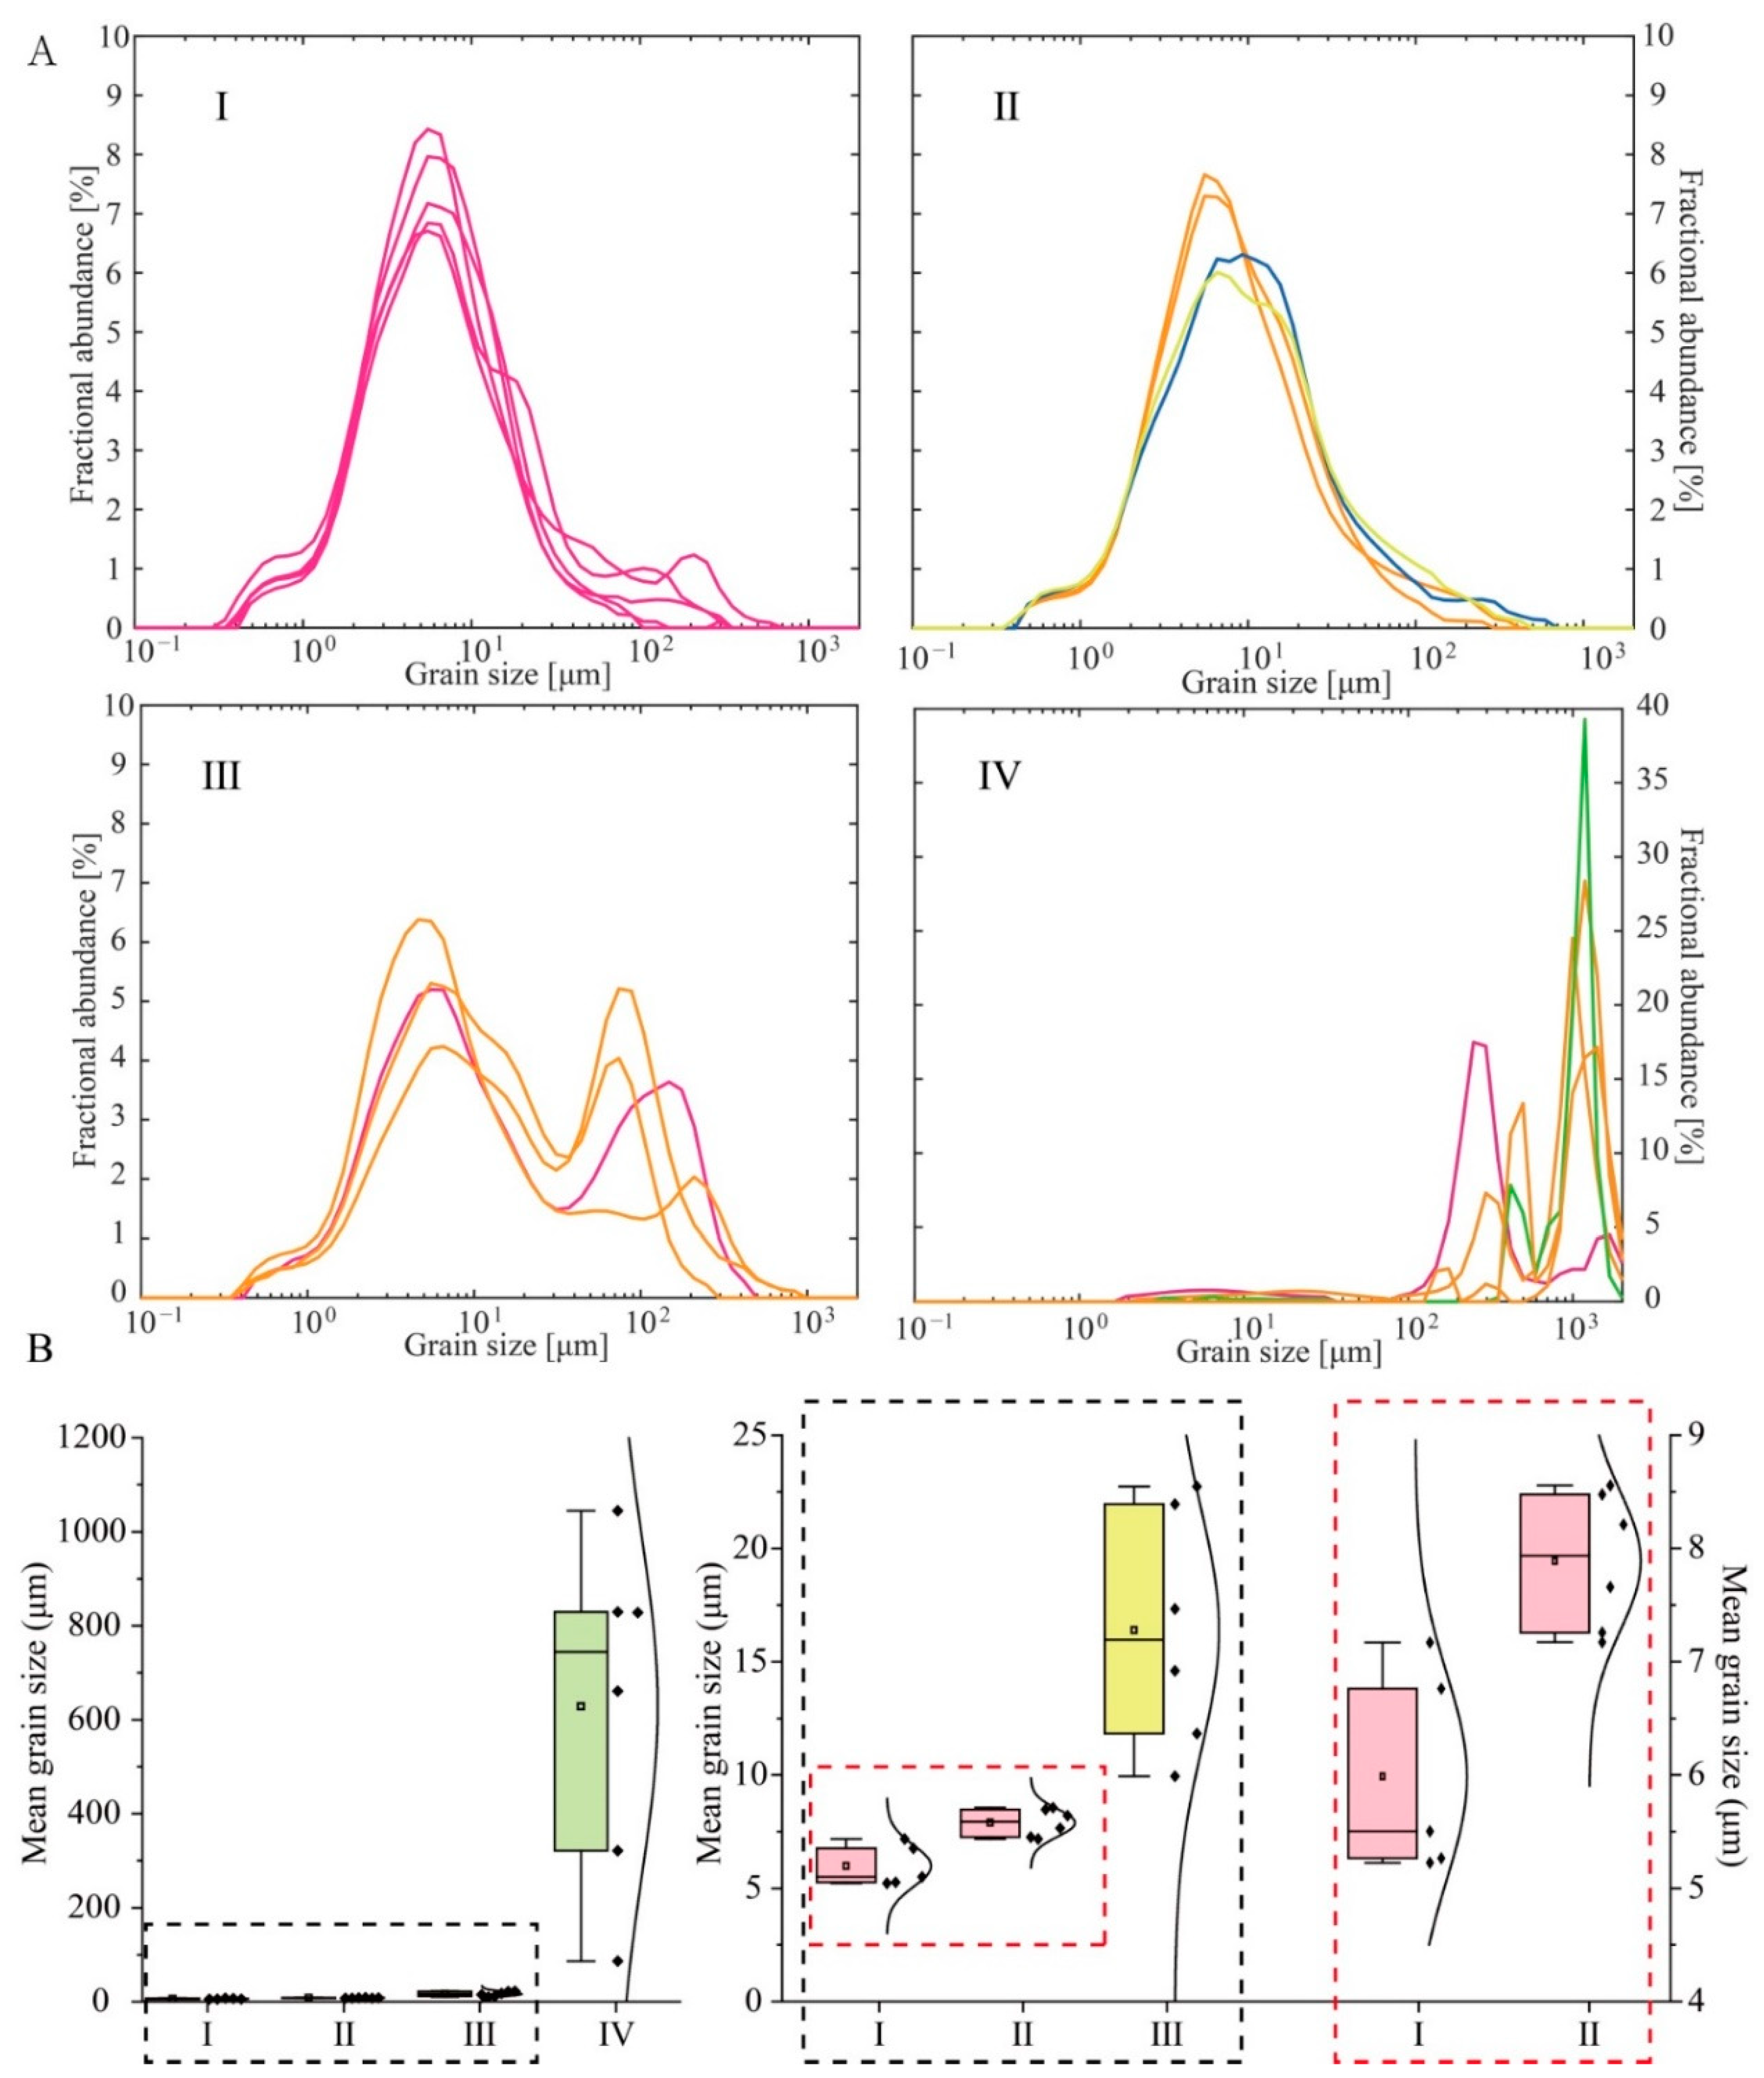
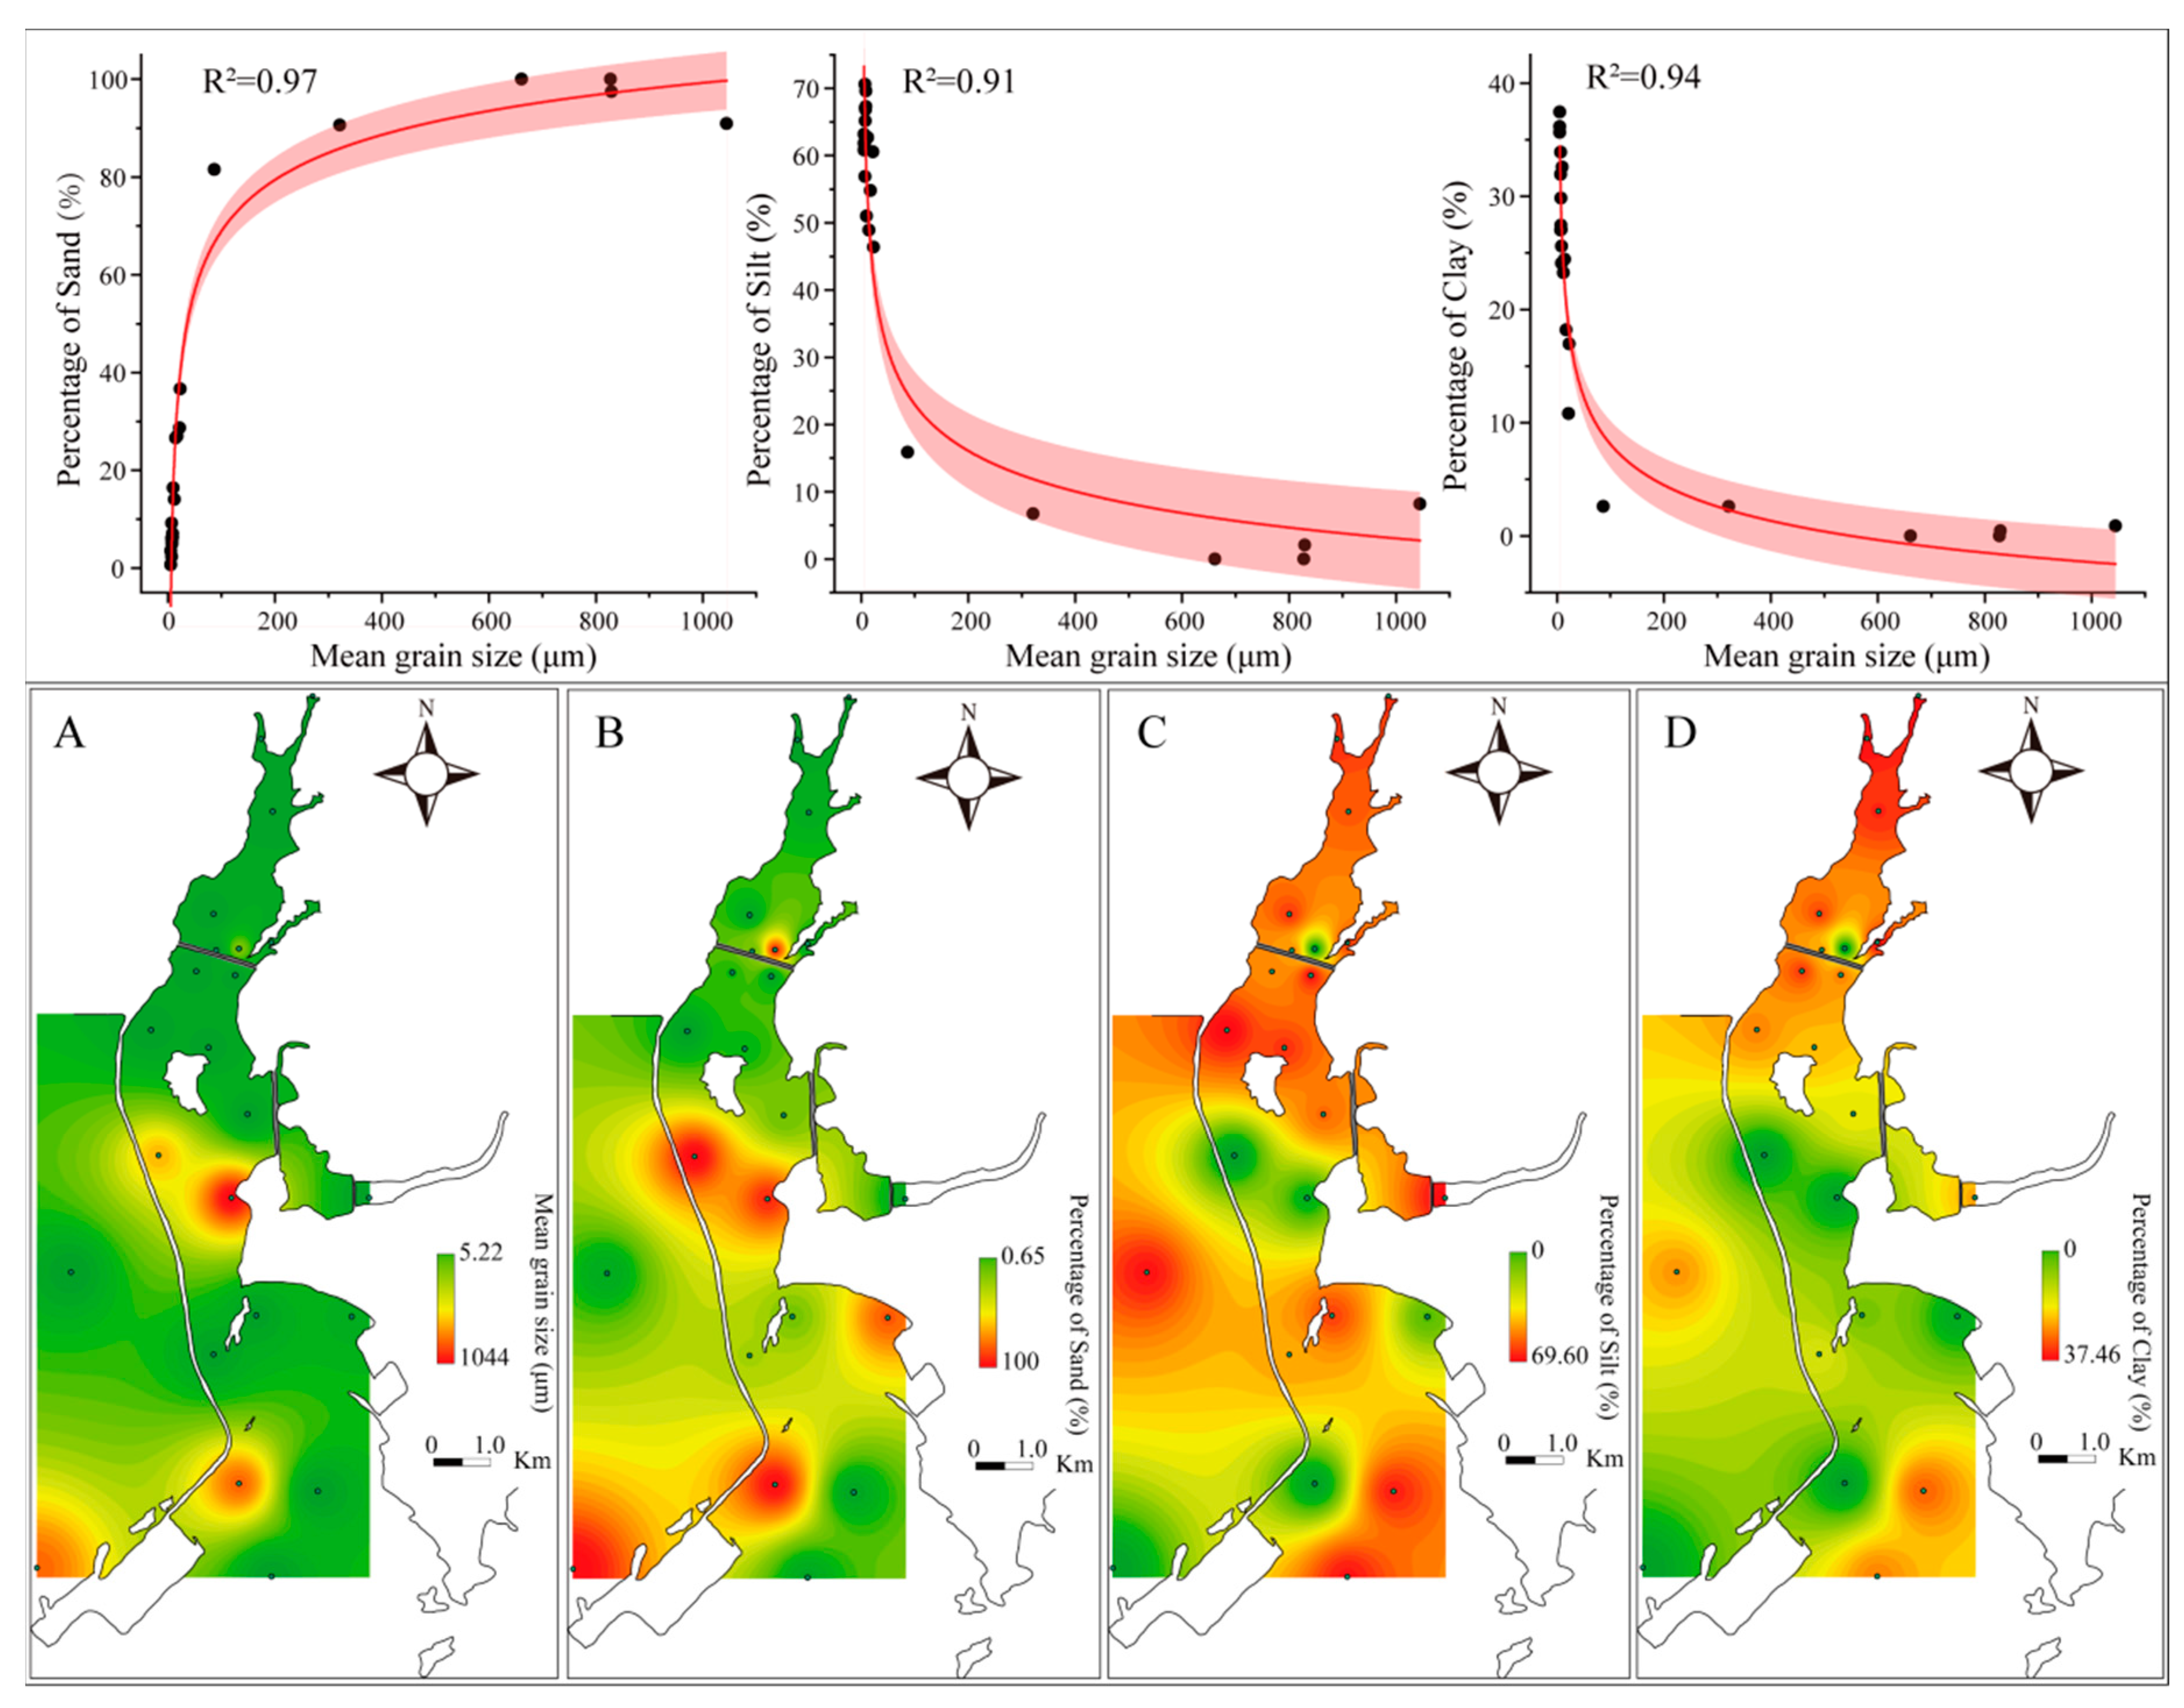
4.2. Surface Sediment Grain Size Distribution
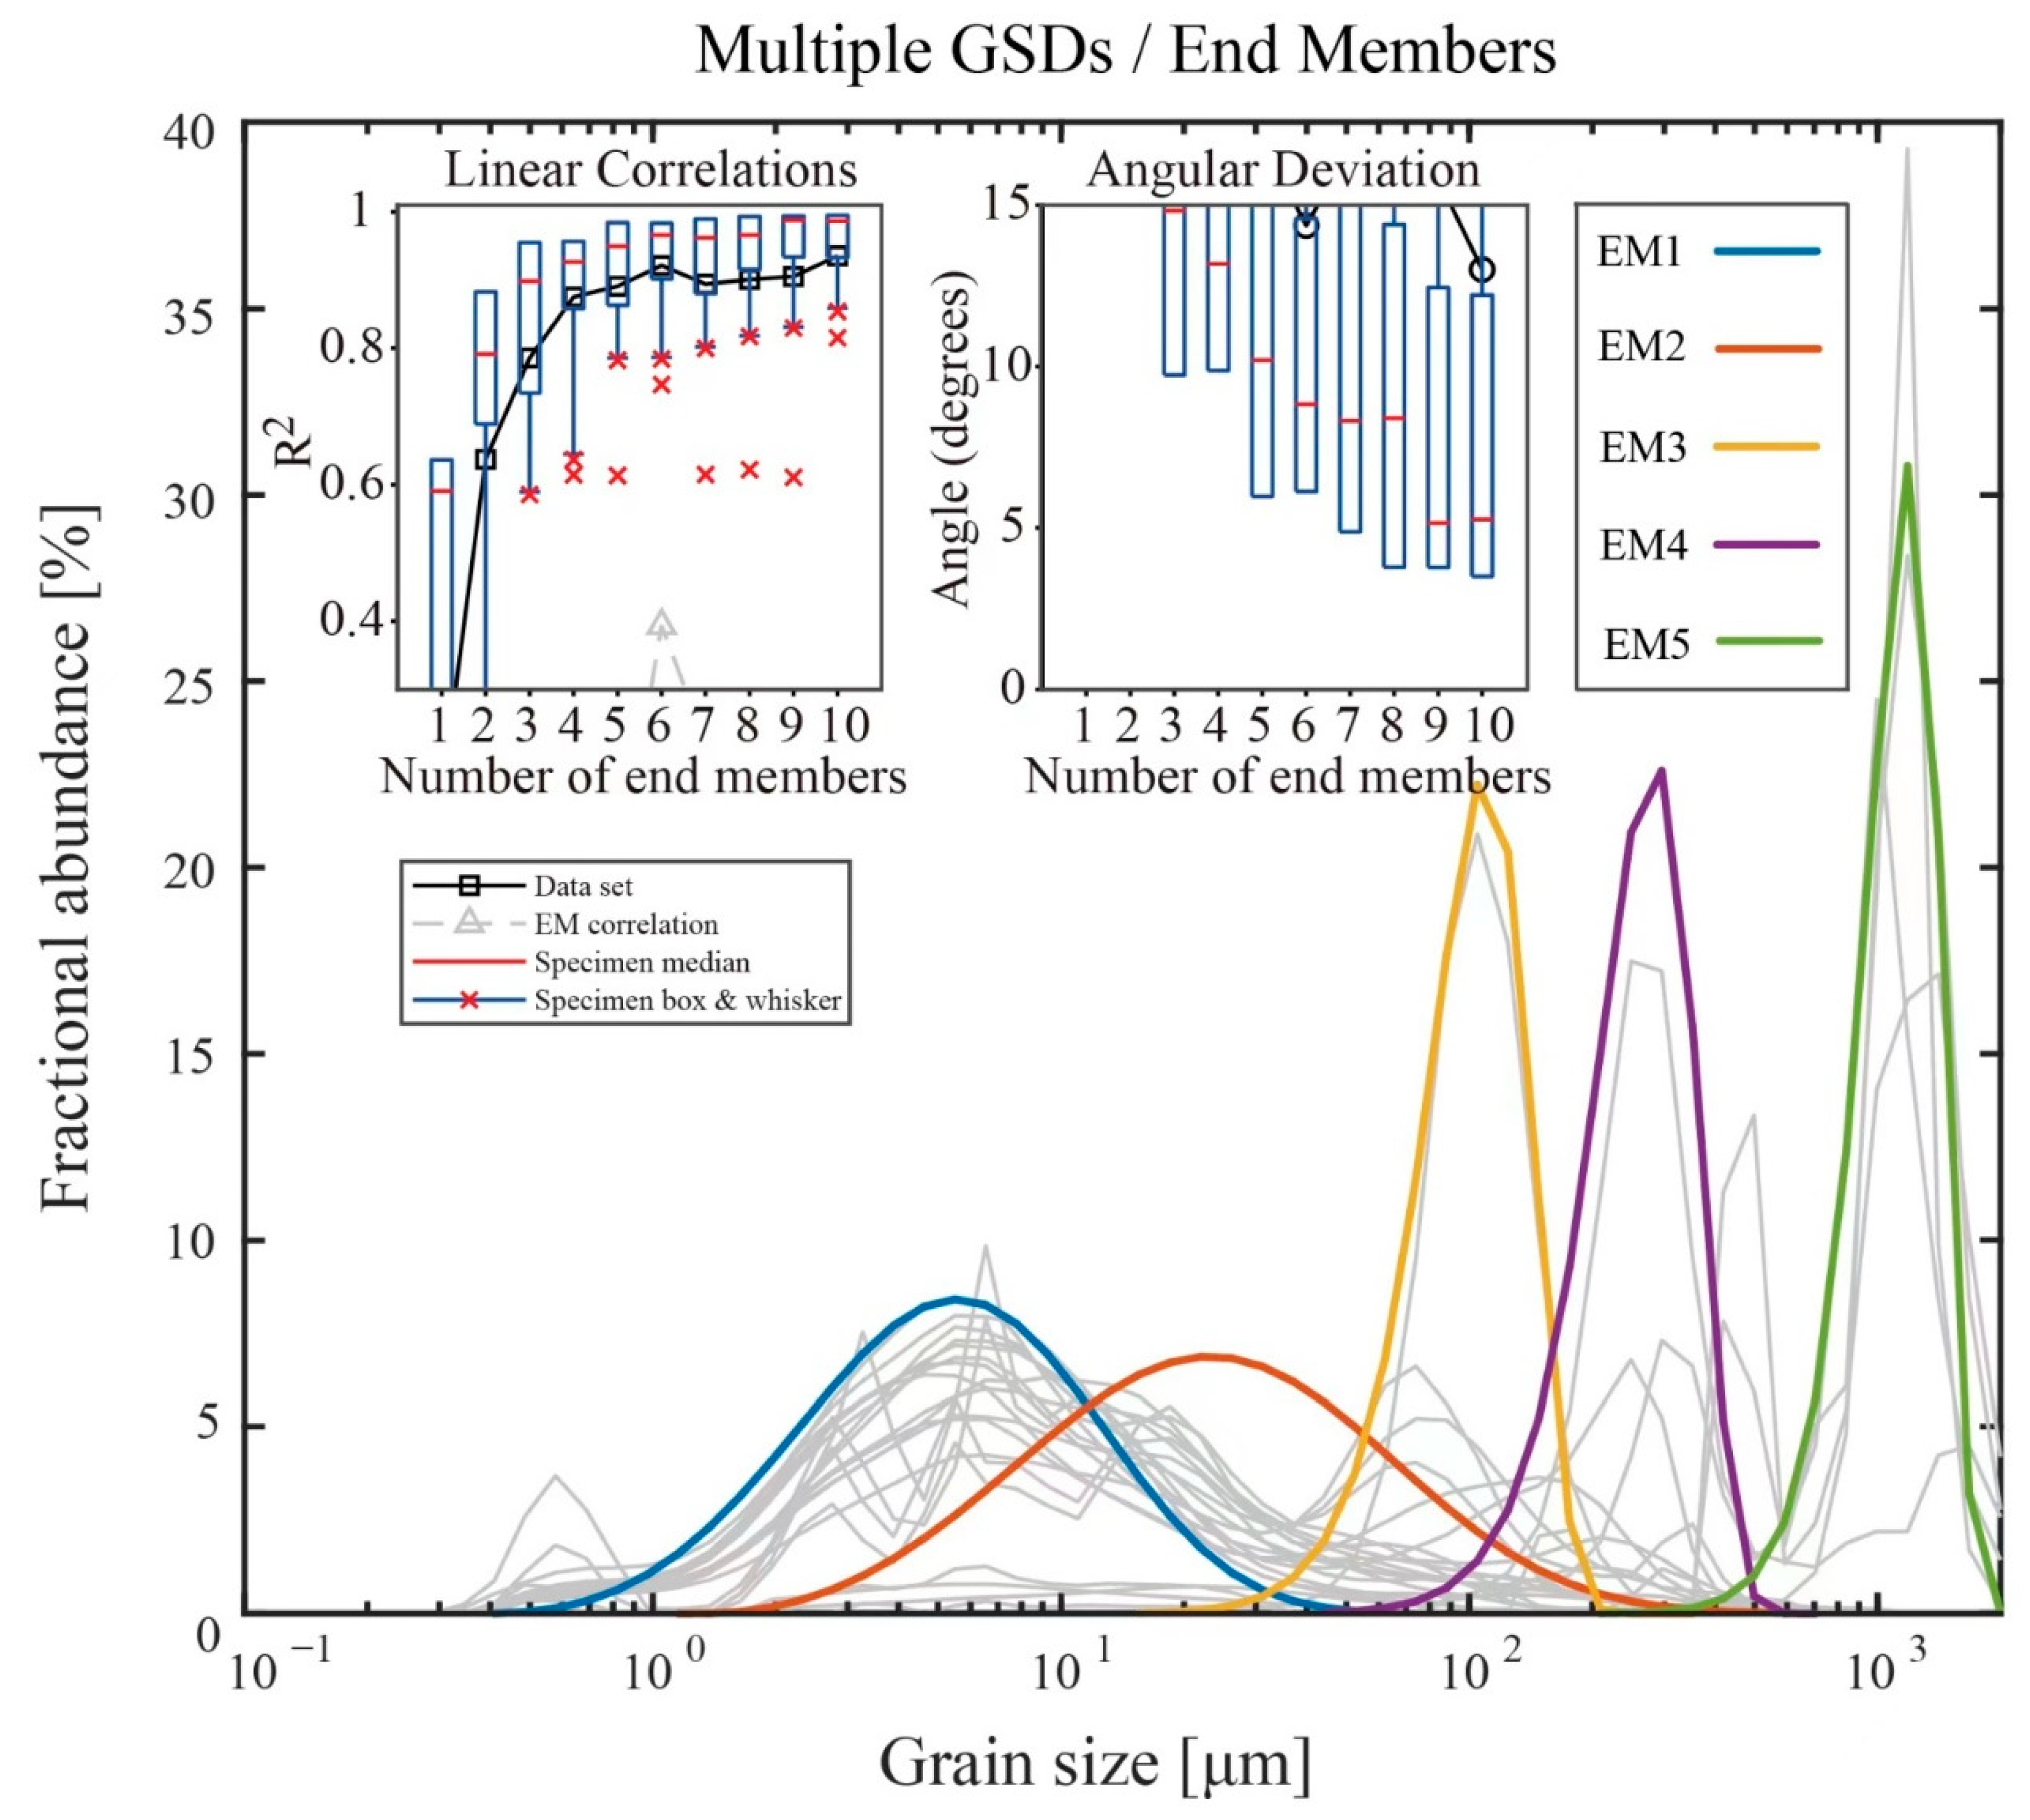
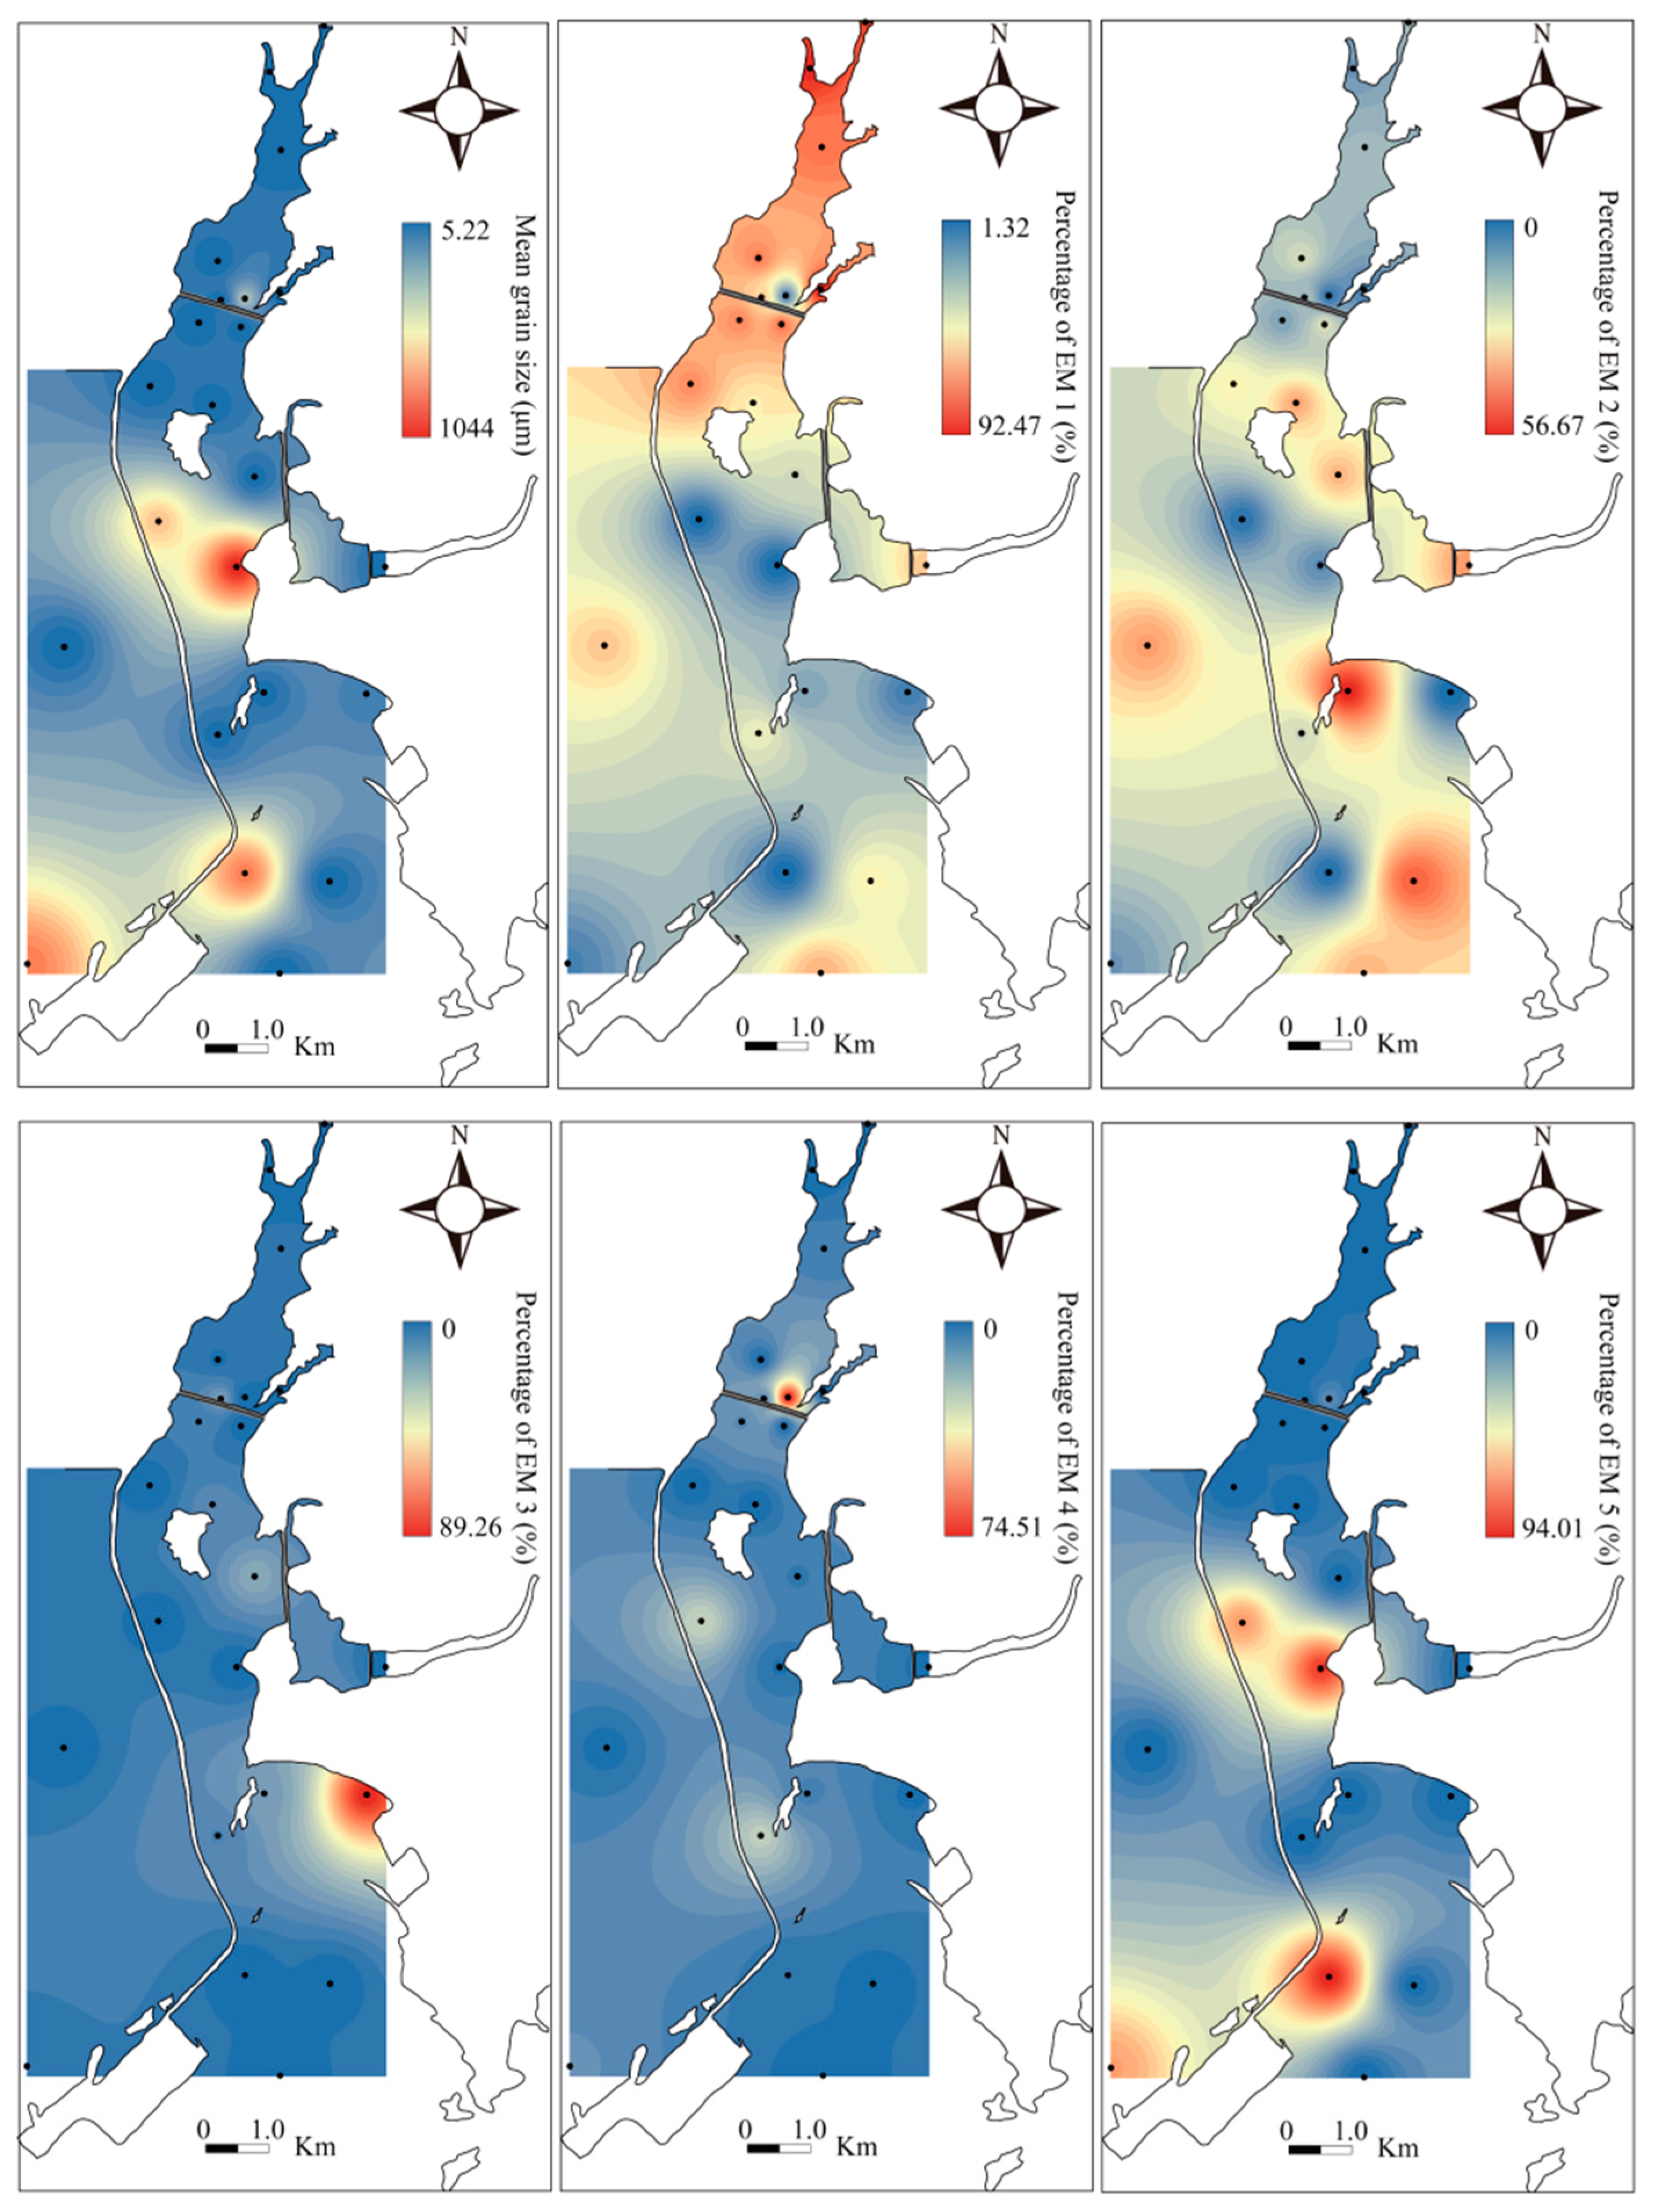
4.3. The Characteristics of Endmember Analysis of Sediments
5. Discussion
5.1. Endmember Analysis of Sediments’ Provenances
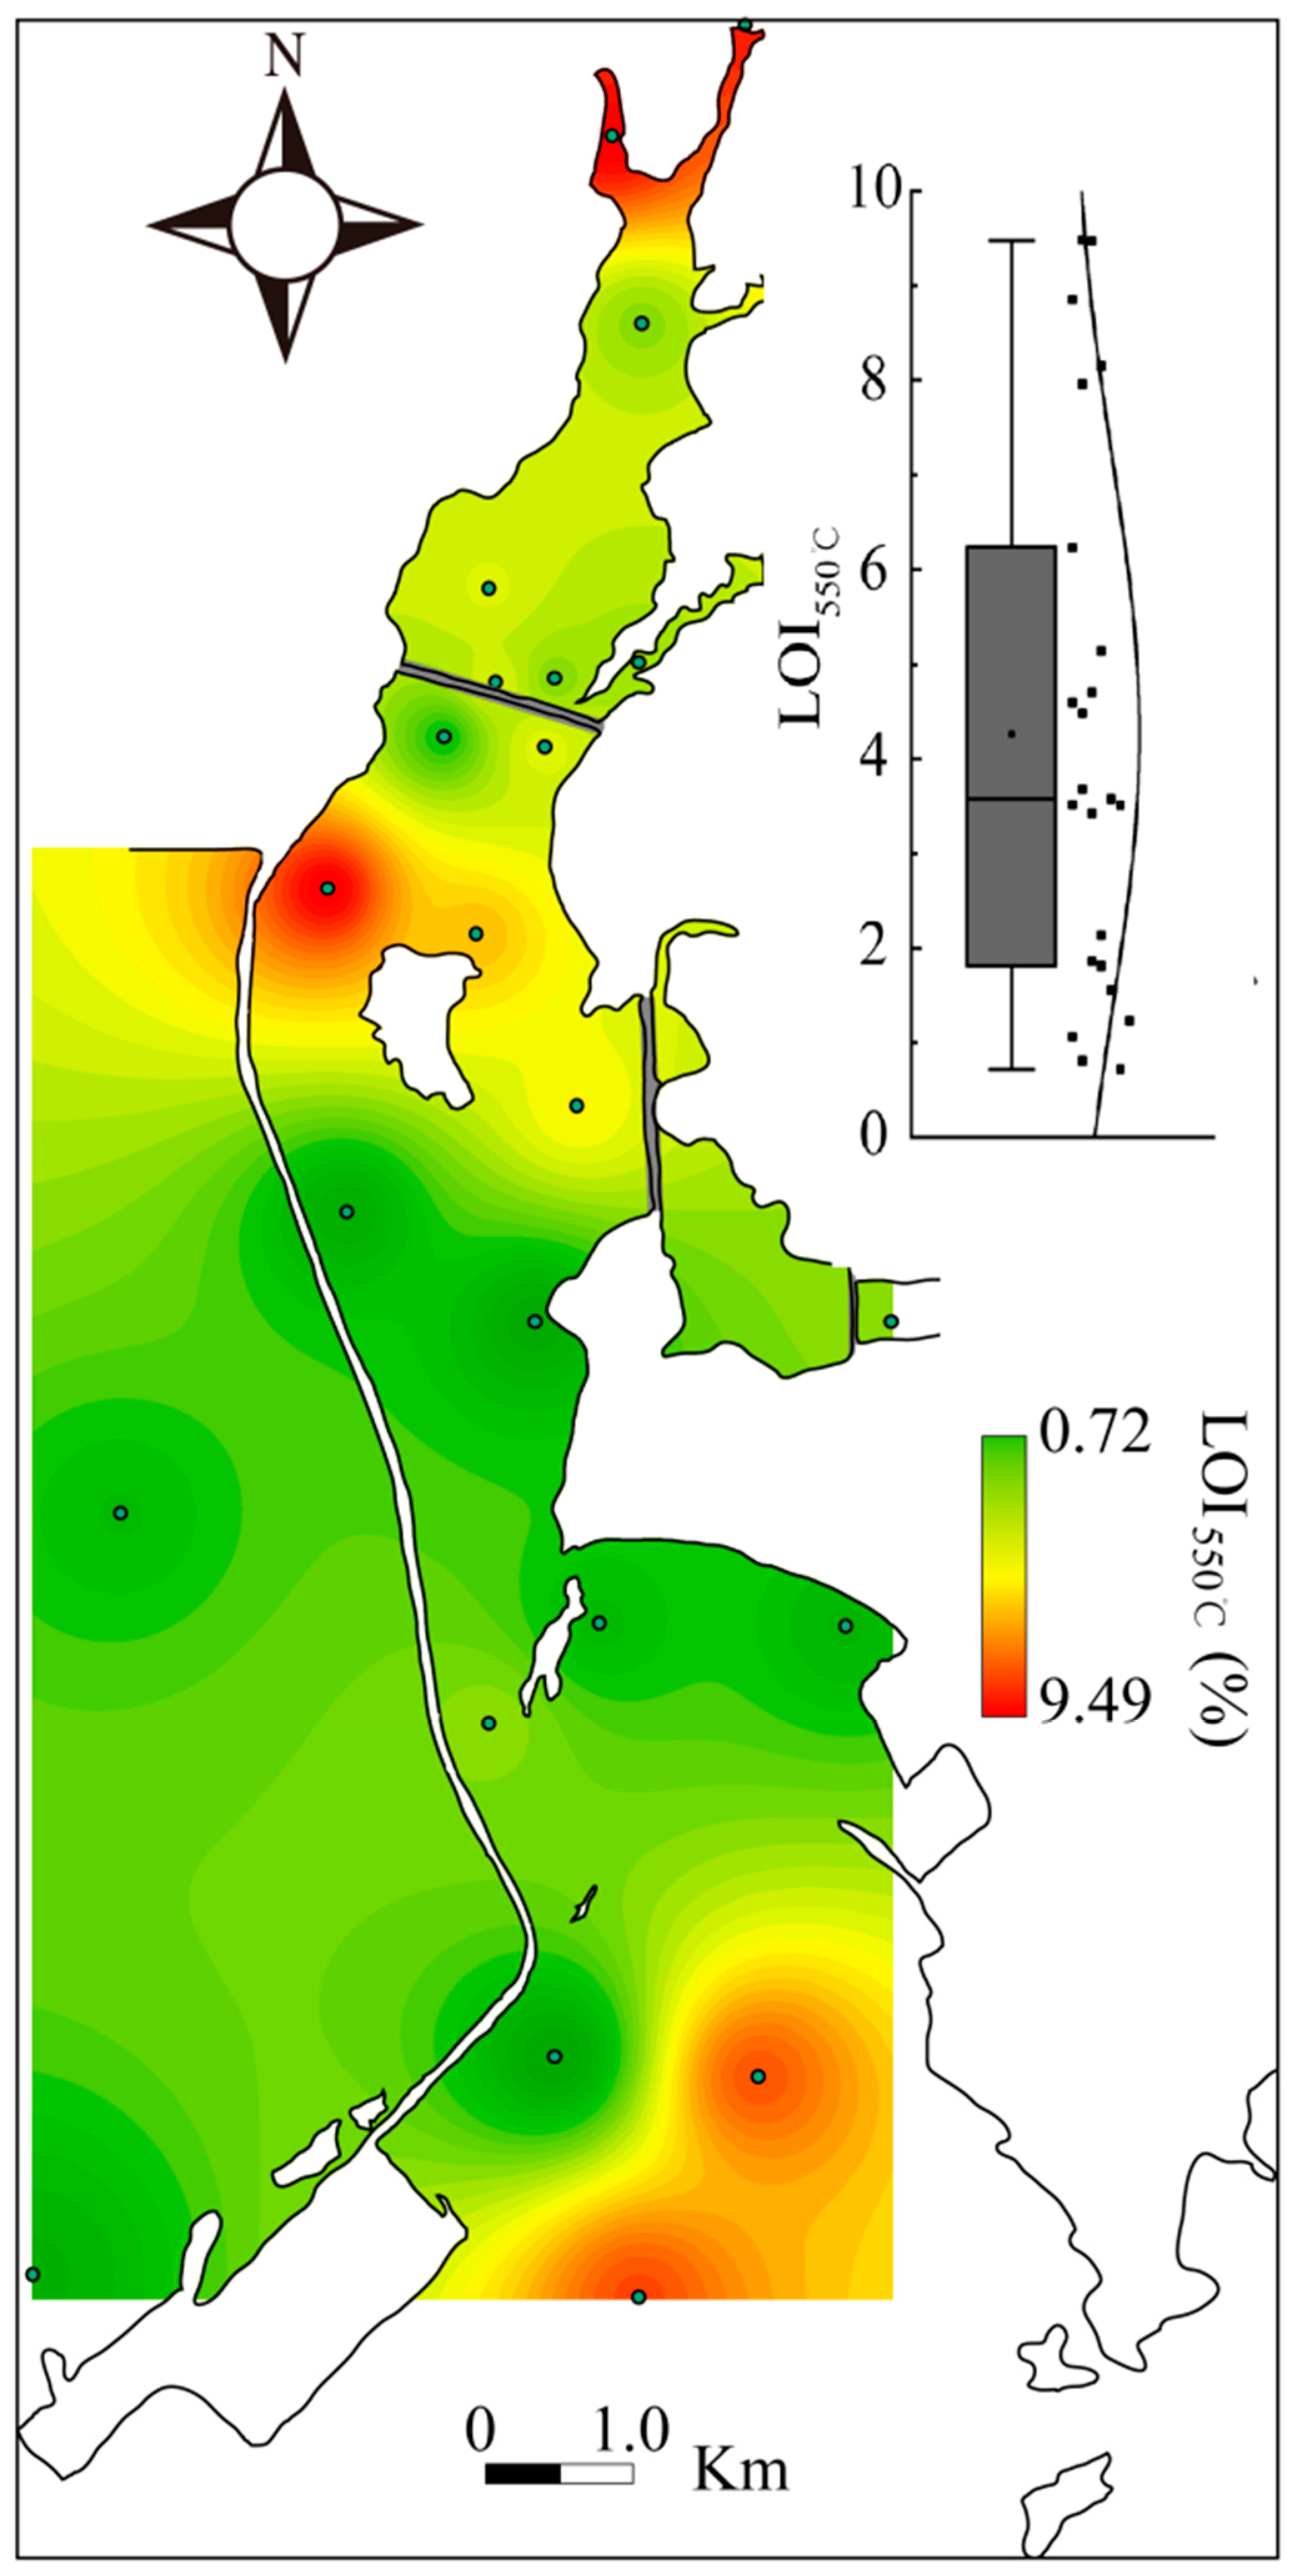
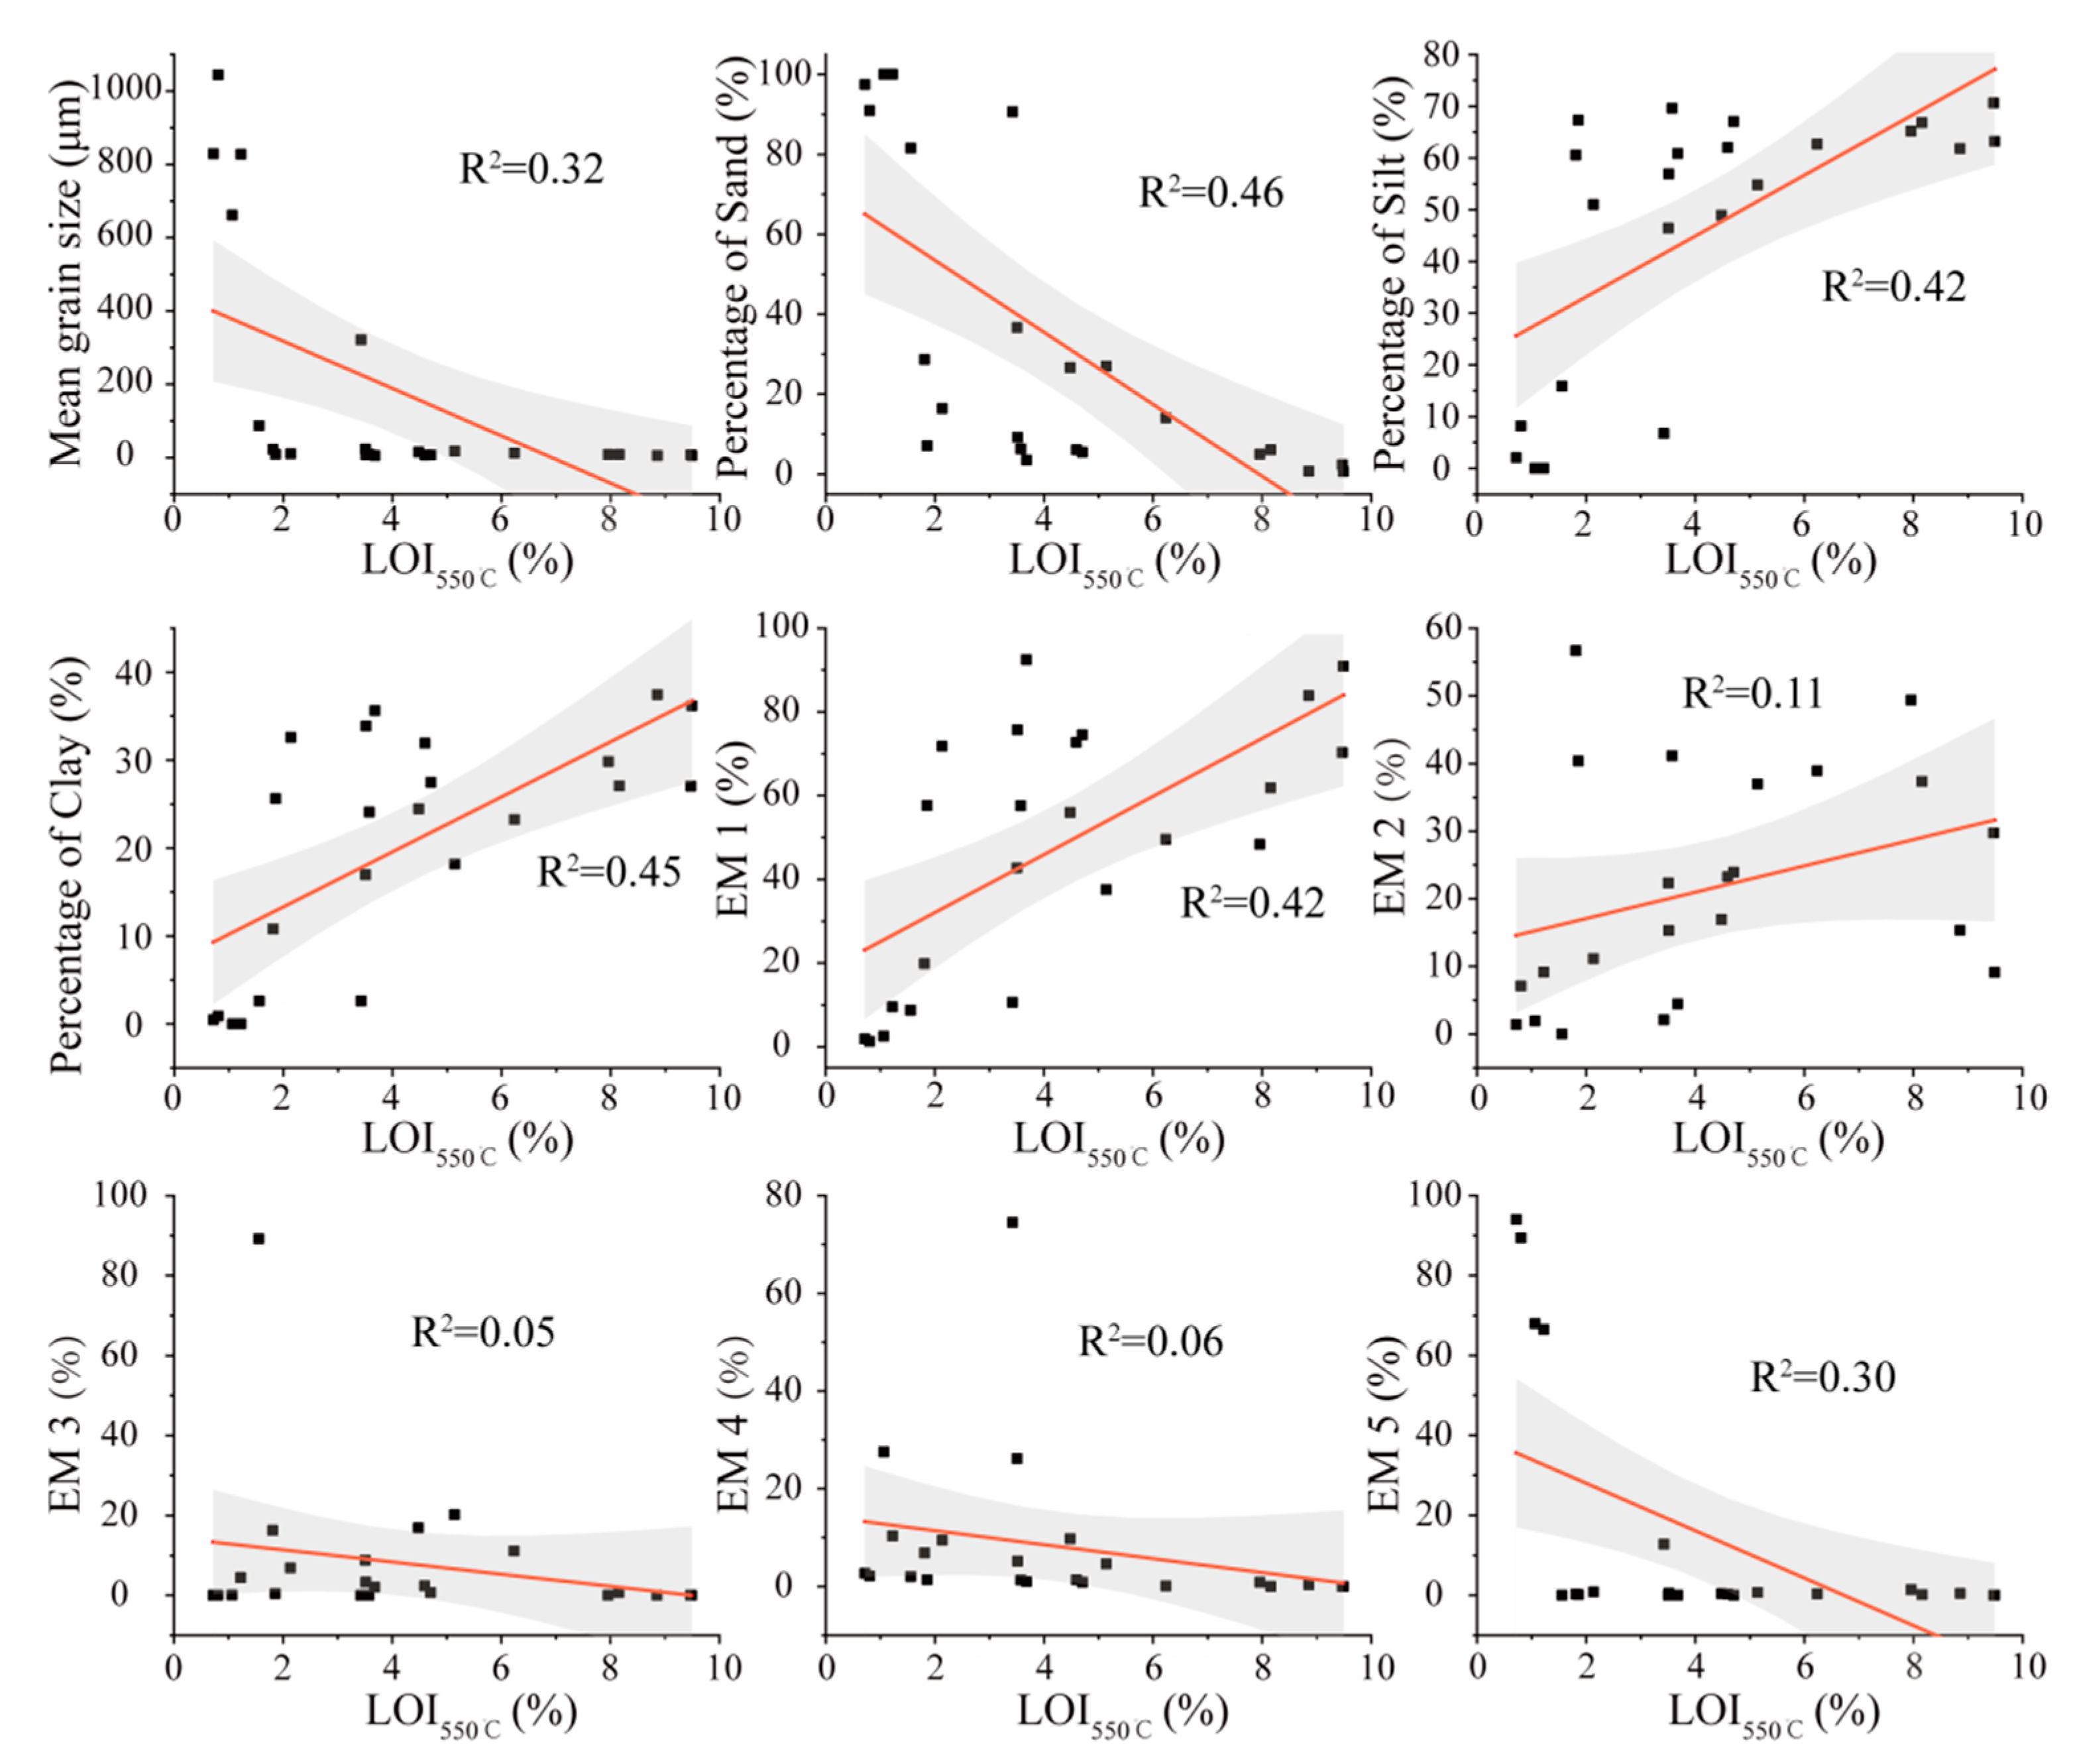
5.2. The Influence of Intense Human Activitieson the Organic Matter’s Provenance
5.3. Elemental Analysis and Discussion about Provenances
6. Conclusions
- (1)
- The offshore area around Lu’erhuan River-Malan Island-Sandun Island is affected by intense human activities; thus, the sediment grain sizes differed significantly. Taking the vicinity of Malan Island as the boundary, the sediment on the north side has a single provenance, the hydrodynamic conditions vary slightly and the sediment grain size is relatively fine (argillaceous sediment). However, the sediment on the south side is complex, and the average grain size is relatively large due to the multiple impacts of human activities, tidal currents and waves.
- (2)
- The endmember analysis showed that, due to long-term intense human activities, the material provenances and hydrodynamic conditions in the offshore area around Lu’erhuan River-Malan Island-Sandun Island are varied. The EM1 component is mainly transported by rivers and weak tidal currents from inland or coastal areas; the EM2 component is mainly input from near shore sources through the weak tidal current; and the rather coarse EM3 component mainly comes from the nearby beach and is input through coastal erosion by weak waves and tidal currents. However, the coarse-grained EM4 and EM5 are unevenly distributed in the study area. They are affected by human activities, tidal currents and waves, and are deposited through the marine transport after coastal erosion.
- (3)
- The provenance of organic matter in the waters around Lu’erhuan River-Malan Island-Sandun Island resembles that of the sediment endmember components, exhibiting diversified characteristics as a result of the superposed impact of natural and human activities. The organic matter in the upper reaches of the Lu’erhuan River originates from the river and the paddy fields along it and exhibits obvious terrigenous characteristics. Meanwhile, the organic matter to the north of Malan Island mainly comes from the external input produced by oyster breeding, while organic matter to the east of Sandun Island mainly comes from the internal input produced by marine plankton.
- (4)
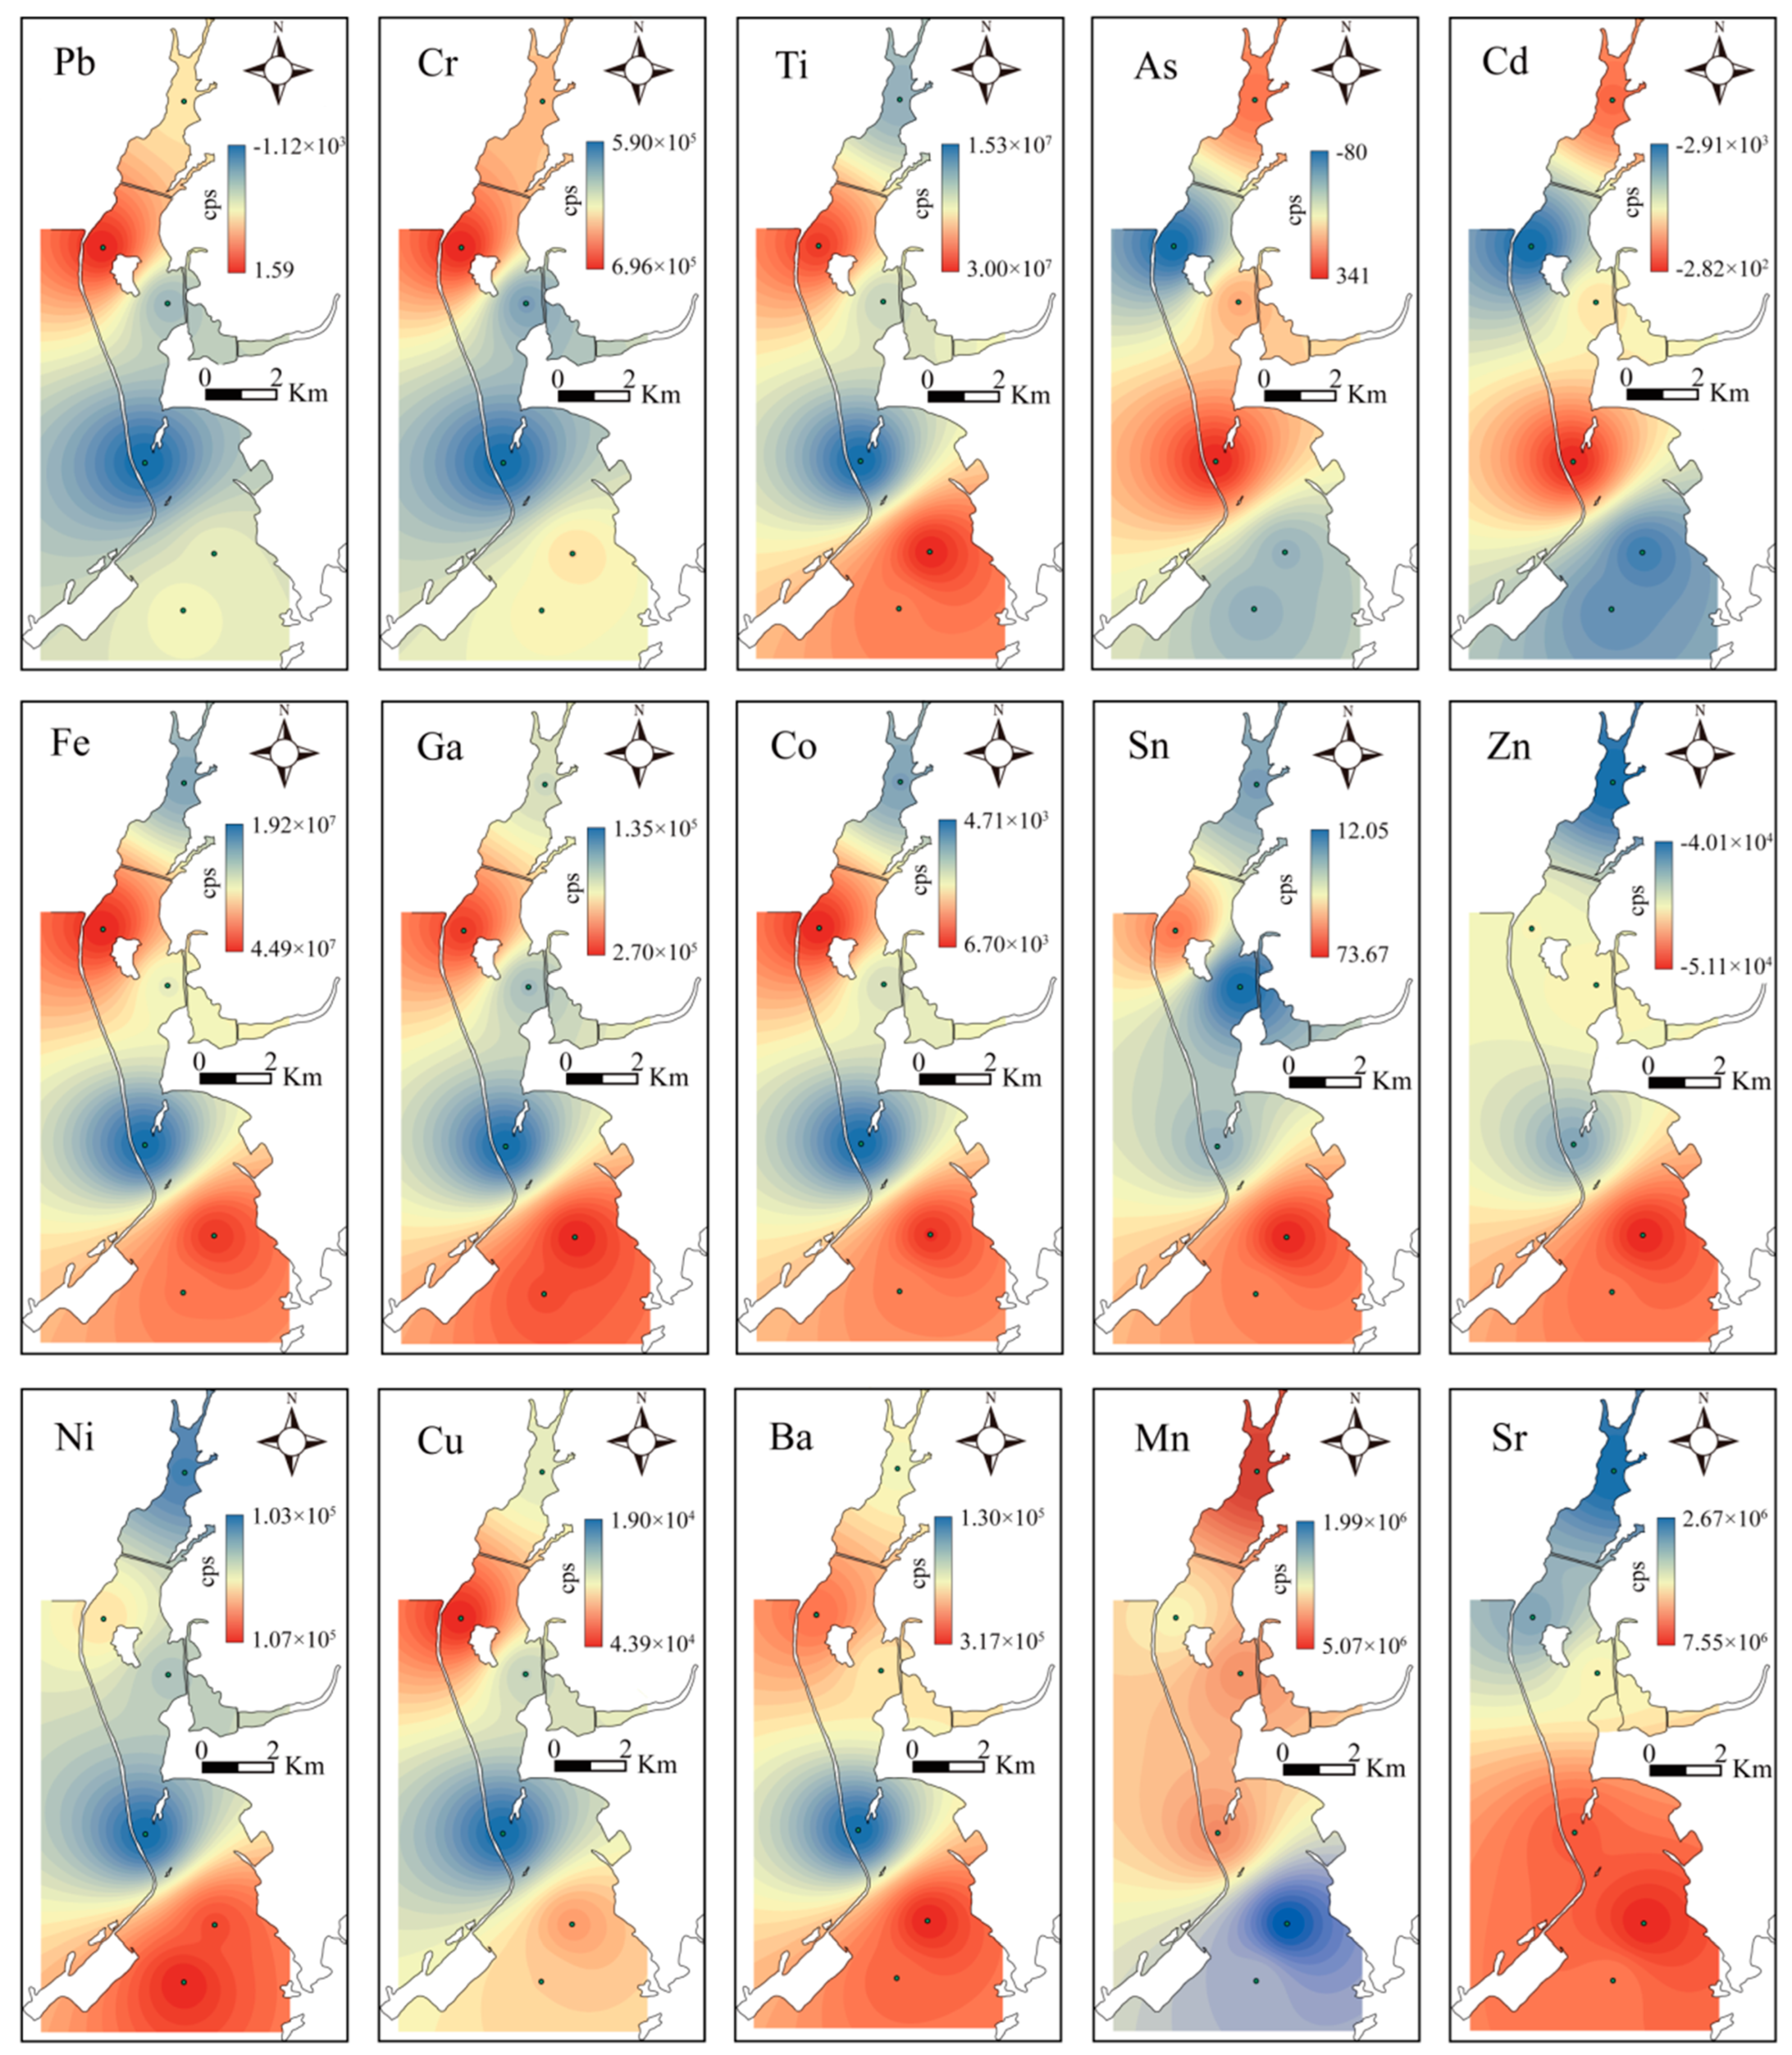
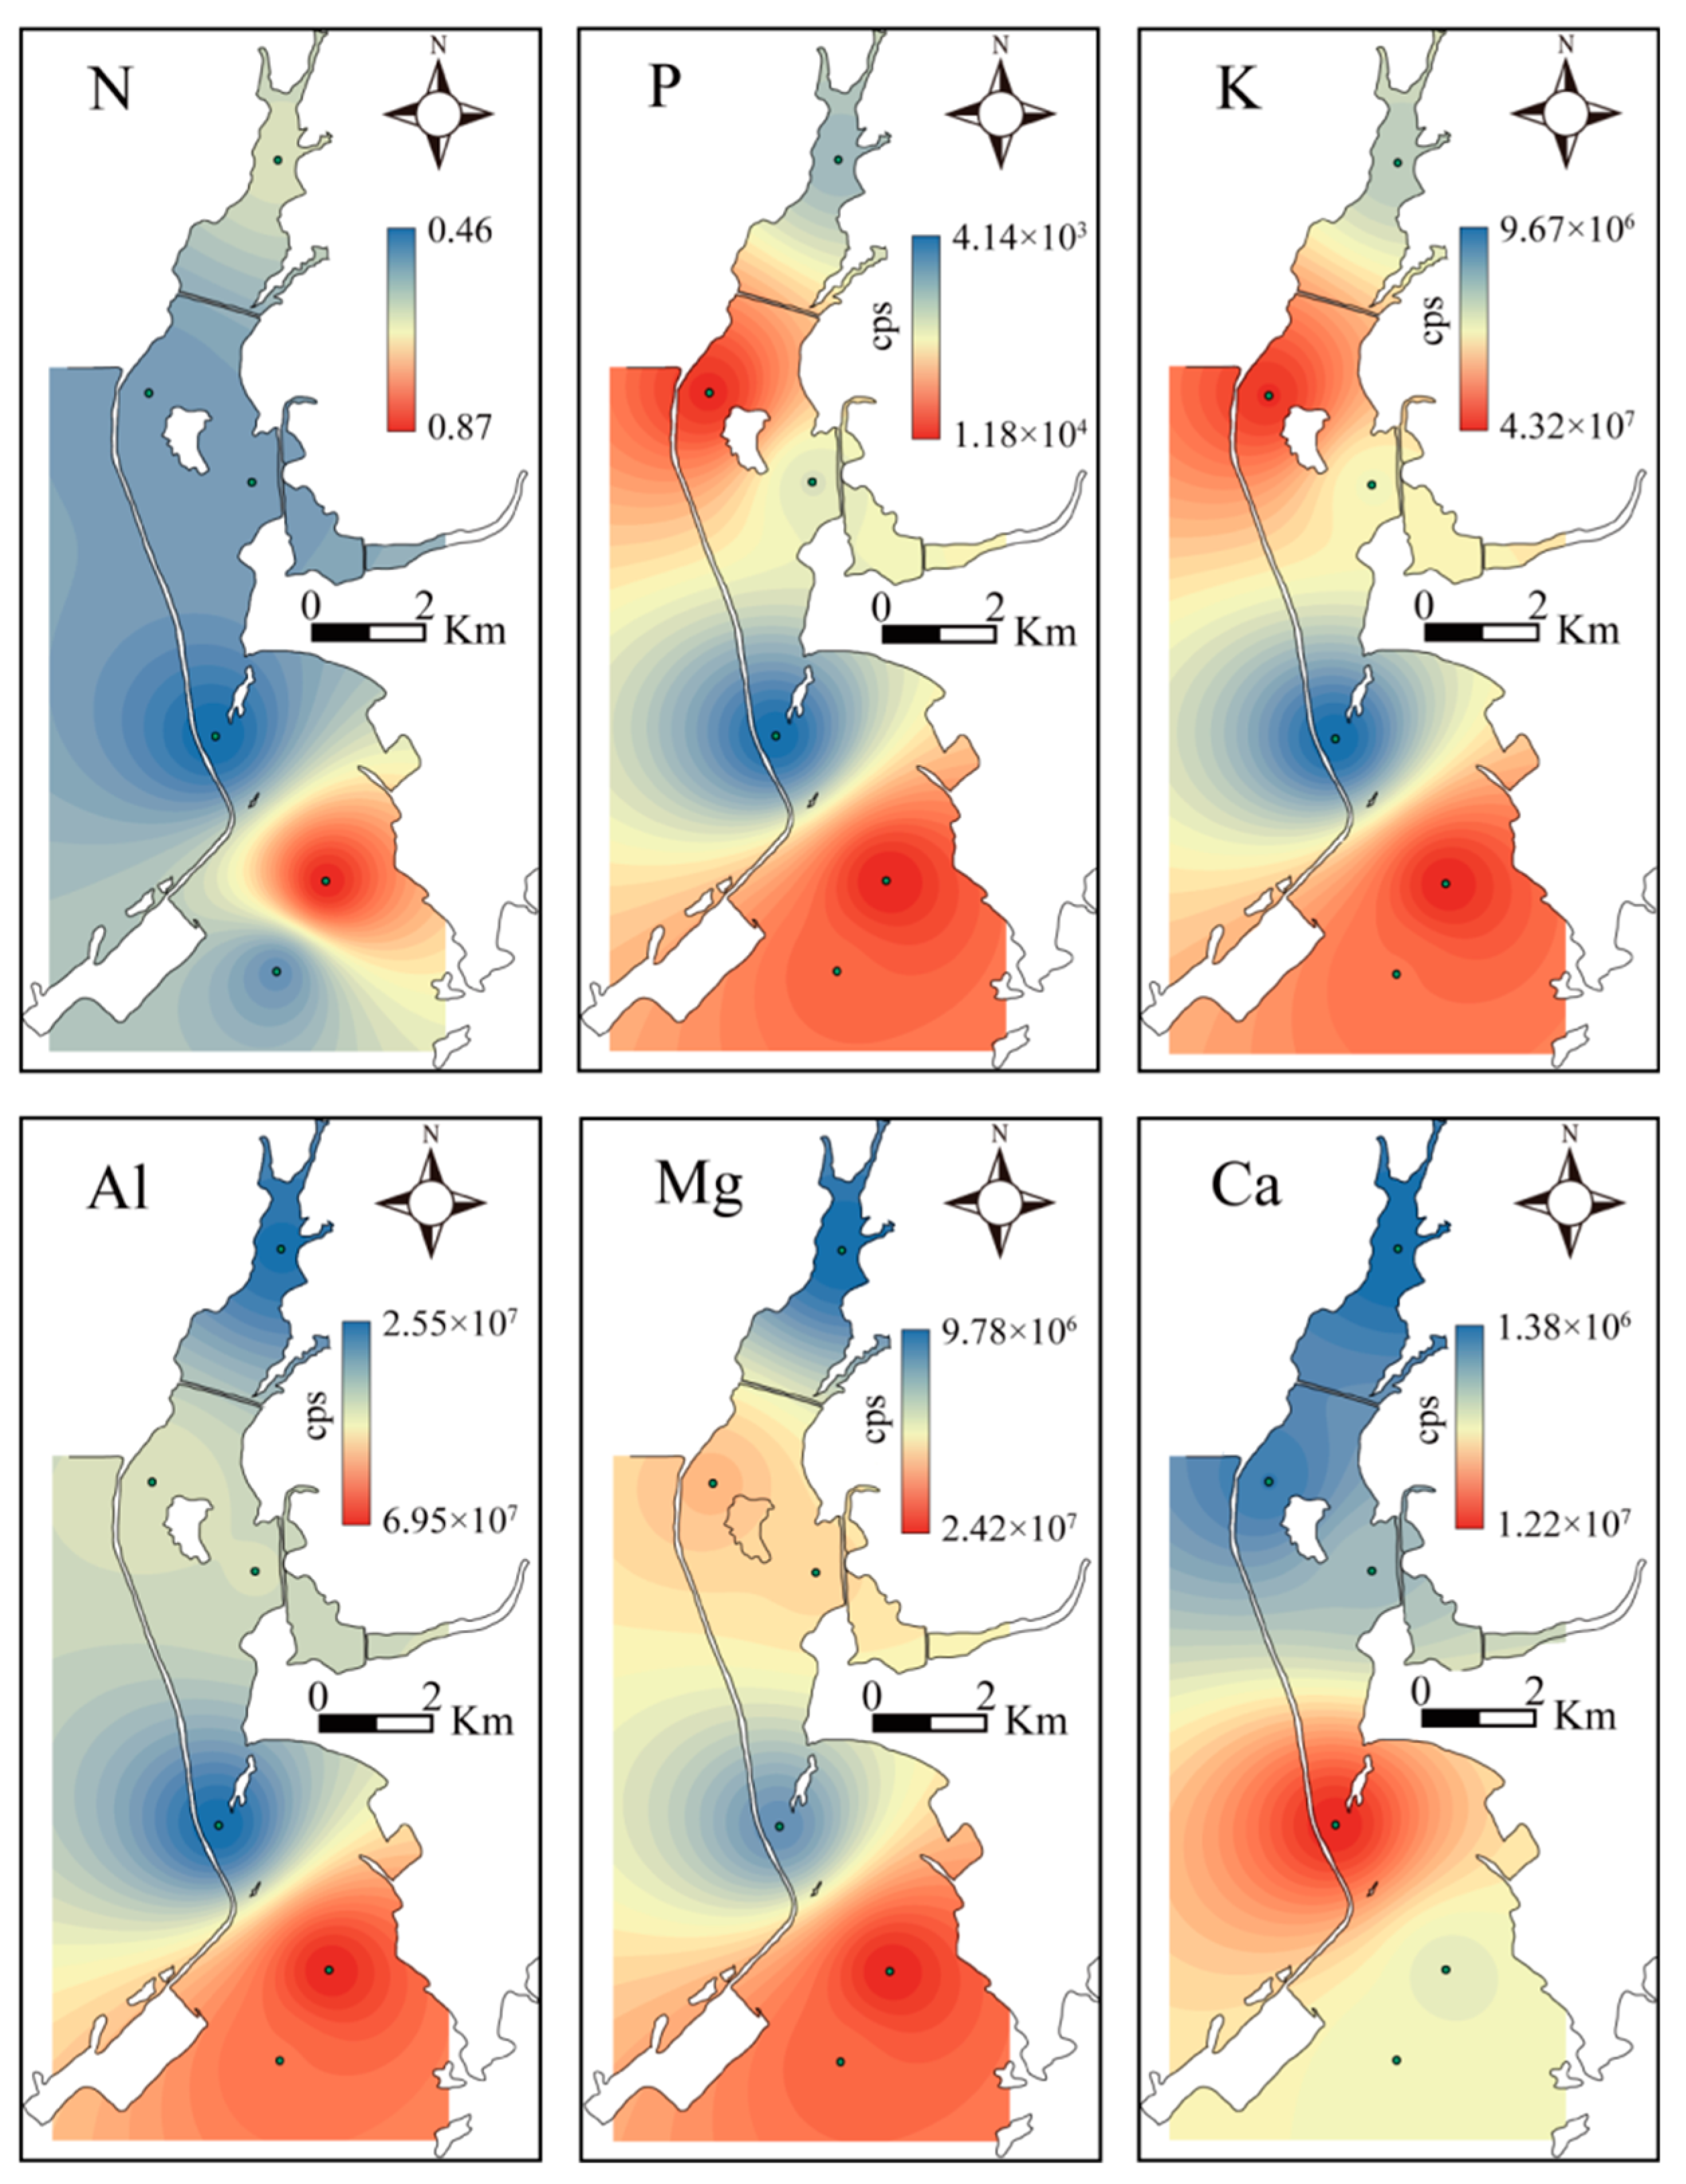
- In the elemental analysis, when used as indicators of terrigenous sediments, the elements (Al, Ti, Fe, Mg, K, Ga, et al.) are significantly disturbed by human activities. However, the element Mn can still sufficiently indicate the distribution characteristics of terrigenous sediments, which are mainly distributed in the offshore area from the Lu’erhuan River to Jishuimen. In addition, Ca and Sr, which indicate the provenance of marine sediments, are located in the eastern offshore area of Sandun Island, which connects with the open sea. Finally, affected by human activities, the enrichment of As and Cd in the study area is clearly a result of human activities, while Cu is less affected by human activities.
Author Contributions
Funding
Institutional Review Board Statement
Informed Consent Statement
Data Availability Statement
Conflicts of Interest
References
- Gu, S.; Hu, Y.; Zhou, H. Ecological Civilization Construction: Scientific Connotation and Basic Paths. Resour. Sci. 2013, 35, 2–13. [Google Scholar]
- Pan, Y.; Li, J.; Huang, W.; Ren, Y. Analysis of current situations, existing problems of oyster industry and its developmental suggestions in Guangxi. J. South. Agric. 2021, 52, 2608–2618. [Google Scholar]
- Pszonka, J.; Schulz, B.; Sala, D. Application of mineral liberation analysis (MLA) for investigations of grain size distribution in submarine density flow deposits. Mar. Pet. Geol. 2021, 129, 105109. [Google Scholar] [CrossRef]
- Zhang, X.; Zhai, S.; Xu, S. The application of grain-size end-member modelling to the shelf near the estuary of Changjiang River in China. Acta Oceanol. Sin. 2006, 28, 159–166. [Google Scholar]
- Kong, F.; Xu, S.; Han, M.; Chen, H.; Jia, G. Application of grain size endmember analysis in the study of dust accumulation processes: A case study of loess in Shandong Province, East China. Sediment. Geol. 2021, 416, 105868. [Google Scholar] [CrossRef]
- Tian, C.; Ouyang, T.; Li, M.; Zhang, J.; Chen, H. Magnetic investigation of surface sediments of the north-western South China Sea: Implication for sediment provenance and transportation. J. Asian Earth Sci. 2020, 202, 104530. [Google Scholar] [CrossRef]
- Zhong, Q.; Puigcorbé, V.; Chen, X.; Sanders, C.; Du, J. Unexpectedly high dissolved 210Pb in coastal groundwater: Is submarine groundwater discharge important in coastal sea? Chem. Geol. 2022, 614, 121165. [Google Scholar] [CrossRef]
- Zhang, P. Seasonal phosphorus variation in coastal water affected by the land-based sources input in the eutrophic Zhanjiang Bay, China. Estuar. Coast. Shelf Sci. 2021, 252, 107277. [Google Scholar] [CrossRef]
- Li, J.; Zhang, H.; Zhang, K.; Yang, R.; Li, Y. Characterization, source, and retention of micro plastic in sandy beaches and mangrove wetlands of the Qinzhou Bay, China. Mar. Pollut. Bull. 2018, 136, 401–406. [Google Scholar] [CrossRef]
- Liao, W.; Hu, J.; Zhou, H.; Hu, J.; Peng, P.; Deng, W. Sources and distribution of sedimentary organic matter in the Beibu Gulf, China: Application of multiple proxies. Mar. Chem. 2018, 206, 74–83. [Google Scholar] [CrossRef]
- Gu, Y.; Lin, Q.; Yu, Z.; Wang, X.; Ke, C.; Ning, J. Speciation and risk of heavy metals in sediments and human health implications of heavy metals in edible nekton in Beibu Gulf, China: A case study of Qinzhou Bay. Mar. Pollut. Bull. 2015, 101, 852–859. [Google Scholar] [CrossRef]
- Li, Y.; Chen, Y.; Ruan, M.; Jia, W. The Jiulong River plume as cross-strait exporter and along-strait barrier for suspended sediment: Evidence from the endmember analysis of in-situ particle size. Estuar. Coast. Shelf Sci. 2015, 166, 146–152. [Google Scholar] [CrossRef]
- Li, W.; Wu, C. Incorporating land use land cover probability information into endmember class selections for temporal mixture analysis. ISPRS J. Photogramm. Remote Sens. 2015, 101, 163–173. [Google Scholar] [CrossRef]
- Lin, Z.; Wang, A.; Ye, X. End-Member Analysis for Sur-facial Sediment of Nanliujiang River Subaqueous Delta and Associated Sediment Dynamic Environmental Significance. Acta Sedimentol. Sin. 2019, 37, 124–134. [Google Scholar]
- Zhang, Z.; Wang, Y.; Han, G.; Zhong, H.; Zhang, Z. The geochemical characteristics and the source of heavy metals in sediment for the Beibu Gulf. Acta Oceanol. Sin. 2013, 35, 72–81. [Google Scholar]
- Fang, X.; Hu, N.; Dou, R.; Zhang, Y.; Zhang, H.; Liu, J. Provenance evolution since Middle Holocene of the sediments on the East Siberian shelf: Evidence from elemental geochemistry. Mar. Geol. Quat. Geol. 2021, 41, 60–73. [Google Scholar]
- Zhang, B.; Chen, S.; Liu, Y.; Gu, G. Sediment characteristics and differentiation in the Qinzhou Bay, Guangxi, China. J. Trop. Oceanogr. 2011, 30, 66–70. [Google Scholar]
- Lin, H.; Lan, W.; Feng, Q.; Zhu, X.; Zhao, B. Pollution and ecological risk assessment, and source identification of heavy metals in sediment from the Beibu Gulf, South China Sea. Mar. Pollut. Bull. 2021, 168, 112403. [Google Scholar] [CrossRef]
- Li, Z.; Luan, Z.; Yan, J.; Zhuang, L. Characterization of grain size parameters and the provenance analysis of the surface sediment in the outer shelf of the northern South China Sea. Mar. Sci. 2011, 35, 92–100. [Google Scholar]
- Cao, C.; Wu, C.; Cai, F.; Zheng, W.; Lu, H.; Bao, J.; Zheng, Y.; Tu, W. Characteristics of submarine topography geomorphology and sediments sources in outer Qinzhou Bay. J. Appl. Oceanogr. 2020, 39, 378–388. [Google Scholar]
- Ding, X.; Ye, S.; Gao, Z. Development and applications of grain size analysis technique. World Geol. 2005, 24, 203–207. [Google Scholar]
- Pszonka, J.; Sala, D. Application of the mineral liberation analysis (MLA) for extraction of grain size and shape measurements in siliciclastic sedimentary rocks. E3S Web Conf. 2018, 66, 02002. [Google Scholar] [CrossRef]
- Paterson, G.; Heslop, D. New methods for unmixing sediment grain size data. Geochem. Geophys. Geosyst. 2016, 16, 4494–4506. [Google Scholar] [CrossRef]
- Zhu, G.; Chen, Y. A Review of Geochemical Behaviours and Environmental Effects of Organic Matter in Sediments. J. Lake Sci. 2001, 13, 272–279. [Google Scholar]
- Li, N.; Sack, D.; Sun, J.; Liu, S.; Jie, D. quantifying the carbon content of Aeolian sediments: Which method should we use? Catena 2020, 185, 104276. [Google Scholar] [CrossRef]
- Zhao, Y.; Yan, C. Geochemistry of Sediments of the China Shelf Sea; Science Press: Beijing, China, 1994. [Google Scholar]
- Zhang, C.; Li, L.; Long, G.; Zhang, K.; Li, J. Geochemical Characteristics and Provenance Implication of Major Elements in the Surface Sediments of the Sanya Offshore Area. Coast. Eng. 2018, 37, 26–35. [Google Scholar]
- Folk, R.; Andrews, P.; Lewis, D. Detrital sedimentary rock classification on and nomenclature for use in New Zealand. N. Z. J. Geol. Geophys. 1970, 13, 937–968. [Google Scholar] [CrossRef]
- Chen, S.; Yang, S.; Wu, R. Temporal Changes in Tidal Flat Sediment Grain Size Along the North Bank of the Hangzhou Bay and Their Implication of Sedimentation Dynamics. Adv. Mar. Sci. 2004, 22, 299–305. [Google Scholar]
- Xu, Z.; Wang, Y.; Li, Y.; Ma, F.; Ye, C. Sediment transport patterns in the eastern Beibu Gulf based on grain-size multivariate statistics and provenance analysis. Acta Oceanol. Sin. 2010, 32, 67–78. [Google Scholar]
- Ma, F.; Wang, Y.; Li, Y.; Ye, C.; Xu, Z. The Application of Geostatistics to Analysis of Grain Size Trend in the Eastern Beibu Gulf. Acta Geogr. Sin. 2008, 63, 1207–1217. [Google Scholar] [CrossRef]
- Xiao, X.; Shi, Y.; Feng, X.; Xun, Y. Surface Sediment Characteristics and Dynamics in Beibu Gulf. Period. Ocean. Univ. China 2016, 46, 83–89. [Google Scholar]
- Yang, H.; Zheng, B.; Yu, D.; He, J.; Shu, F.; Luo, F. Characteristics of surface sediment grain size and the erosion/deposition evolution in the outer Pinghai Bay, Fujian. J. Appl. Oceanogr. 2017, 36, 233–242. [Google Scholar]
- Spiske, M.; Tang, H.; Bahlburg, H. Post-depositional alteration of onshore tsunami deposits- Implications for the reconstruction of past events. Earth-Sci. Rev. 2020, 202, 103068. [Google Scholar] [CrossRef]
- Ge, T.; Xue, Y.; Jiang, X.; Zuo, L.; Wang, X. Sources and radiocarbon ages of organic carbon in different grain size fractions of Yellow River-transported particles and coastal sediments. Chem. Geol. 2020, 534, 119452. [Google Scholar] [CrossRef]
- Yuan, X.; Yang, Q.; Luo, X.; Yu, F.; Liu, F.; Li, J.; Wang, Z. Distribution of grain size and organic elemental composition of the surgical sediments in Lingding Bay in the Pearl River Delta, China: A record of recent human activity. Ocean. Coast. Manag. 2019, 178, 104849. [Google Scholar] [CrossRef]
- Zhong, F.; Huang, W.; Li, X.; Lin, Z.; Pang, W.; Yan, X.; Tan, B. Analysis of the current situation and countermeasures for the development of oyster fry industry in Qinzhou, Guangxi. J. Aquac. 2020, 5, 79–80. [Google Scholar]
- Chen, Y.; Yang, Y.; Jiao, N. Effects of mariculture on the planktonic community and water environments: A review. Mar. Sci. 2001, 25, 20–22. [Google Scholar]
- Hatakeyama, Y.; Kawahata, T.; Fujibayashi, M.; Nishimura, O.; Sakamaki, T. Sources and oxygen consumption of particulate organic matter settling in oyster aquaculture farms: Insights from analysis of fatty acid composition. Estuary. Coast. Shelf Sci. 2021, 254, 107328. [Google Scholar] [CrossRef]
- Ray, N.; Al-Haj, A.; Fulweiler, R. Sediment biogeochemistry along an oyster aquaculture chronosequence. Mar. Ecol. Prog. Ser. 2020, 646, 13–27. [Google Scholar] [CrossRef]
- Jin, B.; Lin, Z.; Ji, F. Interpretation of Element Geochemical Records of Marine Sedimentary Environment and Provenance. Adv. Mar. Sci. 2003, 21, 99–106. [Google Scholar]
- Li, T.; Li, X.; Zhang, J.; Luo, W.; Zhao, L. Source identification and co-occurrence patterns of major elements in South China Sea sediments. Mar. Geol. 2020, 428, 106285. [Google Scholar] [CrossRef]
- Dong, D.; Li, Y.; Chen, X.; Chen, B.; Ya, H. Impacts of Ocean Engineering on Shoreline, Topography and Deposition-erosion Environment in Qinzhou Gulf. Guangxi Sci. 2015, 22, 266–274. [Google Scholar]


| Sample Number | Latitude (N) | Longitude (E) | Average Grain Size(μm) | Sample Number | Latitude (N) | Longitude (E) | Average Grain Size(μm) |
|---|---|---|---|---|---|---|---|
| 1 | 21°44′26″ | 108°43′20″ | 7.58 | 13 | 21°40′26″ | 108°42′43″ | 5.78 |
| 2 | 21°44′2″ | 108°42′51″ | 7.56 | 14 | 21°39′38″ | 108°42′33″ | 0.57 |
| 3 | 21°43′20″ | 108°42′57″ | 7.36 | 15 | 21°39′38″ | 108°43′53″ | 6.84 |
| 4 | 21°42′22″ | 108°42′23″ | 7.20 | 16 | 21°39′33″ | 108°41′1″ | 6.84 |
| 5 | 21°42′4″ | 108°42′56″ | 7.49 | 17 | 21°38′31″ | 108°42′48″ | 5.33 |
| 6 | 21°42′0″ | 108°42′25″ | 6.11 | 18 | 21°38′30″ | 108°43′42″ | 3.63 |
| 7 | 21°42′1″ | 108°42′38″ | 1.73 | 19 | 21°38′8″ | 108°42′23″ | 5.37 |
| 8 | 21°41′48″ | 108°42′13″ | 6.67 | 20 | 21°36′54″ | 108°42′37″ | 0.15 |
| 9 | 21°41′46″ | 108°42′36″ | 7.10 | 21 | 21°36′50″ | 108°43′23″ | 7.10 |
| 10 | 21°41′14″ | 108°41′47″ | 7.13 | 22 | 21°36′6″ | 108°40′42″ | 7.35 |
| 11 | 21°41′4″ | 108°42′21″ | 6.46 | 23 | 21°36′1″ | 108°42′56″ | 6.90 |
| 12 | 21°40′12″ | 108°41′51″ | 0.56 | 24 | 21°36′1″ | 108°42′58″ | 6.84 |
| Endmember | Mean (μm) | Separability (φ) | Skewness (φ) | Kurtosis (φ) |
|---|---|---|---|---|
| EM 1 | 6.43 | 2.85 | 0.04 | 1.06 |
| EM 2 | 75.11 | 2.03 | −0.47 | 1.90 |
| EM 3 | 315.74 | 3.42 | 0.01 | 3.39 |
| EM 4 | 949.59 | 1.47 | −0.35 | 1.66 |
| EM 5 | 625.24 | 1.67 | −0.25 | 1.56 |
| Endmember | P10 (μm) | P25 (μm) | P50 (μm) | P75 (μm) | P90 (μm) |
|---|---|---|---|---|---|
| EM 1 | 1.69 | 2.78 | 4.89 | 8.43 | 13.37 |
| EM 2 | 5.99 | 10.74 | 21.11 | 41.40 | 74.00 |
| EM 3 | 55.94 | 72.99 | 92.72 | 113.42 | 132.24 |
| EM 4 | 144.66 | 187.01 | 237.54 | 288.48 | 336.53 |
| EM 5 | 705.20 | 856.34 | 1025.70 | 1178.83 | 1335.68 |
| Sample | P (cps) | Mg (cps) | Mn (cps) | K (cps) | Ca (cps) |
|---|---|---|---|---|---|
| 4 | 6378 | 9,778,145 | 1,985,847 | 21,025,771 | 1,382,918 |
| 11 | 11,645 | 19,100,219 | 4,115,123 | 42,273,623 | 2,087,401 |
| 14 | 7463 | 18,099,022 | 3,066,164 | 26,212,772 | 4,548,484 |
| 20 | 4140 | 11,772,609 | 2,960,292 | 9,667,056 | 12,193,893 |
| 22 | 11,848 | 24,181,639 | 6,383,927 | 43,192,880 | 6,195,244 |
| 24 | 10,706 | 22,109,094 | 5,067,886 | 37,562,231 | 6,469,540 |
| N (cps) | TOC% | C/N% | Zn/Pb% | Ca/Mg | |
| 4 | 0.63 | 0.04 | 0.06 | 101.8 | 0.1414 |
| 11 | 0.53 | 0.10 | 0.18 | −21.8 | 0.1093 |
| 14 | 0.53 | 0.05 | 0.10 | 55.7 | 0.2513 |
| 20 | 0.46 | 0.04 | 0.08 | 43.4 | 1.0358 |
| 22 | 0.87 | 0.08 | 0.09 | 65.9 | 0.2562 |
| 24 | 0.52 | 0.08 | 0.16 | 73.6 | 0.2926 |
Publisher’s Note: MDPI stays neutral with regard to jurisdictional claims in published maps and institutional affiliations. |
© 2022 by the authors. Licensee MDPI, Basel, Switzerland. This article is an open access article distributed under the terms and conditions of the Creative Commons Attribution (CC BY) license (https://creativecommons.org/licenses/by/4.0/).
Share and Cite
Li, P.; Du, J.; Zhang, Z.; Xu, G. Sedimentological Analysis of Regional Differentiation and Sediment Provenance in the Lu’erhuan River Sea Area of Qinzhou Bay, Guangxi Province. J. Mar. Sci. Eng. 2022, 10, 1732. https://doi.org/10.3390/jmse10111732
Li P, Du J, Zhang Z, Xu G. Sedimentological Analysis of Regional Differentiation and Sediment Provenance in the Lu’erhuan River Sea Area of Qinzhou Bay, Guangxi Province. Journal of Marine Science and Engineering. 2022; 10(11):1732. https://doi.org/10.3390/jmse10111732
Chicago/Turabian StyleLi, Ping, Jun Du, Zhiwei Zhang, and Guoqiang Xu. 2022. "Sedimentological Analysis of Regional Differentiation and Sediment Provenance in the Lu’erhuan River Sea Area of Qinzhou Bay, Guangxi Province" Journal of Marine Science and Engineering 10, no. 11: 1732. https://doi.org/10.3390/jmse10111732
APA StyleLi, P., Du, J., Zhang, Z., & Xu, G. (2022). Sedimentological Analysis of Regional Differentiation and Sediment Provenance in the Lu’erhuan River Sea Area of Qinzhou Bay, Guangxi Province. Journal of Marine Science and Engineering, 10(11), 1732. https://doi.org/10.3390/jmse10111732